
Examining Assessment Methods in Project-Based Mathematics Learning
by
Brittany Nicole McCullough
A dissertation submitted to the Graduate Faculty of Auburn University
in partial fulfillment of the requirements for the Degree of
Doctor of Philosophy
Auburn, Alabama December 15, 2018
Keywords: project-based learning, mathematics learning, assessment, Attitudes Toward Mathematics Inventory (ATMI)
Copyright 2018 by Brittany Nicole McCullough
Approved by
Dr. David Shannon, Chair, Humana-Germany-Sherman Distinguished Professor, Educational Foundations, Leadership, and Technology
Dr. Joni Lakin, Associate Professor, Educational Foundations, Leadership, and Technology Dr. Jill Salisbury-Glennon, Associate Professor, Educational Foundations, Leadership, and
Technology Dr. Paris Strom, Professor, Educational Foundations, Leadership, and Technology

ii
Abstract
Project-based learning (PBL) is an instructional method that has grown in
popularity across all grade levels and subject areas, in both K-12 schools and higher education
institutions. PBL embraces the integration of curriculum across subjects, the engagement of
home and community in school learning, and the involvement of students in cooperative
teamwork (Harada, Kirio, & Yamamoto, 2008). With regard to mathematics, specifically,
advocates of project-based learning claim that problem solving skills are successfully developed
when students learn mathematical content and process knowledge on their own in an authentic
setting (Roh, 2003).
This method of instruction has been adopted at a newly created public K-9 school system
in its second year of operation in central Alabama. This study utilized a mixed methods
approach (Creswell & Clark, 2017) to examining the implementation and assessment methods of
project-based mathematics learning taking place in the middle grade levels (6-8) of this
particular school system. In order to examine project-based learning implementation and
assessment in middle grades mathematics classrooms in the school system of interest, data
collection included student pre- and post-semester surveys, teacher post-semester surveys,
multiple classroom observations, and existing data in the form of classroom grades and
standardized test scores provided to the researcher by the school. The primary survey instrument
utilized for this study was the Attitudes Toward Mathematics Inventory (Tapia & Marsh, 2004).
iii
The population of interest was 6th, 7th, and 8th grade mathematics students and teachers at
the selected school system currently implementing and participating in project-based learning in
mathematics classes. Research questions focused on topics such as: implementation and
assessment of project-based mathematics learning; comparisons of classroom performance
grading systems and standardized test results; relationships between student self-assessments,
grades, and standardized test scores; and looking to identify significant increases in students’
levels of self-confidence, value, enjoyment, and motivation in mathematics. Findings show that
project-based learning is being implemented at different levels across the middle grades
mathematics classes of the school. Some agreement was found between various assessment
methods, but no significant increases were found in students’ mathematics self-confidence,
value, enjoyment, or motivation.

iv
Acknowledgments
I am grateful and appreciative to have received support from so many people throughout
my graduate studies and the writing of this dissertation. I would like to thank my advisor, Dr.
David Shannon, for his guidance and encouragement throughout this process. Thank you to my
committee members, Dr. Joni Lakin, Dr. Jill Salisbury-Glennon, and Dr. Paris Strom, for
contributing through sharing your extensive wisdom and expertise. Thank you to my outside
reader, Dr. Overtoun Jenda, for all of your mentorship and support over the years.
I have been blessed with the most wonderful and supportive family that anyone could ask
for. I am forever thankful to my parents, Ronnie and Pearl Wells, who never missed a single
school awards program, band competition, orchestra concert, Girl Scout event, or anything else
important to my education, and who have been telling me since before kindergarten that I could
do anything I set my mind to. To my husband, Chapel McCullough, thank you for your
understanding and support as we pursued these PhDs together. Finally, I am thankful to God for
the innumerable blessings in my life and for His constant guidance and love.
v
Table of Contents
Abstract ......................................................................................................................................... ii
Acknowledgments ....................................................................................................................... iv
List of Tables ............................................................................................................................. viii
Chapter 1: Introduction ............................................................................................................... 1
Research Questions ......................................................................................................... 2
Background ..................................................................................................................... 2
Significance ..................................................................................................................... 3
Assumptions .................................................................................................................... 3
Challenges ....................................................................................................................... 4
Limitations ...................................................................................................................... 5
Hypotheses ...................................................................................................................... 5
Chapter 2: Literature Review ...................................................................................................... 7
Theory ............................................................................................................................. 7
Overview of PBL Methods ............................................................................................. 9
Implementation ............................................................................................................. 10
Academic Benefits ........................................................................................................ 11
Maximizing Impact: Student, Teacher, and Classroom Factors ................................... 14
Motivation, Self-Efficacy, and Interest ......................................................................... 16
Challenges ..................................................................................................................... 18

vi
Assessment .................................................................................................................... 20
Gaps in the Literature .................................................................................................... 23
Chapter 3: Methods ................................................................................................................... 25
Purpose and Research Questions .................................................................................. 25
Setting ........................................................................................................................... 26
Research Design ............................................................................................................ 26
Participants .................................................................................................................... 27
Instrumentation ............................................................................................................. 29
Student Survey .................................................................................................. 29
Teacher Survey ................................................................................................. 31
Classroom Observations ................................................................................... 31
Data Collection ............................................................................................................. 32
Data Analysis ................................................................................................................ 33
Chapter 4: Findings ................................................................................................................... 36
Introduction ................................................................................................................... 36
Research Question 1 ..................................................................................................... 36
Implementation ................................................................................................. 36
Assessment ........................................................................................................ 46
Teacher Surveys ................................................................................................ 49
Research Question 2a .................................................................................................... 51
Pearson Correlation Coefficients ...................................................................... 51
Research Question 2b ................................................................................................... 52
Pearson Correlation Coefficients ...................................................................... 52
vii
Multiple Stepwise Regression ........................................................................... 53
Kendall’s Coefficient of Concordance W ......................................................... 54
Research Question 3 ..................................................................................................... 55
ATMI Paired Samples ....................................................................................... 55
Supplemental Survey Items Paired Samples ..................................................... 56
ATMI Independent Samples ............................................................................. 57
Pre- and Post- Item Statistics ............................................................................ 58
ATMI .................................................................................................... 58
Supplemental Survey Items .................................................................. 60
Conclusion .................................................................................................................... 61
Chapter 5: Discussion ............................................................................................................... 63
Summary of Findings .................................................................................................... 63
Discussion ..................................................................................................................... 64
Suggestions for Future Research .................................................................................. 65
Hypotheses and Conclusions ........................................................................................ 66
Conclusions and Recommendations ............................................................................. 67
References ................................................................................................................................. 69
Appendix A: School Mission, Beliefs and Vision .................................................................... 75
Appendix B: Attitudes Toward Mathematics Inventory ........................................................... 77
Appendix C: Supplemental Survey Questions .......................................................................... 80
Appendix D: Teacher Post-Semester Survey ............................................................................ 82
Appendix E: Classroom Observation Protocol ......................................................................... 84
Appendix F: IRB Approval Documents ................................................................................... 93

viii
List of Tables
Table 1: Participant Numbers .................................................................................................... 28
Table 2: ATMI Reliability Statistics .......................................................................................... 30
Table 3: Supplemental Survey Items Reliability Statistics ........................................................ 31
Table 4: Data Analysis Methods ................................................................................................ 33
Table 5: Classroom Observation Data by Grade Level – Scale Scores (Summary of Quality). 38
Table 6: Classroom Observation Data by Grade Level – Item Scores ...................................... 38
Table 7: Classroom Performance Scores by Grade Level ......................................................... 48
Table 8: Global Scholar Mathematics Mean Scaled Scores ....................................................... 49
Table 9: Teacher Survey Item Statistics ..................................................................................... 50
Table 10: Correlations between Classroom Performance Ratings and Global Scholar Scaled Scores ......................................................................................................................................... 52
Table 11: Correlations between Classroom Performance Ratings and ATMI Post Scores ....... 52
Table 12: Regression Findings – ATMI Scores and Global Scholar Scores ............................. 53
Table 13: R Squared Change Test Findings .............................................................................. 53
Table 14: Kendall’s Coefficient of Concordance Hypothesis Test Summary ........................... 54
Table 15: Summary of ATMI Paired T-Tests ............................................................................ 56
Table 16: Summary of Supplementary Survey Items Paired T-Test ......................................... 56
Table 17: ATMI Independent Samples T-Tests Group Statistics .............................................. 57
Table 18: Summary of ATMI Independent Samples T-Tests .................................................... 57
ix
Table 19: ATMI Survey Item Statistics ..................................................................................... 58
Table 20: Supplemental Survey Item Statistics .......................................................................... 60
1
Chapter I
Introduction
Project-based learning (PBL) has recently come into prominence as a prevalent method
of instruction for a variety of subjects and grade levels in K-12 schools. PBL has also been
implemented in some subject areas in higher education. Marzano (2003) states that research
supports a move from memorized learning to memorable learning. These memorable learning
experiences promote mastery of both the content and the process. PBL embraces the integration
of curriculum across subjects, the engagement of home and community in school learning, and
the involvement of students in cooperative teamwork (Harada, Kirio, & Yamamoto, 2008). With
regard to mathematics, specifically, advocates of project-based learning claim that problem
solving skills are successfully developed when students learn mathematical content and process
knowledge on their own in an authentic setting (Roh, 2003). Mathematics PBL has also become
more prevalent since it has been found to decrease achievement gaps, with low performing
students showing particularly high growth rates on mathematics scores (Han, Capraro, &
Capraro, 2015).
This method of instruction has been adopted at a newly created public K-9 school system
in its second year of operation in central Alabama. After one full year of instruction using a
project-based approach, educators and school administrators stand to benefit from an
examination of their assessment methods in terms of how effectively they are measuring the
outcomes of project-based learning – specifically in mathematics classes. At the time of this
2
study, the school system sought to examine the extent to which project-based learning was being
implemented and appropriate assessment methods were being used. This study utilized a mixed
methods approach (Creswell & Clark, 2017) to examining the implementation and assessment
methods of project-based mathematics learning taking place in the middle grade levels (6-8) of
this particular school system.
Research Questions
Research questions for the study included the following:
• RQ1: How is project-based mathematics learning currently being implemented and
assessed?
• RQ2a: How does the school’s classroom performance grading system compare to
standardized test results?
• RQ2b: How do student self-assessments relate to grades and scores on standardized tests?
• RQ3: Does project-based learning lead to increases in students’ levels of self-confidence,
value, enjoyment, and motivation in mathematics?
Background
The school system at the center of this study operates with the goal of creating a culture
of intellectual curiosity, where all students have ownership over their learning and are inspired to
think, innovate, and create. This goal is at the forefront of all teaching and learning activities
each day. The school system has adopted the idea of “The (School Name) Way,” which
emphasizes the strong desire to create an environment rooted in intellectual curiosity. The
Schools’ mission, vision, and beliefs give evidence of the climate and culture that the Schools
strive to maintain (Mission, Beliefs, and Vision, 2016). This culture includes intellectual

3
curiosity, genuine engagement, and meaningful learning with the aim of solving real problems
for a real audience. The full text of the Mission, Beliefs, and Vision is presented in Appendix A.
Significance
This research study will enable the school system to make data-driven decisions
regarding their use of PBL learning in mathematics and their chosen assessment methods. This
study will help school leaders determine whether or not current assessment methods are valid in
measuring students’ levels of understanding and concept mastery, hopefully leading to the
development of more meaningful assessment methods and overall school
improvement/enhancement. Current assessment methods include monitoring of progress and
capturing outcomes using a standards-based reporting tool called FreshGrade, which is available
online to parents and students and reports learner progress using various colors instead of
percentages or letter grades. Culminating exhibitions and showcases after big projects allow
students to demonstrate and share their learning with an authentic audience. Ongoing feedback
and critiques also take place throughout projects, allowing students to reflect on their learning
and include these reflections in project portfolios. Focus groups are regularly conducted with
students, and metrics such as ACT Aspire scores and Advanced Placement (AP) scores are
considered as secondary assessment metrics (Assessment of Learning, 2016).
Results will ultimately help the profession by providing valuable information to
educators in similar settings, namely mathematics classrooms in rural public schools, and
providing teachers and school administrators with a better understanding of how mathematics
PBL assessments reflect student learning.
Assumptions
Assumptions made by the researcher in this study included the following:

4
• Middle school mathematics teachers in the school system will implement project-
based learning teaching methods in their classrooms.
• Teachers have received professional development through pre-semester
workshops and conferences focusing on project-based learning instructional
methods and integrating cross-subject content into their classes.
• Students in the school system will actively participate in project-based learning
instruction and activities.
• PBL teaching methods will be applied with a high level of fidelity of
implementation.
• Existing data such as standardized test scores and classroom grades are valid and
reliable records that contain accurate student information.
Challenges
One challenge of this study is the separation of extraneous variables that may indirectly
influence the outcomes of project-based mathematics learning. Factors such as teacher quality,
student demographics, aptitude, prior math achievement, socio-economic status, and language
ability could all be potential covariates that need to be considered.
Another challenge was acquiring parental consent/student assent for a large enough
number of students to be conducive to a meaningful study. An explanation of the study by the
researcher to each class at the beginning of the semester was given in order to address this
challenge, along with cooperation from classroom teachers who assisted in the collection of
permission forms.

5
Limitations
Because this project takes on a mixed methods approach with some aspects of a case
study approach in order to generate an in-depth, multi-faceted understanding of the project-based
learning assessments taking place at the school, one limitation of the study is a lack of
comparison data from another school system. The school system involved in this study is very
unique in terms of its approach to learning, instructional methods, and student demographics.
The standardized test scores, classroom grades, classroom observations, student/teacher surveys,
and existing data records used in this study are exclusive to one school system. Another
limitation of the study is the relatively short time frame – surveys took place over the span of just
over one semester (August to January) and classroom grades were obtained over the span of the
first three nine-week grading periods of the academic year.
Hypotheses
The following hypotheses are proposed:
• Effective project-based mathematics learning instruction and assessment methods are
being incorporated in mathematics classes of the middle grade levels of the school
system.
• Students’ standardized test scores in mathematics will not have a high correlation with
their classroom mathematics grades because of inconsistencies between knowledge
measured by test items and the learning outcomes achieved by PBL. A weak positive
correlation is expected.
• Students’ self-assessments (survey responses) and teacher assessments (grades) of their
mathematical content knowledge are expected to have a strong positive correlation.

6
• Students’ levels of self-confidence, value, enjoyment, and motivation in mathematics will
significantly increase after one semester of participation in project-based learning.

7
Chapter II
Literature Review
Theory
Project-based learning is grounded in the constructivist theory that students understand
material more thoroughly when they actively work with and use their own ideas (Krajcik &
Blumenfeld, 2006). In terms of mathematics, proponents of mathematical problem solving
believe that students successfully develop the skill of problem solving when they learn
mathematical knowledge on their own, in a heuristic manner (Roh, 2003).
As a broad model, PBL was developed in the medical field for the purpose of giving
future doctors real-life “practice” with patients and in laboratory settings (Savery & Duffy,
1995). Since its beginning, it has been expanded to a variety of subject areas and is used in
classrooms ranging from elementary schools to universities and professional schools. Students
participating in project-based learning work in groups and are involved in solving challenging
problems that are authentic to the real world, curriculum-based, and often interdisciplinary
(Solomon, 2003).
The basis for PBL is rooted in the cognitive constructivist learning theories of Dewey and
Piaget. Dewey (1986) says that education takes place through a series of practical and theoretical
problematic struggles, which are resolved by the student engaging in a process that leads to
learning through reorganization of their thoughts. Piaget (1977) describes the process as the
need for accommodation when current experience cannot be assimilated into the learner’s

8
existing schema. In terms of PBL, these conflicts and questions within the student serve as the
stimulus for learning and determine the organization and nature of what is learned (Savery &
Duffy, 1995). In other words, the goals of the learner and the questions that they deem worthy of
answering are essential in considering what will be learned. Once goals for learning are
established, knowledge evolves through social negotiation and the ever-changing individual
understandings held by students in the group, classroom, school, community, etc.
The social constructivist theories of Vygotsky and his idea of scaffolding are also
instrumental in the theoretical basis for PBL. “What the child is able to do in collaboration today,
he will be able to do independently tomorrow.” (Vygotsky, 1934/1987). By collaborating with
teachers and classmates, students are able to increase their levels of understanding, problem
solving, and mathematical skills. The social constructivism of Vygotsky presents itself in PBL
through acculturation, learning experiences reflecting real-world complexities, the presence of a
more knowledgeable other (which could be the classroom teacher or a peer), and the zone of
proximal development (ZPD). The ZPD is utilized in project-based learning when the student is
placed in a role or situation that challenges them to advance their understanding of a topic
through the support and assistance of others (Voth, 2014).
Students require a great deal of support and monitoring as they navigate the twists and
turns of discovering how to best solve their given problem. Scaffolding occurs in PBL when
teachers help students bridge the gaps between their existing knowledge and skills and the
necessary knowledge and skills to complete the task at hand. This scaffolding is temporary, and
as students gain understanding and ability, they develop into self-confident and capable learners
(Bell, 2010).
9
Savery and Duffy (1995) describe problem-based learning as “what we consider to be
one of the best exemplars of a constructivist learning environment” (p. 31). They point out that
what is learned by students cannot be considered separately from how it is learned – students’
interactions with their environments are the channel through which understanding is established,
again pointing to the importance of constructivist theory in this method of instruction.
Overview of PBL Methods
Before discussing the methods used in PBL instruction, it is important to make note of an
issue regarding terminology. Throughout the literature, the acronym PBL refers alternatively to
either project-based learning or problem-based learning. The differences between the two
methods are subtle, and many times are considered to be one and the same. Projects are
sometimes viewed as smaller tasks with specifications for a desired end product (Savery, 2006),
which lead to solutions of the bigger issue, the problem. The literature reviewed here includes
studies in both project-based and problem-based learning.
It is helpful to note that PBL is neither a Socratic process of simply inquiry and
discussion, nor a discovery learning environment where a pre-determined outcome is desired by
the teacher (Savery & Duffy, 1995). PBL projects differ from traditional school projects in that
they incorporate more student autonomy, a greater degree of student choice, more work time is
unsupervised, and students have more responsibility (Thomas, 2000).
This method of learning is more in-depth, more student-focused, and more dependent on
the active engagement of students as they construct their own understandings in a context similar
to the real-life situation where their knowledge will be applied. Student learning is inherently
valuable in its own right, because it has a connection to something real, not just test scores or
grade point averages (Solomon, 2003). Student choice is another key element of PBL, as
10
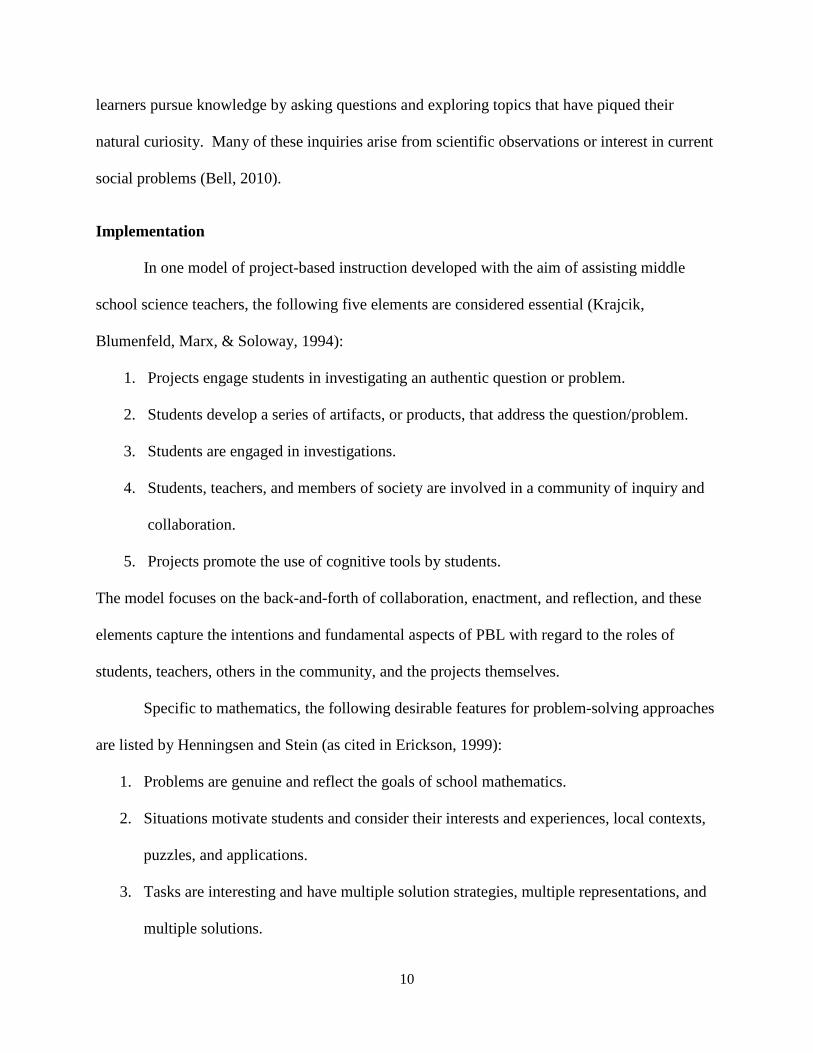
learners pursue knowledge by asking questions and exploring topics that have piqued their
natural curiosity. Many of these inquiries arise from scientific observations or interest in current
social problems (Bell, 2010).
Implementation
In one model of project-based instruction developed with the aim of assisting middle
school science teachers, the following five elements are considered essential (Krajcik,
Blumenfeld, Marx, & Soloway, 1994):
1. Projects engage students in investigating an authentic question or problem.
2. Students develop a series of artifacts, or products, that address the question/problem.
3. Students are engaged in investigations.
4. Students, teachers, and members of society are involved in a community of inquiry and
collaboration.
5. Projects promote the use of cognitive tools by students.
The model focuses on the back-and-forth of collaboration, enactment, and reflection, and these
elements capture the intentions and fundamental aspects of PBL with regard to the roles of
students, teachers, others in the community, and the projects themselves.
Specific to mathematics, the following desirable features for problem-solving approaches
are listed by Henningsen and Stein (as cited in Erickson, 1999):
1. Problems are genuine and reflect the goals of school mathematics.
2. Situations motivate students and consider their interests and experiences, local contexts,
puzzles, and applications.
3. Tasks are interesting and have multiple solution strategies, multiple representations, and
multiple solutions.
11
4. Problems provide rich opportunities for mathematical communication.
5. Appropriate content is covered and students’ ability levels and prior knowledge are
considered.
6. Difficulty levels are reasonable, and students are challenged but not discouraged.
These problems are described as taking anywhere from a few minutes to a few weeks to solve,
indicating that a wide variety of difficulty levels, scales, and types of problems are suitable for
the PBL approach.
PBL instruction must have learning-appropriate goals. When learners are given project-
based tasks, it is important for teachers to keep in mind that the difficulty of the projects, or even
the types of the projects, must not necessarily be the same as those that adult professionals would
deal with. What is important, rather, is that the types of cognitive demands and challenges
presented should reflect real-life scientific activities and should be consistent with the real-world
environment for which students are being prepared (Savery & Duffy, 1995).
The role of a teacher in a PBL classroom is not the same as the role of a teacher in a
traditional classroom. Rather than being the “giver” of knowledge, teachers using PBL strategies
serve more as facilitators. The facilitator has a major responsibility to foster the learning
environment and guide students in their activities and decision making processes. Another
important function of the facilitator is to model the metacognitive thinking that students should
engage in throughout the problem solving process (Savery & Duffy, 1995).
Academic Benefits
The benefits of PBL instruction in terms of knowledge acquisition and retention have
been demonstrated in numerous studies. In a 1998 experimental research study, Boaler presents
results showing that students in traditional content-based learning mathematics classrooms

12
demonstrated lower achievement on both standardized tests and project-based tests when
compared to students who had learned through a PBL mathematics approach. Students from the
PBL classrooms recognized that mathematics involved active and flexible thinking, and they
were successful in adapting the methods they had learned when necessary for solving a new
problem. The project-based tests these students took involved realistic situations, implying that
PBL instruction gives students an understanding that is able to be retained and later applied to
authentic circumstances. The students from the traditional classroom had difficulty using the
information they had learned in anything other than textbook questions. Boaler (1998) points out
that the students from the PBL approach did not necessarily know more mathematics than the
students from the traditional approach, but they were better able to use their knowledge because
of three characteristics: a willingness and ability to perceive and interpret different situations; a
sufficient procedural understanding to allow them to select an appropriate procedure; and a
mathematical confidence that enabled students to adapt and change procedures when a new
situation called for changes. This indicates that students receiving PBL instruction acquire not
only more translatable knowledge, but a different kind of knowledge than that acquired by
students in a traditional approach (Bell, 2010).
In addition to performing better when presented with real life problem solving tasks,
students also find more enjoyment in the PBL model of instruction. Savery (2006) reports that in
one study involving physical therapy students, program graduates performed equally well with
PBL or traditional instruction approaches, but students reported a preference for the PBL
approach.
Project-based learning as the approach to instruction has greater benefits to students than
simply adding on projects as extra assignments or supplements to traditional instruction. Krajcik

13
and Blumenfeld (2006) describe many traditional experiments and projects as being “cookbook”
procedures, where students follow a prescribed set of steps to reach a predetermined outcome or
conclusion. This process does not require a deep understanding of material, and the learning that
results is superficial. In a project-based classroom, however, students are allowed to “explore
phenomena, investigate questions, discuss their ideas, challenge the ideas of others, and try out
new ideas. Research shows that problem-based science has the potential to help all students –
regardless of culture, race, or gender – engage in and learn science” (Project-Based Science
section, para. 2).
Lipka et al. (2005) present a case study of a culturally based mathematics curriculum
among Native Alaskan students. Students were engaged in projects that reflected themes and
connections to their local culture. They state that, “The need for culturally based curricula seems
obvious to those in the field of educational anthropology, but not necessarily to policy makers.”
They found the culturally-based mathematics project to allow student ownership through inquiry
and cultural connections, and they present strong evidence that this project-based curriculum is
beneficial in improving students’ academic performance both statistically and practically. The
real and positive connections engage students in deeper levels of engagement and understanding.
Schneider, Krajcik, Marx, and Soloway (2002) address the concern that has been raised
by some that movement away from teacher-disseminated information will limit the amount of
content to which students will be exposed, therefore giving students a disadvantage when taking
important achievement tests. Their study finds that among tenth and eleventh grade students
enrolled in a PBL science program, when compared to subgroups, the PBL students outscored
the national sample on 44% of test items on the NAEP science test, showing that students

14
participating in project-based learning are well prepared for this type of test. These outcomes
should translate to project-based learning in mathematics classes.
Although standardized test scores are often used to bolster claims of the success of PBL,
it is important to recognize that PBL fosters the development of many twenty-first-century skills
that cannot be measured on a standardized test (Bell, 2010). Self-management, teamwork,
leadership, and working to solve real tasks in real environments are crucial in the professional
world (Zafirov, 2013), and PBL prepares students to successfully collaborate, negotiate, plan,
and organize. Other benefits to students include increased social and communication skills and
more clear realizations of interdisciplinary connections in subject areas (Railsback, 2002). While
rubrics, self-evaluations, and reflections can somewhat address these factors, the benefits of PBL
reach far beyond the singular value of a standardized test score.
In mathematics, students are pushed beyond the traditional goal of computational ability
and are required to communicate effectively both the solutions and the solution paths, therefore
demonstrating deeper levels of understanding. Students can generate more specific questions
based on the original problem and then explore strategies for finding a solution. Throughout the
problem-solving tasks, students can also come to see the value of mistakes in mathematics –
dead ends and wrong turns in mathematics are often just as instructive as correct solutions in
helping students understand the mathematics involved (Erickson, 1999).
Maximizing Impact: Student, Teacher, and Classroom Factors
The effectiveness of PBL depends on student characteristics, teacher characteristics, the
overall classroom and school environments, and the specific tasks performed by the learners.
With regard to students themselves, a number of characteristics can be considered: age, gender,
learning style, attitude and disposition, race/ethnicity, socioeconomic status, ability, etc. These

15
factors must be considered as covariates in the study, possibly impacting learning outcomes and
correlations between formal assessment findings and observed outcomes and students’ self-
ratings of learning outcomes. Thomas (2000) discusses multiple studies on the outcomes of PBL
dependent on student factors: Findings include evidence that students with lower ability benefit
more and demonstrated the largest gain in critical thinking and social participation behaviors.
Girls were found to show a preference for teaching methods that stress understanding rather than
memorization and rote learning procedures, indicating that exposure to PBL may raise the
mathematical achievements of all students, but especially girls. Students who do not perform
well in traditional classrooms may have learning styles and preferences that are not well-suited to
the transmission of facts and rote learning processes, but may thrive in a PBL environment.
In PBL classrooms, teachers’ instructional abilities are more critical than in traditional
classrooms. PBL teachers must develop a broader range of pedagogical skills in order to be
effective – these skills are critically important as the teacher must convey to the students not only
mathematical knowledge, but also knowledge of mathematical processes, communication and
presentation skills, modeling, and reasoning (Roh, 2003). Therefore, professional development
and teacher adaptation are critical elements to successful project-based learning.
School factors can present constraints on the success of project-based instruction: PBL is
more likely to be successful in schools with adequate resources, flexible schedules, compatible
technology, manageable class sizes, and supportive curricular policy (Thomas, 2000). These
conditions are generally favorable at the school system at the center of this study: resources,
schedules, technology, and curricular policies are all in place to support PBL. Manageable class
size is an area where the school is currently struggling, with population growth and school
enrollment increasing faster than originally expected and planned for. Hertzog (1994) reported

16
that school factors were the primary barrier in the implementation of project-based learning –
especially physical organization of the school, limitations on available time, and structure of
schedules to cover all academic subjects (as cited in Thomas, 2000, p. 26-27).
Motivation, Self-Efficacy, and Interest
Evidence from prior studies shows that PBL proves beneficial to students by helping
them develop flexible understandings of information and the continued ability and desire for
lifelong learning. Improved student motivation, specifically intrinsic motivation, is considered to
be one of the major advantages of PBL (Hmelo-Silver, 2004). This intrinsic motivation is
increased because when students assume the role of a scientist, historian, engineer, or another
individual who has a real stake in the proposed problem, students take ownership and feel
invested in the problem (Stepein & Gallagher, 1993).
Another possible explanation for increased motivation is accountability. When students
are completing a project in a group, they are all functioning as members of a team. Children
often do not want to let their friends down, and this accountability to peers can have greater
consequences and provide more motivation to students than if they were only responsible to the
teacher (Bell, 2010).
The following conditions are decreased in a PBL environment, which can lead to
increases in intrinsic motivation (Stiggins, Arter, Chappuis, & Chappuis, 2007):
• Intimidation
• Punishments and rewards linked to subjective judgments
• Comparisons of students to their peers
• Infrequent or vague feedback
• Limited personal control

17
• Responsibility without authority
In PBL classrooms, these conditions are replaced with student sense of control and choice,
frequent and specific feedback, challenging but not threatening tasks, accurate self-assessment,
and learning tasks relevant to the student’s everyday life.
Questions about student motivation are often considered separately from questions about
thinking and learning, but teachers are required to integrate these two areas (Blumenfeld et al.,
1991). Classroom activities comprised of predominantly low-level tasks that don’t require
complex thinking can contribute to poor attitudes toward learning and a lack of understanding of
content and processes. The authentic projects of PBL, on the other hand, lead to increased
motivation when students are focused on formulating plans, tracking progress, and evaluating
solutions – not on grades and other anticipated outcomes and consequences.
Blumenfeld et al. found that the features of PBL such as variety, challenge, student
choice, and realistic problems promote increased levels of interest and perceived value among
students (as cited in Thomas, 2000, p. 6). Self-reports collected by teachers also showed that
PBL activities resulted in a variety of benefits for students, including improvements in attitudes
towards learning, work habits, problem-solving capabilities, and self-esteem. These teachers, in
fact, indicated that learning subject matter content was not one of the primary benefits of project-
based learning – subject matter content knowledge was rated as a less frequent type of learning
in PBL than problem-solving skills, aspects of cooperation, critical thinking skills, and aspects of
responsibility (Thomas, 2000). A study of participation in a scientific and technological PBL
instruction found that students’ levels of motivation and self-image were elevated, supporting
conclusions that PBL fosters meaningful learning (Doppelt, 2003).

18
While PBL has been reported to increase self-esteem in students, Meyer, Turner, and
Spencer (1997) point out that a sense of academic self-efficacy is required before students will
actively engage in strategic problem-solving efforts. They say that students who report higher
self-efficacy are expected to choose to undertake academic challenges for the purpose of
improving mastery and are more likely to persist toward achieving their goals, indicating that
“challenge seekers” (those with higher tolerance for failure and a learning goal orientation) will
be more open to a PBL approach than “challenge avoiders” (those who have a higher negative
affect for failure and a performance-based goal orientation).
Challenges
High quality implementation of PBL instruction requires a large investment of time,
energy, and resources on the part of many individuals: students, parents, teachers, and school
administrators. Solomon (2003) lists the following things as being essential to successful
implementation of PBL: change in teachers’ approaches to teaching, change in students’
approaches to learning, restructuring of policy decisions, leadership, and professional
development for teachers. These things are all currently in place at the school. In addition to
these demands, teachers must also find ways to fit more collaboration into their schedules – with
both fellow teachers and people from the community who can serve as audiences for student
projects (Bradley-Levine et al., 2010). Clearly, adopting a PBL approach to instruction is not a
simple decision for a school or school district. Many factors must be considered.
Another challenge of implementing PBL in K-12 schools is the constraint of traditional
school day scheduling and the pressure to produce high standardized test scores. Savery (2006)
says this:

19
Most state-funded elementary schools, middle schools, and high schools are constrained
by a state-mandated curriculum and an expectation that they will produce a uniform
product. High-stakes standardized testing tends to support instructional approaches that
teach to the test. These approaches focus primarily on memorization through drill and
practice, and rehearsal using practice tests. The instructional day is divided into specific
blocks of time and organized around subjects. There is not much room in this structure
for teachers or students to immerse themselves in an engaging problem. (p. 17-18)
The challenge of the traditionally structured school day is something that has already been
addressed at the school system involved in this study – their school day is not divided into the
typical blocks or periods, and students have some degree of freedom to use their time working on
projects and activities of their choice. This is helpful for the implementation of PBL to be more
successful and impactful in the school.
When these challenges are overcome and PBL instruction is implemented, performance
standards can still create difficulties in developing projects and identifying driving questions and
problems. When the standards are considered before the driving question, it can be difficult to
identify questions that would be meaningful and interesting to students since many driving
questions do not address learning outcomes aligned to national, state, or district standards and
curricula (Krajcik & Blumenfeld, 2006). Student interest and curiosity should be considered first
in identifying a question or problem, and then projects can be identified that promote the
appropriate cognitive skills and learning outcomes.
The integration of technology can also be a challenge in PBL. While teachers realize that
it is a valuable tool for learning, they often have difficulty incorporating technology into the
classroom in meaningful ways and as a cognitive tool (Thomas, 2000).
20
Assessment
Much of the reviewed literature focuses either on how to assess project-based learning in
general, or on how to assess mathematics learning in general. There is very little research on
best practices and methods for assessing project-based learning specifically in the context of
mathematics instruction. However, many of the ideas and suggestions for PBL in general can be
applied or slightly adapted to fit the needs of students and teachers in PBL mathematics
classrooms.
Just as the instruction in a PBL classroom is authentic, Hopkins (1999) describes how
mathematics assessments should also be authentic. Authentic assessment involves data
collection that provides teachers credible and reliable information about what students are able to
do. It is important for not only the results to be accurate, but for the process of obtaining them to
be trustworthy. Authentic assessment is part of an ongoing cycle of teaching, learning, and
assessment working together as an interactive process.
Solomon (2003) explains the culmination of the PBL process as follows: “At the end,
students demonstrate their newly acquired knowledge and are judged by how much they’ve
learned and how well they communicate it.” Although no details are offered as to how students
communicate their knowledge (because different projects and contexts call for different
measures), it is clear that a subjective assessment by the teacher will take place.
However, teacher input should be received by students not just at the end of a project or
unit, but throughout the learning process. It is important for the teacher to have regular
conversations with students to ensure that the students are staying on track in their plans and
activities, and also to check that they are developing their ideas and skills fully (Bell, 2010). If
time is a constraint, teachers can provide group feedback instead of feedback to individual

21
students (Krajcik & Blumenfeld, 2006). With this regular delivery of feedback and guidance, the
expertise of the teacher will benefit students throughout all stages of the project.
Throughout this cycle of assessment and revision, teachers do not specify exactly what
students should change, instead they give general feedback that alerts students to the key
concepts that they should rethink. Students can then return independently to portions of the
project where they see opportunities for improvement, empowering them with intellectual
responsibility (Barron et al., 1998).
In addition to this assessment by the teacher, student self-assessments also play a large
role in the PBL instructional model. Savery (2006) recommends that both self-assessment and
peer assessment be conducted after the completion of each problem or project, and again at the
end of each curricular unit, so that they occur regularly throughout the project. These
assessments promote reflection and metacognition skills in students.
One method of self-assessment, self-grading, is described by Ulmer (2000). He
developed this self-grading practice as a solution to the excessive amounts of time required for
formative assessment activities in PBL in mathematics. In this process, students are given an
assignment requiring a short written response to a question. After responses are written, students
engage in discussions about their perspectives on the assignment. Students correct and revise
their responses as the discussions are taking place, and additions and corrections are made on
their papers using a different colored pen or pencil from the one used in writing the original
response. Students are given rubrics and reflect on their work, and then assign themselves a
grade. By participating in this process, the learner is able to see the differences in their initial
response and final response, becomes engaged in critical thinking through the discussion and
revision processes, and receives timely feedback from the instructor on both the original and
22
final responses. This improves the quality and quantity of formative assessment taking place,
and the impetus to think critically is placed where it belongs – with the student, not the teacher.
Savery (2006) also discusses the goals of formal student examinations in a PBL
classroom. When students are given an exam, the goal of that exam must be to measure the
student’s progress toward both the knowledge-based and process-based aspects of the material.
Both dimensions of the PBL process should be assessed regularly, and students need to be able
to recognize and communicate to others their knowledge and what and how they learned
throughout the project.
Sometimes, formal exams will not be a useful measure of gains in student knowledge.
Bell (2010) describes a study in which students used principles from geometry and architecture
to develop designs for a new playhouse to be built at a community center. The project was
assessed by the evaluation of the designs themselves, with a determination of whether or not the
submissions were accurate enough to actually be built. In this particular case, 84% of the student
submissions were deemed buildable, and after the assessment, students were able to consult other
resources and revise their designs.
This process of revision after the initial assessment shows a level of motivation in the
students created in part by the assessment process, evidencing assessment for learning (where
assessment is not just the index of change, but rather it is the change) as opposed to merely
assessment of learning. Research on motivation, learning strategies, and feedback all support
assessment for learning as the best use of assessment to promote student learning (Stiggins,
Arter, Chappuis, & Chappuis, 2007).
Among students who report overwhelming favor for PBL over traditional instruction,
team dynamics and seemingly unfair assessment are cited as their biggest frustrations (Piper,

23
2012). Students can be resentful of “group grades” where everyone in a group receives the same
grade for a project, regardless of whether or not equal contributions were made by all group
members. To address this challenge, Piper suggests the following methods:
• Individual portfolios – students select elements from the project that they were primarily
responsible for producing and then discuss why they are good examples of their skills.
• Role-based assessment – students cycle through lead and supporting roles and are graded
on the artifacts produced when they are the lead, and graded on their actions to support
the team when they are in supporting roles.
• Weighted scoring – a combination of self-evaluations, peer-evaluations, and teacher
evaluations are used to score student contributions.
When students work together in an environment that recognizes and assesses their individual
contributions, PBL can be more effective for all types of students as the teacher is enabled to
help more students individually on their level.
Gaps in the Literature
As stated previously, little research exists specifically on the assessment of PBL in
mathematics classrooms. In her 2004 article, Hmelo-Silver notes that minimal research has been
conducted outside of the fields of medical education and gifted education.
Some research studies have examined the effectiveness of PBL through summative
assessment and looked at the degree of success associated with implementation of PBL through
formative assessment. However, only one study of PBL effectiveness was found that
incorporated an experimental research design (Thomas, 2000). There also does not seem to be
much existing literature focusing on determining the validity of the assessments themselves
when conducted to measure the outcomes of project-based mathematics learning. The proposed

24
study offers an expansion of the knowledge in this area, which will be useful to educational
administrators, teachers, and policy makers.

25
Chapter III
Methods
In order to examine project-based learning implementation and assessment in middle
grades mathematics classrooms in the school system of interest, data collection included student
pre- and post-semester surveys, teacher post-semester surveys, multiple classroom observations,
and existing data in the form of classroom grades and standardized test scores provided to the
researcher by the school. The population of interest was 6th, 7th, and 8th grade mathematics
students and teachers at the selected school system currently implementing and participating in
project-based learning in mathematics classes.
Purpose and Research Questions
This project examined the methods of implementation and assessment of project-based
mathematics instruction at a newly established K-9 school located in central Alabama. Research
questions and methods of analysis included the following:
• RQ1: How is project-based mathematics learning currently being implemented and
assessed? (classroom observations, descriptive statistics, qualitative description)
• RQ2a: How does the school’s classroom performance grading system compare to
standardized test results? (Chronbach’s Alpha, Kendall’s Coefficient of Concordance W,
Pearson correlations)
• RQ2b: How do student self-assessments relate to grades and scores on standardized tests?
(Chronbach’s Alpha, Kendall’s Coefficient of Concordance W, Pearson correlations)

26
• RQ3: Does project-based learning lead to increases in students’ levels of self-confidence,
value, enjoyment, and motivation in mathematics? (paired samples T-tests, pre-post mean
differences)
Setting
The school system involved in this study is a non-traditional public school system in
central Alabama. The system is unique in that it did not stem from a pre-existing system, school,
policies, or culture. It was created to serve a new municipality with a rapidly growing population,
which has many elements of a suburban community but is also largely rural. The percentage of
students living in poverty in this school system is far lower than the percentages for other public
schools in the same county. Challenges faced by this newly established school system have
included increased enrollments stretching the availability of space and resources, the ability to
effectively communicate the non-traditional grading and assessment practices of the system, and
using data analysis to drive instruction and the implementation of instructional programs,
policies, and procedures (Advance Education, 2017).
Research Design
The design for this study was a mixed-methods approach utilizing existing data
(academic performance information including standardized test scores and classroom
performance ratings) and new data obtained through classroom observations, student surveys,
and teacher surveys. Students’ mathematical abilities were measured by their classroom grades,
standardized test scores, and survey responses, collected periodically throughout the semester
from the classroom teachers and the students.
Students' mathematics self-confidence, value, enjoyment, and motivation were measured
by online surveys administered once in September 2016 and once in January 2017 through
27
Qualtrics software. These surveys included the Attitudes Toward Mathematics Inventory
(ATMI) (see Appendix B) and supplemental questions developed by the researcher (see
Appendix C). Teacher surveys were conducted after the conclusion of the Fall 2016 semester, in
January 2017. The teacher surveys collected information about how well teachers feel that they
are able to determine their students’ mathematical knowledge through the use of class-wide,
small group, and individual projects or assignments; teacher attitudes about the importance of
teaching pure and applied mathematics; and the perceived availability of opportunities for
students to express their understanding of mathematical concepts through oral, written, and other
creative outlets. The full teacher survey instrument is included in Appendix D. Other classroom
factors that determine the effectiveness of mathematics project-based learning were measured
through classroom observations conducted throughout the fall semester at the school (Appendix
E).
Time and effort required from students and teachers was minimal. Approximately 30
minutes was required to complete the surveys at the beginning and end of the semester. Most of
the students’ participation in the project was accomplished by their regular class attendance and
participation. A minimum level of participation and time spent in a PBL setting was expected to
be necessary in order for PBL to be an effective instructional method.
Participants
The population of interest was 6th, 7th, and 8th grade students enrolled in mathematics
classes in the school system of interest. This particular school system was selected because of
their progressive approach to instruction and learning, which leans heavily toward project-based
and inquiry-based learning. The sample included all students who returned signed parental
permission forms to participate in the study and also completed the online surveys conducted
28
twice throughout the semester, as well as all mathematics teachers in grades 6, 7, and 8 who
signed and returned consent forms. All students in grades 6, 7, and 8 were invited to participate.
No students were excluded due to educational ability, physical ability, or any other criteria. The
school employs one mathematics teacher per grade level for the middle grades, so a total of three
teachers were included in the sample. All stamped and approved permission/consent forms and
the Institutional Review Board (IRB) approval letter are included in Appendix F.
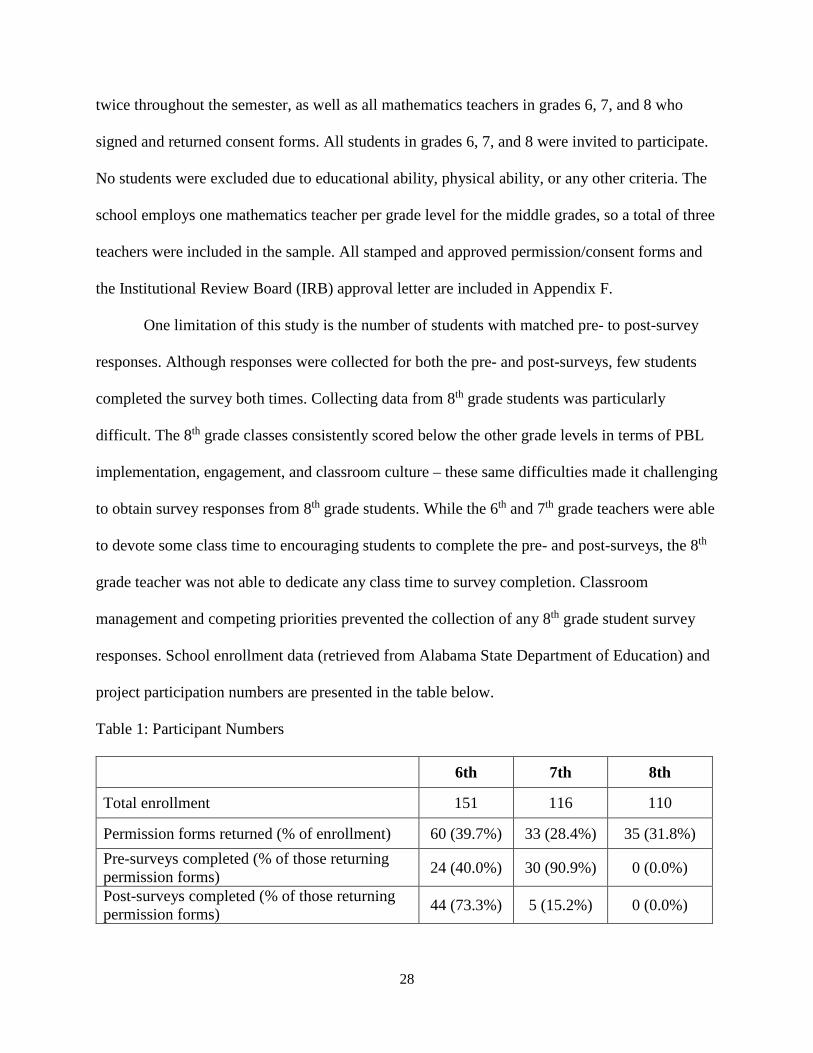
One limitation of this study is the number of students with matched pre- to post-survey
responses. Although responses were collected for both the pre- and post-surveys, few students
completed the survey both times. Collecting data from 8th grade students was particularly
difficult. The 8th grade classes consistently scored below the other grade levels in terms of PBL
implementation, engagement, and classroom culture – these same difficulties made it challenging
to obtain survey responses from 8th grade students. While the 6th and 7th grade teachers were able
to devote some class time to encouraging students to complete the pre- and post-surveys, the 8th
grade teacher was not able to dedicate any class time to survey completion. Classroom
management and competing priorities prevented the collection of any 8th grade student survey
responses. School enrollment data (retrieved from Alabama State Department of Education) and
project participation numbers are presented in the table below.
Table 1: Participant Numbers
6th 7th 8th
Total enrollment 151 116 110
Permission forms returned (% of enrollment) 60 (39.7%) 33 (28.4%) 35 (31.8%) Pre-surveys completed (% of those returning permission forms) 24 (40.0%) 30 (90.9%) 0 (0.0%)
Post-surveys completed (% of those returning permission forms) 44 (73.3%) 5 (15.2%) 0 (0.0%)

29
Matched pre/post survey responses (% of those returning permission forms) 11 (18.3%) 4 (12.1%) 0 (0.0%)
Global Scholar scores obtained (% of those returning permission forms) 57 (95.0%) 32 (97.0%) 35 (100.0%)
Classroom Performance scores obtained (% of those returning permission forms) 53 (88.3%) 29 (87.8%) 28 (80.0%)
Instrumentation
Student Survey
The primary data collection instrument for obtaining student data was the Attitude
Toward Mathematics Inventory (ATMI). Permission has been granted from the authors of the
ATMI to use the inventory in this study (M. Tapia, personal communication, January 19, 2017).
The ATMI was designed to investigate the underlying dimensions of attitudes toward
mathematics, with items constructed to assess confidence, anxiety, value, enjoyment, motivation,
and parent/teacher expectations. To estimate internal consistency of the scores, the survey
authors calculated the Cronbach alpha coefficient and found it to be .97, indicating a high degree
of internal consistency for group analyses. All 40 items had item-to-total correlation above .50,
with the highest being .82, suggesting that all items contribute significantly (Tapia & Marsh,
2004). A later study of the ATMI using a confirmatory factor analysis also supported the original
four-factor structure (Majeed, Darmawan, & Lynch, 2013).
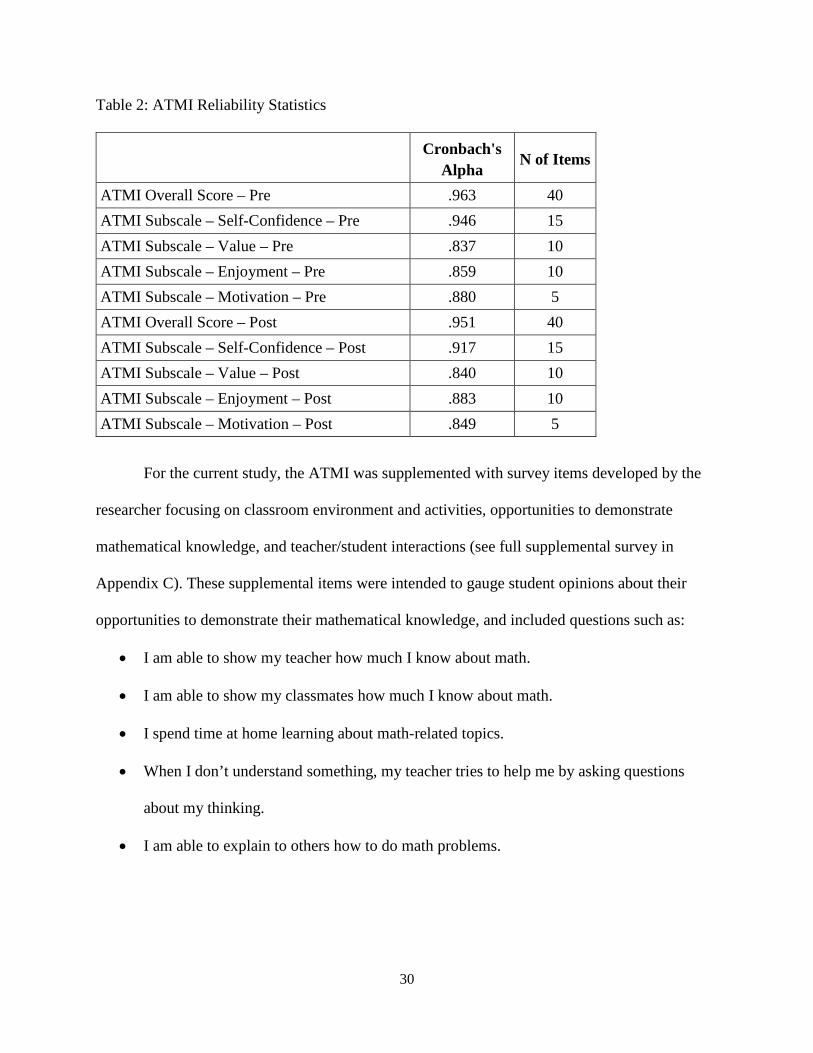
The table below presents internal consistencies for the pre- and post-ATMI overall survey
and the four subscales for this study, calculated using Cronbach’s Alpha statistics. The
Cronbach’s Alpha values ranged from 0.837 to 0.963. This demonstrates a high level of
reliability and is in alignment with previous results (Majeed et al., 2013).
30
Table 2: ATMI Reliability Statistics
Cronbach's Alpha
N of Items
ATMI Overall Score – Pre .963 40 ATMI Subscale – Self-Confidence – Pre .946 15 ATMI Subscale – Value – Pre .837 10 ATMI Subscale – Enjoyment – Pre .859 10 ATMI Subscale – Motivation – Pre .880 5 ATMI Overall Score – Post .951 40 ATMI Subscale – Self-Confidence – Post .917 15 ATMI Subscale – Value – Post .840 10 ATMI Subscale – Enjoyment – Post .883 10 ATMI Subscale – Motivation – Post .849 5
For the current study, the ATMI was supplemented with survey items developed by the
researcher focusing on classroom environment and activities, opportunities to demonstrate
mathematical knowledge, and teacher/student interactions (see full supplemental survey in
Appendix C). These supplemental items were intended to gauge student opinions about their
opportunities to demonstrate their mathematical knowledge, and included questions such as:
• I am able to show my teacher how much I know about math.
• I am able to show my classmates how much I know about math.
• I spend time at home learning about math-related topics.
• When I don’t understand something, my teacher tries to help me by asking questions
about my thinking.
• I am able to explain to others how to do math problems.

31
Internal consistency was also calculated for the pre- and post-supplemental survey items
using Cronbach’s Alpha and showed high levels of reliability at 0.777 for pre-surveys and 0.815
for post-surveys.
Table 3: Supplemental Survey Items Reliability Statistics
Cronbach's Alpha N of Items
Supplemental Survey Questions – Pre .777 20 Supplemental Survey Questions – Post .815 20
Teacher Survey
Teachers completed a post-semester survey developed by the researcher in which they
provided quantitative ratings about their ability to measure students’ mathematical abilities
through various assessment methods, beliefs and opinions about teaching both pure and applied
mathematics, and the opportunities that their students have to express their understanding of
mathematical concepts through different kinds of outlets. The sample size for this teacher survey
was small (only completed by the three mathematics teachers in grades 6-8 at the school). No
complex data analysis was performed with these results, but responses were compared/contrasted
with each other and compared to observation data and student survey data within each grade
level.
Classroom Observations
For classroom observations, the researcher utilized the STEM Classroom Observation
Protocol developed by the SERVE Center at University of North Carolina at Greensboro
(Arshavsky et al., 2012). This protocol includes guidelines for assessing 8 areas: mathematics
and science content; student cognitive engagement in meaningful instruction; inquiry learning,

32
project-based learning, and problem-based instruction; teacher instruction/formative assessment;
common instructional framework; student engagement; use of technology; and classroom
culture. This observation protocol assisted in measuring implementation of fidelity of project-
based classroom instruction. The protocol allowed for quantitative data to be collected by scoring
various aspects of instruction and student engagement on a scale from 0 = not observed to 3 =
very descriptive of the observation, and qualitative data was collected by recording notes about
specific details of various aspects of the teaching and learning processes. The classroom
observation data was used to calculate descriptive statistics, with repeated measures throughout
the semester to improve reliability.
Data Collection
At the beginning of the Fall 2016 semester, the Principal Investigator visited the
mathematics classrooms of the 6th, 7th, and 8th grades at the school. The research project was
explained to all students, and information/consent letters were distributed to students to take
home for their parents to sign. The researcher returned to the school the next week to collect the
signed forms. No further efforts were made to recruit participants. The link to the online surveys
was distributed to students by their classroom teachers using the Edmodo software that is utilized
daily for mathematics instruction. The researcher returned to the school four times throughout
the Fall 2016 semester to conduct classroom observations. All physical data collection of
observations and examination of existing records also took place at the school.
Electronic data was collected through online form surveys developed with Qualtrics
software and hosted on a secure server at www.auburn.edu. In addition to obtaining information
from individual students, the mathematics classrooms for grades 6-8 were also observed as a
whole in order to assess and better understand the project-based instruction methods being

33
implemented. Teachers completed brief surveys at the conclusion of the Fall 2016 semester.
Existing data in the form of standardized test scores and classroom performance grades were also
collected and examined. Files for approximately 200 students were obtained. These data were
provided by a school administrator and merged with data gathered through surveys using student
code numbers.
Data Analysis
Several methods were used to conduct data analysis for this study. Teacher and student
survey responses were collected using Likert-type scale items. The internal consistencies of the
ATMI survey instrument and the supplemental survey questions were calculated using
Cronbach’s Alpha coefficients. Data analyses of responses included standard inferential statistics
and percentages of students improving or increasing from the pre- to the post-survey. Other data
analysis techniques used included paired samples t-tests, Pearson correlations, Kendall’s
coefficient of concordance W, and qualitative analysis of classroom observation data. Data
analysis methods by research question are presented below.
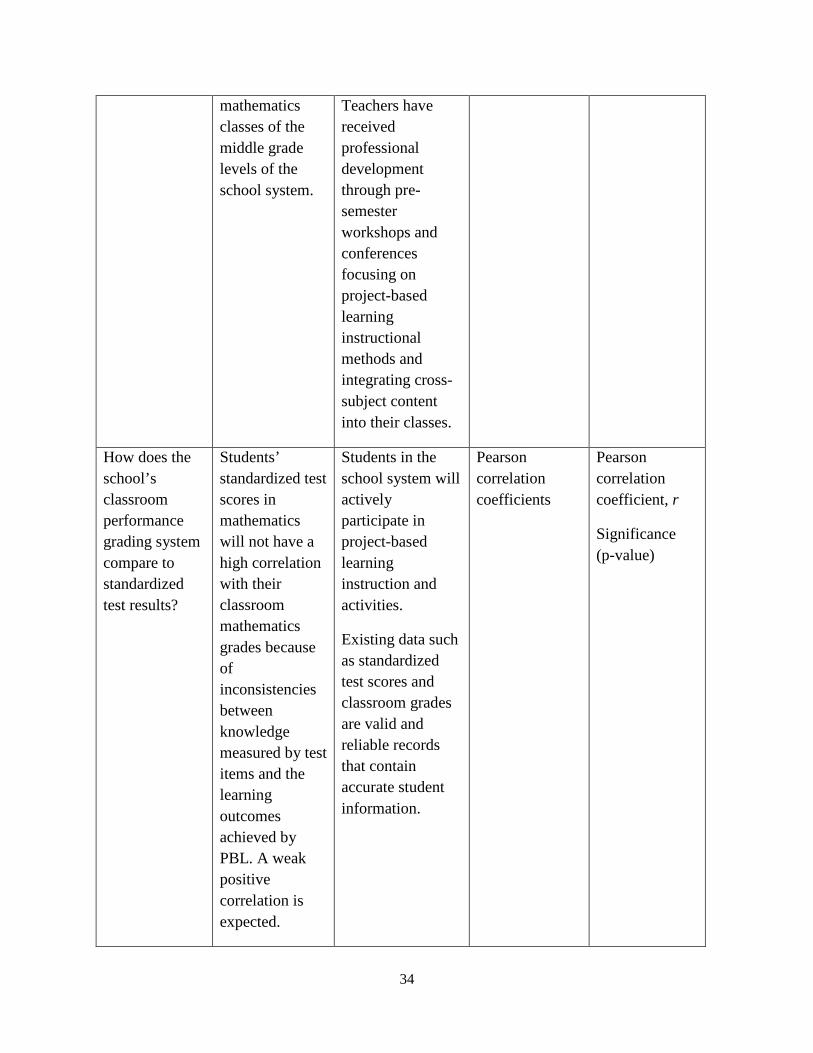
Table 4: Data Analysis Methods
Research Question
Hypothesis Assumptions Statistical Test Performed
Test Statistics
How is project-based mathematics learning currently being implemented and assessed?
Effective project-based mathematics learning instruction and assessment methods are being incorporated in
Middle school mathematics teachers in the school system will implement project-based learning teaching methods in their classrooms.
Descriptive Statistics
Qualitative Analysis
Means
Standard Deviations
34
mathematics classes of the middle grade levels of the school system.
Teachers have received professional development through pre-semester workshops and conferences focusing on project-based learning instructional methods and integrating cross-subject content into their classes.
How does the school’s classroom performance grading system compare to standardized test results?
Students’ standardized test scores in mathematics will not have a high correlation with their classroom mathematics grades because of inconsistencies between knowledge measured by test items and the learning outcomes achieved by PBL. A weak positive correlation is expected.
Students in the school system will actively participate in project-based learning instruction and activities.
Existing data such as standardized test scores and classroom grades are valid and reliable records that contain accurate student information.
Pearson correlation coefficients
Pearson correlation coefficient, r
Significance (p-value)

35
How do student self-assessments relate to grades and scores on standardized tests?
Students’ self-assessments (survey responses) and teacher assessments (grades) of their mathematical content knowledge are expected to have a strong positive correlation.
Students in the school system will actively participate in project-based learning instruction and activities.
Existing data such as standardized test scores and classroom grades are valid and reliable records that contain accurate student information.
Multiple Regression Backward Elimination
Kendall’s Coefficient of Concordance, W
R Square
Standard Error of the Estimate
R Square Change
F Change
Standardized Coefficients Beta
Partial Correlations
Kendall’s W
Significance (p-value)
Does project-based learning lead to increases in students’ levels of self-confidence, value, enjoyment, and motivation in mathematics?
Students’ levels of self-confidence, value, enjoyment, and motivation in mathematics will significantly increase after one semester of participation in project-based learning.
Students in the school system will actively participate in project-based learning instruction and activities.
PBL teaching methods will be applied with a high level of fidelity of implementation.
Paired Samples T-Tests
Descriptive Statistics
t-value
Effect Size
Means
Standard Deviations
Change in Means
36
Chapter IV
Findings
Introduction
Findings show that project-based learning is being implemented at different levels across
the middle grades mathematics classes of the school. Some agreement was found between
various assessment methods, but no significant increases were found in mathematics self-
confidence, value, enjoyment, or motivation. Results are presented below by research question.
RQ1: How is project-based mathematics currently being implemented and assessed?
Implementation
Classroom observations were conducted in mathematics classes of the 6th, 7th, and 8
grades throughout the semester. Four observations took place for each grade level, with each
observation consisting of a 55-minute class period. The observations took into account eight
areas: mathematics and science content; student cognitive engagement in meaningful instruction;
inquiry learning, project-based learning, ad problem-based instruction; teacher
instruction/formative assessment; common instructional framework; student engagement; use of
technology; and classroom culture. Items for each of these 8 areas were rated on a scale of 0 =
not observed, 1 = minimal, 2 = to some extent, and 3 = very descriptive of the observation.
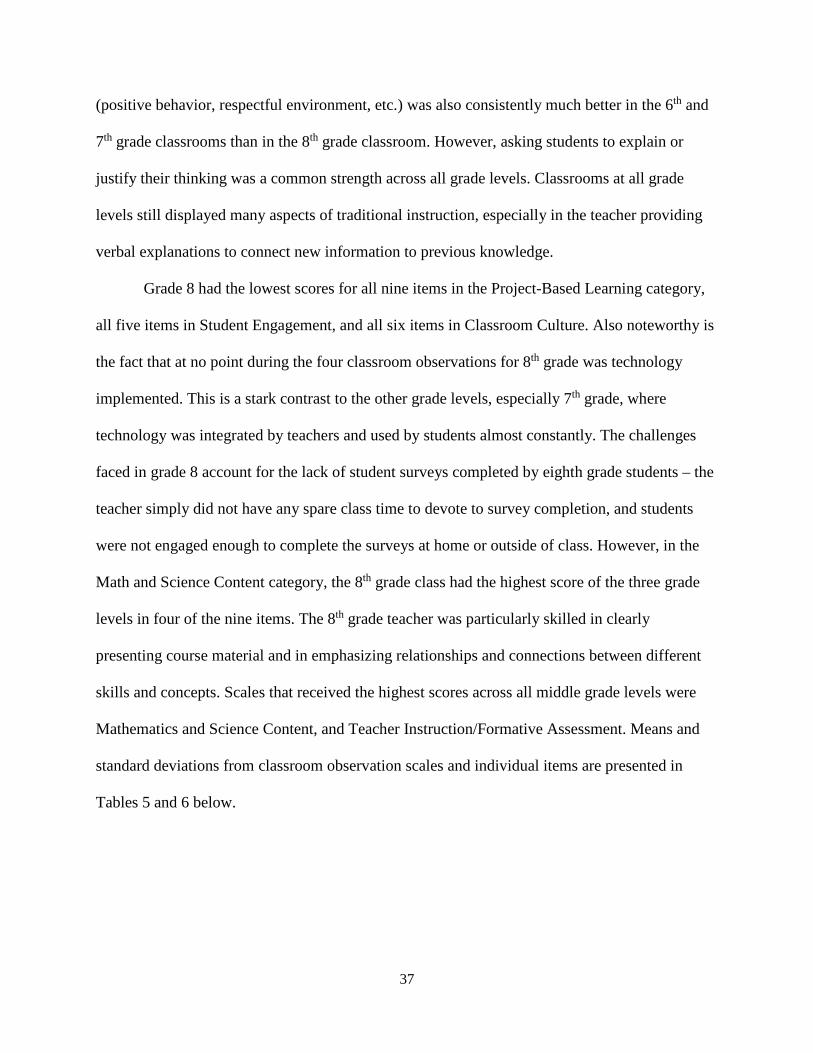
As a whole, project-based learning and problem-based instruction were far more
prominent in the 6th and 7th grade classrooms than in the 8th grade classroom. Classroom culture
37
(positive behavior, respectful environment, etc.) was also consistently much better in the 6th and
7th grade classrooms than in the 8th grade classroom. However, asking students to explain or
justify their thinking was a common strength across all grade levels. Classrooms at all grade
levels still displayed many aspects of traditional instruction, especially in the teacher providing
verbal explanations to connect new information to previous knowledge.
Grade 8 had the lowest scores for all nine items in the Project-Based Learning category,
all five items in Student Engagement, and all six items in Classroom Culture. Also noteworthy is
the fact that at no point during the four classroom observations for 8th grade was technology
implemented. This is a stark contrast to the other grade levels, especially 7th grade, where
technology was integrated by teachers and used by students almost constantly. The challenges
faced in grade 8 account for the lack of student surveys completed by eighth grade students – the
teacher simply did not have any spare class time to devote to survey completion, and students
were not engaged enough to complete the surveys at home or outside of class. However, in the
Math and Science Content category, the 8th grade class had the highest score of the three grade
levels in four of the nine items. The 8th grade teacher was particularly skilled in clearly
presenting course material and in emphasizing relationships and connections between different
skills and concepts. Scales that received the highest scores across all middle grade levels were
Mathematics and Science Content, and Teacher Instruction/Formative Assessment. Means and
standard deviations from classroom observation scales and individual items are presented in
Tables 5 and 6 below.
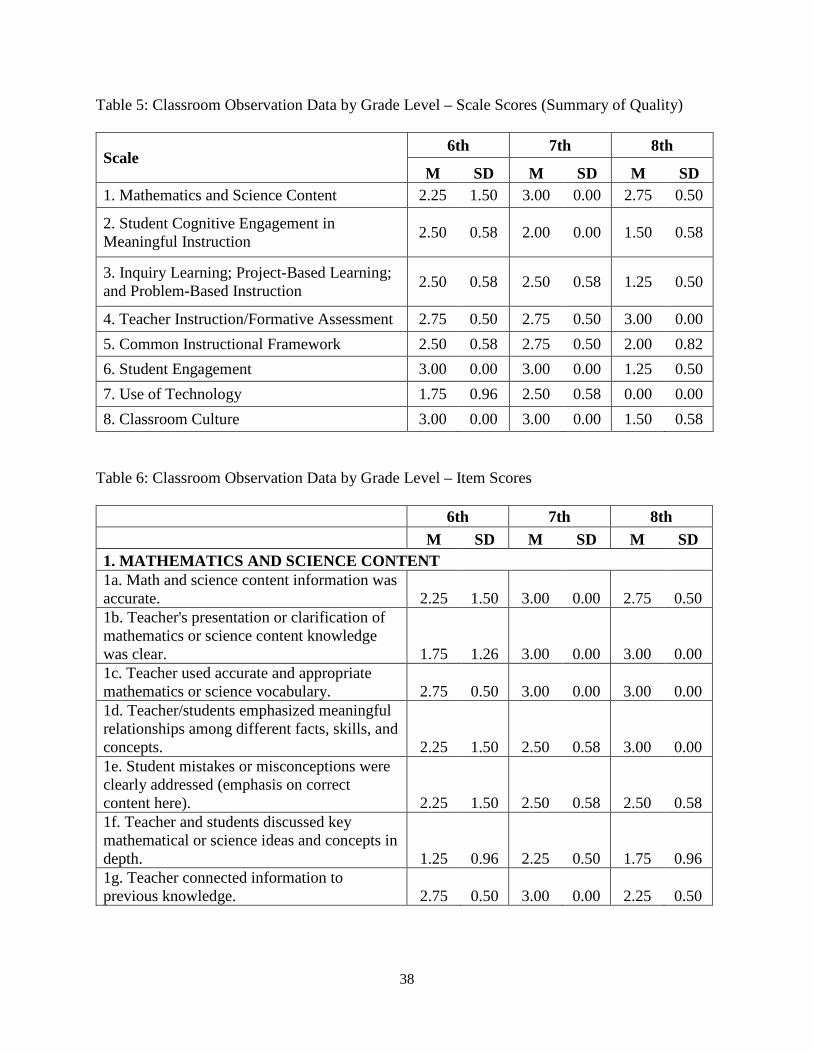
38
Table 5: Classroom Observation Data by Grade Level – Scale Scores (Summary of Quality)
Scale 6th 7th 8th
M SD M SD M SD 1. Mathematics and Science Content 2.25 1.50 3.00 0.00 2.75 0.50
2. Student Cognitive Engagement in Meaningful Instruction 2.50 0.58 2.00 0.00 1.50 0.58
3. Inquiry Learning; Project-Based Learning; and Problem-Based Instruction 2.50 0.58 2.50 0.58 1.25 0.50
4. Teacher Instruction/Formative Assessment 2.75 0.50 2.75 0.50 3.00 0.00 5. Common Instructional Framework 2.50 0.58 2.75 0.50 2.00 0.82 6. Student Engagement 3.00 0.00 3.00 0.00 1.25 0.50 7. Use of Technology 1.75 0.96 2.50 0.58 0.00 0.00 8. Classroom Culture 3.00 0.00 3.00 0.00 1.50 0.58
Table 6: Classroom Observation Data by Grade Level – Item Scores
6th 7th 8th M SD M SD M SD 1. MATHEMATICS AND SCIENCE CONTENT 1a. Math and science content information was accurate. 2.25 1.50 3.00 0.00 2.75 0.50 1b. Teacher's presentation or clarification of mathematics or science content knowledge was clear. 1.75 1.26 3.00 0.00 3.00 0.00 1c. Teacher used accurate and appropriate mathematics or science vocabulary. 2.75 0.50 3.00 0.00 3.00 0.00 1d. Teacher/students emphasized meaningful relationships among different facts, skills, and concepts. 2.25 1.50 2.50 0.58 3.00 0.00 1e. Student mistakes or misconceptions were clearly addressed (emphasis on correct content here). 2.25 1.50 2.50 0.58 2.50 0.58 1f. Teacher and students discussed key mathematical or science ideas and concepts in depth. 1.25 0.96 2.25 0.50 1.75 0.96 1g. Teacher connected information to previous knowledge. 2.75 0.50 3.00 0.00 2.25 0.50

39
1h. Appropriate connections were made to other areas of mathematics/science or to other disciplines. 0.75 0.50 2.50 1.00 1.00 0.00 1i. Appropriate connections were made to real-world contexts. 1.75 0.96 2.50 1.00 1.00 0.00 2. STUDENT COGNITIVE ENGAGEMENT IN MEANINGFUL INSTRUCTION 2a. Students experienced high cognitive demand of activities because teacher did not reduce cognitive demand of activities by providing directive hints, explaining strategies or providing solutions to problems before students have a chance to explore them, etc. 2.50 0.58 2.50 0.58 1.75 0.50 2b. Students were asked to explain or justify their thinking. 2.25 0.96 2.50 0.58 2.75 0.50 2c. Students were given opportunities to summarize, synthesize, and generalize. 1.75 0.96 2.00 0.00 1.25 0.50 2d. Students used a variety of means (models, drawings, graphs, concrete materials, manipulatives, etc.) to represent phenomena. 2.00 0.82 1.50 0.58 1.25 0.50 2e. Students were asked to apply knowledge to a novel situation. 2.50 0.58 2.25 0.50 1.50 0.58 2f. Students were asked to compare/contrast different answers, different solutions, or different explanations/interpretations to a problem or phenomena. 2.75 0.50 2.50 0.58 1.75 0.96 3. INQUIRY LEARNING; PROJECT-BASED LEARNING; AND PROBLEM-BASED INSTRUCTION 3a. Students were engaged in open-ended tasks or questions. 2.50 0.58 2.50 0.58 1.50 1.00 3b. Students engaged in hands-on or real-life problem solving activities or a lab experiment. 2.00 1.15 2.00 0.82 1.00 0.00 3c. Students developed their own questions and/or hypotheses to explore or test. 1.50 1.00 1.75 0.96 1.25 0.50 3d. Students engaged in scientific inquiry process (tested hypotheses and made inferences). 1.00 0.00 1.50 0.58 1.00 0.00 3e. Students determined which problem solving strategies to use. 3.00 0.00 2.75 0.50 2.00 0.00 3f. Students had to present or explain results of project. 3.00 0.00 3.00 0.00 2.50 0.58 3g. Students worked on a project requiring creativity. 2.75 0.50 2.75 0.50 1.50 1.00

40
3h. There was an explicit evidence of teacher modeling engineering (or reverse engineering) design process. 2.25 0.50 2.00 0.00 0.75 0.50 3i. There was an explicit evidence of students using engineering (or reverse engineering) design process. 2.25 0.50 2.00 0.00 0.75 0.50 4. TEACHER INSTRUCTION/FORMATIVE ASSESMENT 4a. Teacher provided clear learning goals to students. 3.00 0.00 3.00 0.00 3.00 0.00 4b. Teacher provided clear criteria for success/examples of good work to students. 2.75 0.50 2.25 0.50 2.50 1.00 4c. Teacher used a variety of strategies to monitor student learning and understanding throughout the lesson. 2.50 0.58 2.00 0.82 2.00 0.00 4d. Teacher provided specific feedback to students. 3.00 0.00 3.00 0.00 2.75 0.50 4e. Students were engaged in self- and/or peer-assessment. 2.50 0.58 2.75 0.50 2.00 0.82 4f. Teacher adjusted or differentiated instruction based on evidence of student learning. 2.50 0.58 2.75 0.50 2.50 0.58 4g. Students were given opportunities to reflect on their own learning. 2.75 0.50 2.75 0.50 2.50 0.58 5. COMMON INSTRUCTIONAL FRAMEWORK 5a. Students worked collaboratively in teams or groups. 2.00 0.82 2.50 1.00 1.50 1.00 5b. Students used writing to communicate what they had learned. 2.50 0.71 2.00 0.82 2.00 0.82 5c. Teachers asked open-ended questions that required higher level thinking. 2.25 0.50 2.00 0.00 1.50 1.00 5d. Teachers provided assistance/scaffolding when students struggled. 3.00 0.00 3.00 0.00 2.50 0.58 5e. Students engaged in discussion with each other. 2.75 0.50 3.00 0.00 2.25 0.96 5f. Students participated in guided reading discussions. 0.00 0.00 0.00 0.00 0.00 0.00 6. STUDENT ENGAGEMENT 6a. Students were behaviorally engaged (following directions, on-task behavior, responding to teachers' questions). 3.00 0.00 3.00 0.00 1.00 0.00 6b. The time in class was spent productively on meaningful tasks. 3.00 0.00 3.00 0.00 1.50 0.58 6c. Teacher pursued the active engagement of all students. 2.75 0.50 2.50 0.58 2.00 0.82
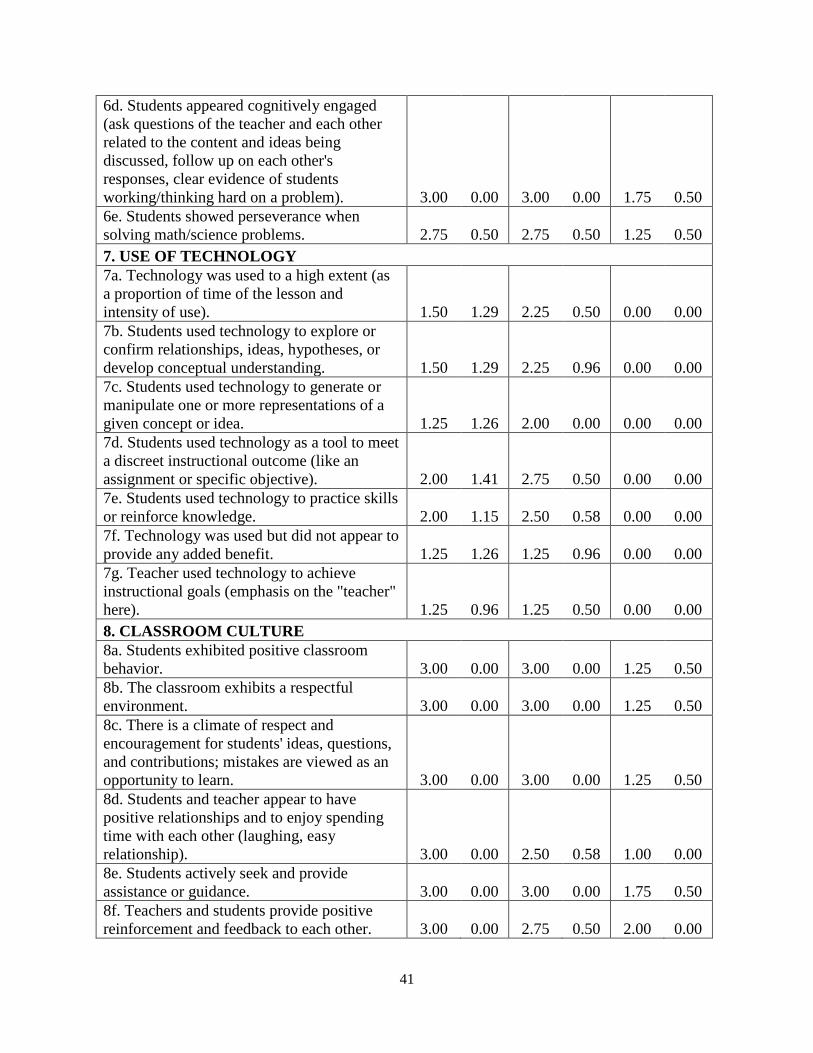
41
6d. Students appeared cognitively engaged (ask questions of the teacher and each other related to the content and ideas being discussed, follow up on each other's responses, clear evidence of students working/thinking hard on a problem). 3.00 0.00 3.00 0.00 1.75 0.50 6e. Students showed perseverance when solving math/science problems. 2.75 0.50 2.75 0.50 1.25 0.50 7. USE OF TECHNOLOGY 7a. Technology was used to a high extent (as a proportion of time of the lesson and intensity of use). 1.50 1.29 2.25 0.50 0.00 0.00 7b. Students used technology to explore or confirm relationships, ideas, hypotheses, or develop conceptual understanding. 1.50 1.29 2.25 0.96 0.00 0.00 7c. Students used technology to generate or manipulate one or more representations of a given concept or idea. 1.25 1.26 2.00 0.00 0.00 0.00 7d. Students used technology as a tool to meet a discreet instructional outcome (like an assignment or specific objective). 2.00 1.41 2.75 0.50 0.00 0.00 7e. Students used technology to practice skills or reinforce knowledge. 2.00 1.15 2.50 0.58 0.00 0.00 7f. Technology was used but did not appear to provide any added benefit. 1.25 1.26 1.25 0.96 0.00 0.00 7g. Teacher used technology to achieve instructional goals (emphasis on the "teacher" here). 1.25 0.96 1.25 0.50 0.00 0.00 8. CLASSROOM CULTURE 8a. Students exhibited positive classroom behavior. 3.00 0.00 3.00 0.00 1.25 0.50 8b. The classroom exhibits a respectful environment. 3.00 0.00 3.00 0.00 1.25 0.50 8c. There is a climate of respect and encouragement for students' ideas, questions, and contributions; mistakes are viewed as an opportunity to learn. 3.00 0.00 3.00 0.00 1.25 0.50 8d. Students and teacher appear to have positive relationships and to enjoy spending time with each other (laughing, easy relationship). 3.00 0.00 2.50 0.58 1.00 0.00 8e. Students actively seek and provide assistance or guidance. 3.00 0.00 3.00 0.00 1.75 0.50 8f. Teachers and students provide positive reinforcement and feedback to each other. 3.00 0.00 2.75 0.50 2.00 0.00

42
Examining PBL observation scores over the course of the semester shows that grade 7
made the most progress in terms of mathematics PBL implementation. Grade 8 consistently had
the lowest scores for all PBL items, and grade 6 tended to remain flat or decrease toward the end
of the semester. Grade 7 generally showed upward movement for most PBL areas. Areas with
the most room for improvement in the school are incorporating engineering design processes and
engaging in the scientific inquiry process. The line graphs below show PBL observation scores
by grade level over time.
Figure 1: PBL Observation Scores by Grade Level Over Time
0
1
2
3
4
1 2 3 4
Ratin
g Sc
ore
Observation Time
3a. Students were engaged in open-ended tasks or questions.
6th
7th
8th
0
1
2
3
4
1 2 3 4
Ratin
g Sc
ore
Observation Time
3b. Students engaged in hands-on or real-life problem solving activities or a lab experiment.
6th
7th
8th

43
0
1
2
3
4
1 2 3 4
Ratin
g Sc
ore
Observation Time
3c. Students developed their own questions and/or hypotheses to explore or test.
6th
7th
8th
0
1
2
3
1 2 3 4
Ratin
g Sc
ore
Observation Time
3d. Students engaged in scientific inquiry process (tested hypotheses and made inferences).
6th
7th
8th
0
1
2
3
4
1 2 3 4
Ratin
g Sc
ore
Observation Time
3e. Students determined which problem solving strategies to use.
6th
7th
8th

44
0
1
2
3
4
1 2 3 4
Ratin
g Sc
ore
Observation Time
3f. Students had to present or explain results of project.
6th
7th
8th
0
1
2
3
4
1 2 3 4
Ratin
g Sc
ore
Observation Time
3g. Students worked on a project requiring creativity.
6th
7th
8th
0
1
2
3
4
1 2 3 4
Ratin
g Sc
ore
Observation Time
3h. There was an explicit evidence of teacher modeling engineering (or reverse engineering) design process.
6th
7th
8th
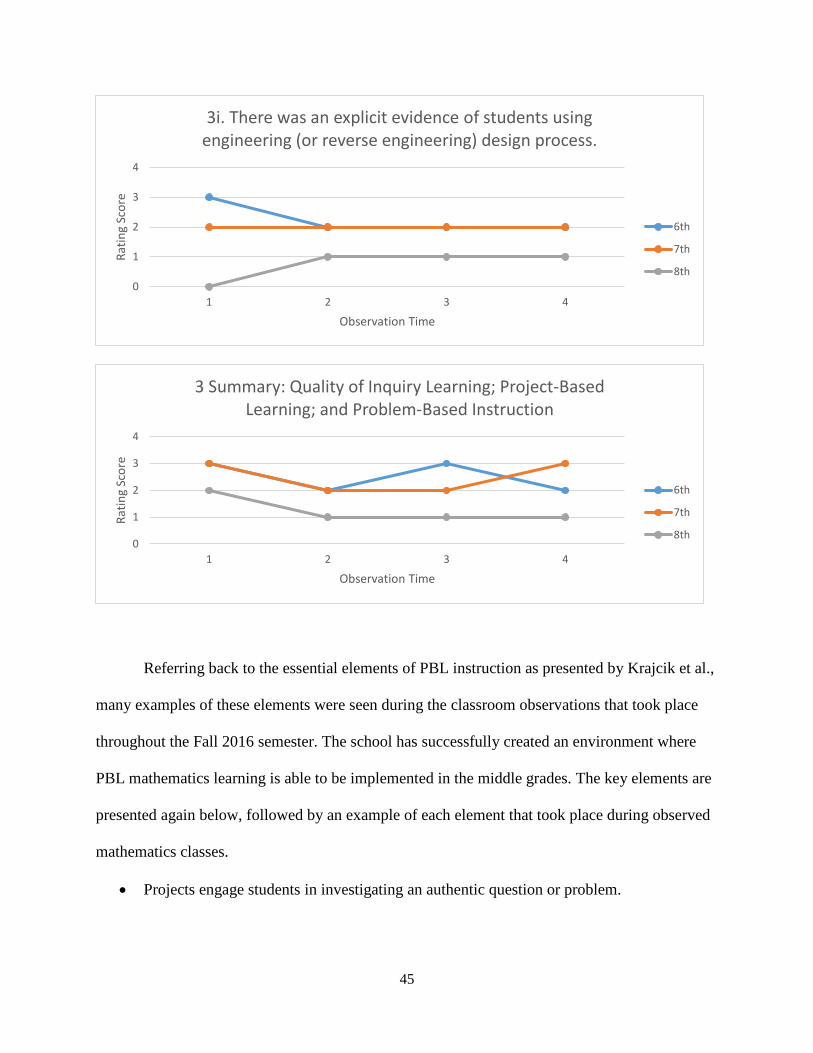
45
Referring back to the essential elements of PBL instruction as presented by Krajcik et al.,
many examples of these elements were seen during the classroom observations that took place
throughout the Fall 2016 semester. The school has successfully created an environment where
PBL mathematics learning is able to be implemented in the middle grades. The key elements are
presented again below, followed by an example of each element that took place during observed
mathematics classes.
• Projects engage students in investigating an authentic question or problem.
0
1
2
3
4
1 2 3 4
Ratin
g Sc
ore
Observation Time
3i. There was an explicit evidence of students using engineering (or reverse engineering) design process.
6th
7th
8th
0
1
2
3
4
1 2 3 4
Ratin
g Sc
ore
Observation Time
3 Summary: Quality of Inquiry Learning; Project-Based Learning; and Problem-Based Instruction
6th
7th
8th

46
o 7th grade students researched prices of various items sold in bulk on Amazon,
learning about ratios and unit rates.
• Students develop a series of artifacts, or products, that address the question/problem.
o 6th grade students created videos explaining how to evaluate expressions in which
letters stand for numbers. The videos were then shown to members of a lower-
level math class, with the 6th graders serving as peer leaders.
• Students, teachers, and members of society are involved in a community of inquiry and
collaboration.
o 8th grade students worked in groups to solve problems involving rules of
exponents. Students collaborated to write out meaningful questions to be asked
after presentations by other groups.
Assessment
Summative student assessment in mathematics took place using two methods: a
classroom performance rating assigned by the teacher, and a Global Scholar Performance Series
standardized test score. Classroom performance was rated by the mathematics teacher at the end
of each nine weeks, and students were assigned a rating on the following five-point scale.
Classroom Performance Assessment Ratings:
NME = Not Meeting Expectation of grade level understanding.
AAE = Almost Approaching Expectation of grade level understanding.
AE = Approaching Expectation of grade level understanding.
AME = Almost Meeting Expectation of grade level understanding.
MLE = Meeting Learning Expectation of grade level understanding.

47
The rating received by the student is dependent upon their performance during the previous nine
weeks of school. The teacher considers multiple factors when assigning student ratings,
including individual projects and assignments, small group projects, class-wide projects, and the
student’s portfolio of work for the term uploaded to the FreshGrade portfolio and assessment
platform. The portfolio can include evidence of learning such as completion certificates from
online mathematics exercises, pictures of objects and projects the student has created, and
electronic products such as videos, pictures, audio clips, notes, and presentations (FreshGrade,
n.d.).
Classroom performance ratings by grade level are presented below for each of the first
three nine-week periods. Distributions reveal that arbitrary decisions by teachers may lead to
discrepancies in classroom performance scores across grade levels. Although students in both the
6th and 7th grades performed well on mathematics standardized tests and outscored the national
means for their respective grade levels (see Table 8 below), a majority of 6th grade students
received scores of MLE = Meeting Learning Expectation, but a majority of 7th grade students
consistently received scores of AME = Almost Meeting Expectation. This suggests that teachers
may have a “default” score in mind as a starting point for evaluating each student. MLE ratings
were very rare among 7th grade students, although they did not differ significantly from 6th grade
students according to other assessment methods. Students in 8th grade received more evenly
distributed scores between AE, AME, and MLE scores. NME and AAE, the lowest two ratings,
were rarely given in any grade level. Classroom performance scores were seen to decrease over
time in grades 6 and 8, with the percentage of students receiving MLE decreasing each nine-
weeks in those two grade levels.
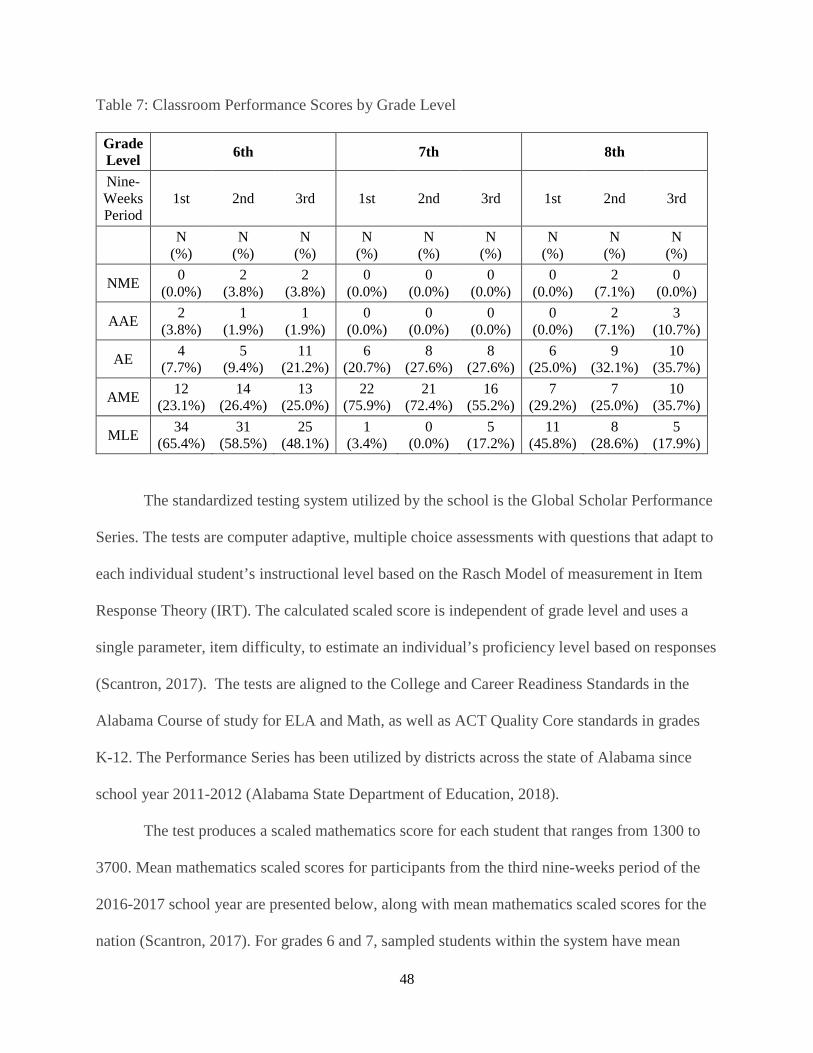
48
Table 7: Classroom Performance Scores by Grade Level
Grade Level 6th 7th 8th
Nine-Weeks Period
1st 2nd 3rd 1st 2nd 3rd 1st 2nd 3rd
N (%)
N (%)
N (%)
N (%)
N (%)
N (%)
N (%)
N (%)
N (%)
NME 0 (0.0%)
2 (3.8%)
2 (3.8%)
0 (0.0%)
0 (0.0%)
0 (0.0%)
0 (0.0%)
2 (7.1%)
0 (0.0%)
AAE 2 (3.8%)
1 (1.9%)
1 (1.9%)
0 (0.0%)
0 (0.0%)
0 (0.0%)
0 (0.0%)
2 (7.1%)
3 (10.7%)
AE 4 (7.7%)
5 (9.4%)
11 (21.2%)
6 (20.7%)
8 (27.6%)
8 (27.6%)
6 (25.0%)
9 (32.1%)
10 (35.7%)
AME 12 (23.1%)
14 (26.4%)
13 (25.0%)
22 (75.9%)
21 (72.4%)
16 (55.2%)
7 (29.2%)
7 (25.0%)
10 (35.7%)
MLE 34 (65.4%)
31 (58.5%)
25 (48.1%)
1 (3.4%)
0 (0.0%)
5 (17.2%)
11 (45.8%)
8 (28.6%)
5 (17.9%)
The standardized testing system utilized by the school is the Global Scholar Performance
Series. The tests are computer adaptive, multiple choice assessments with questions that adapt to
each individual student’s instructional level based on the Rasch Model of measurement in Item
Response Theory (IRT). The calculated scaled score is independent of grade level and uses a
single parameter, item difficulty, to estimate an individual’s proficiency level based on responses
(Scantron, 2017). The tests are aligned to the College and Career Readiness Standards in the
Alabama Course of study for ELA and Math, as well as ACT Quality Core standards in grades
K-12. The Performance Series has been utilized by districts across the state of Alabama since
school year 2011-2012 (Alabama State Department of Education, 2018).
The test produces a scaled mathematics score for each student that ranges from 1300 to
3700. Mean mathematics scaled scores for participants from the third nine-weeks period of the
2016-2017 school year are presented below, along with mean mathematics scaled scores for the
nation (Scantron, 2017). For grades 6 and 7, sampled students within the system have mean

49
mathematics scaled scores higher than the national average. Student scores among participants
also increased on average from 6th grade to 7th grade. As noted earlier, possible scores range
from 1300 to 3700 and are independent of grade level – therefore, one would expect to see an
increase in mean scores as grade level increases. However, for grade 8, sampled students within
the system have mean mathematics scaled scores lower than the national average, and also lower
than the 7th grade students in the system. This is consistent with the lower levels of project-based
learning implementation, student engagement, technology integration, and classroom culture in
the 8th grade.
Table 8: Global Scholar Mathematics Mean Scaled Scores
6th 7th 8th
Participants 2624 2744 2663
Nation 2580 2655 2715
Teacher Surveys
The three mathematics teachers at the school completed a short survey at the conclusion
of the Fall 2016 semester. This survey asked them to provide their opinions about the extent to
which they are able to measure student learning through various assessment methods, the
importance of teaching both practical, real world applications of mathematics and the theoretical,
pure mathematics behind those applications, and the availability of various outlets for students to
express their understanding of mathematical concepts. The full survey is presented in Appendix
D. The teachers rated individual projects or assignments as more valuable for assessment
purposes than small group projects or class-wide projects. They rated both practical applications
and pure mathematics as being important to teach students, but placed more importance on the

50
practical applications. Departing from traditional assessment methods, the teachers indicated that
their students have more opportunities to express their understanding of mathematics verbally
than through writing. Teachers indicated a lack of opportunities for students to express
mathematical understanding through creative outlets such as visual, musical, or other performing
arts. Observation notes also show more opportunities for students to demonstrate their
knowledge through vocal expressions than through written expressions, and observation data
confirms a lack of opportunities for students to utilize creative expression outlets. Means and
standard deviations for each survey item are presented below.
Table 9: Teacher Survey Item Statistics Teacher Survey Item Valid N M SD 1. I am able to determine my students’ mathematical abilities based on their contributions to class-wide projects.
3 4.00 1.000
2. I am able to determine my students’ mathematical abilities based on their contributions to small group projects.
3 4.67 .577
3. I am able to determine my students’ mathematical abilities based on individual projects or assignments. 3 5.00 .000
4. It is important to teach students how to solve math problems through practical, real world applications. 3 5.00 .000
5. It is important to teach students the theoretical, pure mathematics behind the processes they are learning.
3 4.33 .577
6. Students in my class have opportunities to vocally express their understanding of mathematical concepts.
3 4.33 .577
7. Students in my class have opportunities to express their understanding of mathematical concepts through writing.
3 3.33 .577
8. Students in my class have opportunities to express their understanding of mathematical concepts through creative outlets in visual, musical, or other performing arts.
3 2.67 1.155
Overall, the school is successfully using a variety of assessment methods to measure
students’ mathematical knowledge and learning. The system is doing well in terms of assessment
by utilizing individual portfolios and weighted scoring (Piper, 2012). More should be done in the

51
area of role-based assessment. None of the observed class periods in any grade level utilized a
cycling of lead and supporting roles for students. Students were given many opportunities to
create artifacts and contribute to group work, but the roles of group leaders and support members
were always arrived upon by the students as a function of their personalities, abilities, etc.
Teachers could be more deliberate in ensuring that these roles vary and grading students on their
supporting actions as well as final products.
RQ2a: How does the school’s classroom performance grading system compare to
standardized test results?
Pearson Correlation Coefficients
Pearson correlation coefficients were calculated to examine agreement between
classroom performance grades and Global Scholar scaled scores for each of the first three
grading periods during the 2016-2017 school year. In each grading period, classroom
performance grades and Global Scholar scaled scores were found to have significant correlation,
p < .01. Although correlations were not strong, the Pearson correlation coefficients did increase
each nine weeks, suggesting that teachers’ classroom performance ratings of students may have
become more accurate over the course of the semester. Distributions of classroom grades as
presented in Table 7 do show changes over time in the proportions of students at each ranking. In
the 6th and 8th grades, there was a marked decline in the percentage of students receiving the
highest ranking, Meets Learning Expectations, over the course of the year. Overall, the
significant correlations between classroom grades and standardized test scores indicate that
teachers are able to successfully evaluate students’ learning and levels of mastery.
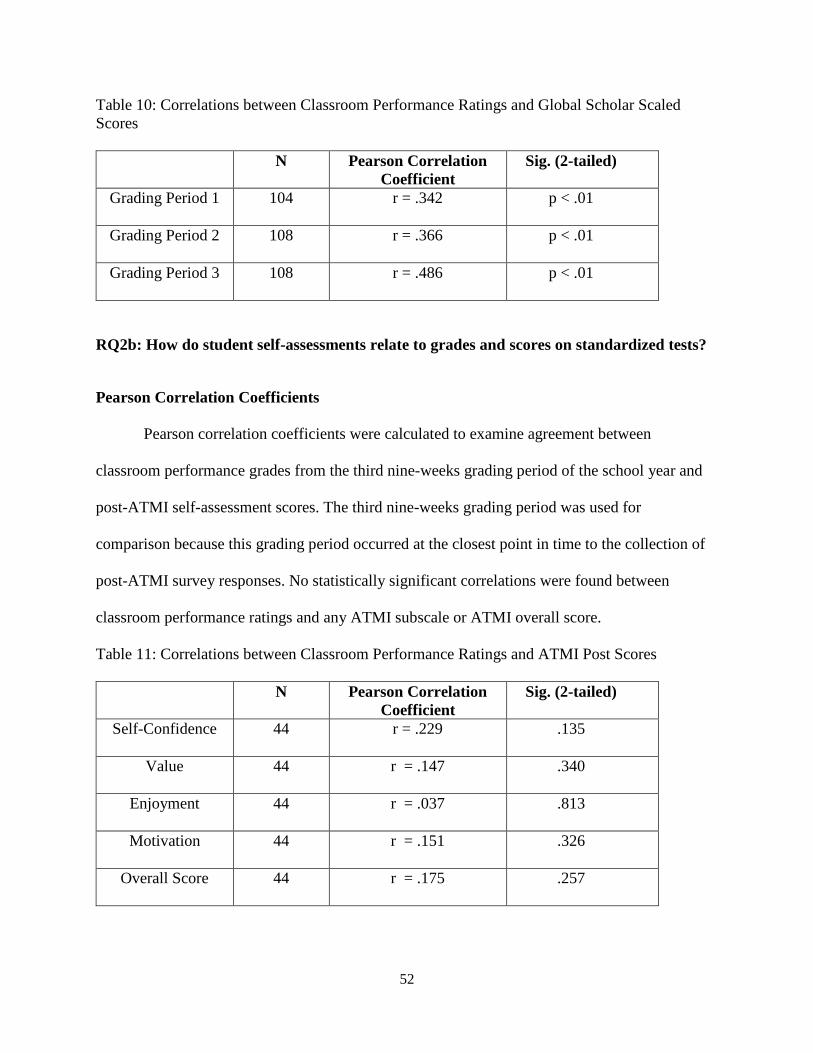
52
Table 10: Correlations between Classroom Performance Ratings and Global Scholar Scaled Scores
N Pearson Correlation
Coefficient Sig. (2-tailed)
Grading Period 1 104 r = .342 p < .01
Grading Period 2 108 r = .366 p < .01
Grading Period 3 108 r = .486 p < .01
RQ2b: How do student self-assessments relate to grades and scores on standardized tests?
Pearson Correlation Coefficients
Pearson correlation coefficients were calculated to examine agreement between
classroom performance grades from the third nine-weeks grading period of the school year and
post-ATMI self-assessment scores. The third nine-weeks grading period was used for
comparison because this grading period occurred at the closest point in time to the collection of
post-ATMI survey responses. No statistically significant correlations were found between
classroom performance ratings and any ATMI subscale or ATMI overall score.
Table 11: Correlations between Classroom Performance Ratings and ATMI Post Scores
N Pearson Correlation
Coefficient Sig. (2-tailed)
Self-Confidence 44 r = .229 .135
Value 44 r = .147 .340
Enjoyment 44 r = .037 .813
Motivation 44 r = .151 .326
Overall Score 44 r = .175 .257
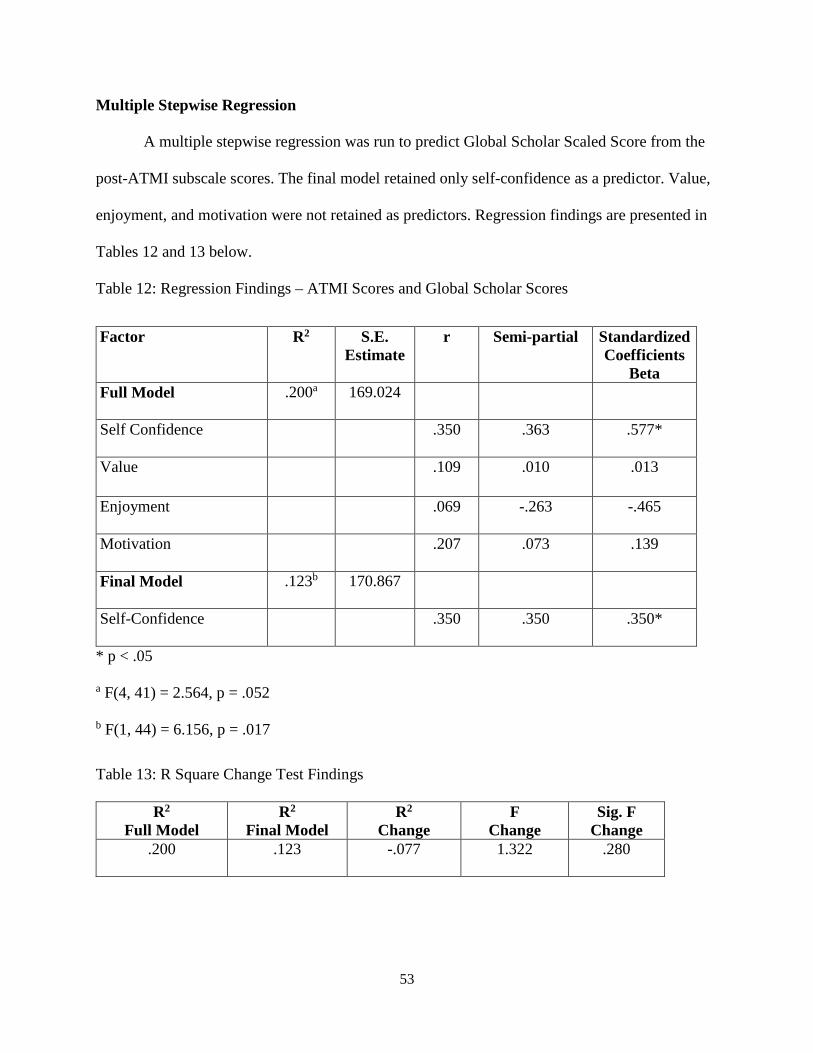
53
Multiple Stepwise Regression
A multiple stepwise regression was run to predict Global Scholar Scaled Score from the
post-ATMI subscale scores. The final model retained only self-confidence as a predictor. Value,
enjoyment, and motivation were not retained as predictors. Regression findings are presented in
Tables 12 and 13 below.
Table 12: Regression Findings – ATMI Scores and Global Scholar Scores
Factor R2 S.E. Estimate
r Semi-partial Standardized Coefficients
Beta Full Model .200a 169.024
Self Confidence .350 .363 .577*
Value .109 .010 .013
Enjoyment .069 -.263 -.465
Motivation .207 .073 .139
Final Model .123b 170.867
Self-Confidence .350 .350 .350*
* p < .05
a F(4, 41) = 2.564, p = .052
b F(1, 44) = 6.156, p = .017
Table 13: R Square Change Test Findings
R2
Full Model R2
Final Model R2
Change F
Change Sig. F
Change .200 .123 -.077 1.322 .280
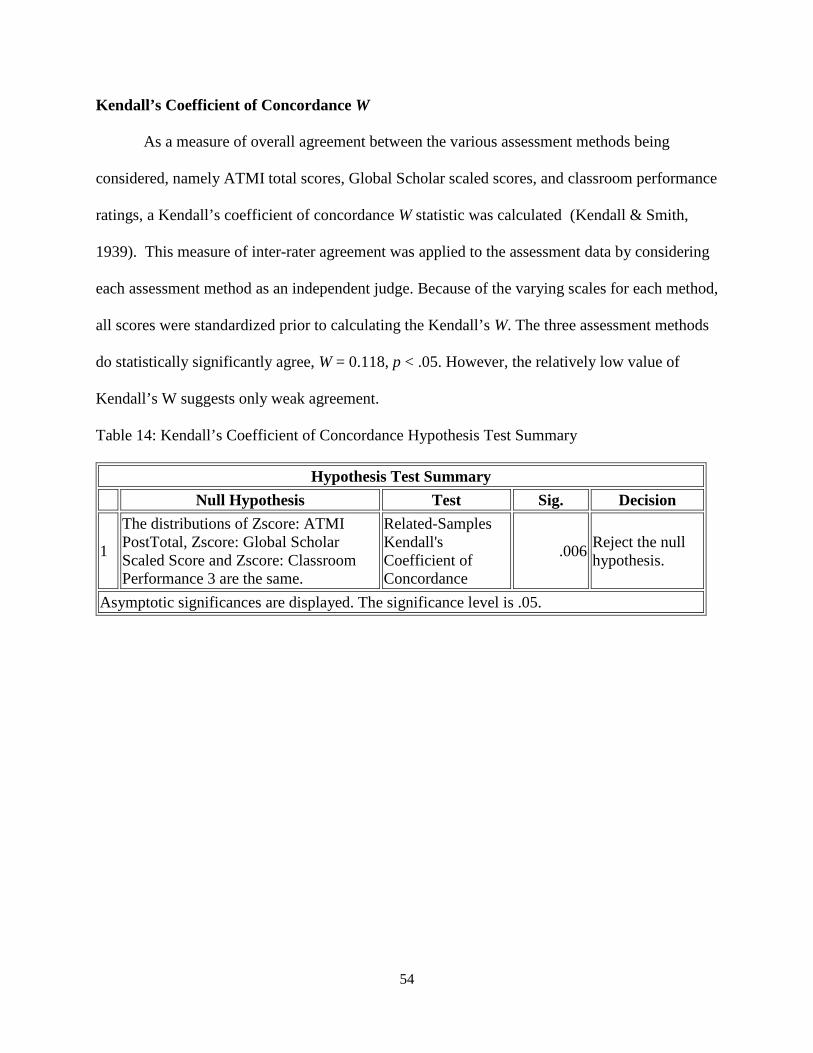
54
Kendall’s Coefficient of Concordance W
As a measure of overall agreement between the various assessment methods being
considered, namely ATMI total scores, Global Scholar scaled scores, and classroom performance
ratings, a Kendall’s coefficient of concordance W statistic was calculated (Kendall & Smith,
1939). This measure of inter-rater agreement was applied to the assessment data by considering
each assessment method as an independent judge. Because of the varying scales for each method,
all scores were standardized prior to calculating the Kendall’s W. The three assessment methods
do statistically significantly agree, W = 0.118, p < .05. However, the relatively low value of
Kendall’s W suggests only weak agreement.
Table 14: Kendall’s Coefficient of Concordance Hypothesis Test Summary
Hypothesis Test Summary Null Hypothesis Test Sig. Decision
1
The distributions of Zscore: ATMI PostTotal, Zscore: Global Scholar Scaled Score and Zscore: Classroom Performance 3 are the same.
Related-Samples Kendall's Coefficient of Concordance
.006 Reject the null hypothesis.
Asymptotic significances are displayed. The significance level is .05.

55
Figure 2: Kendall’s Coefficient of Concordance Results
RQ3: Does project-based learning lead to increases in students’ levels of self-confidence,
value, enjoyment, and motivation in mathematics?
ATMI Paired Samples
Paired samples t-tests were conducted to determine whether or not any statistically
significant increases occurred between the pre-survey and post-survey in the areas of self-
confidence, value, enjoyment, and motivation in mathematics, as well as ATMI overall scores.
The sample size for the paired samples test was small, with only N = 15 students completing
both the pre- and post-surveys. Neither the overall scores nor any of the subscales were found to
have a statistically significant change. Mean scores among the 15 paired students did slightly
increase in the areas of value and enjoyment. Mean scores slightly decreased in the areas of self-

56
confidence and motivation, as well as ATMI total scores. Cohen’s d statistics show small effect
sizes for all subscales and overall scores.
Table 15: Summary of ATMI Paired T-Tests
N Pre Post Change t Effect
Size
Mean (SD) Mean (SD) Mean (SD)
Self-Confidence 15 57.47 (12.21) 56.47 (11.55) -1.00 (6.536) -.593 -.153
Value 15 40.13 (5.87) 41.00 (6.40) .87 (4.824) .696 .180
Enjoyment 15 35.07 (7.87) 35.53 (7.26) .46 (4.998) .362 .092
Motivation 15 17.93 (4.67) 17.27 (4.73) -.66 (2.769) -.933 -.238
Overall Score 15 150.60 (26.44) 150.27 (25.73) -.33 (13.393) -.096 -.025
Supplemental Survey Items Paired Samples
A paired samples t-test was also conducted to determine whether or not a statistically
significant increase occurred between the pre-survey and post-survey for the Supplemental
Survey Items overall scores. The sample size for the paired samples test was small, with only N
= 15 students completing both the pre- and post-surveys. The scores were not found to have a
statistically significant change. Mean scores among the 15 paired students slightly decreased,
from 66.00 to 65.93. Cohen’s d statistics shows a very small effect size.
Table 16: Summary of Supplemental Survey Items Paired T-Test
N Pre Post Change t Effect
Size
Mean (SD) Mean (SD) Mean (SD)
Overall Score 15 66.00 (11.30) 65.93 (10.30) -.07 (4.20) -.061 -.025

57
ATMI Independent Samples
Due to the small sample sizes for the paired samples t-test, independent samples t-tests
were also conducted to compare ATMI pre- and post-survey responses. Results were consistent
with the paired samples t-tests in that no statistically significant changes were found. Among all
respondents regardless of matching, mean scores increased slightly for all four ATMI subscale
areas and for ATMI total scores. Results are presented in Tables 17 and 18 below.
Table 17: ATMI Independent Samples T-Tests Group Statistics
Test N Mean SD Std. Error
Mean
Self-Confidence Pre 53 56.02 13.044 1.792 Post 49 56.06 11.497 1.642
Value Pre 53 39.87 5.851 .804 Post 49 40.41 5.975 .854
Enjoyment Pre 53 35.53 8.004 1.099 Post 49 36.00 8.150 1.164
Motivation Pre 53 16.60 5.168 .710 Post 49 16.82 4.676 .668
ATMI Total Pre 53 148.02 28.763 3.951 Post 49 149.29 25.802 3.686
Table 18: Summary of ATMI Independent Samples T-Tests
t df Sig. (2-tailed)
Mean Difference
Std. Error Difference
95% Confidence Interval of the
Difference Lower Upper
Self-Confidence -.017 100 .986 -.042 2.443 -4.889 4.804 Value -.461 100 .646 -.540 1.171 -2.864 1.784 Enjoyment -.295 100 .769 -.472 1.600 -3.646 2.703 Motivation -.217 100 .828 -.213 .979 -2.154 1.729 Overall Score -.233 100 .816 -1.267 5.427 -12.033 9.499

58
Pre- and Post- Item Statistics
ATMI
The table below presents the pre- and post- N, mean score, standard deviation, and pre-
post difference for each item of the ATMI. This is not a matched sample – all survey responses
are included in this data. All ATMI items used a 5-point scale of 1 = Strongly Disagree to 5 =
Strongly Agree. The items showing the largest increases from pre- to post- were representative
of all four subscales of the ATMI. The following items had the largest increases in mean value:
• Math is one of the most important subjects for people to study. (Value subscale, +0.40)
• Math is important in everyday life. (Value subscale, +0.37)
• I am happier in math class than in any other class. (Enjoyment subscale, +0.35)
• I really like math. (Enjoyment subscale, +0.29)
• I would like to avoid using math in high school. (Reverse-scored, Motivation subscale,
+0.25)
• Math is one of my most dreaded subjects. (Reverse-scored, Self-confidence subscale,
+0.24)
Table 19: ATMI Survey Item Statistics
ATMI Survey Item PRE POST PRE-
POST DIFF. N Mean SD N Mean SD
SELF-CONFIDENCE 9. Math is one of my most dreaded subjects.* 58 3.47 1.26 57 3.70 1.38 0.24 19. I expect to do fairly well in any math class I take. 58 3.81 1.00 57 3.93 0.98 0.12 22. I learn math easily. 54 3.52 1.08 50 3.62 1.12 0.10 14. When I hear the word math, I have a feeling of dislike.* 58 3.76 1.38 57 3.84 1.21 0.08 15. It makes me nervous to even think about doing a math problem.* 58 4.05 1.13 57 4.09 1.01 0.04 16. Math does not scare me at all. 58 3.71 1.20 57 3.70 1.18 -0.01
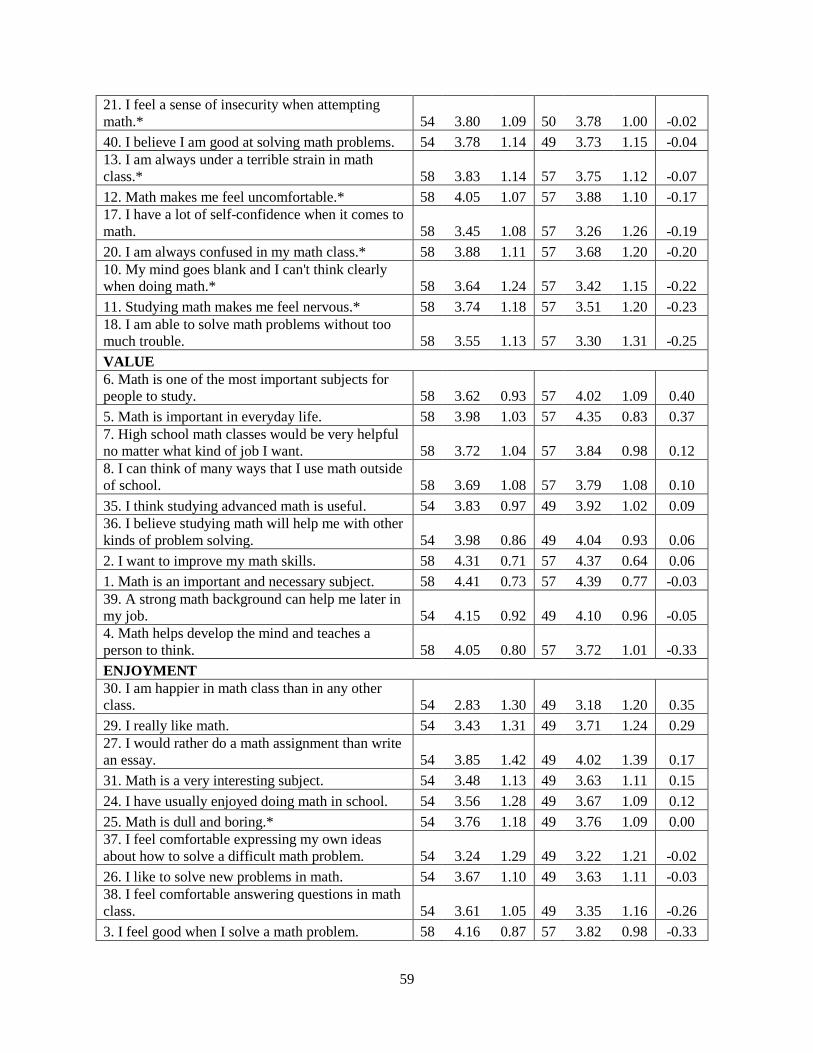
59
21. I feel a sense of insecurity when attempting math.* 54 3.80 1.09 50 3.78 1.00 -0.02 40. I believe I am good at solving math problems. 54 3.78 1.14 49 3.73 1.15 -0.04 13. I am always under a terrible strain in math class.* 58 3.83 1.14 57 3.75 1.12 -0.07 12. Math makes me feel uncomfortable.* 58 4.05 1.07 57 3.88 1.10 -0.17 17. I have a lot of self-confidence when it comes to math. 58 3.45 1.08 57 3.26 1.26 -0.19 20. I am always confused in my math class.* 58 3.88 1.11 57 3.68 1.20 -0.20 10. My mind goes blank and I can't think clearly when doing math.* 58 3.64 1.24 57 3.42 1.15 -0.22 11. Studying math makes me feel nervous.* 58 3.74 1.18 57 3.51 1.20 -0.23 18. I am able to solve math problems without too much trouble. 58 3.55 1.13 57 3.30 1.31 -0.25 VALUE 6. Math is one of the most important subjects for people to study. 58 3.62 0.93 57 4.02 1.09 0.40 5. Math is important in everyday life. 58 3.98 1.03 57 4.35 0.83 0.37 7. High school math classes would be very helpful no matter what kind of job I want. 58 3.72 1.04 57 3.84 0.98 0.12 8. I can think of many ways that I use math outside of school. 58 3.69 1.08 57 3.79 1.08 0.10 35. I think studying advanced math is useful. 54 3.83 0.97 49 3.92 1.02 0.09 36. I believe studying math will help me with other kinds of problem solving. 54 3.98 0.86 49 4.04 0.93 0.06 2. I want to improve my math skills. 58 4.31 0.71 57 4.37 0.64 0.06 1. Math is an important and necessary subject. 58 4.41 0.73 57 4.39 0.77 -0.03 39. A strong math background can help me later in my job. 54 4.15 0.92 49 4.10 0.96 -0.05 4. Math helps develop the mind and teaches a person to think. 58 4.05 0.80 57 3.72 1.01 -0.33 ENJOYMENT 30. I am happier in math class than in any other class. 54 2.83 1.30 49 3.18 1.20 0.35 29. I really like math. 54 3.43 1.31 49 3.71 1.24 0.29 27. I would rather do a math assignment than write an essay. 54 3.85 1.42 49 4.02 1.39 0.17 31. Math is a very interesting subject. 54 3.48 1.13 49 3.63 1.11 0.15 24. I have usually enjoyed doing math in school. 54 3.56 1.28 49 3.67 1.09 0.12 25. Math is dull and boring.* 54 3.76 1.18 49 3.76 1.09 0.00 37. I feel comfortable expressing my own ideas about how to solve a difficult math problem. 54 3.24 1.29 49 3.22 1.21 -0.02 26. I like to solve new problems in math. 54 3.67 1.10 49 3.63 1.11 -0.03 38. I feel comfortable answering questions in math class. 54 3.61 1.05 49 3.35 1.16 -0.26 3. I feel good when I solve a math problem. 58 4.16 0.87 57 3.82 0.98 -0.33

60
MOTIVATION 28. I would like to avoid using math in high school.* 54 3.67 1.29 49 3.92 1.10 0.25 32. I am willing to take more math classes than I have to. 54 3.13 1.23 49 3.24 1.16 0.12 34. I like the challenge of doing math. 54 3.43 1.28 49 3.51 1.19 0.08 33. I want to take as many math classes as I can in school. 54 2.87 1.23 49 2.73 1.20 -0.14 23. I think I could learn advanced math. 54 3.59 1.24 49 3.41 1.26 -0.18 * Items were reverse-scored.
Supplemental Survey Items
The table below presents the pre- and post- N, mean score, standard deviation, and pre-
post difference for each supplemental survey item. This is not a matched sample – all survey
responses are included in this data. All supplemental survey items used a 5-point scale of 1 =
Strongly Disagree to 5 = Strongly Agree. The largest increases were for items related to
practicing things repetitively during math class, needing extra help in math class, and thinking
about different ways to solve math problems.
Table 20: Supplemental Survey Item Statistics
Supplemental Survey Item PRE POST PRE-
POST DIFF. N Mean SD N Mean SD
44. In math class, we practice things over and over until we get them right.* 51 2.25 1.00 48 2.50 1.03 0.25 58. I feel like I need extra help to stay caught up in math class.* 51 3.16 1.38 48 3.40 1.27 0.24 53. My teacher asks us to think about different ways to solve each math problem. 51 3.25 0.91 48 3.46 1.11 0.20 54. I am able to show my teacher how much I know about math. 51 3.61 1.17 48 3.75 1.04 0.14 46. My teacher tries to understand my way of doing math problems. 51 3.14 1.17 48 3.23 1.04 0.09 60. I am able to explain to others how to do math problems. 51 3.37 1.09 48 3.44 1.07 0.06 My teacher asks me to show my work with pictures. 51 2.33 1.13 48 2.38 1.18 0.04 49. In math class, we work on one big math problem for a long time. 51 2.41 0.98 48 2.42 0.94 0.00
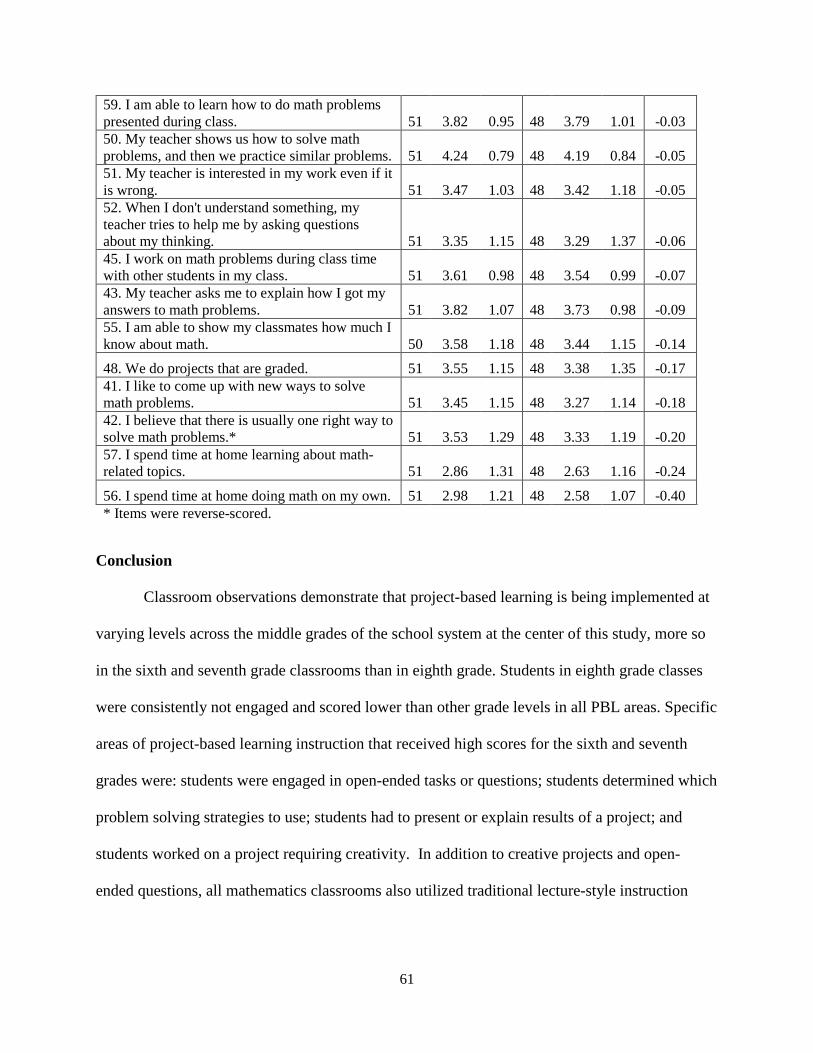
61
59. I am able to learn how to do math problems presented during class. 51 3.82 0.95 48 3.79 1.01 -0.03 50. My teacher shows us how to solve math problems, and then we practice similar problems. 51 4.24 0.79 48 4.19 0.84 -0.05 51. My teacher is interested in my work even if it is wrong. 51 3.47 1.03 48 3.42 1.18 -0.05 52. When I don't understand something, my teacher tries to help me by asking questions about my thinking. 51 3.35 1.15 48 3.29 1.37 -0.06 45. I work on math problems during class time with other students in my class. 51 3.61 0.98 48 3.54 0.99 -0.07 43. My teacher asks me to explain how I got my answers to math problems. 51 3.82 1.07 48 3.73 0.98 -0.09 55. I am able to show my classmates how much I know about math. 50 3.58 1.18 48 3.44 1.15 -0.14 48. We do projects that are graded. 51 3.55 1.15 48 3.38 1.35 -0.17 41. I like to come up with new ways to solve math problems. 51 3.45 1.15 48 3.27 1.14 -0.18 42. I believe that there is usually one right way to solve math problems.* 51 3.53 1.29 48 3.33 1.19 -0.20 57. I spend time at home learning about math-related topics. 51 2.86 1.31 48 2.63 1.16 -0.24
56. I spend time at home doing math on my own. 51 2.98 1.21 48 2.58 1.07 -0.40 * Items were reverse-scored.
Conclusion
Classroom observations demonstrate that project-based learning is being implemented at
varying levels across the middle grades of the school system at the center of this study, more so
in the sixth and seventh grade classrooms than in eighth grade. Students in eighth grade classes
were consistently not engaged and scored lower than other grade levels in all PBL areas. Specific
areas of project-based learning instruction that received high scores for the sixth and seventh
grades were: students were engaged in open-ended tasks or questions; students determined which
problem solving strategies to use; students had to present or explain results of a project; and
students worked on a project requiring creativity. In addition to creative projects and open-
ended questions, all mathematics classrooms also utilized traditional lecture-style instruction

62
approaches. Each teacher provided clear learning goals to students, and there was no evidence of
long-term (lasting all semester or all year) mathematical projects or activities.
Formal assessment measures including Global Scholar standardized test scores and
classroom performance ratings determined by teachers did significantly correlate with each other
for each grading period, but a Kendall’s Coefficient of Concordance W indicated only weak
levels of agreement. Self-confidence was identified as a subscale of the ATMI that significantly
predicted Global Scholar scaled scores.
Statistically significant improvement was not seen over the course of the study in any
subscale of the ATMI or in ATMI total scores, but limitations include a small matched sample
size and the short time frame of the study, covering only one semester. Also, the stability of
motivation scores over the course of the semester can be viewed as a positive result, since
motivation in mathematics is known to typically decrease over time during the middle grades
years (Pajares & Graham, 1999).
63
Chapter V
Discussion
Summary of Findings
Classroom observations demonstrated that project-based learning and assessment looks
different across the middle grade levels of the school system under consideration. Over the
course of one semester, project-based learning scores obtained through classroom observations
did not have noticeable trends in any direction, but rather remained stable throughout the study.
Aspects of PBL that were most evident included students being engaged in open-ended tasks or
questions; students determining which problem-solving strategies to use; students presenting or
explaining results of a project; and students working on a project requiring creativity. In addition
to creative projects and open-ended questions, all mathematics classrooms also applied many
components of traditional instruction. New material was most often introduced to students by
teacher-given lectures and demonstrations. The individual and group assignments were usually
short-term projects that could be completed in either one class period or a few class periods.
Long-term projects spanning the semester or the academic year were not observed.
Formal assessment measures including Global Scholar standardized test scores and
classroom performance ratings determined by teachers were found to have statistically
significant correlations. Calculating a Kendall’s Coefficient of Concordance W indicated only
weak levels of agreement between the various assessment methods employed in the school’s
mathematics classrooms. Self-confidence was identified as a subscale of the ATMI that

64
significantly predicted Global Scholar scaled scores, while no other ATMI subscales
significantly contributed to the regression model. No ATMI subscales correlated significantly
with classroom performance scores. Classroom performance and Global Scholar scores did have
statistically significant correlation.
Discussion
PBL literature provides many standards and goals that school systems should strive for
when implementing and assessing mathematics PBL instruction. This school system is doing
many things in a manner that is consistent with a high level of fidelity of implementation to a
PBL approach. Strengths of the system include providing students with opportunities to verbally
explain or justify their thinking; allowing students to work collaboratively in teams and groups;
and teachers providing accurate and thorough content information to students.
The three mathematics teachers in the three grade levels considered in this study all
approached instruction and assessment with a project-based mindset and orientation. However,
the actual instruction methods used in mathematics classes differed among grade levels, with
more traditional methods being implemented in the older grades. While some of these
differences may be accounted for by the varying difficulty of material (mathematics concepts in
earlier grades lending themselves more easily to project-based learning and assessment),
differences in student behaviors and teachers’ backgrounds and levels of experience may also
affect the extent of PBL instruction and assessment that takes place in mathematics classes.
Important areas where the system fell short in implementing and assessing mathematics
PBL include: making more connections to real-world contexts; discussing key mathematical
concepts in depth; engaging students in the scientific inquiry process; providing opportunities for
65
students to engage in problem solving activities and/or experiments; and utilizing role-based
assessments.
One surprising finding in this study was that no statistically significant improvement was
seen over the course of the study in any subscale of the ATMI or in ATMI total scores. The
subscale areas considered were self-confidence, value, enjoyment, and motivation in
mathematics. Limitations and possible explanations for the lack of improvement in these areas
include a small matched sample size and the short time frame of the study, covering only one
semester.
Suggestions for Future Research
With regard to project-based learning, less research exists on the effectiveness of PBL in
mathematics classes as compared to science classes such as biology and physics. Of particular
interest regarding mathematics project-based learning is how the effectiveness of such
instruction can be accurately measured, benefits of a project-based approach over a traditional
approach, and other classroom factors that affect the impact of mathematics project-based
learning.
This study would have been strengthened a great deal by a larger number of matched
students responding to both the pre- and post-surveys and by examining project-based
mathematics learning implementation and assessment over multiple semesters or multiple
academic years. Future research should address the generalizability of this study’s findings to
other grade levels and other subject areas. Future research should also consider the effect of
demographic factors and other possible confounding variables on project-based learning
outcomes. Demographic information for participants (other than grade level) was not attainable
for this study.
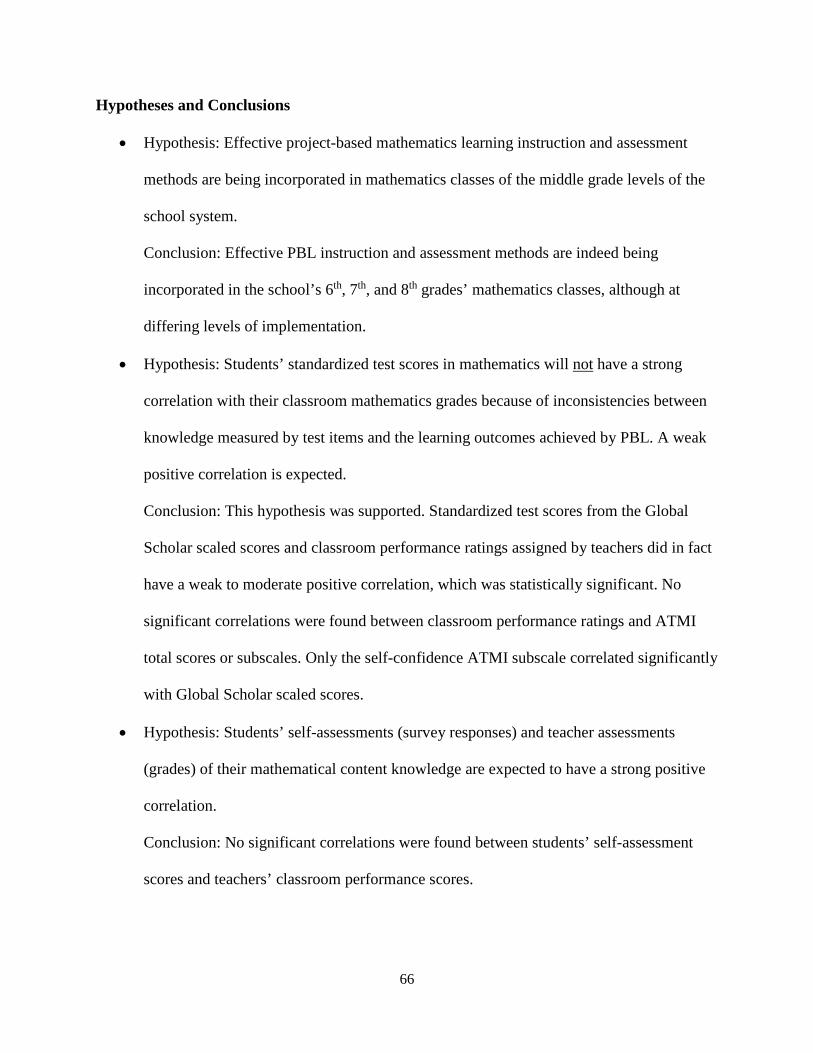
66
Hypotheses and Conclusions
• Hypothesis: Effective project-based mathematics learning instruction and assessment
methods are being incorporated in mathematics classes of the middle grade levels of the
school system.
Conclusion: Effective PBL instruction and assessment methods are indeed being
incorporated in the school’s 6th, 7th, and 8th grades’ mathematics classes, although at
differing levels of implementation.
• Hypothesis: Students’ standardized test scores in mathematics will not have a strong
correlation with their classroom mathematics grades because of inconsistencies between
knowledge measured by test items and the learning outcomes achieved by PBL. A weak
positive correlation is expected.
Conclusion: This hypothesis was supported. Standardized test scores from the Global
Scholar scaled scores and classroom performance ratings assigned by teachers did in fact
have a weak to moderate positive correlation, which was statistically significant. No
significant correlations were found between classroom performance ratings and ATMI
total scores or subscales. Only the self-confidence ATMI subscale correlated significantly
with Global Scholar scaled scores.
• Hypothesis: Students’ self-assessments (survey responses) and teacher assessments
(grades) of their mathematical content knowledge are expected to have a strong positive
correlation.
Conclusion: No significant correlations were found between students’ self-assessment
scores and teachers’ classroom performance scores.

67
• Hypothesis: Students’ levels of self-confidence, value, enjoyment, and motivation in
mathematics will significantly increase after one semester of participation in project-
based learning.
Conclusion: No statistically significant increases were observed in any of the above-
mentioned ATMI subscales, nor in ATMI total scores.
Conclusions and Recommendations
Student engagement emerges as a critical component for successful implementation of
project-based learning in middle grades mathematics classrooms. Engagement levels often drop
off in older grade levels as compared to younger grades – this fact combined with mathematical
concepts becoming progressively difficult and complex can make it difficult for teachers in
higher grade levels to keep students interested in course material as they progress. PBL requires
authentic connections to the real world, and when those connections are forced or artificial,
students are less active in their learning. Students should be engaged in more long-term projects
that arise from their own interests and curiosities.
Recommendations for assessment include the following:
• Incorporating the use of peer assessments to give students a more prominent voice in the
assessment process and to reflect differing roles in group projects.
• Placing more importance on student self-assessment ratings. The statistically significant
correlation between ATMI self-confidence subscores and Global Scholar standardized
test scores demonstrates that students are able to successfully gauge their own levels of
learning in mathematics. Teachers could consider student self-assesments when
determining classroom performance grades, which currently seem to be lacking in
consistency across grade levels.

68
Findings in this study should help the school system involved to identify strengths and
weaknesses of their mathematics PBL middle grades instructions. Discrepancies in levels of
fidelity of implementation across grade levels should lead to more comprehensive teacher
training and professional development to ensure uniformity across grade levels. Classroom
performance ratings could also be more uniform across grade levels. Project-based mathematics
learning is generally alive and well in the school, but technology could be implemented more
frequently and in ways that are more organic to students’ interests and curiosities. This
knowledge should also benefit educators in similar settings, namely mathematics classrooms in
rural public schools looking to implement mathematics PBL instruction and assessment.
69
References
Advance Education, Inc. (2017). Alabama Continuous Improvement Plan. Retrieved from
http://images.pcmac.org/Uploads/PikeRoadSD/PikeRoadSD/SubDepartments/Documents
Categories/Documents/2017-2018_ACIP.pdf
Alabama State Department of Education. (2017). Enrollment by Ethnicity and Gender (School
Level) [Data file]. Retrieved from
http://web.alsde.edu/PublicDataReports/Default.aspx?navtext=Enrollment%20Reports
Alabama State Department of Education. (2018). Scantron Information. Retrieved from
https://www.alsde.edu/sec/sa/Pages/assessmentdetails.aspx?AssessmentName=Scantron
&navtext=Scantron
Arshavsky, N., Edmunds, J., Charles, K., Rice, O. (2012). STEM Classroom Observation
Protocol Training Manual. Greensboro, NC: The SERVE Center, University of North
Carolina at Greensboro. Available at http://www.serve.org/STEM.aspx
Arshavsky, N., Edmunds, J., Charles, K., Rice, O., Argueta, R., Faber, M., Parker, B. (2012).
STEM Classroom Observation Protocol. Greensboro, NC: The SERVE Center,
University of North Carolina at Greensboro. Available at
http://www.serve.org/STEM.aspx
Assessment of Learning. (2016). Retrieved from
http://www.pikeroadschools.org/?DivisionID=20454&DepartmentID=23410.
70
Barron, B. J., Schwartz, D. L., Vye, N. J., Moore, A., Petrosino, A., Zech, L., & Bransford, J. D.
(1998). Doing with understanding: Lessons from research on problem-and project-based
learning. Journal of the Learning Sciences, 7(3-4), 271-311.
Bell, S. (2010). Project-based learning for the 21st century: Skills for the future. The Clearing
House, 83(2), 39-43.
Blumenfeld, P. C., Soloway, E., Marx, R. W., Krajcik, J. S., Guzdial, M., & Palincsar, A. (1991).
Motivating project-based learning: Sustaining the doing, supporting the learning.
Educational Psychologist, 26(3-4), 369-398.
Boaler, J. (1998). Open and closed mathematics: Student experiences and understandings.
Journal for Research in Mathematics Education, 41-62.
Bradley-Levine, J., Berghoff, B., Seybold, J., Sever, R., Blackwell, S., & Smiley, A. (2010,
April). What teachers and administrators “need to know” about project-based learning
implementation. In Annual Meeting of the American Educational Research Association.
Denver, Colorado.
Creswell, J. W., & Clark, V. L. P. (2017). Designing and conducting mixed methods research.
Sage publications.
Dewey, J. (1986, September). Experience and education. In The Educational Forum. 50(3), 241-
252. Taylor & Francis Group.
Doppelt, Y. (2003). Implementation and assessment of project-based learning in a flexible
environment. International Journal of Technology and Design Education, 13(3), 255-272.
Erickson, D. K. (1999). A problem-based approach to mathematics instruction. The Mathematics
Teacher, 92(6), 516.

71
FreshGrade. (n.d.). Meeting the Unique Needs of Every Classroom. Retrieved from
https://www.freshgrade.com/teachers/
Han, S., Capraro, R., & Capraro, M. M. (2015). How science, technology, engineering, and
mathematics (STEM) project-based learning (PBL) affects high, middle, and low
achievers differently: The impact of student factors on achievement. International Journal
of Science and Mathematics Education, 13(5), 1089-1113.
Harada, V.H., Kirio, C.H., & Yamamoto, S.H. (2008). Collaborating for Project-based learning
in grades 9-12. Columbus, OH: Linworth Publishing, Inc.
Hmelo-Silver, C. E. (2004). Problem-based learning: What and how do students learn?.
Educational Psychology Review, 16(3), 235-266.
Hopkins, M. H. (1999). Practicing what we preach: Authentic assessment in mathematics.
Assessment for Effective Intervention, 25(1), 15-30.
Kendall, M. G., & Smith, B. B. (1939). The problem of m rankings. The annals of mathematical
statistics, 10(3), 275-287.
Krajcik, J. S., & Blumenfeld, P. C. (2006). Project-based Learning (pp. 317-34). na.
Krajcik, J. S., Blumenfeld, P. C., Marx, R. W., & Soloway, E. (1994). A collaborative model for
helping middle grade science teachers learn project-based instruction. The Elementary
School Journal, 483-497.
Krauss, J., & Boss, S. (2013). Thinking through project-based learning: Guiding deeper inquiry.
Thousand Oaks, CA: Corwin.
Lipka, J., Hogan, M. P., Webster, J. P., Yanez, E., Adams, B., Clark, S., & Lacy, D. (2005).
Math in a cultural context: Two case studies of a successful culturally based math project.
Anthropology & Education Quarterly, 36(4), 367-385.
72
Majeed, A. A., Darmawan, I. G. N., & Lynch, P. (2013). A confirmatory factor analysis of
Attitudes Toward Mathematics Inventory (ATMI). The Mathematics Educator, 15(1),
121-135.
Marzano, R. J. (2003). What works in schools: Translating research into action. ASCD.
Meyer, D. K., Turner, J. C., & Spencer, C. A. (1997). Challenge in a mathematics classroom:
students' motivation and strategies in project-based learning. The Elementary School
Journal, 501-521.
Mission, Beliefs, and Vision. (2016). Retrieved from
http://www.pikeroadschools.org/?DivisionID=20464&DepartmentID=23450
Pajares, F., & Graham, L. (1999). Self-efficacy, motivation constructs, and mathematics
performance of entering middle school students. Contemporary educational psychology,
24(2), 124-139.
Piaget, J. (1977). The development of thought: equilibration of cognitive structures. (Trans A.
Rosin). Viking.
Piper, K. (2012). Practical PBL: The ongoing challenges of assessment. Edutopia: What Works
in Education. Retrieved from http://www.edutopia.org/blog/practical-pbl-challenges-of-
assessment-katherine-piper
Railsback, J. (2002). Project-based instruction: Creating excitement for learning. By Request
Series.
Roh, K. H. (2003). Problem-based learning in mathematics. ERIC Clearinghouse for Science
Mathematics and Environmental Education, 2004-3.
Savery, J. R. (2006). Overview of problem-based learning: Definitions and distinctions.
Interdisciplinary Journal of Problem-Based Learning, 1(1).

73
Savery, J. R., & Duffy, T. M. (1995). Problem based learning: An instructional model and its
constructivist framework. Educational Technology, 35(5), 31-38.
Scantron. (2017). Performance Series Scores Quick Reference Guide. Retrieved from
https://www.scantron.com/wp-content/uploads/2018/08/PS-Scores-Quick-Reference.pdf
Schneider, R. M., Krajcik, J., Marx, R. W., & Soloway, E. (2002). Performance of students in
project‐based science classrooms on a national measure of science achievement. Journal
of Research in Science Teaching, 39(5), 410-422.
Solomon, G. (2003). Project-based learning: A primer. Technology and Learning - Dayton,
23(6), 20-20.
Stepien, W., & Gallagher, S. (1993). Problem-based learning: As authentic as it gets. Educational
Leadership, 50, 25-25.
Stiggins, R., Arter, J., Chappuis, J., & Chappuis, S. (2007). Classroom assessment for student
learning: Doing it right – using it well. Pearson Education, Inc.
Tapia, M., & Marsh, G. E. (2004). An instrument to measure mathematics attitudes. Academic
Exchange Quarterly, 8(2), 16-22.
Thomas, J. W. (2000). A review of research on project-based learning.
Ulmer, M. B. (2000). Self-Grading: A Simple Strategy for Formative Assessment in Activity-
Based Instruction.
Voth, M. (2014, July 28). Considering Vygotsky's ZPD in PBL. Retrieved from
http://www.slideshare.net/mnvoth/considering-vygotskys-zpd-in-pbl
Vygotsky, L. S. (1987). Thinking and speech (N. Minick, Trans.). In R. W. Rieber & A. S.
Carton (Eds.), The collected works of L. S. Vygotsky: Vol. 1. Problems of general
psychology (pp. 39-285). New York: Plenum Press. (Original work published 1934)

74
Zafirov, C. (2013). New challenges for the project based learning in the digital age. Trakia
Journal of Sciences, 3, 298-302.
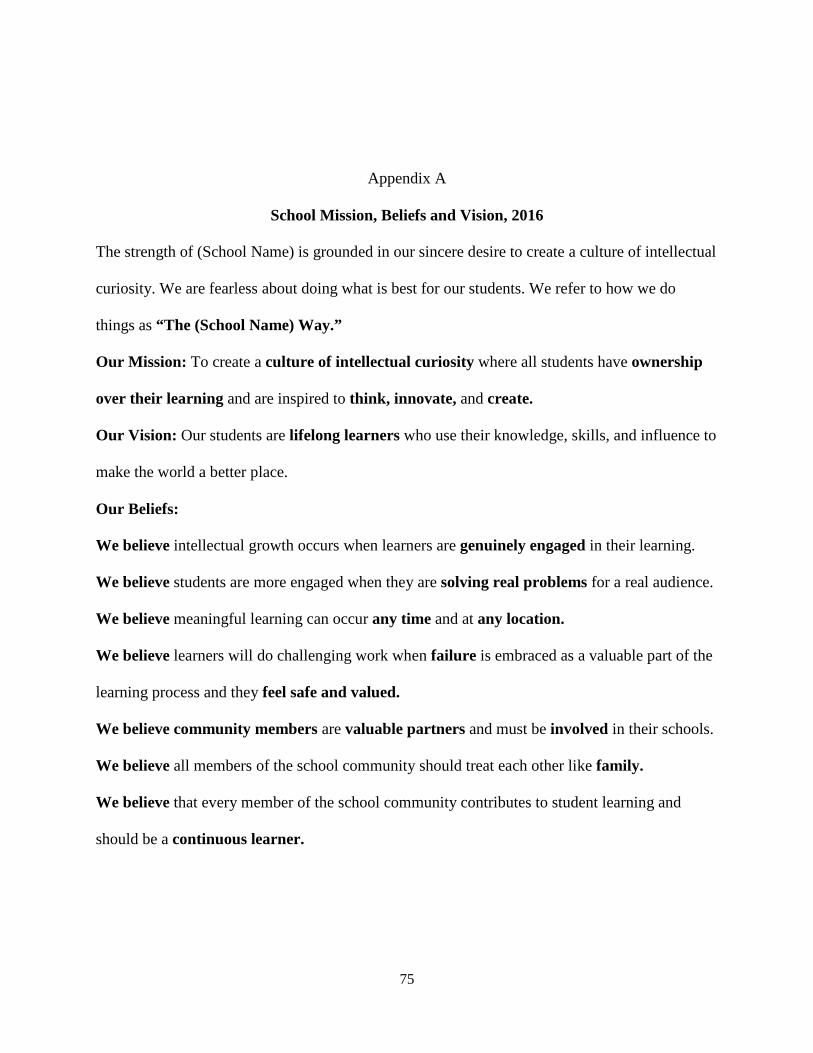
75
Appendix A
School Mission, Beliefs and Vision, 2016
The strength of (School Name) is grounded in our sincere desire to create a culture of intellectual
curiosity. We are fearless about doing what is best for our students. We refer to how we do
things as “The (School Name) Way.”
Our Mission: To create a culture of intellectual curiosity where all students have ownership
over their learning and are inspired to think, innovate, and create.
Our Vision: Our students are lifelong learners who use their knowledge, skills, and influence to
make the world a better place.
Our Beliefs:
We believe intellectual growth occurs when learners are genuinely engaged in their learning.
We believe students are more engaged when they are solving real problems for a real audience.
We believe meaningful learning can occur any time and at any location.
We believe learners will do challenging work when failure is embraced as a valuable part of the
learning process and they feel safe and valued.
We believe community members are valuable partners and must be involved in their schools.
We believe all members of the school community should treat each other like family.
We believe that every member of the school community contributes to student learning and
should be a continuous learner.

76
We believe teachers are designers, facilitators, navigators, mentors, encouragers, and leaders
who continuously work on improving the learning experiences designed for students and are
highly respected experts who have a global impact on teaching and learning.
We believe parents are valuable partners and members of the school community.
We believe the superintendent and principals are lead learners and are highly respected experts
who have a global impact on teaching and learning.
We believe the superintendent and school board function as a team, advocate for students, create
capacity and build community.
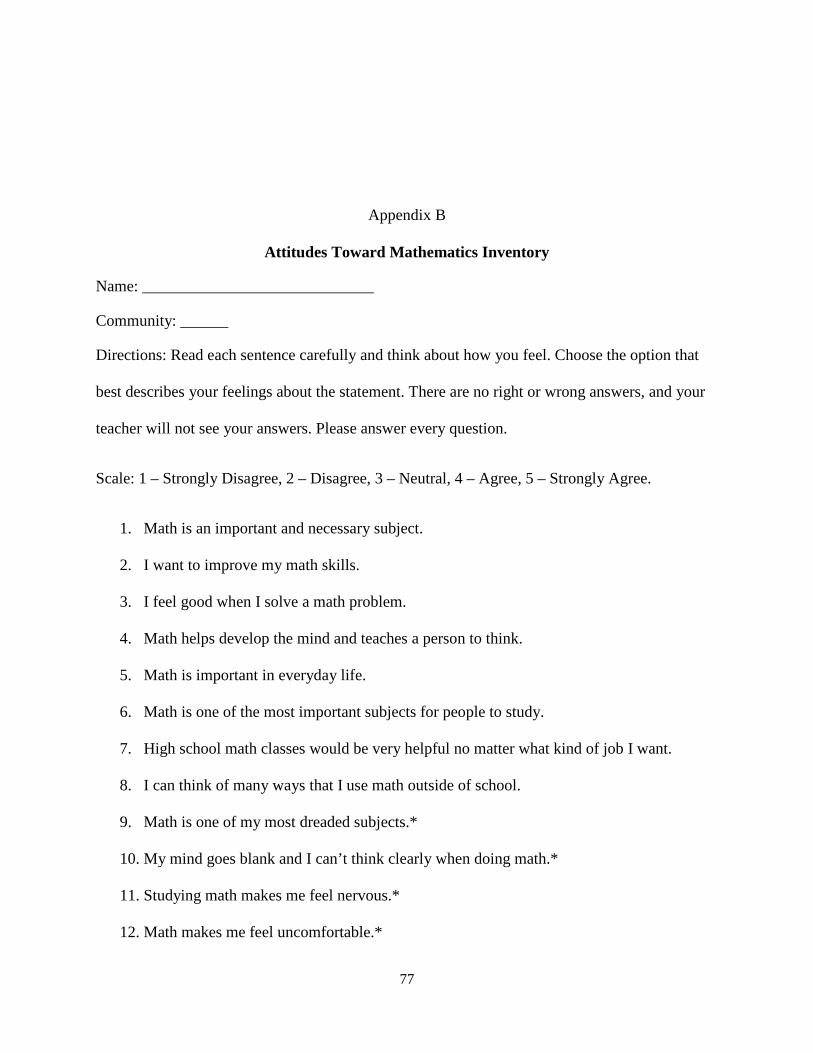
77
Appendix B
Attitudes Toward Mathematics Inventory
Name: _____________________________
Community: ______
Directions: Read each sentence carefully and think about how you feel. Choose the option that
best describes your feelings about the statement. There are no right or wrong answers, and your
teacher will not see your answers. Please answer every question.
Scale: 1 – Strongly Disagree, 2 – Disagree, 3 – Neutral, 4 – Agree, 5 – Strongly Agree.
1. Math is an important and necessary subject.
2. I want to improve my math skills.
3. I feel good when I solve a math problem.
4. Math helps develop the mind and teaches a person to think.
5. Math is important in everyday life.
6. Math is one of the most important subjects for people to study.
7. High school math classes would be very helpful no matter what kind of job I want.
8. I can think of many ways that I use math outside of school.
9. Math is one of my most dreaded subjects.*
10. My mind goes blank and I can’t think clearly when doing math.*
11. Studying math makes me feel nervous.*
12. Math makes me feel uncomfortable.*
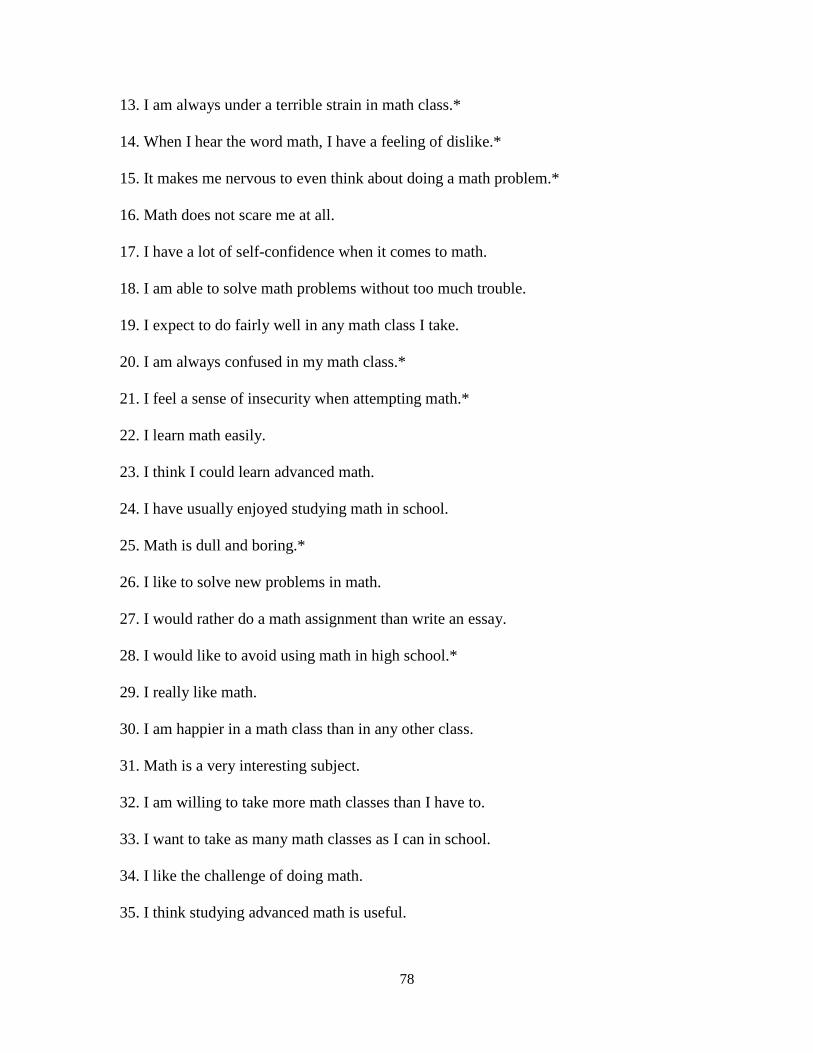
78
13. I am always under a terrible strain in math class.*
14. When I hear the word math, I have a feeling of dislike.*
15. It makes me nervous to even think about doing a math problem.*
16. Math does not scare me at all.
17. I have a lot of self-confidence when it comes to math.
18. I am able to solve math problems without too much trouble.
19. I expect to do fairly well in any math class I take.
20. I am always confused in my math class.*
21. I feel a sense of insecurity when attempting math.*
22. I learn math easily.
23. I think I could learn advanced math.
24. I have usually enjoyed studying math in school.
25. Math is dull and boring.*
26. I like to solve new problems in math.
27. I would rather do a math assignment than write an essay.
28. I would like to avoid using math in high school.*
29. I really like math.
30. I am happier in a math class than in any other class.
31. Math is a very interesting subject.
32. I am willing to take more math classes than I have to.
33. I want to take as many math classes as I can in school.
34. I like the challenge of doing math.
35. I think studying advanced math is useful.

79
36. I believe studying math will help me with other kinds of problem solving.
37. I feel comfortable expressing my own ideas about how to solve a difficult math problem.
38. I feel comfortable answering questions in math class.
39. A strong math background can help me later in my job.
40. I believe I am good at solving math problems.
* Items reverse-scored.
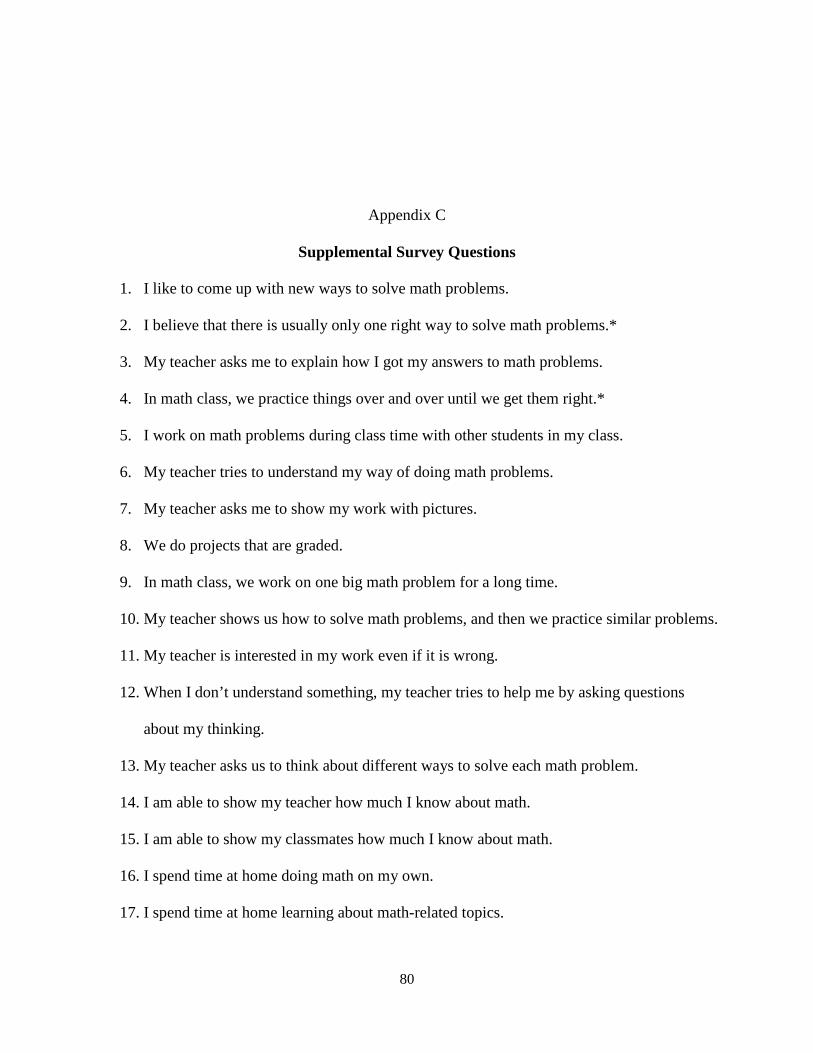
80
Appendix C
Supplemental Survey Questions
1. I like to come up with new ways to solve math problems.
2. I believe that there is usually only one right way to solve math problems.*
3. My teacher asks me to explain how I got my answers to math problems.
4. In math class, we practice things over and over until we get them right.*
5. I work on math problems during class time with other students in my class.
6. My teacher tries to understand my way of doing math problems.
7. My teacher asks me to show my work with pictures.
8. We do projects that are graded.
9. In math class, we work on one big math problem for a long time.
10. My teacher shows us how to solve math problems, and then we practice similar problems.
11. My teacher is interested in my work even if it is wrong.
12. When I don’t understand something, my teacher tries to help me by asking questions
about my thinking.
13. My teacher asks us to think about different ways to solve each math problem.
14. I am able to show my teacher how much I know about math.
15. I am able to show my classmates how much I know about math.
16. I spend time at home doing math on my own.
17. I spend time at home learning about math-related topics.

81
18. I feel like I need extra help to stay caught up in math class.*
19. I am able to learn how to do math problems presented during class.
20. I am able to explain to others how to do math problems.
* Items reverse-scored.

82
Appendix D
Teacher Post-Semester Survey
Directions: Please indicate the extent to which you agree or disagree with the
following statements, and provide any other relevant comments that you wish to
share.
Scale: 1 – Strongly Disagree, 2 – Disagree, 3 – Neutral, 4 – Agree, 5 – Strongly Agree.
1. I am able to determine my students’ mathematical abilities based on their contributions
to class-wide projects.
Comments:
2. I am able to determine my students’ mathematical abilities based on their contributions
to small group projects.
Comments:
3. I am able to determine my students’ mathematical abilities based on individual
projects or assignments.
Comments:
4. It is important to teach students how to solve math problems through practical, real
world applications.
Comments:
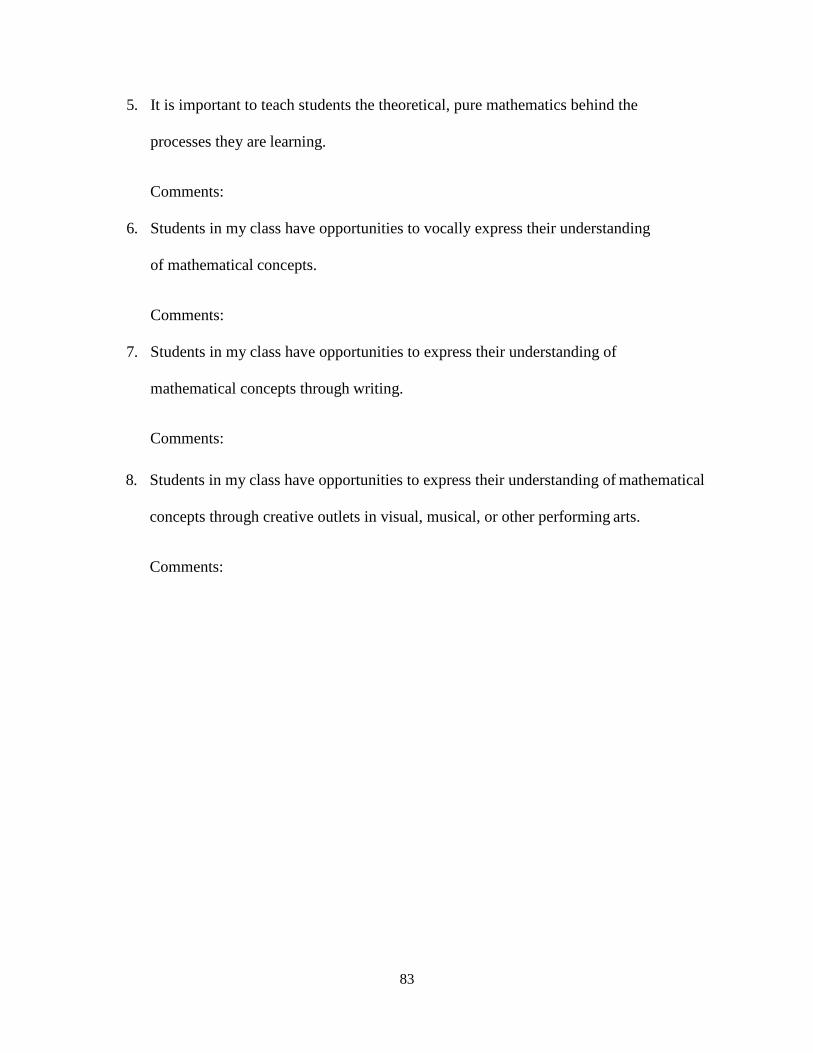
83
5. It is important to teach students the theoretical, pure mathematics behind the
processes they are learning.
Comments:
6. Students in my class have opportunities to vocally express their understanding
of mathematical concepts.
Comments:
7. Students in my class have opportunities to express their understanding of
mathematical concepts through writing.
Comments:
8. Students in my class have opportunities to express their understanding of mathematical
concepts through creative outlets in visual, musical, or other performing arts.
Comments:

84
Appendix E
Classroom Observation Protocol: Study of STEM Learning
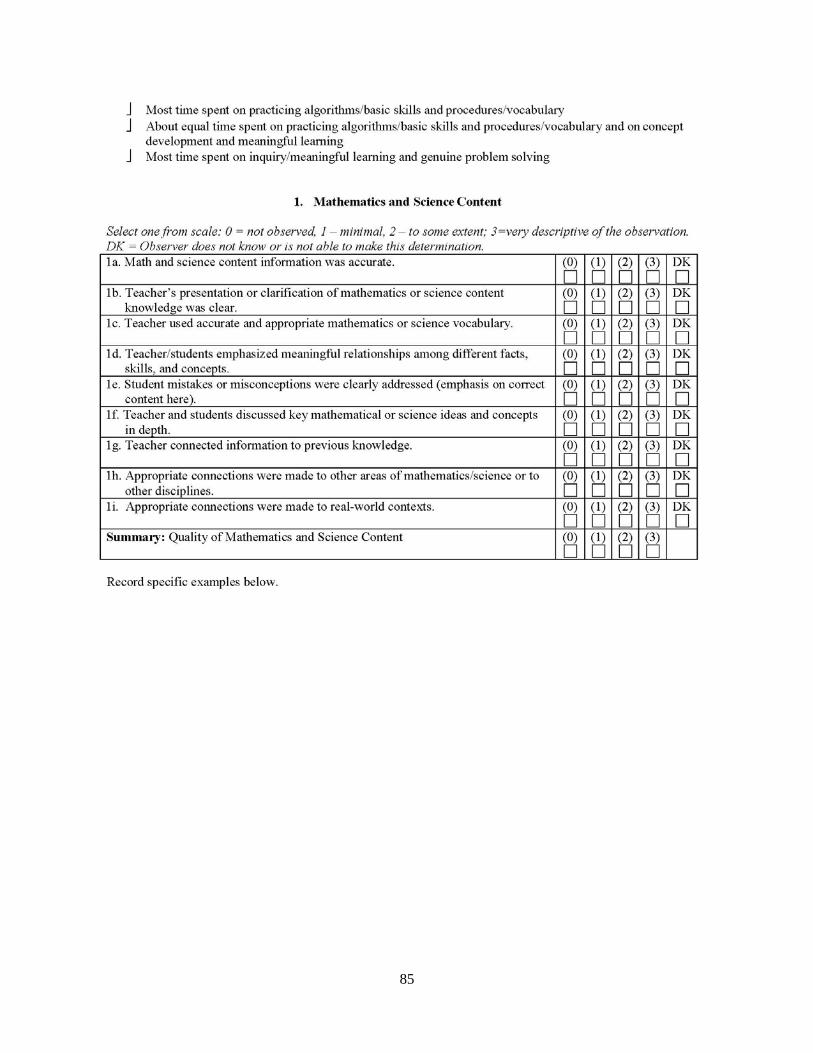
85
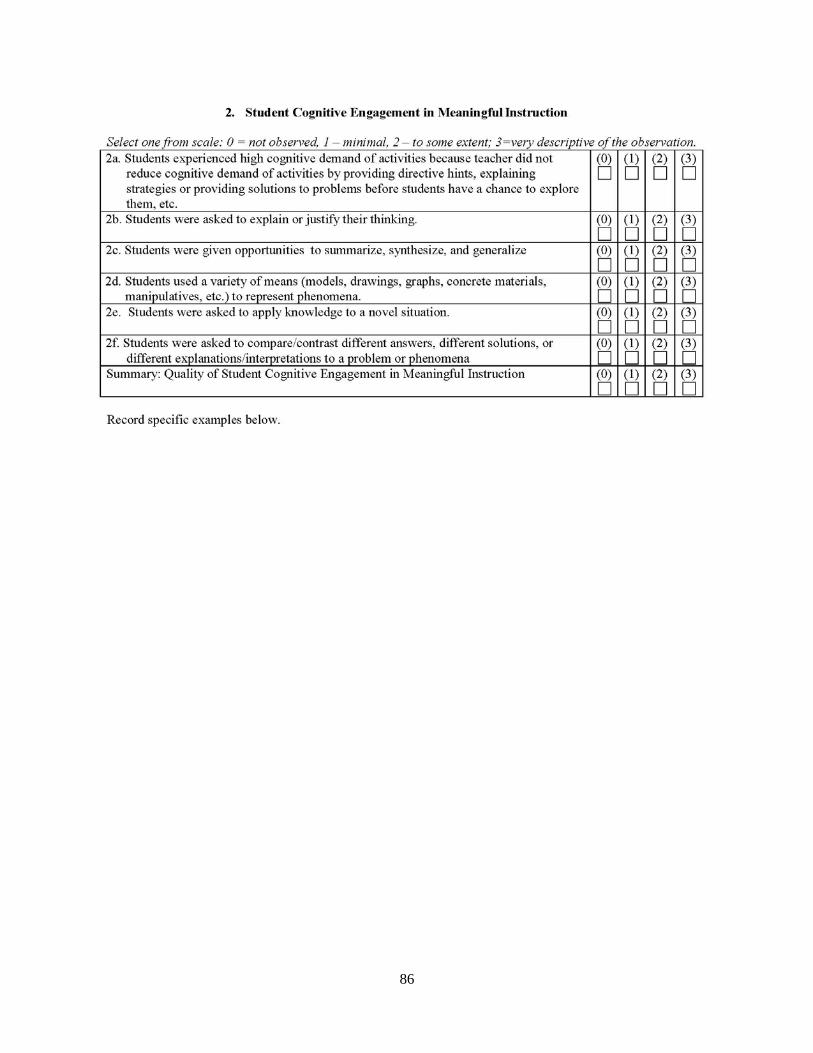
86

87
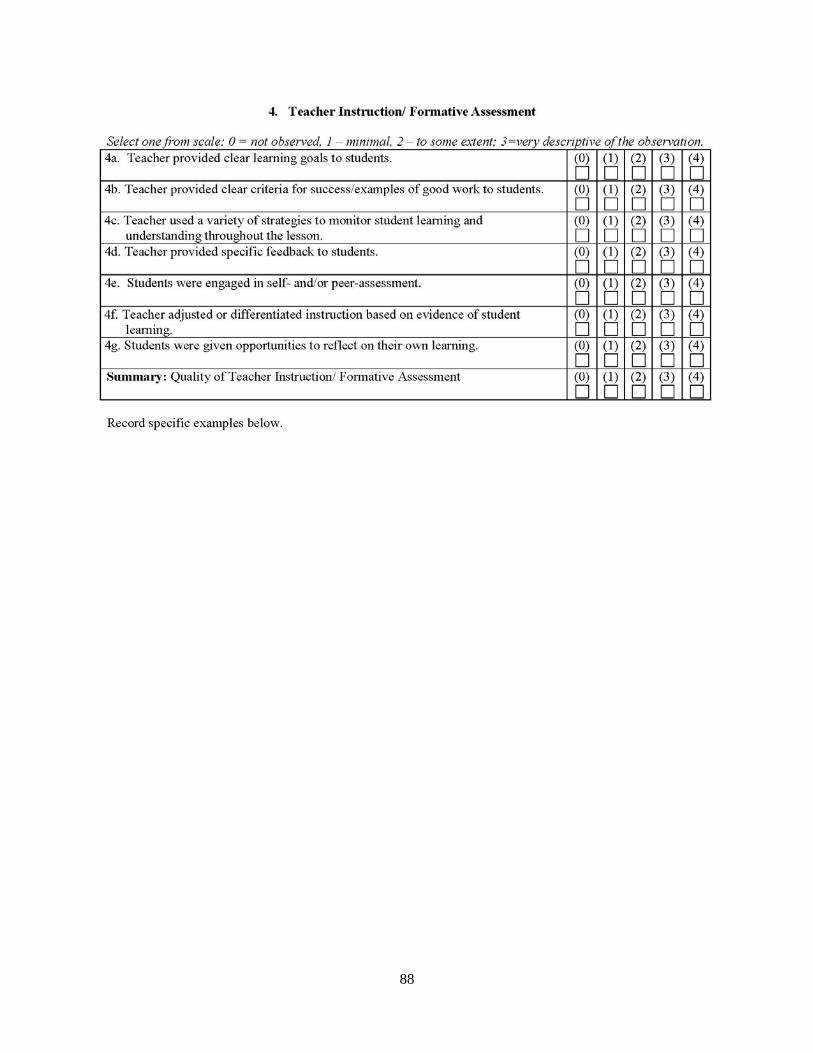
88

89

90
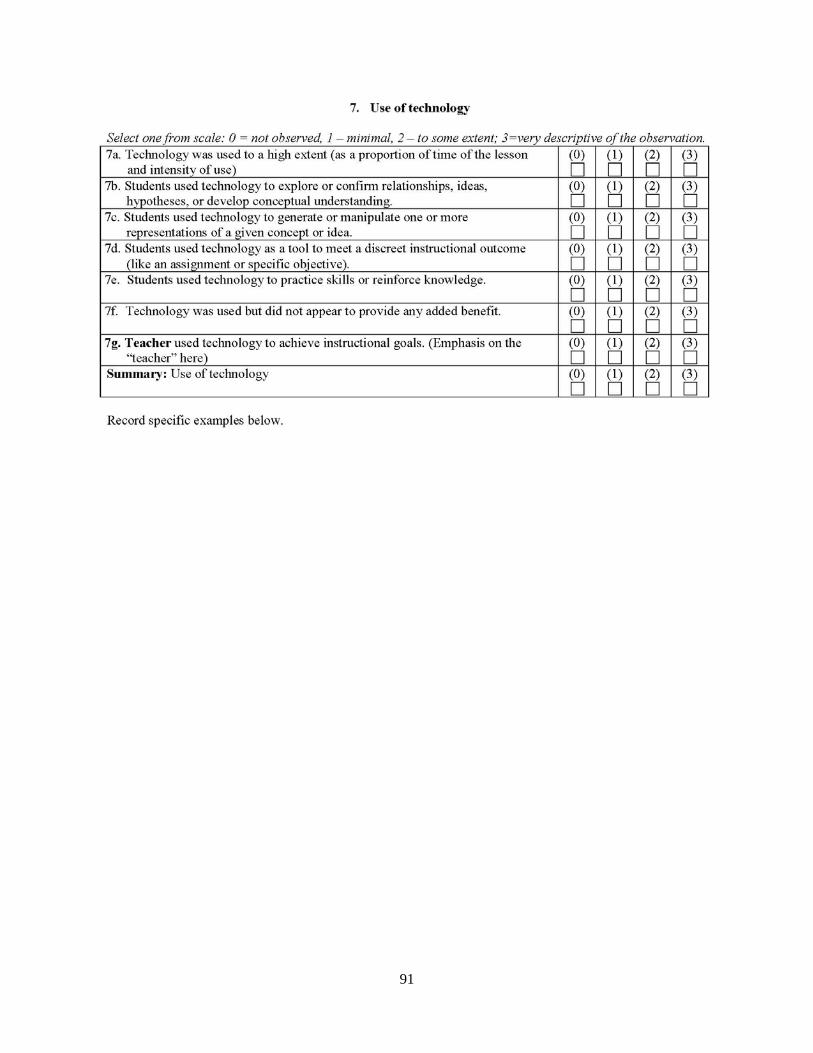
91

92
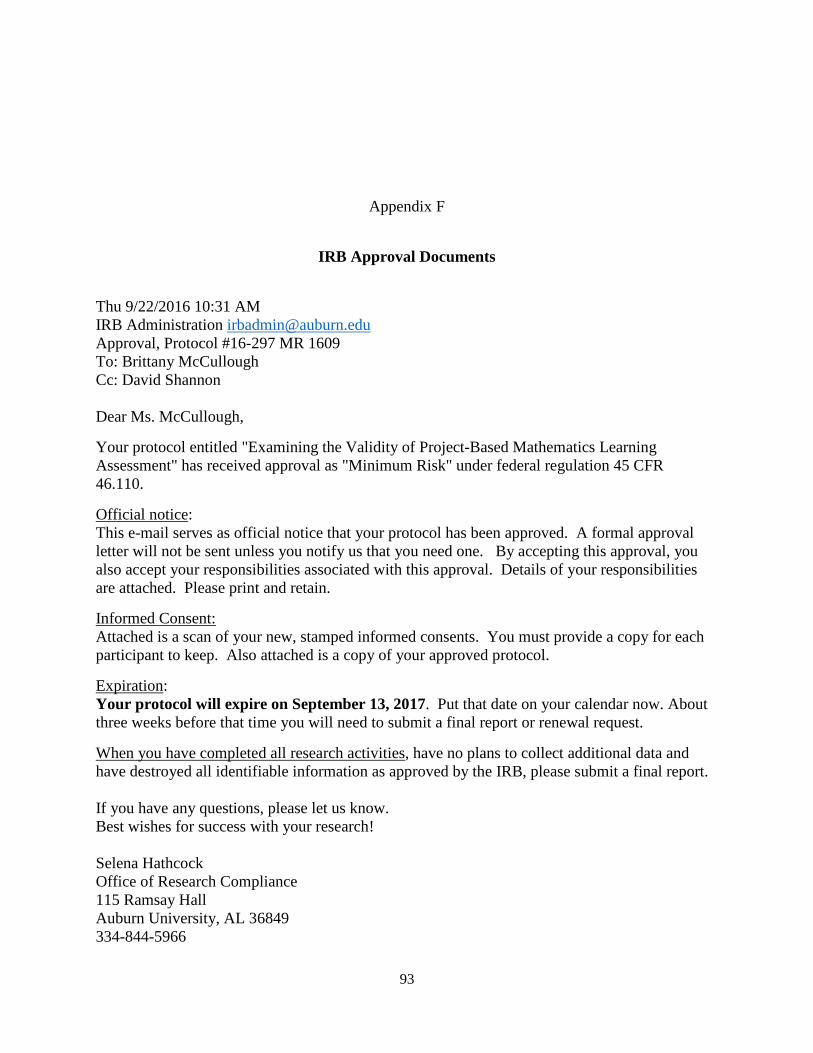
93
Appendix F
IRB Approval Documents
Thu 9/22/2016 10:31 AM IRB Administration [email protected] Approval, Protocol #16-297 MR 1609 To: Brittany McCullough Cc: David Shannon Dear Ms. McCullough, Your protocol entitled "Examining the Validity of Project-Based Mathematics Learning Assessment" has received approval as "Minimum Risk" under federal regulation 45 CFR 46.110. Official notice: This e-mail serves as official notice that your protocol has been approved. A formal approval letter will not be sent unless you notify us that you need one. By accepting this approval, you also accept your responsibilities associated with this approval. Details of your responsibilities are attached. Please print and retain. Informed Consent: Attached is a scan of your new, stamped informed consents. You must provide a copy for each participant to keep. Also attached is a copy of your approved protocol. Expiration: Your protocol will expire on September 13, 2017. Put that date on your calendar now. About three weeks before that time you will need to submit a final report or renewal request. When you have completed all research activities, have no plans to collect additional data and have destroyed all identifiable information as approved by the IRB, please submit a final report. If you have any questions, please let us know. Best wishes for success with your research! Selena Hathcock Office of Research Compliance 115 Ramsay Hall Auburn University, AL 36849 334-844-5966
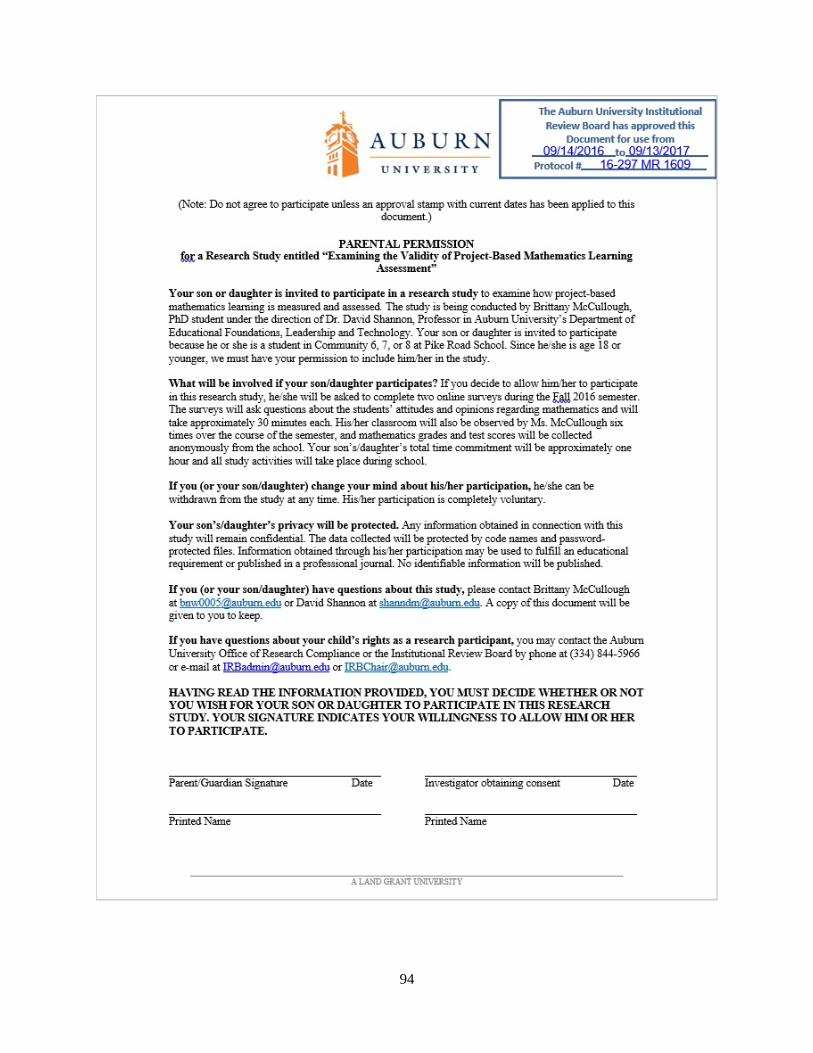
94

95

96


