BOFIT Discussion Papers 19 • 2006
Jiao Wang and Andy G. Ji
Exchange rate sensitivity of China’s bilateral trade flows
Bank of Finland, BOFIT Institute for Economies in Transition

BOFIT Personnel 2006 Economists Mr Pekka Sutela, head Russian economy and economic policy Russia’s international economic relations China in the world economy [email protected]
Ms Tuuli Juurikkala, economist Russian economy and economic policy Private sector development [email protected]
Mr Juuso Kaaresvirta, economist Chinese economy and economic policy [email protected]
Ms Tuuli Koivu, economist Chinese economy and economic policy Editor-in-Chief of BOFIT China Review [email protected]
Mr Iikka Korhonen, research supervisor Exchange rate policies in transition economies Monetary policy in transition economies Editor-in-Chief of BOFIT Discussion Papers [email protected]
Mr Aaron Mehrotra, economist Chinese economy and economic policy Monetary policy in transition economies [email protected]
Mr Simon Ollus, economist Russian economy and economic policy Russian industrial policy [email protected]
Mr Jouko Rautava, economist Russian and Chinese economies and economic policies Editor-in-Chief of BOFIT Russia Review and BOFIT Online [email protected] Ms Heli Simola, economist Economic relations between Russia and Finland Russia's impact on the Finnish economy [email protected] Ms Laura Solanko, economist Russian regional issues Public economics [email protected]
Ms Merja Tekoniemi, economist Russian regional issues [email protected]
On leave of absence
Mr Vesa Korhonen, email: [email protected] Ms Seija Lainela, email: [email protected] Mr Jian-Guang Shen, email: [email protected] Information Services
Mr Timo Harell, editor Press monitoring Editor-in-Chief of BOFIT Weekly [email protected] Ms Liisa Mannila, department secretary Department coordinator Publications traffic [email protected]
Ms Päivi Määttä, information specialist Information services [email protected] Ms Tiina Saajasto, information specialist Information services [email protected]
Contact us
Bank of Finland BOFIT – Institute for Economies in Transition PO Box 160
Phone: +358 10 831 2268 Fax: +358 10 831 2294 E-mail: [email protected]

BOFIT Discussion Papers 19 • 2006
Jiao Wang and Andy G. Ji
Exchange rate sensitivity of China’s bilateral trade flows
Bank of Finland, BOFIT Institute for Economies in Transition

BOFIT Discussion Papers
Editor-in-Chief Iikka Korhonen
BOFIT Discussion Papers 19/2006 22.12.2006
Jiao Wang and Andy G. Ji: Exchange rate sensitivity of China’s
bilateral trade flows
ISBN 952-462-846-5 ISSN 1456-4564 (print) ISBN 952-462-847-3 ISSN 1456-5889 (online)
Multiprint Oy Helsinki 2006

BOFIT- Institute for Economies in Transition Bank of Finland
BOFIT Discussion Papers 19/ 2006
3
Contents Abstract ...............................................................................................................................5 Tiivistelmä...........................................................................................................................6 1 Introduction ................................................................................................................7 2 Literature ....................................................................................................................8 3 Methodology...............................................................................................................9 4 Bilateral gravity model..............................................................................................10 5 Data description ........................................................................................................11
5.1 Sources.............................................................................................................11 5.2 Exchange rate...................................................................................................12 5.3 Trade flows ......................................................................................................13
6 Bilateral gravity model with time-series data............................................................13
6.1 Estimation procedure and empirical results......................................................13 7 Bilateral gravity model with panel data.....................................................................17 8 Conclusions and further research suggestions...........................................................20 References .........................................................................................................................22 Appendix ...........................................................................................................................24 Tables

Jiao Wang and Andy G. Ji Exchange rate sensitivity of China’s bilateral trade flows
4
All opinions expressed are those of the authors and do not necessarily reflect the views of the Bank of Finland.

BOFIT- Institute for Economies in Transition Bank of Finland
BOFIT Discussion Papers 19/ 2006
5
Jiao Wang a and Andy G. Ji b
Exchange rate sensitivity of China’s bilateral trade flows
Abstract Traditional assessments of the impact of exchange rate depreciation or appreciation on
trade have involved estimating the elasticity of trade volume to relative prices. Such stud-
ies relied heavily on aggregated trade data. More recent studies employ bilateral trade data
and methodologies such as ECM and gravity models. This study uses a generalized gravity
model with data panel analysis in assessing the impact of currency depreciation or appre-
ciation on bilateral trade flows between China and its top trading partners. The empirical
evidence suggests exchange rates (both real and nominal) do not exert a significant influ-
ence on the overall exports from China. Thus, a devaluation or revaluation of the yuan
should be expected to have only limited impact on China’s trade balance. Moreover, previ-
ous studies provide limited evidence of a negative relation between exchange rate volatility
and trade flows. Given the current revaluation expectations, we find China’s anticipated
shift toward a more flexible exchange rate regime fails to address China’s trade surplus
issues, and thus will merely lead to a revaluation of the nominal exchange rate and in-
creased exchange rate volatility. It appears a major overhaul of the country’s heavily sub-
sidized export regime must first occur for the exchange rate to assume a larger role in
China’s international trade.
Keywords: Exchange Rate, Trade, China, Competition, Gravity Model, Panel
JEL Classification: C22, C23, F14, F31
We thank David Mayes for his helpful comments and support. a London South Bank University, London, SE1 0AA, UK: [email protected]. b The paper was written while Andy G. Ji was an economist at the Bank of Finland. He is currently employed by the Singapore Monetary Authority.

Jiao Wang and Andy G. Ji Exchange rate sensitivity of China’s bilateral trade flows
6
Jiao Wang and Andy G. Ji
Exchange rate sensitivity of China’s bilateral trade flows
Tiivistelmä
Valuuttakurssin vaikutusta ulkomaankauppaan on tavallisesti tutkittu estimoimalla kaupan
volyymin joustoja suhteellisten hintojen muutoksiin nähden. Näissä tutkimuksissa on
yleensä käytetty aggregaattitilastoja. Uudemmissa tutkimuksissa on käytetty myös kahden-
välistä kauppaa koskevaa dataa ja virheenkorjaus- ja gravitaatiomallien tyyppisiä mene-
telmiä. Tässä tutkimuksessa arvioidaan valuuttakurssin vaikutusta Kiinan ja sen tärkeimpi-
en kauppakumppanien väliseen kauppaan gravitaatiomallin avulla. Tilastoaineisto on pa-
neelimuodossa. Tulosten mukaan valuuttakurssin muutokset (reaaliset tai nimelliset) eivät
juuri vaikuta Kiinan vientiin. Valuutan ulkoisen arvon muutokset eivät siten juuri vaikut-
taisi Kiinan kauppataseen ylijäämään. Aiempien tutkimusten mukaan myöskään valuutta-
kurssin volatiilius ei paljon vaikuta kauppavirtoihin. Vaikka Kiinan tällä hetkellä odotetaan
jatkavan valuuttansa ulkoisen arvon vahvistamista, tämän vahvistumisen vaikutukset
kauppataseeseen ovat pieniä. Jotta valuuttakurssilla olisi suurempi vaikutus kauppavirtoi-
hin, esimerkiksi Kiinan vientituet olisi lopetettava.
Asiasanat: valuuttakurssi, ulkomaankauppa, Kiina, kilpailu, gravitaatiomalli,
paneelimenetelmät

BOFIT- Institute for Economies in Transition Bank of Finland
BOFIT Discussion Papers 19/ 2006
7
1 Introduction International trade has become a salient feature of Chinese economic growth.1 Statistics
show net exports contributed 10.4 % of GDP growth in 1993-2003, up from -1.1 % in
1983-1993 and -1.4 % in 1973-1983 (Felipe and Lim, 2005). China’s current account,
which has been in surplus since the early 1990s, saw a sharp rise in 2004 and 2005 due to
China’s consistently strong export performance. In coming years, China’s external balance
is expected to increase further, riding on the back of strong export receipts, foreign direct
investment, and large capital inflows.
Despite this dynamic shift in trade and a range of studies analyzing underlying bal-
ance suggesting that China’s exchange rate has departed substantially from its equilibrium
value, the yuan’s exchange rate has slavishly tracked the US dollar for well over a decade.
It was pegged at a rate of 8.28 yuan with the 1994 unification of dual exchange rate sys-
tems, and has appreciated only slightly since the abandonment of the dollar peg in July
2005.2
In the following discussion, we examine the effects of exchange rate movements on
China’s external trade in terms of China’s bilateral trade flows with its major trading part-
ners. We investigate the impact of both real and nominal effective exchange rate on the
China’s exports (imports) to (from) top trading partners in 1986-2003 using a generalized
gravity model. This paper contributes in a number of ways to research on the relationship
between exchange rate and trade flows. First, the data analyzed here make it possible to
examine the long-run impact of exchange rate on bilateral trade flows. Second, to our
knowledge, this study is the first to employ a generalized gravity model to China’s bilateral
trade flows within a panel data methodology. Gravity models have a remarkably consistent
history of success in explaining bilateral trade flows. The panel data methodology3 has a
number of advantages (such as more accurate inference of model parameters4, greater ca-
pacity of capturing more complicated behavioural hypotheses, controlling the impact of
1 China became the world’s third largest exporter in 2004. 2 On July 21, 2005, Chinese authorities abandoned the yuan’s dollar peg for a currency basket with a fluctua-tion band of ±0.3%. 3 Panel data analysis typically refers to the data containing time series observations of a number of individu-als. Hence, observations in panel data analysis involve at least two dimensions: a cross-sectional dimension and a time series dimension.

Jiao Wang and Andy G. Ji Exchange rate sensitivity of China’s bilateral trade flows
8
omitted variables, uncovering dynamic relationships and simplifying computation and sta-
tistical inference than a single time series or cross-section data5) over the standard time-
series and cross-section methodologies. Third, we include both nominal and real effective
exchange rates as determinants of trade flows. The bilateral real effective exchange rate
captures the relative competitiveness of the trading partners: large nominal exchange rate
changes affect the behavior of trade flows usually through a real depreciation/appreciation
in the exchange rate when the relative level of inflation does not adjust to a similar extent.
The nominal exchange rate reveals impacts of revaluation/devaluation. Currently popular
discussion focuses heavily, if not exclusively, on the nominal exchange rate as the key to
dealing with China’s external imbalance problem.
Perhaps the most significant finding in this study is that the exchange rate, real or
nominal, apparently has little impact on overall exports from China. We suggest this de-
coupling of China’s exports to exchange rate movements reflects various export-oriented
schemes currently in place. For example, the export tax refund has long been credited with
jump-starting and promoting China’s extraordinary export performance. Moreover, the
empirical evidence suggests that a substantial revaluation/devaluation would have only
muted success in bringing down China’s large trade surplus.
The rest of the paper is organized as follows. Previous literature is surveyed briefly
in the next section. We then present the relevant methodologies, the data, and the empirical
results. We conclude with suggestions for further research in this area.
2 Literature
Despite decades of studies on the exchange rate’s impact on trade flows, the recent large
survey of McKenzie (1999) suggests that results have been inconclusive. Economic theo-
ries and empirical evidence are ambiguous as to the effect of the exchange rate on exports
and export revenue. Junz and Rhomberg (1973) as well as Wilson and Takacs (1979) find
that devaluation increases exports for developed countries with fixed exchange rates. Bah-
mani-Oskooee and Kara (2003) find similar results with flexible rates. In contrast, Athu-
korala (1991), Athukorala and Menon (1994), Abeysinghe and Yeok (1998), and Wilson
4 Panel data usually contain more degrees of freedom and more sample variability than corss-sectional data, improving the efficiency of econometric estimates (Hsiao et al., 1995). 5 Please refer to Nerlove (2002) and Hsiao et al., (2005) for further details.

BOFIT- Institute for Economies in Transition Bank of Finland
BOFIT Discussion Papers 19/ 2006
9
and Tat (2001) find that appreciation does not lower exports in some Asian countries.
More specifically, Abeysinghe and Yeok demonstrate that Singapore’s exports are not ad-
versely affected by currency appreciation because lower import prices that are the result of
currency appreciation reduce the cost of export production. Fang and Miller (2004), also
show depreciation did little to improve Singapore’s exports. Similarly, Campa (2001) finds
Latin America’s exports to industrialized countries are sensitive to changes in the real ex-
change rate, whereas bilateral import flows do not show much sensitivity to changes in bi-
lateral exchange rates.
An extensive survey of the literature reveals only a few studies relevant to China on
this topic. Notably, Dees (2001) takes confronts the subject directly, arguing “firms export-
ing products that are imported beforehand are less sensitive to relative price changes than
firms exporting goods produced with national inputs.” Overall, however, the literature pro-
vides no consensus on the magnitude of exchange rate impact on trade flows in many
countries, including China. Moreover, no study to date considers the impact of the ex-
change rate in light of time series data for China’s bilateral trade.
The volatility in exchange rate represents another channel through which trade
flows could be affected. An increase in volatility could theoretically lower both export and
imports. In their cross-country study, Frankel and Wei (1995) find evidence of a significant
negative impact of exchange-rate volatility on trade across Asian countries. Based on the
gravity model, Devlin et al. (2001) use a set of 136 countries over 1981-1996. They iden-
tify significant impacts of exchange rate volatility on trade, especially in developing coun-
tries. Using a gravity model, however, Lahreche-Revil and Benassy-Quere (2001) find no
significant evidence that exchange-rate uncertainty has affected development of Chinese
trade.
3 Methodology
The two key methods for analyzing the relationship between exchange rate and external
trade are the more traditional method, which explains trade volume in terms of world de-
mand and price competitiveness (i.e. exchange rate),6 and the gravity model, which consid-
6 The application of this method on the case of China can be found in Cerra and Dayal-Gulati (1999), Song (2000) and Dees (2001).
Jiao Wang and Andy G. Ji Exchange rate sensitivity of China’s bilateral trade flows
10
ers bilateral trade across a wide range of countries using variables such as GDP, popula-
tion, distance, and trade barriers. The traditional approach uses dummies for reform, while
dummies in the gravity model are such factors as common border and language. Compared
to the traditional, the gravity model places greater emphasis on the long-run determinants
of trade and allows for fundamental analysis of the determinants of trade and the introduc-
tion of the exchange rate’s role in determining prices. Furthermore, a gravity model is bi-
lateral in nature, so it is good for detailing bilateral features such as trade agreements or
choice of specific exchange rate regime, which lie beyond the scope of traditional eco-
nomic variables such as GDP and population.
4 Bilateral gravity model
Assume trade (exports and imports) from China to its trading partners are dependent on the
following main factors under the bilateral gravity model:
(i) Level of GDP and population (absolute or per capita) of China and its related trad-
ing partners. These account for market power together with endowment differences.
(ii) Relative prices (nominal exchange rate, or real exchange rate, or consumer price
index). These account for bilateral competitiveness in trade.
(iii) Dummies. We use here dummies for policy changes and exchange rate regime
changes.
As our analysis concentrates on the impact of exchange rate change on bilateral trade
flows,7 the following exports and imports function are considered:
ttti
jtji
tjtitjtitji
DummyDummyPP
LnNERLn
POPLnPOPLnRPGDPLnRPGDPLnXLn
εαααα
ααααα
+⋅+⋅+⋅+⋅+
⋅+⋅+⋅+⋅+=
21)()(
)()()()()(
87
*
6,,5
,4,3,2,10,,
Eq.(1)
tjiX ,, = Exports or imports fromcountry i to country j
tiRPGDP , ( tjRPGDP , ) = Real per capita GDP

BOFIT- Institute for Economies in Transition Bank of Finland
BOFIT Discussion Papers 19/ 2006
11
tiPOP , ( tjPOP , ) = Total population
tDummy1 = Unification of exchange-rate regime8
tDummy2 = Managed-peg exchange-rate regime9
The coefficients of interest in this study are 5α , 6α , 7α , and 8α . Traditional trade theory
suggests that an appreciation of domestic currency may depress exports and encourage im-
ports, while the opposite would be true for depreciation.10
The estimation is carried out on time-series data for China’s 37 trading partners in
the period 1980-2003.11
5 Data description 5.1 Sources
Exchange rate (average local currency/US$ unit), population (person), CPI (2000=100),
are taken from International Financial Statistics (IFS). Bilateral trade (exports and imports
in current US$) are from Direction of Trade Statistics Yearbook (DOTS). Nominal GDP
(current US$), Real GDP (constant 1995 US$), Real Per Capita GDP (constant 1995 US$)
are from World Development Indicators (WDI). Taiwan’s data are from the Taiwan Statis-
tical Data Book and www.investintaiwan.org.tw. Several variables have been taken from
the China Statistical Yearbook, Deutsche Bank AG, www.bradynet.com, and other data
sources. Re-exports of Hong Kong are excluded, because the magnitude of this re-exports
7 Because of the nature of bilateral gravity model, traditional variables like geographic distance as a proxy of transportation costs and relative trade barriers (e.g. dummies for a common border or language) are not in-cluded. 8 This takes the value of one when a unified single exchange-rate regime is in effect during the sample pe-riod. Here, we only consider China’s side in 1994. It has a value of zero before 1994 and one after 1994. 9 China eliminates restrictions on current international transactions. Domestic firms are allowed to open for-eign exchange accounts for current international transaction. We define a value of zero before 1997 and one after 1997. 10 Theoretical models from Giovannini (1988), Franke (1991), Sereu and Vanhulle (1992) suggest exchange rate volatility can benefit trade flows, while Baron (1976), Feenstra and Kendall (1991) and Broll (1994) find that exchange rate volatility may have no impact on trade. 11 This is the maximum period.

Jiao Wang and Andy G. Ji Exchange rate sensitivity of China’s bilateral trade flows
12
would introduce a significant double counting into the trade of the Asian region.12 Due to
political conditions, Hong Kong intermediates trade between China13 and Taiwan.
5.2 Exchange rate There are several ways of measuring exchange rates, including price quotation,14 volume
quotation,15 RER,16 NEER,17 and REER.18 In this paper, we consider both bilateral nomi-
nal exchange rate and real exchange rate. REER is the most appropriate measurement re-
flecting the international competitiveness of domestic goods. The nominal exchange rate,
on the other hand, is adopted because the pass-through from nominal exchange rate into
inflation (or price by trade) either suffers from large lags or is otherwise distorted by the
command economy pricing mechanisms still in use in China.
Broadly speaking, various definitions of the real exchange rate can be grouped un-
der purchasing power parity (PPP) or based on the distinction between the tradable and the
non-tradable goods. Due to limited available data, we only use PPP to get the bilateral
RER for China against its top trading partners. RER is defined as follows:
i
jjiji P
PNERRER
*
,, ⋅=
RER = Real exchange rate
NER = Nominal exchange rate *jP = Foreign price level (or consumer price index)
iP = Domestic price level
As to the choice of the price index, there are four candidates including Consumer Price In-
dex (CPI), Wholesale Price Index (WPI), Producers Price Index (PPI) and GDP deflator.
Here we use CPI.
12 A large proportion of Hong Kong’s re-exports are goods of Chinese origin or have China as final destina-tion. Some 9.8% of total Asian merchandise exports in 2000 were Hong Kong re-exports (Technical Notes, WTO). 13 For our purposes, China refers to Mainland China. 14 The exchange rate is expressed in terms of the national currency value of a unit of foreign currency. 15 The exchange rate is expressed in terms of foreign currency value of a unit of the national currency. 16 The Real Exchange Rate (RER) is defined as the nominal exchange rate adjusted for inflation. 17 The Nominal Effective Exchange Rate (NEER) is a weighted average of major bilateral nominal exchange rates, with weights based on the trade shares reflecting the relative importance of each currency in the effec-tive exchange rate basket.
BOFIT- Institute for Economies in Transition Bank of Finland
BOFIT Discussion Papers 19/ 2006
13
5.3 Trade flows
China’s economy has opened up and liberalized extensively in the past two decades. In
particular, growth of China’s trade has far outstripped the expansion of world trade in this
period. This trend is only expected to continue, with the wider implications becoming evi-
dent as the adjustment periods following China’s WTO accession begin to lapse. Figure 1
and 2 shows the evolution of openness and export growth in China compared to other
countries/regions. Figure 3 indicates that over 54% of exports go to industrial countries and
about 45% to developing countries. Note that the US takes over 20% of Chinese exports,
followed by Hong Kong and Japan at around 17% and 16%, respectively. Note also that
China’s imports come increasingly from developing countries and decreasingly from in-
dustrial countries. The leading importers to China, however, are still Japan, the US and Ko-
rea.
6 Bilateral gravity model with time-series data
6.1 Estimation procedure and empirical results
Prior to estimating the bilateral gravity model defined above, the time-series properties of
the individual series must be tested. The order of integration of the individual time series is
determined using an Augmented Dickey-Fuller (ADF) test. The results indicate that nearly
all series are I(1) at a 5% significance level (see Appendix, Table 1).19
Four different specifications of Equation (1) are estimated. In model (1), only real
exchange rate is included as an exogenous variable. In model (2), only consumer price in-
dex and the exchange-rate dummies are included as exogenous variables in the estimation.
Finally, in models (3) and (4), the nominal exchange rate and the consumer price index are
tested in two separate estimations.
A number of diagnostic tests reported at the bottom of Tables 2–38 are performed
to determine the acceptability of the empirical estimates for each version of Equation (1).
18 The Real Effective Exchange Rate (REER) is calculated by adjusting the NEER for inflation differentials of the countries involved. 19 Only a few variables have an order of integration larger than one. Detailed ADF results are available upon request.
Jiao Wang and Andy G. Ji Exchange rate sensitivity of China’s bilateral trade flows
14
The adjusted 2R for all five models in 37 bilateral gravity model equations is very high.
The F-statistics overwhelmingly reject the null hypothesis at the 5% level. The Durbin-
Watson statistics mostly support acceptance of the null hypothesis that the errors are not
positively auto-correlated at the 5% level.
From the results in summary Table A,20 we find that the standard features of the
gravity model work well. However, the coefficient estimates for exporter’s (importer’s) per
capita income, population size and relative price vary in terms of magnitude and sign. This
suggests the exchange rate plays a role in determining trade flows that is statistically insig-
nificant for most trading partners. The observation contradicts the prediction by economic
theories that exchange rate appreciation (depreciation) depresses exports (imports) and vice
versa. The results also indicate that exchange rate regime and related policy do not have a
statistically significant effect on China’s trade flows to most of its top trading partners.
This is consistent with the results in Lahreche-Revil and Benassy-Quere (2001).21
One explanation for the lack of sensitivity of China’s exports to exchange rate
movements could rest on the fact that in order to maintain and increase the market share,
China’s exporters (first supported by directly by the government, and then indirectly
through favorable trade policies such as duty exemptions and tax refunds) are able to adjust
their prices and profit margins to movements in exchange rates. Moreover, China’s exports
consist largely of value-added goods, which require a large import component. These im-
ports contents are either exempt from duties or eligible for refund on the import tax paid.
China’s export tax refund regime has long known to offer significant incentives to ex-
porter. As tax refund rates run as high as 17 % for electromechanical devices, the strong
export performance in these product categories is hardly surprising. Moreover, the value-
added component of more than half of China’s exports is essentially the labor cost incurred
within Chinese borders. While many researchers argue that the large labor overhang de-
termines the magnitude of this value-added component more than exchange rate, the vari-
ous incentives offered to export processing industries such as tax breaks and free land use
in designated processing zones, can readily be seen as part of a heavily subsidized export-
oriented regime.
20 Details of regression results are provided in the Appendix. 21 Lahreche-Revil and Benassy-Quere (2001) find no evidence of an influence of exchange rate on trade in a gravity model.

BOFIT- Institute for Economies in Transition Bank of Finland
BOFIT Discussion Papers 19/ 2006
15
Unlike exports, China’s imports from its top trading partners are highly sensitivity
to exchange rate movements. The impacts are especially evident in bilateral trade flows
with China’s neighbors in East and South-East Asia (e.g. Hong Kong, Indonesia, Malaysia,
and Taiwan). Relative inflation also affect exports from China to the US, Japan, and Ger-
many.

Jiao Wang and Andy G. Ji Exchange rate sensitivity of China’s bilateral trade flows
16
Table A. Exchange rate sensitivity and consumer price index impact on China’s exports (imports) to (from) its top trading partners
Note: M1, M2, M3 and M4 refer to Model 1, 2, 3 and 4, respectively. * and ** denote t-test significance at the 10% and
5% levels, respectively.
China’s exports to … China’s imports from … Nominal
exchange rate
RER Inflation Nominal exchange rate
RER Inflation
Regions M3 M 1 M 2 M 4 M3 M 1 M 2 M 4 China’s exports to
European Zone China’s imports from
European Zone Austria 0.18 0.17 -0.52 -0.02 0.30 0.31 -0.20 0.47 Denmark 0.07 0.43** 0.10 0.33 -0.29 -0.11 1.14* 0.64 Finland 0.37** 0.22 0.51 -0.79* 0.41** 0.29* -0.14 -0.56 France 0.25 -0.07 -1.60** -1.32** -0.01 -0.004 -0.03 0.03 Germany 0.23 0.19 0.25 -0.29 0.64** 0.65* 2.35** 0.96 Hungary 0.91** 0.90 -0.89 -1.27* 1.05* 1.17 -0.35 -1.37* Ireland 0.73 0.29 -1.54 -1.39 -0.98 -1.05 -0.15 -0.67 Italy 0.01 0.006 -1.40** -1.17** -0.05* -0.05* -0.43 -0.83* Netherlands 0.12 -0.17 -0.66 -0.53* 0.15 0.07 -0.29 -0.10 Norway 1.00** 1.35** -0.94 -0.60 -1.06** -0.36 1.41** 1.53** Russia 0.49* 0.06 -0.17 -0.26 0.13 0.31 0.04 0.05 Spain 0.005 -0.02 -1.16** -1.30** 0.07 0.10 2.55** 1.84** Sweden -0.17 -0.13 0.11 0.27 0.21 0.14 -0.48 -0.48 Switzerland 0.34 -0.16 -1.75** -1.55** 0.84** 0.68** -1.13 0.08 Turkey 1.19** -1.27** -1.62** -1.22** 1.04** 1.59 -0.24 -0.99** UK 0.50 -0.007 -0.73 -0.79 -0.23 -0.36 0.13 0.05 China’s exports to
North American Zone China’s imports from
North American Zone Canada -0.34 -0.10 0.37 0.15 -0.34 0.20 1.14** 0.48 Mexico 0.52 0.05 -0.73 -0.44 0.005 0.11 -0.51 0.03 USA 0.40 -0.51* -0.61 -0.75** -0.05 -0.63** -0.87* -0.67** China’s exports to
Asian Zone China’s imports from
Asian Zone Hong Kong -0.21 -0.38 -0.59 -0.27 -2.18** -0.65 1.45 2.89** India -0.37 -1.06** -0.75 -1.27* -2.37** -2.55** -3.77* -2.42* Indonesia 0.52** 0.60** 0.40 0.29 1.12** 0.88** -0.76 -0.87 Iran 0.05 0.07 0.85 1.06 -0.09 -0.10 -3.73 -1.46 Japan 0.03 -0.21 -0.69 -0.96** 0.32 0.48** 0.24 0.36 Korea 0.81 1.60 -0.70 -0.14 1.23 1.32 -2.67 -0.73 Malaysia -0.27 -0.24 -0.36 -0.22 -1.09* -1.03** -1.47 -1.07 Philippines 0.42 0.58 -0.14 -0.80 -0.62 -0.33 2.43* 2.31** Singapore -0.01 0.47 1.09 0.98* -0.28 -1.49** -3.20** -2.55** Taiwan -0.15 -0.22 -0.01 -0.14 0.93* 1.13** -1.37 0.20 Thailand -1.30** -1.27** 1.80 1.94 -0.67 -0.97* -0.21 -0.42 Vietnam -0.44 2.35 5.78** 3.21* -1.98 0.27 7.73** 5.27** China’s exports to
Rest of World China’s imports from
Rest of World Australia 0.56 -0.64 -0.89 -1.00** -0.17 -0.34 0.06 -0.01 Brazil 0.03 0.20 -0.10 -0.02 0.09 -0.23 -0.17** -0.07 New Zealand 0.32 0.33 -0.70 -0.45 -0.25 -0.51 -0.97 -0.15 Saudi Arabia -0.50 -0.31 0.75 0.61 -0.20 -0.66 7.36 -0.37 South Africa 0.88** 1.08 1.09 -2.36** 0.65* 0.76 -1.81 -1.84** UAE 0.12 0.24 0.05 -0.45 -3.59* -2.85 2.78 4.38*

BOFIT- Institute for Economies in Transition Bank of Finland
BOFIT Discussion Papers 19/ 2006
17
7 Bilateral gravity model with panel data
We conduct the panel data analysis on two different sets of samples, namely the full sam-
ple and a sub-sample that constitutes China’s Asian neighbors. The use of the sub-sample
enables us to test the robustness of our estimation models and hopefully shed light on the
different features in trade flows in an economic region of importance to China. The panel
analysis uses pooled regression, fixed effects (FEM), and random effects methods. The
most appropriate method is determined by diagnostic tests (e.g. LM and Hausman tests).
The diagnostic tests overwhelmingly reject the pooled regression method, while FEM ap-
pears to outperform the random effects model in most model estimations. Five models are
run with exactly the same setups as described in the earlier section. The results from
pooled regressions are not reported. Full results are provided in the Appendix (Tables 39–
41).
In Table B we see that both exchange rates (nominal and real) and relative inflation
have significant impacts on imports to China from its trading partners, but no impact on
exports from China. Signs of coefficients are as expected with respect to both imports and
exports. Similarly, the results suggest that relative inflation has a significant correlation
with imports, not exports. Moreover, the empirical evidence from the full sample indicates
that China’s imports from its trading partners are determined by the relative competitive-
ness as envisaged by the bilateral exchange rate and relative prices, not exports. The lack
of sensitivity of both exchange rate movements and relative price levels on China’s exports
show that China’s export regime is far from market based.

Jiao Wang and Andy G. Ji Exchange rate sensitivity of China’s bilateral trade flows
18
Table B. All countries Exports Imports
FEM M1 M3 M4 M1 M3 M4
LEXRATE 0.0191** (1.980) 0.0114
(0.980)
LCOMPETIT -0.0082 (-0.778) -0.0270**
(-2.122)
LRER 0.0265 (0.998) -0.0670**
(-2.184)
D1
D2
REM M1 M3 M4 M1 M3 M4
LEXRATE 0.0220** (2.364) -0.0022
(-0.198)
LCOMPETIT -0.0160 (-1.560) -0.0151
(-1.233)
LRER 0.0421* (1.833) -0.0809***
(-3.113)
D1
D2
Note: M1, M3 and M4 refer to Model 1, 3 and 4, respectively. *, **, and *** denote t-test significance at the 10%, 5%, and 1% levels, respectively.
Table C gives the results from the sub-sample, including Asian countries alone. The results
again demonstrate that the exchange rate does not influence exports from China. The inter-
esting observation here lies with the relative inflation variable, which has highly significant
coefficients. A quick inspection on the empirical results on the individual country by the
time-series analysis reveals that Vietnam is a clear outlier in terms of having significant
positive correlation between relative inflation and exports. We thus re-estimate the coeffi-
cients excluding Vietnam from the sub- sample. The results calculated for exports differ
greatly from when Vietnam is included in the sub-sample, whereas the performance on im-
ports remains consistent.
A puzzle emerges here as the exchange rate movements appear to be negatively re-
lated to exports. Specifically, our empirical results suggest a devaluation of the nominal
exchange rate or depreciation in the real exchange rate causes exports to contract, and vice
versa. Abeysinghe and Yeok (1998) find that exchange rate appreciation does not decrease
Singapore’s exports as predicted under the traditional Mundell-Fleming model. They argue

BOFIT- Institute for Economies in Transition Bank of Finland
BOFIT Discussion Papers 19/ 2006
19
that the surge in exports during the period of currency appreciation may be attributed to
one of four reasons. First, exports have large import contents. Second, external demand
may have been rising. Third, productivity may have been rising. Fourth, pricing-to-market
ability may offset the negative effects of currency appreciation. They find evidence in sup-
port of the first rationale in that Singapore’s exports have a large presence of import con-
tents. As mentioned, over half of China’s exports involve processing activities. Therefore,
the reversed relationship between the exchange rate and the exports in this study can be
also explained by the large import contents of China’s exports. During depreciation epi-
sodes, Chinese exporters especially those in process industries experience rising prices of
imported intermediate goods. Since they find it difficult to raise prices of export goods
when China’s Asian neighbors are producing mostly the same goods domestically, they are
forced to cut exports to these markets, and perhaps opt for other less price-sensitive mar-
kets.
Table C. Asian countries (excluding Vietnam)
Exports Imports FEM M1 M3 M4 M1 M3 M4 LEXRATE -0.4635***
(-7.647) -0.4160***
(-4.522)
LCOMPETIT 0.6235*** (6.173)
0.4477*** (2.959)
LRER -0.6177*** (-5.810)
-0.6743*** (-4.370)
D1 D2 REM M1 M3 M4 M1 M3 M4 LEXRATE -0.3389***
(-6.307) -0.2220***
(-3.872)
LCOMPETIT 0.4582*** (4.960)
0.2621** (2.020)
LRER -0.3624*** (-4.392)
-0.2217*** (-3.385)
D1 D2
Note: M1, M3 and M4 refer to Model 1, 3, and 4, respectively. *. **, and *** denote t-test significance at the 10%, 5%, and 1% levels, respectively.
The overall performance of the gravity model is comparable to previous studies. Both
home and destination GDP exert positive impacts on bilateral trade flows, indicating the
existence of both pulling and pushing effects. Distance is shown to be negatively related to
Jiao Wang and Andy G. Ji Exchange rate sensitivity of China’s bilateral trade flows
20
the bilateral trade flows in the full sample. However, the significant relationship disappears
for the Asian countries, probably because of the geographic proximity of China to coun-
tries in the region.
The results from the panel data analysis are largely consistent to those from the ear-
lier time-series analysis. Hence, our empirically results appear to be robust under different
methodologies and model specifications.
8 Conclusions and further research suggestions
This paper considered the impact of exchange rate movements and exchange-rate regime
changes on China’s exports (imports) to (from) 37 top trading partners based on a general-
ized bilateral gravity model. Using annual data for the sample period of 1980-2003, the
empirical findings suggested two basic conclusions. First, the exchange rate (especially the
nominal exchange rate) has no significant effect on exports from China to its trading part-
ners. This partly confirms the hypothesis of the importance of nominal exchange rate due
to inefficient pass-through from the exchange rate to prices. Echoing previous research on
this topic, we further argued that this insulation from exchange-rate effects reflected the
large import contents Chinese exports. This unique feature traces back to China’s export
regime, which remains heavily subsidized by various export-oriented incentives. Second,
China’s imports exhibit expected patterns toward relative prices. This is indicative of the
overall competitiveness of China’s trading partners in the export sector. Therefore, the em-
pirical evidence suggests that a mild revaluation in the nominal exchange rate or apprecia-
tion in the real exchange rate would only have muted success in bringing down China’s
trade surplus.
In other words, the revamping of the current export-oriented policy regime should
receive greater attention and the precondition for exchange rate to take bigger role in de-
termining China’s international balance of payments. China has already moved to this di-
rection with the initiation of reforms in its export tax refund system in 2004. The aim was

BOFIT- Institute for Economies in Transition Bank of Finland
BOFIT Discussion Papers 19/ 2006
21
to reduce the level of tax refund in general and introduce more fiscal responsibility at the
local level. Meanwhile, the unification of the dual income tax regime, which currently of-
fers foreign companies much lower tax rates, will certainly affect the production and ex-
port strategies of the foreign companies. Currently, foreign companies account for over
half of the all exports from China.
Given the weak evidence of any negative impact on trade from exchange rate vola-
tility (especially exports), further studies might seek to document direct evidence of the
impact of export subsidies and processing trade on China’s trade flows. Since such data are
unavailable in the bilateral setting, efforts should be made to circumvent the problem. Fur-
ther research could also consider the exchange rate’s impact on China’s FDI inflows rela-
tive to investing in other countries/regions. FDI inflows to China have been concentrated in
the trade sector. This obviously affects the composition and distribution of China’s bilat-
eral trade flows. Moreover, given the importance of exchange rate in China’s imports, re-
search on the exchange rate pass-through could provide interesting insights into China’s
monetary policy formation. The dynamics of pass-through from the exchange rate to im-
port prices and consumer prices could be analyzed, say, based on the micro-foundations of
the exporter’s pricing behavior.

Jiao Wang and Andy G. Ji Exchange rate sensitivity of China’s bilateral trade flows
22
References
Abeysinghe, T and Yeok, T. L. (1998), “Exchange Rate Appreciation and Export Competi-tiveness: The Case of China,” Applied Economics, Vol. 30, 51-55.
Baron, D.P. (1976) “Fluctuating Exchange Rates and the Pricing of Exports,” Economic Inquiry, Vol.14, 425-438
Broll, U. (1994), “Foreign Production and Forward Markets,” Australian Economic Pa-pers, Vol.62, 1-6.
Campa, J. M. (2001), “Exchange Rate Crises and Bilateral Trade Flows in Latin America,” IESE Working Paper
Cerra, V. and Dayal-Gulati, A. (1999), “China’s Trade Flows: Changing Price Sensitivities and the Reform Process,” IMF Working Paper WP/99/1
Dees, S. (2001), “The Real Exchange-Rate and Types of Trade, Heterogeneity of Trade Behaviours in China,” Paper presented at the workshop on China’s Economy, CEPII, in Paris, December 12, 2001.
Fang, W. S. and Miller, S. M. (2004), “Exchange Rate Depreciation and Exports: The Case of Singapore Revisited,” University of Connecticut working paper 2004-45
Feenstra, R.C. and Kendall, J.D. (1991), “Exchange Rate Volatility and International Prices,” NBER Working Paper No.3644
Felipe, J. and Lim, J. (2005), “Export or Domestic-Led Growth in Asia?” Asian Develop-ment Bank Working Paper No. 69
Franke, G. (1988), “Exchange Rate Volatility and International Trading Strategy,” Journal of International Money and Finance, Vol.10, 292-307.
Frankel, J.A. and Wei,S. (1995), “European Integration and the Regionalization of World Trade Currencies: The Economics and the Politics,” in Eichengreen, B., Frieden, J. and von Hagen, J. (eds.) Monetary and Fiscal Policy in an Integrated Europe, European and Transatlantic Studies, Heidelberg, New York and London: Springer.
Giovannini, A. (1988), “Exchange Rates and Traded Goods Prices,” Journal of Interna-tional Economics, Vol.24, 45-68.
Hsiao, C., Mountain, D.C. and Ho-Illman, K. (1995) “Bayesian Integration of End-Use Metering and Conditional Demand Analysis,” Journal of Business and Economic Statistics, Vol.13 pp.315-326
Hsiao, C., Shen, Y. and Fujiki, H. (2005) “Aggregate vs Disaggregate Data Analysis – A Paradox in the Estimation of Money Demand Function of Japan under the Lower Interest Rate Policy,” Journal of Applied Econometrics, Vol.20 pp.579-601
BOFIT- Institute for Economies in Transition Bank of Finland
BOFIT Discussion Papers 19/ 2006
23
Lahreche-Revil, A. and Benassy-Quere, A. (2001), “The Impact of Exchange Rate Strate-gies on Trade and Foreign Direct Investment in China,” Paper Presented at the workshop on China’s economy, CEPII, in Paris December 12, 2001.
Lardy, N. (2005) “Exchange Rate and Monetary Policy in China,” Cato Journal, Vol. 25, No. 1.
McKenzie, M. D. (1999), “The Impact of Exchange Rate Volatility on International Trade Flows,” Journal of Economic Surveys, Vol.13, 71-106.
Nerlove, M. (2002) Essays in Panel Data Econometrics, Cambridge University Press, Cambridge
Sereu, P. and Vanhulle, C. (1992) “Exchange Rate Volatility, Exposure and the Value of Exporting Firms,” Journal of Banking and Finance, Vol.16 pp.155-182.
Song, L. (2000), “China’s Exchange Rate Mechanism and the Real Effective Exchange Rate,” in Lloyd, P.J. and Zhang, X. (eds.) China in the Global Economy, Edward Elgar.

Jiao Wang and Andy G. Ji Exchange rate sensitivity of China’s bilateral trade flows
24
APPENDIX
Figure 1: Openness in China Compared to Other Countries/Regions
0.00
5.00
10.00
15.00
20.00
25.00
30.00
35.00
40.00
45.00
1971
1974
1977
1980
1983
1986
1989
1992
1995
1998
2001
Year
Export/GDP in %
East Asia & Pacific
European Monetary Union
World
China
Source: World development indicators 2004
Figure 2: Export Annual % Growth
(5.00)
0.00
5.00
10.00
15.00
20.00
25.00
30.00
35.00
1979
1981
1983
1985
1987
1989
1991
1993
1995
1997
1999
2001
Year
%
East Asia & Pacific
European Monetary Union
World
China
Source: World development iIndicators 2004

BOFIT- Institute for Economies in Transition Bank of Finland
BOFIT Discussion Papers 19/ 2006
25
Figure 3: Distribution of Chinese Exports to Selected
Countries/Regions
0%
20%
40%
60%
80%
100%
1980
1982
1984
1986
1988
1990
1992
1994
1996
1998
2000
2002 Year
%
A
r
e
a
Singapore
Korea
Hong Kong
Australia
Japan
Canada
France
Italy
Netherlands
Canada
Germany
UK
USA
Developing Countries
Industrial Countries
Source: World development iIndicators 2004

Table 1. Augmented Dickey-Fuller regressions including an intercept and a linear trend: unit root test (degree of integration)
LEXPORT LIMPORT LRGDP0 LRGDP1 LPOP0 LPOP1 LEXRATE LRER LCOMPETIT Australia 1 0 1 1 1 1 1 1 1 Austria 0 1 1 1 1 1 1 1 1 Belgium 1 1 1 1 1 1 1 1 1 Brazil 1 1 1 1 1 1 1 1 1 Canada 1 1 1 1 1 1 1 1 1 Denmark 1 1 1 1 1 1 1 1 1 Finland 1 1 1 1 1 1 1 1 1 France 1 0 1 1 1 1 1 1 1 Germany 1 1 1 1 1 1 1 1 1 Hong Kong 1 1 1 1 1 1 1 1 1 Hungary 1 1 1 1 1 0 1 1 1 India 0 0 1 1 1 1 1 1 1 Indonesia 1 0 1 1 1 1 1 1 1 Iran 0 1 1 1 1 1 1 1 1 Ireland 1 1 1 1 1 1 1 1 1 Italy 1 1 1 1 1 1 1 1 1 Japan 1 1 1 1 1 1 1 1 1 Korea 1 0 1 1 1 1 1 1 1 Malaysia 1 1 1 1 1 1 1 1 1 Mexico 0 1 1 1 1 1 1 1 1 Netherlands 0 1 1 1 1 1 1 1 1 New Zealand 1 1 1 1 1 1 1 1 1 Norway 1 1 1 1 1 1 1 1 1 Philippines 1 1 1 1 1 1 1 1 1 Russia 1 1 1 1 1 1 1 1 1 Saudi Arabia 0 1 1 1 1 1 1 1 1 Singapore 1 1 1 1 1 1 1 1 1 South Africa 1 1 1 1 1 1 1 1 1 Spain 1 1 1 1 1 0 1 1 1 Sweden 0 1 1 1 1 1 1 1 1 Switzerland 1 1 1 1 1 1 1 1 1 Taiwan 1 1 1 1 1 1 1 1 1 Thailand 1 1 1 1 1 0 1 1 1 Turkey 1 1 1 1 1 1 1 1 1 UK 0 1 1 1 1 0 1 1 1 UAE 1 1 1 1 1 0 1 1 0 USA 1 0 1 1 1 1 1 1 1 Vietnam 0 0 1 1 1 1 0 1 1 Note: 95% critical value for the augmented Dickey-Fuller statistics. I(0) refers to no-unit root; I(1) refers to unit root.
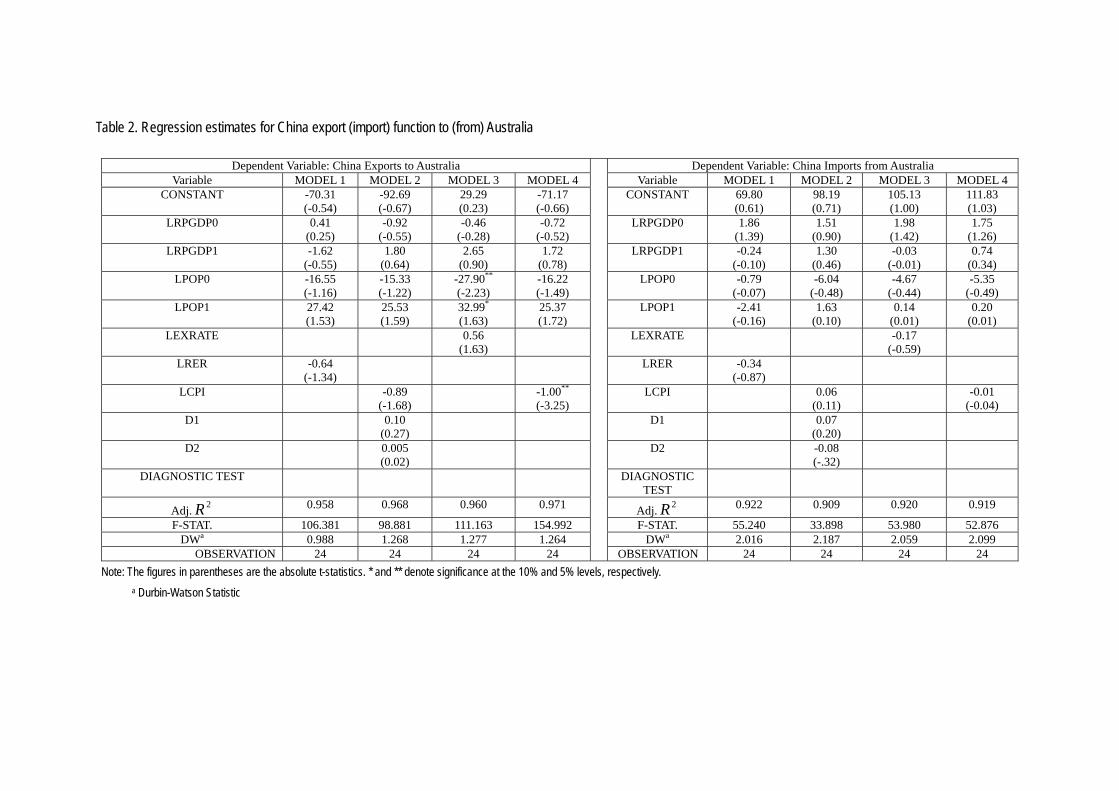
Table 2. Regression estimates for China export (import) function to (from) Australia
Dependent Variable: China Exports to Australia Dependent Variable: China Imports from Australia Variable MODEL 1 MODEL 2 MODEL 3 MODEL 4 Variable MODEL 1 MODEL 2 MODEL 3 MODEL 4
CONSTANT -70.31 (-0.54)
-92.69 (-0.67)
29.29 (0.23)
-71.17 (-0.66)
CONSTANT 69.80 (0.61)
98.19 (0.71)
105.13 (1.00)
111.83 (1.03)
LRPGDP0 0.41 (0.25)
-0.92 (-0.55)
-0.46 (-0.28)
-0.72 (-0.52)
LRPGDP0 1.86 (1.39)
1.51 (0.90)
1.98 (1.42)
1.75 (1.26)
LRPGDP1 -1.62 (-0.55)
1.80 (0.64)
2.65 (0.90)
1.72 (0.78)
LRPGDP1 -0.24 (-0.10)
1.30 (0.46)
-0.03 (-0.01)
0.74 (0.34)
LPOP0 -16.55 (-1.16)
-15.33 (-1.22)
-27.90**
(-2.23) -16.22 (-1.49)
LPOP0 -0.79 (-0.07)
-6.04 (-0.48)
-4.67 (-0.44)
-5.35 (-0.49)
LPOP1 27.42 (1.53)
25.53 (1.59)
32.99*
(1.63) 25.37 (1.72)
LPOP1 -2.41 (-0.16)
1.63 (0.10)
0.14 (0.01)
0.20 (0.01)
LEXRATE 0.56 (1.63)
LEXRATE -0.17 (-0.59)
LRER -0.64 (-1.34)
LRER -0.34 (-0.87)
LCPI -0.89 (-1.68)
-1.00**
(-3.25) LCPI 0.06
(0.11) -0.01
(-0.04) D1 0.10
(0.27) D1 0.07
(0.20)
D2 0.005 (0.02)
D2 -0.08 (-.32)
DIAGNOSTIC TEST DIAGNOSTIC TEST
Adj. 2R 0.958 0.968 0.960 0.971 Adj. 2R 0.922 0.909 0.920 0.919
F-STAT. 106.381 98.881 111.163 154.992 F-STAT. 55.240 33.898 53.980 52.876 DWa 0.988 1.268 1.277 1.264 DWa 2.016 2.187 2.059 2.099
OBSERVATION 24 24 24 24 OBSERVATION 24 24 24 24 Note: The figures in parentheses are the absolute t-statistics. * and ** denote significance at the 10% and 5% levels, respectively.
a Durbin-Watson Statistic

Table 3. Regression estimates for China export (import) function to (from) Austria
Dependent Variable: China Exports to Austria Dependent Variable: China Imports from Austria Variable MODEL 1 MODEL 2 MODEL 3 MODEL 4 Variable MODEL 1 MODEL 2 MODEL 3 MODEL 4
CONSTANT -349.84 (-0.98)
55.02 (0.09)
-308.08 (-0.97)
-160.92 (-0.34)
CONSTANT -140.47 (-0.44)
604.25 (1.18)
-55.33 (-0.19)
63.87 (0.15)
LRPGDP0 0.69 (0.43)
2.67 (1.10)
0.70 (0.44)
1.29 (0.91)
LRPGDP0 -0.01 (-0.01)
3.36 (1.62)
0.06 (0.04)
0.98 (0.74)
LRPGDP1 3.29 (0.44)
9.46 (1.26)
3.40 (0.46)
7.29 (1.29)
LRPGDP1 -6.35 (-0.94)
7.60 (1.19)
-5.87 (-0.89)
0.19 (0.04)
LPOP0 -10.11 (-0.73)
-29.47 (-1.38)
-10.50 (-0.79)
-16.97 (-1.49)
LPOP0 17.32 (1.41)
-18.02 (-0.99)
16.15 (1.35)
6.67 (0.63)
LPOP1 34.10**
(2.38) 29.50 (1.16)
31.91**
(2.45) 28.42 (1.24)
LPOP1 -8.60 (-0.67)
-19.24 (-0.89)
-12.75 (-1.09)
-12.22 (-0.57)
LEXRATE 0.18 (0.75)
LEXRATE 0.30 (1.43)
LRER 0.17 (0.74)
LRER 0.31 (1.48)
LCPI -0.52 (-0.31)
-0.02 (-0.01)
LCPI -0.20 (-0.14)
0.47 (0.34)
D1 -0.41 (-0.54)
D1 -0.17 (-0.26)
D2 -0.26 (-0.48)
D2 -0.86*
(-1.88)
DIAGNOSTIC TEST DIAGNOSTIC TEST
Adj. 2R 0.876 0.861 0.876 0.872 Adj. 2R 0.703 0.696 0.701 0.699
F-STAT. 33.534 21.336 33.564 32.447 F-STAT. 11.890 8.526 11.788 10.311 DWa 2.49 2.548 2.500 2.431 DWa 1.862 2.231 1.852 1.725
OBSERVATION 24 24 24 24 OBSERVATION 24 24 24 24 Note: The figures in parentheses are the absolute t-statistics. * and ** denote significance at the 10% and 5% levels, respectively.
a Durbin-Watson Statistic

Table 4. Regression estimates for China export (import) function to (from) Brazil
Dependent Variable: China Exports to Brazil Dependent Variable: China Imports from Brazil Variable MODEL 1 MODEL 2 MODEL 3 MODEL 4 Variable MODEL 1 MODEL 2 MODEL 3 MODEL 4
CONSTANT 1480.90**
(4.96) 691.09**
(2.30) 1331.7**
(5.83) 1336.9**
(5.63) CONSTANT 7.67
(0.02) 25.46 (0.09)
-46.90 (-0.20)
-58.25 (-0.24)
LRPGDP0 16.85**
(6.22) 10.26**
(2.90) 17.17**
(5.82) 16.91**
(6.02) LRPGDP0 -2.04
(-0.72) 5.51
(1.60) 0.72
(0.24) 0.25
(0.09) LRPGDP1 -7.28**
(-2.29) -7.83**
(-2.47) -8.05**
(-2.21) -7.81**
(-2.20) LRPGDP1 1.71
(0.51) -3.26
(-1.05) -0.83
(-0.23) -0.47
(-0.13) LPOP0 -12.05
(-0.46) 13.58 (0.48)
5.28 (0.17)
3.03 (0.10)
LPOP0 -43.80 (-1.58)
1.80 (0.07)
-19.66 (-0.62)
-21.64 (-0.68)
LPOP1 -66.42**
(-2.82) -50.58*
(-1.83) -77.47**
(-2.59) -75.26**
(-2.57) LPOP1 49.14*
(1.98) -2.61
(-0.10) 25.45 (0.84)
28.28 (0.95)
LEXRATE 0.03 (0.48)
LEXRATE 0.09 (1.34)
LRER 0.20 (0.41)
LRER -0.23 (-0.45)
LCPI -0.10 (-1.48)
-0.02 (-0.38)
LCPI -0.17**
(-2.66) -0.07
(-1.27) D1 1.59**
(2.78) D1 0.25
(0.45)
D2 0.23 (0.57)
D2 -1.26**
(-3.26)
DIAGNOSTIC TEST DIAGNOSTIC TEST
Adj. 2R 0.813 0.863 0.813 0.813 Adj. 2R 0.783 0.864 0.801 0.799
F-STAT. 20.964 21.664 21.047 20.939 F-STAT. 17.624 21.883 19.486 19.263 DWa 1.721 2.504 1.734 1.730 DWa 1.193 1.697 1.032 1.038
OBSERVATION 24 24 24 24 OBSERVATION 24 24 24 24 Note: The figures in parentheses are the absolute t-statistics. * and ** denote significance at the 10% and 5% levels, respectively.
a Durbin-Watson Statistic

Table 5. Regression estimates for China export (import) function to (from) Canada
Dependent Variable: China Exports to Canada Dependent Variable: China Imports from Canada
Variable MODEL 1 MODEL 2 MODEL 3 MODEL 4 Variable MODEL 1 MODEL 2 MODEL 3 MODEL 4 CONSTANT 30.55
(0.38) 3.17
(0.04) -14.16 (-0.17)
46.71 (0.69)
CONSTANT 11.43 (0.09)
-160.05 (-1.27)
-86.08 (-0.64)
-27.70 (-0.26)
LRPGDP0 1.91**
(2.86) 1.69*
(2.07) 1.96**
(3.10) 2.04**
(3.06) LRPGDP0 -0.02
(-0.01) -0.94
(-0.83) -0.12
(-0.11) -0.14 (0.13)
LRPGDP1 -0.51 (-0.59)
-0.43 (-0.40)
-1.21 (-1.18)
-0.71 (-0.75)
LRPGDP1 1.23 (0.89)
1.16 (0.76)
0.37 (0.22)
0.31 (0.21)
LPOP0 -12.59 (-1.69)
-15.49**
(-2.31) -9.73
(-1.58) -16.44**
(-3.17) LPOP0 -18.53
(-1.56) -15.22 (-1.62)
-8.27 (-0.82)
-18.13**
(-2.26) LPOP1 14.36
(1.71) 19.41**
(2.32) 13.90*
(1.96) 18.13**
(2.36) LPOP1 22.41
(1.68) 28.42**
(2.42) 16.18 (1.40)
24.56*
(2.07) LEXRATE -0.34
(-1.25) LEXRATE -0.34
(-0.77)
LRER -0.10 (-0.42)
LRER 0.20 (0.53)
LCPI 0.37 (1.05)
0.15 (0.61)
LCPI 1.14**
(2.32) 0.48
(1.27) D1 0.20
(0.90) D1 0.59*
(1.95)
D2 -0.06 (-0.40)
D2 -0.17 (-0.87)
DIAGNOSTIC TEST DIAGNOSTIC TEST
Adj. 2R 0.986 0.985 0.987 0.986 Adj. 2R 0.790 0.829 0.794 0.804
F-STAT. 327.249 223.053 352.548 330.798 F-STAT. 18.334 16.942 18.695 19.918 DWa 1.544 1.826 1.652 1.629 DWa 1.865 2.396 1.981 2.021
OBSERVATION 24 24 24 24 OBSERVATION 24 24 24 24 Note: The figures in parentheses are the absolute t-statistics. * and ** denote significance at the 10% and 5% levels, respectively.
a Durbin-Watson Statistic

Table 6. Regression estimates for China export (import) function to (from) Denmark
Dependent Variable: China Exports to Denmark Dependent Variable: China Imports from Denmark
Variable MODEL 1 MODEL 2 MODEL 3 MODEL 4 Variable MODEL 1 MODEL 2 MODEL 3 MODEL 4 CONSTANT -406.65**
(-2.68) -399.45**
(-2.21) -293.24*
(-1.83) -320.80**
(-2.10) CONSTANT 414.05
(1.29) 134.97 (0.40)
433.85 (1.48)
302.94 (1.06)
LRPGDP0 0.02 (0.02)
0.57 (0.65)
0.18 (0.21)
0.63 (0.76)
LRPGDP0 3.13*
(1.96) 3.02*
(1.86) 3.55**
(2.23) 3.72
(2.40) LRPGDP1 5.26**
(3.51) 4.88**
(2.24) 5.04**
(2.78) 3.42*
(1.91) LRPGDP1 1.45
(0.46) -0.41
(-0.10) 0.09
(0.03) -0.87
(-0.26) LPOP0 -0.88
(-0.26) -0.18
(-0.04) 1.12
(0.31) 1.92
(0.57) LPOP0 -11.55
(-1.63) -7.63
(-1.01) -10.22 (-1.52)
-11.54*
(-1.82) LPOP1 25.17**
(3.31) 23.77**
(2.67) 15.22**
(2.22) 16.74**
(2.63) LPOP1 -12.15
(-0.75) 1.52
(0.09) -14.47 (-1.15)
-3.85 (-0.32)
LEXRATE 0.07 (0.49)
LEXRATE -0.29 (-1.09)
LRER 0.43**
(2.21) LRER -0.11
(-0.26)
LCPI 0.10 (0.30)
0.33 (1.45)
LCPI 1.14*
(1.80) 0.64
(1.53) D1 -0.20
(-0.92) D1 0.41
(0.99)
D2 -0.19 (-1.07)
D2 -0.22 (-0.66)
DIAGNOSTIC TEST DIAGNOSTIC TEST
Adj. 2R 0.988 0.986 0.985 0.986 Adj. 2R 0.900 0.911 0.906 0.911
F-STAT. 371.684 226.780 295.301 325.666 F-STAT. 42.379 34.673 45.241 48.128 DWa 1.638 1.817 1.342 1.398 DWa 2.249 2.782 2.394 2.445
OBSERVATION 24 24 24 24 OBSERVATION 24 24 24 24 Note: The figures in parentheses are the absolute t-statistics. * and ** denote significance at the 10% and 5% levels, respectively.
a Durbin-Watson Statistic
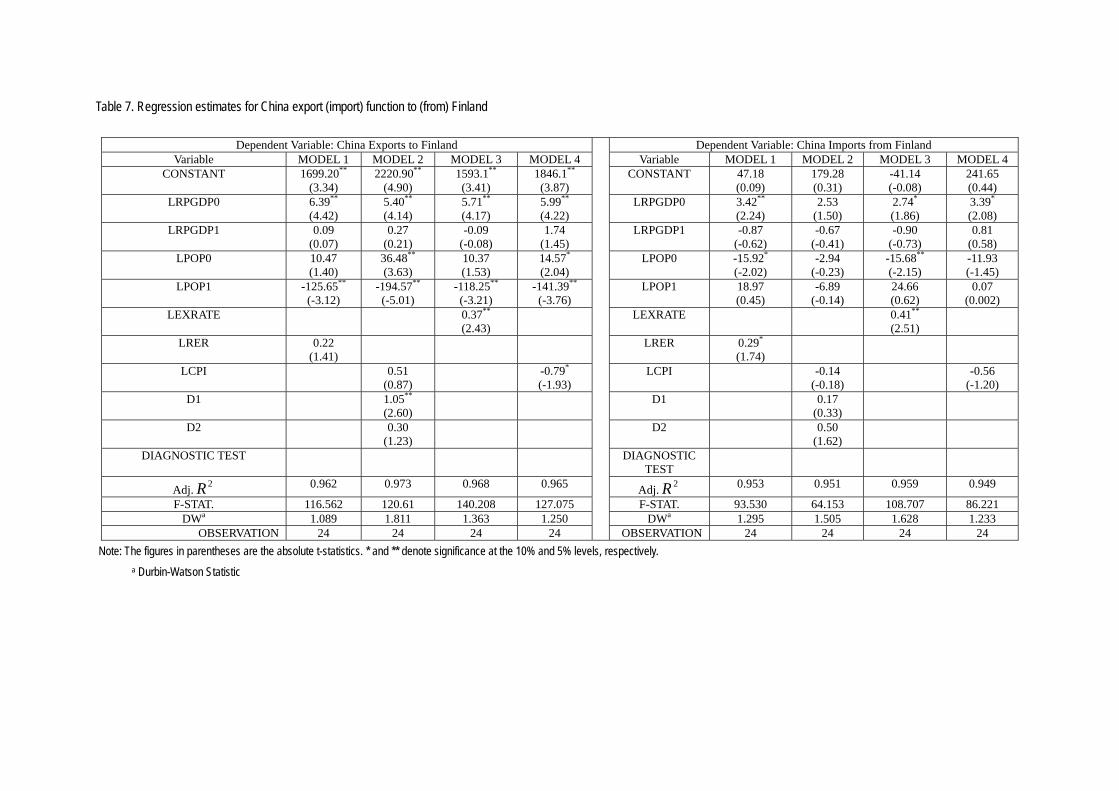
Table 7. Regression estimates for China export (import) function to (from) Finland
Dependent Variable: China Exports to Finland Dependent Variable: China Imports from Finland
Variable MODEL 1 MODEL 2 MODEL 3 MODEL 4 Variable MODEL 1 MODEL 2 MODEL 3 MODEL 4 CONSTANT 1699.20**
(3.34) 2220.90**
(4.90) 1593.1**
(3.41) 1846.1**
(3.87) CONSTANT 47.18
(0.09) 179.28 (0.31)
-41.14 (-0.08)
241.65 (0.44)
LRPGDP0 6.39**
(4.42) 5.40**
(4.14) 5.71**
(4.17) 5.99**
(4.22) LRPGDP0 3.42**
(2.24) 2.53
(1.50) 2.74*
(1.86) 3.39*
(2.08) LRPGDP1 0.09
(0.07) 0.27
(0.21) -0.09
(-0.08) 1.74
(1.45) LRPGDP1 -0.87
(-0.62) -0.67
(-0.41) -0.90
(-0.73) 0.81
(0.58) LPOP0 10.47
(1.40) 36.48**
(3.63) 10.37 (1.53)
14.57*
(2.04) LPOP0 -15.92*
(-2.02) -2.94
(-0.23) -15.68**
(-2.15) -11.93 (-1.45)
LPOP1 -125.65**
(-3.12) -194.57**
(-5.01) -118.25**
(-3.21) -141.39**
(-3.76) LPOP1 18.97
(0.45) -6.89
(-0.14) 24.66 (0.62)
0.07 (0.002)
LEXRATE 0.37**
(2.43) LEXRATE 0.41**
(2.51)
LRER 0.22 (1.41)
LRER 0.29*
(1.74)
LCPI 0.51 (0.87)
-0.79*
(-1.93) LCPI -0.14
(-0.18) -0.56
(-1.20) D1 1.05**
(2.60) D1 0.17
(0.33)
D2 0.30 (1.23)
D2 0.50 (1.62)
DIAGNOSTIC TEST DIAGNOSTIC TEST
Adj. 2R 0.962 0.973 0.968 0.965 Adj. 2R 0.953 0.951 0.959 0.949
F-STAT. 116.562 120.61 140.208 127.075 F-STAT. 93.530 64.153 108.707 86.221 DWa 1.089 1.811 1.363 1.250 DWa 1.295 1.505 1.628 1.233
OBSERVATION 24 24 24 24 OBSERVATION 24 24 24 24 Note: The figures in parentheses are the absolute t-statistics. * and ** denote significance at the 10% and 5% levels, respectively.
a Durbin-Watson Statistic

Table 8. Regression estimates for China export (import) function to (from) France
Dependent Variable: China Exports to France Dependent Variable: China Imports from France Variable MODEL 1 MODEL 2 MODEL 3 MODEL 4 Variable MODEL 1 MODEL 2 MODEL 3 MODEL 4
CONSTANT -408.20 (-0.44)
-1118.70*
(-1.86) -242.87 (-0.28)
-1069.9*
(-1.86) CONSTANT 10.58
(0.01) -31.83 (-0.04)
9.54 (0.01)
32.35 (0.04)
LRPGDP0 1.16 (0.51)
-1.32 (-0.80)
1.06 (0.49)
-1.48 (-1.01)
LRPGDP0 0.57 (0.31)
0.47 (0.21)
0.58 (0.32)
0.64 (0.33)
LRPGDP1 3.85 (0.91)
2.04 (0.79)
-0.39 (-0.10)
3.19 (1.53)
LRPGDP1 1.77 (0.52)
0.90 (0.26)
1.88 (0.55)
1.70 (0.62)
LPOP0 -16.16 (-1.35)
-23.37**
(-3.01) -6.38
(-0.58) -21.50**
(-3.44) LPOP0 8.87
(0.93) 9.93
(0.94) 8.65
(0.94) 9.20
(1.13) LPOP1 40.33
(0.62) 90.85**
(2.26) 22.07 (0.37)
85.25**
(2.18) LPOP1 -10.97
(-0.21) -9.30
(-0.17) -10.72 (-0.21)
-12.58 (-0.25)
LEXRATE 0.25 (1.36)
LEXRATE -0.01 (-0.08)
LRER -0.07 (-0.36)
LRER -0.004 (-0.03)
LCPI -1.60**
(-4.49) -1.32**
(-5.55) LCPI -0.03
(-0.06) 0.03
(0.10) D1 -0.29
(-1.14) D1 -0.08
(-0.22)
D2 0.08 (0.42)
D2 0.09 (0.34)
DIAGNOSTIC TEST DIAGNOSTIC TEST
Adj. 2R 0.938 0.976 0.943 0.977 Adj. 2R 0.945 0.938 0.945 0.945
F-STAT. 70.230 135.504 77.250 194.963 F-STAT. 79.604 51.120 79.631 79.650 DWa 0.793 2.038 0.876 2.091 DWa 3.043 3.024 3.050 3.051
OBSERVATION 24 24 24 24 OBSERVATION 24 24 24 24 Note: The figures in parentheses are the absolute t-statistics. * and ** denote significance at the 10% and 5% levels, respectively.
a Durbin-Watson Statistic

Table 9. Regression estimates for China export (import) function to (from) Germany
Dependent Variable: China Exports to Germany Dependent Variable: China Imports from Germany Variable MODEL 1 MODEL 2 MODEL 3 MODEL 4 Variable MODEL 1 MODEL 2 MODEL 3 MODEL 4
CONSTANT 80.62 188.78 (0.33)
-289.53*
(-2.01) 373.17 (0.75)
CONSTANT 407.17 (0.65)
-438.68 (0.27) (-0.81)
395.49 (1.65)
168.67 (0.14)
LRPGDP0 1.89 (1.77)
2.04 (1.53)
1.27** 2.29*
(1.93) LRPGDP0 2.15
(0.96) 2.11
(1.67) 2.35**
(3.20) 2.49
(2.87) (0.88) LRPGDP1 -8.86**
(-3.87) -8.27**
(-2.71) -2.59
(-1.23) -8.61**
(-3.48) LRPGDP1 -14.41**
(-3.00) -6.88*
(-2.39) -1.34
(-0.38) -12.57*
(-2.14) LPOP0 13.54 14.35 -0.66 13.82 LPOP0 20.92 14.52
(1.51) -7.84
(-0.97) 19.23
(1.62) (1.41) (-0.14) (1.52) (1.19) (0.89) LPOP1 -14.41
(-1.25) -21.72 (-0.76)
18.89**
(3.93) -30.98 (-1.24)
LPOP1 -37.79 (-1.55)
11.19 (0.41)
-11.58 (-1.45)
-24.10 (-0.41)
LEXRATE 0.23 (1.34)
LEXRATE 0.64**
(2.21)
LRER 0.19 (1.24)
LRER 0.65*
(2.04)
LCPI 0.25 (0.27)
-0.29 (-0.48)
LCPI 2.35**
(2.65) 0.96
(0.65) D1 0.17
(0.78) D1 0.37
(1.78)
D2 -0.04 (-0.31)
D2 -0.49**
(-4.44)
DIAGNOSTIC TEST DIAGNOSTIC TEST
Adj. 0.982 0.975 0.982 0.979 2R Adj. 2R 0.915 0.976 0.932 0.872
F-STAT. 133.079 69.167 252.934 112.563 F-STAT. 26.848 72.092 63.749 17.367 DWa 2.663 2.543 1.156 2.200 DWa 1.953 3.334 1.354 1.254
OBSERVATION 13 13 13 13 OBSERVATION 13 13 13 13 Note: The figures in parentheses are the absolute t-statistics. * and ** denote significance at the 10% and 5% levels, respectively.
a Durbin-Watson Statistic

Table 10. Regression estimates for China export (import) function to (from) Hong Kong
Dependent Variable: China Exports to Hong Kong Dependent Variable: China Imports from Hong Kong
Variable MODEL 1 MODEL 2 MODEL 3 MODEL 4 Variable MODEL 1 MODEL 2 MODEL 3 MODEL 4 CONSTANT -238.63**
(-2.11) -181.61 (-1.47)
-214.51*
(-1.88) -236.86*
(-2.00) CONSTANT -513.56*
(-1.75) -165.92 (-0.71)
-438.17*
(-1.86) -284.29 (-1.15)
LRPGDP0 -0.52 (-0.40)
-0.61 (-0.43)
-0.43 (-0.30)
-1.11 (-0.80)
LRPGDP0 -4.67 (-1.41)
-1.25 (-0.47)
-1.12 (-0.38)
-2.07 (-0.72)
LRPGDP1 1.45 (1.01)
1.73 (1.19)
1.42 (0.96)
1.64 (1.12)
LRPGDP1 5.85 (1.58)
5.40*
(1.97) 4.63
(1.52) 5.02
(1.64) LPOP0 13.89**
(2.27) 10.06 (1.59)
12.37*
(2.05) 11.92*
(2.03) LPOP0 22.67
(1.43) 2.41
(0.20) 28.69**
(2.30) 12.91 (1.05)
LPOP1 -2.48 (-0.45)
-0.97 (-0.15)
-2.01 (-0.34)
0.23 (0.04)
LPOP1 2.14 (0.15)
5.53 (0.45)
-11.40 (-0.92)
-0.85 (-0.07)
LEXRATE -0.21 (-0.62)
LEXRATE -2.18**
(-3.13)
LRER -0.38 (-1.11)
LRER -0.65 (-0.73)
LCPI -0.59 (-1.07)
-0.27 (-0.60)
LCPI 1.45 (1.40)
2.89**
(3.01) D1 -0.26
(-1.25) D1 -1.03**
(-2.56)
D2 0.13 (0.56)
D2 -0.25 (-0.57)
DIAGNOSTIC TEST DIAGNOSTIC TEST
Adj. 2R 0.959 0.958 0.957 0.957 Adj. 2R 0.760 0.869 0.840 0.836
F-STAT. 108.74 75.375 103.753 103.613 F-STAT. 15.600 22.864 25.200 24.473 DWa 1.794 1.949 1.569 1.473 DWa 0.847 1.868 1.628 1.080
OBSERVATION 24 24 24 24 OBSERVATION 24 24 24 24 Note: The figures in parentheses are the absolute t-statistics. * and ** denote significance at the 10% and 5% levels, respectively.
a Durbin-Watson Statistic
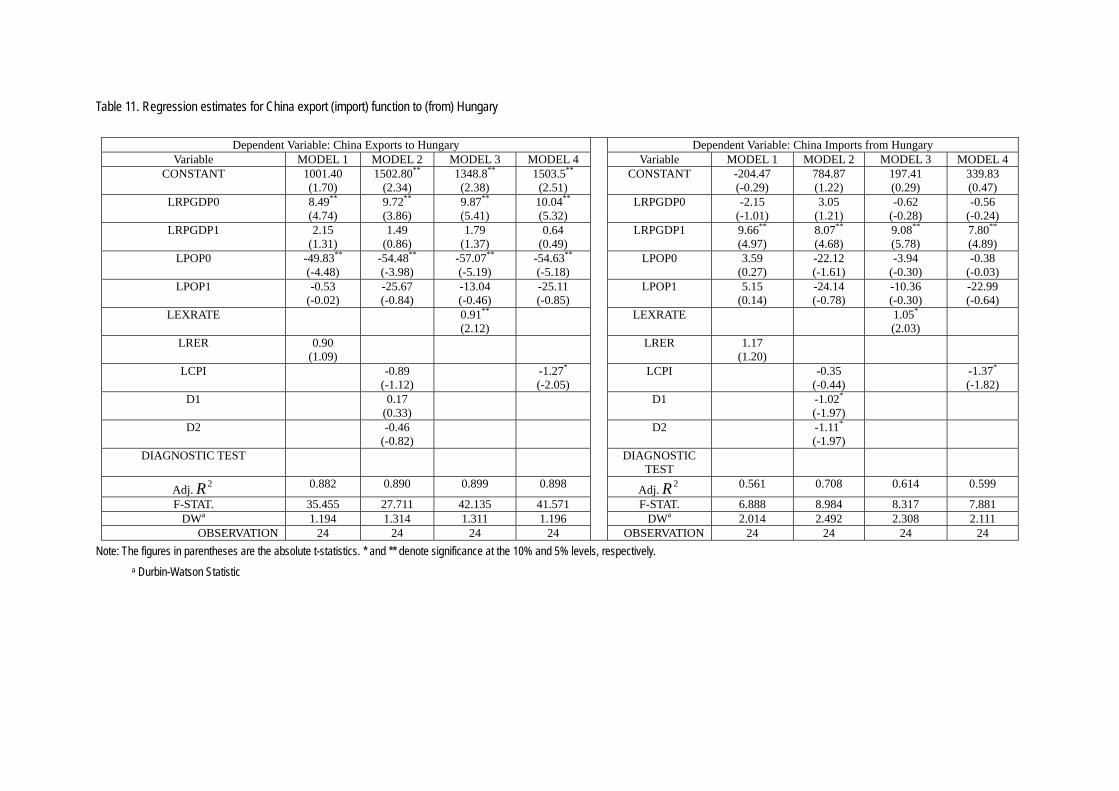
Table 11. Regression estimates for China export (import) function to (from) Hungary
Dependent Variable: China Exports to Hungary Dependent Variable: China Imports from Hungary
Variable MODEL 1 MODEL 2 MODEL 3 MODEL 4 Variable MODEL 1 MODEL 2 MODEL 3 MODEL 4 CONSTANT 1001.40
(1.70) 1502.80**
(2.34) 1348.8**
(2.38) 1503.5**
(2.51) CONSTANT -204.47
(-0.29) 784.87 (1.22)
197.41 (0.29)
339.83 (0.47)
LRPGDP0 8.49**
(4.74) 9.72**
(3.86) 9.87**
(5.41) 10.04**
(5.32) LRPGDP0 -2.15
(-1.01) 3.05
(1.21) -0.62
(-0.28) -0.56
(-0.24) LRPGDP1 2.15
(1.31) 1.49
(0.86) 1.79
(1.37) 0.64
(0.49) LRPGDP1 9.66**
(4.97) 8.07**
(4.68) 9.08**
(5.78) 7.80**
(4.89) LPOP0 -49.83**
(-4.48) -54.48**
(-3.98) -57.07**
(-5.19) -54.63**
(-5.18) LPOP0 3.59
(0.27) -22.12 (-1.61)
-3.94 (-0.30)
-0.38 (-0.03)
LPOP1 -0.53 (-0.02)
-25.67 (-0.84)
-13.04 (-0.46)
-25.11 (-0.85)
LPOP1 5.15 (0.14)
-24.14 (-0.78)
-10.36 (-0.30)
-22.99 (-0.64)
LEXRATE 0.91**
(2.12) LEXRATE 1.05*
(2.03)
LRER 0.90 (1.09)
LRER 1.17 (1.20)
LCPI -0.89 (-1.12)
-1.27*
(-2.05) LCPI -0.35
(-0.44) -1.37*
(-1.82) D1 0.17
(0.33) D1 -1.02*
(-1.97)
D2 -0.46 (-0.82)
D2 -1.11*
(-1.97)
DIAGNOSTIC TEST DIAGNOSTIC TEST
Adj. 2R 0.882 0.890 0.899 0.898 Adj. 2R 0.561 0.708 0.614 0.599
F-STAT. 35.455 27.711 42.135 41.571 F-STAT. 6.888 8.984 8.317 7.881 DWa 1.194 1.314 1.311 1.196 DWa 2.014 2.492 2.308 2.111
OBSERVATION 24 24 24 24 OBSERVATION 24 24 24 24 Note: The figures in parentheses are the absolute t-statistics. * and ** denote significance at the 10% and 5% levels, respectively.
a Durbin-Watson Statistic
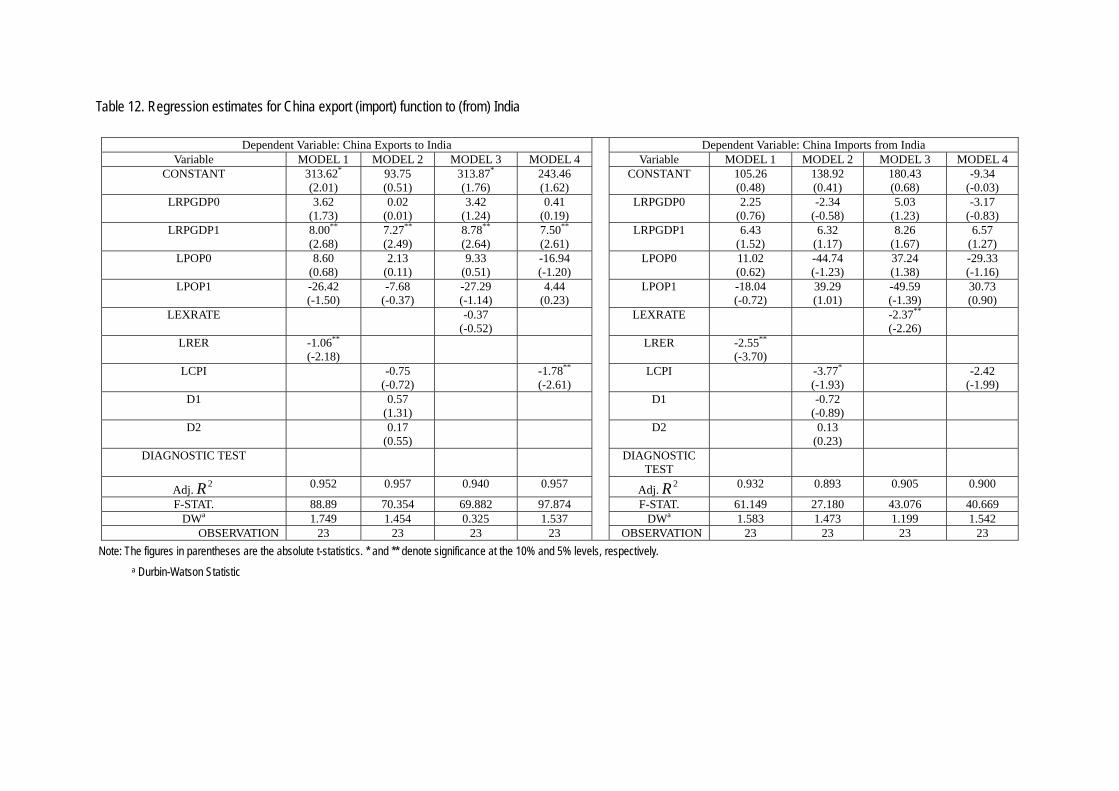
Table 12. Regression estimates for China export (import) function to (from) India
Dependent Variable: China Exports to India Dependent Variable: China Imports from India Variable MODEL 1 MODEL 2 MODEL 3 MODEL 4 Variable MODEL 1 MODEL 2 MODEL 3 MODEL 4
CONSTANT 313.62*
(2.01) 93.75 (0.51)
313.87*
(1.76) 243.46 (1.62)
CONSTANT 105.26 (0.48)
138.92 (0.41)
180.43 (0.68)
-9.34 (-0.03)
LRPGDP0 3.62 (1.73)
0.02 (0.01)
3.42 (1.24)
0.41 (0.19)
LRPGDP0 2.25 (0.76)
-2.34 (-0.58)
5.03 (1.23)
-3.17 (-0.83)
LRPGDP1 8.00**
(2.68) 7.27**
(2.49) 8.78**
(2.64) 7.50**
(2.61) LRPGDP1 6.43
(1.52) 6.32
(1.17) 8.26
(1.67) 6.57
(1.27) LPOP0 8.60
(0.68) 2.13
(0.11) 9.33
(0.51) -16.94 (-1.20)
LPOP0 11.02 (0.62)
-44.74 (-1.23)
37.24 (1.38)
-29.33 (-1.16)
LPOP1 -26.42 (-1.50)
-7.68 (-0.37)
-27.29 (-1.14)
4.44 (0.23)
LPOP1 -18.04 (-0.72)
39.29 (1.01)
-49.59 (-1.39)
30.73 (0.90)
LEXRATE -0.37 (-0.52)
LEXRATE -2.37**
(-2.26)
LRER -1.06**
(-2.18) LRER -2.55**
(-3.70)
LCPI -0.75 (-0.72)
-1.78**
(-2.61) LCPI -3.77*
(-1.93) -2.42
(-1.99) D1 0.57
(1.31) D1 -0.72
(-0.89)
D2 0.17 (0.55)
D2 0.13 (0.23)
DIAGNOSTIC TEST DIAGNOSTIC TEST
Adj. 2R 0.952 0.957 0.940 0.957 Adj. 2R 0.932 0.893 0.905 0.900
F-STAT. 88.89 70.354 69.882 97.874 F-STAT. 61.149 27.180 43.076 40.669 DWa 1.749 1.454 0.325 1.537 DWa 1.583 1.473 1.199 1.542
OBSERVATION 23 23 23 23 OBSERVATION 23 23 23 23 Note: The figures in parentheses are the absolute t-statistics. * and ** denote significance at the 10% and 5% levels, respectively.
a Durbin-Watson Statistic

Table 13. Regression estimates for China export (import) function to (from) Indonesia
Dependent Variable: China Exports to Indonesia Dependent Variable: China Imports from Indonesia Variable MODEL 1 MODEL 2 MODEL 3 MODEL 4 Variable MODEL 1 MODEL 2 MODEL 3 MODEL 4
CONSTANT -176.63**
(-2.41) -183.65 (-1.38)
-197.31**
(-2.49) -172.30*
(-1.86) CONSTANT -596.99**
(-4.89) -430.38**
(-2.35) -637.66**
(-6.22) -636.03**
(-4.46) LRPGDP0 1.45
(1.51) 0.57
(0.38) 1.33
(1.28) 0.69
(0.59) LRPGDP0 -6.05**
(-3.77) -5.16**
(-2.48) -5.76**
(-4.28) -7.18**
(-3.98) LRPGDP1 -0.31E-3
(-0.47E-3) 1.59
(1.12) -1.25
(-1.17) 1.84
(1.36) LRPGDP1 -0.52
(-0.47) -1.49
(-0.77) -3.99**
(-2.88) -1.37
(-0.66) LPOP0 8.47
(0.95) 8.57
(0.65) 2.01
(0.21) 9.86
(0.81) LPOP0 -24.39
(-1.64) -49.29**
(-2.74) -36.97**
(-2.92) -37.51*
(-2.00) LPOP1 0.78
(0.08) 0.47
(0.03) 9.39
(0.90) -1.64
(-0.12) LPOP1 61.59**
(3.94) 80.08**
(4.17) 78.70**
(5.85) 78.56**
(3.79) LEXRATE 0.52**
(2.63) LEXRATE 1.12**
(4.42)
LRER 0.60**
(3.32) LRER 0.88**
(2.89)
LCPI 0.40 (0.90)
0.29 (0.70)
LCPI -0.76 (-1.25)
-0.87 (-1.34)
D1 0.15 (0.57)
D1 -0.27 (-0.74)
D2 -0.24 (-1.05)
D2 -0.60*
(-1.94)
DIAGNOSTIC TEST DIAGNOSTIC TEST
Adj. 2R 0.989 0.981 0.987 0.982 Adj. 2R 0.966 0.962 0.976 0.954
F-STAT. 403.909 174.898 346.131 256.147 F-STAT. 129.916 83.281 186.411 96.686 DWa 2.494 2.406 2.471 2.095 DWa 1.188 1.653 1.878 1.073
OBSERVATION 24 24 24 24 OBSERVATION 24 24 24 24 Note: The figures in parentheses are the absolute t-statistics. * and ** denote significance at the 10% and 5% levels, respectively.
a Durbin-Watson Statistic

Table 14. Regression estimates for China export (import) function to (from) Iran
Dependent Variable: China Exports to Iran Dependent Variable: China Imports from Iran Variable MODEL 1 MODEL 2 MODEL 3 MODEL 4 Variable MODEL 1 MODEL 2 MODEL 3 MODEL 4
CONSTANT -327.20 (-1.18)
-281.76 (-0.97)
-332.47 (-1.19)
-325.52 (-1.21)
CONSTANT -617.39 (-0.75)
-497.13 (-0.61)
-601.77 (-0.73)
-686.16 (-0.84)
LRPGDP0 -0.10 (-0.05)
-0.49 (-0.16)
-0.09 (-0.05)
-2.03 (-0.93)
LRPGDP0 -0.42 (-0.11)
11.81 (1.51)
-0.52 (-0.13)
2.48 (0.49)
LRPGDP1 2.12*
(1.84) 1.30
(0.93) 2.14*
(1.82) 1.44
(1.14) LRPGDP1 -0.46
(-0.17) -0.77
(-0.27) -0.47
(-0.17) 0.05
(0.02) LPOP0 21.31
(1.25) 19.52 (1.12)
21.39 (1.25)
19.45 (1.17)
LPOP0 18.95 (0.31)
32.11 (0.51)
17.75 (0.29)
28.57 (0.45)
LPOP1 -6.31 (-1.04)
-6.47 (-0.88)
-6.13 (-0.98)
-3.53 (-0.62)
LPOP1 13.69 (0.48)
-11.63 (-0.35)
14.27 (0.50)
5.43 (0.17)
LEXRATE 0.05 (0.29)
LEXRATE -0.09 (-0.25)
LRER 0.07 (0.44)
LRER -0.10 (-0.32)
LCPI 0.85 (0.66)
1.06 (1.09)
LCPI -3.73 (-1.23)
-1.46 (0.63)
D1 -0.43 (-0.75)
D1 -1.97 (-1.55)
D2 -0.08 (-0.13)
D2 -0.10 (-0.09)
DIAGNOSTIC TEST DIAGNOSTIC TEST
Adj. 2R 0.763 0.756 0.762 0.775 Adj. 2R 0.888 0.893 0.888 0.890
F-STAT. 15.820 11.180 15.702 16.879 F-STAT. 31.070 23.710 30.985 31.796 DWa 2.374 2.375 2.359 2.328 DWa 2.845 2.816 2.848 2.759
OBSERVATION 24 24 24 24 OBSERVATION 20 20 20 20 Note: The figures in parentheses are the absolute t-statistics. * and ** denote significance at the 10% and 5% levels, respectively.
a Durbin-Watson Statistic

Table 15. Regression estimates for China export (import) function to (from) Ireland
Dependent Variable: China Exports to Ireland Dependent Variable: China Imports from Ireland Variable MODEL 1 MODEL 2 MODEL 3 MODEL 4 Variable MODEL 1 MODEL 2 MODEL 3 MODEL 4
CONSTANT 235.76 (0.95)
-428.56 (-0.81)
-37.62 (-0.14)
-463.16 (-0.651)
CONSTANT -1286.50**
(-4.10) -1304.10 (-1.58)
-809.60**
(-2.22) -1427.0*
(-2.06) LRPGDP0 2.47
(1.71) -0.39
(-0.16) 0.77
(0.43) -0.586 (-0.24)
LRPGDP0 -2.43 (-1.33)
-3.74 (-0.97)
-0.24 (-0.10)
-4.06 (-1.15)
LRPGDP1 3.82**
(2.69) 1.64
(0.65) 3.30**
(3.33) 0.62
(0.31) LRPGDP1 -3.27*
(-1.82) -1.65
(-0.42) -1.27
(-0.95) -2.51
(-0.87) LPOP0 -13.26
(-1.42) 1.81
(0.13) -8.84
(-1.15) 6.02
(0.45) LPOP0 34.35*
(2.89) 30.12 (1.44)
21.96**
(2.10) 32.14 (1.69)
LPOP1 0.39 (0.06)
26.67 (1.25)
13.35 (1.21)
23.80 (1.40)
LPOP1 42.09**
(4.92) 48.47 (1.45)
25.44 (1.70)
54.67**
(2.25) LEXRATE 0.73
(1.48) LEXRATE -0.98
(-1.46)
LRER 0.29 (0.58)
LRER -1.05 (-1.67)
LCPI -1.54 (-1.07)
-1.39 (-1.50)
LCPI -0.15 (-0.06)
-0.67 (-0.51)
D1 -0.09 (-0.16)
D1 0.24 (0.29)
D2 -0.65*
(-1.83) D2 -0.08
(-0.14)
DIAGNOSTIC TEST DIAGNOSTIC TEST
Adj. 2R 0.969 0.974 0.972 0.972 Adj. 2R 0.956 0.944 0.954 0.950
F-STAT. 146.239 124.887 161.319 161.894 F-STAT. 100.672 56.289 97.262 87.945 DWa 1.094 1.350 1.065 0.837 DWa 2.167 2.089 2.054 2.060
OBSERVATION 24 24 24 24 OBSERVATION 24 24 24 24 Note: The figures in parentheses are the absolute t-statistics. * and ** denote significance at the 10% and 5% levels, respectively.
a Durbin-Watson Statistic

Table 16. Regression estimates for China export (import) function to (from) Italy
Dependent Variable: China Exports to Italy Dependent Variable: China Imports from Italy Variable MODEL 1 MODEL 2 MODEL 3 MODEL 4 Variable MODEL 1 MODEL 2 MODEL 3 MODEL 4
CONSTANT -234.24 (-0.57)
1279.60**
(2.53) -237.50 (-0.59)
1130.1**
(2.79) CONSTANT 1794.00**
(3.74) 1432.00*
(1.87) 1731.4**
(3.61) 2571.8**
(3.67) LRPGDP0 1.15
(1.51) 2.26**
(3.58) 1.09
(1.45) 2.10**
(4.12) LRPGDP0 2.73**
(3.07) 3.38**
(3.53) 2.68**
(3.01) 2.61**
(2.95) LRPGDP1 7.48**
(2.20) 0.49
(0.15) 7.16*
(2.08) 2.73
(1.14) LRPGDP1 -6.94*
(-1.75) -5.01
(-0.99) -6.79
(-1.67) -13.86**
(-3.35) LPOP0 -8.74
(-1.41) -0.98
(-0.15) -7.97
(-1.27) -4.00
(-1.09) LPOP0 12.65*
(1.74) 4.23
(0.43) 12.57 (1.69)
25.09**
(3.94) LPOP1 20.00
(0.88) -69.99**
(-2.19) 19.48 (0.86)
-59.34**
(-2.54) LPOP1 -111.18**
(-4.18) -82.20 (-1.69)
-107.66**
(-4.02) -165.20**
(-4.09) LEXRATE 0.01
(0.45) LEXRATE -0.05*
(-1.91)
LRER 0.006 (0.25)
LRER -0.05*
(-2.00)
LCPI -1.40**
(-4.40) -1.17**
(-4.55) LCPI -0.43
(-0.90) -0.83*
(-1.86) D1 -0.17
(-0.79) D1 -0.20
(-0.62)
D2 0.13 (0.79)
D2 -0.64**
(-2.61)
DIAGNOSTIC TEST DIAGNOSTIC TEST
Adj. 2R 0.969 0.985 0.969 0.986 Adj. 2R 0.944 0.955 0.943 0.942
F-STAT. 144.570 218.914 145.691 313.545 F-STAT. 78.259 70.068 76.907 76.226 DWa 0.852 1.250 0.858 1.224 DWa 1.815 1.948 1.778 1.899
OBSERVATION 24 24 24 24 OBSERVATION 24 24 24 24 Note: The figures in parentheses are the absolute t-statistics. * and ** denote significance at the 10% and 5% levels, respectively.
a Durbin-Watson Statistic

Table 17. Regression estimates for China export (import) function to (from) Japan
Dependent Variable: China Exports to Japan Dependent Variable: China Imports from Japan Variable MODEL 1 MODEL 2 MODEL 3 MODEL 4 Variable MODEL 1 MODEL 2 MODEL 3 MODEL 4
CONSTANT 364.17*
(1.76) 128.61 (0.68)
456.41**
(2.26) 116.50 (0.65)
CONSTANT 371.02 (1.37)
416.27 (1.47)
191.32 (0.71)
295.23 (0.90)
LRPGDP0 2.08**
(3.10) 1.02
(1.48) 2.24**
(3.27) 0.98
(1.57) LRPGDP0 3.46**
(3.95) 4.53**
(4.36) 2.90**
(3.18) 3.53**
(3.09) LRPGDP1 1.94
(1.04) -1.29
(-0.62) 1.33
(0.63) -1.87
(-1.09) LRPGDP1 -1.46
(-0.60) -1.14
(-0.36) -2.25
(-0.80) 0.82
(0.26) LPOP0 -0.50
(-0.07) 4.53
(0.71) -0.18
(-0.02) 4.63
(0.75) LPOP0 -12.16
(-1.22) -13.26 (-1.37)
-10.63 (-1.00)
-14.40 (-1.28)
LPOP1 -19.53*
(-1.82) -10.14 (-1.08)
-24.52**
(-2.34) -9.18
(-1.03) LPOP1 -5.31
(-0.38) -7.10
(-0.50) 3.30
(0.24) -0.16
(-0.01) LEXRATE 0.03
(0.17) LEXRATE 0.32
(1.52)
LRER -0.21 (-1.25)
LRER 0.48**
(2.17)
LCPI -0.69 (-1.45)
-0.96**
(-3.65) LCPI 0.24
(0.33) 0.36
(0.75) D1 0.15
(0.68) D1 -0.12
(-0.36)
D2 -0.04 (-0.36)
D2 -0.52**
(-2.94)
DIAGNOSTIC TEST DIAGNOSTIC TEST
Adj. 2R 0.973 0.982 0.971 0.983 Adj. 2R 0.942 0.948 0.935 0.929
F-STAT. 165.70 176.927 152.367 267.034 F-STAT. 75.720 61.150 67.311 61.259 DWa 1.256 1.628 1.378 1.534 DWa 1.749 2.087 1.467 1.324
OBSERVATION 24 24 24 24 OBSERVATION 24 24 24 24 Note: The figures in parentheses are the absolute t-statistics. * and ** denote significance at the 10% and 5% levels, respectively.
a Durbin-Watson Statistic

Table 18. Regression estimates for China export (import) function to (from) Korea
Dependent Variable: China Exports to Korea Dependent Variable: China Imports from Korea Variable MODEL 1 MODEL 2 MODEL 3 MODEL 4 Variable MODEL 1 MODEL 2 MODEL 3 MODEL 4
CONSTANT -195.65 (-0.12)
-14.97 (-0.01)
-81.72 (-0.05)
998.68 (0.78)
CONSTANT 1878.20 (0.82)
1282.50 (0.49)
1163.00 (0.47)
2465.8 (1.40)
LRPGDP0 0.47 (0.06)
0.24 (0.02)
-0.01 (0.001)
5.27 (0.64)
LRPGDP0 16.71 (1.39)
12.86 (0.84)
12.28 (0.88)
18.24 (1.61)
LRPGDP1 2.36 (0.51)
5.38 (1.35)
3.97 (0.96)
5.79 (1.62)
LRPGDP1 -3.12 (-0.46)
-0.74 (-0.14)
-3.05 (-0.53)
-0.33 (-0.07)
LPOP0 -37.09 (-1.15)
-33.82 (-0.81)
-21.27 (-0.62)
-27.34 (-0.73)
LPOP0 -34.68 (-0.74)
-25.90 (-0.47)
-15.95 (-0.34)
-17.64 (-0.34)
LPOP1 55.42 (0.52)
39.55 (0.31)
29.28 (0.28)
-27.85 (-0.35)
LPOP1 -68.14 (-0.44)
-44.22 (-0.26)
-48.25 (-0.33)
-123.88 (-1.15)
LEXRATE 0.81 (0.79)
LEXRATE 1.23 (0.86)
LRER 1.60 (1.06)
LRER 1.32 (0.60)
LCPI -0.70 (-0.36)
-0.14 (-0.13)
LCPI -2.67 (-1.05)
-0.73 (-0.49)
D1 -0.26 (-0.31)
D1 -1.03 (-0.93)
D2 -0.49 (-0.73)
D2 -0.60 (-0.69)
DIAGNOSTIC TEST DIAGNOSTIC TEST
Adj. 2R 0.884 0.840 0.877 0.868 Adj. 2R 0.879 0.865 0.884 0.877
F-STAT. 20.824 10.776 19.580 18.094 F-STAT. 19.804 12.861 20.784 19.480 DWa 1.854 1.930 1.714 1.844 DWa 1.340 1.516 1.308 1.332
OBSERVATION 14 14 14 14 OBSERVATION 14 14 14 14 Note: The figures in parentheses are the absolute t-statistics. * and ** denote significance at the 10% and 5% levels, respectively.
a Durbin-Watson Statistic

Table 19. Regression estimates for China export (import) function to (from) Malaysia
Dependent Variable: China Exports to Malaysia Dependent Variable: China Imports from Malaysia Variable MODEL 1 MODEL 2 MODEL 3 MODEL 4 Variable MODEL 1 MODEL 2 MODEL 3 MODEL 4
CONSTANT 106.57 (1.24)
196.00 (1.30)
93.58 (0.96)
136.74 (1.61)
CONSTANT -141.15 (-1.21)
141.61 (0.65)
-189.37 (-1.37)
-5.72 (-0.46)
LRPGDP0 -0.52 (-0.35)
-1.56 (-0.93)
-0.16 (-0.09)
-1.22 (-0.81)
LRPGDP0 0.29 (0.14)
-3.13 (-1.27)
1.66 (0.63)
-2.87 (-1.30)
LRPGDP1 1.57**
(2.20) 0.92
(0.78) 0.96*
(1.89) 1.16
(1.11) LRPGDP1 0.75
(0.78) -1.37
(-0.80) 2.33 -1.19
(1.58) (-0.78) LPOP0 -14.47** -25.53** -19.14**
(-3.40) -12.34 LPOP0
(-2.32) (-2.30) (-1.30) 4.38
(0.52) -29.51*
(-1.82) 12.32 (0.91)
-16.59*
(-2.01) LPOP1 12.33*
(1.86) 21.58**
(2.43) 10.12 (1.04)
16.86**
(2.61) LPOP1 3.79
(0.42) 31.82**
(2.46) -4.52
(-0.33) 24.20**
(2.55) LEXRATE -0.27
(-0.64) LEXRATE -1.09*
(-1.85)
LRER -0.24 (-0.75)
LRER -1.03**
(-2.38)
LCPI -0.36 (-0.55)
-0.22 (-0.41)
LCPI -1.47 (-1.53)
-1.07 (-1.36)
D1 -0.06 (-0.17)
D1 -0.27 (-0.56)
D2 -0.21 (-0.81)
D2 -0.30 (-0.81)
DIAGNOSTIC TEST DIAGNOSTIC TEST
Adj. 2R 0.968 0.965 0.968 0.968 Adj. 2R 0.961 0.950 0.957 0.953
F-STAT. 142.264 92.106 141.111 139.163 F-STAT. 113.417 63.579 102.336 94.586 DWa 0.718 1.043 0.707 0.727 DWa 1.099 1.407 1.086 1.126
OBSERVATION 24 24 24 24 OBSERVATION 24 24 24 24 Note: The figures in parentheses are the absolute t-statistics. * and ** denote significance at the 10% and 5% levels, respectively
a Durbin-Watson Statistic

Table 20. Regression estimates for China export (import) function to (from) Mexico
Dependent Variable: China Exports to Mexico Dependent Variable: China Imports from Mexico Variable MODEL 1 MODEL 2 MODEL 3 MODEL 4 Variable MODEL 1 MODEL 2 MODEL 3 MODEL 4
CONSTANT -391.93 (-1.60)
-773.69**
(-2.26) -636.72**
(-2.70) -703.78**
(-2.45) CONSTANT 244.78
(0.78) 281.28 (0.68)
216.72 (0.68)
LRPGDP0 2.24 (0.76)
1.28 (0.36)
0.28 (0.09)
0.07 (0.02)
LRPGDP0 2.15 (0.58)
6.17 (1.42)
2.01 (0.50)
LRPGDP1 13.49**
(5.81) 8.80
(2.13) 8.97**
(2.43) 10.37**
(3.33) LRPGDP1 2.22
(0.75) 1.73
(0.35) 2.35
(0.47)
LPOP0 32.13 (1.58)
46.03*
(2.01) 33.63*
(1.90) 38.62*
(2.10) LPOP0 -18.77
(-0.72) -14.48 (-0.52)
-17.50 (-0.73)
LPOP1 -20.98 (-0.96)
-13.42 (-0.56)
-6.66 (-0.29)
-9.15 (-0.40)
LPOP1 7.39 (0.27)
-0.50 (-0.02)
7.46 (0.24)
LEXRATE 0.52 (1.46)
LEXRATE 0.005 (0.01)
LRER 0.05 (0.07)
LRER 0.11 (0.12)
LCPI -0.73 (-1.60)
-0.44 (-1.32)
LCPI -0.51 (-0.92)
D1 -0.61 (-1.01)
D1 -1.43*
(-1.96)
D2 0.08 (0.16)
D2 -0.47 (-0.74)
DIAGNOSTIC TEST DIAGNOSTIC TEST
Adj. 2R 0.948 0.950 0.954 0.953 Adj. 2R 0.626 0.673 0.625
F-STAT. 85.647 63.804 96.209 94.208 F-STAT. 8.693 7.770 8.682 DWa 1.234 1.310 1.182 1.215 DWa 0.956 1.040 0.947
OBSERVATION 24 24 24 24 OBSERVATION 24 24 24 Note: The figures in parentheses are the absolute t-statistics. * and ** denote significance at the 10% and 5% levels, respectively
a Durbin-Watson Statistic

Table 21. Regression estimates for China export (import) function to (from) Netherlands
Dependent Variable: China Exports to Netherlands Dependent Variable: China Imports from Netherlands Variable MODEL 1 MODEL 2 MODEL 3 MODEL 4 Variable MODEL 1 MODEL 2 MODEL 3 MODEL 4
CONSTANT -494.14**
(-2.57) -566.98**
(-3.00) -426.78**
(-2.16) -441.92**
(-2.57) CONSTANT 280.66
(1.45) 491.63**
(2.81) 302.91 (1.55)
268.36 (1.42)
LRPGDP0 0.52 (0.66)
-0.12 (-0.14)
0.63 (0.79)
0.52 (0.71)
LRPGDP0 1.91**
(2.39) 3.40**
(4.05) 1.93**
(2.43) 1.87**
(2.34) LRPGDP1 1.15
(0.69) -1.75
(-0.80) 0.86
(0.50) 0.59
(0.39) LRPGDP1 1.55
(0.92) 4.91**
(2.42) 1.37
(0.81) 1.50
(0.89) LPOP0 -13.81**
(-3.26) -12.63 (-1.74)
-15.03**
(-3.25) -17.19**
(-4.11) LPOP0 8.74*
(2.04) -5.84
(-0.87) 7.72
(1.69) 8.27*
(1.81) LPOP1 47.73**
(3.30) 52.83**
(3.59) 45.30**
(3.13) 49.32**
(3.72) LPOP1 -28.45*
(-1.95) -25.30*
(-1.85) -28.41*
(-1.98) -27.04 (-1.86)
LEXRATE 0.12 (0.50)
LEXRATE 0.15 (0.65)
LRER -0.17 (-0.83)
LRER 0.07 (0.32)
LCPI -0.66 (-1.56)
-0.53*
(-2.01) LCPI -0.29
(-0.73) -0.10
(-0.36) D1 0.01
(0.05) D1 -0.34
(-1.41)
D2 0.33 (1.53)
D2 -0.52**
(-2.58)
DIAGNOSTIC TEST DIAGNOSTIC TEST
Adj. 2R 0.979 0.982 0.978 0.982 Adj. 2R 0.957 0.970 0.958 0.957
F-STAT. 214.318 185.089 209.170 253.146 F-STAT. 102.929 106.508 104.835 103.063 DWa 1.993 2.372 1.989 2.367 DWa 1.241 1.865 1.297 1.187
OBSERVATION 24 24 24 24 OBSERVATION 24 24 24 24 Note: The figures in parentheses are the absolute t-statistics. * and ** denote significance at the 10% and 5% levels, respectively
a Durbin-Watson Statistic

Table 22. Regression estimates for China export (import) function to (from) New Zealand
Dependent Variable: China Exports to New Zealand Dependent Variable: China Imports from New Zealand Variable MODEL 1 MODEL 2 MODEL 3 MODEL 4 Variable MODEL 1 MODEL 2 MODEL 3 MODEL 4
CONSTANT -361.83**
(-2.16) -289.37*
(-1.80) -336.20**
(-2.11) -272.77 (-1.65)
CONSTANT 577.28**
(2.71) 528.25**
(2.39) 518.43**
(2.42) 507.77**
(2.29) LRPGDP0 -1.51
(-1.04) -0.67
(-0.51) -1.41
(-1.03) -0.72
(-0.53) LRPGDP0 5.69**
(3.07) 4.90**
(2.71) 5.12**
(2.78) 4.67**
(2.58) LRPGDP1 -1.66
(-1.09) -0.06
(-0.03) -0.69
(-0.40) -0.67
(-0.34) LRPGDP1 -0.11
(-0.06) 2.79
(0.98) -0.60
(-0.26) 0.98
(0.38) LPOP0 -8.25
(-1.60) -6.57
(-1.10) -5.77
(-1.20) -2.93
(-0.51) LPOP0 -13.17*
(-2.00) -15.31*
(-1.87) -16.54**
(-2.55) -14.99*
(-1.95) LPOP1 38.34**
(4.86) 30.10**
(3.08) 32.53**
(5.50) 24.27**
(2.66) LPOP1 -20.95*
(-2.09) -15.99 (-1.19)
-11.86 (-1.49)
-14.11 (-1.16)
LEXRATE 0.32 (1.58)
LEXRATE -0.25 (-0.94)
LRER 0.33 (1.24)
LRER -0.51 (-1.47)
LCPI -0.70 (-1.27)
-0.45 (-1.15)
LCPI -0.97 (-1.28)
-0.15 (-0.29)
D1 -0.31 (-1.02)
D1 -0.63 (-1.51)
D2 -0.31*
(-1.76) D2 -0.08
(-0.32)
DIAGNOSTIC TEST DIAGNOSTIC TEST
Adj. 2R 0.976 0.978 0.978 0.976 Adj. 2R 0.863 0.849 0.853 0.847
F-STAT. 191.637 146.730 201.318 189.561 F-STAT. 29.891 19.493 27.748 26.429 DWa 1.191 1.617 1.162 1.189 DWa 1.400 1.734 1.375 1.364
OBSERVATION 24 24 24 24 OBSERVATION 24 24 24 24 Note: The figures in parentheses are the absolute t-statistics. * and ** denote significance at the 10% and 5% levels, respectively
a Durbin-Watson Statistic

Table 23. Regression estimates for China export (import) function to (from) Norway
Dependent Variable: China Exports to Norway Dependent Variable: China Imports from Norway Variable MODEL 1 MODEL 2 MODEL 3 MODEL 4 Variable MODEL 1 MODEL 2 MODEL 3 MODEL 4
CONSTANT -339.94 (-0.88)
142.96 (0.25)
-11.22 (-0.03)
96.49 (0.22)
CONSTANT 216.01 (0.55)
12.65 (0.03)
87.99 (0.30)
-264.10 (-0.90)
LRPGDP0 0.93 (0.37)
2.90 (0.84)
1.99 (0.83)
2.52 (0.91)
LRPGDP0 1.29 (0.51)
1.08 (0.49)
1.06 (0.54)
-0.22 (-0.12)
LRPGDP1 1.96 (0.48)
-0.03 (-0.004)
0.62 (0.16)
-0.30 (-0.07)
LRPGDP1 2.52 (0.61)
1.13 (0.29)
2.59 (0.81)
4.41 (1.46)
LPOP0 -16.63*
(-1.78) -5.07
(-0.45) -12.94 (-1.61)
-1.99 (-0.25)
LPOP0 8.38 (0.88)
8.96 (1.24)
16.30**
(2.46) 4.82
(0.92) LPOP1 44.50*
(1.78) -2.03
(-0.06) 18.45 (0.95)
-2.98 (-0.13)
LPOP1 -26.58 (-1.05)
-13.49 (-0.58)
-28.99*
(-1.81) 8.55
(0.54) LEXRATE 1.00**
(2.62) LEXRATE -1.06**
(-3.41)
LRER 1.35**
(2.39) LRER -0.36
(-0.62)
LCPI -0.94 (-1.00)
-0.60 (-1.05)
LCPI 1.41**
(2.35) 1.53**
(4.01) D1 -0.31
(-0.49) D1 0.11
(0.28)
D2 -0.02 (-0.04)
D2 0.47 (1.31)
DIAGNOSTIC TEST DIAGNOSTIC TEST
Adj. 2R 0.938 0.915 0.941 0.923 Adj. 2R 0.887 0.938 0.930 0.939
F-STAT. 70.910 36.371 74.507 56.381 F-STAT. 37.002 50.602 61.778 71.640 DWa 1.884 1.947 2.085 1.876 DWa 0.904 1.810 1.660 1.823
OBSERVATION 24 24 24 24 OBSERVATION 24 24 24 24 Note: The figures in parentheses are the absolute t-statistics. * and ** denote significance at the 10% and 5% levels, respectively
a Durbin-Watson Statistic

Table 24. Regression estimates for China export (import) function to (from) Philippines
Dependent Variable: China Exports to Philippines Dependent Variable: China Imports from Philippines Variable MODEL 1 MODEL 2 MODEL 3 MODEL 4 Variable MODEL 1 MODEL 2 MODEL 3 MODEL 4
CONSTANT 534.36**
(5.22) 368.97**
(2.83) 528.75**
(5.39) 494.89**
(5.19) CONSTANT 469.34**
(2.35) 507.75**
(2.22) 418.58**
(2.25) 432.19**
(2.70) LRPGDP0 6.34**
(3.49) 3.48
(1.38) 5.09**
(2.58) 4.06
(1.62) LRPGDP0 0.60
(0.17) 8.05*
(1.82) 2.63
(0.70) 7.71
(1.83) LRPGDP1 3.81**
(3.50) 1.65
(0.86) 2.54**
(2.27) 1.17
(0.64) LRPGDP1 1.47
(0.69) 8.67**
(2.58) 2.90
(1.37) 8.00**
(2.62) LPOP0 -21.17*
(-1.88) -19.19 (-1.15)
-27.45**
(-2.17) -30.17*
(-2.03) LPOP0 -49.02**
(-2.23) -15.26 (-0.52)
-34.24 (-1.43)
-8.83 (-0.35)
LPOP1 -7.60 (-0.66)
1.08 (0.06)
0.90 (0.07)
7.00 (0.42)
LPOP1 31.12 (1.39)
-16.15 (-0.54)
15.50 (0.62)
-19.02 (-0.67)
LEXRATE 0.42 (1.72)
LEXRATE -0.62 (-1.34)
LRER 0.58 (1.54)
LRER -0.33 (-0.45)
LCPI -0.14 (-0.20)
-0.80 (-1.45)
LCPI 2.43*
(1.92) 2.31**
(2.51) D1 0.51
(1.46) D1 -0.01
(-0.02)
D2 0.11 (0.46)
D2 -0.37 (-0.84)
DIAGNOSTIC TEST DIAGNOSTIC TEST
Adj. 2R 0.943 0.943 0.945 0.942 Adj. 2R 0.882 0.905 0.891 0.911
F-STAT. 77.062 55.378 79.425 75.992 F-STAT. 35.332 32.161 38.759 48.332 DWa 2.197 2.451 2.288 2.312 DWa 1.311 1.312 1.366 1.300
OBSERVATION 24 24 24 24 OBSERVATION 24 24 24 24 Note: The figures in parentheses are the absolute t-statistics. * and ** denote significance at the 10% and 5% levels, respectively
a Durbin-Watson Statistic

Table 25. Regression estimates for China export (import) function to (from) Russia
Dependent Variable: China Exports to Russia Dependent Variable: China Imports from Russia Variable MODEL 1 MODEL 2 MODEL 3 MODEL 4 Variable MODEL 1 MODEL 2 MODEL 3 MODEL 4
CONSTANT 798.90 (1.05)
484.32 (0.66)
-129.22 (-0.17)
359.97 (0.46)
CONSTANT -41.02 (-0.08)
36.82 (0.08)
-234.22 (-0.33)
117.22 (0.18)
LRPGDP0 -3.77 (-0.72)
0.33 (0.08)
-2.01 (-0.49)
-1.92 (-0.40)
LRPGDP0 -1.97 (-0.56)
1.51 (0.55)
-0.57 (-0.15)
-1.34 (-0.34)
LRPGDP1 0.51 (0.27)
-1.33 (-0.93)
-0.03 (-0.02)
-0.51 (-0.31)
LRPGDP1 1.75 (1.40)
0.49 (0.55)
0.86 (0.72)
1.15 (0.85)
LPOP0 16.20 (0.44)
10.86 (0.39)
34.40 (1.15)
21.34 (0.65)
LPOP0 17.57 (0.72)
3.42 (0.19)
17.79 (0.64)
11.25 (0.42)
LPOP1 -58.29 (-1.63)
-36.18 (-1.11)
-29.58 (-0.94)
-40.84 (-1.16)
LPOP1 -16.24 (-0.68)
-5.29 (-0.26)
-6.34 (-0.22)
-17.61 (-0.61)
LEXRATE 0.49*
(1.95) LEXRATE 0.13
(0.58)
LRER 0.06 (0.17)
LRER 0.31 (1.25)
LCPI -0.17 (-0.69)
-0.26 (-1.19)
LCPI 0.04 (0.27)
0.05 (0.30)
D1 -0.79 (-1.66)
D1 -0.55 (-1.85)
D2 -0.43 (-1.44)
D2 -0.52**
(-2.81)
DIAGNOSTIC TEST DIAGNOSTIC TEST
Adj. 2R 0.427 0.676 0.648 0.534 Adj. 2R 0.693 0.846 0.633 0.618
F-STAT. 2.641 4.271 5.046 3.522 F-STAT. 5.969 9.601 4.796 4.563 DWa 2.201 2.209 2.685 2.061 DWa 2.451 1.936 1.948 1.914
OBSERVATION 12 12 12 12 OBSERVATION 12 12 12 12 Note: The figures in parentheses are the absolute t-statistics. * and ** denote significance at the 10% and 5% levels, respectively
a Durbin-Watson Statistic

Table 26. Regression estimates for China export (import) function to (from) Saudi Arabia
Dependent Variable: China Exports to Saudi Arabia Dependent Variable: China Imports from Saudi Arabia Variable MODEL 1 MODEL 2 MODEL 3 MODEL 4 Variable MODEL 1 MODEL 2 MODEL 3 MODEL 4
CONSTANT -151.98 (-0.86)
-275.42 (-1.24)
-272.83 (-1.45)
-290.40 (-1.42)
CONSTANT 509.14 (1.61)
625.57 (1.51)
468.37 (1.30)
606.58 (1.58)
LRPGDP0 1.10*
(1.85) 1.48
(1.35) 1.08*
(1.97) 1.32**
(2.41) LRPGDP0 5.09**
(4.74) 5.39**
(2.64) 5.32**
(5.10) 5.34**
(5.20) LRPGDP1 1.19
(1.57) 1.39
(1.70) 1.11
(1.54) 1.25
(1.72) LRPGDP1 0.32
(0.24) 0.86
(0.57) 0.43
(0.31) 0.50
(0.37) LPOP0 8.24
(0.72) 14.69 (1.07)
14.90 (1.25)
15.91 (1.25)
LPOP0 -29.29 (-1.43)
-36.87 (-1.45)
-26.82 (-1.19)
-34.34 (-1.44)
LPOP1 -1.03 (-0.28)
-2.20 (-0.51)
-2.08 (-0.58)
-2.65 (-0.70)
LPOP1 5.31 (0.79)
7.36 (0.92)
4.49 (0.65)
5.68 (0.80)
LEXRATE -0.50 (-1.46)
LEXRATE -0.20 (-0.31)
LRER -0.31 (-0.67)
LRER -0.66 (-0.80)
LCPI 0.75 (1.16)
0.61 (1.25)
LCPI 7.36 (0.92)
-0.37 (-0.41)
D1 0.05 (0.16)
D1 0.25 (0.41)
D2 -0.10 (-0.47)
D2 -0.22 (-0.56)
DIAGNOSTIC TEST DIAGNOSTIC TEST
Adj. 2R 0.946 0.943 0.950 0.949 Adj. 2R 0.962 0.957 0.960 0.961
F-STAT. 81.094 55.640 88.889 86.272 F-STAT. 116.119 74.065 112.632 113.132 DWa 1.356 1.444 1.570 1.418 DWa 1.670 1.407 1.513 1.489
OBSERVATION 24 24 24 24 OBSERVATION 24 24 24 24 Note: The figures in parentheses are the absolute t-statistics. * and ** denote significance at the 10% and 5% levels, respectively
a Durbin-Watson Statistic

Table 27. Regression estimates for China export (import) function to (from) Singapore
Dependent Variable: China Exports to Singapore Dependent Variable: China Imports from Singapore Variable MODEL 1 MODEL 2 MODEL 3 MODEL 4 Variable MODEL 1 MODEL 2 MODEL 3 MODEL 4
CONSTANT 21.54 (0.20)
6.58 (0.04)
-0.26 (-0.002)
41.23 (0.39)
CONSTANT -109.27 (-0.93)
63.43 (0.51)
-40.53 (-0.27)
-148.65 (-1.52)
LRPGDP0 1.39 (1.07)
2.64*
(1.86) 1.97
(1.27) 2.80**
(2.24) LRPGDP0 6.98**
(5.02) 3.79**
(3.39) 5.81**
(2.80) 3.01**
(2.60) LRPGDP1 -1.23
(-1.41) 0.50
(0.40) -0.81
(-0.62) 0.65
(0.59) LRPGDP1 0.46
(0.49) -3.81**
(-3.87) -0.09
(-0.05) -4.65**
(-4.52) LPOP0 -1.40
(-0.27) 1.71
(0.20) 1.71
(0.33) -0.04
(-0.01) LPOP0 20.32**
(3.66) 3.47
(0.51) 12.07 (1.73)
15.14**
(3.67) LPOP1 2.15
(0.53) -3.16 (0.64)
-1.18 (-0.24)
-3.15 (-1.01)
LPOP1 -22.59**
(-5.27) -5.58
(-1.44) -14.98**
(-2.24) -7.06**
(-2.45) LEXRATE -0.01
(-0.03) LEXRATE -0.28
(-0.49)
LRER 0.47 (1.24)
LRER -1.49**
(-3.65)
LCPI 1.09 (1.66)
0.98*
(1.88) LCPI -3.20**
(-6.21) -2.55**
(-5.28) D1 0.11
(0.31) D1 -0.66**
(-2.41)
D2 -0.02 (-0.07)
D2 0.007 (0.03)
DIAGNOSTIC TEST DIAGNOSTIC TEST
Adj. 2R 0.938 0.937 0.933 0.944 Adj. 2R 0.978 0.988 0.962 0.985
F-STAT. 70.942 50.269 65.108 78.533 F-STAT. 202.883 265.345 116.631 298.737 DWa 1.811 1.832 1.704 1.798 DWa 1.286 2.587 1.118 2.573
OBSERVATION 24 24 24 24 OBSERVATION 24 24 24 24 Note: The figures in parentheses are the absolute t-statistics. * and ** denote significance at the 10% and 5% levels, respectively
a Durbin-Watson Statistic

Table 28. Regression estimates for China export (import) function to (from) South Africa
Dependent Variable: China Exports to South Africa Dependent Variable: China Imports from South Africa Variable MODEL 1 MODEL 2 MODEL 3 MODEL 4 Variable MODEL 1 MODEL 2 MODEL 3 MODEL 4
CONSTANT 79.89 (0.13)
6.58 (0.04)
172.37 (0.41)
698.33**
(3.35) CONSTANT 58.10
(0.11) 474.29 (1.71)
98.79 (0.26)
480.00*
(2.36) LRPGDP0 0.45
(0.07) 2.64*
(1.86) 3.29
(0.80) 11.57**
(5.00) LRPGDP0 1.16
(0.20) 9.16*
(2.70) 2.98
(0.80) 9.23**
(4.08) LRPGDP1 7.92
(0.71) 0.50
(0.40) 4.36
(0.58) -6.67
(-1.56) LRPGDP1 7.08
(0.74) -3.58
(-0.62) 4.84
(0.70) -3.45
(-0.83) LPOP0 -28.04
(-1.66) 1.71
(0.20) -17.63 (-1.25)
-5.20 (-0.56)
LPOP0 -12.67 (-0.87)
5.44 (0.46)
-4.62 (-0.36)
5.94 (0.66)
LPOP1 26.15 (1.09)
-3.16 (-0.64)
9.07 (0.65)
-32.96**
(-3.46) LPOP1 9.19
(0.44) -33.59*
(-2.40) -2.34
(-0.18) -34.59**
(-3.72) LEXRATE 0.88**
(2.89) LEXRATE 0.65*
(2.33)
LRER 1.08 (1.72)
LRER 0.76 (1.39)
LCPI 1.09 (1.66)
-2.36**
(-5.74) LCPI -1.81
(-2.18) -1.84**
(-4.58) D1 0.11
(0.31) D1 -0.003
(-0.01)
D2 -0.02 D2 -0.03 (-0.17)
DIAGNOSTIC TEST -0.07 DIAGNOSTIC TEST
Adj. 2R 0.926 0.937 0.956 0.984 Adj. 2R 0.908 0.960 0.939 0.976
F-STAT. 25.990 50.269 44.397 127.956 F-STAT. 20.856 35.015 31.850 80.862 DWa 2.453 1.832 2.889 3.262 DWa 2.218 3.332 2.581 3.181
OBSERVATION 11 11 11 11 OBSERVATION 11 11 11 11 Note: The figures in parentheses are the absolute t-statistics. * and ** denote significance at the 10% and 5% levels, respectively
a Durbin-Watson Statistic

Table 29. Regression estimates for China export (import) function to (from) Spain
Dependent Variable: China Exports to Spain Dependent Variable: China Imports from Spain Variable MODEL 1 MODEL 2 MODEL 3 MODEL 4 Variable MODEL 1 MODEL 2 MODEL 3 MODEL 4
CONSTANT 818.14* -116.90 (-0.27)
863.29*
(1.99) -61.35 (-0.16)
CONSTANT -127.27 (-0.22)
862.39 (1.85) (1.73)
-238.13 (-0.41)
970.41*
(1.96) LRPGDP0 3.38**
(3.65) 1.27
(1.24) 3.37** 1.47*
(1.78) LRPGDP0 1.29
(1.08) (3.62) 2.98**
(2.52) 1.18
(0.96) 4.01**
(3.78) LRPGDP1 4.99**
(2.12) 2.96
(1.62) 4.42*
(1.80) 2.32
(1.56) LRPGDP1 -9.96**
(-3.27) -2.14
(-1.01) -9.42**
(-2.90) -4.41**
(-2.30) LPOP0 0.14
(0.02) -3.90
(-0.44) 2.53
(0.29) -2.38
(-0.51) LPOP0 22.24*
(1.99) 17.78 (1.73)
19.13 (1.67)
18.29**
(3.03) LPOP1 -49.70
(-1.56) 10.73 (0.34)
-54.82*
(-1.77) 6.06
(0.24) LPOP1 -13.14
(-0.32) -69.98*
(-1.89) -3.35
(-0.08) -75.67**
(-2.28) LEXRATE 0.005
(0.07) LEXRATE 0.07
(0.91)
LRER -0.02 (-0.33)
LRER 0.10 (1.34)
LCPI -1.16**
(-2.19) -1.30**
(-4.04) LCPI 2.55**
(4.15) 1.84**
(4.45) D1 0.15
(0.48) D1 0.68*
(1.86)
D2 -0.11 (-0.44)
D2 -0.26 (-0.91)
DIAGNOSTIC TEST DIAGNOSTIC TEST
Adj. 2R 0.970 0.983 0.970 0.984 Adj. 2R 0.822 0.918 0.813 0.907
F-STAT. 151.252 189.141 150.382 289.846 F-STAT. 22.298 37.767 21.041 45.887 DWa 0.946 1.603 0.937 1.498 DWa 1.154 2.689 1.058 2.308
OBSERVATION 24 24 24 24 OBSERVATION 24 24 24 24 Note: The figures in parentheses are the absolute t-statistics. * and ** denote significance at the 10% and 5% levels, respectively
a Durbin-Watson Statistic

Table 30. Regression estimates for China export (import) function to (from) Sweden
Dependent Variable: China Exports to Sweden Dependent Variable: China Imports from Sweden Variable MODEL 1 MODEL 2 MODEL 3 MODEL 4 Variable MODEL 1 MODEL 2 MODEL 3 MODEL 4
CONSTANT 511.98**
(-2.91) -526.99*
(-1.96) -561.36**
(-2.73) -550.58**
(-2.19) CONSTANT 273.73
(1.65) 362.86 (1.43)
340.36*
(1.77) 363.56 (1.55)
LRPGDP0 0.59 (0.67)
1.01 (0.95)
0.58 (0.67)
0.88 (1.10)
LRPGDP0 3.85**
(4.63) 3.46**
(3.43) 3.91**
(4.87) 3.50**
(4.68) LRPGDP1 4.10**
(2.12) 4.37
(1.57) 4.38**
(2.36) 4.94*
(2.03) LRPGDP1 -1.69
(-0.93) -3.13
(-1.19) -1.98
(-1.14) -2.98
(-1.31) LPOP0 -10.79
(-1.68) -15.68 (-1.56)
-11.71**
(-2.32) -15.81*
(-1.93) LPOP0 -10.14
(-1.68) -2.56
(-0.27) -9.45*
(-2.00) -3.05
(-0.40) LPOP1 44.52**
(3.82) 51.49**
(2.15) 48.64**
(3.95) 52.77**
(2.34) LPOP1 -3.00
(-0.27) -17.28 (-0.76)
-7.80 (-0.69)
-16.79 (-0.80)
LEXRATE -0.17 (-0.66)
LEXRATE 0.21 (0.88)
LRER -0.13 (-0.54)
LRER 0.14 (0.61)
LCPI 0.11 (0.12)
0.27 (0.37)
LCPI -0.48 (-0.58)
-0.48 (-0.70)
D1 -0.16 (-0.46)
D1 -0.14E-3 (-0.43E-3)
D2 0.09 (0.40)
D2 0.03 (0.14)
DIAGNOSTIC TEST DIAGNOSTIC TEST
Adj. 2R 0.961 0.957 0.961 0.961 Adj. 2R 0.971 0.967 0.971 0.971
F-STAT. 114.320 73.978 115.259 113.322 F-STAT. 152.903 97.856 156.303 153.937 DWa 1.138 1.263 1.183 1.258 DWa 1.738 1.756 1.775 1.734
OBSERVATION 24 24 24 24 OBSERVATION 24 24 24 24 Note: The figures in parentheses are the absolute t-statistics. * and ** denote significance at the 10% and 5% levels, respectively
a Durbin-Watson Statistic
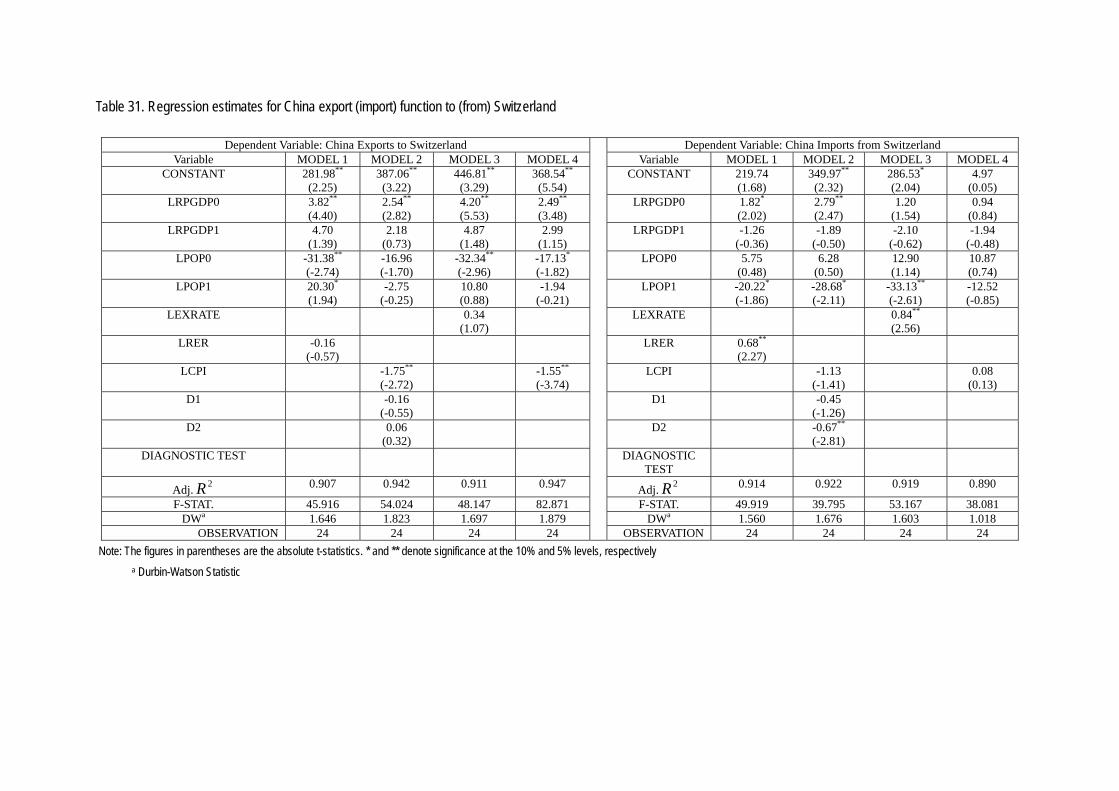
Table 31. Regression estimates for China export (import) function to (from) Switzerland
Dependent Variable: China Exports to Switzerland Dependent Variable: China Imports from Switzerland Variable MODEL 1 MODEL 2 MODEL 3 MODEL 4 Variable MODEL 1 MODEL 2 MODEL 3 MODEL 4
CONSTANT 281.98**
(2.25) 387.06**
(3.22) 446.81**
(3.29) 368.54**
(5.54) CONSTANT 219.74
(1.68) 349.97**
(2.32) 286.53*
(2.04) 4.97
(0.05) LRPGDP0 3.82**
(4.40) 2.54**
(2.82) 4.20**
(5.53) 2.49**
(3.48) LRPGDP0 1.82*
(2.02) 2.79**
(2.47) 1.20
(1.54) 0.94
(0.84) LRPGDP1 4.70
(1.39) 2.18
(0.73) 4.87
(1.48) 2.99
(1.15) LRPGDP1 -1.26
(-0.36) -1.89
(-0.50) -2.10
(-0.62) -1.94
(-0.48) LPOP0 -31.38**
(-2.74) -16.96 (-1.70)
-32.34**
(-2.96) -17.13*
(-1.82) LPOP0 5.75
(0.48) 6.28
(0.50) 12.90 (1.14)
10.87 (0.74)
LPOP1 20.30*
(1.94) -2.75
(-0.25) 10.80 (0.88)
-1.94 (-0.21)
LPOP1 -20.22*
(-1.86) -28.68*
(-2.11) -33.13**
(-2.61) -12.52 (-0.85)
LEXRATE 0.34 (1.07)
LEXRATE 0.84**
(2.56)
LRER -0.16 (-0.57)
LRER 0.68**
(2.27)
LCPI -1.75**
(-2.72) -1.55**
(-3.74) LCPI -1.13
(-1.41) 0.08
(0.13) D1 -0.16
(-0.55) D1 -0.45
(-1.26)
D2 0.06 (0.32)
D2 -0.67**
(-2.81)
DIAGNOSTIC TEST DIAGNOSTIC TEST
Adj. 2R 0.907 0.942 0.911 0.947 Adj. 2R 0.914 0.922 0.919 0.890
F-STAT. 45.916 54.024 48.147 82.871 F-STAT. 49.919 39.795 53.167 38.081 DWa 1.646 1.823 1.697 1.879 DWa 1.560 1.676 1.603 1.018
OBSERVATION 24 24 24 24 OBSERVATION 24 24 24 24 Note: The figures in parentheses are the absolute t-statistics. * and ** denote significance at the 10% and 5% levels, respectively
a Durbin-Watson Statistic

Table 32. Regression estimates for China export (import) function to (from) Taiwan
Dependent Variable: China Exports to Taiwan Dependent Variable: China Imports from Taiwan
Variable MODEL 1 MODEL 2 MODEL 3 MODEL 4 Variable MODEL 1 MODEL 2 MODEL 3 MODEL 4 CONSTANT -161.33*
(-2.09) -144.15 (-1.71)
-133.81*
(-1.89) -141.01*
(-1.75) CONSTANT 210.34
(1.19) 96.85 (0.49)
80.26 (0.49)
56.95 (0.28)
LRPGDP0 -0.68 (-1.36)
-0.68 (-1.10)
-0.41 (-1.03)
-0.52 (-0.90)
LRPGDP0 2.07*
(1.82) 1.52
(1.05) 0.77
(0.83) 0.72
(0.50) LRPGDP1 2.01**
(7.30) 1.92**
(4.40) 2.04**
(5.62) 1.74**
(5.65) LRPGDP1 1.73**
(2.75) 1.50
(1.47) 1.33
(1.57) 2.75**
(3.54) LPOP0 4.57
(0.86) 5.47
(0.95) 4.98
(0.93) 5.67
(1.06) LPOP0 -1.07
(-0.09) -9.42
(-0.70) -2.40
(-0.19) -6.66
(-0.49) LPOP1 4.27
(0.75) 2.20
(0.38) 2.01
(0.41) 1.85
(0.34) LPOP1 -11.44
(-0.88) 6.31
(0.46) -1.39
(-0.12) 4.37
(0.32) LEXRATE -0.15
(-0.73) LEXRATE 0.93*
(1.90)
LRER -0.22 (-1.01)
LRER 1.13**
(2.22)
LCPI -0.01 (-0.02)
-0.14 (-0.38)
LCPI -1.37 (-0.96)
0.20 (0.22)
D1 0.04 (0.19)
D1 -0.58 (-1.30)
D2 0.11 (0.93)
D2 -0.45 (-1.64)
DIAGNOSTIC TEST DIAGNOSTIC TEST
Adj. 2R 0.992 0.991 0.992 0.992 Adj. 2R 0.970 0.965 0.968 0.962
F-STAT. 586.718 374.346 571.329 559.271 F-STAT. 151.29 92.880 142.374 118.389 DWa 2.005 1.974 1.935 1.854 DWa 2.041 1.903 1.821 1.630
OBSERVATION 24 24 24 24 OBSERVATION 24 24 24 24 Note: The figures in parentheses are the absolute t-statistics. * and ** denote significance at the 10% and 5% levels, respectively
a Durbin-Watson Statistic

Table 33. Regression estimates for China export (import) function to (from) Thailand
Dependent Variable: China Exports to Thailand Dependent Variable: China Imports from Thailand
Variable MODEL 1 MODEL 2 MODEL 3 MODEL 4 Variable MODEL 1 MODEL 2 MODEL 3 MODEL 4 CONSTANT -50.64
(-0.30) 185.89 (0.71)
43.71 (0.28)
219.86 (1.13)
CONSTANT 93.46 (0.59)
80.07 (0.32)
174.44 (1.13)
165.05 (0.90)
LRPGDP0 -0.28 (-0.16)
2.87 (1.22)
0.75 (0.58)
4.04**
(2.43) LRPGDP0 3.17*
(2.03) 4.13*
(1.82) 4.35**
(3.34) 4.88**
(3.12) LRPGDP1 3.15**
(2.59) 4.06**
(2.20) 4.53**
(3.17) 3.46*
(2.06) LRPGDP1 -0.08
(-0.07) -1.84
(-1.03) 0.23
(0.16) -1.82
(-1.15) LPOP0 5.27
(0.28) 25.80 (1.17)
11.01 (0.65)
30.33 (1.55)
LPOP0 0.97 (0.05)
14.12 (0.67)
7.83 (0.46)
11.34 (0.61)
LPOP1 -3.55 (-0.17)
-42.70 (-1.71)
-16.52 (-0.94)
-50.08**
(-2.16) LPOP1 -6.35
(-0.32) -20.44 (-0.85)
-19.44 (-1.09)
-22.15 (-1.02)
LEXRATE -1.30**
(-2.81) LEXRATE -0.67
(-1.45)
LRER -1.27**
(-2.30) LRER -0.97*
(-1.88)
LCPI 1.80 (1.28)
1.94 (1.52)
LCPI -0.21 (-0.16)
-0.42 (-0.35)
D1 -0.02 (-0.04)
D1 0.22 (0.49)
D2 0.38 (0.98)
D2 0.03 (0.08)
DIAGNOSTIC TEST DIAGNOSTIC TEST
Adj. 2R 0.905 0.885 0.915 0.891 Adj. 2R 0.946 0.929 0.942 0.936
F-STAT. 44.785 26.218 50.265 38.630 F-STAT. 82.096 44.294 76.288 68.470 DWa 1.665 1.285 1.799 1.303 DWa 1.674 1.470 1.549 1.433
OBSERVATION 24 24 24 24 OBSERVATION 24 24 24 24 Note: The figures in parentheses are the absolute t-statistics. * and ** denote significance at the 10% and 5% levels, respectively
a Durbin-Watson Statistic

Table 34. Regression estimates for China export (import) function to (from) Turkey
Dependent Variable: China Exports to Turkey Dependent Variable: China Imports from Turkey Variable MODEL 1 MODEL 2 MODEL 3 MODEL 4 Variable MODEL 1 MODEL 2 MODEL 3 MODEL 4
CONSTANT -50.64 (-0.30)
106.73 (0.34)
435.88 (1.61)
218.76 (0.87)
CONSTANT -116.09 (-0.26)
278.45 (0.91)
-45.41 (-0.14)
-247.99 (-0.82)
LRPGDP0 -0.28 (-0.16)
17.54**
(3.35) 14.90**
(3.27) 12.31**
(2.84) LRPGDP0 11.41*
(1.75) 21.29**
(4.18) 14.23**
(2.66) 11.68**
(2.25) LRPGDP1 3.15**
(2.59) -1.61
(-0.41) -0.32
(-0.08) 1.21
(0.33) LRPGDP1 -7.12
(-1.44) -8.63**
(-2.26) -10.94**
(-2.42) -9.28*
(-2.09) LPOP0 5.27
(0.28) 23.01 (0.59)
-7.14 (-0.19)
-7.85 (-0.21)
LPOP0 89.91*
(1.93) 84.43**
(2.22) 52.91 (1.23)
55.00 (1.23)
LPOP1 -3.55 (-0.17)
-36.93 (-0.87)
-19.39 (-0.52)
-6.67 (-0.17)
LPOP1 -97.11*
(-1.89) -116.38**
(-2.82) -57.74 (-1.32)
-49.12 (-1.06)
LEXRATE 1.19**
(3.49) LEXRATE 1.04**
(2.59)
LRER -1.27**
(-2.30) LRER 1.59
(1.01)
LCPI -1.62**
(-3.11) -1.22**
(-3.37) LCPI -0.24
(-0.48) -0.99**
(-2.29) D1 -0.80
(-1.25) D1 -2.21**
(-3.52)
D2 0.97 (1.29)
D2 -1.02 (-1.39)
DIAGNOSTIC TEST DIAGNOSTIC TEST
Adj. 2R 0.905 0.935 0.930 0.928 Adj. 2R 0.284 0.651 0.456 0.419
F-STAT. 44.785 45.950 59.49 57.735 F-STAT. 2.742 6.850 4.688 4.176 DWa 1.665 2.297 1.851 1.928 DWa 0.888 1.724 1.095 0.960
OBSERVATION 24 23 23 23 OBSERVATION 23 23 23 23 Note: The figures in parentheses are the absolute t-statistics. * and ** denote significance at the 10% and 5% levels, respectively
a Durbin-Watson Statistic
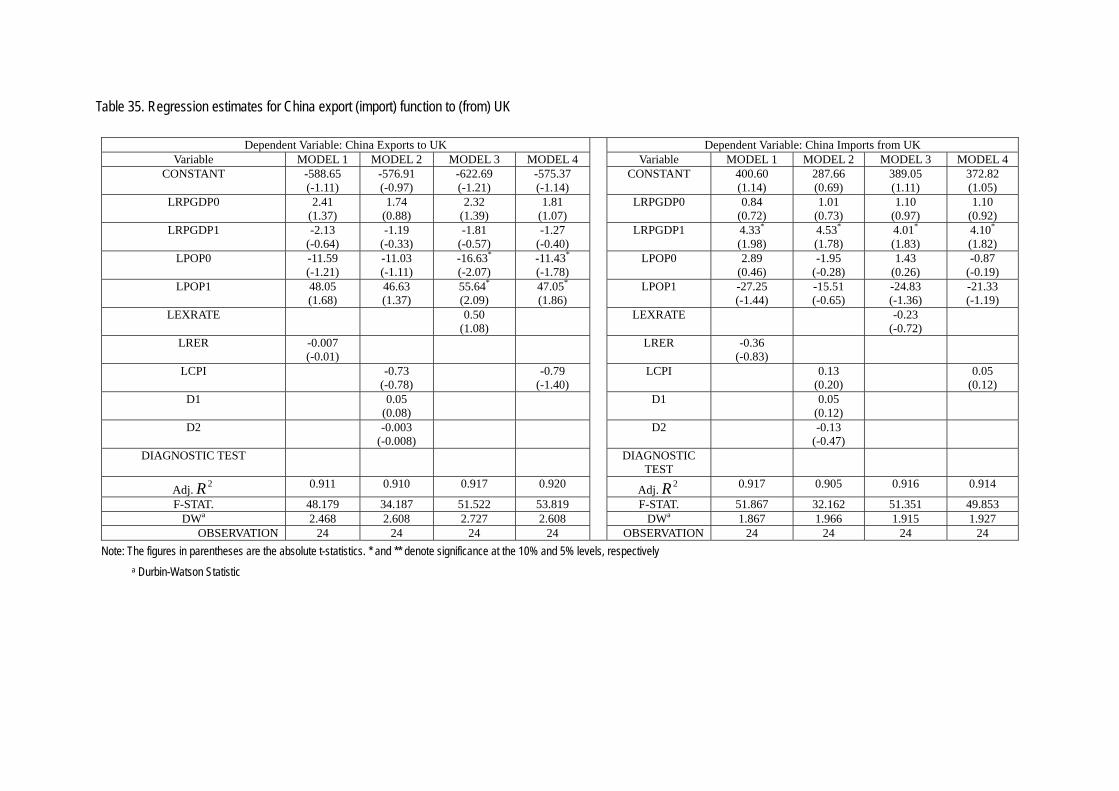
Table 35. Regression estimates for China export (import) function to (from) UK
Dependent Variable: China Exports to UK Dependent Variable: China Imports from UK Variable MODEL 1 MODEL 2 MODEL 3 MODEL 4 Variable MODEL 1 MODEL 2 MODEL 3 MODEL 4
CONSTANT -588.65 (-1.11)
-576.91 (-0.97)
-622.69 (-1.21)
-575.37 (-1.14)
CONSTANT 400.60 (1.14)
287.66 (0.69)
389.05 (1.11)
372.82 (1.05)
LRPGDP0 2.41 (1.37)
1.74 (0.88)
2.32 (1.39)
1.81 (1.07)
LRPGDP0 0.84 (0.72)
1.01 (0.73)
1.10 (0.97)
1.10 (0.92)
LRPGDP1 -2.13 (-0.64)
-1.19 (-0.33)
-1.81 (-0.57)
-1.27 (-0.40)
LRPGDP1 4.33*
(1.98) 4.53*
(1.78) 4.01*
(1.83) 4.10*
(1.82) LPOP0 -11.59
(-1.21) -11.03 (-1.11)
-16.63*
(-2.07) -11.43*
(-1.78) LPOP0 2.89
(0.46) -1.95
(-0.28) 1.43
(0.26) -0.87
(-0.19) LPOP1 48.05
(1.68) 46.63 (1.37)
55.64*
(2.09) 47.05*
(1.86) LPOP1 -27.25
(-1.44) -15.51 (-0.65)
-24.83 (-1.36)
-21.33 (-1.19)
LEXRATE 0.50 (1.08)
LEXRATE -0.23 (-0.72)
LRER -0.007 (-0.01)
LRER -0.36 (-0.83)
LCPI -0.73 (-0.78)
-0.79 (-1.40)
LCPI 0.13 (0.20)
0.05 (0.12)
D1 0.05 (0.08)
D1 0.05 (0.12)
D2 -0.003 (-0.008)
D2 -0.13 (-0.47)
DIAGNOSTIC TEST DIAGNOSTIC TEST
Adj. 2R 0.911 0.910 0.917 0.920 Adj. 2R 0.917 0.905 0.916 0.914
F-STAT. 48.179 34.187 51.522 53.819 F-STAT. 51.867 32.162 51.351 49.853 DWa 2.468 2.608 2.727 2.608 DWa 1.867 1.966 1.915 1.927
OBSERVATION 24 24 24 24 OBSERVATION 24 24 24 24 Note: The figures in parentheses are the absolute t-statistics. * and ** denote significance at the 10% and 5% levels, respectively
a Durbin-Watson Statistic

Table 36. Regression estimates for China export (import) function to (from) UAE
Dependent Variable: China Exports to UAE Dependent Variable: China Imports from UAE Variable MODEL 1 MODEL 2 MODEL 3 MODEL 4 Variable MODEL 1 MODEL 2 MODEL 3 MODEL 4
CONSTANT 463.01 (1.57)
440.34 (1.21)
-515.64**
(-3.33) 551.49 (1.78)
CONSTANT -624.34 (-0.61)
-1579.20 (-1.66)
-379.04 (-1.03)
-1513.1 (-1.61)
LRPGDP0 13.81**
(3.59) 13.64 (1.94)
0.56 (0.85)
17.07**
(3.17) LRPGDP0 14.90
(1.12) -20.86 (-1.14)
0.90 (0.84)
-18.27 (-1.12)
LRPGDP1 0.37 (0.36)
0.54 (0.37)
0.19 (0.34)
0.84 (0.65)
LRPGDP1 1.36 (0.39)
-4.03 (-1.05)
-0.67 (-0.74)
-3.08 (-0.79)
LPOP0 -2.09 (-0.17)
-1.75 (-0.13)
28.18**
(3.07) 0.27
(0.02) LPOP0 65.79
(1.54) 36.39 (1.01)
15.81 (0.70)
41.56 (1.12)
LPOP1 -33.27**
(-3.42) -31.25 (-1.45)
-4.00 (-1.40)
-44.19**
(-2.70) LPOP1 -57.00
(-1.70) 67.61 (1.17)
4.75 (0.63)
53.46 (1.08)
LEXRATE 0.12 (0.27)
LEXRATE -3.59**
(-4.09)
LRER 0.24 (0.36)
LRER -2.85 (-1.26)
LCPI 0.05 (0.04)
-0.45 (-0.65)
LCPI 2.78 (0.95)
4.38*
(2.08) D1 0.03
(0.11) D1 -1.12
(-1.41)
D2 -0.16 (-0.88)
D2 -0.50 (-1.06)
DIAGNOSTIC TEST DIAGNOSTIC TEST
Adj. 2R 0.968 0.962 0.979 0.969 Adj. 2R 0.818 0.878 0.919 0.866
F-STAT. 67.55 41.256 202.605 70.764 F-STAT. 10.909 12.277 44.157 15.270 DWa 2.360 3.322 1.195 2.635 DWa 2.644 3.056 2.682 3.060
OBSERVATION 12 12 12 12 OBSERVATION 12 12 12 12 Note: The figures in parentheses are the absolute t-statistics. * and ** denote significance at the 10% and 5% levels, respectively.
a Durbin-Watson Statistic

Table 37. Regression estimates for China export (import) function to (from) USA
Dependent Variable: China Exports to USA Dependent Variable: China Imports from USA Variable MODEL 1 MODEL 2 MODEL 3 MODEL 4 Variable MODEL 1 MODEL 2 MODEL 3 MODEL 4
CONSTANT -202.83 (-1.64)
-307.69**
(-2.43) -267.86*
(-1.86) -290.46**
(-2.57) CONSTANT -45.81
(-0.36) -174.02 (-1.27)
-54.22 (-0.35)
-128.34 (-1.00)
LRPGDP0 2.40**
(2.59) 0.77
(0.75) 1.22
(0.90) 0.94
(1.05) LRPGDP0 1.20
(1.26) -0.57
(-0.52) 0.92
(0.63) -0.22
(-0.21) LRPGDP1 -6.24**
(-3.75) -4.83**
(-2.64) -5.36**
(-2.80) -5.15**
(-3.42) LRPGDP1 -0.71
(-0.42) 1.41
(0.71) -0.51
(-0.24) 0.34
(0.20) LPOP0 2.62
(0.72) -2.15
(-0.40) -6.20
(-1.13) -3.20
(-1.27) LPOP0 2.65
(0.72) -9.74
(-1.67) -2.38
(-0.40) -4.10
(-1.43) POP1 11.40
(1.69) 21.82**
(2.65) 24.08**
(2.36) 22.22**
(3.88) POP1 0.75
(0.11) 20.32**
(2.28) 6.52
(0.59) 12.28*
(1.88) LEXRATE 0.40
(0.93) LEXRATE -0.05
(-0.11)
LRER -0.51*
(-1.94) LRER -0.63**
(-2.35)
LCPI -0.61 (-1.44)
-0.75**
(-3.07) LCPI -0.87*
(-1.88) -0.67**
(-2.41) D1 0.11
(0.44) D1 -0.09
(-0.34)
D2 -0.03 (-0.14)
D2 -0.27 (-1.38)
DIAGNOSTIC TEST DIAGNOSTIC TEST
Adj. 2R 0.989 0.990 0.987 0.991 Adj. 2R 0.955 0.955 0.941 0.955
F-STAT. 404.239 328.453 349.932 509.993 F-STAT. 98.187 71.059 74.320 99.376 DWa 1.816 1.963 1.427 1.936 DWa 1.670 2.027 1.254 1.600
OBSERVATION 24 24 24 24 OBSERVATION 24 24 24 24 Note: The figures in parentheses are the absolute t-statistics. * and ** denote significance at the 10% and 5% levels, respectively.
a Durbin-Watson Statistic

Table 38. Regression estimates for China export (import) function to (from) Vietnam
Dependent Variable: China Exports to Vietnam Dependent Variable: China Imports from Vietnam Variable MODEL 1 MODEL 2 MODEL 3 MODEL 4 Variable MODEL 1 MODEL 2 MODEL 3 MODEL 4
CONSTANT 7.01 (0.01)
2042.20*
(2.33) 81.108 (0.11)
1365.7 (1.59)
CONSTANT 439.62 (0.56)
3571.90**
(3.99) 1249.10 (1.41)
2837.1**
(3.14) LRPGDP0 14.04
(1.62) 26.30**
(3.61) 22.83**
(2.29) 29.15**
(3.82) LRPGDP0 28.67**
(2.38) 39.88**
(5.37) 40.20**
(3.50) 43.73**
(5.45) LRPGDP1 -22.00
(-1.53) 2.34
(0.15) -39.17**
(-5.38) -20.27*
(-1.93) LRPGDP1 -33.78
(-1.69) 19.98 (1.23)
-38.39**
(-4.57) -5.67
(-0.51) POP0 -47.51
(-0.96) 15.49 (0.32)
-85.20*
(-1.95) -39.81 (-0.95)
POP0 -35.57 (-0.52)
83.11 (1.67)
-43.35 (-0.86)
33.39 (0.76)
POP1 58.54 (1.08)
-141.05 (-1.56)
99.15*
(2.05) -33.02 (-0.44)
POP1 18.50 (0.25)
-314.48**
(-3.40) -20.73 (-0.37)
-209.13**
(-2.62) LEXRATE -0.44
(-0.38) LEXRATE -1.98
(-1.48)
LRER 2.35 (1.30)
LRER 0.27 (0.11)
LCPI 5.78**
(2.93) 3.21*
(2.09) LCPI 7.73**
(3.84) 5.27**
(3.26) D1 1.19
(1.83) D1 0.96
(1.45)
D2 -0.29 (-0.57)
D2 -0.81 (-1.59)
DIAGNOSTIC TEST DIAGNOSTIC TEST
Adj. 2R 0.963 0.975 0.957 0.970 Adj. 2R 0.910 0.967 0.928 0.959
F-STAT. 73.706 78.049 62.838 92.823 F-STAT. 29.472 59.738 37.072 66.408 DWa 2.359 2.268 1.872 1.423 DWa 2.077 2.769 1.876 1.702
OBSERVATION 15 15 15 15 OBSERVATION 15 15 15 15 Note: The figures in parentheses are the absolute t-statistics. * and ** denote significance at the 10% and 5% levels, respectively.
a Durbin-Watson Statistic

Table 39. All trading partners Exports Imports FEM Case 1 Case 2 Case 3 Case 4 Case 5 Case 1 Case 2 Case 3 Case 4 Case 5 POP0 -7.9044E-10
(-0.849) -3.5561E-09***
(-2.975)
POP1 8.8018E-10** (2.052)
1.9036E-09*** (3.456)
LPOP0 -9.7418*** (-5.996)
-9.7201*** (-5.950)
-9.4974*** (-5.868)
-9.3246*** (-5.823)
-5.6804*** (-2.878)
-5.5988*** (-2.843)
-6.1944*** (-3.167)
-6.0586*** (-3.158)
LPOP1 0.1111 (.0363)
0.1390 (0.451)
0.0431 (0.147)
0.8191*** (3.108)
3.9348*** (10.611)
4.0261*** (10.811)
4.2831*** (12.072)
4.0539*** (12.124)
LRPGDP0 1.6164*** (3.935)
3.0666*** (12.797)
3.0686*** (12.801)
3.0700*** (12.807)
2.9884*** (12.578)
3.1594*** (5.989)
1.6402*** (5.663)
1.6466*** (5.698)
1.6429*** (5.671)
1.6212*** (5.696)
LRPGDP1 1.1909*** (8.330)
1.2746*** (9.031)
1.2549*** (8.745)
1.2428*** (8.692)
1.0731*** (7.893)
1.2566*** (6.828)
1.5969*** (9.343)
1.5297*** (8.824)
1.5619*** (9.019)
1.6109*** (9.544)
LDIST LEXRATE 0.0348
(1.371) 0.0264
(0.997) 0.0191**
(1.980) -0.1704***
(-5.223) -0.0708**
(-2.213) 0.0114
(0.980) LCOMPETI 0.0247
(0.887) 0.0183
(0.641) -0.0082 (-0.778)
-0.1886*** (-5.286)
-0.0981*** (-2.841)
-0.0270** (-2.122)
LRER 0.0265 (0.998)
-0.0670** (-2.184)
D1 0.1520*** (4.238)
-0.1191*** (-2.585)
D2 0.0581* (1.906)
-0.0677* (-1.730)
Adjusted R2 92.92 92.85 92.83 93.84 92.67 87.93 89.21 89.26 89.20 89.37 F value 236.22 250.01 244.22 249.88 249.83 131.55 159.35 156.56 159.29 165.87 REM Case 1 Case 2 Case 3 Case 4 Case 5 Case 1 Case 2 Case 3 Case 4 Case 5 POP0 -6.1799E-10
(-0.665) -3.4927E-09***
(-2.929)
POP1 1.3175E-09*** (3.902)
2.0314E-09*** (5.145)
LPOP0 -10.0171*** (-6.177)
-9.9590*** (-6.138)
-9.6642*** (-5.985)
-9.3169*** (-5.836)
-4.4870** (-2.292)
-4.4342** (-2.269)
-4.9898** (-2.558)
-4.8494** (-2.535)
LPOP1 0.7314*** (7.073)
0.7257*** (7.028)
0.6884*** (6.540)
0.7604*** (7.559)
1.1069*** (11.322)
1.1001*** (11.295)
1.1667*** (11.750)
1.1671*** (12.259)
LRPGDP0 1.6355*** (3.982)
3.0925*** (13.032)
3.0954*** (13.041)
3.0782*** (12.972)
3.0330*** (12.899)
3.1642*** (5.999)
1.9498*** (6.811)
1.9515*** (6.833)
1.9811*** (6.923)
1.9560*** (6.958)
LRPGDP1 0.8455*** (8.413)
0.9791*** (10.476)
0.9665*** (10.320)
0.9895*** (10.340)
0.9310*** (10.095)
1.0588*** (9.208)
1.3134*** (13.787)
1.3064*** (13.751)
1.2707*** (13.192)
1.2629*** (13.645)

LDIST -1.3046*** (-4.892)
-1.3402*** (-6.731)
-1.3452*** (-6.773)
-1.2932*** (-6.300)
-1.2949*** (-6.571)
-0.9730*** (-3.584)
-1.1246*** (-6.175)
-1.1323*** (-6.244)
-1.2361*** (-6.680)
-1.2155*** (-6.783)
LEXRATE 0.0264 (1.114)
0.0420* (1.829)
0.0220** (2.364)
-0.1483*** (-5.049)
-0.0807*** (-3.116)
-0.0022 (-0.198)
LCOMPETI 0.0082 (0.316)
0.0261 (1.033)
-0.0160 (-1.560)
-0.1713*** (-5.325)
-0.0959*** (-3.350)
-0.0151 (-1.233)
LRER 0.0421* (1.833)
-0.0809*** (-3.113)
D1 0.1530*** (4.266)
-0.1155** (-2.509)
D2 0.0615** (2.021)
-0.0647* (-1.656)
Constant 6.5332*** (6.373)
87.1826*** (6.179)
86.7051*** (6.144)
84.1356*** (5.991)
80.7814*** (5.816)
4.2249*** (3.990)
35.1249** (2.063)
34.9387** (2.057)
39.8052** (2.347)
38.5209** (2.316)
LM 6338.67 4619.39 4603.62 4848.46 4769.88 4408.79 2375.64 2308.55 2697.82 2401.98 Hausman 14.30 16.28 14.64 13.06 4.79 13.45 84.06 88.28 87.55 90.41
Note: The figures in parentheses are the absolute t-statistics. *, ** and *** denote significance at the 10%, 5% and 1% levels, respectively.
Table 40. Euro countries
Exports Imports FEM Case 1 Case 2 Case 3 Case 4 Case 5 Case 1 Case 2 Case 3 Case 4 Case 5 POP0 5.1977E-10
(0.497) -2.4533E-09
(-1.600)
POP1 -6.2577E-09 (-0.455)
-9.3260E-08*** (-4.619)
LPOP0 -6.0968*** (-3.490)
-5.3926*** (-3.299)
-5.7423*** (-3.501)
-6.4431*** (-3.763)
-1.7471 (-0.689)
-2.2738 (-0.907)
-0.9452 (-0.355)
-2.8444 (-1.166)
LPOP1 0.3703 0.442
0.8276 (1.053)
0.1781 (0.246)
1.3787* (1.668)
-4.0908*** (-3.363)
-4.4315*** (-3.675)
-1.9640* (-1.671)
-3.6792*** (-3.124)
LRPGDP0 0.7476* (1.707)
2.2587*** (8.181)
1.7520*** (6.363)
1.9570*** (7.576)
2.1213*** (7.689)
2.7693*** (4.309)
1.5557*** (3.880)
1.9336*** (4.578)
1.1545*** (2.754)
1.6931*** (4.308)
LRPGDP1 2.7831*** (11.025)
2.7903*** (11.945)
2.8770*** (13.169)
2.8208*** (12.902)
2.8987*** (12.337)
2.4819*** (6.700)
3.0309*** (8.934)
2.9666*** (8.853)
3.1803*** (8.963)
3.0747*** (9.187)
LDIST LEXRATE 0.0216
(1.301) 0.0349**
(2.025) 0.0287
(1.596) -0.0982***
(-4.031) -0.1324***
(-5.016) -0.1120***
(-4.369) LCOMPETI -0.3176**
(-2.082) -0.5694***
(-5.098) -0.5234***
(-4.743) 0.2178
(0.973) 0.3182*
(1.857) 0.1433 (0.800)
LRER 0.0042 (0.240)
-0.1096*** (-4.352)
D1 0.1242** -0.0211
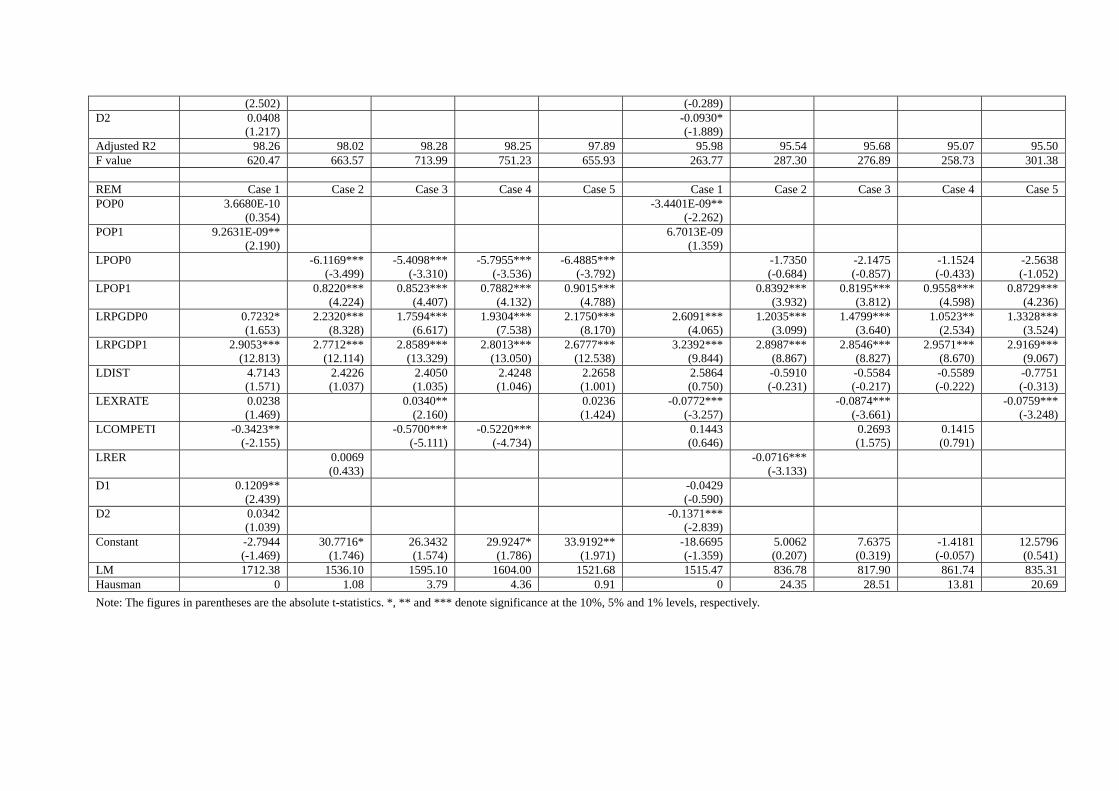
(2.502) (-0.289) D2 0.0408
(1.217) -0.0930*
(-1.889)
Adjusted R2 98.26 98.02 98.28 98.25 97.89 95.98 95.54 95.68 95.07 95.50 F value 620.47 663.57 713.99 751.23 655.93 263.77 287.30 276.89 258.73 301.38 REM Case 1 Case 2 Case 3 Case 4 Case 5 Case 1 Case 2 Case 3 Case 4 Case 5 POP0 3.6680E-10
(0.354) -3.4401E-09**
(-2.262)
POP1 9.2631E-09** (2.190)
6.7013E-09 (1.359)
LPOP0 -6.1169*** (-3.499)
-5.4098*** (-3.310)
-5.7955*** (-3.536)
-6.4885*** (-3.792)
-1.7350 (-0.684)
-2.1475 (-0.857)
-1.1524 (-0.433)
-2.5638 (-1.052)
LPOP1 0.8220*** (4.224)
0.8523*** (4.407)
0.7882*** (4.132)
0.9015*** (4.788)
0.8392*** (3.932)
0.8195*** (3.812)
0.9558*** (4.598)
0.8729*** (4.236)
LRPGDP0 0.7232* (1.653)
2.2320*** (8.328)
1.7594*** (6.617)
1.9304*** (7.538)
2.1750*** (8.170)
2.6091*** (4.065)
1.2035*** (3.099)
1.4799*** (3.640)
1.0523** (2.534)
1.3328*** (3.524)
LRPGDP1 2.9053*** (12.813)
2.7712*** (12.114)
2.8589*** (13.329)
2.8013*** (13.050)
2.6777*** (12.538)
3.2392*** (9.844)
2.8987*** (8.867)
2.8546*** (8.827)
2.9571*** (8.670)
2.9169*** (9.067)
LDIST 4.7143 (1.571)
2.4226 (1.037)
2.4050 (1.035)
2.4248 (1.046)
2.2658 (1.001)
2.5864 (0.750)
-0.5910 (-0.231)
-0.5584 (-0.217)
-0.5589 (-0.222)
-0.7751 (-0.313)
LEXRATE 0.0238 (1.469)
0.0340** (2.160)
0.0236 (1.424)
-0.0772*** (-3.257)
-0.0874*** (-3.661)
-0.0759*** (-3.248)
LCOMPETI -0.3423** (-2.155)
-0.5700*** (-5.111)
-0.5220*** (-4.734)
0.1443 (0.646)
0.2693 (1.575)
0.1415 (0.791)
LRER 0.0069 (0.433)
-0.0716*** (-3.133)
D1 0.1209** (2.439)
-0.0429 (-0.590)
D2 0.0342 (1.039)
-0.1371*** (-2.839)
Constant -2.7944 (-1.469)
30.7716* (1.746)
26.3432 (1.574)
29.9247* (1.786)
33.9192** (1.971)
-18.6695 (-1.359)
5.0062 (0.207)
7.6375 (0.319)
-1.4181 (-0.057)
12.5796 (0.541)
LM 1712.38 1536.10 1595.10 1604.00 1521.68 1515.47 836.78 817.90 861.74 835.31 Hausman 0 1.08 3.79 4.36 0.91 0 24.35 28.51 13.81 20.69 Note: The figures in parentheses are the absolute t-statistics. *, ** and *** denote significance at the 10%, 5% and 1% levels, respectively.
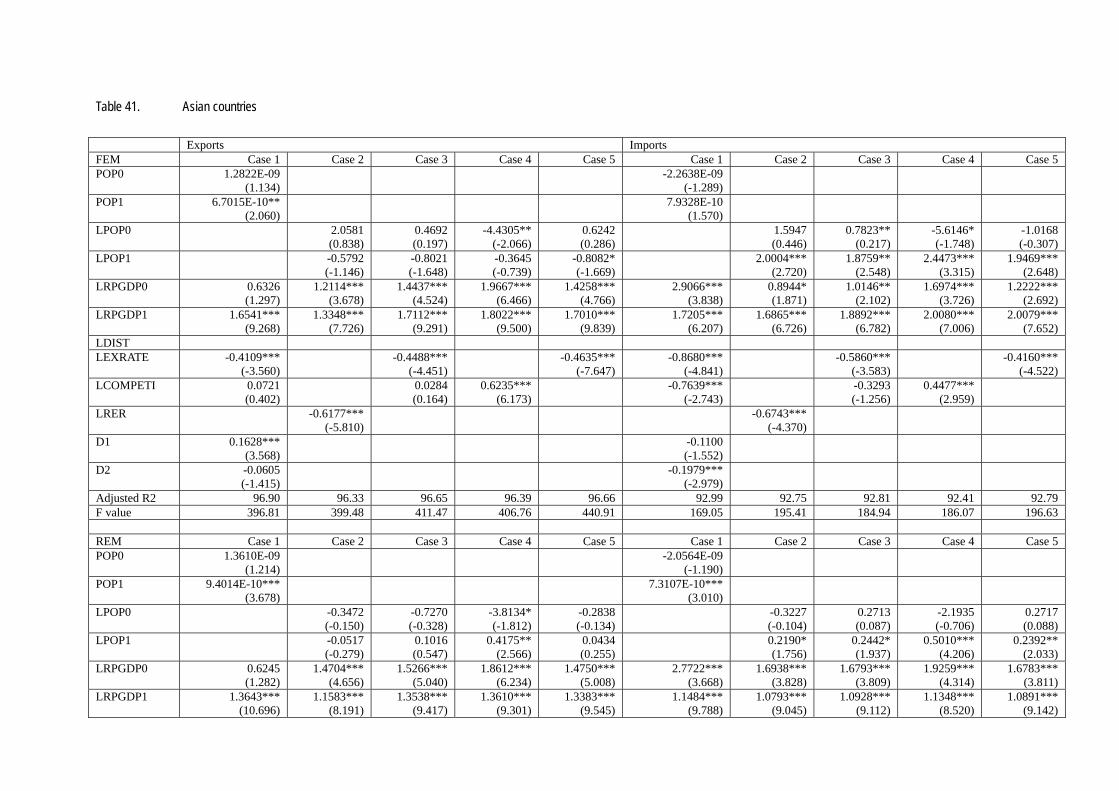
Table 41. Asian countries
Exports Imports FEM Case 1 Case 2 Case 3 Case 4 Case 5 Case 1 Case 2 Case 3 Case 4 Case 5 POP0 1.2822E-09
(1.134) -2.2638E-09
(-1.289)
POP1 6.7015E-10** (2.060)
7.9328E-10 (1.570)
LPOP0 2.0581 (0.838)
0.4692 (0.197)
-4.4305** (-2.066)
0.6242 (0.286)
1.5947 (0.446)
0.7823** (0.217)
-5.6146* (-1.748)
-1.0168 (-0.307)
LPOP1 -0.5792 (-1.146)
-0.8021 (-1.648)
-0.3645 (-0.739)
-0.8082* (-1.669)
2.0004*** (2.720)
1.8759** (2.548)
2.4473*** (3.315)
1.9469*** (2.648)
LRPGDP0 0.6326 (1.297)
1.2114*** (3.678)
1.4437*** (4.524)
1.9667*** (6.466)
1.4258*** (4.766)
2.9066*** (3.838)
0.8944* (1.871)
1.0146** (2.102)
1.6974*** (3.726)
1.2222*** (2.692)
LRPGDP1 1.6541*** (9.268)
1.3348*** (7.726)
1.7112*** (9.291)
1.8022*** (9.500)
1.7010*** (9.839)
1.7205*** (6.207)
1.6865*** (6.726)
1.8892*** (6.782)
2.0080*** (7.006)
2.0079*** (7.652)
LDIST LEXRATE -0.4109***
(-3.560) -0.4488***
(-4.451) -0.4635***
(-7.647) -0.8680***
(-4.841) -0.5860***
(-3.583) -0.4160***
(-4.522) LCOMPETI 0.0721
(0.402) 0.0284
(0.164) 0.6235***
(6.173) -0.7639***
(-2.743) -0.3293
(-1.256) 0.4477***
(2.959)
LRER -0.6177*** (-5.810)
-0.6743*** (-4.370)
D1 0.1628*** (3.568)
-0.1100 (-1.552)
D2 -0.0605 (-1.415)
-0.1979*** (-2.979)
Adjusted R2 96.90 96.33 96.65 96.39 96.66 92.99 92.75 92.81 92.41 92.79 F value 396.81 399.48 411.47 406.76 440.91 169.05 195.41 184.94 186.07 196.63 REM Case 1 Case 2 Case 3 Case 4 Case 5 Case 1 Case 2 Case 3 Case 4 Case 5 POP0 1.3610E-09
(1.214) -2.0564E-09
(-1.190)
POP1 9.4014E-10*** (3.678)
7.3107E-10*** (3.010)
LPOP0 -0.3472 (-0.150)
-0.7270 (-0.328)
-3.8134* (-1.812)
-0.2838 (-0.134)
-0.3227 (-0.104)
0.2713 (0.087)
-2.1935 (-0.706)
0.2717 (0.088)
LPOP1 -0.0517 (-0.279)
0.1016 (0.547)
0.4175** (2.566)
0.0434 (0.255)
0.2190* (1.756)
0.2442* (1.937)
0.5010*** (4.206)
0.2392** (2.033)
LRPGDP0 0.6245 (1.282)
1.4704*** (4.656)
1.5266*** (5.040)
1.8612*** (6.234)
1.4750*** (5.008)
2.7722*** (3.668)
1.6938*** (3.828)
1.6793*** (3.809)
1.9259*** (4.314)
1.6783*** (3.811)
LRPGDP1 1.3643*** (10.696)
1.1583*** (8.191)
1.3538*** (9.417)
1.3610*** (9.301)
1.3383*** (9.545)
1.1484*** (9.788)
1.0793*** (9.045)
1.0928*** (9.112)
1.1348*** (8.520)
1.0891*** (9.142)
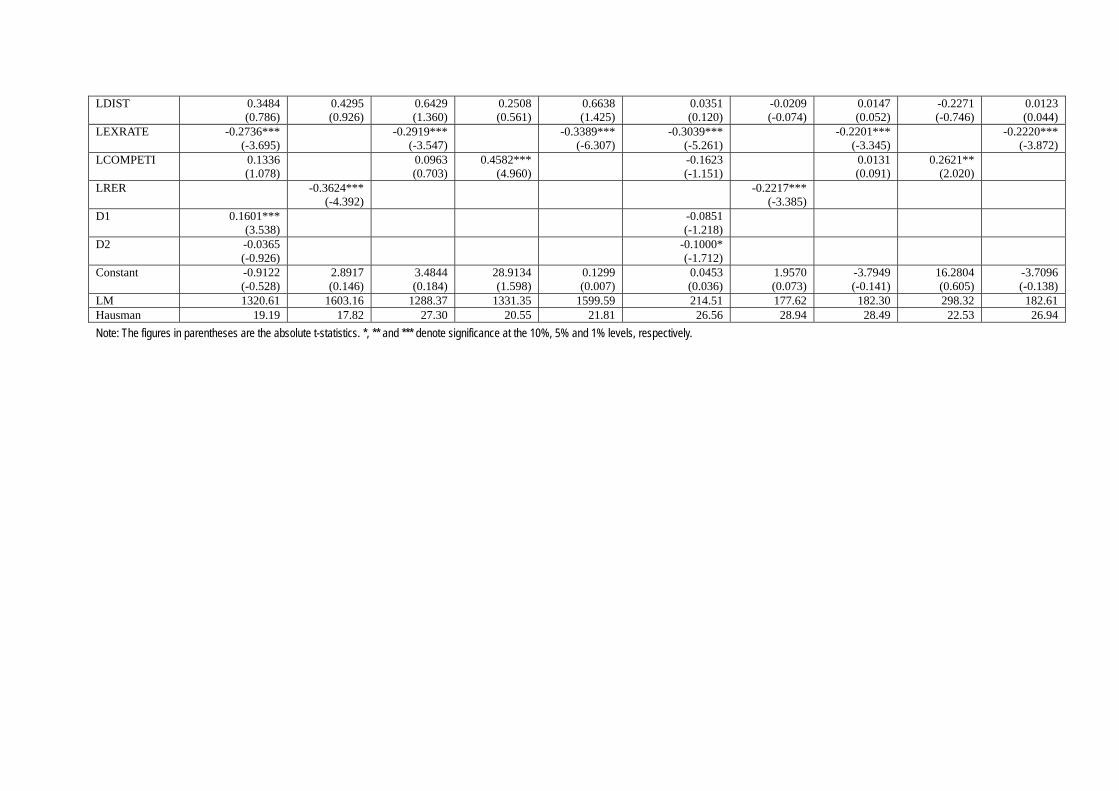
LDIST 0.3484 (0.786)
0.4295 (0.926)
0.6429 (1.360)
0.2508 (0.561)
0.6638 (1.425)
0.0351 (0.120)
-0.0209 (-0.074)
0.0147 (0.052)
-0.2271 (-0.746)
0.0123 (0.044)
LEXRATE -0.2736*** (-3.695)
-0.2919*** (-3.547)
-0.3389*** (-6.307)
-0.3039*** (-5.261)
-0.2201*** (-3.345)
-0.2220*** (-3.872)
LCOMPETI 0.1336 (1.078)
0.0963 (0.703)
0.4582*** (4.960)
-0.1623 (-1.151)
0.0131 (0.091)
0.2621** (2.020)
LRER -0.3624*** (-4.392)
-0.2217*** (-3.385)
D1 0.1601*** (3.538)
-0.0851 (-1.218)
D2 -0.0365 (-0.926)
-0.1000* (-1.712)
Constant -0.9122 (-0.528)
2.8917 (0.146)
3.4844 (0.184)
28.9134 (1.598)
0.1299 (0.007)
0.0453 (0.036)
1.9570 (0.073)
-3.7949 (-0.141)
16.2804 (0.605)
-3.7096 (-0.138)
LM 1320.61 1603.16 1288.37 1331.35 1599.59 214.51 177.62 182.30 298.32 182.61 Hausman 19.19 17.82 27.30 20.55 21.81 26.56 28.94 28.49 22.53 26.94 Note: The figures in parentheses are the absolute t-statistics. *, ** and *** denote significance at the 10%, 5% and 1% levels, respectively.

BOFIT Discussion Papers http://www.bof.fi/bofit
2006 No 1 Tuuli Juurikkala and Olga Lazareva: Lobbying at the local level: Social assets in Russian firms No 2 Laura Solanko: Coping with missing public infrastructure: An analysis of Russian industrial enterprises No 3 Konstantin Gluschenko and Darya Kulighina: Assessing a feasible degree of product market integration (a pilot analysis) No 4 Tuuli Juurikkala and Olga Lazareva: Non-wage benefits, costs of turnover and labor attachment: Evidence from Russian firms No 5 Olena Havrylchyk and Emilia Jurzyk: Profitability of foreign banks in Central and Eastern Europe: Does the entry mode matter? No 6 Declan Curran and Michael Funke: Taking the temperature – forecasting GDP growth for mainland China No 7 Konstantin Gluschenko: Russia's common market takes shape: Price convergence and market integration among Russian regions No 8 Fabrizio Coricelli, Balázs Égert and Ronald MacDonald: Monetary transmission mechanism in Central and Eastern Europe: Gliding on a wind of change No 9 Konstantin Gluschenko: Biases in cross-space comparisons through cross-time price indexes: The case of Russia No 10 Aaron Mehrotra: Demand for money in transition: Evidence from China’s disinflation No 11 Kirill Sosunov and Oleg Zamulin: The inflationary consequences of real exchange rate targeting via accumulation of reserves No 12 Iftekhar Hasan, Paul Wachtel and Mingming Zhou: Institutional development, financial deepening and economic growth: Evidence from China No 13 Alexei Karas, William Pyle and Koen Schoors: Sophisticated discipline in a nascent deposit market: Evidence from post-communist Russia No 14 Zuzana Fungáčová and Jan Hanousek: A castle built on sand: Tthe effects of mass privatization on stock market creation in transition economies No 15 Yuging Xing: Exchange rate policy and the relative distribution of FDI among host countries No 16 Roberta Colavecchio and Michael Funke: Volatility transmissions between renminbi and Asia-Pacific on- shore and off-shore U.S. dollar futures No 17 Svetlana Ledyaeva and Mikael Linden: Foreign direct investment and economic growth: Empirical evidence from Russian regions No 18 Arnaud Mehl: The yield curve as a predictor and emerging economies No 19 Jiao Wang and Andy G. Ji: Exchange rate sensitivity of China’s bilateral trade flows

Bank of Finland BOFIT – Institute for Economies in Transition
PO Box 160 FIN-00101 Helsinki
+ 358 10 831 2268 [email protected]
http://www.bof.fi/bofit


