
WR-211 Page 1
EXHIBIT WR-211
REBUTTAL TESTIMONY OF JEFFREY YEAZELL
My rebuttal testimony directly addresses certain issues raised by the Written Testimony of Greg Young,
P.E. (Exhibit BBID392). Mr. Young made seven (7) conclusions regarding alleged errors in the demand-
side of the water availability analysis performed by staff of the State Water Resources Control Board
(SWRCB) in 2015 (Exhibit BBID392, ¶5). My rebuttal testimony specifically addresses the following
alleged conclusions reached by Mr. Young: (2) “the SWRCB failed to effectively use 2015 water use data
submitted to the SWRCB by diverters to adjust its forecasts of water demands” (¶ 27); (3) “the SWRCB
included duplicate demands for numerous rights in the Delta, thereby inflating the demand values used
to assess water availability for purposes of the curtailment notices and enforcement orders” (¶¶ 28-33);
and (7) “general data entry mistakes” (¶¶ 38-42).
I will also address Mr. Young’s first conclusion, namely the correct quantification of demands that can
“rightfully” be charged against full natural flow (¶¶ 7-25), but I will address that point at the end of my
rebuttal testimony. The other conclusions reached by Mr. Young (conclusions #4-6, as well as conclusion
#1) are addressed in the rebuttal statements of Brian Coats and Kathy Mrowka.
Young Conclusion #2: 2015 Informational Order Data (Exhibit BBID392, ¶27)
Mr. Young testifies that the Water Board “failed to effectively use 2015 water use data submitted by
diverters to adjust its forecasts of water demands” (¶5). Mr. Young is correct that the staff did not use
all of the 2015 information in the Water Availability Analyses (WAAs1) associated with the May and June
Notices of Water Unavailability (Notices). Mr. Young claims he replaced 2014 Information Order data
with that from 2015 and that “there were individual increases and decreases in monthly values, but an
overall reduction in the total monthly values” (¶27). To evaluate the accuracy and significance of Mr.
Young’s claim, I revised the supply/demand plot associated with the June 12, 2015, Notice (Exhibit WR-
77) by replacing the reported 2014 Information Order diversions included in the original WAA with the
reported 2015 Information Order reported demands. The reconstructed or revised plot using the 2015
Information Order demand data is included as Figure 1.
1 As Brian Coats and Kathy Mrowka explained in their case-in-chief testimony, the drought supply and demand analysis conducted in 2015 is not the same as a “Water Availability Analysis” conducted for water right permitting. I use the term Water Availability Analysis here for convenience.

WR-211 Page 2
Appendix A, attached to this testimony, contains a report describing the process I took to update the
demand data and construct the plot in Figure 1. To perform this substitution, I used the R programming
language (Foundation for Statistical Computing, Vienna, Austria), a free, open-source software
environment for statistical computing, data analysis, and graphics. I chose to use R to provide a level of
reproducibility that is not as easily accomplished using Excel spreadsheets. R scripts provide a line-by-
line story of how the raw data was read, cleaned, manipulated, and analyzed to become the resulting
data set. The R script, when applied to the identical raw data, will always produce the same result. I
have used R for various statistical and data analysis projects for over ten years. My updated resume is
provided as Exhibit WR-212 (true and correct copy) to document recent training I have taken to further
enhance my expertise in R programming and data analysis.
A zipped file containing true and correct copies of the R script and data files used to perform the revision
are presented as Exhibit WR-239 (true and correct copy). Note that this is not a ‘new’ analysis. The R
script described in Appendix A simply removed the 2014 Information Order diversions and replaced
them with the corresponding 2015 Information Order demands in a manner consistent with the original
WAA, then constructed the revised supply/demand plot in Figure 1.
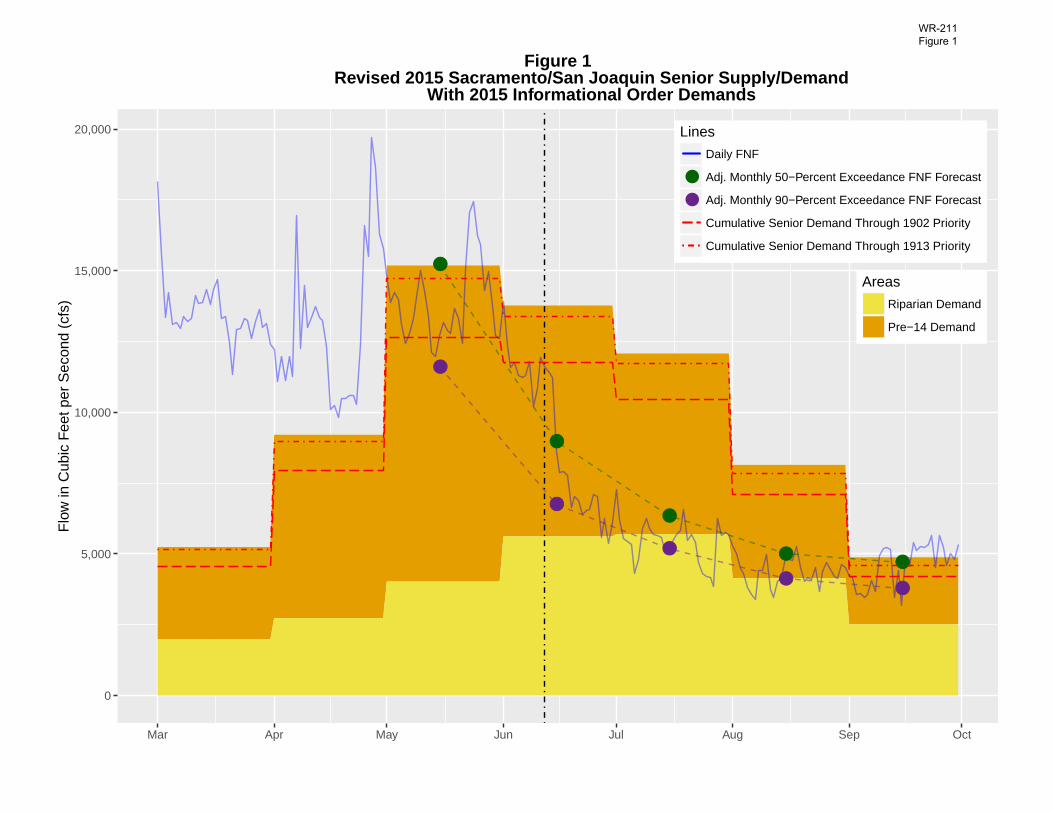
Looking at Figure 1, the yellow and orange/tan shaded areas of the plot represent the resulting
aggregate Riparian and Pre-1914 demand, respectively. The green and purple points represent the
adjusted monthly FNF exceedance forecasts at the 50- and 90-percent levels, respectively. Each point
reflects the value for the entire month in which it is centered. The dashed lines connecting these points
do not represent any values; they just help the viewer follow the trend of each set of points. The blue
line represents the combined ten-station daily FNF flows. The red dashed line represents the cumulative
Senior demand through the 1902 priority level, and the red dashed/dotted line represents the
cumulative Senior demand through the 1913 priority level. The black vertical dashed line indicates the
day on which the Notice was issued (June 12, 2015).
As indicated on Figure 1, the water supply represented by the June adjusted 50-percent Exceedance FNF
Forecast (the green point) is well below the June cumulative senior demand through the 1902 priority
level (the red dashed line). The difference between the June adjusted 50-percent Exceedance FNF
Forecast and the 1913 priority level (the red dashed line) is even greater. BBID’s 1914 demand is above
the 1913 line. The following flow and demand values are applicable for June:
• Riparian Demand: 5,622 cfs.

WR-211 Page 3
• Pre-1914 Demand: 8,150 cfs.
• Combined Riparian and Pre-1914 Demand: 13,771 cfs.
• Senior Demand Through 1902: 11,759 cfs.
• Adjusted 50% Exceedance Forecasted FNF: 8,974 cfs.
From Exhibit WR-77, the June Senior demand through the 1902 priority year was originally calculated to
be 13,560 cfs (Cell H119 on the Senior Chart Data tab), which indicates a reduction of 1,801 cfs, or 15
percent by replacing the reported 2014 Information Order demands with the 2015 demands.
With all other parameters in the WAA associated with the June 12, 2015, Notice (Exhibit WR-77) being
equal, the combined demands did decrease, but not to the extent that they would have changed staff’s
recommendations on issuing the Notices when they did.
YOUNG CONCLUSION #3: ALLEGED DUPLICATE DEMANDS (EXHIBIT BBID392, ¶¶28-33)
Mr. Young claimed that he “discovered many instances where multiple statements had the same listed
value for the same month,” which he otherwise terms “Duplicate Delta Demands” (¶28). Mr. Young uses
six (6) examples of alleged duplicates to support his claim. He stated that he reviewed the Initial
Statements of Diversion and Use and provided some justification as to why they were duplicates, but he
failed to review the Supplemental Statements2 in which the diverters explicitly stated they were not
duplicates. True and correct copies of the 2012 Supplemental Statements for the six diversions Mr.
Young used to illustrate his claim (S020995, S021018, S021024, S021030, S021032, and S021033) are
included in Appendix B of this testimony.
As I explained in my initial testimony, I created the WRUDS spreadsheet to flag potential duplicate
reporting using the following criteria: 1) the owner name must be identical, and 2) the monthly average
demands must be equal in each individual month for all 12 months. In the Delta, the duplicate flagging
algorithm identified 196 statements that were potential duplicates that were not subject to the
Information Order.3 Prior to incorporating the 2014 data collected under the information order, all of
the demand data were evaluated for potential duplicates using the algorithm. Next, data collected
2 Supplemental Statements of Diversion and Use are available for the public to review at https://ciwqs.waterboards.ca.gov/ciwqs/ewrims/EWPublicTerms.jsp 3 Obtained from Tab 3 of Exhibit WR-77 by filtering HYDROLOGIC_UNIT to “LEGAL DELTA”; WR_TYPE to “Statement of Div and Use”; INFO_ORDER column to “Blanks”; and DUP_FLAG to “Y”; then totaling the the remaining row count in the table.

WR-211 Page 4
under the 2014 Information Order were added to the spreadsheet, under the assumption that these
demands were true and accurate.
The 196 potential duplicate demands identified by the algorithm represented 8,388 acre-feet (136 cfs)
of demand in May, and 11,395 acre-feet (185 cfs) of demand in June.4 Uncorrected, these demands are
negligible when compared to the revised total Senior demands of over 15,000 cfs in May and 13,000 cfs
in June, as illustrated on Figure 1.
With respect to the 196 potential duplicates, I reviewed the most recent Supplemental Statements of
Diversion and Use (Supplemental Statements) in the eWRIMS online database for the most potentially
significant duplicate demands. Of these, I found ten (10) confirmed cases of duplicate reporting by one
diverter, representing excess demands of 4,750 acre-feet (77 cfs) in May and 5,977 acre-feet (100 cfs) in
June. True and correct copies of the 2012 Supplemental Statements for these 10 claims are included in
Appendix C of this testimony. I confirmed these 10 cases of duplicate reporting by the comment in Box
11a of each of the Supplemental Statements: “The amounts reported represent all use for Statements
18411, 16910, 18417, 18414, 18408, 18405, 16909, 18420, 18491 and 18423.” Given such compelling
evidence of obvious duplication, the demands from nine of the ten claims were removed from the
demand data set.
To be clear, Mr. Young’s six examples of alleged duplicate Delta demands that he claims were
inappropriately included in the WAA were potential duplicates that I flagged and reviewed when
creating the demand data set. I determined these demands were not in fact duplicates because they all
shared a similar statement in Box11a of their Supplemental Statements: “The point of diversion that is
the subject of this report is one of [number varies by report] points of diversion that provided water to an
approximate [amount varies by report] acre field/parcel. For purposes of these reports, the amount of
acreage irrigated, water used and water diverted associated with each of those points of diversion has
been evenly split along them.” This was sufficient evidence to consider each of the potential duplicates
as unique diversions. A large portion of the other remaining potential duplicates in the Delta had a
similar statement in box 11a of their supplemental statements.
4 Obtained from Tab 3 of Exhibit WR-77 by filtering HYDROLOGIC_UNIT to “LEGAL DELTA”; WR_TYPE to “Statement of Div and Use”; INFO_ORDER column to “Blanks”; and DUP_FLAG to “Y”; then summing AVG_DEMAND_MAY and AVG_DEMAND_JUN, respectively.

WR-211 Page 5
On additional example from Mr. Young of a so-called duplicate merits mention (¶32). This is an example
of a diverter who failed to submit accurate information in response to the Information Order on time.
Staff has to rely on the truth, accuracy, and timeliness of the submissions, and the fact that this diverter
amended its response after the submittal deadline is unfortunate. However, a 21 cfs demand reduction
is negligible when compared to the revised total Senior demands of over 15,000 cfs in May and 13,000
cfs in June, as illustrated on Figure 1.
Finally, Mr. Young testifies that he lacked the time to evaluate all of the individual filings (¶33). So did
staff. There are over 13,000 permits, licenses, and statements in the Sacramento/San Joaquin/Delta
evaluation area, each of which had information from up to four annual reports or supplemental
statements incorporated into the demand data set. Reviewing every filing is an impossibility given the
expedited time frames needed to make curtailment decisions. Staff must assume diverters report
accurately. However, as explained in my Written Testimony (WR-11), several automatic adjustments
were made to reduce potential excessive demands, such as reducing over-reported permit and license
demands so they don’t exceed the permitted or licensed face values, and where possible, reducing
irrigation demands so they more accurately reflect an appropriate crop duty based on reported acreage.
As explained above and in my earlier testimony, staff reviewed certain annual statements to make
determinations on whether a diversion was a duplicate or not. In no instance was an attempt made to
increase demands on a particular diversion, unless specifically reported by the diverter, such as through
the Information Order. Mr. Young, on the other hand, inappropriately assumed the “likely misreporting
of monthly demands” and applied an arbitrary 5 percent reduction for total delta demand (¶33). There
is no sound basis for doing so.
YOUNG CONCLUSION #7: ALLEGED DATA ENTRY MISTAKES (EXHIBIT BBID392, ¶¶38-42)
Mr. Young claims that staff or diverters made data entry errors which when corrected would have
reduced the demand data set. His examples relate to quantities of demand that are negligible, and to
instances not where staff made data entry errors, but rather where diverters reported use statements
may or may not have contained errors. As I have stated previously, the Water Board has to rely on
diverters to report their use accurately, truthfully, and on time. Mr. Young, however, makes
assumptions that certain diverters’ statements were submitted in error. With respect to the two
examples he gives in ¶39, it is possible that the diverter may have made decimal placement errors from
one month to the next. With respect to the Water Availability Analysis, each month is considered

WR-211 Page 6
independently, and has no effect on any other month. The Prosecution Team’s Case-in-Chief focuses on
whether WSID and BBID diverted unlawfully or threatened to divert unlawfully beginning in May 2015
and June 2015, respectively. Because the excessive reporting identified by Mr. Young occurred in July,
Mr. Young’s claim is both unfounded and irrelevant.
Mr. Young pointed out two statements that he claimed resulted in demand errors because of
inconsistencies in monthly reported diversions between the years from which the average monthly
demands were calculated (¶¶40-41). According to Mr. Young, adjustments to the averages by removing
the large values would have reduced May and June demands by 13 cfs. As stated previously, staff relies
on data reported by diverters to be true and accurate. Additionally, the demand reduction of 13 cfs
suggested by Mr. Young is negligible compared to the over-5,000-cfs (visually estimated from Figure 1)
demand that would need to be removed in order to meet the 50-percent exceedance FNF forecast for
supply in July. In other words, demand exceeded supply by over 5,000 cfs in June, 2015. As such, it was
not necessary for me to confirm Mr. Young’s calculations.
Young Conclusion #1 and Final Conclusion: Reported Overall Demand Reduction:
As explained in my written testimony, staff was very generous to the diverters when analyzing both the
supply and demand data, and otherwise relied on their online reporting data to be truthful and
accurate. Mr. Young failed to acknowledge the significant amount of demand removed right off the top
of the demand data set by staff applying the gross adjustments to the demand data as described in my
initial testimony (Exhibit WR-11). Adjustments were made on a bulk scale to the most justifiable and
flagrant over-reporting errors (diversions exceeding face values for Post-1914 appropriative rights and
diversions exceeding eight-acre-foot/acre crop duties for senior rights that had a net acreage value
listed), power-only diversions, and potential duplicate reporting when developing the demand data set.
For example, using the data in the WRUDS 2015-06-09 tab from Exhibit WR-77, the raw, unadjusted,
four-year average total June diversion amount for the Riparian and Pre-1914 claims in the WAA
boundary, excluding statements subject to the Information Order, was about 808,000 acre-feet5 (13,600
5 Determined by filtering the AREA column to include SACRAMENTO, SAN JOAQUIN, and LEGAL DELTA; the WR_TYPE to “Statement of Div and Use”; the INFO_ORDER column to “Blanks”, then totaling the AV_DIV_JUN column.

WR-211 Page 7
cfs). The resulting June demand after the bulk adjustments were made was about 139,000 acre-feet6
(2,350 cfs). This is a demand reduction of over 80 percent!
Nevertheless, it is the conclusion of Mr. Young and Mr. Bonsignore that if staff had modified the
demands even further to account for spatial issues associated with where demand can be met with
supply and other issues (see Rebuttal Testimony of Brian Coats, Exhibit WR-210), there would have been
“no reasonable basis for the SWRCB to conclude that water was unavailable” for WSID and BBID in May
and June 2015, respectively. His support for this position is offered in Exhibits BBID273 and BBID285
(¶43 and ¶45). Mr. Young and Mr. Bonsignore are wrong.
The Excel workbook Mr. Young used to create his graphs in Exhibits BBID273 and BBID385 was not
initially available to me to review. Of note, on each graph, Mr. Young only plotted the daily Full Natural
Flows to the beginning of June. His graphs are misleading because they fail to provide any data on
supply after June 7. Therefore, he does not provide any water supply data to compare his revised
demands to. Even if Mr. Young and Mr. Bonsignore are correct in their identification and quantification
of excess demand, there still wasn’t enough water to satisfy WSID’s and BBID’s demands. To illustrate
this, on Figure 2 I superimposed the 50-percent Exceedance FNF forecast used in the WAA of Exhibit
WR-77 on Mr. Young’s graph on Exhibit BBID285. It clearly indicates there is still not enough supply to
satisfy these diverters’ demands. Accordingly, all of Mr. Young’s testimony is irrelevant.
Mr. Young’s Excel workbook was ultimately made available to me on February 18, 2016 via BBID’s
lawyer, Mr. Dan Kelly. A true and correct copy of this workbook as received from Mr. Kelly is presented
as Exhibit WR-237. To further exemplify the lack of supply, I added the adjusted 50% Exceedance FNF
forecast points from the WAA associated with the June 12 Notice, as well as additional daily FNF data
through September, to the workbook Mr. Young used to create the plot in Exhibit 385. A true and
correct copy of the workbook with my additions is presented as Exhibit WR-238. The data I added to the
plot is located in columns J, K, and L of the ‘Modified Senior Demand’ tab, and are highlighted in yellow.
Figure 3 shows a modified version of Exhibit BBId385 with the FNF Forecast points in red and the
additional daily FNF data line in light blue. These additional data again demonstrate there is still not
enough supply to satisfy these diverters’ demands, and Mr. Young’s testimony continues to be
irrelevant.
6 Determined by filtering the AREA column to include SACRAMENTO, SAN JOAQUIN, and LEGAL DELTA; the WR_TYPE to “Statement of Div and Use”; the INFO_ORDER column to “Blanks”, then totaling the DEMAND_JUN column.
●
●
●
●●
●
●
●
●●
0
5,000
10,000
15,000
20,000
Mar Apr May Jun Jul Aug Sep Oct
Flo
w in
Cub
ic F
eet p
er S
econ
d (c
fs)
Lines
●
●
Daily FNF
Adj. Monthly 50−Percent Exceedance FNF Forecast
Adj. Monthly 90−Percent Exceedance FNF Forecast
Cumulative Senior Demand Through 1902 Priority
Cumulative Senior Demand Through 1913 Priority
Areas
Riparian Demand
Pre−14 Demand
Figure 1 Revised 2015 Sacramento/San Joaquin Senior Supply/Demand
With 2015 Informational Order Demands
WR-211 Figure 1

0
2,000
4,000
6,000
8,000
10,000
12,000
14,000
16,000
18,000
20,000
Time-Av
eraged
Cub
icFeetp
erSecon
d(CFS)
2015CombinedSacramento/SanJoaquinRiverBasinSeniorSupply/DemandwithRevisedSeniorDemandsandPost-14rightstoApril17,1916
MAR APR MAY JUN JUL AUG SEP
MonthlyReducOoninWRUDSSeniorDemand
AddiOonalPost-14rightsuptoApril17,1916
RevisedSeniorDemand
0
2,000
4,000
6,000
8,000
10,000
12,000
14,000
16,000
18,000
20,000
MAR APR MAY JUN JUL AUG SEP
DailyFNF
BB
ID Exh. 385
FIGURE 250% EXCEEDANCE FNF FORECAST SUPERIMPOSED OVER EXHIBIT BBID-385
50% EXCEEDANCEFNF FORECAST
WR-211 Figure 2

0
2,000
4,000
6,000
8,000
10,000
12,000
14,000
16,000
18,000
20,000
Time‐Av
eraged
Cub
ic Feet p
er Secon
d (CFS)
2015 Combined Sacramento/San Joaquin River Basin Senior Supply/Demandwith Revised Senior Demands and Post‐14 rights to April 17, 1916
MAR APR MAY JUN JUL AUG SEP
Monthly Reduction in WRUDS Senior Demand
Additional Post‐14 rightsup to April 17, 1916
Revised Senior Demand
FIGURE 3Mr. Young's and Mr. Bonsignore's Revised Senior Demands
With Addition of 50% Exceedance FNF Forecasts From Exhibit WR‐77and Extension of Daily FNFs Through September
Daily FNF
Adj. 50% ExceedanceFNF Forecast
WR-211 Figure 3

Appendix ARevised Supply/Demand Plot
For June 12, 2015, Water Unavailability NoticeIncorporating 2015 Information Order Diversions
Jeffrey Yeazell, P.E.SWRCB, Division of Water Rights
February 19, 2016
Summary
I revised the supply/demand plot associated with the June 12, 2015, Notice of Water Un-
availability by replacing the monthly 2014 Information Order demands that were used in the
original Water Availability Analysis (WAA) associated with the June 12, 2015, Notice of Wa-
ter Unavailability (Notice) with the monthly 2015 diversions for those statements that had re-
ported. I performed the revisions using R Statistical Software (Foundation for Statistical Com-
puting, Vienna, Austria), a free, open-source software environment for statistical computing,
data analysis, and graphics. The R script I created to construct the revised plot is named
WR-77-Revised-Plot.R, and the raw data files are stored in the Data folder of the zipped
project file (Exhibit WR-239). The general sequence of steps taken to revise the plot were as
follows:
1. Extract the supply and demand data from the original WAA worksheet and save them as
comma-separated-values (CSV) files.
2. Load the original raw demand CSV files and raw 2015 Information Order demand file.
A-1
WR-211 App A Page 1

3. Clean and tidy the 2015 Information Order demand data set.
4. Clean and tidy the Sacramento/San Joaquin and Delta data sets.
5. Remove and replace existing 2014 Information Order demands with corresponding 2015
values.
6. Load and tidy original supply data.
7. Combine the above data sets into a single data frame from which to build the sup-
ply/demand plot.
The following sections describe the procedures and methods I used to prepare the data,
process the data, and build the resulting supply/demand plot.
Data Preparation
The initial demands used in developing the revision were obtained from the WAA workbook
associated with the June 12, 2015, Notices of Water Unavailability (Exhibit WR-77). I saved the
first tab of the workbook as a CSV file (WR-77 20150610_sacsjcombined_tab1.csv), which
was used to retrieve the demand data for the Sacramento and San Joaquin areas. I saved the
third tab of the workbook as WR-77 20150610_sacsjcombined_tab3.csv), which was used
to retrieve the demand data for the Delta.
On January 29, 2015, I downloaded the latest 2015 Information Order raw data file from the
Water Board’s intranet and saved it as a CSV file (2015actual_tbl4_2016-01-29.csv). Prior
to saving it, I removed columns containing personal information including login information,
addresses, and telephone numbers.
A-2
WR-211 App A Page 2
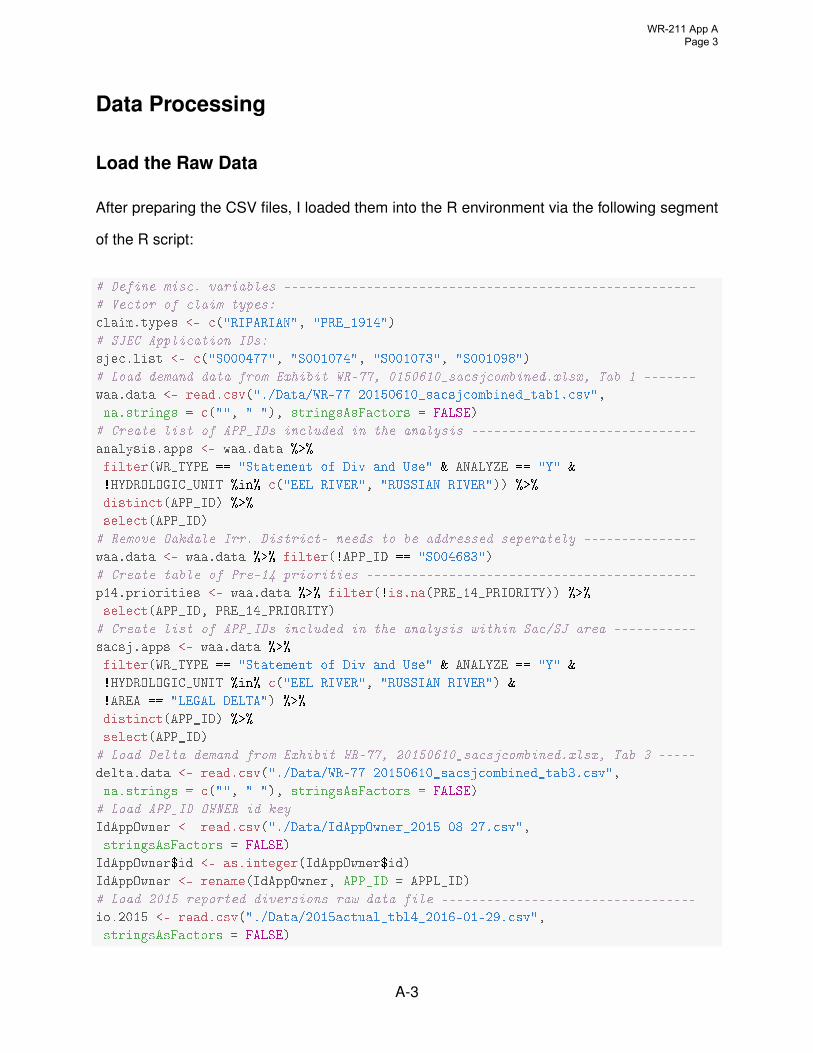
Data Processing
Load the Raw Data
After preparing the CSV files, I loaded them into the R environment via the following segment
of the R script:
# Define misc. variables -------------------------------------------------------
# Vector of claim types:
claim.types <- c("RIPARIAN", "PRE_1914")
# SJEC Application IDs:
sjec.list <- c("S000477", "S001074", "S001073", "S001098")
# Load demand data from Exhibit WR-77, 0150610_sacsjcombined.xlsx, Tab 1 -------
waa.data <- read.csv("./Data/WR-77 20150610_sacsjcombined_tab1.csv",
na.strings = c("", " "), stringsAsFactors = FALSE)
# Create list of APP_IDs included in the analysis ------------------------------
analysis.apps <- waa.data %>%
filter(WR_TYPE == "Statement of Div and Use" & ANALYZE == "Y" &
!HYDROLOGIC_UNIT %in% c("EEL RIVER", "RUSSIAN RIVER")) %>%
distinct(APP_ID) %>%
select(APP_ID)
# Remove Oakdale Irr. District- needs to be addressed seperately ---------------
waa.data <- waa.data %>% filter(!APP_ID == "S004683")
# Create table of Pre-14 priorities --------------------------------------------
p14.priorities <- waa.data %>% filter(!is.na(PRE_14_PRIORITY)) %>%
select(APP_ID, PRE_14_PRIORITY)
# Create list of APP_IDs included in the analysis within Sac/SJ area -----------
sacsj.apps <- waa.data %>%
filter(WR_TYPE == "Statement of Div and Use" & ANALYZE == "Y" &
!HYDROLOGIC_UNIT %in% c("EEL RIVER", "RUSSIAN RIVER") &
!AREA == "LEGAL DELTA") %>%
distinct(APP_ID) %>%
select(APP_ID)
# Load Delta demand from Exhibit WR-77, 20150610_sacsjcombined.xlsx, Tab 3 -----
delta.data <- read.csv("./Data/WR-77 20150610_sacsjcombined_tab3.csv",
na.strings = c("", " "), stringsAsFactors = FALSE)
# Load APP_ID-OWNER-id key -----------------------------------------------------
IdAppOwner <- read.csv("./Data/IdAppOwner_2015-08-27.csv",
stringsAsFactors = FALSE)
IdAppOwner$id <- as.integer(IdAppOwner$id)
IdAppOwner <- rename(IdAppOwner, APP_ID = APPL_ID)
# Load 2015 reported diversions raw data file ----------------------------------
io.2015 <- read.csv("./Data/2015actual_tbl4_2016-01-29.csv",
stringsAsFactors = FALSE)
A-3
WR-211 App A Page 3

This script created several reference tables for future use, including: p14.priorities,
which contains the list of priority years for Pre-1914 claims, analysis.apps, which contains
the list of statements used in the WAA, and sacsj.apps, which contains the list of statements
within the greater Sacramento and San Joaquin watersheds.
The original WAA spreadsheet had four entries for Oakdale Irrigation District’s (OID’s) Pre-
1914 claim (S004683). These represented OID’s reported demands being distributed among
the four adjudicated priority years and associated diversion rates (5 cfs at at an 1855 priority,
127 cfs at an 1885 priority, 66.2 cfs at a 1902 priority, and 847.8 cfs at a 1909 priority). The
script segment above removed OID’s 2014 entries, so they could be replaced with the revised
2015 entries after the reported 2015 demands were distributed to the four priority years/flow
rates identified in the adjudication.
Process the Information Order 2015 Demand
The raw Information Order 2015 data download required considerable cleanup to make it us-
able. Because of the many inaccurate Application ID values entered by the diverters, I created
a key file that relates id to the correct Application ID and Owner from the initial submission
for the 2014 and projected 2015 data. This CSV file is named IdAppOwner_2015-08-27.csv,
and is located in the Data folder of the project folder. Rows with inconsistent records were
removed, unneeded columns were dropped (the 2015 actual demands were kept), the row IDs
were cross-referenced with the known ID-APP_ID-Owner key table (IdAppOwner) to filter out
false entries, and the data frame was rearranged into a long-tidy form. The monthly direct-
diversion and diversion-to-storage amounts were then combined for each statement, and any
row with an empty demand field was dropped, so that it would not replace an existing value.
In other words, if in any month a statement did not contain a 2015 diversion value, the existing
2014 value was kept. Finally, diversions by statements that were not included in the WAA
were removed by comparing the Application IDs to those in analysis.apps. The resulting
data frame, io.2015, was generated using the following segment of the script:
A-4
WR-211 App A Page 4

# IO 2015 Data cleanup ---------------------------------------------------------
# Remove non-ASCII characters in id field:
io.2015$id <- gsub("[^[:alnum:]///' ]", "", io.2015$id)
# Remove rows that have blank ids:
io.2015 <- subset(io.2015,!grepl("^[[:space:]]*$",id))
io.2015 <- subset(io.2015,app_no!="")
# Remove rows that have non-numeric ids, convert id column to integer:
io.2015 <- io.2015[!is.na(as.numeric(io.2015$id)),]
io.2015$id <- as.integer(io.2015$id)
# Keep id and actual diversions columns:
io.2015 <- io.2015 %>%
select(id,matches("^actual"))
# Join io.2015 to IdAppOwner:
io.2015 <- io.2015 %>%
inner_join(IdAppOwner,io.2015,by="id") %>%
select(APP_ID, OWNER, starts_with("actual"))
# Convert diversion columns to numeric:
io.2015 <- japply(io.2015, which(sapply(io.2015, class)=="integer"),
as.numeric )
# Tidy data --------------------------------------------------------------------
io.2015 <- io.2015 %>% gather(key, demand,-c(APP_ID,OWNER))
io.2015$key <- gsub("actual", "", io.2015$key)
io.2015$key <- gsub("direct", "direct.", io.2015$key)
io.2015$key <- gsub("storage", "storage.", io.2015$key)
io.2015$key <- gsub("pre", ".pre", io.2015$key)
io.2015$key <- ifelse (grepl("[0-9]$", io.2015$key),
paste(io.2015$key,".riparian",sep=""), io.2015$key)
io.2015 <- separate(io.2015, key, c("DivType","Month","PriorityType"))
io.2015$PriorityType[io.2015$PriorityType == "pre"] <- "pre-14"
io.2015$Month <- as.numeric(io.2015$Month)
# Combined direct dversion and diversion to storage ----------------------------
io.2015<-melt(io.2015,id=c("APP_ID","OWNER","DivType","Month","PriorityType"))
io.2015 <- dcast(io.2015,APP_ID+OWNER+Month+PriorityType~variable,sum)
# Remove NA amounts- 2014 demands apply if nor reporting for 2015 --------------
io.2015 <- io.2015 %>% filter(!is.na(demand))
# Remove apps that are not in analysis -----------------------------------------
io.2015 <- io.2015 %>% filter(APP_ID %in% analysis.apps$APP_ID)
The io.2015 data frame contains 947 statements within the analysis area having usable
2015 demands.
A-5
WR-211 App A Page 5

Process The Sacramento and San Joaquin Demand
The following script segment retrieved the Sacramento/San Joaquin area demands from the
primary demand data set (waa.data). The resulting data frame, sacsj.data, was cleaned,
tidied, then removed of statements that had corresponding 2015 Information Order demands.
# Copy data from waa.data, filter to include Sac/SJ APP_IDs --------------------
sacsj.data.old <- waa.data %>%
filter(APP_ID %in% sacsj.apps$APP_ID)
# Remove unnecessary columns ---------------------------------------------------
sacsj.data.old <- sacsj.data.old %>%
select(APP_ID, OWNER = PRIMARY_OWNER, AREA, RIPARIAN, PRE_1914,
PRE_14_PRIORITY, DEMAND_JAN, DEMAND_FEB, DEMAND_MAR, DEMAND_APR,
DEMAND_MAY, DEMAND_JUN, DEMAND_JUL, DEMAND_AUG, DEMAND_SEP,
DEMAND_OCT, DEMAND_NOV, DEMAND_DEC)
# Tidy remaining data set ------------------------------------------------------
sacsj.data.old <- sacsj.data.old %>%
gather(Month, demand, starts_with("DEMAND_"))
# Replace DEMAND_ with month number --------------------------------------------
sacsj.data.old$Month <- plyr::mapvalues(sacsj.data.old$Month,
c("DEMAND_JAN", "DEMAND_FEB", "DEMAND_MAR",
"DEMAND_APR", "DEMAND_MAY", "DEMAND_JUN",
"DEMAND_JUL", "DEMAND_AUG", "DEMAND_SEP",
"DEMAND_OCT", "DEMAND_NOV", "DEMAND_DEC"),
c(1:12))
sacsj.data.old$Month <- as.numeric(sacsj.data.old$Month)
# Convert RIPARIAN and PRE_1914 columns to logicals ----------------------------
sacsj.data.old[claim.types][is.na(sacsj.data.old[claim.types])] <- FALSE
sacsj.data.old[claim.types] <- lapply(sacsj.data.old[claim.types],
function(x) gsub("^Y", TRUE, x))
sacsj.data.old[claim.types] <- lapply(sacsj.data.old[claim.types],
function(x) as.logical(x))
# Create Claim Type column -----------------------------------------------------
sacsj.data.old <- sacsj.data.old %>%
mutate(ClaimType = ifelse(PRE_1914 & !RIPARIAN, "pre-14",
ifelse(PRE_1914 & RIPARIAN,
"both", "riparian"))) %>%
select(APP_ID, OWNER, ClaimType, PRE_14_PRIORITY, Month, demand)
# make lists of IO apps in demand table-----------------------------------------
sacsj.io.apps <- sacsj.data.old %>%
filter(APP_ID %in% io.2015$APP_ID)%>%
select(APP_ID) %>%
distinct(APP_ID)
# Remove statements having 2015 Info Order responses ---------------------------
sacsj.data <- sacsj.data.old %>%
A-6
WR-211 App A Page 6

filter(!APP_ID %in% io.2015$APP_ID)
Process The Delta Demand
The following script segment generally performed the same data processing for the Delta data
as previously done for the Sacramento/San Joaquin data:
# Remove columns not needed for analysis: --------------------------------------
delta.data <- delta.data %>%
select(APP_ID, OWNER = PRIMARY_OWNER, AREA, RIPARIAN, PRE_1914,
PRE_14_PRIORITY, DEMAND_JAN, DEMAND_FEB, DEMAND_MAR, DEMAND_APR,
DEMAND_MAY, DEMAND_JUN, DEMAND_JUL, DEMAND_AUG, DEMAND_SEP,
DEMAND_OCT, DEMAND_NOV, DEMAND_DEC)
# Tidy remaining data set ------------------------------------------------------
delta.data <- delta.data %>%
gather(Month, demand, starts_with("DEMAND_"))
# Replace DEMAND_ with month number --------------------------------------------
delta.data$Month <- plyr::mapvalues(delta.data$Month,
c("DEMAND_JAN", "DEMAND_FEB", "DEMAND_MAR",
"DEMAND_APR", "DEMAND_MAY", "DEMAND_JUN",
"DEMAND_JUL", "DEMAND_AUG", "DEMAND_SEP",
"DEMAND_OCT", "DEMAND_NOV", "DEMAND_DEC"),
c(1:12))
delta.data$Month <- as.numeric(delta.data$Month)
# Convert RIPARIAN and PRE_1914 columns to logicals ----------------------------
delta.data[claim.types][is.na(delta.data[claim.types])] <- FALSE
delta.data[claim.types] <- lapply(delta.data[claim.types],
function(x) gsub("^Y", TRUE, x))
delta.data[claim.types] <- lapply(delta.data[claim.types],
function(x) as.logical(x))
# Create ClaimType column ------------------------------------------------------
delta.data <- delta.data %>%
mutate(ClaimType = ifelse(PRE_1914 & !RIPARIAN, "pre-14",
ifelse(PRE_1914 & RIPARIAN, "both", "riparian"))) %>%
select(APP_ID, OWNER, ClaimType, PRE_14_PRIORITY, Month, demand)
# Identify s only claims in Delta -----------------------------------------
delta.p14.apps <- delta.data %>%
filter(ClaimType == "pre-14") %>%
select(APP_ID) %>%
distinct(APP_ID)
# Make lists of IO apps in Delta -----------------------------------------------
delta.io.apps <- delta.data %>%
filter(APP_ID %in% io.2015$APP_ID)%>%
A-7
WR-211 App A Page 7
select(APP_ID) %>%
distinct(APP_ID)
# Remove statements in 2015 Info Order responses -------------------------------
delta.data <- delta.data %>%
filter(!APP_ID %in% io.2015$APP_ID)
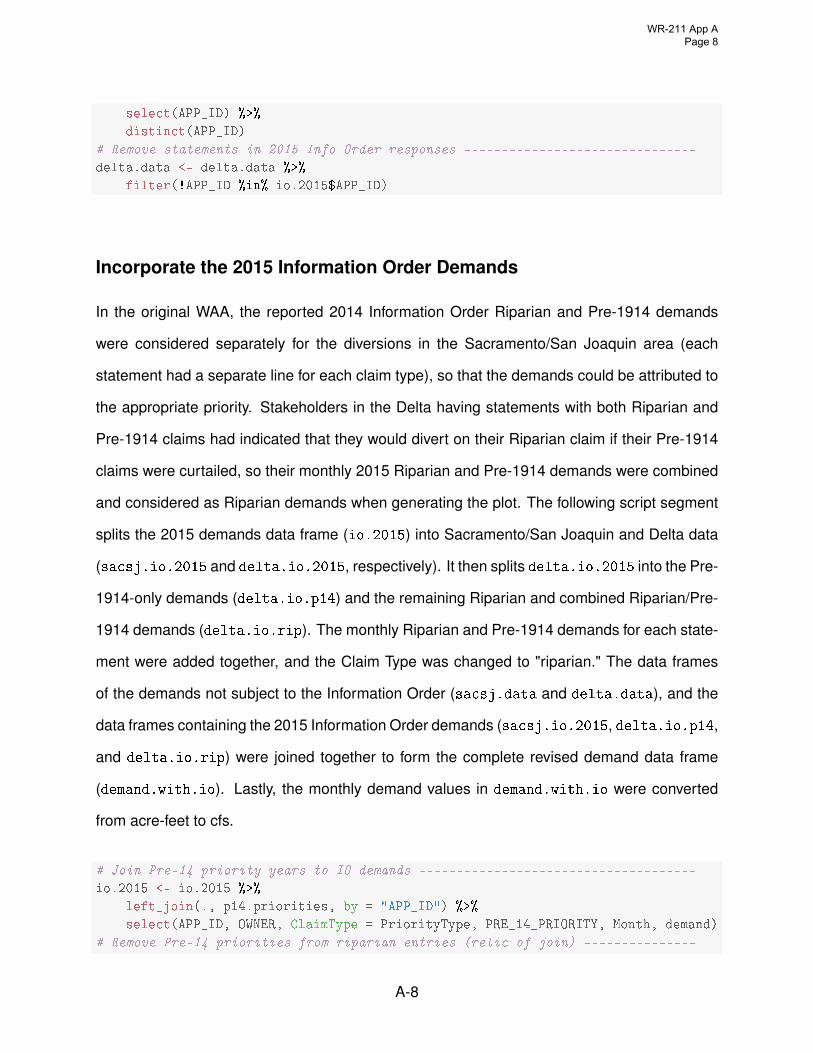
Incorporate the 2015 Information Order Demands
In the original WAA, the reported 2014 Information Order Riparian and Pre-1914 demands
were considered separately for the diversions in the Sacramento/San Joaquin area (each
statement had a separate line for each claim type), so that the demands could be attributed to
the appropriate priority. Stakeholders in the Delta having statements with both Riparian and
Pre-1914 claims had indicated that they would divert on their Riparian claim if their Pre-1914
claims were curtailed, so their monthly 2015 Riparian and Pre-1914 demands were combined
and considered as Riparian demands when generating the plot. The following script segment
splits the 2015 demands data frame (io.2015) into Sacramento/San Joaquin and Delta data
(sacsj.io.2015 and delta.io.2015, respectively). It then splits delta.io.2015 into the Pre-
1914-only demands (delta.io.p14) and the remaining Riparian and combined Riparian/Pre-
1914 demands (delta.io.rip). The monthly Riparian and Pre-1914 demands for each state-
ment were added together, and the Claim Type was changed to "riparian." The data frames
of the demands not subject to the Information Order (sacsj.data and delta.data), and the
data frames containing the 2015 Information Order demands (sacsj.io.2015, delta.io.p14,
and delta.io.rip) were joined together to form the complete revised demand data frame
(demand.with.io). Lastly, the monthly demand values in demand.with.io were converted
from acre-feet to cfs.
# Join Pre-14 priority years to IO demands -------------------------------------
io.2015 <- io.2015 %>%
left_join(., p14.priorities, by = "APP_ID") %>%
select(APP_ID, OWNER, ClaimType = PriorityType, PRE_14_PRIORITY, Month, demand)
# Remove Pre-14 priorities from riparian entries (relic of join) ---------------
A-8
WR-211 App A Page 8

io.2015 <- io.2015 %>%
mutate(PRE_14_PRIORITY = ifelse(ClaimType == "riparian",
NA, PRE_14_PRIORITY))
# Split io.2015 into Sac/SJ and Delta ------------------------------------------
sacsj.io.2015 <- io.2015 %>%
filter(APP_ID %in% sacsj.io.apps$APP_ID)
delta.io.2015 <- io.2015 %>%
filter(APP_ID %in% delta.io.apps$APP_ID)
# Split delta.io.2015 into Pre-14 only claims and the rest ---------------------
delta.io.p14 <- delta.io.2015 %>%
filter(APP_ID %in% delta.p14.apps$APP_ID & ClaimType == "pre-14")
delta.io.rip <- delta.io.2015 %>%
filter(!APP_ID %in% delta.p14.apps$APP_ID)
# Combine Delta riaprian/both to riparian --------------------------------------
delta.io.rip <- delta.io.rip %>%
group_by(APP_ID, OWNER, Month) %>%
summarize(demand = sum(demand))
delta.io.rip <- delta.io.rip %>%
mutate(ClaimType = "riparian", PRE_14_PRIORITY = NA) %>%
select(APP_ID, OWNER, ClaimType, PRE_14_PRIORITY, Month, demand)
delta.io.rip <- as.data.frame(delta.io.rip)
# Combine: sacsj.data, delta.data, sacsj.io.2015, delta.io.p14, delta.io.rip ---
demand.with.io <- rbind(sacsj.data, delta.data, sacsj.io.2015,
delta.io.p14, delta.io.rip)
# Convert monthly demands from acre-feet to cfs --------------------------------
demand.with.io <- demand.with.io %>%
mutate(demand = demand / days_in_month(Month) / 1.9835)
As described previously, the original WAA spreadsheet had four entries for OID’s Pre-
1914 claim S004683, with its 2014 reported demands distributed among the four adjudicated
priority years and associated diversion rates (5 cfs at at an 1855 priority, 127 cfs at an 1885
priority, 66.2 cfs at a 1902 priority, and 847.8 cfs at a 1909 priority). The script segment below
distributes the 2015 demands by filling the demands up by seniority. For example, 5 cfs would
be distributed to the 1855 priority, then 127 cfs to the 1885, priority, and so on, until the demand
in each month has been fully distributed.
A-9
WR-211 App A Page 9

# Distrubute OID's 2015 demands consistent with adjudication -------------------
OID.amount <- io.2015 %>%
filter(APP_ID == "S004683" & ClaimType == "pre-14") %>%
mutate(demand = demand / days_in_month(Month) / 1.9835) %>% # change to cfs
select(-APP_ID, -OWNER, -ClaimType, -PRE_14_PRIORITY) %>%
spread(Month, demand)
OID.amount <- as.matrix(OID.amount)
OID.demands <- matrix(NA, nrow = 4, ncol = 12)
# Adjudicated rates for 1855, 1885, 1902, and 1909
adj.amounts <- matrix(c(5.0, 127.0, 66.2, 847.8))
# Fill up demands by priority (fill up 1855 first, then 1885, etc,)
for(i in 1:3) {
for( j in 1:12) {
if(OID.amount[j] > adj.amounts[i]) {
OID.demands[i,j] <- adj.amounts[i]
OID.amount[j] <- OID.amount[j] - adj.amounts[i]
} else
if(OID.amount[j] < adj.amounts[i]) {
OID.demands[i,j] <- OID.amount[j]
OID.amount[j] <- 0
}
}
}
OID.demands[4, ] <- OID.amount
# Rebuild dataframe to bind to demand.with.io:
OID.df <- data.frame(APP_ID = rep("S004683",4),
OWNER = rep("OAKDALE IRRIGATION DISTRICT",4),
ClaimType = rep("pre-14",4),
PRE_14_PRIORITY = c(1855, 1885, 1902, 1909),
stringsAsFactors = FALSE)
OID.df <- cbind(OID.df, OID.demands)
OID.df <- OID.df %>%
gather(key = Month, value = demand, -APP_ID, -OWNER,
-ClaimType, -PRE_14_PRIORITY)
OID.df$Month <- as.numeric(OID.df$Month)
demand.with.io <- rbind(demand.with.io, OID.df)
The resulting distribution of OID’s 2015 monthly demands was assigned as follows:
A-10
WR-211 App A Page 10

##
## --------------------------------------------------------------------------
## PRE_14_PRIORITY 1 2 3 4 5 6 7 8 9 10 11 12
## ----------------- --- --- ---- ---- ---- ---- --- ---- ---- ---- ---- ----
## 1855 0 0 5 5 5 5 5 5 5 5 4.32 0
##
## 1885 0 0 127 127 127 127 127 19.7 6.16 78.3 0 0
##
## 1902 0 0 66.2 66.2 66.2 66.2 17 0 0 0 0 0
##
## 1909 0 0 262 376 555 286 0 0 0 0 0 0
## --------------------------------------------------------------------------
Verification
To verify the completion of processing the original Sacramento/San Joaquin Demands prior to
inserting the 2015 Information Order demand values, I subset the original monthly demands
of the four statements held by the San Joaquin River Exchange Contractors (SJEC) for April
through August to show the demands used in the original WAA. I chose these four statements
because they have considerably large diversions. The following code chunk extracts and lists
the four SJEC 2014 Information Order demands used in the original WAA:
##
## ---------------------------------------------------------------
## APP_ID OWNER 4 5 6 7 8
## -------- ------------------------ ----- ----- ----- ----- -----
## S000477 CENTRAL CALIF IRRIGATION 17939 43416 59787 74100 61129
## DISTRICT
##
## S001073 COLUMBIA CANAL COMPANY 2904 4967 6776 7865 4614
##
## S001074 SAN LUIS CANAL COMPANY 4106 8400 19428 25267 18391
##
## S001098 FIREBAUGH CANAL COMPANY 2802 4578 6762 6940 5219
## ---------------------------------------------------------------
The 4, 5, 6, 7, and 8 shown in the top row of the result output above represent the cor-
responding numerical months of April through August, respectively. The demand values are
A-11
WR-211 App A Page 11
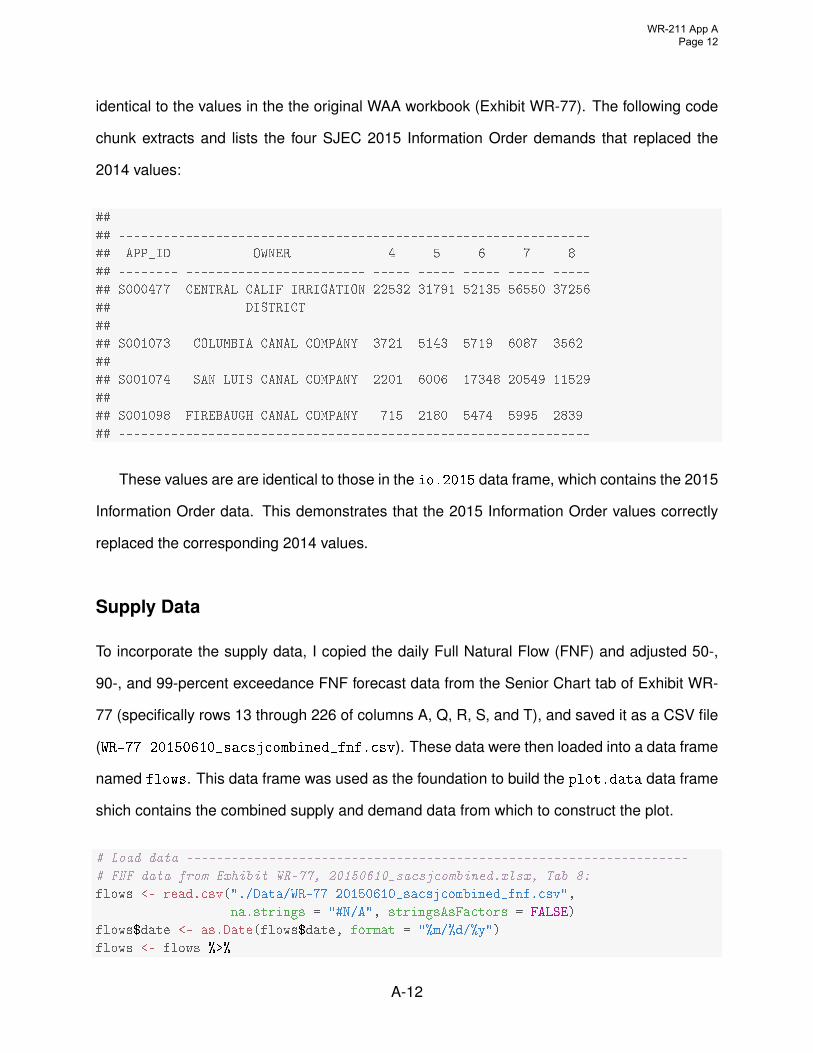
identical to the values in the the original WAA workbook (Exhibit WR-77). The following code
chunk extracts and lists the four SJEC 2015 Information Order demands that replaced the
2014 values:
##
## ---------------------------------------------------------------
## APP_ID OWNER 4 5 6 7 8
## -------- ------------------------ ----- ----- ----- ----- -----
## S000477 CENTRAL CALIF IRRIGATION 22532 31791 52135 56550 37256
## DISTRICT
##
## S001073 COLUMBIA CANAL COMPANY 3721 5143 5719 6087 3562
##
## S001074 SAN LUIS CANAL COMPANY 2201 6006 17348 20549 11529
##
## S001098 FIREBAUGH CANAL COMPANY 715 2180 5474 5995 2839
## ---------------------------------------------------------------
These values are are identical to those in the io.2015 data frame, which contains the 2015
Information Order data. This demonstrates that the 2015 Information Order values correctly
replaced the corresponding 2014 values.
Supply Data
To incorporate the supply data, I copied the daily Full Natural Flow (FNF) and adjusted 50-,
90-, and 99-percent exceedance FNF forecast data from the Senior Chart tab of Exhibit WR-
77 (specifically rows 13 through 226 of columns A, Q, R, S, and T), and saved it as a CSV file
(WR-77 20150610_sacsjcombined_fnf.csv). These data were then loaded into a data frame
named flows. This data frame was used as the foundation to build the plot.data data frame
shich contains the combined supply and demand data from which to construct the plot.
# Load data -------------------------------------------------------------------
# FNF data from Exhibit WR-77, 20150610_sacsjcombined.xlsx, Tab 8:
flows <- read.csv("./Data/WR-77 20150610_sacsjcombined_fnf.csv",
na.strings = "#N/A", stringsAsFactors = FALSE)
flows$date <- as.Date(flows$date, format = "%m/%d/%y")
flows <- flows %>%
A-12
WR-211 App A Page 12

mutate(Month = month(date)) %>%
select(date, Month, daily.FNF, forecast.50, forecast.90, forecast.99)
Build The Supply/Demand Plot Data Frame
The following script generates the plot.data data frame from which the plot is generated:
# Calculate total riparian + both demand for each month ------------------------
rip.demand <- demand.with.io %>%
filter(ClaimType %in% c("riparian", "both")) %>%
group_by(Month) %>%
summarize(rip.demand = sum(demand, na.rm = TRUE))
# Calculate total pre-14 demand for each month ---------------------------------
p14.demand <- demand.with.io %>%
filter(ClaimType == "pre-14") %>%
group_by(Month) %>%
summarize(p14.demand = sum(demand, na.rm = TRUE))
# Create summary table for plot ------------------------------------------------
plot.data <- flows %>%
left_join(., rip.demand, by = "Month") %>%
left_join(., p14.demand, by = "Month") %>%
select(-Month) %>%
gather(variable, flow, -date)
### Create df for Pre-14 Priority Lines ----------------------------------------
# Select Pre-14 demands from demand data ---------------------------------------
p14.priority.demand <- demand.with.io %>%
filter(ClaimType == "pre-14") %>%
select(PRE_14_PRIORITY, Month, demand)
# If priority year is greater than 1914, assume 1914 ---------------------------
p14.priority.demand <- p14.priority.demand %>%
mutate(PRE_14_PRIORITY = ifelse(PRE_14_PRIORITY > 1914,
1914,
PRE_14_PRIORITY))
# Subtotal Pre-14 demands by priority year, month ------------------------------
p14.priority.demand <- p14.priority.demand %>%
group_by(PRE_14_PRIORITY, Month) %>%
summarise(demand = sum(demand, na.rm = TRUE))
# Calculate cumulative Pre-14 sums ---------------------------------------------
p14.priority.demand <- p14.priority.demand %>%
group_by(Month) %>%
arrange(PRE_14_PRIORITY) %>%
mutate(cs = cumsum(demand)) %>%
A-13
WR-211 App A Page 13

select(-demand)
# Add riparian demands to Pre-14 demands to stack on plot correctly ------------
p14.priority.demand <- p14.priority.demand %>%
left_join(., rip.demand, by = "Month") %>%
mutate(cs.adj = cs + rip.demand) %>%
select(-cs, -rip.demand)
# Create df for Pre-14 plot lines ----------------------------------------------
p14.priority.demand <- as.data.frame(p14.priority.demand)
p14.priority.demand <- p14.priority.demand %>%
spread(PRE_14_PRIORITY, cs.adj)
p14.plot.df <- as.data.frame(flows$date)
names(p14.plot.df)[1] <- "date"
p14.plot.df <- p14.plot.df %>%
mutate(Month = month(date)) %>%
left_join(., p14.priority.demand, by = "Month") %>%
select(-Month)
p14.plot.df <- p14.plot.df %>% gather(variable, flow, -date)
plot.data <- rbind(plot.data, p14.plot.df)
The following script builds the plot using the ggplot2 package. The resulting plot is shown
in Figure 1.
# It's plotting time! ----------------------------------------------------------
# Color palettes:
fPalette <- c("#E69F00", "#F0E442")
lPalette <- c( "red","red", "blue", "darkgreen", "darkorchid4")
# Build plot
g <- ggplot(plot.data, aes(x = date, y = flow))
g <- g + scale_y_continuous(labels = comma)
g <- g + geom_area(data = subset(plot.data,
variable %in% c("rip.demand", "p14.demand")),
aes(fill = variable))
g <- g + geom_line(data = subset(plot.data, variable %in% "daily.FNF" &
!is.na(flow)),
aes(color = variable), alpha = 0.4)
g <- g + geom_line(data = subset(plot.data,
variable %in% c("forecast.50", "forecast.90") &
!is.na(flow)), aes(color = variable),
linetype = 2, alpha = 0.5)
g <- g + geom_point(data = subset(plot.data,
variable %in% c("forecast.50", "forecast.90") &
!is.na(flow)),
aes(color = variable), size = 4)
g <- g + geom_line(data = subset(plot.data, variable == "1902"),
aes(color = variable), linetype = 5)
A-14
WR-211 App A Page 14

g <- g + geom_line(data = subset(plot.data, variable == "1913"),
aes(color = variable), linetype = 4)
g <- g + geom_vline(xintercept = as.numeric(as.Date("2015-06-12")),
linetype = 4, color = "black")
g <- g + scale_color_manual(name="Lines",
breaks=c("daily.FNF", "forecast.50","forecast.90", "1902", "1913"),
labels=c("Daily FNF", "Adj. Monthly 50-Percent Exceedance FNF Forecast",
"Adj. Monthly 90-Percent Exceedance FNF Forecast",
"Cumulative Senior Demand Through 1902 Priority",
"Cumulative Senior Demand Through 1913 Priority"),
values = lPalette)
g <- g + scale_fill_manual(values=fPalette,
name="Areas",
breaks=c("rip.demand", "p14.demand"),
labels=c("Riparian Demand", "Pre-14 Demand"))
g <- g + guides(color = guide_legend(override.aes =
list(shape=c(NA, 16, 16, NA, NA),
linetype=c(1, 0, 0, 5, 4))))
g <- g + theme(legend.justification=c(1,1), legend.position=c(1,1), legend.box.just = "right")
g <- g + labs(title = "Figure 1
Revised 2015 Sacramento/San Joaquin Senior Supply/Demand
With 2015 Informational Order Demands") +
theme(plot.title = element_text(lineheight=.8, face="bold"))
g <- g + labs(x = "", y = "Flow in Cubic Feet per Second (cfs)")
A-15
WR-211 App A Page 15

●
●
●
● ●
●
●
●
● ●
0
5,000
10,000
15,000
20,000
Mar Apr May Jun Jul Aug Sep Oct
Flo
w in
Cub
ic F
eet p
er S
econ
d (c
fs)
Lines
●
●
Daily FNF
Adj. Monthly 50−Percent Exceedance FNF Forecast
Adj. Monthly 90−Percent Exceedance FNF Forecast
Cumulative Senior Demand Through 1902 Priority
Cumulative Senior Demand Through 1913 Priority
Areas
Riparian Demand
Pre−14 Demand
Figure 1 Revised 2015 Sacramento/San Joaquin Senior Supply/Demand
With 2015 Informational Order Demands
A-16
WR-211 App A Page 16

Discussion
Looking at Figure 1, the yellow and orange/tan shaded areas of the plot represent the re-
sulting aggregate Riparian and Pre-1914 demand, respectively. The green and purple points
represent the adjusted monthly FNF exceedance forecasts at the 50- and 90-percent levels,
respectively. The dashed lines connecting these points do not represent any values, they just
help the viewer follow the sequence of each set of points. The transparent solid blue line
represents the combined ten-station daily FNF flows. The red dashed line represents the ag-
gregate demand through the 1902 priority level, and the red dashed/dotted line represents the
aggregate demand through the 1913 priority level. The black vertical dashed line indicates the
day on which the notices were issued (June 12, 2015). From the resulting supply/demand plot
data frame containing the 2015 Information Order demands, (plot.data), the following supply
and demand values are applicable for June:
• Riparian Demand: 5,622 cfs.
• Pre-1914 Demand: 8,150 cfs.
• Combined Riparian and Pre-1914 Demand: 13,771 cfs.
• Senior Demand Through 1902: 11,759 cfs.
• Adjusted 50% Exceedance Forecasted FNF: 8,974 cfs.
List of R Packages Used
[1] Gergely Daróczi and Roman Tsegelskyi. pander: An R Pandoc Writer, 2015. R packageversion 0.6.0.
[2] Ari B. Friedman. taRifx: Collection of utility and convenience functions., 2014. R packageversion 1.0.6.
[3] Garrett Grolemund, Vitalie Spinu, and Hadley Wickham. lubridate: Make Dealing withDates a Little Easier, 2015. R package version 1.5.0.
A-17
WR-211 App A Page 17

[4] R Core Team. R: A Language and Environment for Statistical Computing. R Foundationfor Statistical Computing, Vienna, Austria, 2015.
[5] Hadley Wickham. reshape2: Flexibly Reshape Data: A Reboot of the Reshape Package.,2014. R package version 1.4.1.
[6] Hadley Wickham. scales: Scale Functions for Visualization, 2015. R package version0.3.0.
[7] Hadley Wickham. tidyr: Easily Tidy Data with ‘spread()‘ and ‘gather()‘ Functions, 2016.R package version 0.4.1.
[8] Hadley Wickham and Winston Chang. ggplot2: An Implementation of the Grammar ofGraphics, 2015. R package version 2.0.0.
[9] Hadley Wickham and Romain Francois. dplyr: A Grammar of Data Manipulation, 2015.R package version 0.4.3.
[10] Yihui Xie. knitr: A General-Purpose Package for Dynamic Report Generation in R, 2016.R package version 1.12.3.
A-18
WR-211 App A Page 18

Session Information
## R version 3.2.3 (2015-12-10)
## Platform: x86_64-w64-mingw32/x64 (64-bit)
## Running under: Windows 7 x64 (build 7601) Service Pack 1
##
## locale:
## [1] LC_COLLATE=English_United States.1252
## [2] LC_CTYPE=English_United States.1252
## [3] LC_MONETARY=English_United States.1252
## [4] LC_NUMERIC=C
## [5] LC_TIME=English_United States.1252
##
## attached base packages:
## [1] stats graphics grDevices utils datasets methods base
##
## other attached packages:
## [1] scales_0.3.0 lubridate_1.5.0 ggplot2_2.0.0 reshape2_1.4.1
## [5] dplyr_0.4.3 tidyr_0.4.1 pander_0.6.0 taRifx_1.0.6
## [9] knitr_1.12.3
##
## loaded via a namespace (and not attached):
## [1] Rcpp_0.12.3 magrittr_1.5 munsell_0.4.3 colorspace_1.2-6
## [5] R6_2.1.2 stringr_1.0.0 highr_0.5.1 plyr_1.8.3
## [9] tools_3.2.3 parallel_3.2.3 grid_3.2.3 gtable_0.1.2
## [13] DBI_0.3.1 lazyeval_0.1.10 assertthat_0.1 digest_0.6.9
## [17] formatR_1.2.1 evaluate_0.8 labeling_0.3 stringi_1.0-1
A-19
WR-211 App A Page 19

[SUMMARY OF FINAL SUBMITTED VERSION]
SUPPLEMENTAL STATEMENT OF WATER DIVERSION AND USE FOR 2012
Primary Owner: TUSCANY RESEARCH INSTITUTE Statement Number: S020995 Date Submitted: 2013-06-20
1. Water is used underRiparian ClaimPre-1914 ClaimOther: overlying and statutory rights
2. Year of first use 1800
3-4. Maximum Rate of Diversion for each Month and Amount of Water Diverted and Used
Month Rate of diversionAmount directly diverted or
collected to storage(Acre-Feet)
Amount beneficially used(Acre-Feet)
January 139.3 33.25February 71.67 44.8March 199 124.38April 179.96 112.47May 290.8 181.75June 496.5 310.31July 562.45 351.53August 427.07 266.92September 223.99 139.99October 98.74 61.71November 178.3 57.63December 146.31 37.63Total 3014.09 1722.37Comments
5. Water Diversion Measurement
a. Measurement Direct measurement using a device listed in Section 1 is "not locally cost effective" for water directly diverted and/or diverted to storage
b.Types of measuring devices used
c.
Additional technology usedDescription of additional technology used
d.Who installed your measuring device(s)
e. Make, model number, and last calibration date of
Page 1 of 3SUPPLEMENTAL STATEMENT OF WATER DIVERSION AND USE
2/19/2016https://ciwqs.waterboards.ca.gov/ciwqs/ewrims_online_reporting/ssPrint.do?form_id=128...
WR-211 App B Page 1

your measuring device(s)
f.
Why direct measurement using a device listed in Section 1 is "not locally cost effective"
Other
Explanation of why use of devices and technologies listed in Section 1 are "not locally cost effective"
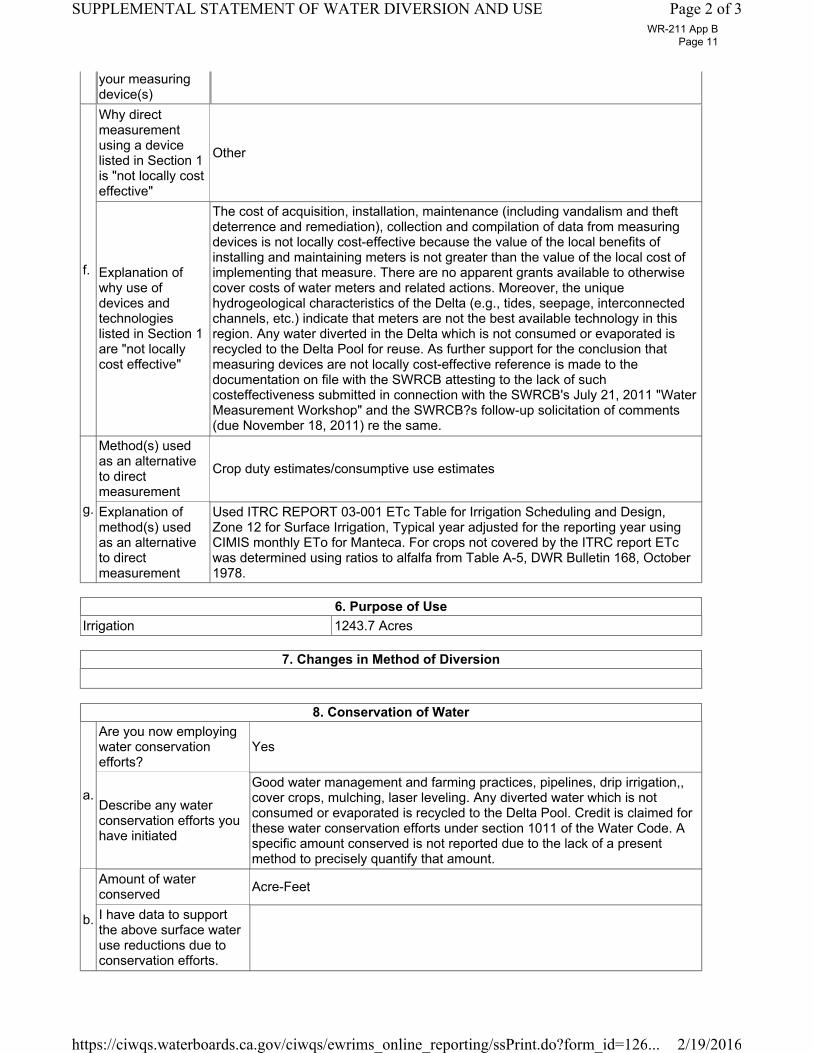
The cost of acquisition, installation, maintenance (including vandalism and theft deterrence and remediation), collection and compilation of data from measuring devices is not locally cost-effective because the value of the local benefits of installing and maintaining meters is not greater than the value of the local cost of implementing that measure. There are no apparent grants available to otherwise cover costs of water meters and related actions. Moreover, the unique hydrogeological characteristics of the Delta (e.g., tides, seepage, interconnected channels, etc.) indicate that meters are not the best available technology in this region. Any water diverted in the Delta which is not consumed or evaporated is recycled to the Delta Pool for reuse. As further support for the conclusion that measuring devices are not locally cost-effective reference is made to the documentation on file with the SWRCB attesting to the lack of such costeffectiveness submitted in connection with the SWRCB's July 21, 2011 "Water Measurement Workshop" and the SWRCB?s follow-up solicitation of comments (due November 18, 2011) re the same.
g.
Method(s) used as an alternative to direct measurement
Crop duty estimates/consumptive use estimates
Explanation of method(s) used as an alternative to direct measurement
Used ITRC REPORT 03-001 ETc Table for Irrigation Scheduling and Design, Zone 12 for Surface Irrigation, Typical year adjusted for the reporting year using CIMIS monthly ETo for Manteca. For crops not covered by the ITRC report ETc was determined using ratios to alfalfa from Table A-5, DWR Bulletin 168, October 1978.
6. Purpose of Use Irrigation 864.1 Acres
7. Changes in Method of Diversion
8. Conservation of Water
a.
Are you now employing water conservation efforts?
Yes
Describe any water conservation efforts you have initiated
Good water management and farming practices, lined ditches, pipelines, drip irrigation, sprinkler irrigation, low energy spray irrigation, cover crops, mulching, laser leveling. Any diverted water which is not consumed or evaporated is recycled to the Delta Pool. Credit is claimed for these water conservation efforts under section 1011 of the Water Code. A specific amount conserved is not reported due to the lack of a present method to precisely quantify that amount.
b. Amount of water conserved Acre-Feet
I have data to support the above surface water use reductions
Page 2 of 3SUPPLEMENTAL STATEMENT OF WATER DIVERSION AND USE
2/19/2016https://ciwqs.waterboards.ca.gov/ciwqs/ewrims_online_reporting/ssPrint.do?form_id=128...
WR-211 App B Page 2

due to conservation efforts.
9. Water Quality and Wastewater Reclamation
a. Are you now or have you been using reclaimed water from a wastewater treatment facility, desalination facility, or water polluted by waste to a degree which unreasonably affects such water for other beneficial causes?
No
b.
Amount of reduced diversionType of substitute water supplyAmount of substitute water supply usedI have data to support the above surface water use reductions due to the use of a substitute water supply
10. Conjuctive Use of Surface Water and Groundwatera. Are you now using groundwater in lieu of surface water? No
b.Amount of groundwater usedI have data to support the above surface water use reductions due to the use of groundwater.
11a. Additional RemarksThe amount diverted is a multiple of the reported use amount, plus a factor to account for field flooding (if any). The multiple is to account for additional water that is diverted but not consumed or evaporated. (Note: add the following insertion to the above insertion if you had multiple PODs deliver water to the same field or parcel): The point of diversion that is the subject of this report is one of ___2___ (insert number) points of diversion that provided water to an approximate ___864.10____ acre field/parcel. For purposes of these reports, the amount of acreage irrigated, water used and water diverted associated with each of those points of diversion has been evenly split along them.
AttachmentsFile Name Description Size
No Attachments
Contact Information of the Person Submitting the FormFirst Name ClintLast Name WomackRelation to Water RightHas read the form and agrees the information in the report is true to the best of his/her knowledge and belief Yes
Page 3 of 3SUPPLEMENTAL STATEMENT OF WATER DIVERSION AND USE
2/19/2016https://ciwqs.waterboards.ca.gov/ciwqs/ewrims_online_reporting/ssPrint.do?form_id=128...
WR-211 App B Page 3

[SUMMARY OF FINAL SUBMITTED VERSION]
SUPPLEMENTAL STATEMENT OF WATER DIVERSION AND USE FOR 2012
Primary Owner: CCRC FARMS, LLC Statement Number: S021018 Date Submitted: 2013-06-20
1. Water is used underRiparian ClaimPre-1914 ClaimOther: overlying and statutory rights
2. Year of first use 1800
3-4. Maximum Rate of Diversion for each Month and Amount of Water Diverted and Used
Month Rate of diversionAmount directly diverted or
collected to storage(Acre-Feet)
Amount beneficially used(Acre-Feet)
January 409.17 65.33February 98.05 61.28March 278.43 174.02April 199.17 124.48May 382.53 239.08June 900.5 562.81July 1015.8 634.87August 677.08 423.18September 200.86 125.54October 116.72 72.95November 435.32 81.67December 406.93 63.93Total 5120.56 2629.14Comments
5. Water Diversion Measurement
a. Measurement Direct measurement using a device listed in Section 1 is "not locally cost effective" for water directly diverted and/or diverted to storage
b.Types of measuring devices used
c.
Additional technology usedDescription of additional technology used
d.Who installed your measuring device(s)
e. Make, model number, and last calibration date of
Page 1 of 3SUPPLEMENTAL STATEMENT OF WATER DIVERSION AND USE
2/19/2016https://ciwqs.waterboards.ca.gov/ciwqs/ewrims_online_reporting/ssPrint.do?form_id=127...
WR-211 App B Page 4

your measuring device(s)
f.
Why direct measurement using a device listed in Section 1 is "not locally cost effective"
Other
Explanation of why use of devices and technologies listed in Section 1 are "not locally cost effective"
The cost of acquisition, installation, maintenance (including vandalism and theft deterrence and remediation), collection and compilation of data from measuring devices is not locally cost-effective because the value of the local benefits of installing and maintaining meters is not greater than the value of the local cost of implementing that measure. There are no apparent grants available to otherwise cover costs of water meters and related actions. Moreover, the unique hydrogeological characteristics of the Delta (e.g., tides, seepage, interconnected channels, etc.) indicate that meters are not the best available technology in this region. Any water diverted in the Delta which is not consumed or evaporated is recycled to the Delta Pool for reuse. As further support for the conclusion that measuring devices are not locally cost-effective reference is made to the documentation on file with the SWRCB attesting to the lack of such costeffectiveness submitted in connection with the SWRCB's July 21, 2011 "Water Measurement Workshop" and the SWRCB?s follow-up solicitation of comments (due November 18, 2011) re the same.
g.
Method(s) used as an alternative to direct measurement
Crop duty estimates/consumptive use estimates
Explanation of method(s) used as an alternative to direct measurement
Used ITRC REPORT 03-001 ETc Table for Irrigation Scheduling and Design, Zone 12 for Surface Irrigation, Typical year adjusted for the reporting year using CIMIS monthly ETo for Manteca. For crops not covered by the ITRC report ETc was determined using ratios to alfalfa from Table A-5, DWR Bulletin 168, October 1978.
6. Purpose of Use Irrigation 1243.7 Acres
7. Changes in Method of Diversion
8. Conservation of Water
a.
Are you now employing water conservation efforts?
Yes
Describe any water conservation efforts you have initiated
Good water management and farming practices, lined ditches, pipelines, drip irrigation, sprinkler irrigation, low energy spray irrigation, cover crops, mulching, laser leveling. Any diverted water which is not consumed or evaporated is recycled to the Delta Pool. Credit is claimed for these water conservation efforts under section 1011 of the Water Code. A specific amount conserved is not reported due to the lack of a present method to precisely quantify that amount.
b. Amount of water conserved Acre-Feet
I have data to support the above surface water use reductions
Page 2 of 3SUPPLEMENTAL STATEMENT OF WATER DIVERSION AND USE
2/19/2016https://ciwqs.waterboards.ca.gov/ciwqs/ewrims_online_reporting/ssPrint.do?form_id=127...
WR-211 App B Page 5

due to conservation efforts.
9. Water Quality and Wastewater Reclamation
a. Are you now or have you been using reclaimed water from a wastewater treatment facility, desalination facility, or water polluted by waste to a degree which unreasonably affects such water for other beneficial causes?
No
b.
Amount of reduced diversionType of substitute water supplyAmount of substitute water supply usedI have data to support the above surface water use reductions due to the use of a substitute water supply
10. Conjuctive Use of Surface Water and Groundwatera. Are you now using groundwater in lieu of surface water? No
b.Amount of groundwater usedI have data to support the above surface water use reductions due to the use of groundwater.
11a. Additional RemarksThe amount diverted is a multiple of the reported use amount, plus a factor to account for field flooding (if any). The multiple is to account for additional water that is diverted but not consumed or evaporated. (Note: add the following insertion to the above insertion if you had multiple PODs deliver water to the same field or parcel): The point of diversion that is the subject of this report is one of ______ (insert number) points of diversion that provided water to an approximate _______ acre field/parcel. For purposes of these reports, the amount of acreage irrigated, water used and water diverted associated with each of those points of diversion has been evenly split along them.
AttachmentsFile Name Description Size
No Attachments
Contact Information of the Person Submitting the FormFirst Name ClintLast Name WomackRelation to Water RightHas read the form and agrees the information in the report is true to the best of his/her knowledge and belief Yes
Page 3 of 3SUPPLEMENTAL STATEMENT OF WATER DIVERSION AND USE
2/19/2016https://ciwqs.waterboards.ca.gov/ciwqs/ewrims_online_reporting/ssPrint.do?form_id=127...
WR-211 App B Page 6

[SUMMARY OF FINAL SUBMITTED VERSION]
SUPPLEMENTAL STATEMENT OF WATER DIVERSION AND USE FOR 2012
Primary Owner: TUSCANY RESEARCH INSTITUTE Statement Number: S021024 Date Submitted: 2013-06-19
1. Water is used underRiparian ClaimPre-1914 ClaimOther: overlying and statutory rights
2. Year of first use 1800
3-4. Maximum Rate of Diversion for each Month and Amount of Water Diverted and Used
Month Rate of diversionAmount directly diverted or
collected to storage(Acre-Feet)
Amount beneficially used(Acre-Feet)
January 139.3 33.25February 71.67 44.8March 199 124.38April 179.96 112.47May 290.8 181.75June 496.5 310.31July 562.45 351.53August 427.07 266.92September 223.99 139.99October 98.74 61.71November 178.3 57.63December 146.31 37.63Total 3014.09 1722.37Comments
5. Water Diversion Measurement
a. Measurement Direct measurement using a device listed in Section 1 is "not locally cost effective" for water directly diverted and/or diverted to storage
b.Types of measuring devices used
c.
Additional technology usedDescription of additional technology used
d.Who installed your measuring device(s)
e. Make, model number, and last calibration date of
Page 1 of 3SUPPLEMENTAL STATEMENT OF WATER DIVERSION AND USE
2/19/2016https://ciwqs.waterboards.ca.gov/ciwqs/ewrims_online_reporting/ssPrint.do?form_id=126...
WR-211 App B Page 7

your measuring device(s)
f.
Why direct measurement using a device listed in Section 1 is "not locally cost effective"
Other
Explanation of why use of devices and technologies listed in Section 1 are "not locally cost effective"
The cost of acquisition, installation, maintenance (including vandalism and theft deterrence and remediation), collection and compilation of data from measuring devices is not locally cost-effective because the value of the local benefits of installing and maintaining meters is not greater than the value of the local cost of implementing that measure. There are no apparent grants available to otherwise cover costs of water meters and related actions. Moreover, the unique hydrogeological characteristics of the Delta (e.g., tides, seepage, interconnected channels, etc.) indicate that meters are not the best available technology in this region. Any water diverted in the Delta which is not consumed or evaporated is recycled to the Delta Pool for reuse. As further support for the conclusion that measuring devices are not locally cost-effective reference is made to the documentation on file with the SWRCB attesting to the lack of such costeffectiveness submitted in connection with the SWRCB's July 21, 2011 "Water Measurement Workshop" and the SWRCB?s follow-up solicitation of comments (due November 18, 2011) re the same.
g.
Method(s) used as an alternative to direct measurement
Crop duty estimates/consumptive use estimates
Explanation of method(s) used as an alternative to direct measurement
Used ITRC REPORT 03-001 ETc Table for Irrigation Scheduling and Design, Zone 12 for Surface Irrigation, Typical year adjusted for the reporting year using CIMIS monthly ETo for Manteca. For crops not covered by the ITRC report ETc was determined using ratios to alfalfa from Table A-5, DWR Bulletin 168, October 1978.
6. Purpose of Use Irrigation 864.1 Acres
7. Changes in Method of Diversion
8. Conservation of Water
a.
Are you now employing water conservation efforts?
Yes
Describe any water conservation efforts you have initiated
Good water management and farming practices, pipelines, drip irrigation, , cover crops, mulching, laser leveling. Any diverted water which is not consumed or evaporated is recycled to the Delta Pool. Credit is claimed for these water conservation efforts under section 1011 of the Water Code. A specific amount conserved is not reported due to the lack of a present method to precisely quantify that amount.
b.
Amount of water conserved Acre-Feet
I have data to support the above surface water use reductions due to conservation efforts.
Page 2 of 3SUPPLEMENTAL STATEMENT OF WATER DIVERSION AND USE
2/19/2016https://ciwqs.waterboards.ca.gov/ciwqs/ewrims_online_reporting/ssPrint.do?form_id=126...
WR-211 App B Page 8

9. Water Quality and Wastewater Reclamation
a. Are you now or have you been using reclaimed water from a wastewater treatment facility, desalination facility, or water polluted by waste to a degree which unreasonably affects such water for other beneficial causes?
No
b.
Amount of reduced diversionType of substitute water supplyAmount of substitute water supply usedI have data to support the above surface water use reductions due to the use of a substitute water supply
10. Conjuctive Use of Surface Water and Groundwatera. Are you now using groundwater in lieu of surface water? No
b.Amount of groundwater usedI have data to support the above surface water use reductions due to the use of groundwater.
11a. Additional RemarksThe amount diverted is a multiple of the reported use amount, plus a factor to account for field flooding (if any). The multiple is to account for additional water that is diverted but not consumed or evaporated. (Note: add the following insertion to the above insertion if you had multiple PODs deliver water to the same field or parcel): The point of diversion that is the subject of this report is one of __2____ (insert number) points of diversion that provided water to an approximate __864.10_____ acre field/parcel. For purposes of these reports, the amount of acreage irrigated, water used and water diverted associated with each of those points of diversion has been evenly split along them.
AttachmentsFile Name Description Size
No Attachments
Contact Information of the Person Submitting the FormFirst Name ClintLast Name WomackRelation to Water RightHas read the form and agrees the information in the report is true to the best of his/her knowledge and belief Yes
Page 3 of 3SUPPLEMENTAL STATEMENT OF WATER DIVERSION AND USE
2/19/2016https://ciwqs.waterboards.ca.gov/ciwqs/ewrims_online_reporting/ssPrint.do?form_id=126...
WR-211 App B Page 9

[SUMMARY OF FINAL SUBMITTED VERSION]
SUPPLEMENTAL STATEMENT OF WATER DIVERSION AND USE FOR 2012
Primary Owner: CCRC FARMS, LLC Statement Number: S021030 Date Submitted: 2013-06-20
1. Water is used underRiparian ClaimPre-1914 ClaimOther: overlying and statutory rights
2. Year of first use 1800
3-4. Maximum Rate of Diversion for each Month and Amount of Water Diverted and Used
Month Rate of diversionAmount directly diverted or
collected to storage(Acre-Feet)
Amount beneficially used(Acre-Feet)
January 409.17 65.33February 98.05 61.28March 278.43 174.02April 199.17 124.48May 382.53 239.08June 900.5 562.81July 1015.8 634.87August 677.08 423.18September 200.86 125.54October 116.72 72.95November 435.32 81.67December 406.93 63.93Total 5120.56 2629.14Comments
5. Water Diversion Measurement
a. Measurement Direct measurement using a device listed in Section 1 is "not locally cost effective" for water directly diverted and/or diverted to storage
b.Types of measuring devices used
c.
Additional technology usedDescription of additional technology used
d.Who installed your measuring device(s)
e. Make, model number, and last calibration date of
Page 1 of 3SUPPLEMENTAL STATEMENT OF WATER DIVERSION AND USE
2/19/2016https://ciwqs.waterboards.ca.gov/ciwqs/ewrims_online_reporting/ssPrint.do?form_id=126...
WR-211 App B Page 10
your measuring device(s)
f.
Why direct measurement using a device listed in Section 1 is "not locally cost effective"
Other
Explanation of why use of devices and technologies listed in Section 1 are "not locally cost effective"
The cost of acquisition, installation, maintenance (including vandalism and theft deterrence and remediation), collection and compilation of data from measuring devices is not locally cost-effective because the value of the local benefits of installing and maintaining meters is not greater than the value of the local cost of implementing that measure. There are no apparent grants available to otherwise cover costs of water meters and related actions. Moreover, the unique hydrogeological characteristics of the Delta (e.g., tides, seepage, interconnected channels, etc.) indicate that meters are not the best available technology in this region. Any water diverted in the Delta which is not consumed or evaporated is recycled to the Delta Pool for reuse. As further support for the conclusion that measuring devices are not locally cost-effective reference is made to the documentation on file with the SWRCB attesting to the lack of such costeffectiveness submitted in connection with the SWRCB's July 21, 2011 "Water Measurement Workshop" and the SWRCB?s follow-up solicitation of comments (due November 18, 2011) re the same.
g.
Method(s) used as an alternative to direct measurement
Crop duty estimates/consumptive use estimates
Explanation of method(s) used as an alternative to direct measurement
Used ITRC REPORT 03-001 ETc Table for Irrigation Scheduling and Design, Zone 12 for Surface Irrigation, Typical year adjusted for the reporting year using CIMIS monthly ETo for Manteca. For crops not covered by the ITRC report ETc was determined using ratios to alfalfa from Table A-5, DWR Bulletin 168, October 1978.
6. Purpose of Use Irrigation 1243.7 Acres
7. Changes in Method of Diversion
8. Conservation of Water
a.
Are you now employing water conservation efforts?
Yes
Describe any water conservation efforts you have initiated
Good water management and farming practices, pipelines, drip irrigation,, cover crops, mulching, laser leveling. Any diverted water which is not consumed or evaporated is recycled to the Delta Pool. Credit is claimed for these water conservation efforts under section 1011 of the Water Code. A specific amount conserved is not reported due to the lack of a present method to precisely quantify that amount.
b.
Amount of water conserved Acre-Feet
I have data to support the above surface water use reductions due to conservation efforts.
Page 2 of 3SUPPLEMENTAL STATEMENT OF WATER DIVERSION AND USE
2/19/2016https://ciwqs.waterboards.ca.gov/ciwqs/ewrims_online_reporting/ssPrint.do?form_id=126...
WR-211 App B Page 11

9. Water Quality and Wastewater Reclamation
a. Are you now or have you been using reclaimed water from a wastewater treatment facility, desalination facility, or water polluted by waste to a degree which unreasonably affects such water for other beneficial causes?
No
b.
Amount of reduced diversionType of substitute water supplyAmount of substitute water supply usedI have data to support the above surface water use reductions due to the use of a substitute water supply
10. Conjuctive Use of Surface Water and Groundwatera. Are you now using groundwater in lieu of surface water? No
b.Amount of groundwater usedI have data to support the above surface water use reductions due to the use of groundwater.
11a. Additional RemarksThe amount diverted is a multiple of the reported use amount, plus a factor to account for field flooding (if any). The multiple is to account for additional water that is diverted but not consumed or evaporated. (Note: add the following insertion to the above insertion if you had multiple PODs deliver water to the same field or parcel): The point of diversion that is the subject of this report is one of _2_____ (insert number) points of diversion that provided water to an approximate __1243.70_____ acre field/parcel. For purposes of these reports, the amount of acreage irrigated, water used and water diverted associated with each of those points of diversion has been evenly split along them.
AttachmentsFile Name Description Size
No Attachments
Contact Information of the Person Submitting the FormFirst Name ClintLast Name WomackRelation to Water RightHas read the form and agrees the information in the report is true to the best of his/her knowledge and belief Yes
Page 3 of 3SUPPLEMENTAL STATEMENT OF WATER DIVERSION AND USE
2/19/2016https://ciwqs.waterboards.ca.gov/ciwqs/ewrims_online_reporting/ssPrint.do?form_id=126...
WR-211 App B Page 12

[SUMMARY OF FINAL SUBMITTED VERSION]
SUPPLEMENTAL STATEMENT OF WATER DIVERSION AND USE FOR 2012
Primary Owner: CCRC FARMS, LLC Statement Number: S021032 Date Submitted: 2013-06-19
1. Water is used underRiparian ClaimPre-1914 ClaimOther: overlying & statutory rights
2. Year of first use 1800
3-4. Maximum Rate of Diversion for each Month and Amount of Water Diverted and Used
Month Rate of diversionAmount directly diverted or
collected to storage(Acre-Feet)
Amount beneficially used(Acre-Feet)
January 49.71 14.63February 22.45 14.03March 59.2 37April 42.06 26.29May 97.94 61.21June 214.53 134.08July 216.4 135.25August 102.82 64.26September 43.25 27.03October 27.03 16.89November 56.15 18.65December 49.39 14.43Total 980.93 563.75Comments
5. Water Diversion Measurement
a. Measurement Direct measurement using a device listed in Section 1 is "not locally cost effective" for water directly diverted and/or diverted to storage
b.Types of measuring devices used
c.
Additional technology usedDescription of additional technology used
d.Who installed your measuring device(s)
e. Make, model number, and last calibration date of
Page 1 of 3SUPPLEMENTAL STATEMENT OF WATER DIVERSION AND USE
2/19/2016https://ciwqs.waterboards.ca.gov/ciwqs/ewrims_online_reporting/ssPrint.do?form_id=126...
WR-211 App B Page 13

your measuring device(s)
f.
Why direct measurement using a device listed in Section 1 is "not locally cost effective"
Other
Explanation of why use of devices and technologies listed in Section 1 are "not locally cost effective"
The cost of acquisition, installation, maintenance (including vandalism and theft deterrence and remediation), collection and compilation of data from measuring devices is not locally cost-effective because the value of the local benefits of installing and maintaining meters is not greater than the value of the local cost of implementing that measure. There are no apparent grants available to otherwise cover costs of water meters and related actions. Moreover, the unique hydrogeological characteristics of the Delta (e.g., tides, seepage, interconnected channels, etc.) indicate that meters are not the best available technology in this region. Any water diverted in the Delta which is not consumed or evaporated is recycled to the Delta Pool for reuse. As further support for the conclusion that measuring devices are not locally cost-effective reference is made to the documentation on file with the SWRCB attesting to the lack of such costeffectiveness submitted in connection with the SWRCB's July 21, 2011 "Water Measurement Workshop" and the SWRCB?s follow-up solicitation of comments (due November 18, 2011) re the same.
g.
Method(s) used as an alternative to direct measurement
Crop duty estimates/consumptive use estimates
Explanation of method(s) used as an alternative to direct measurement
Used ITRC REPORT 03-001 ETc Table for Irrigation Scheduling and Design, Zone 12 for Surface Irrigation, Typical year adjusted for the reporting year using CIMIS monthly ETo for Manteca. For crops not covered by the ITRC report ETc was determined using ratios to alfalfa from Table A-5, DWR Bulletin 168, October 1978.
6. Purpose of Use Irrigation 379.6 Acres
7. Changes in Method of Diversion
8. Conservation of Water
a.
Are you now employing water conservation efforts?
Yes
Describe any water conservation efforts you have initiated
Good water management and farming practices, lined ditches, pipelines, drip irrigation, sprinkler irrigation, low energy spray irrigation, cover crops, mulching, laser leveling. Any diverted water which is not consumed or evaporated is recycled to the Delta Pool. Credit is claimed for these water conservation efforts under section 1011 of the Water Code. A specific amount conserved is not reported due to the lack of a present method to precisely quantify that amount.
b. Amount of water conserved Acre-Feet
I have data to support the above surface water use reductions
Page 2 of 3SUPPLEMENTAL STATEMENT OF WATER DIVERSION AND USE
2/19/2016https://ciwqs.waterboards.ca.gov/ciwqs/ewrims_online_reporting/ssPrint.do?form_id=126...
WR-211 App B Page 14

due to conservation efforts.
9. Water Quality and Wastewater Reclamation
a. Are you now or have you been using reclaimed water from a wastewater treatment facility, desalination facility, or water polluted by waste to a degree which unreasonably affects such water for other beneficial causes?
No
b.
Amount of reduced diversionType of substitute water supplyAmount of substitute water supply usedI have data to support the above surface water use reductions due to the use of a substitute water supply
10. Conjuctive Use of Surface Water and Groundwatera. Are you now using groundwater in lieu of surface water? No
b.Amount of groundwater usedI have data to support the above surface water use reductions due to the use of groundwater.
11a. Additional RemarksThe amount diverted is a multiple of the reported use amount, plus a factor to account for field flooding (if any). The multiple is to account for additional water that is diverted but not consumed or evaporated. (Note: add the following insertion to the above insertion if you had multiple PODs deliver water to the same field or parcel): The point of diversion that is the subject of this report is one of __2____ (insert number) points of diversion that provided water to an approximate __379.60_____ acre field/parcel. For purposes of these reports, the amount of acreage irrigated, water used and water diverted associated with each of those points of diversion has been evenly split along them.
AttachmentsFile Name Description Size
No Attachments
Contact Information of the Person Submitting the FormFirst Name ClintLast Name WomackRelation to Water RightHas read the form and agrees the information in the report is true to the best of his/her knowledge and belief Yes
Page 3 of 3SUPPLEMENTAL STATEMENT OF WATER DIVERSION AND USE
2/19/2016https://ciwqs.waterboards.ca.gov/ciwqs/ewrims_online_reporting/ssPrint.do?form_id=126...
WR-211 App B Page 15
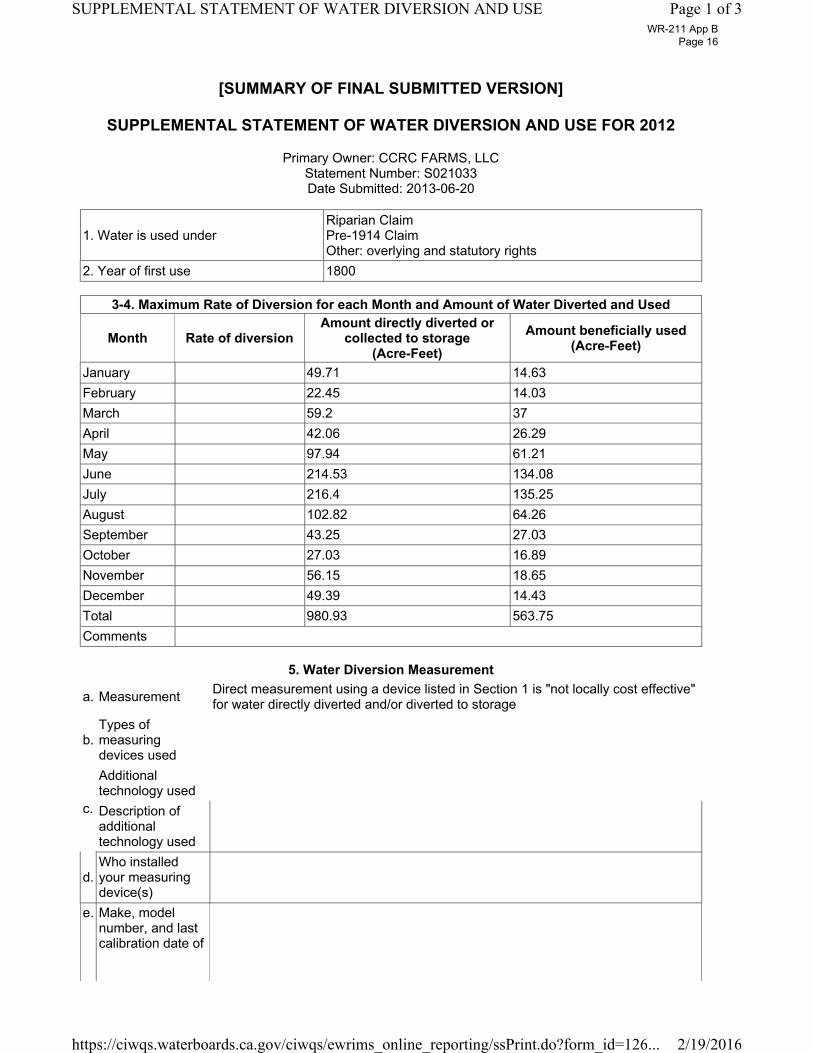
[SUMMARY OF FINAL SUBMITTED VERSION]
SUPPLEMENTAL STATEMENT OF WATER DIVERSION AND USE FOR 2012
Primary Owner: CCRC FARMS, LLC Statement Number: S021033 Date Submitted: 2013-06-20
1. Water is used underRiparian ClaimPre-1914 ClaimOther: overlying and statutory rights
2. Year of first use 1800
3-4. Maximum Rate of Diversion for each Month and Amount of Water Diverted and Used
Month Rate of diversionAmount directly diverted or
collected to storage(Acre-Feet)
Amount beneficially used(Acre-Feet)
January 49.71 14.63February 22.45 14.03March 59.2 37April 42.06 26.29May 97.94 61.21June 214.53 134.08July 216.4 135.25August 102.82 64.26September 43.25 27.03October 27.03 16.89November 56.15 18.65December 49.39 14.43Total 980.93 563.75Comments
5. Water Diversion Measurement
a. Measurement Direct measurement using a device listed in Section 1 is "not locally cost effective" for water directly diverted and/or diverted to storage
b.Types of measuring devices used
c.
Additional technology usedDescription of additional technology used
d.Who installed your measuring device(s)
e. Make, model number, and last calibration date of
Page 1 of 3SUPPLEMENTAL STATEMENT OF WATER DIVERSION AND USE
2/19/2016https://ciwqs.waterboards.ca.gov/ciwqs/ewrims_online_reporting/ssPrint.do?form_id=126...
WR-211 App B Page 16

your measuring device(s)
f.
Why direct measurement using a device listed in Section 1 is "not locally cost effective"
Other
Explanation of why use of devices and technologies listed in Section 1 are "not locally cost effective"
The cost of acquisition, installation, maintenance (including vandalism and theft deterrence and remediation), collection and compilation of data from measuring devices is not locally cost-effective because the value of the local benefits of installing and maintaining meters is not greater than the value of the local cost of implementing that measure. There are no apparent grants available to otherwise cover costs of water meters and related actions. Moreover, the unique hydrogeological characteristics of the Delta (e.g., tides, seepage, interconnected channels, etc.) indicate that meters are not the best available technology in this region. Any water diverted in the Delta which is not consumed or evaporated is recycled to the Delta Pool for reuse. As further support for the conclusion that measuring devices are not locally cost-effective reference is made to the documentation on file with the SWRCB attesting to the lack of such costeffectiveness submitted in connection with the SWRCB's July 21, 2011 "Water Measurement Workshop" and the SWRCB?s follow-up solicitation of comments (due November 18, 2011) re the same.
g.
Method(s) used as an alternative to direct measurement
Crop duty estimates/consumptive use estimates
Explanation of method(s) used as an alternative to direct measurement
Used ITRC REPORT 03-001 ETc Table for Irrigation Scheduling and Design, Zone 12 for Surface Irrigation, Typical year adjusted for the reporting year using CIMIS monthly ETo for Manteca. For crops not covered by the ITRC report ETc was determined using ratios to alfalfa from Table A-5, DWR Bulletin 168, October 1978.
6. Purpose of Use Irrigation 379.6 Acres
7. Changes in Method of Diversion
8. Conservation of Water
a.
Are you now employing water conservation efforts?
Yes
Describe any water conservation efforts you have initiated
Good water management and farming practices, pipelines, drip irrigation, , cover crops, mulching, laser leveling. Any diverted water which is not consumed or evaporated is recycled to the Delta Pool. Credit is claimed for these water conservation efforts under section 1011 of the Water Code. A specific amount conserved is not reported due to the lack of a present method to precisely quantify that amount.
b.
Amount of water conserved Acre-Feet
I have data to support the above surface water use reductions due to conservation efforts.
Page 2 of 3SUPPLEMENTAL STATEMENT OF WATER DIVERSION AND USE
2/19/2016https://ciwqs.waterboards.ca.gov/ciwqs/ewrims_online_reporting/ssPrint.do?form_id=126...
WR-211 App B Page 17

9. Water Quality and Wastewater Reclamation
a. Are you now or have you been using reclaimed water from a wastewater treatment facility, desalination facility, or water polluted by waste to a degree which unreasonably affects such water for other beneficial causes?
No
b.
Amount of reduced diversionType of substitute water supplyAmount of substitute water supply usedI have data to support the above surface water use reductions due to the use of a substitute water supply
10. Conjuctive Use of Surface Water and Groundwatera. Are you now using groundwater in lieu of surface water? No
b.Amount of groundwater usedI have data to support the above surface water use reductions due to the use of groundwater.
11a. Additional RemarksThe amount diverted is a multiple of the reported use amount, plus a factor to account for field flooding (if any). The multiple is to account for additional water that is diverted but not consumed or evaporated. (Note: add the following insertion to the above insertion if you had multiple PODs deliver water to the same field or parcel): The point of diversion that is the subject of this report is one of ___2___ (insert number) points of diversion that provided water to an approximate ____379.60___ acre field/parcel. For purposes of these reports, the amount of acreage irrigated, water used and water diverted associated with each of those points of diversion has been evenly split along them.
AttachmentsFile Name Description Size
No Attachments
Contact Information of the Person Submitting the FormFirst Name ClintLast Name WomackRelation to Water RightHas read the form and agrees the information in the report is true to the best of his/her knowledge and belief Yes
Page 3 of 3SUPPLEMENTAL STATEMENT OF WATER DIVERSION AND USE
2/19/2016https://ciwqs.waterboards.ca.gov/ciwqs/ewrims_online_reporting/ssPrint.do?form_id=126...
WR-211 App B Page 18

[SUMMARY OF FINAL SUBMITTED VERSION]
SUPPLEMENTAL STATEMENT OF WATER DIVERSION AND USE FOR 2012
Primary Owner: Kurt and Sandra Kautz Family Trust Statement Number: S016909 Date Submitted: 2013-06-28
1. Water is used under Riparian ClaimPre-1914 Claim
2. Year of first use 1875
3-4. Maximum Rate of Diversion for each Month and Amount of Water Diverted and Used
Month Rate of diversionAmount directly diverted or
collected to storage(Acre-Feet)
Amount beneficially used(Acre-Feet)
January 0 0February 0 0March 201.43 125.89April 374.1 233.82May 597.36 373.35June 675.82 422.39July 355.75 222.34August 230.59 144.12September 166.49 104.05October 130.82 81.76November 0 0December 0 0Total 2732.36 1707.72Comments
5. Water Diversion Measurement
a. Measurement Direct measurement using a device listed in Section 1 is "not locally cost effective" for water directly diverted and/or diverted to storage
b. Types of measuring devices used
c.
Additional technology usedDescription of additional technology used
d.Who installed your measuring device(s)
e.
Make, model number, and last calibration date of your measuring device(s)
f. Other
Page 1 of 3SUPPLEMENTAL STATEMENT OF WATER DIVERSION AND USE
2/19/2016https://ciwqs.waterboards.ca.gov/ciwqs/ewrims_online_reporting/ssPrint.do?form_id=133...
WR-211 App C Page 1

Why direct measurement using a device listed in Section 1 is "not locally cost effective"
Explanation of why use of devices and technologies listed in Section 1 are "not locally cost effective"
The cost of acquisition, installation and maintenance (including vandalism and theft deterrence and remediation), collection and compilation of data from measuring devices is not locally cost effective because the value of the limited benefits to be obtained from these devices (which do not function properly in the conveyance conditions on this property) are limited and do not justify the associated costs. There are no grants available to cover these costs. The unique hydrologic characteristics of the Delta also indicate that meters are not the best available technology in the Delta to measure water use. Water diverted in the Delta that is not consumed is evaporated or recycled into the Delta Pool for reuse. Further support for why measuring devices are not cost-effective in the Delta is found in the documents on file with the SWRCB submitted in connected with the SWRCB?s July 21, 2011 ?Water Measurement Workshop? and the comments due November 18, 2011.
g.
Method(s) used as an alternative to direct measurement
Other
Explanation of method(s) used as an alternative to direct measurement
Use of Cal Poly San Luis Obispo ITRC Report 03-001 ETc Table for Irrigation Scheduling and Design, Zone 12 for surface irrigation, typical year adjusted to the reporting year using CIIMS monthly ETo for the Central and South Delta region.
6. Purpose of Use Irrigation 945 Acres
7. Changes in Method of Diversion
8. Conservation of Water
a.Are you now employing water conservation efforts? No Describe any water conservation efforts you have initiated
b.Amount of water conserved Acre-Feet I have data to support the above surface water use reductions due to conservation efforts.
9. Water Quality and Wastewater Reclamation
a. Are you now or have you been using reclaimed water from a wastewater treatment facility, desalination facility, or water polluted by waste to a degree which unreasonably affects such water for other beneficial causes?
No
b.
Amount of reduced diversionType of substitute water supplyAmount of substitute water supply usedI have data to support the above surface water use reductions due to the use of a substitute water supply
10. Conjuctive Use of Surface Water and Groundwatera. Are you now using groundwater in lieu of surface water? No
Page 2 of 3SUPPLEMENTAL STATEMENT OF WATER DIVERSION AND USE
2/19/2016https://ciwqs.waterboards.ca.gov/ciwqs/ewrims_online_reporting/ssPrint.do?form_id=133...
WR-211 App C Page 2

b.Amount of groundwater usedI have data to support the above surface water use reductions due to the use of groundwater.
11a. Additional RemarksAmounts diverted and used on the ranch cannot be divided between multiple pumps that may operate as points of diversion or rediversion at different times. The amounts reported represent all use for Statements 18411, 16910, 18417, 18414, 18408, 18405, 16909, 18420, 18491 and 18423. Report completed based on cropping and irrigation information provided by prior owner.
AttachmentsFile Name Description Size
No Attachments
Contact Information of the Person Submitting the FormFirst Name KurtLast Name KautzRelation to Water Right OwnerHas read the form and agrees the information in the report is true to the best of his/her knowledge and belief Yes
Page 3 of 3SUPPLEMENTAL STATEMENT OF WATER DIVERSION AND USE
2/19/2016https://ciwqs.waterboards.ca.gov/ciwqs/ewrims_online_reporting/ssPrint.do?form_id=133...
WR-211 App C Page 3

[SUMMARY OF FINAL SUBMITTED VERSION]
SUPPLEMENTAL STATEMENT OF WATER DIVERSION AND USE FOR 2012
Primary Owner: Kurt and Sandra Kautz Family Trust Statement Number: S016910 Date Submitted: 2013-06-28
1. Water is used under Riparian ClaimPre-1914 Claim
2. Year of first use 1875
3-4. Maximum Rate of Diversion for each Month and Amount of Water Diverted and Used
Month Rate of diversionAmount directly diverted or
collected to storage(Acre-Feet)
Amount beneficially used(Acre-Feet)
January 0 0February 0 0March 201.43 125.89April 374.1 233.82May 597.36 373.35June 675.82 422.39July 355.75 222.34August 230.59 144.12September 166.49 104.05October 130.82 81.76November 0 0December 0 0Total 2732.36 1707.72Comments
5. Water Diversion Measurement
a. Measurement Direct measurement using a device listed in Section 1 is "not locally cost effective" for water directly diverted and/or diverted to storage
b. Types of measuring devices used
c.
Additional technology usedDescription of additional technology used
d.Who installed your measuring device(s)
e.
Make, model number, and last calibration date of your measuring device(s)
f. Other
Page 1 of 3SUPPLEMENTAL STATEMENT OF WATER DIVERSION AND USE
2/19/2016https://ciwqs.waterboards.ca.gov/ciwqs/ewrims_online_reporting/ssPrint.do?form_id=126...
WR-211 App C Page 4

Why direct measurement using a device listed in Section 1 is "not locally cost effective"
Explanation of why use of devices and technologies listed in Section 1 are "not locally cost effective"
The cost of acquisition, installation and maintenance (including vandalism and theft deterrence and remediation), collection and compilation of data from measuring devices is not locally cost effective because the value of the limited benefits to be obtained from these devices (which do not function properly in the conveyance conditions on this property) are limited and do not justify the associated costs. There are no grants available to cover these costs. The unique hydrologic characteristics of the Delta also indicate that meters are not the best available technology in the Delta to measure water use. Water diverted in the Delta that is not consumed is evaporated or recycled into the Delta Pool for reuse. Further support for why measuring devices are not cost-effective in the Delta is found in the documents on file with the SWRCB submitted in connected with the SWRCB?s July 21, 2011 ?Water Measurement Workshop? and the comments due November 18, 2011.
g.
Method(s) used as an alternative to direct measurement
Other
Explanation of method(s) used as an alternative to direct measurement
Use of Cal Poly San Luis Obispo ITRC Report 03-001 ETc Table for Irrigation Scheduling and Design, Zone 12 for surface irrigation, typical year adjusted to the reporting year using CIIMS monthly ETo for the Central and South Delta region.
6. Purpose of Use Irrigation 945 Acres
7. Changes in Method of Diversion
8. Conservation of Water
a.Are you now employing water conservation efforts? No Describe any water conservation efforts you have initiated
b.Amount of water conserved Acre-Feet I have data to support the above surface water use reductions due to conservation efforts.
9. Water Quality and Wastewater Reclamation
a. Are you now or have you been using reclaimed water from a wastewater treatment facility, desalination facility, or water polluted by waste to a degree which unreasonably affects such water for other beneficial causes?
No
b.
Amount of reduced diversionType of substitute water supplyAmount of substitute water supply usedI have data to support the above surface water use reductions due to the use of a substitute water supply
10. Conjuctive Use of Surface Water and Groundwatera. Are you now using groundwater in lieu of surface water? No
Page 2 of 3SUPPLEMENTAL STATEMENT OF WATER DIVERSION AND USE
2/19/2016https://ciwqs.waterboards.ca.gov/ciwqs/ewrims_online_reporting/ssPrint.do?form_id=126...
WR-211 App C Page 5

b.Amount of groundwater usedI have data to support the above surface water use reductions due to the use of groundwater.
11a. Additional RemarksAmounts diverted and used on the ranch cannot be divided between multiple pumps that may operate as points of diversion or rediversion at different times. The amounts reported represent all use for Statements 18411, 16910, 18417, 18414, 18408, 18405, 16909, 18420, 18491 and 18423. Report completed based on cropping and irrigation information provided by prior owner.
AttachmentsFile Name Description Size
No Attachments
Contact Information of the Person Submitting the FormFirst Name KurtLast Name KautzRelation to Water Right OwnerHas read the form and agrees the information in the report is true to the best of his/her knowledge and belief Yes
Page 3 of 3SUPPLEMENTAL STATEMENT OF WATER DIVERSION AND USE
2/19/2016https://ciwqs.waterboards.ca.gov/ciwqs/ewrims_online_reporting/ssPrint.do?form_id=126...
WR-211 App C Page 6

[SUMMARY OF FINAL SUBMITTED VERSION]
SUPPLEMENTAL STATEMENT OF WATER DIVERSION AND USE FOR 2012
Primary Owner: Kurt and Sandra Kautz Family Trust Statement Number: S018405 Date Submitted: 2013-06-28
1. Water is used under Riparian ClaimPre-1914 Claim
2. Year of first use 1875
3-4. Maximum Rate of Diversion for each Month and Amount of Water Diverted and Used
Month Rate of diversionAmount directly diverted or
collected to storage(Acre-Feet)
Amount beneficially used(Acre-Feet)
January 0 0February 0 0March 201.43 125.89April 374.1 233.82May 597.36 373.35June 675.82 422.39July 355.75 222.34August 230.59 144.12September 166.49 104.05October 130.82 81.76November 0 0December 0 0Total 2732.36 1707.72Comments
5. Water Diversion Measurement
a. Measurement Direct measurement using a device listed in Section 1 is "not locally cost effective" for water directly diverted and/or diverted to storage
b. Types of measuring devices used
c.
Additional technology usedDescription of additional technology used
d.Who installed your measuring device(s)
e.
Make, model number, and last calibration date of your measuring device(s)
f. Other
Page 1 of 3SUPPLEMENTAL STATEMENT OF WATER DIVERSION AND USE
2/19/2016https://ciwqs.waterboards.ca.gov/ciwqs/ewrims_online_reporting/ssPrint.do?form_id=126...
WR-211 App C Page 7

Why direct measurement using a device listed in Section 1 is "not locally cost effective"
Explanation of why use of devices and technologies listed in Section 1 are "not locally cost effective"
The cost of acquisition, installation and maintenance (including vandalism and theft deterrence and remediation), collection and compilation of data from measuring devices is not locally cost effective because the value of the limited benefits to be obtained from these devices (which do not function properly in the conveyance conditions on this property) are limited and do not justify the associated costs. There are no grants available to cover these costs. The unique hydrologic characteristics of the Delta also indicate that meters are not the best available technology in the Delta to measure water use. Water diverted in the Delta that is not consumed is evaporated or recycled into the Delta Pool for reuse. Further support for why measuring devices are not cost-effective in the Delta is found in the documents on file with the SWRCB submitted in connected with the SWRCB?s July 21, 2011 ?Water Measurement Workshop? and the comments due November 18, 2011.
g.
Method(s) used as an alternative to direct measurement
Other
Explanation of method(s) used as an alternative to direct measurement
Use of Cal Poly San Luis Obispo ITRC Report 03-001 ETc Table for Irrigation Scheduling and Design, Zone 12 for surface irrigation, typical year adjusted to the reporting year using CIIMS monthly ETo for the Central and South Delta region.
6. Purpose of Use Irrigation 945 Acres
7. Changes in Method of Diversion
8. Conservation of Water
a.Are you now employing water conservation efforts? No Describe any water conservation efforts you have initiated
b.Amount of water conserved Acre-Feet I have data to support the above surface water use reductions due to conservation efforts.
9. Water Quality and Wastewater Reclamation
a. Are you now or have you been using reclaimed water from a wastewater treatment facility, desalination facility, or water polluted by waste to a degree which unreasonably affects such water for other beneficial causes?
No
b.
Amount of reduced diversionType of substitute water supplyAmount of substitute water supply usedI have data to support the above surface water use reductions due to the use of a substitute water supply
10. Conjuctive Use of Surface Water and Groundwatera. Are you now using groundwater in lieu of surface water? No
Page 2 of 3SUPPLEMENTAL STATEMENT OF WATER DIVERSION AND USE
2/19/2016https://ciwqs.waterboards.ca.gov/ciwqs/ewrims_online_reporting/ssPrint.do?form_id=126...
WR-211 App C Page 8

b.Amount of groundwater usedI have data to support the above surface water use reductions due to the use of groundwater.
11a. Additional RemarksAmounts diverted and used on the ranch cannot be divided between multiple pumps that may operate as points of diversion or rediversion at different times. The amounts reported represent all use for Statements 18411, 16910, 18417, 18414, 18408, 18405, 16909, 18420, 18491 and 18423. Report completed based on cropping and irrigation information provided by prior owner.
AttachmentsFile Name Description Size
No Attachments
Contact Information of the Person Submitting the FormFirst Name KurtLast Name KautzRelation to Water Right OwnerHas read the form and agrees the information in the report is true to the best of his/her knowledge and belief Yes
Page 3 of 3SUPPLEMENTAL STATEMENT OF WATER DIVERSION AND USE
2/19/2016https://ciwqs.waterboards.ca.gov/ciwqs/ewrims_online_reporting/ssPrint.do?form_id=126...
WR-211 App C Page 9
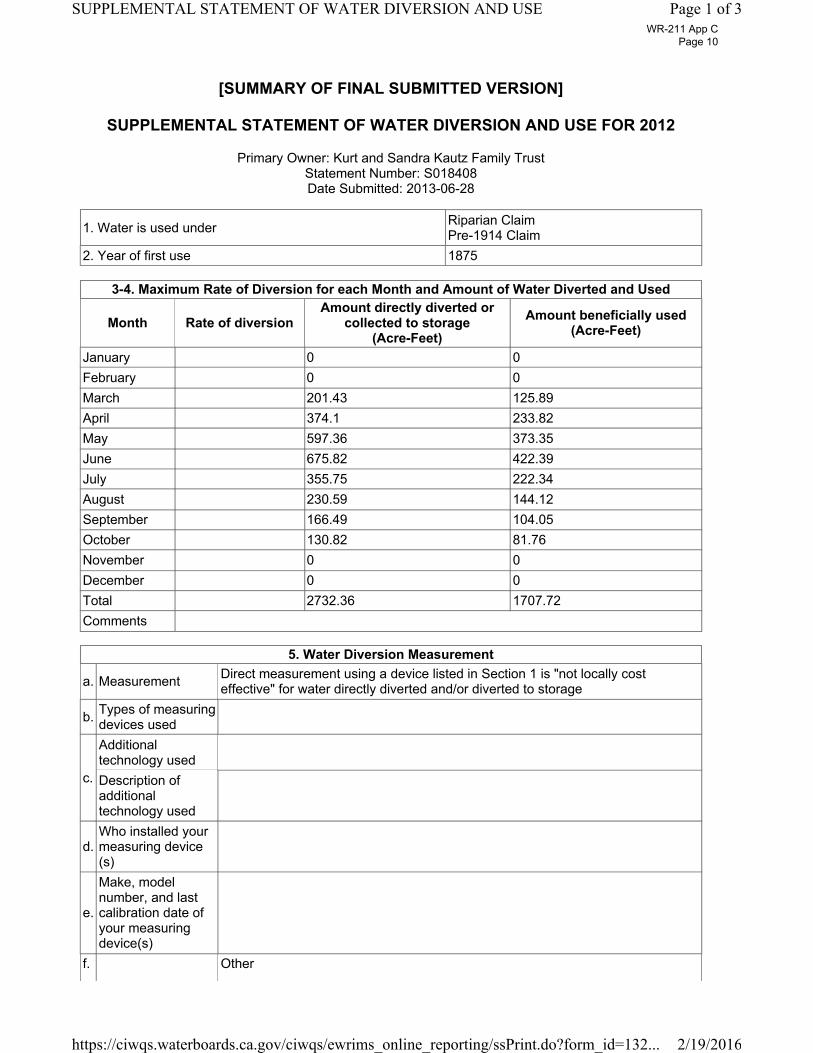
[SUMMARY OF FINAL SUBMITTED VERSION]
SUPPLEMENTAL STATEMENT OF WATER DIVERSION AND USE FOR 2012
Primary Owner: Kurt and Sandra Kautz Family Trust Statement Number: S018408 Date Submitted: 2013-06-28
1. Water is used under Riparian ClaimPre-1914 Claim
2. Year of first use 1875
3-4. Maximum Rate of Diversion for each Month and Amount of Water Diverted and Used
Month Rate of diversionAmount directly diverted or
collected to storage(Acre-Feet)
Amount beneficially used(Acre-Feet)
January 0 0February 0 0March 201.43 125.89April 374.1 233.82May 597.36 373.35June 675.82 422.39July 355.75 222.34August 230.59 144.12September 166.49 104.05October 130.82 81.76November 0 0December 0 0Total 2732.36 1707.72Comments
5. Water Diversion Measurement
a. Measurement Direct measurement using a device listed in Section 1 is "not locally cost effective" for water directly diverted and/or diverted to storage
b. Types of measuring devices used
c.
Additional technology usedDescription of additional technology used
d.Who installed your measuring device(s)
e.
Make, model number, and last calibration date of your measuring device(s)
f. Other
Page 1 of 3SUPPLEMENTAL STATEMENT OF WATER DIVERSION AND USE
2/19/2016https://ciwqs.waterboards.ca.gov/ciwqs/ewrims_online_reporting/ssPrint.do?form_id=132...
WR-211 App C Page 10

Why direct measurement using a device listed in Section 1 is "not locally cost effective"
Explanation of why use of devices and technologies listed in Section 1 are "not locally cost effective"
The cost of acquisition, installation and maintenance (including vandalism and theft deterrence and remediation), collection and compilation of data from measuring devices is not locally cost effective because the value of the limited benefits to be obtained from these devices (which do not function properly in the conveyance conditions on this property) are limited and do not justify the associated costs. There are no grants available to cover these costs. The unique hydrologic characteristics of the Delta also indicate that meters are not the best available technology in the Delta to measure water use. Water diverted in the Delta that is not consumed is evaporated or recycled into the Delta Pool for reuse. Further support for why measuring devices are not cost-effective in the Delta is found in the documents on file with the SWRCB submitted in connected with the SWRCB?s July 21, 2011 ?Water Measurement Workshop? and the comments due November 18, 2011.
g.
Method(s) used as an alternative to direct measurement
Other
Explanation of method(s) used as an alternative to direct measurement
Use of Cal Poly San Luis Obispo ITRC Report 03-001 ETc Table for Irrigation Scheduling and Design, Zone 12 for surface irrigation, typical year adjusted to the reporting year using CIIMS monthly ETo for the Central and South Delta region.
6. Purpose of Use Irrigation 945 Acres
7. Changes in Method of Diversion
8. Conservation of Water
a.Are you now employing water conservation efforts? No Describe any water conservation efforts you have initiated
b.Amount of water conserved Acre-Feet I have data to support the above surface water use reductions due to conservation efforts.
9. Water Quality and Wastewater Reclamation
a. Are you now or have you been using reclaimed water from a wastewater treatment facility, desalination facility, or water polluted by waste to a degree which unreasonably affects such water for other beneficial causes?
No
b.
Amount of reduced diversionType of substitute water supplyAmount of substitute water supply usedI have data to support the above surface water use reductions due to the use of a substitute water supply
10. Conjuctive Use of Surface Water and Groundwatera. Are you now using groundwater in lieu of surface water? No
Page 2 of 3SUPPLEMENTAL STATEMENT OF WATER DIVERSION AND USE
2/19/2016https://ciwqs.waterboards.ca.gov/ciwqs/ewrims_online_reporting/ssPrint.do?form_id=132...
WR-211 App C Page 11

b.Amount of groundwater usedI have data to support the above surface water use reductions due to the use of groundwater.
11a. Additional RemarksAmounts diverted and used on the ranch cannot be divided between multiple pumps that may operate as points of diversion or rediversion at different times. The amounts reported represent all use for Statements 18411, 16910, 18417, 18414, 18408, 18405, 16909, 18420, 18491 and 18423. Report completed based on cropping and irrigation information provided by prior owner.
AttachmentsFile Name Description Size
No Attachments
Contact Information of the Person Submitting the FormFirst Name KurtLast Name KautzRelation to Water Right OwnerHas read the form and agrees the information in the report is true to the best of his/her knowledge and belief Yes
Page 3 of 3SUPPLEMENTAL STATEMENT OF WATER DIVERSION AND USE
2/19/2016https://ciwqs.waterboards.ca.gov/ciwqs/ewrims_online_reporting/ssPrint.do?form_id=132...
WR-211 App C Page 12

[SUMMARY OF FINAL SUBMITTED VERSION]
SUPPLEMENTAL STATEMENT OF WATER DIVERSION AND USE FOR 2012
Primary Owner: Kurt and Sandra Kautz Family Trust Statement Number: S018411 Date Submitted: 2013-06-28
1. Water is used under Riparian ClaimPre-1914 Claim
2. Year of first use 1875
3-4. Maximum Rate of Diversion for each Month and Amount of Water Diverted and Used
Month Rate of diversionAmount directly diverted or
collected to storage(Acre-Feet)
Amount beneficially used(Acre-Feet)
January 0 0February 0 0March 201.43 125.89April 374.1 233.82May 597.36 373.35June 675.82 422.39July 355.75 222.34August 230.59 144.12September 166.49 104.05October 130.82 81.76November 0 0December 0 0Total 2732.36 1707.72Comments
5. Water Diversion Measurement
a. Measurement Direct measurement using a device listed in Section 1 is "not locally cost effective" for water directly diverted and/or diverted to storage
b. Types of measuring devices used
c.
Additional technology usedDescription of additional technology used
d.Who installed your measuring device(s)
e.
Make, model number, and last calibration date of your measuring device(s)
f. Other
Page 1 of 3SUPPLEMENTAL STATEMENT OF WATER DIVERSION AND USE
2/19/2016https://ciwqs.waterboards.ca.gov/ciwqs/ewrims_online_reporting/ssPrint.do?form_id=130...
WR-211 App C Page 13

Why direct measurement using a device listed in Section 1 is "not locally cost effective"
Explanation of why use of devices and technologies listed in Section 1 are "not locally cost effective"
The cost of acquisition, installation and maintenance (including vandalism and theft deterrence and remediation), collection and compilation of data from measuring devices is not locally cost effective because the value of the limited benefits to be obtained from these devices (which do not function properly in the conveyance conditions on this property) are limited and do not justify the associated costs. There are no grants available to cover these costs. The unique hydrologic characteristics of the Delta also indicate that meters are not the best available technology in the Delta to measure water use. Water diverted in the Delta that is not consumed is evaporated or recycled into the Delta Pool for reuse. Further support for why measuring devices are not cost-effective in the Delta is found in the documents on file with the SWRCB submitted in connected with the SWRCB?s July 21, 2011 ?Water Measurement Workshop? and the comments due November 18, 2011.
g.
Method(s) used as an alternative to direct measurement
Other
Explanation of method(s) used as an alternative to direct measurement
Use of Cal Poly San Luis Obispo ITRC Report 03-001 ETc Table for Irrigation Scheduling and Design, Zone 12 for surface irrigation, typical year adjusted to the reporting year using CIIMS monthly ETo for the Central and South Delta region.
6. Purpose of Use Irrigation 945 Acres
7. Changes in Method of Diversion
8. Conservation of Water
a.Are you now employing water conservation efforts? No Describe any water conservation efforts you have initiated
b.Amount of water conserved Acre-Feet I have data to support the above surface water use reductions due to conservation efforts.
9. Water Quality and Wastewater Reclamation
a. Are you now or have you been using reclaimed water from a wastewater treatment facility, desalination facility, or water polluted by waste to a degree which unreasonably affects such water for other beneficial causes?
No
b.
Amount of reduced diversionType of substitute water supplyAmount of substitute water supply usedI have data to support the above surface water use reductions due to the use of a substitute water supply
10. Conjuctive Use of Surface Water and Groundwatera. Are you now using groundwater in lieu of surface water? No
Page 2 of 3SUPPLEMENTAL STATEMENT OF WATER DIVERSION AND USE
2/19/2016https://ciwqs.waterboards.ca.gov/ciwqs/ewrims_online_reporting/ssPrint.do?form_id=130...
WR-211 App C Page 14

b.Amount of groundwater usedI have data to support the above surface water use reductions due to the use of groundwater.
11a. Additional RemarksAmounts diverted and used on the ranch cannot be divided between multiple pumps that may operate as points of diversion or rediversion at different times. The amounts reported represent all use for Statements 18411, 16910, 18417, 18414, 18408, 18405, 16909, 18420, 18491 and 18423. Report completed based on cropping and irrigation information provided by prior owner.
AttachmentsFile Name Description Size
No Attachments
Contact Information of the Person Submitting the FormFirst Name KurtLast Name KautzRelation to Water Right OwnerHas read the form and agrees the information in the report is true to the best of his/her knowledge and belief Yes
Page 3 of 3SUPPLEMENTAL STATEMENT OF WATER DIVERSION AND USE
2/19/2016https://ciwqs.waterboards.ca.gov/ciwqs/ewrims_online_reporting/ssPrint.do?form_id=130...
WR-211 App C Page 15

[SUMMARY OF FINAL SUBMITTED VERSION]
SUPPLEMENTAL STATEMENT OF WATER DIVERSION AND USE FOR 2012
Primary Owner: Kurt and Sandra Kautz Family Trust Statement Number: S018414 Date Submitted: 2013-06-28
1. Water is used under Riparian ClaimPre-1914 Claim
2. Year of first use 1875
3-4. Maximum Rate of Diversion for each Month and Amount of Water Diverted and Used
Month Rate of diversionAmount directly diverted or
collected to storage(Acre-Feet)
Amount beneficially used(Acre-Feet)
January 0 0February 0 0March 201.43 125.89April 374.1 233.82May 597.36 373.35June 675.82 422.39July 355.75 222.34August 230.59 144.12September 166.49 104.05October 130.82 81.76November 0 0December 0 0Total 2732.36 1707.72Comments
5. Water Diversion Measurement
a. Measurement Direct measurement using a device listed in Section 1 is "not locally cost effective" for water directly diverted and/or diverted to storage
b. Types of measuring devices used
c.
Additional technology usedDescription of additional technology used
d.Who installed your measuring device(s)
e.
Make, model number, and last calibration date of your measuring device(s)
f. Other
Page 1 of 3SUPPLEMENTAL STATEMENT OF WATER DIVERSION AND USE
2/19/2016https://ciwqs.waterboards.ca.gov/ciwqs/ewrims_online_reporting/ssPrint.do?form_id=132...
WR-211 App C Page 16

Why direct measurement using a device listed in Section 1 is "not locally cost effective"
Explanation of why use of devices and technologies listed in Section 1 are "not locally cost effective"
The cost of acquisition, installation and maintenance (including vandalism and theft deterrence and remediation), collection and compilation of data from measuring devices is not locally cost effective because the value of the limited benefits to be obtained from these devices (which do not function properly in the conveyance conditions on this property) are limited and do not justify the associated costs. There are no grants available to cover these costs. The unique hydrologic characteristics of the Delta also indicate that meters are not the best available technology in the Delta to measure water use. Water diverted in the Delta that is not consumed is evaporated or recycled into the Delta Pool for reuse. Further support for why measuring devices are not cost-effective in the Delta is found in the documents on file with the SWRCB submitted in connected with the SWRCB?s July 21, 2011 ?Water Measurement Workshop? and the comments due November 18, 2011.
g.
Method(s) used as an alternative to direct measurement
Other
Explanation of method(s) used as an alternative to direct measurement
Use of Cal Poly San Luis Obispo ITRC Report 03-001 ETc Table for Irrigation Scheduling and Design, Zone 12 for surface irrigation, typical year adjusted to the reporting year using CIIMS monthly ETo for the Central and South Delta region.
6. Purpose of Use Irrigation 945 Acres
7. Changes in Method of Diversion
8. Conservation of Water
a.Are you now employing water conservation efforts? No Describe any water conservation efforts you have initiated
b.Amount of water conserved Acre-Feet I have data to support the above surface water use reductions due to conservation efforts.
9. Water Quality and Wastewater Reclamation
a. Are you now or have you been using reclaimed water from a wastewater treatment facility, desalination facility, or water polluted by waste to a degree which unreasonably affects such water for other beneficial causes?
No
b.
Amount of reduced diversionType of substitute water supplyAmount of substitute water supply usedI have data to support the above surface water use reductions due to the use of a substitute water supply
10. Conjuctive Use of Surface Water and Groundwatera. Are you now using groundwater in lieu of surface water? No
Page 2 of 3SUPPLEMENTAL STATEMENT OF WATER DIVERSION AND USE
2/19/2016https://ciwqs.waterboards.ca.gov/ciwqs/ewrims_online_reporting/ssPrint.do?form_id=132...
WR-211 App C Page 17
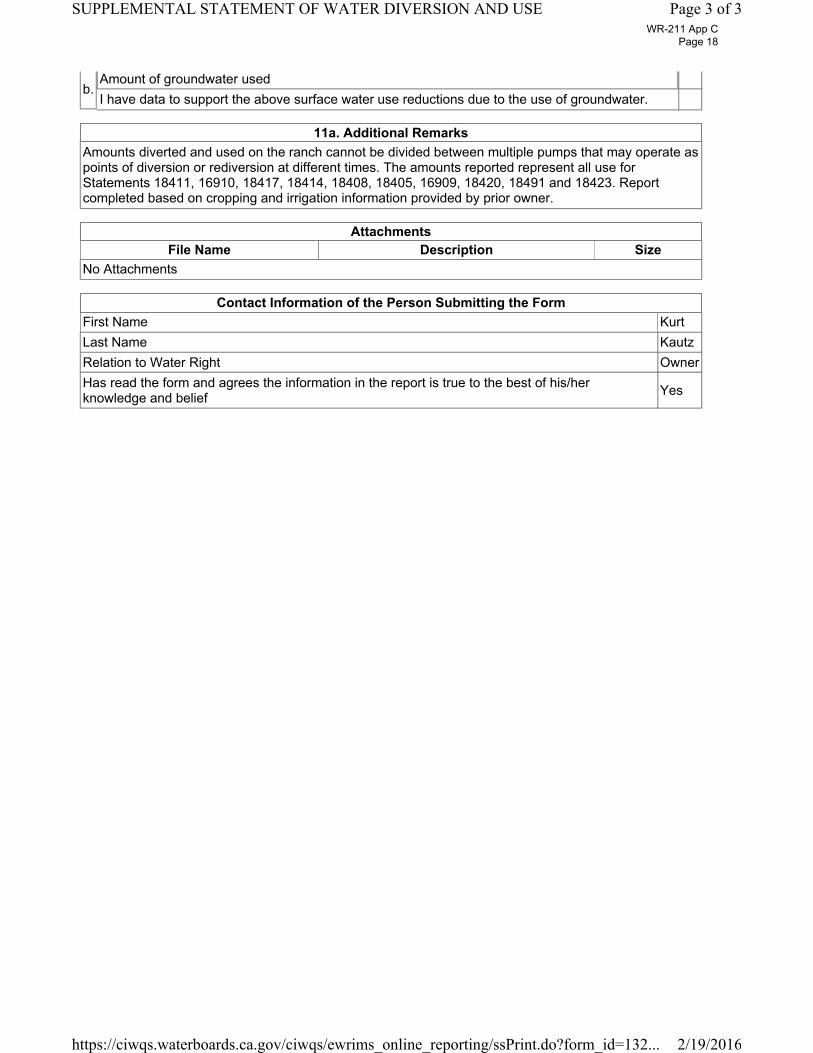
b.Amount of groundwater usedI have data to support the above surface water use reductions due to the use of groundwater.
11a. Additional RemarksAmounts diverted and used on the ranch cannot be divided between multiple pumps that may operate as points of diversion or rediversion at different times. The amounts reported represent all use for Statements 18411, 16910, 18417, 18414, 18408, 18405, 16909, 18420, 18491 and 18423. Report completed based on cropping and irrigation information provided by prior owner.
AttachmentsFile Name Description Size
No Attachments
Contact Information of the Person Submitting the FormFirst Name KurtLast Name KautzRelation to Water Right OwnerHas read the form and agrees the information in the report is true to the best of his/her knowledge and belief Yes
Page 3 of 3SUPPLEMENTAL STATEMENT OF WATER DIVERSION AND USE
2/19/2016https://ciwqs.waterboards.ca.gov/ciwqs/ewrims_online_reporting/ssPrint.do?form_id=132...
WR-211 App C Page 18

[SUMMARY OF FINAL SUBMITTED VERSION]
SUPPLEMENTAL STATEMENT OF WATER DIVERSION AND USE FOR 2012
Primary Owner: Kurt and Sandra Kautz Family Trust Statement Number: S018417 Date Submitted: 2013-06-28
1. Water is used under Riparian ClaimPre-1914 Claim
2. Year of first use 1875
3-4. Maximum Rate of Diversion for each Month and Amount of Water Diverted and Used
Month Rate of diversionAmount directly diverted or
collected to storage(Acre-Feet)
Amount beneficially used(Acre-Feet)
January 0 0February 0 0March 201.43 125.89April 374.1 233.82May 597.36 373.35June 675.82 422.39July 355.75 222.34August 230.59 144.12September 166.49 104.05October 130.82 81.76November 0 0December 0 0Total 2732.36 1707.72Comments
5. Water Diversion Measurement
a. Measurement Direct measurement using a device listed in Section 1 is "not locally cost effective" for water directly diverted and/or diverted to storage
b. Types of measuring devices used
c.
Additional technology usedDescription of additional technology used
d.Who installed your measuring device(s)
e.
Make, model number, and last calibration date of your measuring device(s)
f. Other
Page 1 of 3SUPPLEMENTAL STATEMENT OF WATER DIVERSION AND USE
2/19/2016https://ciwqs.waterboards.ca.gov/ciwqs/ewrims_online_reporting/ssPrint.do?form_id=151...
WR-211 App C Page 19

Why direct measurement using a device listed in Section 1 is "not locally cost effective"
Explanation of why use of devices and technologies listed in Section 1 are "not locally cost effective"
The cost of acquisition, installation and maintenance (including vandalism and theft deterrence and remediation), collection and compilation of data from measuring devices is not locally cost effective because the value of the limited benefits to be obtained from these devices (which do not function properly in the conveyance conditions on this property) are limited and do not justify the associated costs. There are no grants available to cover these costs. The unique hydrologic characteristics of the Delta also indicate that meters are not the best available technology in the Delta to measure water use. Water diverted in the Delta that is not consumed is evaporated or recycled into the Delta Pool for reuse. Further support for why measuring devices are not cost-effective in the Delta is found in the documents on file with the SWRCB submitted in connected with the SWRCB?s July 21, 2011 ?Water Measurement Workshop? and the comments due November 18, 2011.
g.
Method(s) used as an alternative to direct measurement
Other
Explanation of method(s) used as an alternative to direct measurement
Use of Cal Poly San Luis Obispo ITRC Report 03-001 ETc Table for Irrigation Scheduling and Design, Zone 12 for surface irrigation, typical year adjusted to the reporting year using CIIMS monthly ETo for the Central and South Delta region.
6. Purpose of Use Irrigation 945 Acres
7. Changes in Method of Diversion
8. Conservation of Water
a.Are you now employing water conservation efforts? No Describe any water conservation efforts you have initiated
b.Amount of water conserved Acre-Feet I have data to support the above surface water use reductions due to conservation efforts.
9. Water Quality and Wastewater Reclamation
a. Are you now or have you been using reclaimed water from a wastewater treatment facility, desalination facility, or water polluted by waste to a degree which unreasonably affects such water for other beneficial causes?
No
b.
Amount of reduced diversionType of substitute water supplyAmount of substitute water supply usedI have data to support the above surface water use reductions due to the use of a substitute water supply
10. Conjuctive Use of Surface Water and Groundwatera. Are you now using groundwater in lieu of surface water? No
Page 2 of 3SUPPLEMENTAL STATEMENT OF WATER DIVERSION AND USE
2/19/2016https://ciwqs.waterboards.ca.gov/ciwqs/ewrims_online_reporting/ssPrint.do?form_id=151...
WR-211 App C Page 20

b.Amount of groundwater usedI have data to support the above surface water use reductions due to the use of groundwater.
11a. Additional RemarksAmounts diverted and used on the ranch cannot be divided between multiple pumps that may operate as points of diversion or rediversion at different times. The amounts reported represent all use for Statements 18411, 16910, 18417, 18414, 18408, 18405, 16909, 18420, 18491 and 18423. Report completed based on cropping and irrigation information provided by prior owner.
AttachmentsFile Name Description Size
No Attachments
Contact Information of the Person Submitting the FormFirst Name KurtLast Name KautzRelation to Water Right OwnerHas read the form and agrees the information in the report is true to the best of his/her knowledge and belief Yes
Page 3 of 3SUPPLEMENTAL STATEMENT OF WATER DIVERSION AND USE
2/19/2016https://ciwqs.waterboards.ca.gov/ciwqs/ewrims_online_reporting/ssPrint.do?form_id=151...
WR-211 App C Page 21

[SUMMARY OF FINAL SUBMITTED VERSION]
SUPPLEMENTAL STATEMENT OF WATER DIVERSION AND USE FOR 2012
Primary Owner: Kurt and Sandra Kautz Family Trust Statement Number: S018420 Date Submitted: 2013-06-28
1. Water is used under Riparian ClaimPre-1914 Claim
2. Year of first use 1875
3-4. Maximum Rate of Diversion for each Month and Amount of Water Diverted and Used
Month Rate of diversionAmount directly diverted or
collected to storage(Acre-Feet)
Amount beneficially used(Acre-Feet)
January 0 0February 0 0March 201.43 125.89April 374.1 233.82May 597.36 373.35June 675.82 422.39July 355.75 222.34August 230.59 144.12September 166.49 104.05October 130.82 81.76November 0 0December 0 0Total 2732.36 1707.72Comments
5. Water Diversion Measurement
a. Measurement Direct measurement using a device listed in Section 1 is "not locally cost effective" for water directly diverted and/or diverted to storage
b. Types of measuring devices used
c.
Additional technology usedDescription of additional technology used
d.Who installed your measuring device(s)
e.
Make, model number, and last calibration date of your measuring device(s)
f. Other
Page 1 of 3SUPPLEMENTAL STATEMENT OF WATER DIVERSION AND USE
2/19/2016https://ciwqs.waterboards.ca.gov/ciwqs/ewrims_online_reporting/ssPrint.do?form_id=132...
WR-211 App C Page 22

Why direct measurement using a device listed in Section 1 is "not locally cost effective"
Explanation of why use of devices and technologies listed in Section 1 are "not locally cost effective"
The cost of acquisition, installation and maintenance (including vandalism and theft deterrence and remediation), collection and compilation of data from measuring devices is not locally cost effective because the value of the limited benefits to be obtained from these devices (which do not function properly in the conveyance conditions on this property) are limited and do not justify the associated costs. There are no grants available to cover these costs. The unique hydrologic characteristics of the Delta also indicate that meters are not the best available technology in the Delta to measure water use. Water diverted in the Delta that is not consumed is evaporated or recycled into the Delta Pool for reuse. Further support for why measuring devices are not cost-effective in the Delta is found in the documents on file with the SWRCB submitted in connected with the SWRCB?s July 21, 2011 ?Water Measurement Workshop? and the comments due November 18, 2011.
g.
Method(s) used as an alternative to direct measurement
Other
Explanation of method(s) used as an alternative to direct measurement
Use of Cal Poly San Luis Obispo ITRC Report 03-001 ETc Table for Irrigation Scheduling and Design, Zone 12 for surface irrigation, typical year adjusted to the reporting year using CIIMS monthly ETo for the Central and South Delta region.
6. Purpose of Use Irrigation 945 Acres
7. Changes in Method of Diversion
8. Conservation of Water
a.Are you now employing water conservation efforts? No Describe any water conservation efforts you have initiated
b.Amount of water conserved Acre-Feet I have data to support the above surface water use reductions due to conservation efforts.
9. Water Quality and Wastewater Reclamation
a. Are you now or have you been using reclaimed water from a wastewater treatment facility, desalination facility, or water polluted by waste to a degree which unreasonably affects such water for other beneficial causes?
No
b.
Amount of reduced diversionType of substitute water supplyAmount of substitute water supply usedI have data to support the above surface water use reductions due to the use of a substitute water supply
10. Conjuctive Use of Surface Water and Groundwatera. Are you now using groundwater in lieu of surface water? No
Page 2 of 3SUPPLEMENTAL STATEMENT OF WATER DIVERSION AND USE
2/19/2016https://ciwqs.waterboards.ca.gov/ciwqs/ewrims_online_reporting/ssPrint.do?form_id=132...
WR-211 App C Page 23

b.Amount of groundwater usedI have data to support the above surface water use reductions due to the use of groundwater.
11a. Additional RemarksAmounts diverted and used on the ranch cannot be divided between multiple pumps that may operate as points of diversion or rediversion at different times. The amounts reported represent all use for Statements 18411, 16910, 18417, 18414, 18408, 18405, 16909, 18420, 18491 and 18423. Report completed based on cropping and irrigation information provided by prior owner.
AttachmentsFile Name Description Size
No Attachments
Contact Information of the Person Submitting the FormFirst Name KurtLast Name KautzRelation to Water Right OwnerHas read the form and agrees the information in the report is true to the best of his/her knowledge and belief Yes
Page 3 of 3SUPPLEMENTAL STATEMENT OF WATER DIVERSION AND USE
2/19/2016https://ciwqs.waterboards.ca.gov/ciwqs/ewrims_online_reporting/ssPrint.do?form_id=132...
WR-211 App C Page 24

[SUMMARY OF FINAL SUBMITTED VERSION]
SUPPLEMENTAL STATEMENT OF WATER DIVERSION AND USE FOR 2012
Primary Owner: Kurt and Sandra Kautz Family Trust Statement Number: S018423 Date Submitted: 2013-06-28
1. Water is used under Riparian ClaimPre-1914 Claim
2. Year of first use 1875
3-4. Maximum Rate of Diversion for each Month and Amount of Water Diverted and Used
Month Rate of diversionAmount directly diverted or
collected to storage(Acre-Feet)
Amount beneficially used(Acre-Feet)
January 0 0February 0 0March 201.43 125.89April 374.1 233.82May 597.36 373.35June 675.82 422.39July 355.75 222.34August 230.59 144.12September 166.49 104.05October 130.82 81.76November 0 0December 0 0Total 2732.36 1707.72Comments
5. Water Diversion Measurement
a. Measurement Direct measurement using a device listed in Section 1 is "not locally cost effective" for water directly diverted and/or diverted to storage
b. Types of measuring devices used
c.
Additional technology usedDescription of additional technology used
d.Who installed your measuring device(s)
e.
Make, model number, and last calibration date of your measuring device(s)
f. Other
Page 1 of 3SUPPLEMENTAL STATEMENT OF WATER DIVERSION AND USE
2/19/2016https://ciwqs.waterboards.ca.gov/ciwqs/ewrims_online_reporting/ssPrint.do?form_id=129...
WR-211 App C Page 25

Why direct measurement using a device listed in Section 1 is "not locally cost effective"
Explanation of why use of devices and technologies listed in Section 1 are "not locally cost effective"
The cost of acquisition, installation and maintenance (including vandalism and theft deterrence and remediation), collection and compilation of data from measuring devices is not locally cost effective because the value of the limited benefits to be obtained from these devices (which do not function properly in the conveyance conditions on this property) are limited and do not justify the associated costs. There are no grants available to cover these costs. The unique hydrologic characteristics of the Delta also indicate that meters are not the best available technology in the Delta to measure water use. Water diverted in the Delta that is not consumed is evaporated or recycled into the Delta Pool for reuse. Further support for why measuring devices are not cost-effective in the Delta is found in the documents on file with the SWRCB submitted in connected with the SWRCB?s July 21, 2011 ?Water Measurement Workshop? and the comments due November 18, 2011.
g.
Method(s) used as an alternative to direct measurement
Other
Explanation of method(s) used as an alternative to direct measurement
Use of Cal Poly San Luis Obispo ITRC Report 03-001 ETc Table for Irrigation Scheduling and Design, Zone 12 for surface irrigation, typical year adjusted to the reporting year using CIIMS monthly ETo for the Central and South Delta region.
6. Purpose of Use Irrigation 945 Acres
7. Changes in Method of Diversion
8. Conservation of Water
a.Are you now employing water conservation efforts? No Describe any water conservation efforts you have initiated
b.Amount of water conserved Acre-Feet I have data to support the above surface water use reductions due to conservation efforts.
9. Water Quality and Wastewater Reclamation
a. Are you now or have you been using reclaimed water from a wastewater treatment facility, desalination facility, or water polluted by waste to a degree which unreasonably affects such water for other beneficial causes?
No
b.
Amount of reduced diversionType of substitute water supplyAmount of substitute water supply usedI have data to support the above surface water use reductions due to the use of a substitute water supply
10. Conjuctive Use of Surface Water and Groundwatera. Are you now using groundwater in lieu of surface water? No
Page 2 of 3SUPPLEMENTAL STATEMENT OF WATER DIVERSION AND USE
2/19/2016https://ciwqs.waterboards.ca.gov/ciwqs/ewrims_online_reporting/ssPrint.do?form_id=129...
WR-211 App C Page 26

b.Amount of groundwater usedI have data to support the above surface water use reductions due to the use of groundwater.
11a. Additional RemarksAmounts diverted and used on the ranch cannot be divided between multiple pumps that may operate as points of diversion or rediversion at different times. The amounts reported represent all use for Statements 18411, 16910, 18417, 18414, 18408, 18405, 16909, 18420, 18491 and 18423. Report completed based on cropping and irrigation information provided by prior owner.
AttachmentsFile Name Description Size
No Attachments
Contact Information of the Person Submitting the FormFirst Name KurtLast Name KautzRelation to Water Right OwnerHas read the form and agrees the information in the report is true to the best of his/her knowledge and belief Yes
Page 3 of 3SUPPLEMENTAL STATEMENT OF WATER DIVERSION AND USE
2/19/2016https://ciwqs.waterboards.ca.gov/ciwqs/ewrims_online_reporting/ssPrint.do?form_id=129...
WR-211 App C Page 27

[SUMMARY OF FINAL SUBMITTED VERSION]
SUPPLEMENTAL STATEMENT OF WATER DIVERSION AND USE FOR 2012
Primary Owner: Kurt and Sandra Kautz Family Trust Statement Number: S018491 Date Submitted: 2013-06-28
1. Water is used under Riparian ClaimPre-1914 Claim
2. Year of first use 1875
3-4. Maximum Rate of Diversion for each Month and Amount of Water Diverted and Used
Month Rate of diversionAmount directly diverted or
collected to storage(Acre-Feet)
Amount beneficially used(Acre-Feet)
January 0 0February 0 0March 201.43 125.89April 374.1 233.82May 597.36 373.35June 675.82 422.39July 355.75 222.34August 230.59 144.12September 166.49 104.05October 130.82 81.76November 0 0December 0 0Total 2732.36 1707.72Comments
5. Water Diversion Measurement
a. Measurement Direct measurement using a device listed in Section 1 is "not locally cost effective" for water directly diverted and/or diverted to storage
b. Types of measuring devices used
c.
Additional technology usedDescription of additional technology used
d.Who installed your measuring device(s)
e.
Make, model number, and last calibration date of your measuring device(s)
f. Other
Page 1 of 3SUPPLEMENTAL STATEMENT OF WATER DIVERSION AND USE
2/19/2016https://ciwqs.waterboards.ca.gov/ciwqs/ewrims_online_reporting/ssPrint.do?form_id=132...
WR-211 App C Page 28

Why direct measurement using a device listed in Section 1 is "not locally cost effective"
Explanation of why use of devices and technologies listed in Section 1 are "not locally cost effective"
The cost of acquisition, installation and maintenance (including vandalism and theft deterrence and remediation), collection and compilation of data from measuring devices is not locally cost effective because the value of the limited benefits to be obtained from these devices (which do not function properly in the conveyance conditions on this property) are limited and do not justify the associated costs. There are no grants available to cover these costs. The unique hydrologic characteristics of the Delta also indicate that meters are not the best available technology in the Delta to measure water use. Water diverted in the Delta that is not consumed is evaporated or recycled into the Delta Pool for reuse. Further support for why measuring devices are not cost-effective in the Delta is found in the documents on file with the SWRCB submitted in connected with the SWRCB?s July 21, 2011 ?Water Measurement Workshop? and the comments due November 18, 2011.
g.
Method(s) used as an alternative to direct measurement
Other
Explanation of method(s) used as an alternative to direct measurement
Use of Cal Poly San Luis Obispo ITRC Report 03-001 ETc Table for Irrigation Scheduling and Design, Zone 12 for surface irrigation, typical year adjusted to the reporting year using CIIMS monthly ETo for the Central and South Delta region.
6. Purpose of Use Irrigation 945 Acres
7. Changes in Method of Diversion
8. Conservation of Water
a.Are you now employing water conservation efforts? No Describe any water conservation efforts you have initiated
b.Amount of water conserved Acre-Feet I have data to support the above surface water use reductions due to conservation efforts.
9. Water Quality and Wastewater Reclamation
a. Are you now or have you been using reclaimed water from a wastewater treatment facility, desalination facility, or water polluted by waste to a degree which unreasonably affects such water for other beneficial causes?
No
b.
Amount of reduced diversionType of substitute water supplyAmount of substitute water supply usedI have data to support the above surface water use reductions due to the use of a substitute water supply
10. Conjuctive Use of Surface Water and Groundwatera. Are you now using groundwater in lieu of surface water? No
Page 2 of 3SUPPLEMENTAL STATEMENT OF WATER DIVERSION AND USE
2/19/2016https://ciwqs.waterboards.ca.gov/ciwqs/ewrims_online_reporting/ssPrint.do?form_id=132...
WR-211 App C Page 29

b.Amount of groundwater usedI have data to support the above surface water use reductions due to the use of groundwater.
11a. Additional RemarksAmounts diverted and used on the ranch cannot be divided between multiple pumps that may operate as points of diversion or rediversion at different times. The amounts reported represent all use for Statements 18411, 16910, 18417, 18414, 18408, 18405, 16909, 18420, 18491 and 18423. Report completed based on cropping and irrigation information provided by prior owner.
AttachmentsFile Name Description Size
No Attachments
Contact Information of the Person Submitting the FormFirst Name KurtLast Name KautzRelation to Water Right OwnerHas read the form and agrees the information in the report is true to the best of his/her knowledge and belief Yes
Page 3 of 3SUPPLEMENTAL STATEMENT OF WATER DIVERSION AND USE
2/19/2016https://ciwqs.waterboards.ca.gov/ciwqs/ewrims_online_reporting/ssPrint.do?form_id=132...
WR-211 App C Page 30


