
Experimental Evidence on Scaling Up EducationReforms in Kenya∗
Tessa Bold, Mwangi Kimenyi, Germano Mwabu,Alice Ng’ang’a and Justin Sandefur†
November 2016
Abstract
What constraints arise when translating successful NGO programs to improve pub-lic services in developing countries into government policy? We report on a randomizedtrial embedded within a nationwide reform to teacher hiring in Kenyan governmentprimary schools. New teachers offered a fixed-term contract by an international NGOsignificantly raised student test scores, while teachers offered identical contracts by theKenyan government produced zero impact. Observable differences in teacher charac-teristics explain little of this gap. Instead, data suggests that bureaucratic and politicalopposition to the contract reform led to implementation delays and a differential in-terpretation of identical contract terms.JEL codes: C93, I21, M51, O15
∗Professor Mwangi Kimenyi passed away in 2015. An earlier version of this paper circulated under thetitle ”Scaling up What Works: Experimental Evidence on External Validity in Kenyan Education”. We areindebted to the staff of the Ministry of Education, the National Examination Council, and World VisionKenya. Paul Collier, Stefan Dercon, Geeta Kingdon, David Johnson, and Andrew Zeitlin helped conceivethis project. Michael Clemens, Michael Kremer, Karthik Muralidharan, Paul Niehaus, Lant Pritchett, DavidRoodman, Torsten Persson, Jakob Svensson and numerous seminar participants provided invaluable feed-back. We acknowledge the financial support of the UK Department for International Development (DFID)as part of the “Improving Institutions for Pro-Poor Growth” (iiG) research consortium, the InternationalGrowth Centre (IGC), and the PEP-AUSAID Policy Impact Evaluation Research Initiative (PIERI). Theviews expressed here are the authors’ alone.†Bold: Institute for International Economic Studies, Stockholm University, [email protected]. Mwabu:
Department of Economics, University of Nairobi, [email protected]. Ng’ang’a: Strathmore University,Nairobi, [email protected]. Sandefur: Center for Global Development, Washington D.C., [email protected].
1

1 Introduction
A large share of children in low income countries learn little in primary school and complete
their education lacking even basic reading, writing and arithmetic skills. There is growing
descriptive as well as experimental evidence that low teacher effort can, at least partly,
account for this policy failure and that by incentivizing teachers, for example by linking
payments or tenure to performance, teacher effort could be raised and student learning
outcomes could be significantly improved.1
Contract teacher programs – where new teachers are hired at wages below civil service
levels, often under direct control of local schools, and without civil service tenure protections
– are a case in point. A number of contract teacher trials, implemented across the developing
world, have documented significant improvement in student learning outcomes at relatively
low cost, thus making them a prime example of programs to be recommended for countries
with limited public resources to spend on education.2
Despite this evidence, however, questions remain whether similar positive effects can be
realized when such incentive programs are operated at scale and transposed from NGO to
government implementation. We hypothesize that both scale and government implementa-
tion will change the incentives provided by otherwise identical contract structures. Politics
are a major channel for this effect. While employing a small number of contract teachers at
wages far below civil service salaries may not provoke serious political opposition, large-scale
implementation, absent other complementary policy changes, may face political resistance
from vested interests (e.g. teacher unions) who will prevent government from exercising
the de jure flexibility of teacher contracts. State capacity may be an equally important
constraint. In settings with weak public monitoring systems, it is unclear whether interven-
tions predicated on the operation of dynamic incentives can be efficiently implemented and
enforced by government bureaucrats.3
1For primarily descriptive evidence on teacher effort (or lack thereof), see Chaudhury, Hammer, Muralid-haran and Rogers (2006) and Bold, Filmer, Martin, Molina, Stacy, Rockmore, Svensson and Wane (2016).For experimental evidence on raising teacher effort, see Duflo, Hanna and Ryan (2012), Duflo, Dupas andKremer (2015), Glewwe, Ilias and Kremer (2010), and Muralidharan and Sundararaman (2011) and (2013).For recent reviews of the experimental evidence on ways to improve the quality of education, see Kremer,Brannen and Glennerster (2015), Krishnaratne, White and Carpenter (2013), McEwan (2015), Conn (2014),and Glewwe and Muralidharan (2015).
2See Duflo et al. (2015)), Muralidharan and Sundararaman (2013) and discussion in Kremer et al (2013).3There is a large literature pointing to a theoretical and empirical relationship between state capacity
and the provision of public goods and services (see among others Acemoglu (2005) and Besley and Persson(2011)). Conversely, when state capacity is weak, private actors, such as NGOs may be more effectiveat delivering public services. Reinikka and Svensson (2010) find that religious not-for-profit health care
2

In this paper we start investigating these issues using experimental data from the pilot
phase of a nationwide contract teacher program in Kenya that eventually employed 18,000
contract teachers. In the experiment, we estimate the effectiveness of contract teachers under
the management of the Kenyan government and compare it to contract teachers managed
by an NGO. From a sample of 192 government primary schools spanning all eight Kenyan
provinces, 64 were randomly assigned to the control group, 64 to receive a contract teacher as
part of the government program, and 64 to receive a contract teacher under the coordination
of the local affiliate of an international NGO, World Vision Kenya.
Consistent with earlier findings, we find positive and significant effects of the program
in schools where the contract teacher program was administered by an international NGO.
Placing an additional contract teacher in a school where the program is managed by the NGO
increased test scores by roughly 0.18 standard deviations. Importantly, we show that these
effects are visible across diverse conditions, spanning urban slums in Nairobi and nomadic
communities in the remote Northeastern province. When moving from NGO to government
implementation, however, these positive effects are virtually undone: treatment effects were
significantly smaller and indistinguishable from zero in schools receiving contract teachers
from the Ministry of Education.
What explains the stark difference in treatment success between the government and
the NGO as the program went to scale? We find evidence corroborating both the political
resistance and state capacity mechanisms described above. Specifically, the prospect of a
nationwide contract teacher program with 18,000 new contract teachers provoked organized
resistance from the national teachers union, which demanded permanent civil service em-
ployment and union wages for all government hired teachers. The pattern of heterogeneous
treatment effects as well as direct surveys of teachers suggest that the unions response, and
the controversy surrounding the national scale-up that followed, adversely affected the cred-
ibility of dynamic incentives for teachers, in turn lowering their performance, even though
teachers in the experiment were not formally covered by union collective bargaining. Impor-
tantly, these effects are only discernable in the treatment arm where government hired and
managed contract teachers.
We further show that monitoring and implementation of the program may have been
compromised in several ways in the government treatment arm. For example, schools in the
government treatment arm received fewer monitoring visits, and teachers experienced longer
providers in Uganda provided higher quality care than government facilities, while Banerjee, Duflo andGlennerster (2008) show that government supervisors in Indian public clinics sabotaged an NGO programto monitor absenteeism by nurses.
3

salary delays, though of these intermediate indicators, only salary delays were significantly,
negatively correlated with improvements in pupil test performance.
Overall, our results confirm the findings of previous contract teacher interventions re-
garding the ability of contract teachers to significantly improve learning in public primary
schools across diverse baseline conditions in a low-income country - but not in the insti-
tutional context of government implementation. Our finding of a fairly large, significant
treatment effect from the NGO arm of the contract teacher program implies that the null ef-
fect on the government side is not due to a failed intervention in the usual sense. Rather, our
more tentative findings, about the link from teachers’ expectations and union representation
to the failure of the government treatment arm, point to specific mechanisms through which
political general equilibrium effects can undermine the government scale-up of successful
NGO programs.
Our findings are not meant to imply that successful trials with NGO implementation
cannot be scaled up by government – as recent large scale deworming campaigns inspired by
the work of Miguel and Kremer (2004) aptly demonstrate. However, they do raise important
questions about constraints to large-scale public implementation, especially for programs
that may be politically sensitive or require complementary support from the public bureau-
cracy to work successfully. Importantly, our work also shows that randomized-controlled
trials can be used to assess and identify constraints to scaling-up; i.e., shed light precisely
on the issue of external validity that is often raised as a weakness of the RCT method itself.
A natural next step, pursued in Banerjee, Banerji, Berry, Duflo, Mukherji, Shotland and
Walton (2016), would be to also identify complementary policies to deal with these imple-
mentation constraints. We take a small step in this direction as well by also examining
how complementary accountability training and variation in salaries and in the reliance on
existing government bureaucracies can improve the effectiveness of contract teachers even
within the constraints of government implementation.
The rest of the paper is organized as follows. Section 2 describes the public primary
schooling system in Kenya. Section 3 outlines the experimental design and randomization
procedures based on a multivariate matching algorithm and reports tests for balance using
baseline data. Section 4 discusses compliance. Section 5 presents the main treatment ef-
fect estimates, comparing the relative effectiveness of NGO and government implementation
based on both intention-to-treat (ITT) effects and average treatment effects for the treated
(ATT), where actual treatment is defined as successfully recruiting a contract teacher. It
also presents evidence on complementary experimental treatment variations. Section 6 tests
4

for heterogeneous treatment effects across space and initial conditions. Section 7 explores
possible mechanisms explaining the government-NGO performance gap. Section 8 concludes.
2 Context
Primary school enrollment is relatively high in Kenya, but learning levels in primary schools
are poor. According to the most recent national data prior to our study, from the 2006 Kenya
Integrated Household Budget Survey, net primary enrollment was 81%, with government
primary schools accounting for approximately 90% of this (Bold, Kimenyi, Mwabu and
Sandefur 2011). Among children in third grade however, only 3 out of 10 can read a story
in English or do simple division problems from the second grade syllabus (Mugo, Kaburu,
Limboro and Kimutai 2011).
2.1 School finance and governance
In January 2003, the Kenyan government abolished all school fees in government primary
schools. This “Free Primary Education” (FPE) policy established the current system of
school finance in which government primary schools are prohibited from collecting revenue
and instead receive a central government grant – commonly known as “FPE funds” – of
approximately $13.50 per pupil per annum to cover non-salary costs.4
The FPE reform created a new governing body for each government primary school,
equivalent to a local school board, known as a school management committee (SMC). The
SMC is chaired by the head teacher and comprised of representatives from the Ministry of
Education, parents from each grade, teachers, and in some cases local community or religious
organizations. The SMC manages a bank account where the government deposits FPE funds
for each school.
2.2 Civil service teachers and PTA teachers
Formally, all teachers in Kenyan public primary schools are civil servants employed by the
Teacher Service Commission (TSC), a centralized bureaucracy under the direction of the
Ministry of Education. Salaries are paid directly from Nairobi to individual teachers’ bank
accounts. At the beginning of 2011 the Ministry of Education reported a shortage of 61,000
4Except where otherwise noted, we convert Kenyan shillings to U.S. dollars using the prevailing exchangerate at the time of the baseline survey in July 2009, 74.32 shillings per dollar.
5
civil service teachers (across roughly 20,000 primary schools) relative to its target of a 40:1
pupil-teacher ratio.
Civil-service teacher shortages reflect demand-side, rather than supply-side constraints.
At the time of the experiment, the Ministry was operating under a net hiring freeze for civil
service teachers. The relatively high salaries of civil service teachers create a long queue of
qualified graduates seeking civil service jobs, which are allocated according to an algorithm
that primarily rewards time in the queue rather than merit.
To address teacher shortages, many schools also informally contract local teachers known
as Parent-Teacher Association (PTA) teachers, which are funded directly by parents. In the
sample of schools surveyed for this study in 2009, 83% of teachers were employed by the civil
service (TSC) and the remaining 17% by PTAs. Civil-service teachers earned an average of
$261 per month, compared to just $56 per month for PTA teachers.
PTA teachers, as well as the contract teachers discussed below, are often drawn from the
queue of graduates awaiting civil service jobs.
2.3 Contract teachers
A priori, there are multiple reasons to expect contract teachers to improve education out-
comes. First, they provide additional teaching staff with similar educational qualifications
at much lower cost. Second, because their contracts are, in theory, renewable conditional
on performance, schools may retain only good teachers – a selection effect. Third, contract
teachers lacking permanent job tenure should have stronger dynamic incentives to increase
teaching effort – an incentive effect.
In 2009 the government of Kenya announced an initiative to provide funds to schools
to employ teachers on contract outside of the civil service system. The current study was
designed as an evaluation of a pilot phase of this initiative. The variations in teacher contracts
described in Section 3.2 were chosen to inform the design of the eventual national scale-up.
However, scale-up of the national program occurred before the pilot was completed due
to political pressure from outside the Ministry of Education. The randomized pilot program
analyzed here was launched in June 2010, and in October 2010 the Ministry hired 18,000
contract teachers nationwide, nearly equivalent to one per school. These 18,000 teachers
were initially hired on two-year, non-renewable contracts, at salary levels of roughly $135
per month, somewhat higher than the highest tier for the pilot phase.
The allocation of these teachers, coming after the launch of the randomized pilot, provides
us with an opportunity to assess impact while the progam is going to scale. It also poses an
6

obvious threat to the internal validity of our estimates. We show in Section 4.3, however,
that these teachers were allocated without regard to the distribution of contract teachers in
the experimental pilot.
2.4 Organizational structure of implementing agencies: Ministry
of Education and NGO
The Ministry of Education is responsible for all government primary schools in Kenya, which
account for 90.2% of gross primary enrollment. As of 2005 the Ministry’s budget for primary
education totalled $731 million (Otieno and Colclough 2009), compared to just $4 million
per annum in international aid to Kenya for primary education channeled through NGOs
(OECD 2012).
To implement programs such as the contract teacher initiative studied here, the Ministry
relies on local staff in the district education offices. In principle, district staff should make
routine visits to all schools. In practice, the Ministry’s ability to directly call on these district
officials to carry out specific tasks is limited.
World Vision Kenya is the local affiliate of a large international NGO. Despite being
one of the larger international NGOs with a presence in the country, World Vision is active
in only a small fraction of Kenyan districts – highlighting again the constraints to scaling
up with a non-governmental service provider. Within its areas of operation, World Vision
employs permanent staff and paid “volunteers”, who monitor and implement all World Vision
program activities.
3 Program and Research Design
The experiment was implemented from June 2010 to October 2011 in 14 districts spanning
all 8 Kenyan provinces. 24 schools were sampled from each province, yielding 192 schools
in total. One contract teacher per school was randomly assigned to 128 out of 192 sampled
schools.
All schools in the study are public (i.e., government) primary schools. In a randomly
chosen sub-sample of 64 out of the 128 treatment schools, an NGO was assigned responsibility
solely for the contract teacher program. In the other 64 treatment schools, the government
took responsibility for the contract teacher program. The timing and intervention protocols
for the contract teacher program were identical in the NGO and government treatment arms.
7

The baseline and follow-up data collection, including testing of pupils, was conducted by the
same team of enumerators over the same dates.
3.1 Program details
Schools were given funds to hire a contract teacher. Contract teachers were randomly as-
signed to teach either grade 2 or 3 and the head teacher was charged with allocating students
to either the existing teacher or the contract teacher.5 Schools were told that if they were
not satisfied with the performance of the contract teacher or if the contract teacher left for
other reasons, they could hire a replacement. Head teachers were instructed to split the class
to which the new contract teacher was assigned, maximizing the reduction in class sizes in
the assigned grade rather than re-allocating teachers across grades.
3.2 Treatment variations
The random assignment of schools to NGO versus government implementation, which is at
the center of this study, was overlayed by three additional treatment variations designed to
identify the optimal design for the nationwide contract teacher program.
Out of the total 128 contract teacher positions created, 96 were offered KES 5,000 ($67)
per month, while 32 were offered KES 9,000 ($121) per month. The high salary was equiva-
lent to 50% of the average entry level civil service teacher salary. The low salary was roughly
equivalent to the average PTA teacher salary.
We also tested two modalities for recruiting and paying teachers. In the local cell, respon-
sibility for recruiting and paying contract teachers was assigned to the school management
committee, in order to strengthen local control over the teacher’s performance. The central-
hiring cell in the experimental design was more similar to the civil service model. Teachers
were paid directly by the Ministry or World Vision headquarters in Nairobi and district
education officers and NGO officials, respectively, were responsible for selecting candidates.
In all treatment arms, it was left to the school management committee to decide whether a
teacher’s performance was satisfactory.
Finally, we explored the importance of local accountability on teacher (and in turn,
student) performance with a training intervention that placed particular emphasis on sen-
sitizing school management committees about the contract teacher program in their school
5Half of the teachers in the experiment were assigned to grade 2 in 2010, and half to grade 3 in 2010. In2011, all the contract teachers were placed in grade 3.
8

and encouraging them to take a more active role in monitoring teacher performance.
3.3 Sample
The experimental sample focuses on schools with high pupil-teacher ratios. Within each of
the eight provinces, districts were chosen non-randomly by the implementing partners, based
in part on the location of the offices of the partnering NGO.6 Within each province, schools
with a pupil-teacher ratio below the median were excluded from the sampling frame. Using
this sampling frame of high pupil-teacher ratio schools, schools were chosen through simple
random sampling within the selected districts. In each school, the sampling frame consisted
of all the students in grade 1, 2, and 3 present in school at the day of the baseline survey
and of all students in grade 3 and 4 present on the day of the follow-up survey. The sample
consists of a repeated cross-section of students.
3.4 Data and Timeline
The effect of the randomized intervention is measured by comparing differences in academic
assessments in math and English across assignment groups. The survey instruments were
designed with the collaboration of the Kenya National Examination Council (KNEC) to
conform to the national curriculum. The baseline survey – including pupil exams and ques-
tionnaires regarding pupil characteristics and school facilities – was conducted in July and
early August of 2009 by the KNEC and the research team. The baseline survey was admin-
istered to 176 of the 192 schools in the experimental sample. 16 schools, due to transport
and security constraints, could not be reached in time.7 Teachers were placed in treatment
schools in June 2010; their contracts ended in October 2011. Follow-up data collection was
conducted in the same sample of schools in October 2011. Roughly 15,000 students were
tested in the baseline and follow up surveys. At baseline, we sampled 10 children in grade
1 and 10 children in grade 2 for one-on-one testing, and 20 children in grade 3 for written
testing at the school.8 At follow-up, we sampled 30 children from grade 3; i.e., the cohort
6The sample draws from 14 districts in total, using multiple districts from the same province wherenecessary to reach sufficient sample size. These 14 districts were: Nairobi province (North, West, East);Central province (Muranga South); Coast province (Malindi); Eastern province (Moyale and Laisamis);North Eastern (Lagdera, Wajir South, Wajir West); Nyanza province (Kuria East and Kuria West); RiftValley province (Trans Mara); Western province (Teso).
7The schools that could not be surveyed at baseline, with one exception, were all located in the remoteEastern or North Eastern provinces.
8We included an oral one-on-one component because this is the preferred method for testing youngchildren who may not be literate enough to sit written tests. Since this is a very time-consuming way to test
9

that was in grade 1 at the time of the baseline, and 20 children from grade 4; i.e., the cohort
that was in grade 2 at the time of the baseline, for testing at the school.9 10 of the sampled
children from Standard 3 were tested one on one, the remainder from Standard 3 and 4 sat
written exams. If there were fewer children per grade than the specified sample – a problem
that mainly occurred in the North Eastern and Eastern province – the entire grade was
sampled, and preference was given to one-on-one testing over written exams.
Both at baseline and at follow-up, the tests were targeted to the grade that was tested.
The written tests were marked blindly by a separate set of examiners, whereas the one-on-
one tests were marked directly by the (independent) enumerators who administered them.
The average age of students at baseline was 7.6 years for the grade 1 test, 8.8 years for the
grade 2 test, and 10.4 years for the grade 3 test, with no significant difference in age or
numbers across the three groups. The average age of students who sat the test at follow-up
was 10.5 years in grade 3 and 11.4 years in grade 4, again balanced across all three groups.
Both at baseline and at follow-up, a school questionnaire asking for staffing and enrollment
was administered to the head master and a pupil questionnaire asking for basic demographic
and socio-economic information was administered to the students sitting the test. At follow-
up we also collected data on the implementation of the contract teacher program including
information on monitoring and presence. Throughout the program, data on the hiring of
contract teachers, IDs, salary payments and turnover was collected.
In the term following the end of the contract teacher program, a questionnaire was
administered to all contract teachers who had been employed through the program asking
for demographic and socio-economic information, their experience through the program,
their labor market experience since then and their political attitudes and involvement with
the national controversy surrounding the employment of 18,000 contract teachers.
3.5 Randomization and Balance
To guarantee that the sample is balanced between treatment and control schools, an optimal
multivariate matching algorithm was used (see Greevy, Lu, Silber and Rosenbaum (2004)
and Bruhn and McKenzie (2009)). Treatment and control schools were matched along the
following dimensions: results in nationwide end-of-primary leaving exams, baseline scores on
the grade 1 test, pupil-teacher ratio, number of classrooms, number of civil service teach-
students, however, we also gave students (from grade 3 onwards) written tests, which allowed us to test alarger sample of children.
9If a child that was sampled, was not present, enumerators were told to sample a replacement.
10

ers, number of PTA teachers and average pay of teachers employed by the Parent-Teacher
Associations at baseline. Baseline data were incomplete and not fully processed at the time
of randomization, and district average values were used where data was not available. The
algorithm created groups of 3 schools, which were matched along the above dimensions,
and then randomly assigned them to the three primary treatment arms: control, additional
teacher with government implementation, and additional teacher with NGO implementation.
Figure 1 in the appendix shows the distribution of schools assigned to the control group and
government or NGO implementation across the eight provinces.
Table 1, Panel A, shows balance tests, for the sample of 176 schools with baseline survey
data, for the variables used in the block randomization.10 Panel B reports whether random-
ization was also successful in achieving balance on baseline indicators that were not explicitly
used in the matching algorithm, namely, average standardized test scores (for grades 2, 3
and overall), as well as several other student and test-specific variables.
The number of pupils tested and their age and gender are similar across the three as-
signment arms. Schools in the three groups are also, on average, tested at approximately
the same dates. None of the baseline comparisons with respect to average standardized test
scores yield any significant differences. However, we do observe economically meaningful
differences in magnitude for baseline test scores, especially for grade 2, which are higher in
schools where the contract teacher is managed through the government.11 Since random-
ization was correctly implemented, this imbalance in baseline test scores can be treated as
chance bias (Altman 1985, Roberts and Torgerson 1999) and to account for it we control for
baseline test scores in all our regressions.12 Controlling for baseline scores will also improve
precision, since test scores are highly persistent (Bruhn and McKenzie 2009, Roberts and
Torgerson 1999, Egbewale 2015).
10See Section 3.4. Of the 16 schools with no baseline survey data, 7 of the schools were assigned to theNGO arm, 7 were assigned to the government arm, and 2 were assigned to the comparison group. While ahigher share of treatment schools compared to comparison schools could not be surveyed at baseline, thereis no statistical difference in the share of schools surveyed between the three intervention arms.
11A priori, grade 1 and 2 tests are anticipated to be more accurate because they were collected through one-on-one tests which have greater reliability for young children with limited literacy, while grade 3 studentstook paper-and-pencil tests administered in larger groups. Moreover, test scores in all three grades arestrongly correlated with each other (of similar magnitude in the two treatment arms) and the cross schoolvariation is much larger than the variation across cohorts within schools.
12As noted by Bruhn and McKenzie (2009), controlling for baseline covariates to correct chance bias impliesthat the remaining unobservables are no more likely to be unbalanced than if we had not found unbalancedbaseline characteristics.
11

3.6 Sample attrition
192 schools were initially sampled for the experiment and assigned to either the intervention
or the comparison groups. However, due to transport and security conditions, 4 schools (1
in the government treatment arm, 1 in the NGO treatment arm and 2 in the control group)
could not be visited, thus reducing the effective sample to 188 an attrition rate of 2 percent.
4 Compliance and Implementation
Random assignment of a school to the treatment group created a job vacancy for a contract
teacher. To simulate a scalable program, the onus then fell on district and school officials
under the guidance of their implementation partner; i.e., either the government or the NGO
to recruit a suitable teacher, place him or her in either grade 2 or 3, and split that grade
into two (or more) streams. Examining compliance is both of independent interest and can
shed light on the mechanisms underlying the treatment effects on learning we document in
the next section.
4.1 Teacher recruitment
The 128 schools assigned to receive a contract teacher as part of the experimental evaluation
had varying success in recruiting and retaining contract teachers. Of the 64 schools assigned
to the government (NGO) treatment arm, 88% (86%) were successful in hiring a contract
teacher at some point during the program. However, teachers did not necessarily stay with
the school for the entire duration of the program and when a vacancy opened up, it was
not always filled. As a consequence, out of the 17 months of the program, schools in the
government (NGO) arm actually employed a teacher for 11.6 (13.0) months on average (see
Panel A of Table 2).
Table 3 examines the vacancy rate more closely, modeling success in filling a vacancy as
a function of variations in contract and salaries that were manipulated by the experiment.
The dependent variable is a binary indicator of whether a teacher was present and teaching
in a given school in a given month, with monthly observations spanning the duration of the
experiment from June 2010 to October 2011. We estimate both a linear probability model
and a logit model.
We examine three experimental determinants of teacher labor supply. First, Table 3
shows that NGO implementation led to between 12 and 14% more months with a filled
12

vacancy, relative to the government treatment arm, and this effect is significant across all
specifications. Second, local control over teacher hiring and payment had an effect of similar
magnitude to the salary differential, raising the probability of a filled vacancy by a robustly
significant 14 to 15% across specifications. Third, offering a high salary increases the prob-
ability of filling a teaching vacancy by just under 12%, mirroring results from Ferraz and
Finan (2009) and Deserranno (2016). This effect is significant and consistent between the
LPM and logit models. The first and second findings point to the challenges of government
implementation, and a possible, partial solution (decentralized hiring). The third effect sug-
gests the failure to recruit a teacher was sensibly related to experimentally controlled wage
offers, suggesting that limited supply of contract teachers, at least in certain areas, could
constrain the nationwide implementation of a low-cost contract teacher program.
4.2 Changes in school and classroom characteristics induced by
the program
The contract teacher intervention was intended to operate via two channels: reducing class
size by adding more teaching staff; and increasing the quality and motivation of this addi-
tional staff through the contract structure. Importantly, our ability to measure both effects
using test-score data on the target cohort of pupils also hinges on schools’ willingness to
comply with the intervention by (a) placing the contract teacher in the correct grade, and
not reallocating the existing teacher for that grade, such that the class-size reduction is
concentrated on the treatment cohort.13
Table 2, Panel B, reports the extent to which schools complied with the intervention
protocol in terms of placing the teacher in grade 2 and 3 and splitting the grade. Schools
largely followed the instructions on the former point, but less so on the latter. 95% of teachers
were employed in the correct grade at least some of the time and 72% were employed in the
correct grade all of the time. Class sizes in the treatment cohort were reduced by just over
10%, but this reduction is not significant.
Importantly, there are no significant differences in compliance between the government
and the NGO. Neither teacher placement nor changes in class size were significantly different
between the NGO and government sample. This suggests that any differential effects on test
13For comparison, in Muralidharan and Sundararaman (2013) a contract teacher was provided to a schoolwith no restrictions on how they were to be assigned or used. The result is that the estimated treatmenteffect combines both class size and incentive effects. In contrast, in Duflo et al. (2015) contract teachers wereassigned to a given grade and students randomly assigned to contract or existing teacher, thus allowing theauthors to separate class size effects from the incentive effect.
13
scores will not be driven by the inability (or unwillingness) of the implementing agency to
follow the intervention protocol.
4.3 Reallocation across schools
A second question is the extent to which teachers and pupils endogenously reallocated in
response to the program.
First, random assignment to the treatment group may affect a school’s hiring of PTA
teachers or the probability of being assigned a TSC teacher and/or one of the 18,000 teachers
from the national contract teacher program.14 If staff levels responded endogenously to the
placement of a contract teacher through the research program, then the estimated treatment
effect may be biased (most likely downwards). We explore this possibility in the last three
rows of Table 2, Panel C. Across the board, there are no significant differences between
treatment and control schools (or between NGO and government treatment arm) in terms
of number of PTA teachers, number of civil service teachers, and number of teachers from
the national contract teacher program. Of course, it is still possible that schools in the
government and NGO treatment arm responded differently to the national-scale up and we
examine this possibility formally in Section 7.
Second, we are concerned with possible shifts in school enrollment in response to the
program. The survey consists of a panel of schools, not a panel of students. Thus estimated
treatment effects may be due to changes in performance for a given pupil, and/or changes
in the composition of pupils. In either case, these are causal effects, but with very different
interpretations. To shed light on which of these two channels drives our results, Table 2
reports enrollment levels at the end of the program and percentage changes in enrollment
between 2009 and 2011 in the treatment cohort. There are no significant differences in
enrollment in the treatment cohort between treatment and control schools and between the
government and NGO treatment arm. Overall, there is a small reduction in enrollment in all
schools (enrollment in the treatment cohort drops by roughly 10% between 2010 and 2011),
but this trend is uniform across the various treatment arms. We cannot rule out that these
net enrollment changes mask larger gross changes, leading to changes in the unobserved
14A priori, we would not expect the hiring of the eighteen thousand contract teachers in the national scale-up to respond to the employment of teachers in the experiment. Firstly, the allocation of contract teachersin the national program was based on administrative enrolllment data collected before the beginning of theexperiment described here. Secondly, the steering group, which included several high-ranking governmentofficials, specifically agreed that allocation of teachers in the national and in the experimental program wouldbe independent of each other.
14

ability of pupils. We argue that the observed net enrollment changes would have to mask
implausibly large (and systematic) changes in gross enrollment for this to be a concern in
the estimation.
To summarize, we find that the contract teacher job vacancies created by the experimen-
tal program were filled in roughly 70% of months overall, with a quantitatively small but
significant difference between NGO and government. Teachers were overwhelmingly placed
in the correct grade, but they were often asked to cover additional grades as well, yielding
small net changes in class size in our sample. None of these reallocations differed between
the NGO and government treatment arm. Finally, there is no evidence of reallocation of
teachers or pupils across schools in response to the program.
On the basis of these compliance patterns, we interpret the estimated parameters in the
next section as causal treatment effects on a given cohort of pupils, with a more limited
role for class size reductions. The possibility remains that differences between the NGO and
government arm may be attributable to differences in recruitment success, which we explore
further below.
5 Comparing the effectiveness of contract teachers un-
der government and NGO management
As noted in the introduction, scaling up successful education programs in many low-income
countries typically requires a transition from working with non-governmental organizations
to working within governments. The experiment here is designed to address this central
question of whether the Kenyan government can implement a fairly standard contract teacher
program. We proceed in three steps. First, we present reduced form effects on learning
outcomes for the NGO and the government treatment arms (Section 5.1). We then examine
whether the observed disparity in treatment effects across the implementing partners can
be explained by differences in implementation, and in particular success in recruiting and
retaining teachers, and the effectiveness of SMCs (Sections 5.2 and 5.3). Finally, in Section
7, we examine mechanisms related to working with government and scaling up in order to
explain the differential performance.
15

5.1 ITT effects
We estimate the average intention-to-treat (ITT) effect of school-level assignment to the
contract teacher program on test scores, allowing for differential effects in the NGO and
government treatment arms. The dependent variable Yijt is the score on a math and English
test administered in 2009 and again in 2011, standardized relative to control schools in each
year. The ITT effect is measured by the coefficients on the random assignment variable Zjt,
interacted with indicators for assignment to the NGO or government treatment arm:
Yijt = α1 + βngo1 (Zjt × NGOjt) + βgov
1 (Zjt ×Govjt) + γ1Xjt + ε1ijt (1)
where Zj,t=0 = 0 and Zj,t=1 = 1 if the school was assigned a teacher and zero otherwise
and Xjt are baseline controls. The βngo and βgov coefficients are ITT measures in that
they capture the causal effect of being assigned to the NGO or government treatment arms,
averaging over schools with varying degrees of success in recruiting contract teachers.
We estimate three different specifications of equation (1). First, we use a single cross-
section of post-treatment data and control for initial test scores averaged at the school
level (Yj,t−1 ∈ Xjt).15 Second, we pool both pre- and post-treatment data in a standard
differences-in-differences specification including controls for school-level fixed effects and a
time dummy. Third, we present a specification using only the cross-section.
We estimate these specifications using two alternative rules for inclusion in the sample:
following Puma et. al. (2009), we use as our preferred sample the 174 schools with complete
baseline and follow-up data. We also report results after imputing baseline test scores for the
14 schools which have follow-up data but are missing baseline scores. We use two common
imputation methods: dummy variable adjustment and mean value imputation.16
15Initial test scores are averaged at the school level since the students sampled at baseline are in general notthe same as the students sampled at follow-up. Yj,t−1 is the average score over grade 1, 2 and 3. Includinga longer list of baseline covariates does not affect the results.
16There are many different methods for dealing with missing baseline values (see Little and Rubin (2002)).For cluster randomized trials with baseline variables missing for entire schools, the U.S. Department ofEducation (National Center for Education Evaluation and Regional Assistance) recommends either casedeletion (our 174 schools sample) or imputation using either dummy variable adjustment, or mean valueimputation (see Puma, Michael J. and Olsen, Robert B. and Bell, Stephen H. and Price, C. (2009)). Theseauthors show that the bias of these simple and other more advanced methods is small as long as the percentageof missing data is small (<10%) and in particular when data are missing at random (that is missingness isnot correlated with treatment status), which is the case in our sample since treatment status was randomlyassigned after baseline fieldwork was complete. Dummy variable adjustment sets missing baseline scores tozero and introduces a dummy variable equal to one if baseline data is missing and zero otherwise. Intuitively,the treatment effect is therefore the (weighted) average of the impact of a contract teacher conditional onbaseline scores and the unconditional impact. Mean value imputation fills in missing values (separately by
16

The ITT effect of contract teachers in the NGO treatment arm is estimated to be between
.16 and .18 of a standard deviation (see columns (1) – (3) in Table 4), an effect that is both
economically meaningful and statistically significant in the regressions with baseline school
average test scores and fixed effects.17 The ITT effect of contract teachers in the government
treatment arm, on the other hand, is effectively zero in the specifications that control for
baseline scores and school fixed effects and the gap between the effect of the NGO- and
government administered programs is always positive, i.e., with larger effects in the NGO
program, and statistically significant. In the pure cross-section, the effect of a contract
teacher in the NGO arm is estimated to be twice as large as in the government arm, though
here the difference is not significant.
Figure 2 unpacks the result by displaying the kernel density of pupil-level test scores
for each of the three treatment arms: government, NGO, and control, both at baseline in
2009 and the follow-up in 2011. The distributions are quite close in 2009, and move apart
in 2011. Because test scores are standardized relative to control schools in each year, the
overall shape of the distributions differs between years, but in each round all treatment arms
are handled identically.
Figure 3 shows the main ITT result graphically, comparing the kernel density of test score
changes between control schools, the government treatment arm, and the NGO treatment
arm. The ITT effect does not appear to be driven by outliers, as the NGO test-score
distribution lies everywhere to the right of the government test-score distribution.
We explore the robustness of the core results along the following dimensions: (a) adding
the 14 schools with only follow-up data to the analysis; (b) computing results separately for
English and Mathematics; (c) considering different sets of baseline controls; (d) averaging
all data at the school-year level; (e) Lee bounds and other controls to examine potential bias
due to non-random attrition at follow-up.
In Table A.1 in the Online Appendix, we report intention-to-treat effects on the full
treatment status in the case of RCTs) on the basis of other available characteristic. Here, we use districtaverages (separately for each treatment and control arm).
17The effect sizes estimated here are similar to other experimental findings on contract teachers by Dufloet al. (2015) in Western Kenya and Muralidharan and Sundararaman (2013) in Andhra Pradesh, India.Duflo et al. (2015) find a 0.19 standard deviation effect on math and literacy scores in the grade (but notclass) where the contract teacher was placed in a specification controlling for baseline pupil test scores,while Muralidharan and Sundararaman (2013) find an ITT effect of approximately 0.15 standard deviations,also on combined math and literacy also controlling for baseline pupil test scores. Of course, these resultsmeasurement somewhat different things. Ideally one would standardize the effects to allow for differencesin (a) the length of exposure, (b) the proportion of test-takers directly exposed to treatment. A roughattempt to do so suggests that, effect sizes found here are somewhat larger than those in Duflo et al. (2015)andvMuralidharan and Sundararaman (2013).
17

sample of schools, with imputed baseline scores for the 14 schools with follow-up data but
missing baseline scores. The core results reported in Table 4, columns 1–2, remain in the
full sample of schools and for the two different imputation methods. The ITT effect of a
contract teacher on test scores in the NGO treatment arm is significantly positive, while the
effect in the government arm is effectively zero. The difference between the two coefficients
is significant in one of the four specifications and marginally insignificant in the other three.
The results for the simple cross-section in column (5) show the importance of controlling for
baseline characteristics in the full sample, as the difference between the NGO and government
treatment effect, while positive, is smaller and not significant.
Second, considering English and Maths separately in columns (1)-(4) in Table A.2, the
results remain the same, i.e. a large positive effect of a contract teacher in schools where the
program was managed by the NGO and a zero effect where the government implemented
the program in both subjects. The effects are significant only for English, however.
Third, to assess the robustness of the results with respect to baseline controls, we present
several different robustness checks of the main specification in Table A.2: excluding base-
line scores in grade 2, which are the main source of the imbalance at baseline (column 5),
and instrumenting baseline school average scores using an independent measure of baseline
school performance, namely average school-level scores from the Ministry’s 2007 national
Kenya Certificate of Primary Education examination (column 6). The effects are essentially
unchanged: a large positive and significant ITT effect in the NGO arm and an effectively
zero ITT effect in the government arm.
Fourth, we collapse all test scores at the school (and year) level and estimate the ITT
specification controlling for baseline test scores averaged at the school level, as well as a first
difference specification given by:
∆Yjt = α2 + β2∆Zjt × NGOjt + β′2∆Zjt ×Govjt + γ2∆Xjt + ε2jt (2)
This differs from estimates based on equation (1) in two respects. It is more conservative in
terms of the standard errors than the pupil-level regression using clustered standard errors
(Angrist and Pischke 2009). Point estimates from equations (1) and (2) also differ due
to an implicit re-weighting of the observations. Pupil sample sizes vary across schools in
relationship with school enrollment up to a maximum of twenty pupils per class. Below this
ceiling of twenty pupils, schools with more pupils receive more weight, and the estimates using
pupil-level data can be interpreted roughly as the effect on an average pupil. Estimates using
the collapsed data represent, instead, the treatment effect in the average school in the sample.
18

The results are presented in column (7) and (8) of Table A.2. Again, the conclusions are
unchanged, being assigned a contract teacher increases test scores by roughly 0.2 standard
deviations in the NGO treatment arm, which is significant at the 5% level, but has no
measurable effect in the government treatment arm.
Finally, we explore whether school or pupil attrition at follow up biases our results.
To do so, we estimate bounds on the coefficients in (2) using the procedure proposed by
Lee (2009). The results are presented in the bottom part of column 8, Table A.2, and
again, the conclusions remain unchanged (however, this time it is only the difference between
treatment arms that is significant). We examine whether pupil attrition (or increases) drive
the results by including the percentage change in enrollment in the treatment cohort or grade
as explanatory variables. The results are reported in column (9) and (10). Including the
enrollment variables, which are themselves significant and positively related to test scores,
does not change the results. The effect of an additional contract teacher in the government
treatment arm is still zero and insignificant, while the effect in the NGO treatment arm is
around .2, just shy of significant.
5.2 IV estimates
Can differences in the probability of filling contract teacher vacancies described in Section
4.1 explain the difference in government and NGO performance? We address this question
using instrumental variables to estimate the local average treatment effect of employing a
contract teacher. IV estimates allow us to test whether NGO-government differences are
attributable to differences in recruitment success, under the maintained assumption that
random assignment to treatment status influences test scores only through teacher presence.
Define T as the proportion of months during the experiment that a school employed
a contract teacher. T is clearly endogenous to unobserved factors such as the quality of
school management which may also directly affect pupil performance. Random assignment
satisfies the exclusion restriction for a valid instrument for contract teacher presence under
the assumption stated above, allowing us to estimate local average treatment effects for
schools hiring a teacher in both the government and NGO program.
Thus we estimate the local average treatment effect in the government and treatment
arm as
Yijt = α3 + β3 Tjt × NGOjt + β′3 Tjt ×Govjt + γ3Xjt + ε3ijt (3)
where Tjt × NGOjt and Tjt ×Govjt are the predicted values from the following first-stage
19
regressions
Tjt × NGOjt = α4 + δ4Zjt × NGOjt + δ′4Zjt ×Govjt + γ4Xjt + ε4ijt. (4)
Tjt ×Govjt = α5 + δ5Zjt × NGOjt + δ′5Zjt ×Govjt + γ5Xjt + ε5ijt. (5)
Results from estimating equation (3) are presented in Columns (4) – (6) of Table 4.
The LATE estimate of a contract teacher in the NGO treatment arm is estimated to be .23
and is significant in both the model with baseline school level average scores and the model
with school fixed effects, while the treatment effect of a contract teacher in the government
treatment arm is indistinguishable from zero in both these specifications, with the difference
significant in the fixed effects estimation. In short, scaling our reduced-form ITT effects by
the length of exposure to a contract teacher in a LATE framework provides no evidence that
differences in recruitment and retention alone can explain the government-NGO performance
gap.
5.3 Contract variations and training
In addition to the binary test of the contract teacher treatment versus a control condition,
we also tested three program variations: an overlapping training intervention; a variation
in contract terms to give local schools control over recruitment and teacher payment; and
a variation offering a considerably higher salary. Each of these variations is of independent
interest, but may also shed light on the central discrepancy between NGO and government
implementation.
First, Duflo et al. (2015) show that training school management committees in their
governance responsibilities is an effective complement to the contract teacher intervention.
We conduct a similar SMC training intervention in half of the schools in both the NGO and
government treatment arm. (Note that SMC training was not conducted if the school was
not assigned a contract teacher, as the training curriculum focused heavily on the SMC’s
responsibilities in recruiting, paying, and monitoring the performance of the teachers.) Table
5 shows the ITT effect of the SMC training on test scores, extending the specification in
equation (1) and controlling for baseline scores either by including the school averages or
school fixed effects.
As seen in the top panel, columns 1 and 2, the coefficient on the interaction of Z,
assignment of a contract teacher, and the indicator variable for SMC training is positive
but statistically insignificant in both specifications. The bottom panel shows the results
20

separately for the NGO and government treatment arms. While the SMC training has
no significant effect in either treatment arm, some interesting patterns emerge. Schools in
the government arm that received accountability training have test scores that are .1 of a
standard deviation higher (an effect of similar magnitude to Duflo et al. (2015)) than those
that did not, while the SMC training had no effect in the NGO treatment arm.18
Second, Table 5 tests whether there was any effect of empowering the SMC, rather than
district or national officials, to recruit and pay teachers. On average, contract teachers that
were hired and paid centrally increased test scores by a significant .15 standard deviations,
while those who were locally hired had no significant effect on test scores, though the differ-
ence between the two effects is not significant (see column (3)). Inspecting the bottom panel
of Table 5, we see that this effect arises because schools in the government arm had .19 of a
standard deviation higher test scores when hiring and payments were centrally administered,
while the coefficient on the modality of hiring and payment was almost precisely zero for the
NGO treatment arm in column 3.
Third, we find no effect of salary on performance (columns (5) and (6) of the table). While
this stands in contrast to some of the results in the literature (Ferraz and Finan 2009), it is
consistent with recent research by de Ree, Muralidharan, Pradhan and Rogers (2015), who
found that a doubling of pay for Indonesian school teachers had no effect on test scores.
Together, the results provide some (albeit limited) evidence that there is potential for
optimizing the design of the contract teacher program even within the constraints of a
government scale-up: in particular, they point to the advantage of relying on central and
established government bureaucracies in the hiring and payment of teachers (despite the
loss in local accountability this may entail) and the importance to complement contract
teachers with accountability training. Schools in the government arm that received both
these treatments had test scores .2 of a standard deviation higher than control schools (an
effect similar to the average effect in the NGO treatment arm though not significant). Given
the divergent results in the NGO and government arm, the design is however underpowered
to detect significance for these effect sizes.
18Note that the study is somewhat underpowered to study these cross-cutting interventions separately forgovernment and NGO treatment arms. Given the lack of significance for all three of the program variationsexplored in this section, it is worth noting the (ex post) power calculations for these tests. Given theintraclass correlation of 0.33 in our endline test data and a correlation of 0.43 between baseline and endlinescores, the MDE for a single treatment arm (i.e., government or NGO implementation) is approximately0.26 standard deviations.
21

6 Heterogeneous treatment response
In addition to the institutional considerations raised above, a more traditional concern about
translating successful reforms from one context to another stems from possible heterogeneous
response to treatment associated with differences in school or pupil characteristics. The
broad geographic dispersion of our sample is helpful in both addressing and testing the basis
for this concern.
Recently, a number of researchers have advocated modelling heterogeneity in treat-
ment effects as a means to address external validity concerns (Stuart, Cole, Bradshaw and
Leaf 2011, Hartman, Grieve, Ramsahai and Sekhon 2013, Tamer and Kline 2011), i.e. the
extent to which treatment effects found in one setting can be generalized. This relies on the
strong assumption that the primary threat to external validity is variation in causal param-
eters along observable dimensions of the treatment population. Under such assumptions,
heterogeneous effects can clearly be used to extrapolate estimates to new populations.
Two issues to be addressed in estimating heterogeneous effects are (i) selecting the di-
mensions of heterogeneity, and (ii) hypothesis testing with multiple comparisons (Green and
Kern 2012). We explore three hypotheses tested in an extension of equation (1) including
school fixed effects.
Yijt = α6 + β6Zjt + β′
6
(Zjt ×
Xjt − µx
σx
)+ γ6j + ε6ijt (6)
The first hypothesis is that the intervention’s effect will be stronger where the supply of
teachers is higher, reducing the risk of unfilled vacancies and potentially increasing contract
teachers’ motivation to maintain employment. As a rough proxy for the supply of teachers in
a given area, we use the count of other primary schools within a 5-mile radius of the school.
We assume that a higher density of primary schools implies a higher population density,
particularly for skilled labor, and a thicker labor market for teachers.
Our second hypothesis about heterogeneity is that the addition of a contract teacher will
have a larger effect in schools with a higher initial pupil-teacher ratio, as these schools will
experience a larger reduction in class size due to treatment. Finally, our third hypothesis is
that the treatment will be more effective in schools with lower initial test scores. This hy-
pothesis is more speculative, but is motivated by the attention paid to tracking and remedial
education in the contract teacher literature (Banerjee, Cole, Duflo and Linden 2007, Duflo,
Dupas and Kremer 2011).
Figure 4 shows kernel densities of the three baseline characteristics associated with our
22

three hypotheses about heterogeneous treatment effects – pupil-teacher ratios, geographic
density of schools, and baseline test scores.
Table 6 shows the results from estimating the heterogeneous ITT effects in equation
(6). Because the variables measuring exogenous heterogeneity have been standardized, all
coefficients can be interpreted as the change in the treatment effect implied by a one standard-
deviation change in the independent variable. For instance, column 1 shows that the ITT
effect is roughly 0.007 standard deviations larger in locations with a higher density of schools,
which is statistically indistinguishable from zero.
Column 2 also shows no consistent relationship between initial pupil-teacher ratios and
the treatment effect. Turning to our third hypothesis, column 3 shows a significantly nega-
tive relationship between initial test scores in the baseline and subsequent treatment effects
(coefficient of -0.115) that is concentrated in the government treatment arm, implying that
the intervention is somewhat progressive.
What do these findings imply for the effectiveness of the program across diverse condi-
tions? Our main result from previous sections is that the NGO program had a significant,
positive ITT effect on pupil performance of approximately 0.2 standard deviations. There
is little evidence that NGO treatment effects differ across different contexts; i.e., we cannot
reject the null of homogeneous treatment effects in most cases.
Overall, we would argue that the limited heterogeneity of the treatment effects estimated
here should lend some confidence to policymakers wishing to transplant successful contract
teacher reforms from one context to another.
7 Mechanisms
We now turn to examining mechanisms which could explain the difference in performance
between contract teachers in the NGO and government treatment arms. We explore two
dimensions that we argue are a function of working with government, independent of the
scale of the program: characteristics and effort of teachers hired, and weak monitoring and
accountability systems. We also explore a third channel related to government scale up per
se of the program in question: the effect of the political response to the contract teacher
program by the national teachers union.
Methodologically, we proceed in three steps. First, we present treatment effects of ran-
dom assignment to the government or NGO treatment arm on intermediate outcomes, such
as the observable human capital of contract teachers recruited through the program, the
23

number of monitoring visits made to treatment schools, and indicators of union activity
and identification. Second, we report simple correlations between the final outcome vari-
able (improvements in test score performance over the duration of the program) and these
intermediate outcomes associated with various causal mechanisms. Third, we add inter-
action terms to the main treatment effects specification from equation (1) to examine the
plausibility that the national controversy surrounding the hiring of 18,000 contract teachers
disproportionately affected teachers in the government treatment arm, and thus helps to
explain the differential effect on test scores. We use both observational (to measure absen-
teeism) and survey data collected as part of the follow-up survey, as well as data based on
exit interviews with contract teachers conducted after the follow-up survey. 19
7.1 Teacher selection
The protocol for teacher recruitment was the same for the government and the NGO treat-
ment schools in our sample. However, the effort put into recruiting high quality candidates
may have differed between the two institutions. As can be seen from Table 7, Panel A, the
Ministry hired teachers with higher educational attainment, although there is no significant
difference in terms of teaching qualifications skills. Teachers in the government arm are also
more likely to be female. There is no significant difference in terms of age between govern-
ment and NGO. Interestingly, none of these observable skills or demographic characteristics
are significantly correlated with changes in test scores (column 4, Table 7).
Another way in which recruitment could be affected is through local capture of the hiring
process by existing public servant teachers, as shown in Duflo et al. (2015). As reported in
the last row of Panel A, Table 7, the percentage of contract teachers who were friends of
existing teachers or SMC members was two thirds in the government treatment arm, almost
twice as high as in the NGO treatment arm. While this finding might suggest a corrupted
hiring process in the government arm, it is also possible that teachers in the government
arm were hired more locally and are therefore better connected. In any case, the indicator
of local capture does not show the negative correlation with test score improvements that
one might expect.
19For the exit interviews, we were able to track 111 contract teachers drawn from 84 of the 108 schoolsthat employed a teacher. There are more teachers than schools, because teachers who did not stay for theentirety of the program were replaced by new hires. Absenteeism data is available for 76 of the 108 treatedschools. Attrition was not systematically related to treatment arm (government vs. NGO) or treatmenteffects.
24
7.2 Monitoring and accountability
There is strong reason to suspect that the Ministry’s routine monitoring system of teach-
ers operated by the Quality Assurance and Standards Directorate is quite weak and this
could contribute to the different outcomes in the NGO and the government treatment arm.
Our baseline survey shows roughly 25% absenteeism among civil service teachers, while the
Kenyan Anti-Corruption Commission estimates that there are 32,000 ghost teachers on the
government’s payroll, representing 14% of all teachers (Siringi 2007).
We compare government and NGO along three dimensions related to implementation
and management of the program: teacher effort as measured by presence in the classroom
during an unannounced visit, monitoring of schools and successful management of the payroll
(Table 7, Panel B).
Teacher presence in the classroom is indeed higher in schools managed by the NGO (73%
versus 63%), but the difference is not significant between treatment arms. Presence in the
class room is positively, but not significantly, correlated with test scores.
There is a significant difference between the monitoring activities of the NGO and the
government. Schools in the NGO treatment arm were 11% more likely to have received a
monitoring visit than schools in the government treatment arm. However, the likelihood of
receiving a monitoring visit is not a significant correlate of changes in test scores.
Similar differences are observed in the management of the payroll system and prompt
payment of salaries. Both in the government treatment arm and in the NGO treatment arm,
salary delays occurred, but they were significantly more severe under government implemen-
tation – with an average delay of roughly three months in the government arm, compared to
2 months in the NGO arm. The salary delays display a significant negative correlation with
test score improvements. Taking the point estimates in Table 7 at face value, an increase
in salary delays of 1 months (roughly the average difference between NGO and government)
accounts for one third of the difference in test scores between NGO and government.
We interpret these findings on teacher presence, monitoring and salary delays as different
dimensions of a common problem: low top-down accountability in the government bureau-
cracy, especially in the link from Nairobi to the district offices. Salary delays were often
related to the inability of government officials in Nairobi to confirm the identity or payment
details of teachers contracted locally, preventing timely completion of bank transfers. In
either case, district-level employees of the Ministry failed to carry out their duties under the
program: conducting monitoring visits and reporting back information to Nairobi. While the
SMC training, partly, compensated for this low top-down accountability in the government
25

arm (see Section 5.3), district-level employees of the NGO appear to be more accountable
and responsive to their superiors in Nairobi.
7.3 Unionization, expectations and credibility of short-term con-
tracts
The effect of a fixed-term contract on teacher performance is likely mediated by teachers’
beliefs about the credibility of that contract. Theoretically, short-term teacher contracts are
predicated on the operation of dynamic incentives and career concerns (Holmstrom 1982, De-
watripont, Jewitt and Tirole 1999a, Dewatripont, Jewitt and Tirole 1999b). While motivated
NGOs may be able to commit to employing teachers only if they perform well, the same
contract may lack credibility within a weak public sector bureaucracy and highly unionized
civil service system.
We hypothesize that teachers’ expectations and performance will differ when offered
identical contracts by an international NGO or a national government. This hypothesis is
grounded in the highly unionized and politicized nature of public sector teaching in Kenya,
as in many developing countries. In this case, the government’s ambitious plan to employ
18,000 contract teachers nationwide posed a significant threat to the Kenyan National Union
of Teachers. The teachers’ union waged an intense political and legal battle against the
contract teacher program, including a lawsuit which delayed implementation by over a year,
street protests in central Nairobi, and a two-day national strike, demanding permanent civil
service employment and union wage levels for all contract teachers. By June 2011, 4 months
before the impact evaluation ended, the government acquiesced to union demands to absorb
the contract teachers into civil service employment at the end of their contracts.
Formally, teachers employed in our research project were not covered by the negotiations
between the government and the teacher union, and there was no significant difference be-
tween treatment arms in the share of teachers employed as civil service teachers following
the program. Nevertheless, we hypothesize that teachers in the government treatment arm
were more likely to perceive the outcome of the union negotiation as affecting them person-
ally, and further, that the prospect of a permanent unionized job undermined the dynamic
incentives provided by a short-term teaching contract in the government treatment arm.
We explore this hypothesis in Panel C, Table 7. Two thirds of teachers overall expressed
the hope that the experimental contract teacher program would be a stepping stone to
permanent employment, with no significant difference between government and NGO. We
do, however, see large and significant differences when we ask whether teachers felt that the
26
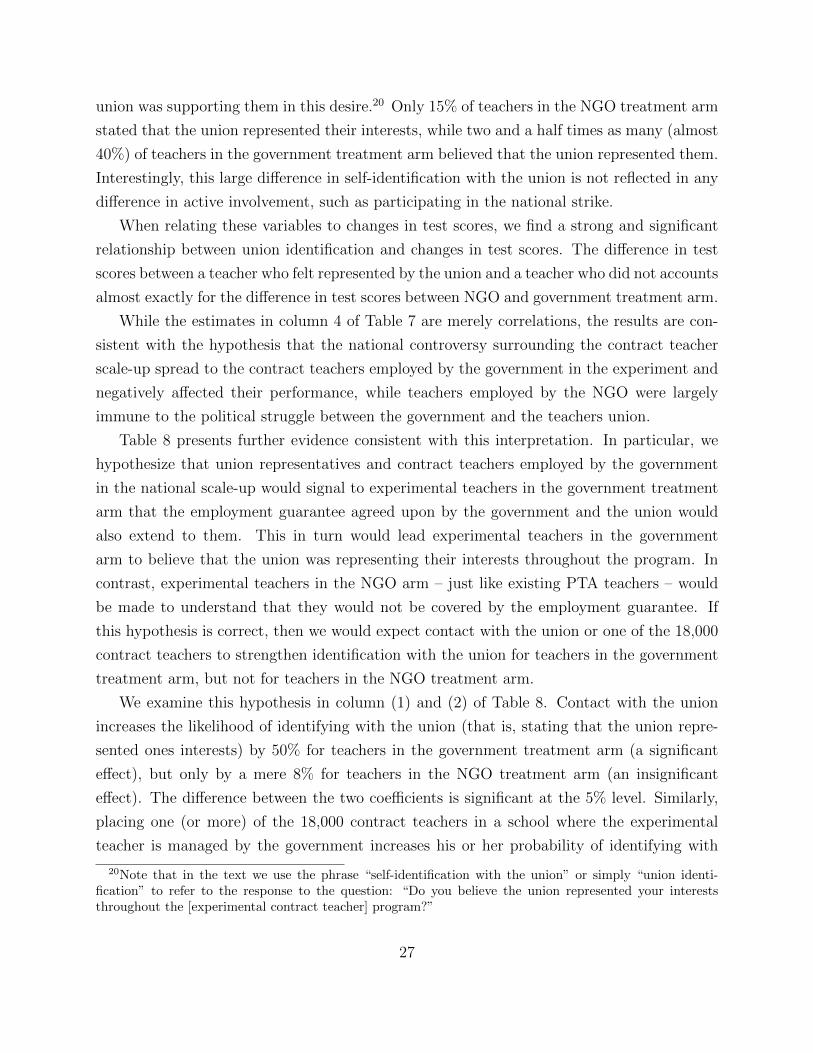
union was supporting them in this desire.20 Only 15% of teachers in the NGO treatment arm
stated that the union represented their interests, while two and a half times as many (almost
40%) of teachers in the government treatment arm believed that the union represented them.
Interestingly, this large difference in self-identification with the union is not reflected in any
difference in active involvement, such as participating in the national strike.
When relating these variables to changes in test scores, we find a strong and significant
relationship between union identification and changes in test scores. The difference in test
scores between a teacher who felt represented by the union and a teacher who did not accounts
almost exactly for the difference in test scores between NGO and government treatment arm.
While the estimates in column 4 of Table 7 are merely correlations, the results are con-
sistent with the hypothesis that the national controversy surrounding the contract teacher
scale-up spread to the contract teachers employed by the government in the experiment and
negatively affected their performance, while teachers employed by the NGO were largely
immune to the political struggle between the government and the teachers union.
Table 8 presents further evidence consistent with this interpretation. In particular, we
hypothesize that union representatives and contract teachers employed by the government
in the national scale-up would signal to experimental teachers in the government treatment
arm that the employment guarantee agreed upon by the government and the union would
also extend to them. This in turn would lead experimental teachers in the government
arm to believe that the union was representing their interests throughout the program. In
contrast, experimental teachers in the NGO arm – just like existing PTA teachers – would
be made to understand that they would not be covered by the employment guarantee. If
this hypothesis is correct, then we would expect contact with the union or one of the 18,000
contract teachers to strengthen identification with the union for teachers in the government
treatment arm, but not for teachers in the NGO treatment arm.
We examine this hypothesis in column (1) and (2) of Table 8. Contact with the union
increases the likelihood of identifying with the union (that is, stating that the union repre-
sented ones interests) by 50% for teachers in the government treatment arm (a significant
effect), but only by a mere 8% for teachers in the NGO treatment arm (an insignificant
effect). The difference between the two coefficients is significant at the 5% level. Similarly,
placing one (or more) of the 18,000 contract teachers in a school where the experimental
teacher is managed by the government increases his or her probability of identifying with
20Note that in the text we use the phrase “self-identification with the union” or simply “union identi-fication” to refer to the response to the question: “Do you believe the union represented your intereststhroughout the [experimental contract teacher] program?”
27

the union by 12% (though this coefficient is not significant), while the effect is exactly zero
in a school where the experimental teacher is managed by the NGO.21
Second, we hypothesize that for experimental teachers in the government treatment arm,
greater exposure to the controversy surrounding the 18,000 government contract teachers
(and the union’s demands that they be permanently employed) undermines the credibility
of the dynamic incentives provided by the short-term contracts in the experiment. Where
teachers find the threat of contract termination less credible, we would expect them to exert
less effort and hence have lower test score gains. Taken together, this implies a negative
association between exposure to the 18,000 government contract teachers and union lobbying
and changes in test scores for teachers in the government treatment arm, but not for teachers
in the NGO treatment arm.
We examine this hypothesis in column (3) and (4) of Table 8. In the government treat-
ment arm, either having contact with the union or placing one of the 18,000 government
contract teachers in the school significantly reduces test-score gains by 0.3 and 0.25 of a
standard deviation respectively. In the NGO treatment arm, exposure to the national con-
troversy had no effect on test score gains.22
Taken at face value, the results in column (3) and (4) of Table 8 imply that our main
result – the performance gap between NGO and government schools in the experiment – was
roughly halved where the experimental subjects had only limited exposure to the national
scale-up and surrounding controversy, i.e, where experimentally assigned contract teachers
in the government treatment arm had no observed interaction with the teacher’s union or
the 18,000 non-experimental government contract teachers.
To summarize, we examined three hypotheses to explain the performance gap between
the government and NGO treatment arms. We found limited evidence to support the idea
that the government program failed due to recruiting lower quality teachers, and somewhat
stronger evidence that limited monitoring and accountability in the government program
undermined results. Note that we characterize both of these mechanisms as features of
21A month prior to the end line survey, a national teacher strike took place. One might therefore supposethat the results in our experiment may be driven by the fact that teachers were absent from school duringthe strike and that teachers in the government treatment arm were more likely to participate in the strike.However, as shown in Table 8, there was no significant difference in strike participation between the twotreatment arms and no significant effect of strike participation itself on test scores.
22The effect of labour strife on productivity has also been documented by Krueger and Mas (2004) inthe case of American tire manufacturers. However, we do note that there was no difference in actual unionactivity (and in particular strike participation) between the two treatment arms, and therefore interpretthe observed effect as being a consequence of different expectations as to the credibility of the short-termcontract in the two treatment arms.
28

working with the Kenyan government, regardless of scale. In this final sub-section, we
presented a variety of evidence that the government program failed in part due to the political
backlash it provoked. We consider this a function of going to scale per se, and argue that the
measurable effects of the political backlash account for roughly half of the NGO-government
performance gap.23 The results of the implementation of the contract teacher program in
Kenya, though only suggestive, are thus largely consistent with the seesaw effect stressed by
Acemoglu (2010): large-scale policy interventions of this sort are likely to provoke political
economy reactions from groups whose rents are threatened by reform, creating an endogenous
policy response that counteracts the objectives of reform.
8 Conclusion
To the best of our knowledge, this paper is the first attempt to employ experimental methods
to test organizational and political economy limitations to translating NGO tested programs
to government implementation at national scale. We report on a randomized trial showing
that contract teachers significantly raise pupil test scores when implemented by an inter-
national NGO. These effects disappear when the program is (a) implemented within the
bureaucratic structures of the Kenyan government and (b) extended to a national scale.
We show that this latter point matters less in terms of the heterogeneity of the beneficiary
population, and more in terms of the concomitant political response from vested interests
opposed to the program.
Our results are consistent with the hypothesis that the government, subject to union
pressure, would struggle to credibly enforce teacher contracts. But our evidence stems from
one particular Kenyan government institution, under pressure from a strong public sector
union, compared to a well-established international NGO. We would be cautious in general-
izing our results to the Kenyan government in its entirety, much less to developing-country
governments and NGOs more broadly. In fact, a recent example from Kenya of a successful
scale-up by government is the national deworming campaign inspired largely by the work
23This political dynamic is by no means unique to Kenya: teacher unions tend to be strong and vociferousopponents to accountability reforms in many countries (see Murillo (1999) and Bruns and Lucque (2014) forexamples from Latin America, and cases in India (Compton and Weiner 2012a, Compton and Weiner 2012b)and the US (Barr 2006). Theoretically, the issue of unions opposing such reforms is examined in Lindbeckand Snower (1989) and stated in general form in Lavy (2007). However, there are also examples whereunions have collaborated in accountability reforms: during the 1990s and 2000s, the Chilean governmentimplemented an ambitious reform of the education sector in cooperation with the teacher union (see Mizalaand Schneider (2014)).
29

of Miguel and Kremer (2004). So while our results are not intended to suggest a universal
ranking of organizational effectiveness placing NGOs above public institutions, they do sug-
gest a dimension of external validity of program evaluation to which future policy-oriented
research should be attentive: namely an examination of government implementation when
trying to understand the impact of accountability reforms and incentive programs, especially
so in developing countries with weak public sector institutions. Our paper is an attempt to
do just that using experimental methods.
References
Acemoglu, Daron, “Politics and Economics in Weak and Strong States,” Journal of Mon-etary Economics, 2005, 52, 1199–1226.
, “Theory, general equilibrium, and political economy in development economics,” Jour-nal of Economic Perspectives, 2010, 24 (3), 17–32.
Altman, D.G., “Comparability of randomized groups,” Statistician, 1985, 34, 125–36.
Angrist, Joshua and Jorn-Steffen Pischke, Mostly Harmless Econometrics: An Em-piricist’s Companion, Princeton University Press, 2009.
Banerjee, A., R. Banerji, J. Berry, E. Duflo, S. Mukherji, M. Shotland, andM. Walton, “Mainstreaming an Effective Intervention: Evidence from RandomizedEvaluations of ”Teaching at the Right Level” in India,” Working Paper, J-PAL 2016.
Banerjee, Abhijit, Esther Duflo, and Rachel Glennerster, “Putting a Band-Aid ona corpse: Incentives for nurses in the Indian public health care system,” Journal of theEuropean Economic Association, 2008, 6 (2-3), 487–500.
, Shawn Cole, Esther Duflo, and Leigh Linden, “Remedying education: Evidencefrom two randomized experiments in India,” The Quarterly Journal of Economics, 2007,122 (3), 1235–1264.
Barr, Stephen, “Unions Oppose Senate’s Pay-for-Performance Bill,” June 2006.Published online, June 30, 2006, at http://www.washingtonpost.com/wp-dyn/content/article/2006/06/29/AR2006062902029.html.
Besley, Timothy and Torsten Persson, Pillars of Prosperity, Princeton: Princeton Uni-versity Press, 2011.
Bold, Tessa, Deon Filmer, Gayle Martin, Ezequiel Molina, Brian Stacy,Christophe Rockmore, Jakob Svensson, and Wally Wane, “Getting Inside the
30

Black-box of Schooling: What do Teachers Know and Do? A report card from AfricanPrimary Schools,” mimeo, World Bank 2016.
, Mwangi Kimenyi, Germano Mwabu, and Justin Sandefur, “Why Did Abol-ishing Fees Not Increase Public School Enrollment in Kenya?,” Center for Global De-velopment Working Paper, 2011, 271.
Bruhn, Miriam and David McKenzie, “In Pursuit of Balance: Randomization in Prac-tice in Development Field Experiments,” American Economic Journal: Applied Eco-nomics, October 2009, 1 (4), 200–232.
Bruns, Barbara and Javier Lucque, Great Teachers: How to Raise Student Learning inLatin America and the Carribean, Advance Edition, Washington, DC: The InternationalBank for Reconstruction and Development / The World Bank, 2014.
Chaudhury, Nazmul, Jeffrey Hammer, Karthik Muralidharan, and F. HalseyRogers, “Missing in Action: Teacher and Health Worker Absence in Developing Coun-tries,” Journal of Economic Perspectives, 2006, 20 (1), 91–116.
Compton, Mary and Lois Weiner, “More police attacks on Kash-miri teachers,” October 2012a. Published online, Oct. 08, 2012, athttp://www.teachersolidarity.com/blog/more-police-attacks-on-kashmiri-teachers/.
and , “Striking Indian Contract Teachers won’t be intimidated,” October 2012b.Published online, Oct. 31, 2012, at http://www.teachersolidarity.com/blog/striking-indian-contract-teachers-wont-be-intimidated/.
Conn, K., “Identifying Effective Education Interventions in Sub-Saharan Africa: A Meta-analysis of Rigorous Impact Evaluations,” mimeo, Columbia University 2014.
de Ree, Jopp, Karthik Muralidharan, Menno Pradhan, and Halsey Rogers, “Dou-ble for Nothing? Experimental Evidence on the Impact of an Unconditional TeacherSalary Increase on Student Performance in Indonesia,” NBER Working Paper Series,2015, 21806.
Deserranno, Erika, “Financial Incentives as Signals: Experimental Evidence from theRecuritument of Health Promoters in Uganda,” mimeo, Northwestern University 2016.
Dewatripont, Mathias, Ian Jewitt, and Jean Tirole, “The Economics of Career Con-cerns, Part I: Comparing Information Structures,” Review of Economic Studies, 1999,(66), 183–198.
, , and , “The Economics of Career Concerns, Part II: Application to Missionsand Accountability of Government Agencies,” Review of Economic Studies, 1999, (66),199–217.
31

Duflo, Esther, Pascaline Dupas, and Michael Kremer, “Peer Effects, Teacher Incen-tives, and the Impact of Tracking: Evidence from a Randomized Evaluation in Kenya,”American Economic Review, 2011, 101 (5).
, , and , “School Governance, Teacher Incentives, and Pupil-Teacher Ratios:Experimental Evidence from Kenyan Primary Schools,” Journal of Public Economics,2015, 123.
, Rema Hanna, and Stephen P Ryan, “Incentives work: Getting teachers to cometo school,” The American Economic Review, 2012, 102 (4), 1241–1278.
Egbewale, Bolaji Emmanuel, “Statistical Issues in randomized controlled trials: a nar-rative synthesis,” Asian Pacific Jouranl of Tropical Biomedicine, 2015, 5(5), 354–359.
Ferraz, Claudio and Frederico Finan, “Motivating Politicians: The Impacts of MonetaryIncentives on Quality and Performance,” NBER Working Paper, 2009, 14906.
Glewwe, P. and K. Muralidharan, “Improving School Education Outcomes in Develop-ing Countries: Evidence, Knowledge Gaps, and Policy Implications,” Rise-WP-15/0012015.
Glewwe, Paul, Nauman Ilias, and Michael Kremer, “Teacher Incentives,” AmericanEconomic Journal: Applied Economics, 2010, 2, 205–227.
Green, Donald P. and Holger L. Kern, “Modeling Heterogenous Treatment Effects inSurvey Experiments using Bayesian Additive Regression Trees,” Public Opinion Quar-terly, 2012, 76 (3), 491–511.
Greevy, Robert, Bo Lu, Jeffrey Silber, and Paul Rosenbaum, “Optimal multivariatematching before randomization,” Biometrika, 2004, 5 (2), 263–275.
Hartman, Erin, Richard Grieve, Roland Ramsahai, and Jasjeet S Sekhon,“From SATE to PATT: Combining Experimental with Observational Studies to Es-timate Population Treatment Effects,” 2013. Working paper. Available online athttp://ekhartman.berkeley.edu/work/SATEtoPATT.pdf.
Holmstrom, B., “Managerial Incentive Problem: A Dynamic Perspective,” in “Essays inEconomics in Honor of Lars Wahlbeck,” Helsinki: Swedish School of Economics, 1982.
Kremer, M., C. Brannen, and R. Glennerster, “The Challenge of Education andLearning in the Developing World,” Science, 2015, 340, 297–300.
Krishnaratne, S., H. White, and E. Carpenter, “Quality education for all children?What works in education in developing countries?,” International Initiative for ImpactEvaluation (3ie) Working Paper 20, New Delhi 2013.
32

Krueger, Alan B. and Alexandre Mas, “Strikes, Scabs, and Tread Separations: LaborStrife and the Production of Defective Bridgestone/Firestone Tires,” Journal of PoliticalEconomy, 2004, 112 (2), 253–289.
Lavy, Victor, “Using Performance-Based Pay to Improve the Quality of Teachers,” TheFuture of Children, 2007, 17(1), 87–109.
Lee, David S., “Training, Wages, and Sample Selection: Estimating Sharp Bounds onTreatment Effects,” Review of Economic Studies, 2009, 76(2), 1071–1102.
Lindbeck, Assar and Dennis J. Snower, The Insider-Outsider Theory of Employmentand Unemployment, Vol. 1 of MIT Press Books, The MIT Press, 1989.
Little, Roderick J. A. and Donald B. Rubin, Statistical Analysis with Missing Data,2nd Edition, Wiley-Interscience, 2002.
McEwan, P., “Improving Learning in Primary Schools in Developing Countries: A Meta-Analysis of Randomized Experiments.,” Review of Educational Research, 2015.
Miguel, Edward and Michael Kremer, “Worms: Identifying Impacts on Educationand Health in the Presence of Treatment Externalities,” Econometrica, 2004, 72 (1),159–217.
Mizala, Alejandra and Ben Ross Schneider, “Negotiating Education Reform: TeacherEvaluations and Incentives in Chile (1990-2010),” Governance: An International Jour-nal of Policy, Administration, and Institutions, 2014, 27(1), 87–109.
Mugo, John, Amos Kaburu, Charity Limboro, and Albert Kimutai, “Are OurChildren Learning: Annual Learning Assessment Report,” Technical Report, UwezoKenya 2011.
Muralidharan, Karthik and Venkatesh Sundararaman, “Teacher Performance Pay:Experimental Evidence from India,” Journal of Political Economy, 2011, 119 (1), 39–77.
and , “Contract Teachers: Experimental Evidence from India,” NBER WorkingPaper Series, 2013, 19440.
Murillo, Maria Victoria, “Recovering Political Dynamics: Teachers’ Unions and the De-centralization of Education in Argentina and Mexico,” Journal of Interamerican Studiesand World Affairs, 1999, 41(1), 31–57.
OECD, “Credit Reporting System (CRS) Database,”http://stats.oecd.org/Index.aspx?datasetcode=CRS1 Accessed March 2012.
Otieno, Wycliffe and Christopher Colclough, “Financing Education in Kenya : Ex-penditure , Outcomes and the Role of International Aid by,” Research Consortium onEducational Outcomes & Poverty Working Paper, 2009, 25.
33

Puma, Michael J. and Olsen, Robert B. and Bell, Stephen H. and Price, C.,“What to Do When Data Are Missing in Group Randomized Controlled Trials (NCEE2009-0049),” Washington, DC: National Center for Education Evaluation and RegionalAssistance, Institute of Education Sciences, U.S. Department of Education 2009.
Reinikka, Ritva and Jakob Svensson, “Working for God? Evidence from a Changein Financing of Nonprofit Health Care Providers in Uganda,” Journal of the EuropeanEconomic Association, 2010, 8 (December), 1159–1178.
Roberts, Chris and David J. Torgerson, “Baseline imbalance in randomised controlledtrials,” British Medical Journal, 1999, 319.
Siringi, Samuel, “Kenya: Exposed – Country’s 32,000 Ghost Teachers,” August 2007.Published online, Aug. 11, 2007, at http://allafrica.com/stories/200708110007.html.
Stuart, Elizabeth A, Stephen R Cole, Catherine P Bradshaw, and Philip J Leaf,“The use of propensity scores to assess the generalizability of results from randomizedtrials,” Journal of the Royal Statistical Society: Series A (Statistics in Society), 2011,174 (2), 369–386.
Tamer, Elie and Brendan Kline, “Using Observational vs. Randomized Controlled TrialData to Learn About Treatment Effects,” 2011. Working paper. Available online athttp://faculty.wcas.northwestern.edu/ ett094/KT-RCT.pdf.
34

Tab
le1:
Bal
ance
atbas
elin
e
Con
trol
Tre
atm
ent
Gov
NG
OT
-CG
ov-C
NG
O-C
Gov
-NG
O(1
)(2
)(3
)(4
)(5
)(6
)(7
)(8
)P
anel
A:
Var
iabl
esu
sed
inth
era
ndo
miz
atio
nP
upil-t
each
erra
tio
63.9
561
.13
61.9
560
.30
-2.8
2-2
.00
-3.6
51.
65N
o.of
clas
sroom
s11
.44
12.3
112
.49
12.1
1.8
71.
05.6
7.3
8N
o.of
civil
serv
ice
teac
her
s7.
318.
258.
408.
11.9
51.
10.8
0.3
0N
o.of
PT
Ate
acher
s1.
401.
852.
001.
70.4
5.6
0∗.3
0.3
0A
vg.
Pay
PT
AT
each
ers
(KSh)
3237
3446
3438
3454
208
201
217
-17
Pri
mar
yL
eavin
gE
xam
236
234
233
235
-2-3
-1-2
Pupil
test
scor
e,E
ngl
ish,
grad
e1
-.07
.04
.03
.04
.11
.10
.11
-.01
Pupil
test
scor
e,M
aths,
grad
e1
-.06
.03
.04
.02
.09
.10
.08
.02
Pan
elB
:V
aria
bles
not
use
din
ran
dom
izat
ion
No.
ofst
uden
tsta
kin
gex
am,
grad
e1
9.15
9.09
8.86
9.32
-.06
-.29
.17
-.46
No.
ofst
uden
tsta
kin
gex
am,
grad
e2
8.92
9.20
9.23
9.18
.28
.31
.26
.05
No.
ofst
uden
tsta
kin
gex
am,
grad
e3
17.6
117
.36
16.9
117
.81
-.25
-.70
.19
-.89
Dat
eof
test†
.50
.57
.58
.56
.07
.08
.06
.02
Age
ofte
stta
kers
,gr
ade
17.
697.
617.
667.
55-.
08-.
03-.
14.1
1A
geof
test
take
rs,
grad
e2
8.70
8.87
8.87
8.88
.18
.17
.18
-.00
5A
geof
test
take
rs,
grad
e3
10.4
710
.34
10.2
210
.49
-.13
-.26
.01
-.27
%b
oys
takin
gte
st,
grad
e1
.54
.53
.56
.50
-.00
6.0
2-.
04.0
6%
boy
sta
kin
gte
st,
grad
e2
.51
.56
.55
.57
.05
.04
.06
-.03
%b
oys
takin
gte
st,
grad
e3
.56
.52
.51
.54
-.04
-.06∗∗
-.02
-.03
Pupil
test
scor
e-
Engl
.&
Mat
h,
grad
e2
-.09
.05
.13
-.04
.13
.22
.05
.17
Pupil
test
scor
e-
Engl
.&
Mat
h,
grad
e3
-.02
.01
.05
-.03
.03
.07
-.00
3.0
8P
upil
test
scor
e-
Engl
.&
Mat
h,
(1,2
&3)
0.0
.09
.14
.04
.09
.14
.04
.11
Sch
ool
level
stat
isti
csar
eb
ased
on17
6sc
hool
sw
ith
base
lin
ein
form
ati
on
,p
upil
leve
lst
ati
stic
sare
base
don
6,2
76
pu
pil
sfr
om
thes
esc
hools
.
Sta
nd
ard
erro
rsfo
rp
up
ille
vel
info
rmat
ion
are
clu
ster
edat
the
sch
ool
leve
l.H
ere
an
din
all
sub
sequ
ent
tab
les,
stan
dard
erro
rsare
rep
ort
edin
bra
cket
san
das
teri
sks
den
ote
sign
ifica
nce
atth
e1%
(∗∗∗)
,5%
(∗∗)
an
d10%
(∗)
leve
l.† :
Date
of
test
isd
efin
edas
1if
the
sch
ool
was
vis
ited
du
rin
gth
ese
con
dh
alf
ofth
esu
rvey
and
zero
oth
erw
ise.
35

Tab
le2:
Imple
men
tati
onan
dC
omplian
ce
Tre
atm
ent
Contr
ol
Diff
.G
ov.
NG
OD
iff.
(1)
(2)
(3)
(4)
(5)
(6)
Pan
elA
:T
each
erR
ecru
itm
ent
Eve
rem
plo
yed
ate
ach
er.8
7.8
8.8
6.0
2(.06)
No.
ofm
onth
sem
plo
yed
ate
ach
er(o
ut
of17)
12.3
011.5
913.0
0-1
.41
(1.08)
Pan
elB
:E
ffec
tsw
ith
insc
hool
Cla
sssi
ze60.6
769.4
5-8
.78
60.4
760.8
8-.
41
(6.14)
(6.42)
Tea
cher
alw
ays
inco
rrec
tgr
ade
.72
.76
.69
.07
(.09)
Tea
cher
ever
inco
rrec
tgr
ade
.95
.97
.94
.02
(.04)
Pan
elC
:R
eall
oca
tion
acro
sssc
hool
sS
ize
oftr
eatm
ent
coh
ort
155.8
3166.9
5-1
1.1
2146.2
9166.0
7-1
9.7
8(15.91)
(18.79)
%ch
ange
inco
hor
ten
roll
men
t-.
11
-.09
-.01
-.14
-.08
-.06
(.04)
(.05)
%ch
ange
ingr
ade
enro
llm
ent
-.02
-.02
.0004
-.04
.008
-.05
(.04)
(.06)
No.
ofte
ach
ers
from
18,0
00p
rogr
am.6
5.4
8.1
7.6
8.6
2.0
6(.17)
(.21)
No.
ofT
SC
teac
her
s9.9
610.1
0-.
14
10.1
59.7
5.4
1(1.11)
(1.32)
No.
ofP
TA
teac
her
s2.0
61.7
4.3
22.0
32.0
9-.
06
(.35)
(.43)
Th
eun
itof
obse
rvat
ion
isth
esc
hool
.C
olu
mn
1sh
ows
aver
ages
for
all
trea
tmen
tsc
hools
,an
dco
lum
n2
for
all
(pu
re)
contr
ol
sch
ools
.C
olu
mn
3m
easu
res
the
gap
bet
wee
nco
lum
ns
1an
d2,
wit
hst
an
dard
erro
rsin
pare
nth
eses
,an
dast
eris
ks
den
oti
ng
diff
eren
ces
that
are
sign
ifica
ntl
y
diff
eren
tfr
omze
ro.
Col
um
ns
4-6
rep
eat
this
exer
cise
com
pari
ng
trea
tmen
tsc
hools
ass
ign
edto
gov
ern
men
tor
NG
Oim
ple
men
tati
on
.
36

Table 3: Labor supply of contract teachers
LPM Logit Model(1) (2) (3) (4)
NGO implementation .120 .120 .120 .121(.066)∗ (.065)∗ (.066)∗ (.065)∗
High salary .118 .117(.064)∗ (.063)∗
Local recruitment .140 .141(.065)∗∗ (.065)∗∗
Obs. 2,060 2,060 2,060 2,060
The unit of observation is the school, with monthly observations from June 2010 to October 2011. The
dependent variable is a binary indicator of whether a teacher was present and teaching in a given school in a
given month. For the logit model, the table reports marginal effects and their standard errors. All standard
errors are clustered at the school level.
37

Table 4: Treatment effects
Dep. variable: student test scores ITT IV(1) (2) (3) (4) (5) (6)
Z× x NGO .184 .175 .162(.088)∗∗ (.091)∗ (.116)
Z× Gov -.022 .021 .081(.090) (.095) (.110)
Mos. of Contract Teacher x NGO .238 .225 .209(.113)∗∗ (.116)∗ (.160)
Mos. of Contract Teacher x Gov .030 -.032 0.116(.130) (.134) (.158)
Difference in coefficients (p-value) 0.086∗ 0.037∗∗ .518 0.111 0.045∗∗ .587Baseline test score (school average) X XSchool fixed effects X XObs. (post) 8220 8220 8220 8220 8220 8220Obs. (pre) 6212 6212Number of schools 174 174 174 174 174 174Obs. 8220 14432 8220 8220 14432 8220
The dependent variable is a standardized score on a math and English test administered to pupils in grades
3 and 4 in 2011 and grades 1, 2 and 3 in 2009. Columns 1, 3 and 4, 6 use only the 2011 (follow-up) test
data as the dependent variable. Columns 1 and 4 control for baseline school average scores and columns
3 and 6 use no additional controls. Columns 2 and 5 use both follow-up and baseline test scores as the
dependent variable and control for school fixed effects. At baseline, Z takes a value of zero for all schools.
In the follow-up survey Z takes a value of 1 for schools randomly assigned to any treatment arm. ‘Mos.
of Contract Teacher’ is a continuous, and potentially endogenous, treatment variable measuring months of
exposure to a contract teacher; NGO is an indicator variable for the NGO treatment arm and Gov is an
indicator variable for the government treatment arm. Standard errors are clustered at the school level.
38

Tab
le5:
Inte
nt-
to-t
reat
effec
tsof
cros
s-cu
ttin
gin
terv
enti
ons
Dep
.va
r.:
Tes
tsc
ore
SM
CT
rain
ing
Loca
lH
irin
gH
igh
Sala
ry(1
)(2
)(3
)(4
)(5
)(6
)P
ool
ing
trea
tmen
tar
ms:
Z.0
86
.073
.152
.136
.102
.080
(.085)
(.093)
(.088)∗
(.095)
(.081)
(.086)
Z×
Cro
ss-c
ut
.036
.009
-.094
-.114
.008
-.010
(.096)
(.096)
(.095)
(.096)
(.108)
(.095)
Coeff
.1
+C
oeff
.2
.122
.082
.057
.022
.109
.070
(.094)
(.094)
(.090)
(.092)
(.110)
(.099)
NG
Ovs
gov’t
imp
lem
enta
tion
:Z×
NG
O.2
02
.222
.182
.204
.174
.171
(.099)∗∗
(.108)∗∗
(.101)∗
(.114)∗
(.095)∗
(.100)∗
Z×
Gov
-.025
-.078
.119
.060
.031
-.012
(.109)
(.113)
(.118)
(.119)
(.100)
(.105)
Z×
Cro
ss-c
ut×
NG
O-.
036
-.095
.003
-.059
.042
.018
(.131)
(.127)
(.130)
(.127)
(.153)
(.125)
Z×
Cro
ss-c
ut×
Gov
.098
.114
-.187
-.157
-.051
-.054
(.136)
(.138)
(.135)
(.138)
(.141)
(.133)
Cro
ss-c
ut
and
NG
O(C
oeff
.1
+3)
.166
.127
.186
.145
.216
.189
(.120)
(.113)
(.117)
(.107)
(.146)
(.118)
Cro
ss-c
ut
and
Gov
(Coeff
.2
+4)
.073
.035
-.068
-.096
-.020
-.065
(.118)
(.120)
(.106)
(.115)
(.131)
(.122)
Bas
elin
ete
stsc
ores
(sch
ool
aver
age)
XX
XS
chool
fixed
effec
tsX
XX
Ob
s.82
20
14432
8220
14432
8220
14432
See
not
esfo
rT
able
4.In
each
colu
mn
,th
e‘c
ross
-cu
t’va
riab
le–
den
oti
ng
acr
oss
-cu
ttin
gex
per
imen
tal
trea
tmen
tor
vari
ati
on
of
the
contr
act
-
teac
her
trea
tmen
t–
isd
efin
edac
cord
ing
toth
eco
lum
nh
ead
ing.
Sta
nd
ard
erro
rsare
clu
ster
edat
the
sch
ool
leve
l.
39

Tab
le6:
Het
erog
eneo
us
trea
tmen
teff
ects
Dep
.va
r.:
Tes
tsc
ore
Full
Sam
ple
Gov
ernm
ent
&C
ontr
olSam
ple
NG
O&
Con
trol
Sam
ple
(1)
(2)
(3)
(4)
(5)
(6)
(7)
(8)
(9)
Z.0
86.0
76.0
82-.
013
-.02
2.0
01.1
84.1
82.1
72(.082)
(.081)
(.080)
(.096)
(.095)
(.092)
(.095)∗
(.091)∗∗
(.091)∗
Z×
Den
sity
.007
-.01
6.0
17(.053)
(.078)
(.068)
Z×
PT
R-.
022
-.07
5.0
51(.047)
(.060)
(.066)
Z×Yt=
0-.
115
-.16
1-.
044
(.050)∗∗
(.070)∗∗
(.064)
Obs.
1430
014
432
1443
296
5597
3297
3296
6597
9797
97
See
not
esfo
rT
able
4.A
lleq
uat
ion
sin
clu
de
sch
ool
fixed
effec
tsan
dst
an
dard
erro
rsare
clu
ster
edat
the
sch
ool
leve
l.C
olu
mn
s1-3
incl
ud
eth
e
full
sam
ple
ofsc
hool
s.In
colu
mn
s4-
6(7
-9)
the
sam
ple
isre
stri
cted
toth
eco
ntr
ol
sch
ools
an
dth
ose
ass
ign
edto
trea
tmen
tby
the
gov
ern
men
t
(NG
O).
‘Den
sity
’m
easu
res
the
nu
mb
erof
pri
mary
sch
ools
wit
hin
a5-m
ile
rad
ius
of
the
sch
ool;
PT
Rm
easu
res
pu
pil
-tea
cher
-rati
os;Yt=
0is
the
aver
age
test
scor
eat
bas
elin
e.
40

Table 7: Mechanisms
Corr. w/ testGov. NGO Difference score gains(1) (2) (3) (4)
Panel A: Socio-economic characteristicsAge 29.983 29.760 .223 .002
(.938) (.010)
Female .550 .294 .256 .057(.097)∗∗∗ (.097)
Post-secondary education .200 .020 .180 -.091(.064)∗∗∗ (.145)
Advanced professional qualification .100 .137 -.037 .097(.061) (.145)
Friend/relative of teacher/SMC member .667 .373 .294 .051(.100)∗∗∗ (.100)
Panel B: Monitoring and accountabilityPresence in school .628 .727 -.099 .101
(.110) (.134)
Any monitoring visit to school .850 .961 -.111 .184(.053)∗∗ (.155)
Average salary delay (months) 3.000 2.117 .883 -.056(.291)∗∗∗ (.034)∗
Panel C: Unionization and expectationsDesire a long-term job .632 .706 -.074 .027
(.089) (.107)
Union represented my interests .377 .149 .228 -.197(.089)∗∗ (.110)∗
Took any union action during program .428 .444 -.017 -.028(.041) (.217)
Panel D: After the experimentStill working at program school .379 .280 .099 .072
(.098) (.104)
Permanent and pensionable .424 .469 -.046 .126(.092) (.098)
Obs. 60 51 111 102
Summary statistics are based on exit interviews with 111 contract teachers (60 from the government and
51 from the NGO treatment arm, respectively) in 84 treatment schools. Absenteeism is based on 72 ob-
servations in treatment schools. Standard errors are clustered at the school level. Dummy variables are
defined as: “Presence in school” = 1 if the teacher was present in school during an announced visit; “Union
represented my interests” = 1 if the teacher said yes to, “Do you believe the union represented your interests
throughout the [experimental contract teacher] program?”; “Desire for long-term employment” = 1 if the
teacher mentioned long-term employment as their main expectation from the program; and “Permanent and
pensionable” = 1 if the teacher is employed as a civil-service teacher after the end of the RCT. “Took any
union action during program” is the average of the following dummy variables: the teacher joined the union
after the program; teacher could explain the purpose of union strike action against the contract teacher
program; teacher participated in the national strike in 2011. Column 4 reports the coefficient in a regression
of changes in test scores between 2009-2011 separately on each of the intermediate outcomes and a constant.
41

Table 8: Mechanisms: Political Economy and scaling up
Union identification Test-score gains
(1) (2) (3) (4)
Z ×Gov 0.084 0.157 -0.065 -0.075(0.101) (0.116) (0.149) (0.119)
Z ×NGO× Union exposure 0.083 0.040(0.120) (0.183)
Z ×Gov× Union exposure 0.548*** -0.304*(0.168) (0.154)
Z ×NGO× Exposure to gov’t scale-up -0.009 0.016(0.115) (0.143)
Z ×Gov× Exposure to gov’t scale-up 0.121 -0.258*(0.154) (0.141)
Observations 100 95 102 107
Regressions are based on teacher exit interviews described in Table . The dependent variable in column (1)
and (2) is union identification, which is a dummy variable set equal to 1 if the teacher said that the union
represented his/her interests during the program, and zero otherwise. The dependent variable in column (3)
and (4) is changes in test scores between 2009-2011. Z takes a value of 0 at baseline for all schools, and 1 in
the follow-up survey only if the school was assigned to any treatment arm; Gov is an indicator variable for
the government treatment arm. “Union exposure” is the weighted average of the following dummy variables:
“Was the school ever visited by a union representative?” and “Did the teacher ever attend a union meeting?”.
“Exposure to gov’t scale-up” is a an indicator variable taking a value of 1 if one (or more) of the 18,000
(non-experimental) government contract teachers was also placed in the school. Standard errors are clustered
at the school level.
42

A Online appendix
!(!(
!(!(!(!(!(
!(!(
!(
!(!(
!(
!(!(
!(
!(!(!(
!(
!(!(
!(
!(
!(
!(
!(!(
!(!(
!(
!(
!(
!(!(
!(
!(
!(
!(!(!(
!(
!(
!(
!(
!(
!(!(!(!(!(!(
!(!(
!(
!(
!(
!(
!(
!(
!(
!(!(!(
!(
!(
!(
!(
!(
!(
!(
!(
!(
!(!(
!(
!(
!(!(!(!(!(
!(
!(
!(
!(!(
!(
!(
!(
!(
!(
!(
!(
!(
!(
!(
!(!(!(!(
!(!(
!(
!(
!(
!(
!(!(
!(
!(
!(
!( !(
!(
!(
!(
!(
!(
!(!( !(
!(
!(!(!(
!(!(
!(
!(
!(!(
!(
!(!(!(
!(
!(!(!(
!(!(!(!(
!(!(!(
!(!(
!(
!(!(!( !(
!(
!(!(
!(
!(
!(
!(!(
!(
!(!(
!(
!( !(!(!( !(!(!(
!(
!(
!(
!(
!(
!(!(
!(
!(
!(
!( !(
!(
!(
!( !(
Eastern
Rift Valley
Coast
North-Eastern
Nyanza Central
Western
Nairobi
Ethiopia
Somalia
Sudan
Tanzania
Uganda
!( Control
!( MOE
!( WV
Figure 1: Treatment & control sites across Kenya’s 8 provinces. (MOE and WV denoteimplementation by the Ministry of Education and World Vision, respectively.)
43
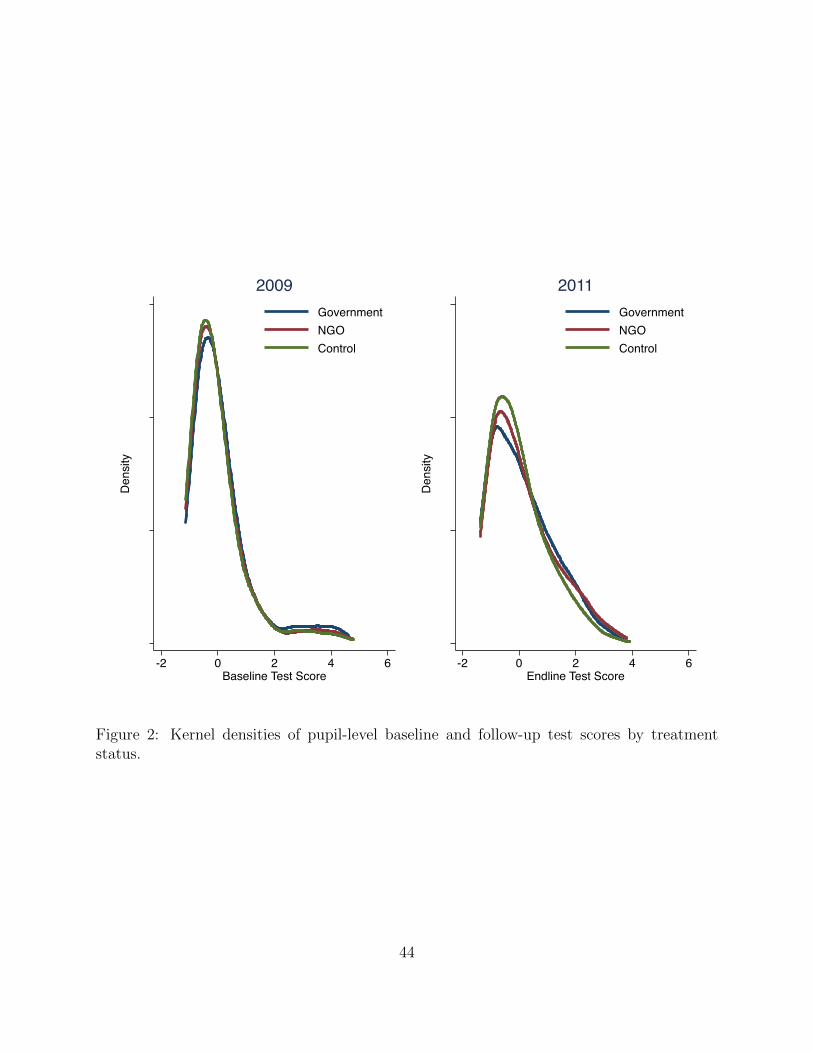
0
.2
.4
.6
Dens
ity
-2 0 2 4 6Baseline Test Score
GovernmentNGOControl
2009
0
.2
.4
.6
Dens
ity
-2 0 2 4 6Endline Test Score
GovernmentNGOControl
2011
Figure 2: Kernel densities of pupil-level baseline and follow-up test scores by treatmentstatus.
44

Tab
leA
.1:
Rob
ust
nes
sch
ecks
for
ITT
effec
ts
Reg
ress
ion
imputa
tion
Dum
my
vari
able
adju
stm
ent
No
contr
ols
(1)
(2)
(3)
(4)
(5)
Z×
NG
O.1
76.1
68.1
70.1
54.1
53(.083)∗∗
(.085)∗∗
(.084)∗∗
(.088)∗
(.109)
Z×
Gov
.052
.009
.046
.022
.124
(.087)
(.089)
(.087)
(.092)
(.087)
Coeff
1-C
oeff
2(p
-val
ue)
.162
.068∗
.161
.153
.808
Bas
elin
ete
stsc
ore
(sch
ool
aver
age)
XX
Sch
ool
fixed
effec
tsX
XO
bs.
8812
1558
488
1215
584
8812
Col
um
ns
1-4
rep
eat
the
spec
ifica
tion
inco
lum
ns
1-2
of
Tab
le4
an
dco
lum
n5
rep
eats
the
spec
ifica
tion
inco
lum
n3
of
Tab
le4.
Th
ere
gre
ssio
ns
incl
ud
eth
e14
sch
ool
sw
ith
only
foll
ow-u
pd
ata
inth
esa
mp
lean
du
setw
om
ethod
sfo
rim
pu
tin
gm
issi
ng
base
lin
eva
lues
:C
olu
mn
s1
an
d2
use
sim
ple
regr
essi
onim
pu
tati
onto
pre
dic
tm
issi
ng
base
lin
esc
ore
sby
dis
tric
tan
dtr
eatm
ent
statu
s.C
olu
mn
s3
an
d4
use
du
mm
yva
riab
le
adju
stm
ent
for
mis
sin
gb
asel
ine
scor
es.
Col
um
n5
pre
sents
asi
mp
lecr
oss
-sec
tion
.
45
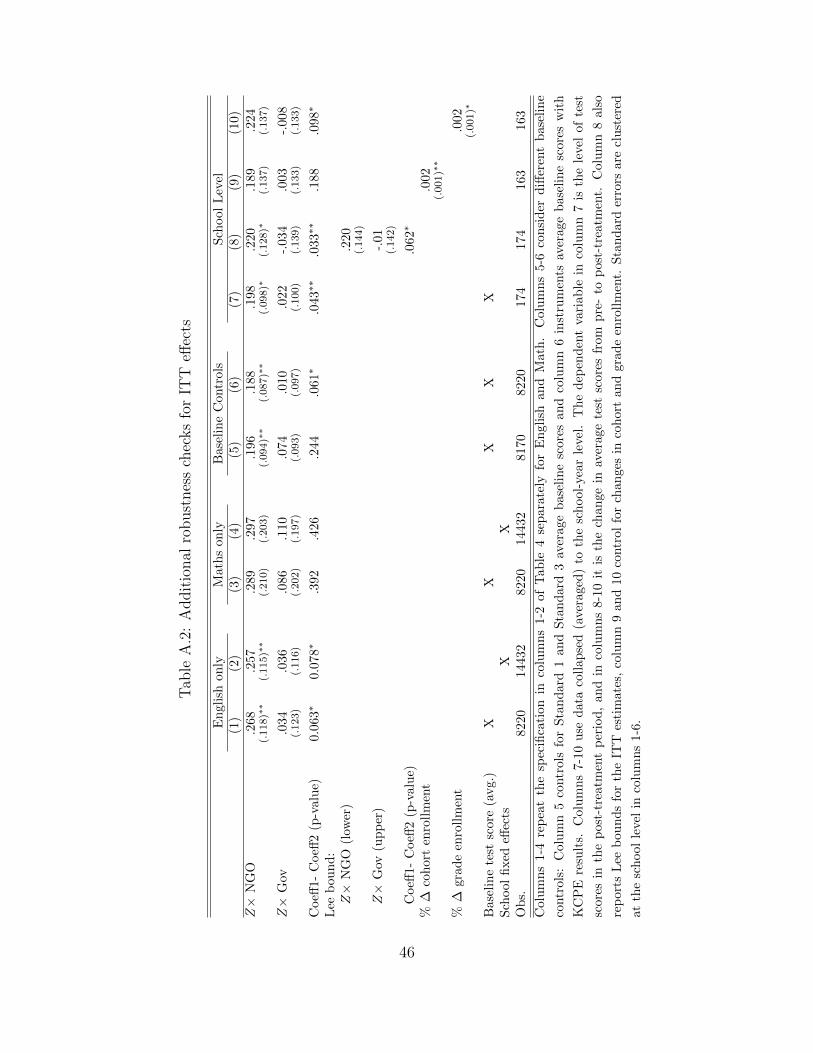
Tab
leA
.2:
Addit
ional
robust
nes
sch
ecks
for
ITT
effec
ts
En
glis
hon
lyM
ath
son
lyB
ase
lin
eC
ontr
ols
Sch
ool
Lev
el(1
)(2
)(3
)(4
)(5
)(6
)(7
)(8
)(9
)(1
0)
Z×
NG
O.2
68.2
57.2
89
.297
.196
.188
.198
.220
.189
.224
(.118)∗∗
(.115)∗∗
(.210)
(.203)
(.094)∗∗
(.087)∗∗
(.098)∗
(.128)∗
(.137)
(.137)
Z×
Gov
.034
.036
.086
.110
.074
.010
.022
-.034
.003
-.008
(.123)
(.116)
(.202)
(.197)
(.093)
(.097)
(.100)
(.139)
(.133)
(.133)
Coeff
1-C
oeff
2(p
-val
ue)
0.06
3∗
0.07
8∗
.392
.426
.244
.061∗
.043∗∗
.033∗∗
.188
.098∗
Lee
bou
nd
:Z×
NG
O(l
ower
).2
20
(.144)
Z×
Gov
(up
per
)-.
01
(.142)
Coeff
1-C
oeff
2(p
-val
ue)
.062∗
%∆
coh
ort
enro
llm
ent
.002
(.001)∗∗
%∆
grad
een
roll
men
t.0
02
(.001)∗
Bas
elin
ete
stsc
ore
(avg.
)X
XX
XX
Sch
ool
fixed
effec
tsX
XO
bs.
8220
1443
28220
14432
8170
8220
174
174
163
163
Col
um
ns
1-4
rep
eat
the
spec
ifica
tion
inco
lum
ns
1-2
of
Tab
le4
sep
ara
tely
for
En
gli
shan
dM
ath
.C
olu
mn
s5-6
con
sid
erd
iffer
ent
base
lin
e
contr
ols:
Col
um
n5
contr
ols
for
Sta
nd
ard
1an
dS
tan
dard
3av
erage
base
lin
esc
ore
san
dco
lum
n6
inst
rum
ents
aver
age
base
lin
esc
ore
sw
ith
KC
PE
resu
lts.
Col
um
ns
7-10
use
dat
aco
llap
sed
(ave
raged
)to
the
sch
ool-
yea
rle
vel.
Th
ed
epen
den
tva
riab
lein
colu
mn
7is
the
leve
lof
test
scor
esin
the
pos
t-tr
eatm
ent
per
iod
,an
din
colu
mn
s8-1
0it
isth
ech
an
ge
inav
erage
test
score
sfr
om
pre
-to
post
-tre
atm
ent.
Colu
mn
8als
o
rep
orts
Lee
bou
nd
sfo
rth
eIT
Tes
tim
ates
,co
lum
n9
an
d10
contr
ol
for
chan
ges
inco
hort
an
dgra
de
enro
llm
ent.
Sta
ndard
erro
rsare
clust
ered
atth
esc
hool
leve
lin
colu
mn
s1-
6.
46

0
.2
.4
.6
.8
Dens
ity
-2 -1 0 1 2Change in Test Score
GovernmentNGOControl
Figure 3: Kernel densities of change in school-level average test scores by treatment status.
47

0
.01
.02
.03
Density
40 60 80 100 120PTR
PTR
0
.1
.2
.3
.4
Den
sity
0 2 4 6 8Geographic density
Geographic density
0
.2
.4
.6
.8
Den
sity
-1 0 1 2 3Baseline Test Scores
Baseline Test Scores
Figure 4: Kernel densities of baseline school characteristics.
48


