ii
CERTIFICATION OF APPROVAL
Experimental Study of Oil Palm Biomass Waste Mixture for Energy Potential
by
Kee Lian Soon
A project dissertation submitted to the
Mechanical Engineering Programme
Universiti Teknologi PETRONAS
in partial fulfilment of the requirement for the
BACHELOR OF ENGINEERING (Hons)
(MECHANICAL ENGINEERING)
Approved by,
_____________________
(Dr. Suhaimi Bin Hassan)
UNIVERSITI TEKNOLOGI PETRONAS
TRONOH, PERAK
September 2011

iii
CERTIFICATION OF ORIGINALITY
This is to certify that I am responsible for the work submitted in this project, that the
original work is my own except as specified in the references and acknowledgements,
and that the original work contained herein have not been undertaken or done by
unspecified sources or persons.
___________________________
KEE LIAN SOON

iv
ABSTRACT
Malaysia is one of the largest producer and exporter of palm oil country. Oil palm
industry plays a major role in the economic development of the country. As a result,
palm oil waste generated is increased. Among the waste generated, palm oil mill
effluent (POME) is considered the most harmful waste to the environment if
discharged untreated. The sludge from POME is a source of pollutant and results in
bad odours. At the same time, the oil palm fronds are pruned regularly but have little
use and left on the ground in a huge quantity for natural decomposition which is a
slow and uneconomical process. Considering their large and consistent supply, oil
palm fronds and POME sludge mixture as an alternative biomass fuel could be a
promising source of energy. In this research, an attempt has been made to convert
these residues into biomass fuel. The feasibility of POME sludge and oil palm fronds
mixture as an alternative biomass fuel is studied. The study is conducted by
developing experimental testing for the biomass fuel in briquette form and the
performance of each sample with different weight percentage is investigated via
standard tests. These biomasses are converted into a compressed form of briquette
through a simple briquetting process. The experiments conducted on the briquettes
are ultimate analysis, calorific value test, burning characteristics test, dimensional
stability test, crack analysis and durability test. Ultimate analysis is carried out to
determine the contents of carbon, hydrogen, nitrogen and sulfur. The energy content
in the biomass fuel is determined by using bomb calorimeter. The objectives of
burning characteristics test are to test the briquette’s ignitability and time taken to
burn to ashes. Durability, stability and crack analyses are also performed
experimentally to evaluate the transport, handling and storage characteristics of the
briquettes. Experimentally, it is found that POME sludge and oil palm fronds
mixture as an alternative biomass fuel is feasible.
v
ACKNOWLEDGEMENTS
The author would like to express his gratitude to Universiti Teknologi PETRONAS
for providing the facilities to conduct all the analyses in the study. The author would
like to express his sincere appreciation to his supervisor, Dr Suhaimi Bin Hassan for
his valuable suggestions, comments, patience and trust during this work.
Great appreciation goes to laboratory staff for their technical assistance. The author
also would like to acknowledge the staffs in Department of Mechanical Engineering
and Department of Chemical Engineering for their kind assistance.
Sincere thanks to FELCRA Nasaruddin Palm Oil Mill for allowing the author to
collect the palm oil mill effluent samples.
Last but not least, the author also would like to express the greatest gratitude to his
parents, Kee Thean Sia and Madam Ooi Ah Mai for their unconditional love,
patience, understanding and support throughout the study.

vi
TABLE OF CONTENTS
ABSTRACT iv
ACKNOWLEDGEMENTS v
CHAPTER 1: INTRODUCTION 1
1.1 Background Study 1
1.2 Problem Statement 3
1.2.1 Problem Identification 3
1.2.2 Significant of the Project 4
1.3 Objectives and Scope of Study 5
1.4 Feasibility of the Project within the Scope and
Time Frame 5
CHAPTER 2: LITERATURE REVIEW 6
2.1 Oil Palm Processing 6
2.2 Characteristics of Palm Oil Mill Effluent (POME) 8
2.3 Characteristics of Oil Palm Frond 10
CHAPTER 3: METHODOLOGY 12
3.1 Method of Work 13
3.2 Briquette Preparation 13
3.2.1 Pre-treatment Process 13
3.2.2 Grinding 13
3.2.3 Briquetting 14
3.3 Briquette Performance Testing 15
3.3.1 Calorific Value Determination 15
3.3.2 Ultimate Analysis 15
3.3.3 Burning Characteristics Test 15
3.3.4 Crack Analysis 16
3.3.5 Dimensional Stability Analysis 16
3.3.6 Durability Analysis 16
3.4 Experiment Flow Chart 17

vii
3.5 Tools and Materials 18
3.5.1 Tools Required 18
3.5.2 Materials Required 18
3.6 Gantt Chart 19
CHAPTER 4: RESULTS AND DISCUSSION 20
4.1 Proximate Analysis 20
4.1.1 Moisture Content 20
4.1.2 Calorific Value Determination 22
4.2 Ultimate Analysis 25
4.3 Burning Characteristics Test 29
4.4 Dimensional Stability Analysis 31
4.5 Durability Analysis 33
4.6 Crack Analysis 35
CHAPTER 5: CONCLUSION AND RECOMMENDATION 37
5.1 Conclusion 37
5.2 Recommendation 39
REFERENCES 40
viii
LIST OF ILLUSTRATIONS
Figure 1.1 World palm oil production by country in 2010 1
Figure 2.1 Schematic flow of palm oil extraction process 7
Figure 2.2 Calorific value of various biomass feeds 11
Figure 3.1 Project flow chart 12
Figure 3.2 Briquettes produced in this project 14
Figure 3.3 Steps in conducting experiment 17
Figure 4.1 Moisture content comparison between POME sludge and frond 21
Figure 4.2 Average calorific value for 0% moisture content sample 22
Figure 4.3 Average calorific value for the sample dried under ambient
condition 23
Figure 4.4 Graph of calorific value against POME sludge content 24
Figure 4.5 Carbon content of POME sludge and oil palm fronds mixture 26
Figure 4.6 Hydrogen content of POME sludge and oil palm fronds mixture 27
Figure 4.7 Nitrogen content of POME sludge and oil palm fronds mixture 27
Figure 4.8 Sulfur content of POME sludge and oil palm fronds mixture 27
Figure 4.9 Graph of ignition time against POME sludge content 29
Figure 4.10 Graph of time taken to burn to ashes against POME sludge content 30
Figure 4.11 Graph of diameter expansion against duration 32
Figure 4.12 Graph of durability against POME sludge content 33
Figure 4.13 Crack analysis on (a) 10:90 (b) 30:70 (c) 50:50 (d) 70:30 and
(e) 90:10 POME sludge to frond briquettes 35

ix
LIST OF TABLES
Table 2.1 Characteristics of untreated POME 8
Table 2.2 Physiochemical analysis of raw POME sludge 9
Table 2.3 Chemical composition of oil palm frond 10
Table 3.1 Project completion Gantt chart of Final Year Project I 19
Table 3.2 Project completion Gantt chart of Final Year Project II 19
Table 4.1 Moisture content of raw residues 20
Table 4.2 Moisture content of the sample dried under ambient condition 20
Table 4.3 Calorific value test result for 0% moisture content sample 22
Table 4.4 Calorific value test result for sample under ambient condition 23
Table 4.5 Ultimate analysis of 10:90 POME sludge to frond briquette in
weight percentage 25
Table 4.6 Ultimate analysis of 30:70 POME sludge to frond briquette in
weight percentage 25
Table 4.7 Ultimate analysis of 50:50 POME sludge to frond briquette in
weight percentage 25
Table 4.8 Ultimate analysis of 70:30 POME sludge to frond briquette in
weight percentage 26
Table 4.9 Ultimate analysis of 90:10 POME sludge to frond briquette in
weight percentage 26
Table 4.10 Burning characteristics test result 29
Table 4.11 Dimensional stability analysis of 10:90 POME sludge to frond
briquette 31
Table 4.12 Dimensional stability analysis of 30:70 POME sludge to frond
briquette 31
Table 4.13 Dimensional stability analysis of 50:50 POME sludge to frond
briquette 31
Table 4.14 Dimensional stability analysis of 70:30 POME sludge to frond
briquette 32
Table 4.15 Dimensional stability analysis of 90:10 POME sludge to frond
briquette 32
Table 4.16 Durability test result 33

x
LIST OF ABBREVIATIONS
BOD Biochemical oxygen demand
COD Chemical oxygen demand
CPO Crude palm oil
DOE Department of Environment, Malaysia
EFB Empty fruit bunches
FFB Fresh fruit bunches
POME Palm oil mill effluent

1
CHAPTER 1
INTRODUCTION
1.1 BACKGROUND STUDY
Oil palm is one the most rapidly expanding crops and plays a major role in the
economic development of many countries. Malaysia has the most ideal climate
conditions for growing oil palm. The growth of the palm oil industry in Malaysia has
been phenomenal over the last 4 decades. Nowadays Malaysia is the world’s second
largest producer and exporter of palm oil country as shown in the statistics from
Figure 1.1. In Malaysia, the oil palm industry has contributed a lot to the country’s
economic development. In fact, crude palm oil (CPO) production has increased from
only 1.3 million tonnes in 1975 to approximately 18.60 million tonnes in 2010 [1, 2].
Meanwhile, the total oil palm planted area in the country increased to 4.85 million
hectares in 2010 with 418 crude palm oil mills, 18 oleochemical plants, 59 refineries
and 57 downstream industries. [1, 3].
Figure 1.1: World palm oil production by country in 2010 [2]
Indonesia
48.0%
Malaysia
38.8%
Thailand
3.1%
Nigeria
1.8%
Colombia
1.7%
Others
6.6%

2
Nevertheless, palm oil industry is one of the most pollution generating agro industry
in Malaysia. This important economic activity generates a large amount of wastes
and liquid effluent from milling processes. The two main wastes resulting from palm
oil production in a mill are solid and liquid wastes. The solid wastes typically consist
of fronds, palm kernel shells, mesocarp fruit fibers and empty fruit bunches. The
liquid waste generated by the extraction of palm oil comes mainly from oil room
after separator or decanter. This liquid waste combined with the wastes from
sterilizer condensate and cooling water known as palm oil mill effluent (POME).
Hence, the increase in number of mills will generate more environmental problem. It
is estimated that for each tonne of CPO that is produced, 5–7.5 tonnes of water are
required, and more than 50% of this water ends up as POME [4]. It has been reported
that for every tonne of the CPO produced, about 3.5 m3 of POME is generated [4],
which indicates that more than 55 million m3 of POME is generated from the palm
oil industry in 2010.
With the significantly large plantations areas in Malaysia, a large amount of fronds
are pruned regularly during the harvesting of fresh fruit bunches (FFB). In 2003, it
was estimated that 36 million tonnes of pruned fronds were produced [5], with an
average rate of 24 pieces per year from every oil palm tree. From another point of
view, for every tonne of palm oil produced from FFB, a farmer harvests around 6
tonnes of oil palm fronds [5].
Despite the fact that the palm oil industry is one of the causes of the environmental
pollution, not enough effort has been done to reduce the negative effects [1].
However, an increasingly stringent environmental regulation from the government
and increased public awareness of pollution problems caused the palm oil industries
facing tremendous challenges. On the other hand, the biomass produced from the oil
palm waste has a great potential as a renewable energy source and the use of biomass
briquettes can earn carbon credits for reducing emissions in the atmosphere.

3
1.2 PROBLEM STATEMENT
1.2.1 Problem Identification
As one of the world largest producer of palm oil, huge quantities of wastes are
produced in this industry. The process of oil extraction results in production of palm
oil mill effluent (POME). POME also contains substantial quantities of solids which
are left after anaerobic treatment. These solids are commonly known as POME
sludge. Therefore due to large quantity of POME production each year, the amount
of sludge increases, respectively. This sludge results in bad odors and is considered
as a source of water and ground pollution. Therefore, there is room to utilize the
sludge as an alternative biomass fuel.
Besides, Malaysia has an abundant supply of oil palm fronds due to the large
plantation areas in the country. The fronds are pruned regularly but have little use
and left on the ground for natural decomposition which is a slow and uneconomical
process. Open burning or simply abandon the waste away is a great lost of energy
source since these biomasses have quite significant energy content.
Considering their large and consistent supply, oil palm fronds and POME sludge
mixture as an alternative biomass fuel could be a promising source of energy.

4
1.2.2 Significant of the Project
Today the most economical biomass fuels for generating electricity come from the
organic by-products of food, fiber, forest and animal manure [6]. The abundant
availability of oil palm by-products biomass for use as energy generation would
definitely path the way for the future development in Malaysia.
This is significantly important as it helps solving the problems concerning pollution
by the by-products. At the same time, this increases the profitability by supplying of
surplus energy to local electricity net and generates local employment by conversion
of biomass residues into value added products. This technology could also be
utilized by other countries around the world for better management of a sustainable
and environmental friendlier electricity generation industry.
5
1.3 OBJECTIVES AND SCOPE OF STUDY
Objectives of this project are as follows:
i. To study on the feasibility of palm oil mill effluent (POME) sludge and oil
palm fronds mixture as an alternative biomass fuel.
ii. To develop experimental testing of the biomass fuel in briquette form.
iii. To investigate performance of each sample with different weight percentage.
The scope of study is mainly on preparing biomass briquette and conducting
experiments on each sample in order to investigate their performance. A general
review of POME and frond characteristics is first carried out. This was followed by a
refined review of the literature in order to gain thorough understanding for the
commencement of the laboratory and experimental aspects of the project.
In line with the second and third objectives, the POME sludge and frond were
collected from palm oil mill. The materials were then processed into compact
briquettes, following a simple briquetting process. Several tests were performed on
the briquettes as a whole. The tests could be divided into two categories - chemical
properties tests and mechanical properties tests, in which the first set of tests, are to
evaluate the intrinsic properties of the materials whereas the second set of tests are to
evaluate the transport, handling and storage characteristics of the briquettes.
All the procedures, material and equipments which utilized in the experiment would
be evaluated, compared and analyzed to obtain the most accurate results. Results of
the analysis were tabulated and discussed further.
1.4 FEASIBILITY OF THE PROJECT WITHIN THE SCOPE AND TIME
FRAME
In order to fit within the time frame, all the researches and analyses were carried out
according to the initial planning and allocated time duration. All the activities carried
out followed strictly the planning in Gantt chart in Methodology section.

6
CHAPTER 2
LITERATURE REVIEW
2.1 PALM OIL MILL PROCESSING
Crude palm oil (CPO) is extracted from the mesocarp of fresh fruit bunch (FFB).
The FFB harvested from the oil palm plantation have to be processed immediately to
prevent poor quality CPO due to increased free fatty acid content. Several units of
operations are involved in order to extract palm oil from FFB. The main stages of
palm oil processing are shown in Figure 2.1 and the major steps are discussed as
follows:
i. Sterilization - The first stage in extraction of crude palm oil is sterilization.
This is carried out in autoclave by steam application at the temperature of
140°C and a pressure of 3 bar, for 75–90 min. Sterilization prevents fatty acid
formations and assists in fruits stripping, as well as preparing the fruit fiber
for the next processing steps. One of the major sources of waste water is
formed by the steam condensate coming out of the sterilizer [1, 6, 7].
ii. Stripping - After sterilization the FFB is fed to a rotary drum-stripper where
the fruits are separated from the spikelet. The waste from this step is empty
fruit bunches [6].
iii. Digestion - The fruits are then mashed in the digester under steam heated
condition with temperature around 90°C. This process releases palm oil in
the fruit through breaking the mesocarp oil bearing cells. The fruit is pounded
by the rotary beater arms at high temperature, which reduces the oil viscosity.
No residue from this step [1, 4, 7].
iv. Extracting the palm oil - Twin screw presses are generally used to press out
the oil from the digested mashed fruits under high pressure. The CPO is
directed to the clarification tank and the temperature is maintained at about
90°C to enhance oil separation. The clarified oil is then purified by using the

7
centrifuge and vacuum drier before storage. The oily fiber and nuts from the
press cake are separated by passing through the depericarper. [4, 6].
Figure 2.1: Schematic flow of palm oil extraction process [4]
2.2 CHARACTERISTICS OF PALM OIL MILL EFFLUENT (POME)
Fresh Fruit Bunches
Loading Ramp
Sterilizer
Stripper
Digester
Press
Screen
Settling Tank
Desander Centrifuge
Vacuum Dryer Centrifuge
Nut/Fiber Separator
Nut Dryer
Winnowing
Hydrocyclone
Kernal Dryer
Fiber
Crack
mixture
Dirt &
light
shell
Kernel
Crude palm oil Sludge
Condensate
Empty fruit bunches
Boiler
Water Steam
Press cake Press liquor
Waster-
water
8
According to Sethupathi [8], POME is mainly generated from sterilization of fresh
fruit bunches, clarification of the extracted crude palm oil and hydrocyclone
separation in which large amounts of steam and hot water are used. It has been
estimated that 5–7.5 tonnes of water is required for producing 1 tonne of crude palm
oil and more than 50% of the water ends up as POME.
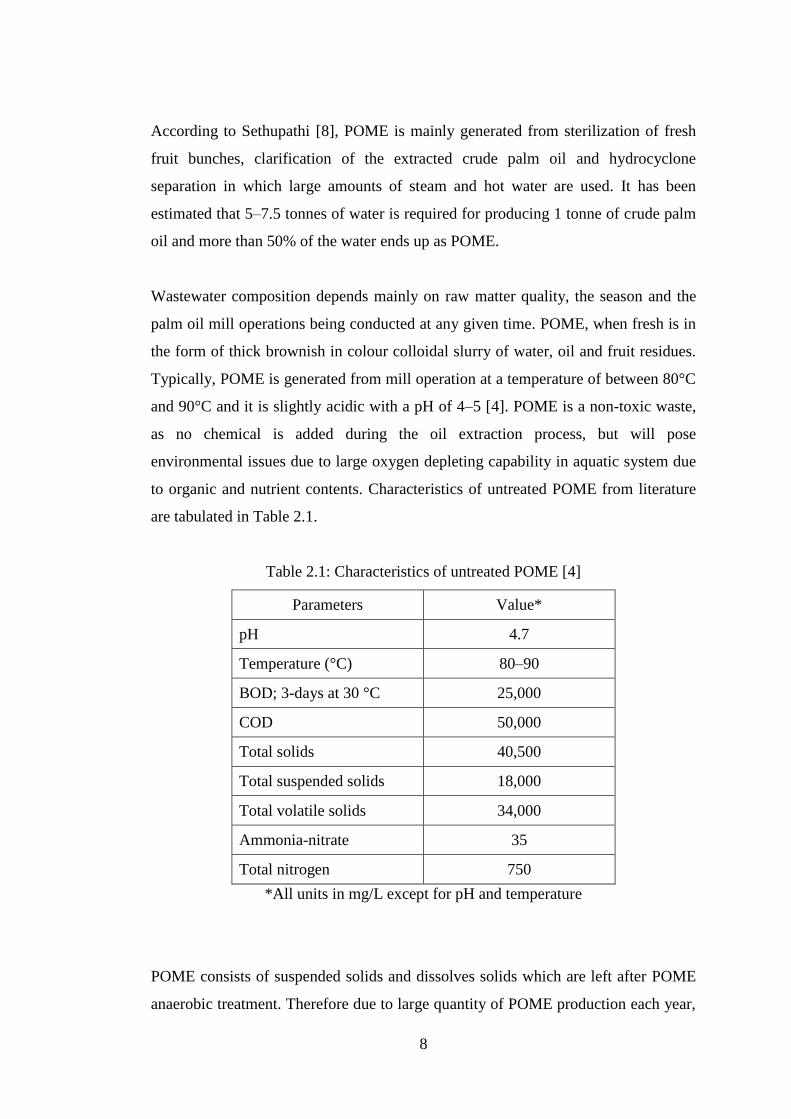
Wastewater composition depends mainly on raw matter quality, the season and the
palm oil mill operations being conducted at any given time. POME, when fresh is in
the form of thick brownish in colour colloidal slurry of water, oil and fruit residues.
Typically, POME is generated from mill operation at a temperature of between 80°C
and 90°C and it is slightly acidic with a pH of 4–5 [4]. POME is a non-toxic waste,
as no chemical is added during the oil extraction process, but will pose
environmental issues due to large oxygen depleting capability in aquatic system due
to organic and nutrient contents. Characteristics of untreated POME from literature
are tabulated in Table 2.1.
Table 2.1: Characteristics of untreated POME [4]
Parameters Value*
pH 4.7
Temperature (°C) 80–90
BOD; 3-days at 30 °C 25,000
COD 50,000
Total solids 40,500
Total suspended solids 18,000
Total volatile solids 34,000
Ammonia-nitrate 35
Total nitrogen 750
*All units in mg/L except for pH and temperature
POME consists of suspended solids and dissolves solids which are left after POME
anaerobic treatment. Therefore due to large quantity of POME production each year,

9
the amount of the sludge increases, respectively. It has high amount of moisture
content, with pH of 8.4 and enriched with organic matter. It has been shown in Table
2.2, the sludge contains 60 mg/L and 33 mg/L of organic matter and total organic
carbon, respectively.
Table 2.2: Physiochemical analysis of raw POME sludge [4]
Parameters Value*
Moisture content (%) 85.0
pH 8.4
Organic matter 60.0
Total organic carbon (mg/L) 33.0
Total nitrogen (mg/L) 3.6
Phosphorus (mg/l) 0.9
Potassium (mg/L) 2.1
*All units in mg/L except for pH and moisture content
2.3 CHARACTERISTICS OF OIL PALM FROND
10
The average density of oil palm frond is about 700 kg/m3. The weight of each frond
is between 15 and 20 kg depending on the age and condition of the palm tree. The
frond comprises of two main components which are petiole and leaflets. The dry
matter weight ratio of petiole to leaflets (including the rachis) is 1.5.
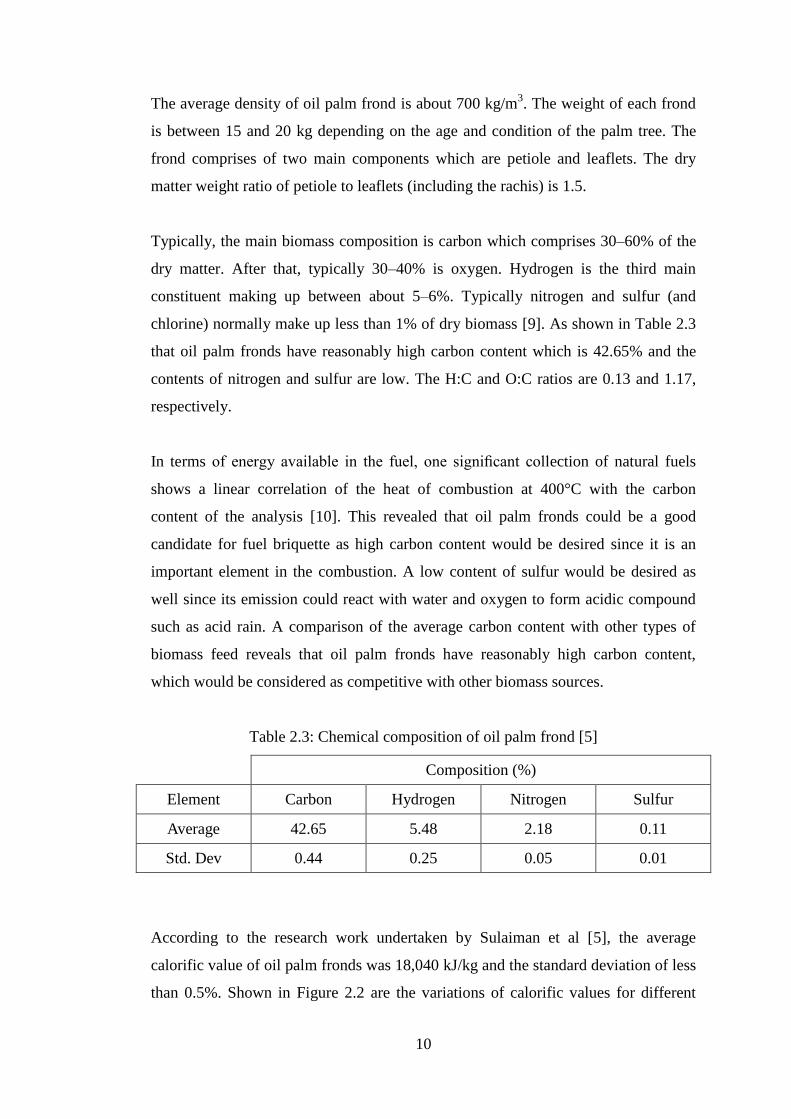
Typically, the main biomass composition is carbon which comprises 30–60% of the
dry matter. After that, typically 30–40% is oxygen. Hydrogen is the third main
constituent making up between about 5–6%. Typically nitrogen and sulfur (and
chlorine) normally make up less than 1% of dry biomass [9]. As shown in Table 2.3
that oil palm fronds have reasonably high carbon content which is 42.65% and the
contents of nitrogen and sulfur are low. The H:C and O:C ratios are 0.13 and 1.17,
respectively.
In terms of energy available in the fuel, one significant collection of natural fuels
shows a linear correlation of the heat of combustion at 400°C with the carbon
content of the analysis [10]. This revealed that oil palm fronds could be a good
candidate for fuel briquette as high carbon content would be desired since it is an
important element in the combustion. A low content of sulfur would be desired as
well since its emission could react with water and oxygen to form acidic compound
such as acid rain. A comparison of the average carbon content with other types of
biomass feed reveals that oil palm fronds have reasonably high carbon content,
which would be considered as competitive with other biomass sources.
Table 2.3: Chemical composition of oil palm frond [5]
Composition (%)
Element Carbon Hydrogen Nitrogen Sulfur
Average 42.65 5.48 2.18 0.11
Std. Dev 0.44 0.25 0.05 0.01
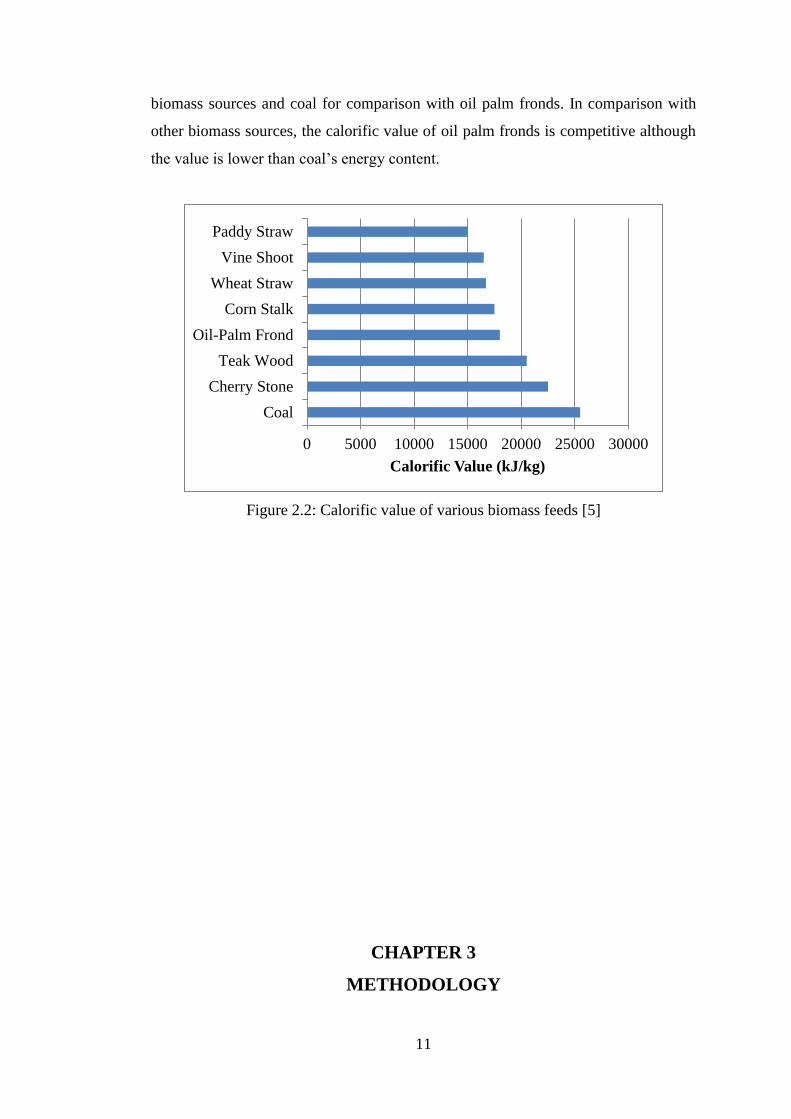
According to the research work undertaken by Sulaiman et al [5], the average
calorific value of oil palm fronds was 18,040 kJ/kg and the standard deviation of less
than 0.5%. Shown in Figure 2.2 are the variations of calorific values for different
11
biomass sources and coal for comparison with oil palm fronds. In comparison with
other biomass sources, the calorific value of oil palm fronds is competitive although
the value is lower than coal’s energy content.
Figure 2.2: Calorific value of various biomass feeds [5]
CHAPTER 3
METHODOLOGY
0 5000 10000 15000 20000 25000 30000
Coal
Cherry Stone
Teak Wood
Oil-Palm Frond
Corn Stalk
Wheat Straw
Vine Shoot
Paddy Straw
Calorific Value (kJ/kg)

12
The project is divided into two main phases which are briquette preparation and
briquette performance testing. The procedures for all the preparation and
investigations were obtained from various standard tests as well as manual of
equipments. The underlying flow of work will be illustrated in Figure 3.1 and the
following respective sub-chapter.
Figure 3.1: Project flow chart
3.1 METHOD OF WORK
Start
Project definition
Develop preliminary specifications and constraints
Evaluate concepts and perform feasibility study
Economic analysis if required
Develop experiment
Conduct experiment
Present finding
End

13
After gathering palm oil mill effluent sludge and fronds, the materials are processed
into compact briquettes, following a simple process. Several tests are performed on
the fuel briquettes. The tests could be divided into two categories - chemical
properties tests and mechanical properties tests, in which the first set of tests are to
evaluate the intrinsic properties of the materials whereas the second set of tests are to
evaluate the transport, handling and storage characteristics of the briquettes.
3.2 BRIQUETTE PREPARATION
3.2.1 Pretreatment Process
The first step of preparing is to reduce the moisture contents of oil palm residues
(POME sludge and fronds). In order to do this, the samples were dried in a
temperature controlled environment, by placing them in an oven at 105°C until
consistency in the sample’s mass is obtained in order to reach 0% moisture content
[9]. Majority of the experiments undertaken in this study were conducted with oven
dried samples except with the samples used to study the effect of moisture content to
calorific value. The samples used to study the effect of moisture content to calorific
value were let dry under ambient condition for 24 hours. The samples were then
oven dried. The change in mass can be used to determine the sample’s percentage
moisture content. Moisture content is presented on a wet basis, which is the moisture
content as a percentage of the total as received mass.
Moisture content mass of water
mass of water mass of solid
3.2.2 Grinding
After completing the pretreatment process, the fronds were grinded into powder by
using mortar grinder. The grinded sample was then collected and removed from the
mortar grinder.
3.2.3 Briquetting

14
In this study, POME sludge and frond biomass mixture was produced. The materials
ratios used were (POME sludge to frond ratio): 10.90, 30:70, 50:50, 70:30 and 90:10.
After completing all the previous processes, the last part is to compact the mixture
by using automatic pellet press. A pressure of 25 MPa was used to form briquettes.
The samples was loaded into a cylindrical mould with an external diameter of 60 mm
and a central hole diameter of 40 mm. The height of the briquette can be varied by
changing the charge mass in the mould. In the research, the briquette produced in
this study weighed 10 g and approximately 7 mm in height. Before undergoing any
kind of testing, briquettes were rested under ambient conditions for a week to
stabilize inner tensions that would affect the microstructures and the porosity of
briquette. Briquettes produced in this project are shown in Figure 3.2.
Figure 3.2: Briquettes produced in this project
3.3 BRIQUETTE PERFORMANCE TESTING

15
The chemical properties tests performed were calorific value determination, ultimate
analysis, burning characteristics test which are the analyses performed on a common
solid fuel whereas the mechanical properties tests conducted were dimensional
stability analysis, crack analysis and durability test.
3.3.1 Calorific Value Determination
The briquette that produced was re-grinded by mortar grinder again to become
powder. 0.5 g of sample was required to use in this analysis. The sample was put into
bomb unit and igniter was attached together to allow heat transfers to the sample.
The bomb was then put into bomb calorimeter. The calorific value of the sample was
recorded from the screen on the bomb calorimeter after a few minutes. To monitor
repeatability between samples, a set of three measurements were conducted for each
of the calorific value tests.
3.3.2 Ultimate Analysis
For ultimate analysis, the carbon, hydrogen, nitrogen and sulfur content of the
materials could be evaluated. Powdery sample was put into a small capsule. The
capsule and sample were then weighted together with the microbalance. The sample
was then put into CHNS analyzer. Three measurements were taken for each of the
ultimate analysis test.
3.3.3 Burning Characteristics Test
The objectives of the burning characteristics test are to test the briquette’s ignitability
and time taken to burn to ashes. Bunsen burner, stand and wire gauze were prepared
in this test. The briquette was put on the wire gauze and the Bunsen burner was
ignited after that. Once a moment, the briquette was removed and placed on a piece
of tissue paper to determine whether the briquette has ignited or not. The briquette
was deemed to be ignited if the briquette was able to burn through the tissue paper.
The interval time was recorded after the briquette was ignited. After the ignition has
occurred, the briquette was then allowed to burn into ashes. Time taken to burn the
briquette to ashes was recorded.
16
3.3.4 Crack Analysis
The crack analysis was done to study the impact resistance of a fuel briquette. The
analysis was performed by dropping the briquette from a height of 1 m. The number
of cracks and length of crack are noted [11].
3.3.5 Dimensional Stability Analysis
Stability test is to determine how well a briquette could sustain its dimensions during
storage. It serves as an index of the extent of resistance of briquettes to change in
their initial physical dimensions and shape [12]. In order to determine the stability,
measurements of diameter was taken immediately on removal from die press and
measured weekly by using a Vernier caliper at different positions. The average was
then calculated.
3.3.6 Durability Analysis
Durability test is performed to investigate how durable a briquette could be when
subjected to a few drops. It is intended to simulate the ability to withstand the rigors
of handling such that they keep their mass, shape, and integrity. The mass of a
briquette was first measured and then dropped from 1.85 m high onto a flat steel
plate four times [13]. The final weight of briquette remained in the plate was
recorded. The durability (%) is taken as the ratio of final mass retained by the
briquette after four drops to the initial mass [13]. It could be calculated by using this
formula:
urability mass of material remained in plate after drops
initial mass of material
3.4 EXPERIMENT FLOW CHART

17
Figure 3.3: Steps in conducting experiment
3.5 TOOLS AND MATERIALS
Start
List the materials and tools required
Availability
Set up experiment
Conduct experiment
Modification
Present finding
End
Yes
Select alternative materials and tools
Available
Unavailable
Prepare the materials and tools
Evaluate and analysis results
No

18
3.5.1 Tools Required
The tools required to carry out this research are listed as below:
i. Oven - to remove the moisture content of samples.
ii. Electronic weight scale - to determine the mass of samples.
iii. Mortar grinder - to triturate raw material into powder.
iv. Automatic pellet press - to compare sample into briquette form.
v. CHNS analyzer - to determine the elemental composition of samples.
vi. Bomb calorimeter - to measure the calorific value of samples.
vii. Vernier caliper - to measure the diameter of briquette.
viii. Bunsen burner - to burn briquette.
ix. Stop watch - to measure ignition time and time take to burn to ashes.
3.5.2 Materials Required
i. Palm oil mill effluent sludge.
ii. Oil palm fronds.

19
3.6 GANTT CHART
Table 3.1: Project completion Gantt chart of Final Year Project I
No. Detail / Week 1 2 3 4 5 6 7 8 9 10 11 12 13 14
1 Selection of Project Topic
2 Preliminary Research Work
3 Submission of Extended Proposal Defence
4 Project Work
5 Proposal Defence
6 Submission of Interim Draft Report
7 Submission of Interim Report
Table 3.2: Project completion Gantt chart of Final Year Project II
No. Detail / Week 1 2 3 4 5 6 7 8 9 10 11 12 13 14 15
1 Project Work (Continue)
2 Submission of Progress Report
3 Project Work (Continue)
4 Poster Exhibition
5 Submission of Draft Report
6 Submission of Project Dissertation (Soft Bound)
7 Oral Presentation
8 Submission of Technical Paper
9 Submission of Project Dissertation (Hard Bound)

20
CHAPTER 4
RESULTS AND DISCUSSIONS
This chapter presents the results obtained from comprehensive experimental
investigations which cover: proximate and ultimate analysis, burning characteristics
test, dimensional stability analysis, durability analysis and crack analysis.
4.1 PROXIMATE ANALYSIS
4.1.1 Moisture Content
The raw materials obtained were oven dried at 105°C until constant mass is obtained
in order to reach 0% moisture content. A time of 7 hours is required for POME
sludge to achieve constant mass. As for frond, 5 hours is required to reach constant
mass. The moisture contents of the raw samples are recorded in Table 4.1. The
moisture content of POME sludge and oil palm fronds obtained are 21.39% and
11.91%, respectively.
Table 4.1: Moisture content of raw residues
Sample Initial Mass (g) Final Mass (g) Moisture Content (%)
POME Sludge 50 39.308 21.39
Frond 15 13.213 11.91
To study the effect of moisture content to calorific value, other samples were let dry
under ambient condition for 24 hours. After that, the samples were then oven dried 7
hours for POME sludge and 5 hours for oil palm fronds. The change in mass can be
used to determine the sample’s percentage moisture content. Table 4.2 presents the
moisture content of the samples dried under ambient condition.
Table 4.2: Moisture content of the sample dried under ambient condition
Sample Initial Mass (g) Final Mass (g) Moisture Content (%)
POME Sludge 50 44.851 10.30
Frond 15 14.441 3.73

21
The moisture content of the POME sludge and oil palm fronds dried under ambient
condition are 10.30% and 3.73%, respectively.
Moisture content comparison between POME sludge and fronds was made and
shown in Figure 4.1.
Figure 4.1: Moisture content comparison between POME sludge and fronds
0
5
10
15
20
25
Raw sample Sample dried under
ambient condition
Mois
ture
Con
ten
t (%
)
POME Sludge
Frond

22
4.1.2 Calorific Value Determination
In order to determine the calorific value of sample, bomb calorimeter was used.
Measurements of the calorific value were repeated three times under the same
conditions. The calorific value test result for 0% moisture content sample is as
shown in Table 4.3 and the average value is presented in Figure 4.2.
Table 4.3: Calorific value test result for 0% moisture content sample
POME Sludge
Content (%)
Calorific Value (kJ/kg)
1 2 3 Average
10 18,710 18,547 19,031 18,763
30 22,026 21,858 21,120 21,668
50 23,574 23,405 24,100 23,693
70 26,053 26,550 25,600 26,068
90 30,408 31,065 31,076 30,850
Figure 4.2: Average calorific value for 0% moisture content sample
From the test, it was found that the five ratios of POME sludge and oil palm fronds
mixture with 0% moisture content show calorific value ranging from 18,763–30,850
kJ/kg. It was noted that the calorific value of the briquette increases with increasing
POME sludge content, with the 90:10 POME sludge to frond showing the highest
value.
0
5,000
10,000
15,000
20,000
25,000
30,000
35,000
10 30 50 70 90
Calo
rifi
c V
alu
e (k
J/k
g)
POME Sludge Content (%)

23
Another set of calorific value test was conducted on the samples that were let dry
under ambient condition for 24 hours in order to study the effect of moisture content.
The moisture content of the POME sludge and frond after drying under ambient
condition are 10.30% and 3.73%, respectively. The calorific value test result for this
sample is shown in Table 4.4 and the average value is presented in Figure 4.3.
Table 4.4: Calorific value test result for the sample dried under ambient condition
POME Sludge
Content (%)
Calorific Value (kJ/kg)
1 2 3 Average
10 17687 18004 18605 18099
30 19507 20134 19921 19854
50 20973 21491 21012 21159
70 22067 23054 23721 22947
90 26088 25834 26475 26132
Figure 4.3: Average calorific value for the sample dried under ambient condition
For the five ratios of POME sludge and frond mixture that were dried under ambient
condition, the energy content ranged from 18,099–26,132 kJ/kg, It was also noted
that the calorific value of the briquette increases with increasing POME sludge
content, with the 90:10 POME sludge to frond briquette showing the highest
calorific value.
0
5,000
10,000
15,000
20,000
25,000
30,000
10 30 50 70 90
Calo
rifi
c V
alu
e (k
J/k
g)
POME Sludge Content (%)
24
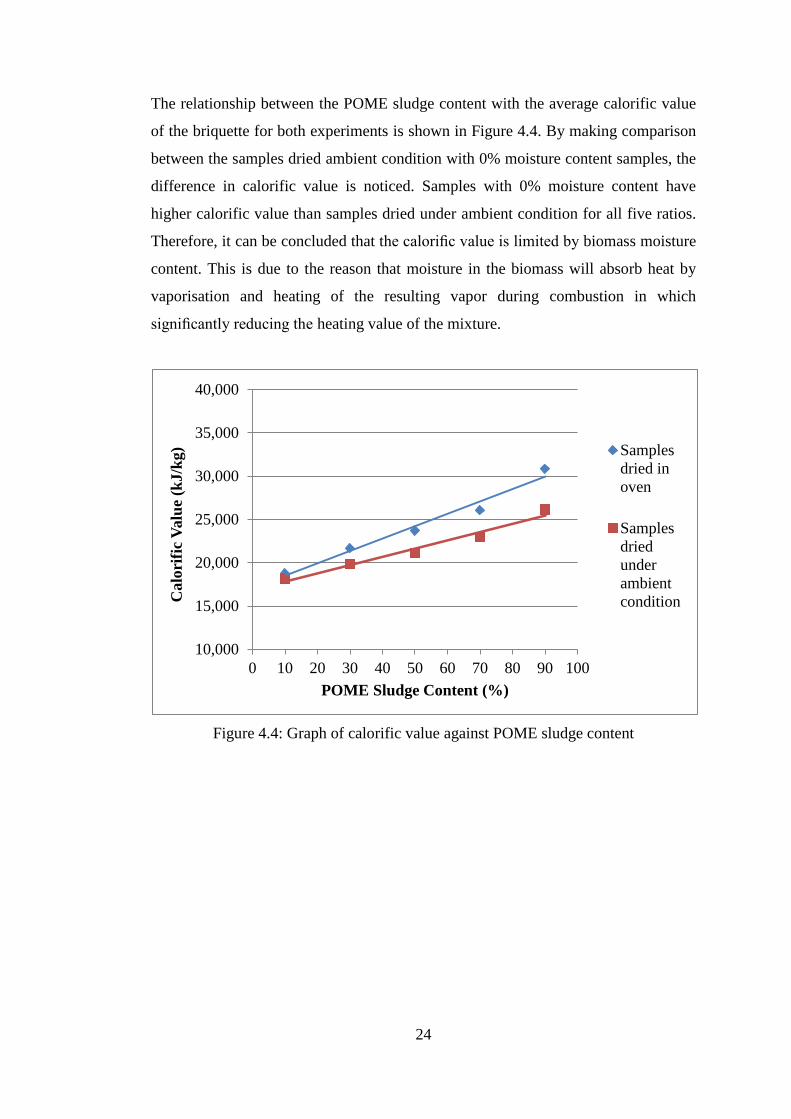
The relationship between the POME sludge content with the average calorific value
of the briquette for both experiments is shown in Figure 4.4. By making comparison
between the samples dried ambient condition with 0% moisture content samples, the
difference in calorific value is noticed. Samples with 0% moisture content have
higher calorific value than samples dried under ambient condition for all five ratios.
Therefore, it can be concluded that the calorific value is limited by biomass moisture
content. This is due to the reason that moisture in the biomass will absorb heat by
vaporisation and heating of the resulting vapor during combustion in which
significantly reducing the heating value of the mixture.
Figure 4.4: Graph of calorific value against POME sludge content
10,000
15,000
20,000
25,000
30,000
35,000
40,000
0 10 20 30 40 50 60 70 80 90 100
Calo
rifi
c V
alu
e (k
J/k
g)
POME Sludge Content (%)
Samples
dried in
oven
Samples
dried
under
ambient
condition

25
4.2 ULTIMATE ANALYSIS
Table 4.5, 4.6, 4.7, 4.8 and 4.9 show the measure composition of carbon, hydrogen,
nitrogen and sulfur of 10:90, 30:70, 50:50, 70:30 and 90:10 POME sludge to frond
briquette, respectively. Each composition of carbon, hydrogen, nitrogen and sulfur of
the samples are shown in Figure 4.5, 4.6, 4.7 and 4.8, respectively.
Table 4.5: Ultimate analysis of 10:90 POME sludge to frond briquette in weight
percentage
Composition (%)
Element Carbon Hydrogen Nitrogen Sulfur
1 44.71 6.093 0.775 0.316
2 46.27 6.184 0.857 0.336
3 45.62 6.123 0.806 0.357
Average 45.53 6.133 0.813 0.336
Table 4.6: Ultimate analysis of 30:70 POME sludge to frond briquette in weight
percentage
Composition (%)
Element Carbon Hydrogen Nitrogen Sulfur
1 51.70 6.810 0.991 0.335
2 48.97 6.429 0.777 0.393
3 51.02 6.556 0.932 0.310
Average 50.56 6.598 0.900 0.346
Table 4.7: Ultimate analysis of 50:50 POME sludge to frond briquette in weight
percentage
Composition (%)
Element Carbon Hydrogen Nitrogen Sulfur
1 50.43 6.242 0.898 0.296
2 55.24 6.678 1.028 0.356
3 55.12 6.919 1.032 0.354
Average 53.60 6.613 0.986 0.335

26
Table 4.8: Ultimate analysis of 70:30 POME sludge to frond briquette in weight
percentage
Composition (%)
Element Carbon Hydrogen Nitrogen Sulfur
1 57.47 7.368 0.967 0.362
2 59.12 7.748 0.989 0.398
3 59.59 7.629 1.020 0.336
Average 58.73 7.582 0.992 0.365
Table 4.9: Ultimate analysis of 90:10 POME sludge to frond briquette in weight
percentage
Composition (%)
Element Carbon Hydrogen Nitrogen Sulfur
1 71.64 9.936 1.135 0.456
2 61.69 7.843 1.029 0.305
3 55.42 6.499 0.888 0.298
Average 62.92 8.093 1.017 0.353
Figure 4.5: Carbon content of POME sludge and oil palm fronds mixture
0
10
20
30
40
50
60
70
10 30 50 70 90
Com
posi
tion
(%
)
POME Sludge Content (%)

27
Figure 4.6: Hydrogen content of POME sludge and oil palm fronds mixture
Figure 4.7: Nitrogen content of POME sludge and oil palm fronds mixture
Figure 4.8: Sulfur content of POME sludge and oil palm fronds mixture
0
2
4
6
8
10
10 30 50 70 90
Com
posi
tion
(%
)
POME Sludge Content (%)
0.0
0.2
0.4
0.6
0.8
1.0
1.2
10 30 50 70 90
Com
posi
tion
(%
)
POME Sludge Content (%)
0.32
0.33
0.34
0.35
0.36
0.37
10 30 50 70 90
Com
posi
tion
(%
)
POME Sludge Content (%)

28
Ultimate analysis result reveals that these mixtures have reasonably high carbon and
hydrogen content. A high carbon and hydrogen content means a high calorific value.
This is due the reason that when biomass is combusted, energy is released by
breaking of high-energy bonds between carbon and hydrogen.
The ultimate analysis result also shows that the contents of nitrogen and sulfur,
which are low. Fuel-bound nitrogen is responsible for most nitrogen oxide (NOx)
emissions produced from biomass combustion. Low nitrogen content in this mixture
should lead to lower NOx emissions which would bring negative effects to the
environment. Sulfur oxides (SOx) are formed during combustion and contribute
significantly to particulate matter pollution and acid rain. Since this mixture has
almost negligible sulfur content with average below 0.4%, its combustion does not
contribute significantly to sulfur emissions.

29
4.3 BURNING CHARACTERISTICS TEST
The time measured from the burning characteristics test was tabulated in Table 4.10.
Figure 4.9 and 4.10 show the graph of ignition time against POME sludge content
and the graph of time taken to burn to ashes against POME sludge content,
respectively.
Table 4.10: Burning characteristics test result
POME Sludge
Content (%) Ignition Time (s)
Time Taken to Burn
to Ashes (s)
10 59 630
30 84 674
50 153 812
70 199 833
90 266 848
Figure 4.9: Graph of ignition time against POME sludge content
0
50
100
150
200
250
300
0 10 20 30 40 50 60 70 80 90 100
Ign
itio
n T
ime
(s)
POME Sludge Content (%)

30
Figure 4.10: Graph of time taken to burn to ashes against POME sludge content
From Figure 4.9, the 90:10 POME sludge to frond briquette has the highest ignition
time while the 10:90 POME sludge to frond briquette has the lowest ignition time. It
is observed that ignition time increases with increasing POME sludge content. From
Figure 4.10, the 90:10 POME sludge to frond briquette has the longest time taken to
burn into ashes among all the samples. Same as observation before, time taken to
burn to ashes increases with increasing POME sludge content.
This observation might be due to lower porosity and higher density of the briquettes.
POME sludge is an oily material and would result in a mixture with low porosity
after undergoing compression. Thus, the ignition time and time taken to burn to
ashes of the briquettes which contain small percentage of POME becomes shorter.
Short ignition time is required in order to ease biomass fuel to start combustion.
However, the time taken to burn the briquette into ashes for a good quality biomass
briquette should be as long as possible. This is very important as it shows the
briquettes can supply heat in longer period.
300
400
500
600
700
800
900
1,000
0 10 20 30 40 50 60 70 80 90 100Tim
e T
ak
en t
o B
urn
to A
shes
(s)
POME Sludge Content (%)

31
4.4 DIMENSIONAL STABILITY ANALYSIS
Stability serves as an index of the extent of resistance of briquettes to changes in
their initial physical dimensions. Table 4.11, 4.12, 4.13, 4.14 and 4.15 respectively
show the dimensional stability analysis results of 10:90, 30:70, 50:50, 70:30 and
90:10 POME sludge to frond briquette. The average measured diameter for all the
five ratios of POME sludge and frond mixture is plotted in Figure 4.11.
Table 4.11: Dimensional stability analysis of 10:90 POME sludge to frond briquette
Table 4.12: Dimensional stability analysis of 30:70 POME sludge to frond briquette
Duration
(Week)
Measurement
1 (mm) Measurement
2 (mm) Measurement
3 (mm) Average
(mm)
Expansion
(%)
0 40.85 40.85 40.70 40.80 0.00
1 41.00 41.00 41.05 41.02 0.53
2 41.00 41.20 40.90 41.03 0.57
3 41.10 41.00 41.00 41.03 0.57
Table 4.13: Dimensional stability analysis of 50:50 POME sludge to frond briquette
Duration
(Week)
Measurement
1 (mm)
Measurement
2 (mm)
Measurement
3 (mm)
Average
(mm)
Expansion
(%)
0 40.30 40.20 40.35 40.28 0.00
1 40.50 40.60 40.35 40.48 0.50
2 40.20 40.50 40.70 40.47 0.46
3 40.50 40.60 40.25 40.45 0.41
Duration
(Week)
Measurement
1 (mm)
Measurement
2 (mm)
Measurement
3 (mm)
Average
(mm)
Expansion
(%)
0 41.50 41.00 41.10 41.20 0.00
1 41.50 41.75 42.00 41.75 1.33
2 41.50 42.00 42.15 41.88 1.66
3 42.00 42.00 41.50 41.83 1.54

32
Table 4.14: Dimensional stability analysis of 70:30 POME sludge to frond briquette
Duration
(Week)
Measurement
1 (mm) Measurement
2 (mm) Measurement
3 (mm) Average
(mm)
Expansion
(%)
0 40.35 40.55 40.50 40.47 0.00
1 40.60 40.60 40.65 40.62 0.37
2 40.60 40.60 40.70 40.63 0.41
3 40.65 40.60 40.65 40.63 0.41
Table 4.15: Dimensional stability analysis of 90:10 POME sludge to frond briquette
Duration
(Week)
Measurement
1 (mm) Measurement
2 (mm) Measurement
3 (mm) Average
(mm)
Expansion
(%)
0 40.45 40.50 40.35 40.43 0.00
1 40.60 40.70 40.55 40.62 0.45
2 40.75 40.65 40.40 40.60 0.41
3 40.65 40.70 40.55 40.63 0.49
Figure 4.11: Graph of diameter expansion against duration
The results revealed that the 10:90 POME sludge to frond briquette is the least stable,
followed by the 30:70 POME sludge to frond briquette. Generally 50:50, 70:30,
90:10 POME sludge to frond briquettes are stable and expanded less than 0.5% in
the first three weeks. This is contributed by the high POME sludge content that acts
as binder which in turn held the briquette firmly together.
0.0
0.2
0.4
0.6
0.8
1.0
1.2
1.4
1.6
1.8
0 1 2 3
Dia
met
er E
xp
an
sion
(%
)
Duration (Week)
10:90
30:70
50:50
70:30
90:10
Ratio of
POME
sludge to
frond
33
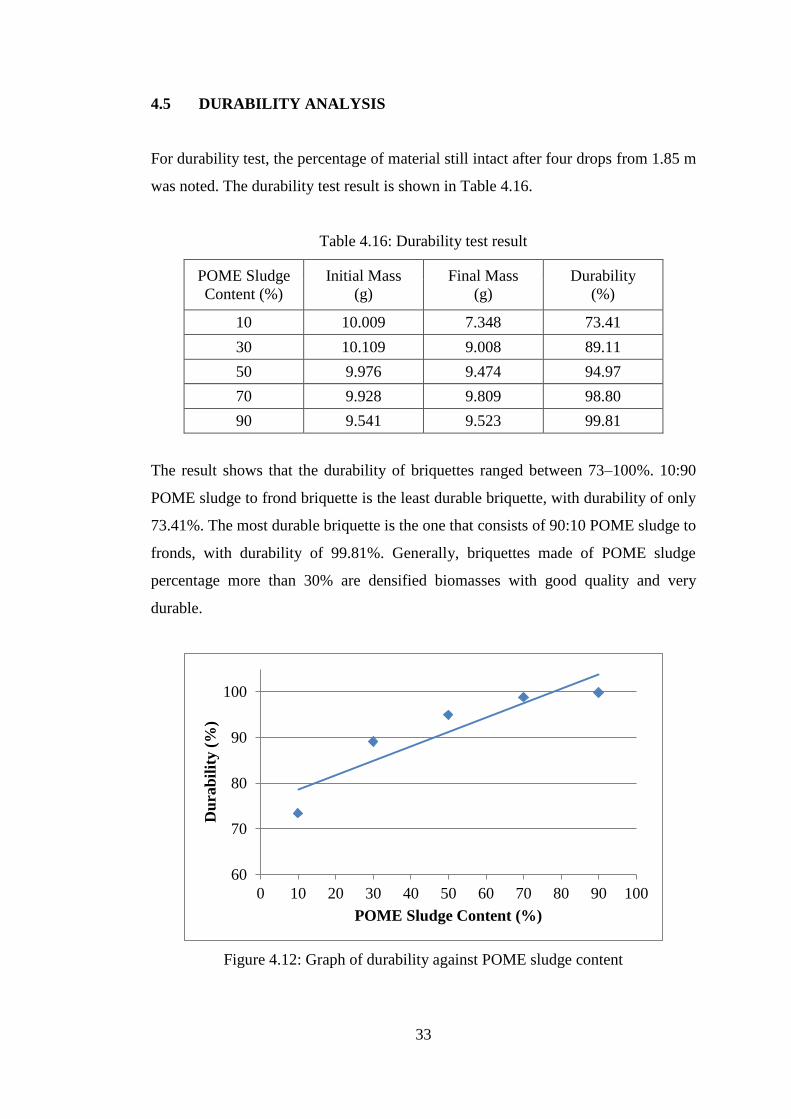
4.5 DURABILITY ANALYSIS
For durability test, the percentage of material still intact after four drops from 1.85 m
was noted. The durability test result is shown in Table 4.16.
Table 4.16: Durability test result
POME Sludge
Content (%)
Initial Mass
(g)
Final Mass
(g)
Durability
(%)
10 10.009 7.348 73.41
30 10.109 9.008 89.11
50 9.976 9.474 94.97
70 9.928 9.809 98.80
90 9.541 9.523 99.81
The result shows that the durability of briquettes ranged between 73–100%. 10:90
POME sludge to frond briquette is the least durable briquette, with durability of only
73.41%. The most durable briquette is the one that consists of 90:10 POME sludge to
fronds, with durability of 99.81%. Generally, briquettes made of POME sludge
percentage more than 30% are densified biomasses with good quality and very
durable.
Figure 4.12: Graph of durability against POME sludge content
60
70
80
90
100
0 10 20 30 40 50 60 70 80 90 100
Du
rab
ilit
y (
%)
POME Sludge Content (%)

34
The relationship between POME sludge content with durability of briquette is shown
in Figure 4.12. It was noted that the durability of the briquette increase with
increasing POME sludge content. Briquette with high POME sludge content can
withstand the rigors of handling such that they keep their mass, shape and integrity.
This could probably due to the reason that POME sludge is oily material that act as
binder and tended to hold the briquette strongly and therefore, these briquettes were
relatively durable.

35
4.6 CRACK ANALYSIS
The third mechanical property test is crack analysis, where a briquette was dropped
from 1 m high and any crack in the radial direction was noted. Result from the crack
analysis is illustrated in Figure 4.13 (a)–(e). Crack analysis results show that 10:90
POME sludge to frond briquette had partially broken into small pieces. Meanwhile,
30:70 POME sludge to frond briquette shows a very minor crack only. Whereas
50:50, 70:30, 90:10 POME sludge to frond briquettes are strong and free of crack.
(a) (b)
(c) (d)
(e)
Figure 4.13: Crack analysis on (a) 10:90 (b) 30:70 (c) 50:50 (d) 70:30 and (e) 90:10
POME sludge to frond briquettes

36
From the crack analysis result obtained, the briquettes made of lower percentage of
POME have tendency to exhibit more cracks. This could due to the reason that oily
material like POME sludge tend to hold briquette tightly together.

37
CHAPTER 5
CONCLUSION AND RECOMMENDATION
5.1 CONCLUSION
In short the purpose of the project is to experimentally study palm oil mill effluent
(POME) sludge and oil palm fronds mixture for energy potential. This proposed
study aims to examine the possibility of POME sludge and oil palm fronds mixture
as an alternative biomass fuel. A general review of POME and fronds characteristics
is first carried out. This was followed by a refined review of the literature in order to
gain thorough understanding for the commencement of the laboratory and
experimental aspects of the project. A series of experimentally works have been
started after that to develop experimental testing of the biomass fuel in briquette
form and to investigate the performance of each sample with different weight
percentage.
From the experimental testing, it was found that 90:10 POME sludge to fronds
briquette shows a good combination of properties. This briquette produces the
highest calorific value among all the briquettes. However, the calorific value is
limited by biomass moisture content as the results show that briquettes with 0%
moisture content have higher calorific value than samples dried under ambient
condition for all the five ratios.
Ultimate analysis result reveals that these mixtures have high carbon and hydrogen
content but the contents of nitrogen and sulfur are low. This mixture is a good
candidate for fuel briquette as high carbon content would be desired since it is an
important element in the combustion. A low content of sulfur and nitrogen would be
desired as well since it minimizes negative effects to the environment.
The burning test result shows that the 90:10 POME sludge to frond briquette has
longest time taken to burn into ashes but the longest ignition time. A good quality of
biomass briquette should have short ignition time and long time taken to burn into

38
ashes. Long ignition time is a disadvantage of a biomass briquette because more time
is required for the briquette to start burning.
As for durability test, the most durable briquette was the one that consisted of 90:10
POME sludge to frond, with durability of 99.81%, whereas 50:50, 70:30, 90:10
POME sludge to frond briquettes are strong and free of crack based on the results
from crack analysis. From dimensional stability analysis, 50:50, 70:30, 90:10 POME
sludge to frond briquettes are stable and expanded less than 0.5% in the first three
weeks.
Experimentally, it was found that POME sludge and oil palm fronds mixture as an
alternative biomass fuel is feasible and the objectives of this research are achieved
successfully.

39
5.2 RECOMMENDATION
There are few optional analyses that can be done in order to further investigate the
characteristic and performance of the briquettes. One of the analyses is immerse test
in which the water resistance of the briquettes is quantified by taking the time that a
briquette required to fully disintegrate in water. This property is important because it
would enable user to decide the storage method or location of the briquettes. For
biomass fuel briquettes that do not have good water resistance, they should be stored
under cover and not at places with high humidity.
Lastly, several die pressures could be applied to the briquette. This is because fuel
briquettes produced under different pressure have been reported to have different
handling characteristics [14]. Briquette density is one of the most important
properties which bear on the combustion characteristics, handling characteristics
including the ignition behavior of briquettes and this property depends on the
briquetting pressure [14].

40
REFERENCES
[1] Ujang, Z., Salmiati, & Salim, M.R. (2010). Microbial Biopolymerization
Production from Palm Oil Mill Effluent (POME). Biopolymers. Magdy
Elnashar (Ed.). Sciyo.
[2] United States Department of Agriculture. (2011). World Agricultural
Production.
[3] Malaysian Palm Oil Board - MPOB. (2011). Overview of the Malaysian oil
palm industry 2010. Ministry of Plantation Industries and Commodities
Malaysia.
[4] Parveen, F.R., Rajeev, P.S., Ibrahim, M.H., & Esa, N. (2010). Review of
Current Palm Oil Mill Effluent Treatment Methods: Vermicomposting as a
Sustainable Practise. World Applied Sciences Journal, 11 (1), 70–81.
[5] Sulaiman, S.A., Balamohan, S., Moni, M.N.Z., Mekbib, S. & Mohamed, A.O.
(2010). Study on the Feasibility of Oil Palm-Fronds for Biomass Gasification.
5th
International Ege Energy Symposium and Exhibition, Denizli, Turkey.
[6] Ling, Y.L. (2007). Treatability of Palm Oil Mill Effluent (POME) Using
Black Liquor in an Anaerobic Treatment Process. Master, Universiti Sains
Malaysia.
[7] Teoh, C.H. (2002). The Palm Oil Industry in Malaysia: From Seed to Frying
Pan. Plantation Agriculture: WWF Malaysia.
[8] Sethupathi, S. (2004). Removal of Residue Oil from Palm Oil Mill Effluent
(POME) using Chitosan, Universiti Sains Malaysia.
[9] Chaney, J. (2010). Combustion Characteristics of Biomass Briquettes. Ph.D,
University of Nottingham.
41
[10] Dietenberger, M. (2002). Update for Combustion Properties of Wood
Components. Fire and Materials, 26, 255–267.
[11] Chin, Y.S., Al-Kayiem H.H., Rangkuti, C. Aris, M.S., & Hassan, S. (2007).
Experimental Investigations on Fuel Briquettes Produced from Agricultural
and Industrial Waste. Department of Mechanical Engineering: Universiti
Teknologi PETRONAS.
[12] Demirbas, A. (1999). Physical Properties of Briquettes from Waste Paper and
Wheat Straw Mixtures. Energy Conversion and Management, 40, 437–445.
[13] Al-Widyan, M.I., Al-Jalil, H.F., Abu-Zreig, M.M., & Abu-Hamdeh, N.H.
(2002). Physical Durability and Stability of Olive Cake Briquettes. Canadian
Biosystems Engineering, 44, 33–41.
[14] Wilaipon, P. (2007). Physical Characteristics of Maize Cob Briquette under
Moderate Die Pressure. American Journal of Applied Sciences, 4 (12), 995–
998.


