Cite this paper as:
Asadullah, Niaz M, Mansor, N and Savoia, A (2019) Explaining a ‘development
miracle’: poverty reduction and human development in Malaysia since the 1970s. GDI
Working Paper 2019-038. Manchester: The University of Manchester.
www.gdi.manchester.ac.uk
Explaining a ‘development miracle’: poverty reduction and human development in Malaysia since the 1970s M Niaz Asadullah,1
Norma Mansor2 Antonio Savoia3
1 Faculty of Economics and Administration,
University of Malaysia, Malaysia; School of Economics, University of Reading, UK; Centre on Skills, Knowledge and Organisational Performance (SKOPE), University of Oxford, UK; IZA Institute of Labor Economics, Germany; Global Development Institute (GDI) and Effective States and Inclusive Development (ESID) Centre, The University of Manchester, UK 2 Faculty of Economics and Administration,
University of Malaysia, Malaysia 3 GDI and ESID, The University of Manchester,
UK
Global Development Institute
Working Paper Series
2019-038
April 2019
ISBN: 978-1-909336-73-5

www.gdi.manchester.ac.uk 2
Abstract
This paper provides a systematic assessment of the alleged exceptionality of
Malaysia’s development progress and its likely explanations, in a comparative
perspective. Using cross-country regressions and aggregate indices of education,
health, poverty and gender equality outcomes, we offer three findings. First, we provide
evidence supporting the hypothesis that Malaysia’s human development progress has
been exceptional compared with that of countries with a similar level of economic
development, primarily for the 1970s and 1980s, so showing that progress has early
origins. Next, we show that such progress is explained by a combination of income-
mediated and support-led mechanisms, including Malaysia’s early emphasis on
education and health inputs and infrastructure development. Finally, we argue that an
early advantage in state capacity, vis-à-vis other countries of similar income level, may
be at the origin of Malaysia’s successful implementation of poverty-reduction and
growth-enhancing policies.
Keywords
Malaysia, state capacity, institutions, poverty, human development
JEL Codes
I38, N35, O13, O53
www.gdi.manchester.ac.uk 3
1. Introduction
Many consider Malaysia’s economic performance and development achievements
since independence as a ‘development miracle’ (World Bank, 1993; Stiglitz, 2007;
Dadzie, 2013). Malaysia was not only one of the handful of developing countries that
experienced high and sustained macroeconomic growth in the postwar period, it did so
by moving the economy away from being a raw commodity exporter to a manufacturing
exporter, lifting the country into the upper middle-income category (Commission on
Growth and Development, 2008; World Bank, 2010). Moreover, its levels of most social
development indicators improved steadily. Poverty reduction, dropping from 49.3% of
the population living below the poverty line in 1970 to 6% by 2002, was achieved well
before the adoption of the Millennium Development Goals (MDGs) and across all
ethnic groups (Henderson et al, 2002). Therefore, Malaysia is often cited as a success
story of growth with redistribution.
Yet its success seems to challenge conventional explanations. First, Malaysia was
historically characterised by ethnic tensions and race riots in its early years. Therefore,
its achievements, vis-à-vis other ethnically divided countries, seem at odds with
prevalent views on the challenges of economic performance, institutional development,
poverty reduction and redistribution in countries characterised by ethnic, linguistic, and
religious cleavages (see eg Alesina et al, 2003; Casey and Owen 2014). Second, one
of Malaysia’s chief traits was its natural resources dependence, which is often seen as
a ‘curse’ on long-run development, particularly when the quality of government is weak
(Frankel, 2012; Wenar, 2013; Venables, 2016). For example, the occurrence and
intensity of internal conflicts, excess inequality, underinvestment in human capital and
poor macroeconomic management are often attributed to economic dependence on
hydrocarbons and mineral wealth (Collier, 2008; Isham et al, 2005; Gylfason, 2011).
But Malaysia is cited as one of the economies that escaped the ‘resource curse’.1
This paper provides a systematic empirical investigation of the alleged exceptionality of
Malaysia’s human development and offers some explanations for its progress,
identifying specific channels. This is needed because, while the country is seen as
challenging conventional explanations, and hence as a ‘miracle’, whether and to what
extent Malaysia overachieves compared with countries with similar level of economic
development is not well documented. Also, existing research on Malaysia has hitherto
mainly looked at its economic performance.2 Research on its human development, on
the other hand, has looked at specific episodes or dimensions, without taking a long-
1 However, Doraisami (2015) is an exception.
2 For comparative studies on economic performance, see Naiya (2013) and Dadzie (2013).
Studies looking at long-term growth are Menon (2009), focusing on macroeconomic policies, and Sen and Tyce (2017), looking at the political economy of growth phases. Ang and McKibbin (2007) provide evidence on the impact of financial liberalisation on financial sector development.
www.gdi.manchester.ac.uk 4
term view of the origins of its progress or providing systematic empirical testing of its
likely explanations.3
The analysis has three steps. First, we look at the significance of Malaysia’s
development progress during the period 1970–2010 in comparative perspective, using
a cross-country framework. This period coincides with the implementation of the New
Economic Policy (NEP). We empirically investigate whether and to what extent
Malaysia over-performs on key development indicators, testing whether and when
Malaysia’s progress is superior to that of economies with a similar level of economic
development. The results suggest that its progress is exceptional along many
dimensions: poverty, education, health, sanitation, and gender parity. In the case of
income poverty reduction, the unusual achievement is that the biggest fall occurred
during the 1970s, when extreme poverty was still widespread throughout the
developing world and the pursuit of pro-poor policies was yet to be the norm. Second,
further tests document the channels responsible for Malaysia's exceptionality, finding
that the early reduction in poverty was achieved through a combination of rapid
economic growth and redistribution, with an early emphasis on education and
infrastructure development. Finally, we show that development progress during the
1970s coincided with an early advantage in key aspects of institutional development,
vis-à-vis other countries of similar income level, related to state legal, fiscal and
administrative capacity. Looking at the long-term roots of Malaysia’s performance, we
argue that historical developments during the colonial period are likely to have helped
meet the necessary pre-conditions, through human capital channels, for effective state
institutions and successful implementation of poverty reduction and human
development in the post-independence era.
The paper is related to the wider debate on Asian development and to the literature on
the origins of long-term development. In particular, the causes and mechanisms of
East Asia's rapid economic growth have been subjected to much analysis, and a better
understanding of the role of developmental states in East Asia’s economic ascendency
remains an important issue in this area. By re-examining Malaysia’s human
development progress, our study contributes to this specific literature on East Asia’s
development experience (see, for example, World Bank, 1993; Krugman, 1994; Baer et
al, 1999; Booth, 1999; Perkins, 2013; Ranis and Stewart, 2012). Moreover, as the
fiscal, legal and administrative capacity of the Malaysian state may be relevant in
explaining its current development performance (Haggard, 2018; Booth, 1999; Noh,
2010; Shah, 2017; Tan, 2014), our study also adds to the broader literature on the
long-run origins of comparative development. In particular, this paper complements this
literature with a case study of the burgeoning macro-empirical literature in this area,
emphasising the historical role of institutions (Acemoglu et al, 2001; Glaeser et al,
2004; Rodrik et al, 2004; Easterly and Levine, 2016) and state capacity (Besley and
Persson, 2011; Bardhan, 2016; Savoia and Sen, 2015).
3 Assessments of Malaysia’s development include Henderson et al (2002), Fredericks (2011),
Naguib and Smucker (2009), and Rodrigo and Mansor (2013).
www.gdi.manchester.ac.uk 5
The paper is organised as follows. Section 2 discusses the development trends during
1970–2013 in relation to other developing countries. Section 3 presents regression-
based evidence on the alleged exceptionality of progress made in social development
outcomes. Section 4 discusses the possible pathways to development in Malaysia,
testing different channels. Section 5 concludes.
2. Malaysia’s development trends
This section illustrates the evolution of Malaysia’s economic and social development in
comparative perspective. This will help us trace the origins of, and contextualise, its
development performance. In the absence of consistent time-series data for the period
1950–69, we focus on the period starting from the 1970s.
The Malaysian economy has substantially grown since its independence, even during
times of worsening global economic environment (Table 1). It went through a process
of structural transformation that was similar to that in other postwar economies. The
growth rate was fairly sustained between 1961 and 1976 and has continued to be
significant over the following 20 years (Thillainathan and Kee-Cheok, 2016). The
government provided incentives through import substitution, as well as export-oriented
manufacturing activities. In the 1970s, high growth was driven by labour-intensive
export-oriented industries like textiles and electronics assembly (Shari, 2000). During
the country’s graduation from being the world's largest rubber producer to becoming a
diversified manufacturing export-oriented economy, agriculture’s share of employment
fell from 40% in 1975 to about 15% in 2000. At the same time, the state intervened to
redistribute gains from economic growth, particularly during the 1970–90 period
(Rasiah and Shari, 2001). Since Malays accounted for the bulk of the poor and rural
residents, allocation of budgetary expenditure prioritised agricultural modernisation and
rural development in the Five-year Plan (FYP) documents (Henderson et al, 2002;
Yusof, 2011).

Table 1: Economic performance in Malaysia vis-à-vis ASEAN and developing
countries, 1980–2013
Year 1970 1975 1980 1985 1990 1995 2000 2005 2010 2013
Panel (a): per capita GDP (constant 2005 US$)
Malaysia 1383.28 1729.19 2318.24 2609.32 3147.09 4347.82 4861.86 5553.94 6318.90 6990.25
ASEAN 5 (Indonesia, Malaysia, Philippines, Thailand, and Vietnam)
Mean 781.28 944.19 1216.10 1097.04 1372.53 1831.91 1949.22 2283.56 2671.35 2969.61
Sd 449.04 564.84 768.96 895.74 1090.47 1561.27 1738.75 1972.45 2208.15 2419.94
N 4 4 4 5 5 5 5 5 5 5
Asia (developing economies)
Mean 613.49 705.24 822.65 826.03 1065.62 901.32 1028.35 1372.12 1803.29 2073.14
Sd 507.29 630.19 824.89 853.29 878.71 892.36 978.07 1240.44 1542.67 1713.39
N 12 12 13 17 23 24 24 26 26 26
Developing economies
Mean 1851.76 3035.54 3283.29 2833.55 2809.16 3018.44 3629.45 4061.83 4273.18 3895.44
Sd 2635.55 8421.85 8591.55 6054.67 5078.90 5403.78 6783.64 7052.99 6571.78 5991.82
N 82 85 103 112 131 137 142 145 142 135
China 131.33 171.67 221.65 327.02 483.19 759.85 1122.26 1731.13 2870.05 3583.38
Year 1971–
75
1976–
80
1981–
85
1986–
90
1991–
95
1996–
2000
2001–
05
2006–
10
2011–
13
Panel (b): Average per capita GDP growth
Malaysia 4.63 6.05 2.44 3.87 6.68 2.46 2.72 2.66 3.42
ASEAN 5 (Indonesia, Malaysia, Philippines, Thailand, and Vietnam)
Mean 3.87 5.06 1.45 4.39 5.34 1.64 3.64 3.73 3.95
Sd 1.20 1.28 3.02 2.61 3.14 2.43 1.26 1 0.81
N 4 4 5 5 5 5 5 5 5
Asia (developing economies)
Mean 1.97 3.26 2.58 2.87 -1.34 3.29 5.43 5.62 5.07
Sd 2.61 2.43 2.50 4.11 8.90 2.72 3.42 2.83 2.40
N 13 13 17 21 25 25 27 26 26
Developing economies
Mean 2.50 1.60 0.24 0.97 -0.09 2.60 3.10 2.84 2.63
Sd 4.12 4.42 3.61 3.82 6.13 5.91 3.62 3.01 2.94
N 86 95 114 125 137 141 146 145 143
China 5.65 5.34 8.14 8.17 9.55 8.12 9.06 10.66 7.68
Notes: GDP is calculated at PPP, 2005 constant prices. The developing countries’ classification follows the IMF
system (http://www.imf.org/external/pubs/ft/weo/2011/01/weodata/groups.htm, accessed: 25 August 2015).Data:
World Bank (2016).
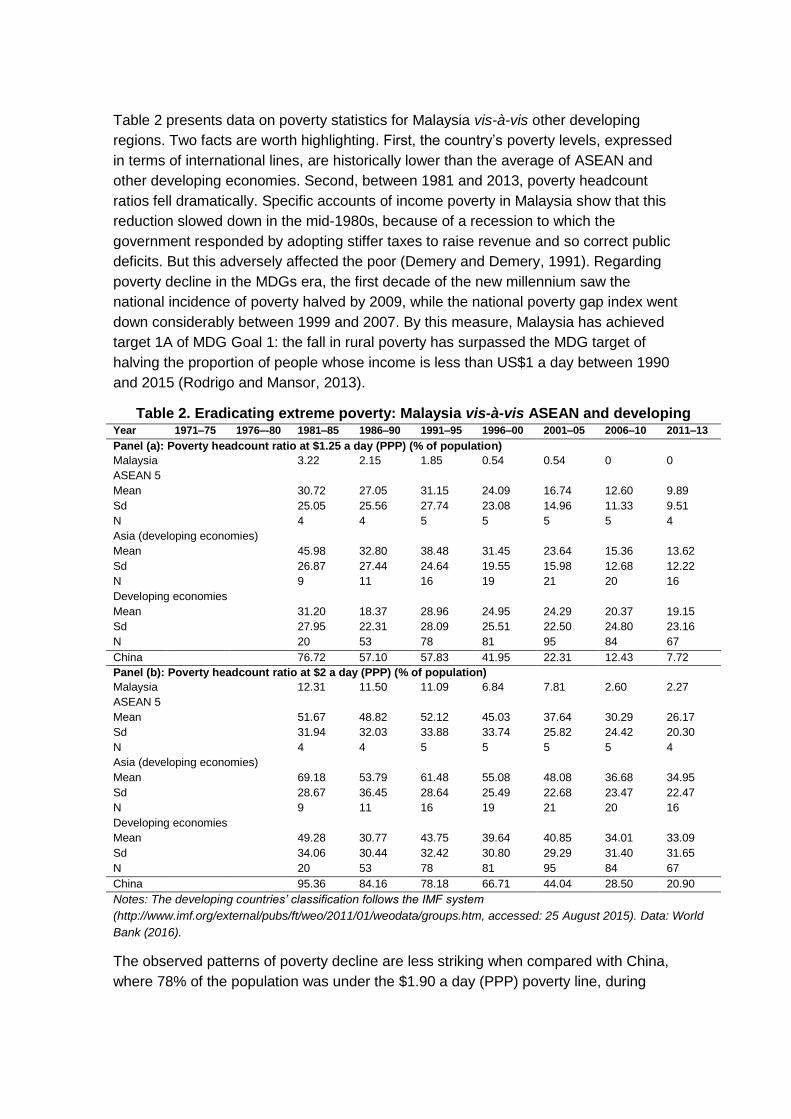
Table 2 presents data on poverty statistics for Malaysia vis-à-vis other developing
regions. Two facts are worth highlighting. First, the country’s poverty levels, expressed
in terms of international lines, are historically lower than the average of ASEAN and
other developing economies. Second, between 1981 and 2013, poverty headcount
ratios fell dramatically. Specific accounts of income poverty in Malaysia show that this
reduction slowed down in the mid-1980s, because of a recession to which the
government responded by adopting stiffer taxes to raise revenue and so correct public
deficits. But this adversely affected the poor (Demery and Demery, 1991). Regarding
poverty decline in the MDGs era, the first decade of the new millennium saw the
national incidence of poverty halved by 2009, while the national poverty gap index went
down considerably between 1999 and 2007. By this measure, Malaysia has achieved
target 1A of MDG Goal 1: the fall in rural poverty has surpassed the MDG target of
halving the proportion of people whose income is less than US$1 a day between 1990
and 2015 (Rodrigo and Mansor, 2013).
Table 2. Eradicating extreme poverty: Malaysia vis-à-vis ASEAN and developing
countries Year 1971–75 1976–-80 1981–85 1986–90 1991–95 1996–00 2001–05 2006–10 2011–13
Panel (a): Poverty headcount ratio at $1.25 a day (PPP) (% of population)
Malaysia 3.22 2.15 1.85 0.54 0.54 0 0
ASEAN 5
Mean 30.72 27.05 31.15 24.09 16.74 12.60 9.89
Sd 25.05 25.56 27.74 23.08 14.96 11.33 9.51
N 4 4 5 5 5 5 4
Asia (developing economies)
Mean 45.98 32.80 38.48 31.45 23.64 15.36 13.62
Sd 26.87 27.44 24.64 19.55 15.98 12.68 12.22
N 9 11 16 19 21 20 16
Developing economies
Mean 31.20 18.37 28.96 24.95 24.29 20.37 19.15
Sd 27.95 22.31 28.09 25.51 22.50 24.80 23.16
N 20 53 78 81 95 84 67
China 76.72 57.10 57.83 41.95 22.31 12.43 7.72
Panel (b): Poverty headcount ratio at $2 a day (PPP) (% of population)
Malaysia 12.31 11.50 11.09 6.84 7.81 2.60 2.27
ASEAN 5
Mean 51.67 48.82 52.12 45.03 37.64 30.29 26.17
Sd 31.94 32.03 33.88 33.74 25.82 24.42 20.30
N 4 4 5 5 5 5 4
Asia (developing economies)
Mean 69.18 53.79 61.48 55.08 48.08 36.68 34.95
Sd 28.67 36.45 28.64 25.49 22.68 23.47 22.47
N 9 11 16 19 21 20 16
Developing economies
Mean 49.28 30.77 43.75 39.64 40.85 34.01 33.09
Sd 34.06 30.44 32.42 30.80 29.29 31.40 31.65
N 20 53 78 81 95 84 67
China 95.36 84.16 78.18 66.71 44.04 28.50 20.90
Notes: The developing countries’ classification follows the IMF system
(http://www.imf.org/external/pubs/ft/weo/2011/01/weodata/groups.htm, accessed: 25 August 2015). Data: World
Bank (2016).
The observed patterns of poverty decline are less striking when compared with China,
where 78% of the population was under the $1.90 a day (PPP) poverty line, during

www.gdi.manchester.ac.uk 8
1991–95. This figure had fallen to 20.9% by 2011. Moreover, in terms of level of
economic development, Malaysia faced more favourable conditions when compared
with China. Its per capita income in 1980 was nearly ten times more than that of China
(see Table 1).
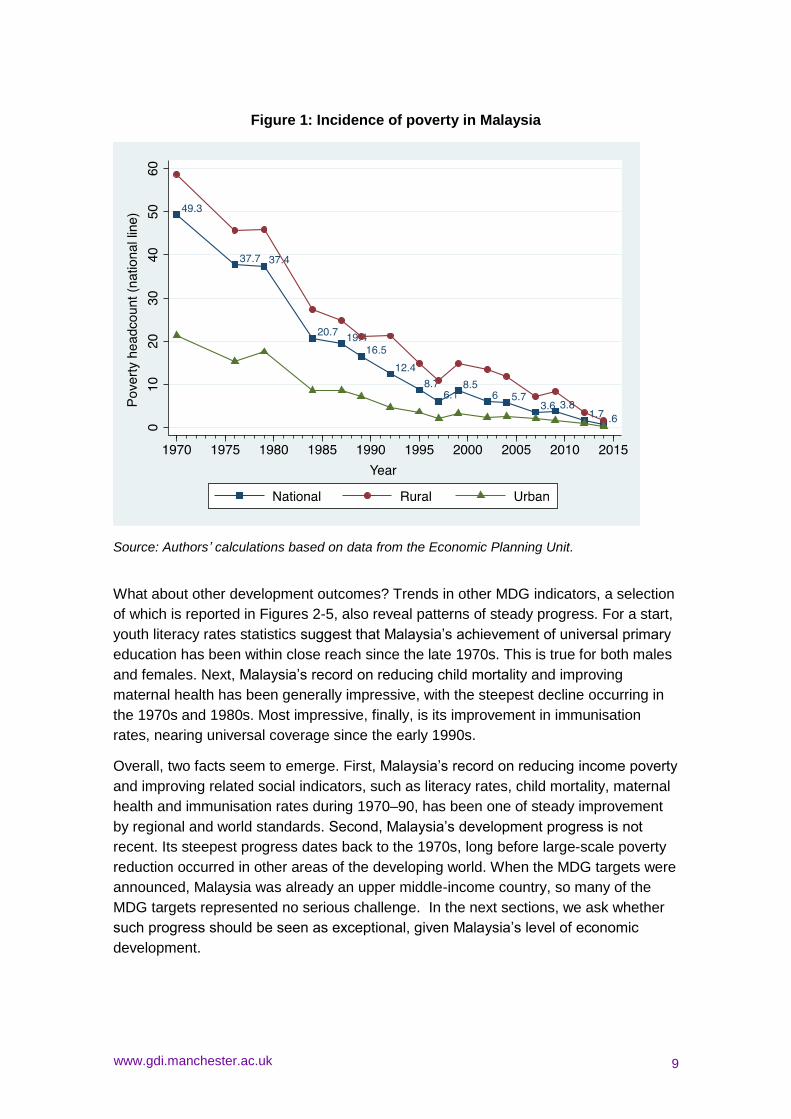
Table 2, however, somewhat understates Malaysia’s achievements in poverty
reduction. International poverty line measures do not cover the 1970s and therefore
overlook the fact that poverty has declined steadily since 1970, to the point of being
almost eradicated by 2005. Figure 1 presents extended headcount statistics, based on
national lines, showing that most poverty reduction occurred in the decade of the
1970s, when mass poverty was the norm throughout developing Asia. The biggest falls
occurred during 1970–76 (12 percentage points) and 1979–84 (17 percentage points).
This coincides with the NEP implementation period of 1971–90.
The NEP comprised a two-pronged strategy of poverty reduction and ethnic
redistribution (ie. the elimination of the racial inequality in income, employment and
wealth) in order to ensure national unity. In general, much of the poverty reduction in
the 1970s has been attributed to the NEP (Edwards, 2005). While some have
questioned the extent of poverty decline and the role of the NEP therein (eg Gomez
and Jomo, 1997), independent assessments of poverty do confirm a substantial decline
(see Shari, 2000).4 Poverty policies during the 1990s were a continuation of the
strategy developed over the previous 20 years, and were carried out through the 1991
National Development Policy (NDP), the successor to the NEP. Like the NEP, the NDP
maintained the 'ethnicity-oriented' poverty policy (Roslan, 2003). A wide range of
redistributive interventions were retained to help the Bumiputera (‘sons of the soil’ or
indigenous Malays) to obtain parity with non-Bumiputera in income and wealth.
However, there was also a shift in policy towards a more growth-focused strategy to
reduce poverty instead of ethnicity-specific targets (Henderson et al, 2002).
4 Malaysia’s official poverty is well below that of other countries at a similar stage of economic
development. However, the pattern of decline in poverty over time does not change even if a revised poverty measure is used (Ravallion, 2019).
www.gdi.manchester.ac.uk 9
Figure 1: Incidence of poverty in Malaysia
Source: Authors’ calculations based on data from the Economic Planning Unit.
What about other development outcomes? Trends in other MDG indicators, a selection
of which is reported in Figures 2-5, also reveal patterns of steady progress. For a start,
youth literacy rates statistics suggest that Malaysia’s achievement of universal primary
education has been within close reach since the late 1970s. This is true for both males
and females. Next, Malaysia’s record on reducing child mortality and improving
maternal health has been generally impressive, with the steepest decline occurring in
the 1970s and 1980s. Most impressive, finally, is its improvement in immunisation
rates, nearing universal coverage since the early 1990s.
Overall, two facts seem to emerge. First, Malaysia’s record on reducing income poverty
and improving related social indicators, such as literacy rates, child mortality, maternal
health and immunisation rates during 1970–90, has been one of steady improvement
by regional and world standards. Second, Malaysia’s development progress is not
recent. Its steepest progress dates back to the 1970s, long before large-scale poverty
reduction occurred in other areas of the developing world. When the MDG targets were
announced, Malaysia was already an upper middle-income country, so many of the
MDG targets represented no serious challenge. In the next sections, we ask whether
such progress should be seen as exceptional, given Malaysia’s level of economic
development.

www.gdi.manchester.ac.uk 10
Figure 2: Youth literacy and enrolment rates in Malaysia
Source: Authors’ calculations based on data from the Economic Planning Unit.

www.gdi.manchester.ac.uk 11
Figure 3: Infant mortality rate in Malaysia
Source: Authors’ calculations based on data from the Economic Planning Unit.
Figure 4: Maternal mortality rate in Malaysia
Source: Authors’ calculations based on data from the Economic Planning Unit.

www.gdi.manchester.ac.uk 12
Figure 5: Immunisation (DPT) in Malaysia
Source: Authors’ calculations based on data from the Economic Planning Unit.
3. Is Malaysia’s development progress exceptional?
In this section, we provide evidence on whether Malaysia outperforms (or
underperforms) other countries. Apart from income poverty, the analysis includes a
number of human development indicators, to obtain evidence on whether the country’s
alleged exceptionality extends to relevant areas of the MDGs.
3.1 Methodology and data
To investigate the hypothesis that its progress is exceptional compared with countries
with a similar level of economic development, we measure the extent of deviations of
Malaysia from the expected value of various development indicators. We do so by
estimating the following cross-country regressions (by Ordinary Least Squares):
Di = α + β1 Mi + β2 Ii + εi with i=1, . . . , N (1)
where the dependent variable Di is the value of each development indicator and Ii is the
purchasing power parity (PPP)-adjusted per capita income (log). This is important,
since Malaysia enjoyed favourable initial conditions in this respect compared with other
www.gdi.manchester.ac.uk 13
poor countries.5 Mi is the Malaysia dummy and captures the deviations from the
expected value for each development indicator. The hypothesis that Malaysia’s human
development is exceptional, in relation to other countries with a similar economic
development, means that it would show up as a response outlier: the dependent
variable of interest takes on an unusual value for economies with similar
characteristics. In practice, this means detecting whether Malaysia can shift the
intercept of the development outcome of interest (its interpretation is equivalent to
calculating studentised residuals, which correspond to the t-stat one would obtain by
including the Malaysia dummy). The hypothesis of Malaysia’s development
exceptionality suggests that the Malaysia dummy is expected to be statistically
significant. To observe its evolution, we repeat such regressions for each five-year sub-
period.6 We use as dependent variables standard MDG targets: income poverty
measures, literacy and enrolment rates in primary education, child mortality rates,
maternal health and gender equality measures. All variables are from the World
Development Indicators (World Bank, 2016).
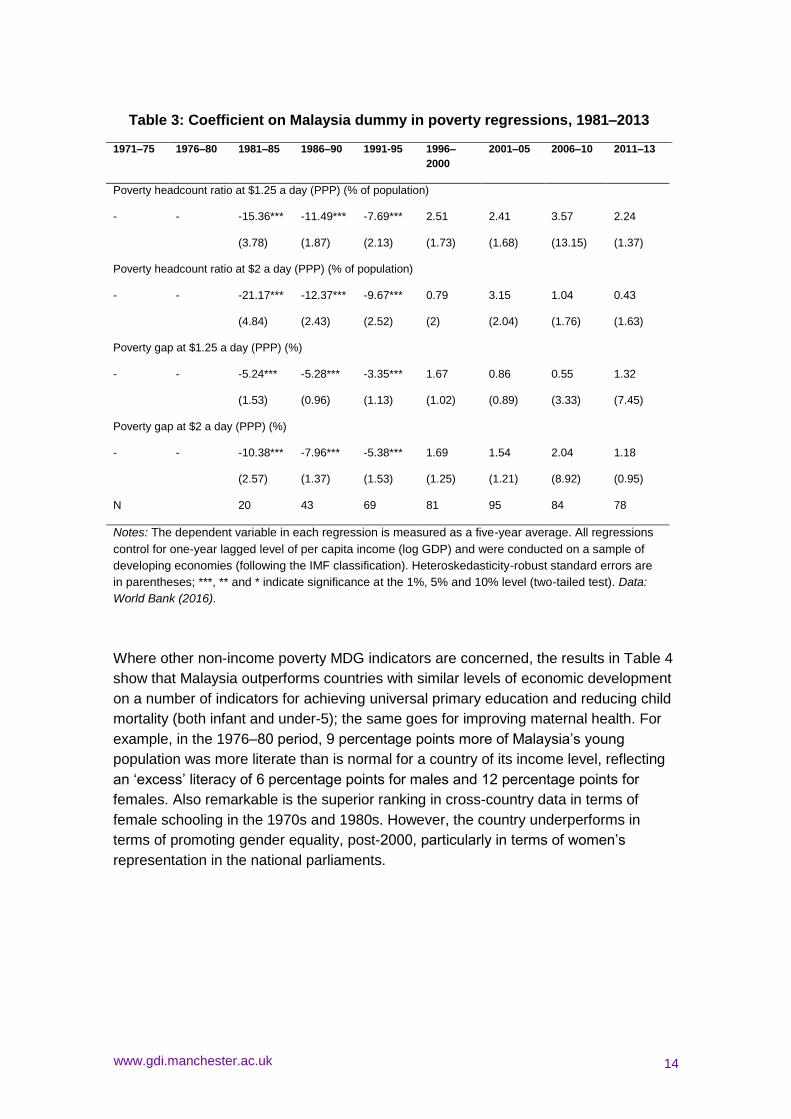
3.2 Results
Table 3 presents estimated coefficients on the Malaysia dummy in poverty regressions.
The results suggest that Malaysia’s progress on poverty eradication has indeed been
exceptional for the period 1981–95. For example, during 1981–85, over 15 percentage
points less of Malaysia’s population was living below $1.25 a day than would be normal
for a country of its income level. After the mid-1990s, the coefficients on Malaysia
dummies become statistically insignificant, showing no evidence of exceptionality.
Note, however, that Malaysia’s exceptionality in poverty reduction may have started
earlier, since the steep decline in income poverty occurred in the 1970s.
5 Malaysia’s per capita income in the 1960s was higher than that of many of the current upper-
middle-income countries (eg Botswana, China), as well as those that still remain lower-middle-income countries (eg Vietnam, Indonesia, Thailand). Botswana (US$210 in 1960) and China ($105 in 1961) were historically a lot poorer, against $790 of Malaysia in 1967 in constant 2000 US dollars (Commission on Growth and Development, 2008). 6 The actual sample size might vary over time in the regressions presented. Rather than having
the same sample over time, we preferred to use the largest possible sample in order to avoid any significant loss in degrees of freedom. However, once we restrict the analysis to the same set of countries for each of the development outcomes under scrutiny, the set of results (available on request) is indeed similar. Incidentally, we should also clarify that the regression framework we use is a useful tool to highlight the exceptionality of certain development outcomes (or of factors contributing to specific development outcomes). But it is not a tool for causal inference.
www.gdi.manchester.ac.uk 14
Table 3: Coefficient on Malaysia dummy in poverty regressions, 1981–2013
1971–75 1976–80 1981–85 1986–90 1991-95 1996–
2000
2001–05 2006–10 2011–13
Poverty headcount ratio at $1.25 a day (PPP) (% of population)
- - -15.36*** -11.49*** -7.69*** 2.51 2.41 3.57 2.24
(3.78) (1.87) (2.13) (1.73) (1.68) (13.15) (1.37)
Poverty headcount ratio at $2 a day (PPP) (% of population)
- - -21.17*** -12.37*** -9.67*** 0.79 3.15 1.04 0.43
(4.84) (2.43) (2.52) (2) (2.04) (1.76) (1.63)
Poverty gap at $1.25 a day (PPP) (%)
- - -5.24*** -5.28*** -3.35*** 1.67 0.86 0.55 1.32
(1.53) (0.96) (1.13) (1.02) (0.89) (3.33) (7.45)
Poverty gap at $2 a day (PPP) (%)
- - -10.38*** -7.96*** -5.38*** 1.69 1.54 2.04 1.18
(2.57) (1.37) (1.53) (1.25) (1.21) (8.92) (0.95)
N 20 43 69 81 95 84 78
Notes: The dependent variable in each regression is measured as a five-year average. All regressions
control for one-year lagged level of per capita income (log GDP) and were conducted on a sample of
developing economies (following the IMF classification). Heteroskedasticity-robust standard errors are
in parentheses; ***, ** and * indicate significance at the 1%, 5% and 10% level (two-tailed test). Data:
World Bank (2016).
Where other non-income poverty MDG indicators are concerned, the results in Table 4
show that Malaysia outperforms countries with similar levels of economic development
on a number of indicators for achieving universal primary education and reducing child
mortality (both infant and under-5); the same goes for improving maternal health. For
example, in the 1976–80 period, 9 percentage points more of Malaysia’s young
population was more literate than is normal for a country of its income level, reflecting
an ‘excess’ literacy of 6 percentage points for males and 12 percentage points for
females. Also remarkable is the superior ranking in cross-country data in terms of
female schooling in the 1970s and 1980s. However, the country underperforms in
terms of promoting gender equality, post-2000, particularly in terms of women’s
representation in the national parliaments.

Table 4: Coefficient on Malaysia dummy in MDG regressions, 1971–2013
1971–75 1976–80 1981–85 1986–90 1991–95 1996–
2000
2001–05 2006–10 2011–13
Panel (a): achieve universal primary education
Literacy rate, youth, total (% of people ages 15–24)
- 9.04** - - 6.92*** -1.57 - -0.92 1.56
(3.40) (1.98) (2.98) (1.98) (1.11)
31 43 60 76 78
Literacy rate, youth, male (% of males ages 15–24)
- 5.95** - - 4.28*** -0.98 - -0.54 1.13
(2.59) (1.36) (2.44) (1.62) (0.90)
31 40 60 76 78
Literacy rate, youth, female (% of females ages 15–24)
- 12.05*** - - 8.92*** -2.05 - -1.25 1.76
(4.30) (2.44) (3.49) (2.32) (1.32)
31 40 60 76 78
School enrolment, primary (% net)
19.03*** - - - 10.86*** 3.78** 3.49*** - -
(2.68) (2.41) (1.52) (1.30)
57 73 116 116
School enrolment, primary, male (% net)
17.06*** - - - 11.07*** 4.33*** 4.49*** - -
(2.89) (2.29) (1.57) (1.25)
49 63 109 107
School enrolment, primary, female (% net)
21.79*** - - - 13.33*** 4.75*** 2.93* - -
(3.36) (2.69) (1.74) (1.49)
49 63 109 107
Panel (b): promote gender equality
Ratio of female to male, primary enrolment (%)
16.95*** 12.84*** 8.08*** 5.57*** 4.16*** 1.36** -1.86*** - -
(2.07) (1.77) (1.29) (1.01) (0.84) (0.64) (0.64)
111 109 109 113 118 135 135
Ratio of female to male, secondary enrolment (%)
3.40 12.40*** 12.26*** 9.09*** 9.60*** 4.23** 2.83* -6.43*** -6.12***
(2.60) (3.09) (3.30) (2.90) (2.19) (1.84) (1.59) (1.33) (1.25)
102 91 92 94 96 120 121 121 104
Ratio of female to male, tertiary enrolment (%)
4.12 7.23 -14.65** - -26.11*** -15.95*** -24.83*** -22.09***
(4.13) (4.38) (5.80) (6.20) (6.05) (5.73) (6.51)
83 75 75 101 111 107 95
Proportion of seats held by women in national parliaments (%)
- - - -3.51*** - -0.77 -1.68 -4.20*** -5.85***
(1.03) (0.95) (1.08) (1.11) (1.20)
99 137 145 145 144
Panel (c): reduce child mortality
Mortality rate, infant (per 1,000 live births)
-56.64*** -47.57*** -36.13*** -29.26*** -23.19*** -11.33*** -10.36*** -8.96*** -8.01***
(3.46) (3.00) (2.50) (2.33) (2.09) (2.10) (1.87) (1.58) (1.48)
106 113 121 122 133 145 144 144 144
Mortality rate, under-5 (per 1,000 live births)
-97.37*** -79.75*** -56.02*** -42.92*** -33.33*** -12.39*** -11.32*** -10.24*** -9.40***
(6.23) (5.20) (4.15) (3.86) (3.51) (3.70) (3.23) (2.58) (2.30)
105 112 121 122 133 145 144 144 144
Panel (d): improve maternal health
Contraceptive prevalence (% of women aged 15–49)
5.90* - 12.78*** 3.01 4.23 - -17.30*** - -
-(3.06) (2.40) (2.57) (3.19) (3.85)
16 45 64 79 95
Notes: The dependent variable in each regression is measured as a five-year average. All regressions
control for a one-year lagged level of per capita income (log GDP) and were conducted on a sample of
developing economies (following the IMF classification). Heteroskedasticity-robust standard errors are
in parentheses; ***, ** and * indicate significance at the 1%, 5% and 10% level (two-tailed test). Literacy
rates for the most recent period are from Malaysia’s Economic Planning Unit (EPU) and refer to 2015.
Data: World Bank (2016); and, for Malaysia literacy rates during 2011-2013, EPU (2016).
Taken together, the results suggest that Malaysia’s development record is exceptional
along many dimensions. Such exceptionality is primarily related to the 1970s and
1980s and so seems to have early origins. Indeed, earlier literature indicates that
Malaysia was already ahead of other low-income countries in the pre-independence
years on a number of health outcomes and inputs.7 Also, as dependence on natural
resources appears to undermine economic development by crowding out human
capital accumulation (Gylfason, 2011), Malaysia’s early achievements in education and
health show why the country is an exception to such a resource curse argument.8
4. Pathways to development: explaining Malaysia’s progress
What explains Malaysia’s development progress? Sen (1999, chapter 2) distinguishes
between income-mediated and support-led human development. This section assesses
both types of pathway, investigating a number of potential channels the literature has
proposed.9
4.1 Methodology and data
The methodology here is similar to that in the previous section, except that here we
measure the extent of Malaysia’s deviations from the expected value of indicators
capturing each specific channel. We do so by estimating the following cross-country
regressions:
Ci = α + β1 Mi + β2 Ii + εi with i=1, . . . , N (2)
where Ci is the variable capturing a specific channel and Ii is the purchasing power
parity (PPP)-adjusted per capita income (log). The hypothesis that a specific channel
7 Infant mortality had already been declining dramatically since the Second World War
(DaVanzo and Habicht, 1986). Life expectancy was also considerably higher compared with other middle-income tropical countries (Gwatkin, 1980). At the time of independence, the life expectancy rate in Malaysia was 64 years, higher than in Brazil, Mexico and Turkey (63.2, 61.4 and 56.4 years, respectively) (Heller, 1975). Malaysia also enjoyed a lower (registered) infant mortality rate (64) compared with other middle-income countries such as Mexico and Chile (77.3 and 120, respectively) (Heller, 1975). A substantive decline in the mortality rate occurred during the interwar period, long before Malaysia’s independence (Manderson, 1996). Birth rates (fertility) also declined significantly during 1957 and 1967 (Cho et al, 1968). Malaysia's stock of medical personnel placed it well above the World Health Organisation minimum of one doctor per 10,000 and one nurse per 5000 people (Meerman, 1979). In sharp contrast to other poor countries, Malaysia's system of health administration was decentralised at independence. This, along with the extensive network of public rural clinics, gave rise to the large number of paramedics (Meerman, 1979). 8 Key reasons why resource-dependent countries grow more slowly are low public expenditure
on education relative to national income, and low levels of female schooling, and secondary-school enrolment (Gylfason, 2011). A related argument (see Kurtz and Brooks, 2011) suggests that the developmental consequences of resource wealth are conditioned by domestic human capital resources, in the absence of which the management of resources is inefficient and wasteful. 9 One view explaining Malaysia’s development progress emphasises economic growth and an
increase in labour productivity (Gomez and Jomo, 1997; EPU, 2016), while another highlights policy interventions under the auspices of the NEP (Snodgrass et al., 2002; Shari, 2000).
www.gdi.manchester.ac.uk 17
has contributed to Malaysia’s development progress suggests that the Malaysia
dummy should be statistically significant. We use as dependent variables data from the
World Bank (2016), unless otherwise indicated in the tables.
4.2 Did economic growth matter?
The importance of the income-mediated channel for the Malaysian case has long been
recognised (eg Gomez and Jomo, 1997; Naiya, 2013). However, the regressions in
Table 5 provide an econometric appreciation. They show that exceptionally high levels
of economic growth throughout 1971–95, compared with those in countries at the same
level of economic development, have facilitated poverty reduction by raising average
incomes. The poverty regressions in Table 3 reflect the significance of this channel. It
remains to be seen, however, which support channels have been most important and
how significant these have been. Indeed, many emphasise the role of social
expenditure programmes in health care and basic education as an important part of
Malaysia's strategy for reducing poverty (eg Hammer et al, 1995; Snodgrass et al,
2002, Shari, 2000). 10 In the rest of this section, therefore, we concentrate on the
significance of such pathways to development.
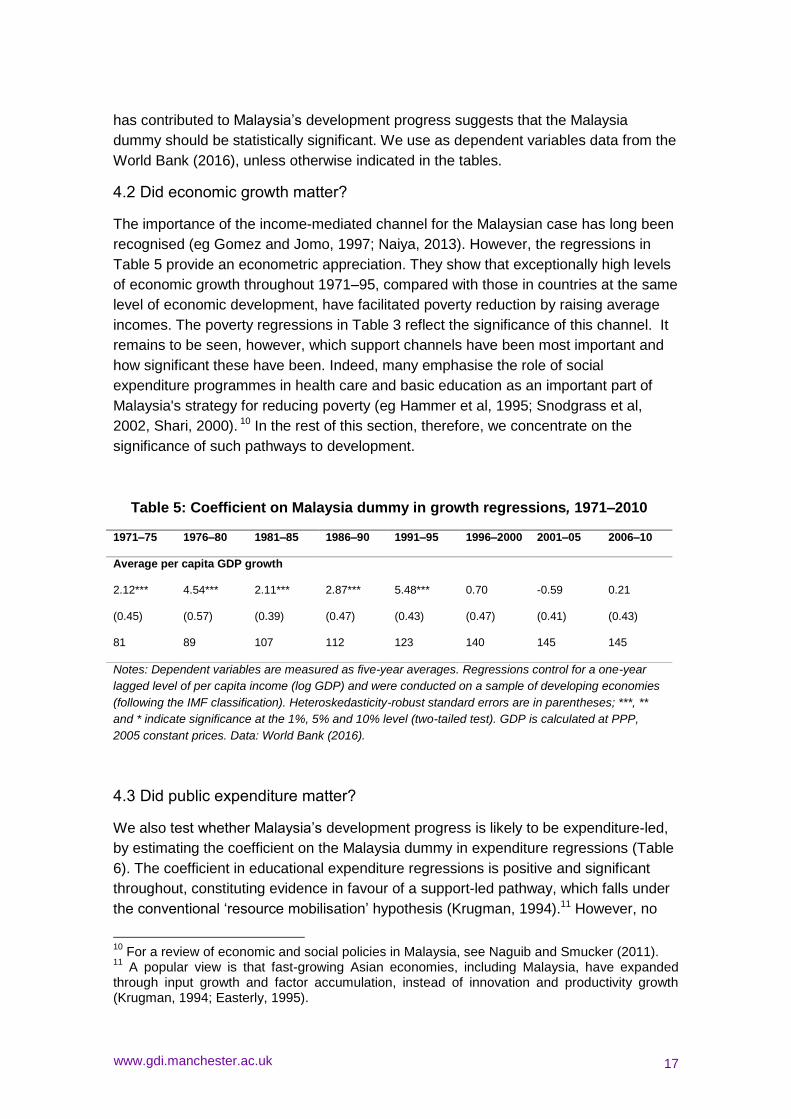
Table 5: Coefficient on Malaysia dummy in growth regressions, 1971–2010
1971–75 1976–80 1981–85 1986–90 1991–95 1996–2000 2001–05 2006–10
Average per capita GDP growth
2.12*** 4.54*** 2.11*** 2.87*** 5.48*** 0.70 -0.59 0.21
(0.45) (0.57) (0.39) (0.47) (0.43) (0.47) (0.41) (0.43)
81 89 107 112 123 140 145 145
Notes: Dependent variables are measured as five-year averages. Regressions control for a one-year
lagged level of per capita income (log GDP) and were conducted on a sample of developing economies
(following the IMF classification). Heteroskedasticity-robust standard errors are in parentheses; ***, **
and * indicate significance at the 1%, 5% and 10% level (two-tailed test). GDP is calculated at PPP,
2005 constant prices. Data: World Bank (2016).
4.3 Did public expenditure matter?
We also test whether Malaysia’s development progress is likely to be expenditure-led,
by estimating the coefficient on the Malaysia dummy in expenditure regressions (Table
6). The coefficient in educational expenditure regressions is positive and significant
throughout, constituting evidence in favour of a support-led pathway, which falls under
the conventional ‘resource mobilisation’ hypothesis (Krugman, 1994).11 However, no
10
For a review of economic and social policies in Malaysia, see Naguib and Smucker (2011). 11
A popular view is that fast-growing Asian economies, including Malaysia, have expanded through input growth and factor accumulation, instead of innovation and productivity growth (Krugman, 1994; Easterly, 1995).

www.gdi.manchester.ac.uk 18
such evidence is present in the case of health expenditure, which seems to be
abnormally low. Education expenditure as a share of the total development budget
increased from 6% in 1970, to 21% in 2003. During the same period, health
expenditure stagnated between 3% and 7% (UNDP, 2005).12
This exceptionally high public spending on education suggests that human-capital
accumulation could have been a key channel. Indeed, the exceptional achievements in
school enrolment and literacy, documented in Table 4, followed from the boom in
educational expenditure. Moreover, early achievements in education could have been
instrumental to creating improvements in other human development outcomes.13 The
decline in infant mortality in the 1960s and 1970s, for instance, is credited to the rise in
female schooling.14
Table 6: Coefficient on Malaysia dummy in health and education expenditure
regressions, 1971–2010
1971–75 1976–80 1981–85 1986–90 1991–95 1996–2000 2001–05 2006–10
Public spending on education, total (% of GDP)
2.09*** 1.81*** 1.91*** 1.65*** - 1.01*** 2.27*** -0.15
(0.19) (0.20) (0.25) (0.51) (0.33) (0.30) (0.24)
70 78 78 22 117 114 106
Public spending on health, total (% of GDP)
- - - - -1.72*** -1.76*** -1.40*** -1.58***
(0.19) (0.19) (0.18) (0.21)
N 129 145 145 144
Notes: Both types of public expenditures are expressed as a share of GDP and measured as five-year
averages. Regressions control for the one-year lagged level of per capita income (log GDP) and were
conducted on a sample of developing economies (following the IMF classification). Heteroskedasticity-
robust standard errors are in parentheses; ***, ** and * indicate significance at the 1%, 5% and 10%
level (two-tailed test). The share of public spending on education for 1986–90 is from EPU.Data: World
Bank (2016); and, for public spending, EPU (2016).
12
However, the emphasis on education was in place in the pre-1970 years. The government guaranteed six years of free basic education three years after independence and had extended that to nine by late 1960s (Ahmad et al, 2003). 13
It has been argued that East Asian countries that invested heavily in health and education in their pre-reform period entered a virtuous cycle of high human development and high economic growth (Ranis and Stewart, 2012). 14
For example, there is evidence based on household survey data from the 1970s that increases in maternal education level explained nearly half the reduction in the infant mortality rate over the period (DaVanzo and Habicht, 1986).

www.gdi.manchester.ac.uk 19
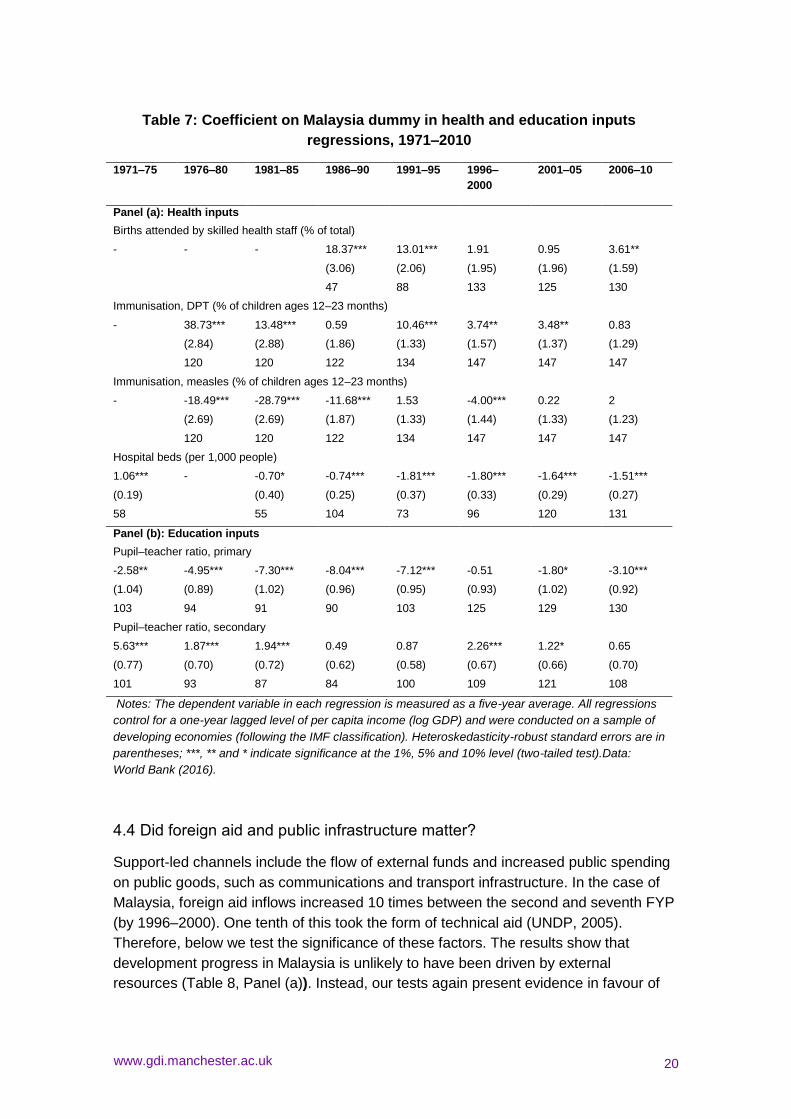
As a further test of the support-led hypothesis, we examine whether Malaysia’s
development progress has been driven by high accumulation of inputs in a range of
social sectors. Table 6 presents estimates of the coefficient on the Malaysia dummy in
health and education inputs regressions. The results suggest that redistributive
channels may be partly responsible, targeting specific aspects of human capital
accumulation. In particular, the evidence suggests that a strategy of human capital
accumulation in the form of education may have been the chosen redistributive channel
since the 1970s. Education inputs regressions suggest that public resources may have
gone into inputs for primary school education, rather than for secondary school
education.
However, evidence on health inputs is mixed. In the face of abnormally low health
public spending (Table 6), Malaysia focused on specific health inputs (Table 7).15 In
terms of hospital beds per 1,000 people, it systematically underperformed compared
with other similar income countries at all times. The immunisation (measles) rate also
did not improve significantly. Although immunisation programmes started in 1960s,
coverage against disease was limited. Coverage for measles increased from 70% in
1990 to 88% in 2000 (UNDP, 2005). However, the country did significantly better in
terms of births attended by skilled health staff. This was partly to the result of a shift to
institutional deliveries from the mid-1980s, which jumped from 50% in 1980 to 95% in
2000 (UNDP, 2005). In addition, the positive and significant coefficient in ‘Births
attended by skilled health staff (% of total)’ regressions, at least in the 1980s, is partly
driven by the fact that in 1969 Malaysia had a more favourable ratio of population per
unit of nursing and midwifery personnel, even when compared with other countries with
similar income levels (eg Brazil) or richer (eg Chile) (Heller, 1975).16
15
However, this is primarily because we do not have data on health expenditure for the 1970s. Soon after independence in 1957, the Malaysian government increased budgetary allocations to combat endemic diseases, introduced preventive medical care and extended health services (including maternal–child health care) in rural locations (Abu Bakar, 1981). 16
However, Brazil and Chile had more physicians per person.
www.gdi.manchester.ac.uk 20
Table 7: Coefficient on Malaysia dummy in health and education inputs
regressions, 1971–2010
1971–75 1976–80 1981–85 1986–90 1991–95 1996–
2000
2001–05 2006–10
Panel (a): Health inputs
Births attended by skilled health staff (% of total)
- - - 18.37*** 13.01*** 1.91 0.95 3.61**
(3.06) (2.06) (1.95) (1.96) (1.59)
47 88 133 125 130
Immunisation, DPT (% of children ages 12–23 months)
- 38.73*** 13.48*** 0.59 10.46*** 3.74** 3.48** 0.83
(2.84) (2.88) (1.86) (1.33) (1.57) (1.37) (1.29)
120 120 122 134 147 147 147
Immunisation, measles (% of children ages 12–23 months)
- -18.49*** -28.79*** -11.68*** 1.53 -4.00*** 0.22 2
(2.69) (2.69) (1.87) (1.33) (1.44) (1.33) (1.23)
120 120 122 134 147 147 147
Hospital beds (per 1,000 people)
1.06*** - -0.70* -0.74*** -1.81*** -1.80*** -1.64*** -1.51***
(0.19) (0.40) (0.25) (0.37) (0.33) (0.29) (0.27)
58 55 104 73 96 120 131
Panel (b): Education inputs
Pupil–teacher ratio, primary
-2.58** -4.95*** -7.30*** -8.04*** -7.12*** -0.51 -1.80* -3.10***
(1.04) (0.89) (1.02) (0.96) (0.95) (0.93) (1.02) (0.92)
103 94 91 90 103 125 129 130
Pupil–teacher ratio, secondary
5.63*** 1.87*** 1.94*** 0.49 0.87 2.26*** 1.22* 0.65
(0.77) (0.70) (0.72) (0.62) (0.58) (0.67) (0.66) (0.70)
101 93 87 84 100 109 121 108
Notes: The dependent variable in each regression is measured as a five-year average. All regressions
control for a one-year lagged level of per capita income (log GDP) and were conducted on a sample of
developing economies (following the IMF classification). Heteroskedasticity-robust standard errors are in
parentheses; ***, ** and * indicate significance at the 1%, 5% and 10% level (two-tailed test).Data:
World Bank (2016).
4.4 Did foreign aid and public infrastructure matter?
Support-led channels include the flow of external funds and increased public spending
on public goods, such as communications and transport infrastructure. In the case of
Malaysia, foreign aid inflows increased 10 times between the second and seventh FYP
(by 1996–2000). One tenth of this took the form of technical aid (UNDP, 2005).
Therefore, below we test the significance of these factors. The results show that
development progress in Malaysia is unlikely to have been driven by external
resources (Table 8, Panel (a)). Instead, our tests again present evidence in favour of
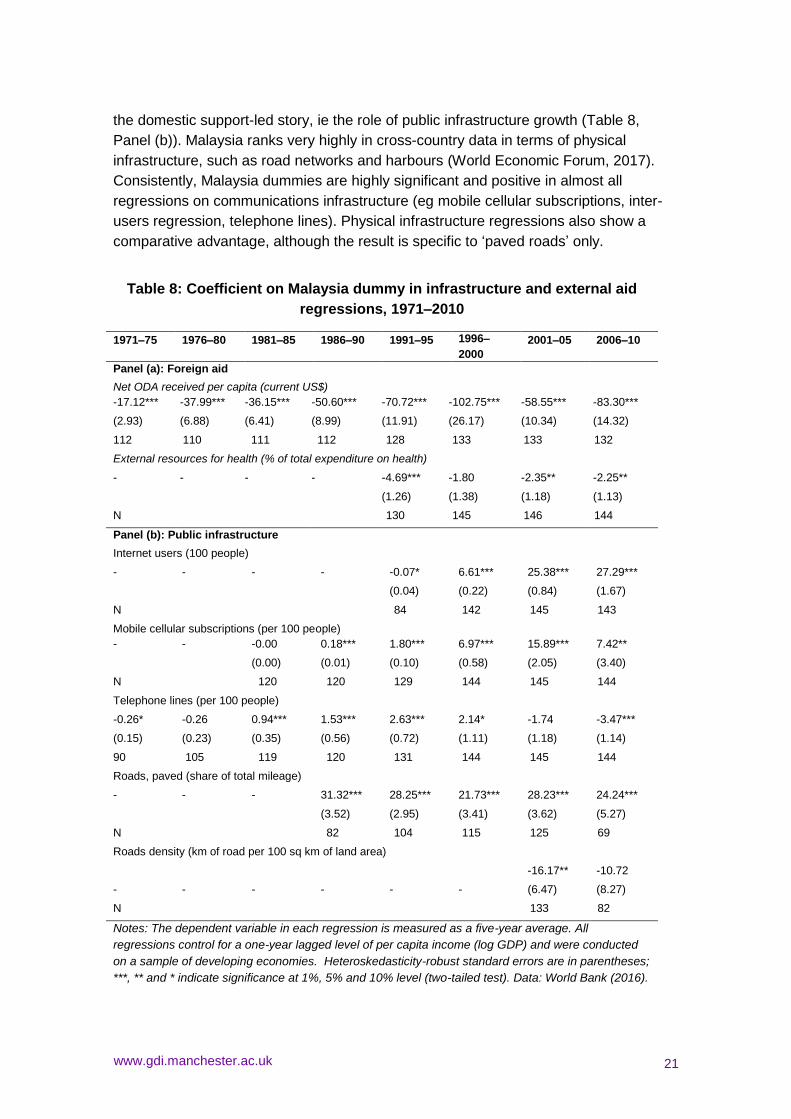
www.gdi.manchester.ac.uk 21
the domestic support-led story, ie the role of public infrastructure growth (Table 8,
Panel (b)). Malaysia ranks very highly in cross-country data in terms of physical
infrastructure, such as road networks and harbours (World Economic Forum, 2017).
Consistently, Malaysia dummies are highly significant and positive in almost all
regressions on communications infrastructure (eg mobile cellular subscriptions, inter-
users regression, telephone lines). Physical infrastructure regressions also show a
comparative advantage, although the result is specific to ‘paved roads’ only.
Table 8: Coefficient on Malaysia dummy in infrastructure and external aid
regressions, 1971–2010
1971–75 1976–80 1981–85 1986–90 1991–95 1996–
2000
2001–05 2006–10
Panel (a): Foreign aid
Net ODA received per capita (current US$)
-17.12*** -37.99*** -36.15*** -50.60*** -70.72*** -102.75*** -58.55*** -83.30***
(2.93) (6.88) (6.41) (8.99) (11.91) (26.17) (10.34) (14.32)
112 110 111 112 128 133 133 132
External resources for health (% of total expenditure on health)
- - - - -4.69*** -1.80 -2.35** -2.25**
(1.26) (1.38) (1.18) (1.13)
N 130 145 146 144
Panel (b): Public infrastructure
Internet users (100 people)
- - - - -0.07* 6.61*** 25.38*** 27.29***
(0.04) (0.22) (0.84) (1.67)
N 84 142 145 143
Mobile cellular subscriptions (per 100 people)
- - -0.00 0.18*** 1.80*** 6.97*** 15.89*** 7.42**
(0.00) (0.01) (0.10) (0.58) (2.05) (3.40)
N 120 120 129 144 145 144
Telephone lines (per 100 people)
-0.26* -0.26 0.94*** 1.53*** 2.63*** 2.14* -1.74 -3.47***
(0.15) (0.23) (0.35) (0.56) (0.72) (1.11) (1.18) (1.14)
90 105 119 120 131 144 145 144
Roads, paved (share of total mileage)
- - - 31.32*** 28.25*** 21.73*** 28.23*** 24.24***
(3.52) (2.95) (3.41) (3.62) (5.27)
N 82 104 115 125 69
Roads density (km of road per 100 sq km of land area)
-16.17** -10.72
- - - - - - (6.47) (8.27)
N 133 82
Notes: The dependent variable in each regression is measured as a five-year average. All
regressions control for a one-year lagged level of per capita income (log GDP) and were conducted
on a sample of developing economies. Heteroskedasticity-robust standard errors are in parentheses;
***, ** and * indicate significance at 1%, 5% and 10% level (two-tailed test). Data: World Bank (2016).

www.gdi.manchester.ac.uk 22
5. Origins of Malaysian progress: did income inequality and government
quality matter?
The results suggest that support-led channels were important, as well as income-
mediated ones. Indeed, the evidence provided above suggests that Malaysia’s social
spending has influenced selected education and health inputs, where the country
enjoyed abnormally high levels. The results also suggest that support-led channels
worked by providing an early advantage in physical and communications
infrastructures. Last, they rule out the notion that foreign aid has played a major role.
This section investigates which structural, long-term factors may have facilitated this.
The evidence on the importance of support-led channels implies that Malaysia’s
development progress has been “domestically engineered”. This requires two key
ingredients: a good deal of domestic political support for reforms and a state that is
institutionally capable of delivering goods and services, as well as implementing
policies. Since we have also seen that growth and human development in Malaysia
had early origins, this calls for more analysis of the structural factors that contributed to
creating such political and institutional conditions for effective development policy. In
this section, we explore the role of inequality and of the quality of government.
5.1 On the role of inequality
Societies with low levels of economic inequality are less likely to see heightened social
conflict, making it easier to build coalitions supporting economic and social reforms
(Rodrik, 1999). This may therefore be one structural factor that facilitated early
development progress. Historically, income inequality in the East Asian countries was
much lower than in other developing regions in the 1960s (World Bank, 1993). Does
Malaysia fall in line with this regional characteristic? The role of inequality is
challenging to test. It is well known that comparable data across countries are rare and
may generate imprecise comparisons (see Atkinson and Brandolini, 2001).
Nonetheless, we resort to a popular database that attempts to adjust available data for
methodological differences across countries (Solt, 2016). Gini index regressions, in
Table 9, suggest that Malaysia was an unusually unequal country in the 1970s (given
its level of economic development). Such exceptionality disappears in the late 1980s,
and it seems even reversed in its more recent history.
Apart from cross-country regressions, we also look at case study historical evidence
from the region, to check whether inequality is indeed historically low or high,
compared with other countries. The related literature on the origins of inequality
indicates that Malaysia starts as quite an unequal economy, both among the Asian
economies and within the wider colonial landscape. As a colony, Malaysia is seen as
an exception among the ‘peasant colonies’, because of its plantation economy.
Although Europeans constituted only a small minority of the population (unlike ‘New

www.gdi.manchester.ac.uk 23
Europes’ and ‘settler colonies’), said minority did not just represent administrators and
tax collectors (as in most ‘peasant colonies’); it also appropriated key assets related to
the production of tin and rubber, thereby generating high levels of inequality (Angeles,
2007). Indeed, land inequality seemed to be a great deal higher than in colonies
sharing similar historical and geographical characteristics, presenting the highest post-
independence level in Asia (Frankema, 2010). Therefore, it seems unlikely that
abnormally low inequality is the structural factor kick-starting subsequent development
progress in the 1970s. 17
Table 9: Coefficient on Malaysia dummy in inequality regressions, 1971–2010
1971–75 1976–80 1981–85 1986–90 1991–95 1996–
2000
2001–05 2006–10
Inequality channel
Gini index, SWIID (est market income)
1.77 10.81*** 11.71*** 3.26** -1.60 -1.33 -3.36*** -6.69***
(1.90) (1.66) (1.65) (1.35) (1.17) (1.21) (1.18) (1.20)
48 46 50 62 83 108 113 96
Notes: The dependent variable in each regression is measured as a five-year average. All regressions
control for a one-year lagged level of per capita income (log GDP) and are on a sample of developing
economies. Heteroskedasticity-robust standard errors are in parentheses; ***, ** and * indicate
significance at 1%, 5% and 10% level (two-tailed test). Data: Standardised World Income Inequality
Dataset - SWIID (http://fsolt.org/swiid) and World Bank (2016).
5.2 On the quality of government
What about the role of quality of government? Some have suggested that efficient
bureaucracy and transparent economic governance were central to Malaysia’s
development success (Naguib and Smucker, 2011; Slater, 2012; Shah, 2017).18
17
However, given the wide range of market and non-market transfers specific to Bumiputeras, income inequality reduction (particularly across race groups) is likely to be an important, though not necessarily dominant, channel of income poverty reduction during the 1980s. National-level evidence shows that income inequality, as measured by the Gini index, peaked in 1976 and declined significantly thereafter to 1990, rising again only in the 1990s, partly because of liberalisation, deregulation and privatisation and impediments to the process of internal migration since the late 1980s (Ragayah, 2008). Recent trends show that, although between 1992 and 2009 there has been a slight decline in income inequality, income inequality remains relatively high by Asian standards (Kanbur et al, 2014). Country-specific evidence indicates that overall economic growth, instead of ethnic inequality reduction, has been the principal driver of poverty reduction in Malaysia. Growth in mean household income accounted for three-fourth of the reduction in absolute poverty in Malaysia since mid-1980s, with only a quarter owing to falling inequality (Ravallion, 2019). 18
Others emphasise how Malaysia’s institutional setting played a key role in successfully managing ethnic conflict (Horowitz, 1989). A third view is that Malaysia did not have a capable
www.gdi.manchester.ac.uk 24
Recent accounts in comparative economic development emphasise state capacity as a
key ingredient for poverty reduction (Ravallion, 2009). One argument emphasises that
states can reduce poverty when their institutions are able to raise revenues to finance
policies and provide a secure contractual environment that stimulates economic growth
(Besley and Persson, 2011). A second argument has noted the capacity of states to
resolve coordination failures (Bardhan, 2016) and to administer their territory in order to
deliver goods and services to their citizens (Evans and Rauch, 1999). Did Malaysia
have an advantage in this respect?
Table 10 presents coefficients on the Malaysia dummy from regressions that use a
range of quality-of-government indicators capturing key aspects of state capacity: legal,
administrative and fiscal. Holding differences in per capita income constant across
countries, in most cases governance quality is plausibly one of the channels behind
Malaysia’ poverty eradication. In particular, the country seems to fit familiar Asian
development stories, as it does better than other countries along governance
dimensions closely linked to state capacity. For example, on the ‘Quality of legal
system’ measure, Malaysia has been systematically ahead of the others since the early
1970s; the same goes for ‘Bureaucratic quality’ since the 1980s. Importantly, its state
also seems to have had an early advantage in the ability to raise revenues, as ‘Total
tax revenues/GDP’ regressions indicate. This may contribute to explaining the success
of the NEP, which rested on bureaucratic competence to manage a large pool of
federal funds and direct them to poor Malays. The government was required to play a
much bigger and more direct role requiring targeted public expenditure, on the one
hand, and a concentration on macroeconomic growth, on the other. Both of these
required strong fiscal capacity. For instance, federal expenditure and lending together
were equal to 32.6% of GNP in 1972, up from 16.6% in 1960 (Meerman, 1979), while
federal expenditure directly related to poverty, rural and human development together
accounted for 25.6% of GNP in 1972 (Meerman, 1979).
indigenous bureaucracy compared to its East Asian competitors and therefore the state could not play a dominant role in national economic development (Park, 2000).

www.gdi.manchester.ac.uk 25
Table 10: Coefficient on Malaysia dummy in quality of government regressions,
1970–2010 1970 1975 1980 1985 1990 1995/96 2000 2005 2010
Quality of legal system and property rights protection (Gwartney et al, 2013)
2.06*** 1.26*** 2.49*** 1.80*** 1.78*** 1.11*** 0.02 1.30*** 1.25***
(0.35) (0.22) (0.21) (0.18) (0.20) (0.13) (0.15) (0.13) (0.12)
23 23 59 75 78 87 87 103 106
Bureaucratic quality (ICRG, 2012, Table 3b)
- - - 0.33*** 0.07** -0.04 0.22*** 0.24*** 0.24***
(0.03) (0.03) (0.03) (0.02) (0.02) (0.02)
N 81 92 93 102 102 102
Total tax revenues / GDP (ICTD, 2015)
- - 0.06*** 0.06*** 0.07*** 0.03*** 0.01 -0.02* -0.02*
(0.01) (0.01) (0.01) (0.01) (0.01) (0.01) (0.01)
N 81 91 107 129 133 134 128
Constraints on the executive, PolityIV (Teorell et al, 2017)
3.25*** 1.92*** 2.32*** 2.08*** 1.51*** 0.95*** -0.55* -0.75** -0.25
(0.24) (0.21) (0.24) (0.28) (0.33) (0.32) (0.33) (0.34) (0.30)
90 95 102 101 102 107 124 124 124
Democracy, Vanhanen’s Index (Teorell et al,
2017)
4.88*** 7.57*** 4.83*** 5.95*** 4.40*** 3.73*** -3.40** -2.31* -
(0.76) (0.59) (0.68) (0.77) (1.05) (1.24) (1.37) (1.34)
71 97 110 115 116 124 142 145
Notes: The dependent variable in each regression is an indicator of quality of government. All
regressions control for a one-year lagged level of per capita income (log GDP) and were conducted on a
sample of developing economies (following the IMF classification). Heteroskedasticity-robust standard
errors are in parentheses; ***, ** and * indicate significance at 1%, 5% and 10% level (two-tailed test).
Last, the remaining two sets of regressions show that Malaysia had an early advantage
in terms of political institutions providing accountability mechanisms for the ruling elites,
which is an enabling condition to develop effective states as incumbents face a
stronger incentive to invest in state capacity if subject to a greater degree of
constitutional limits on the exercise of their prerogatives (Besley and Persson, 2011).
However, there is also evidence of an emerging ‘political institutions deficit’, in terms of
both accountability and representativeness. This needs addressing to avoid impairing
state capacity in the future.
5.3 Understanding the long-term origins of Malaysian progress
The results in Table 10 revealed a unique historical advantage for Malaysia. Compared
with other economies of similar income level, the country has been significantly ahead
since the 1970s or 1980s in a set of governance quality indicators capturing state legal,
fiscal and administrative capacity. Where did this early advantage come from? In this
section, we elaborate on its origins. As we merely scratch the surface here, we hope
www.gdi.manchester.ac.uk 26
this will serve as a stimulus to further research on the complexity of the historical
experience that laid the foundations of subsequent progress.
Analysing Malaysia’s economic history, Sultan Raja Nazrin Shah puts forward one
answer as to why Malaysia’s pre-independence history could be an important part of
the explanation:
the British had put in place institutions and systems that provided significant
support for economic growth and social development post-independence.
These include a national civil service with capacity for planning and programme
implementation, a system of rudimentary education for the masses, and premier
schools for the elite, a criminal justice system, social and physical infrastructure,
as well as institutes that contributed to productivity gains such as the Rubber
Research Institutes. (Shah, 2017, p 178)
The recent literature on the sources of economic development does indeed suggest
two channels through which colonial history contributes to long-term differences. The
first is political: colonisation led to the formation of developmental institutions where
Europeans encountered sanitary conditions (environments with a low risk of disease)
suitable for large-scale settlement (Acemoglu et al, 2001). In the absence of such
favourable conditions, only a few settled, leaving behind institutions that facilitated rent
extraction. Malaysia falls into the category of ‘extractive colonies’. The second channel
relates to the formation of human capital, whereby the colonial rulers brought new
knowledge and human capital-creating institutions (eg. schooling and health
technology and management practices). According to this view, European settlers
directly and immediately added human capital skills to the colonies and also had long-
run effects on human capital accumulation (Glaeser et al, 2004). Accordingly, having a
sizable proportion of Europeans during colonisation would be a precursor to successful
economic development (Easterly and Levine, 2016). However, Malaysia did not see
any sizable European settlement, even though it had mortality rates favourable to such
long-term settlement.19 Despite the absence of mass European settlements in pre- or
post-independence Malaysia, we conjecture that its colonial past still significantly
conditioned poverty reduction and economic growth in the country. We discuss three
channels through which it is likely to have materialised.
First, colonial elites may have contributed to state formation and state capacity. As
most of the large-scale businesses remained British-owned and export-oriented, even
after independence, colonial and post-colonial rulers ensured the legal and market
institutions would be protective of economic rights, and supportive of foreign capital
19
Data on mortality rates from Curtin (1989) and Acemoglu et al (2001) report low settler mortality in Malaysia, at 17.7 x 1000 people, similar to that in the USA and Australia. Furthermore, the share of population of the settlers reported in Malaysia in 1900 was nil (see Table A5 in Acemoglu et al, 2001). Similarly, the share of population of European descent in 1975 was 0.00. Given this low mortality rate, Acemoglu et al's reasoning connecting high numbers of settlers to good institutions (through a favourable disease-free environment) seems disproven in the case of Malaysia.
www.gdi.manchester.ac.uk 27
and business interests in the post-colonial era.20 As well as leaving behind legal
institutions, Malaysia’s colonisers significantly influenced the process of state
formation. Pre-colonial British Malaya was fragmented and run by feudal
arrangements. The need to coordinate financial arrangements and colonial business
interests motivated the formation of the Federated Malay States (FMS) – comprising
the Malay States of Pahang, Selangor, Perak and Negeri Sembilan, in 1896 – and led
to a centralised administration and eventual formation of the Malayan Union in 1945
(Noh, 2010). British-appointed administrators ran the civil administration to mobilise
state revenue and expenditure. They replaced indigenous administrative structures
with European institutions and took away the revenue collection power of the local
chieftains (Ahmad et al, 2003). Before the Second World War, Malaysia did not have a
fully functional system of direct taxation. Following reforms in civil administration and
tax system development initiated by the British, Malaysia overtook some of its regional
neighbours in terms of the ability to collect direct taxes (Slater, 2012). This could be an
important explanation for the exceptional state capacity at the time of independence.
Second, bureaucratic competence may have developed as a result of the colonial
administration. The administration of state institutions was under the complete control
of expatriate bureaucrats; the Malays only served in junior official positions (Esman,
1994).21 Valuable administrative human capital may have been transmitted to the
native Malays who, instead of Indians and Chinese, took over positions at the local,
state and federal level administrative offices after independence (Tillman, 1964).22
Even in the post-independence years, expatriate officers led the main implementing
agency of the NEP, the Economic Planning Unit (EPU). The colonial era, therefore, left
behind significant administrative knowhow that proved critical for successful
management of the economic transformation process during the NEP era.
Finally, even though the British rulers themselves did not settle in large number,
significant innovations in health care administration occurred under colonial rule, in
response to perceived political and economic consequences of ill- health (Manderson,
1996). British owners relied entirely on an immigrant workforce in order to mobilise the
economy. Ethnic identity was institutionalised by associating ethnicity with economic
function, such that, instead of native Malays, only migrant Chinese and Indians were
employed in the extractive industries (Noh, 2010). Protection against tropical diseases
was critical to the success of the British-owned firms that operated in large numbers for
at least two decades in post-independence Malaysia. In pre-colonial Malaysia, natives
20
According to Shah (2017, p 163), “both at the time of independence and up to 1970, foreigners owned up to 62 per cent of the share capital in limited companies overall, with 75 per cent in the agriculture sector and 73 per cent in the mining sector”. 21
Between 1950 and 1957, 79.6% and 61%, respectively, of the officers of the Malayan Civil Service (MCS) were British; in the case of the senior civil service, the shares were 92% and 61%, respectively (Puthucheary, 1978). 22
Many British trained local bureaucrats also entered politics; approximately half of those contested in the 1955 elections were Malay ex-civil servants (Puthucheary 1978). In addition, all entrants into the Judicial and Legal Service (JLS) at the time of Merdeka (ie independence) were graduates from British universities and the Inns of Courts (Ahmad et al, 2003). The JLS continued to be dominated by British-qualified officers until the mid-1990s.

www.gdi.manchester.ac.uk 28
as well as migrants used to rely on traditional indigenous medicine for healthcare.
However, communicable diseases continued to pose considerable threats, particularly
to migrant settlers.23 Between 1901 and 1931, there was a boom in public expenditure
on health, leading to the spread and development of Western health services,
sanitation facilities and medical practices (Ooi, 1991).24 Hospitals, which had previously
been concentrated in the towns, were built in the inland state capitals. This coincided
with evidence of declining mortality rates by the 1930s (Fernandez et al, 1976; Saw,
1988).25 Favourable health statistics at independence and improvements between
1900 and 1930 are likely to have followed from the spread of health practices that
brought the mortality rate down among non-European settlers (migrant workers in
rubber and tin plantations). For instance, the decline in the mortality rate during the
inter-war period was attributed to the improvement in preventive health services
(Manderson, 1996). These early developments in the health sector may have paved
the way for rapid improvements in mortality and life expectancy statistics in the 1960s,
the first decade of independence.26
For the above reasons, Malaysia potentially serves as a possible exception to the
thesis propagated by Acemoglu et al (2001) and Easterly and Levine (2016). The
country’s unique history, however, also implies that it does not necessarily offer a
replicable model for other resource-rich or ethnically fractionalised countries.
6. Conclusions
As it is frequently described as a success case of growth with redistribution,
challenging conventional explanations, we have re-examined Malaysia’s development
progress and offered some explanations for its achievements. Using aggregate indices
of education, health, poverty and gender equality outcomes, we first investigated the
hypothesis that Malaysia’s progress has been exceptional when compared to countries
with similar level of economic development. Cross-country regressions support this
hypothesis. Malaysia halved the incidence of absolute poverty 15 years before the
MDGs were introduced. The sharpest reduction occurred during 1970–85, which
coincided with a period of rapid economic growth and implementation of the NEP,
targeting the poorer segment of the population. The early reduction in poverty is
exceptional, if contrasted with the experience of other developing countries during the
1970s. In comparison, poverty declined at a significantly lower rate during 1985–2000.
23
For a discussion of colonial era death rates among migrant workers, particularly those in rubber plantations, see Ooi (1963), Cameron (1965). 24
According to reports in the Straits Settlements Blue Books (cited in Ooi, 1991), expenditure on health care soared by 152% in fiscal terms between 1877 and 1901. 25
Manderson (1996) points out one source of potential bias arising because of the inflow of young migrant workers which could deflate the mortality rate. But it should be noted that the infant mortality rate, which was unaffected by migrant flows, was also on the decline. The birth rate was underestimated by 10.24% for the period 1947 to 1957 but, by 1967, birth registration was 95% complete (Saw, 1964). 26
For a comparative analysis of mortality trends in low-income countries, see Gwatkin (1980).
www.gdi.manchester.ac.uk 29
Malaysia also enjoyed a significantly lower rate of infant and child mortality and higher
female school enrolment during the 1970s and 1980s, compared with other developing
countries at similar income levels, showing that progress in human development had
early origins.
When it comes to investigating the channels for progress, further tests have shown that
support-led mechanisms were important, as well as income-mediated ones. In
particular, Malaysia’s social spending has had an effect through selected education
and health inputs, allowing the country to enjoy abnormally high levels of these. The
results also suggest that support-led channels worked through an early advantage in
physical and communication infrastructures. In addition, since growth and human
development in Malaysia have early origins, we explored which structural factors may
have contributed to creating favourable conditions for effective development policy. We
found that the administrative, legal and fiscal capacity of the Malaysian state were
critical to the successful implementation of large-scale poverty programmes and
growth-enhancing policies, and so may explain the country’s progress in human
development during 1970–2010. This, in turn, may have resulted from favourable initial
conditions at the time of independence, including human capital channels. Unlike other
success cases in Asia, we found that favourable conditions related to low levels of
inequality did not materialise.
Last, as we have highlighted the possible historical origins of Malaysia’s development
experience, more research is needed on the quality of state institutions during British
rule and their impact on the quality of government in post-independence Malaysia.
Indeed, the country’s early advantage has eroded considerably in recent years and it
performs poorly in terms of quality of political institutions. Equally, as emphasised by
Shah (2017), a comparative analysis of Malaya’s economic growth, institutional
developments and social progress during the colonial era vis-à-vis other British
colonies in Asia would be informative.

www.gdi.manchester.ac.uk 30
References
Acemoglu, D., Johnson, S. and Robinson, J.A. (2001). ‘The colonial origins of comparative development: an empirical investigation’. American Economic Review 91, 1369–1401.
Abu Bakar, N.L. (1981). Malaysia: Population and Development. Kuala Lumpur: National Family Planning Board.
Ahmad, A.S., Mansor, N. and Ahmad, A.K. (2003). The Malaysian Bureaucracy: Four Decades of Development. Kuala Lumpur: Pearson Malaysia.
Alesina, A., Devleeschauwer, A., Easterly, W., Kurlat, S. and Wacziarg, R. (2003). ‘Fractionalization’. Journal of Economic Growth 8, 155–194.
Ang, J.B. and McKibbin, W.J. (2007). ‘Financial liberalization, financial sector development and growth: evidence from Malaysia’. Journal of Development Economics 84, 215–233.
Angeles, L. (2007). ‘Income inequality and colonialism’. European Economic Review 51, 1155–1176.
Atkinson, A.B. and Brandolini, A. (2001). ‘Promise and pitfalls in the use of “secondary” data-sets: income inequality in OECD countries as a case study’. Journal of Economic Literature 39, 771–799.
Baer, W., Miles, W.R. and Moran, A.B. (1999). ‘The end of the Asian myth: why were the experts fooled?’. World Development 27, 1735–1747.
Bardhan, P. (2016). ‘State and development: the need for a reappraisal of the current literature’. Journal of Economic Literature 54, 862–892. doi: 10.1257/jel.20151239.
Besley, T. and Persson, T. (2011). Pillars of Prosperity: The Political Economics of Development Clusters. Princeton NJ: Princeton University Press.
Booth, A. (1999). ‘Initial conditions and miraculous growth: why is South East Asia different from Taiwan and South Korea?’. World Development 27, 301–321.
Cameron, P.C. (1965). Our Tropical Possessions in Malayan India. Kuala Lumpur: Oxford University Press.
Casey, G. and Owen, A. (2014). ‘Inequality and fractionalization’. World Development 56(C), 32–50.
Cho, L.-J., Palmore, J.A. and Saunders, L. (1968). ‘Recent fertility trends in West Malaysia’. Demography 5, 732–744.
Collier, P. (2008) The Bottom Billion. Oxford: Oxford University Press.
Commission on Growth and Development (2008). The Growth Report: Strategies for Sustained Growth and Inclusive Development. Washington DC: World Bank.
Curtin, P.D. (1989). Death by Migration: Europe’s Encounter with the Tropical World in the Nineteenth Century. New York: Cambridge University Press.
Dadzie, R.B. (2013). ‘Economic development and the developmental state: assessing the development experiences of Ghana and Malaysia since independence’. Journal of Developing Societies 29, 123–154.
www.gdi.manchester.ac.uk 31
DaVanzo, J. and Habicht, J.P. (1986). ‘Infant mortality decline in Malaysia, 1946–1975: the roles of changes in variables and changes in the structure of relationships’. Demography 23, 143–160.
Demery, L. and Demery, D. (1991). ‘Poverty and macroeconomic policy in Malaysia, 1979–1987’. World Development 19, 1615–1632.
Doraisami A. (2015). ‘Has Malaysia really escaped the resource curse? A closer look at the political economy of oil revenue management and expenditures’. Resources Policy 45, 98-108.
Easterly, W. (1995). ‘Explaining miracles: growth regressions meet the Gang of Four’. In National Bureau of Economic Research (NBER), Growth Theories in Light of the East Asian Experience, Vol 4. (pp 267–299). Cambridge MA: NBER.
Easterly, W. and Levine, R. (2016). ‘The European origins of economic development’. Journal of Economic Growth 21, 225–257.
Economic Planning Unit (EPU), Malaysia (2016). Malaysia Millennium Development Goals 2015. Kuala Lumpur: United Nations Country Team, Malaysia.
Edwards, J. (2005). The Malaysian Anomaly: Understanding the Consequences of Affirmative Action in the Developing World. Seattle WA: University of Washington.
Esman, M. (1994). Ethnic Politics. Ithaca NY: Cornell University Press.
Evans, P.B. and Rauch, J.E. (1999). ‘Bureaucracy and growth: a cross-national analysis of the effects of “Weberian” state structures on economic growth’. American Sociological Review 64, 748–765. doi: 10.1177/0038038507076620.
Fernandez, D., Hawley, A.H. and Pridaza, S. (1976). The Population of Malaysia. Kuala Lumpur: Malaysia Department of Statistics.
Frankel, J.A. (2012). The Natural Resource Curse: A Survey of Diagnoses and some Prescriptions. Working Paper Series rwp12-014. John F. Kennedy School of Government, Harvard University.
Frankema, E. (2010). ‘The colonial roots of land inequality: geography, factor endowments, or institutions?’. Economic History Review 63, 418–451.
1. Fredericks, L.J. (2011). ‘Exploring the spatial dimensions of rural development models in Malaysia 1957–2007’. Institutions and Economies 4, 47–62.
2. Glaeser, E.L., La Porta, R., Lopez-de-Silanes, F. and Shleifer, A. (2004). ‘Do institutions cause growth?’. Journal of Economic Growth 9, 271–303.
Gomez, E.T. and Jomo, K.S. (1997). Malaysia’s Political Economy: Politics, Patronage and Profits. Cambridge: Cambridge University Press.
Gwartney, J.G., Lawson, R. and Hall, J. (2013). Economic Freedom of the World: 2013 Annual Report. Vancouver: Fraser Institute, 2013.
Gwatkin, D.R. (1980). ‘Indications of change in developing country mortality trends: the end of an era?’. Population and Development Review 6, 615–644.
www.gdi.manchester.ac.uk 32
Gylfason, Th. (2011). ‘Natural resources, education, and economic development’. European Economic Review 45, 847–859.
Haggard, S. (2018). Developmental States. Cambridge: Cambridge University Press.
Hammer, J.S., Nabi, I. and Cercone, J.A. (1995). ‘Distributional effects of social sector expenditures in Malaysia, 1974–89’. In Van de Walle, D. and Nead, K. (eds), Public Spending and the Poor: Theory and Evidence (pp 521–554). Washington DC: World Bank.
Heller, P.S. (1975). Issues in the Costing of Public Sector Outputs: Public Medical Services of Malaysia. Staff Working Paper 207. Washington DC: World Bank.
Henderson, J., Hulme, D., Phillips, R. and Nur, N.A.M. (2002). Economic Governance and Poverty Reduction in Malaysia. Manchester Business School Working Paper 440.
Horowitz, D.L. (1989). ‘Cause and consequence in public policy theory: ethnic policy and system transformation in Malaysia’. Policy Sciences 22, 249–287.
ICRG (2012). International Country Risk Guide Researchers Dataset. Third edn. East Syracuse NY: Political Risk Services.
International Centre for Tax and Development (ICTD) (2015). Government Revenue Dataset 2015. [online resource available at http://www.ictd.ac/en/node/436/]. Accessed: 1 March 2016.
Isham, J., Woolcock, M., Pritchett, L. and Busby, G. (2005). ‘The varieties of resource experience: natural resource export structures and the political economy of economic growth’. World Bank Economic Review 19, 141–174.
Kanbur, R., Rhee, C. and Zhuang, J. (eds) (2014). Inequality in Asia and the Pacific: Trends, Drivers, and Policy Implications. Manila: Asian Development Bank/Routledge.
Krugman, P. (1994). ‘The myth of Asia’s miracle’. Foreign Affairs 73, 62–78.
Kurtz, M.J. and Brooks, S.M. (2011). ‘Conditioning the “resource curse”: globalization, human capital, and growth in oil-rich nations’. Comparative Political Studies 44, 747–770.
Mahadevan, R. (2006). ‘Growth with equity: the Malaysian case’. Asia-Pacific Development Journal 13, 27–52.
Manderson, L. (1996). Sickness and the State: Health and Illness in Colonial Malaya, 1870–1940. Cambridge: Cambridge University Press.
Menon, J. (2009). ‘Macroeconomic management amid ethnic diversity: fifty years of Malaysian experience’. Journal of Asian Economics 20, 25–33.
Naguib, R. and Smucker, J. (2009), When Economic Growth Rhymes with Social Development: The Malaysia Experience, Journal of Business Ethics 89, 99–113
Naiya, I.I. (2013). Structural Change, Economic Growth and Poverty in OIC Countries: The Case of Indonesia, Malaysia, Nigeria and Turkey. MPRA Working Paper. University of Munich.

www.gdi.manchester.ac.uk 33
Noh, A. (2010). Small Steps, Big Outcome: A Historical Institutional Analysis of Malaysia’s Political Economy. Asia Research Centre Working Paper 164. Perth: Murdoch University.
Ooi, J.B. (1963) Land, People and Economy in Malaya. London: Longmans.
Ooi, G.L. (1991). ‘British colonial health care development and the persistence of ethnic medicine in Peninsular Malaysia and Singapore’. Southeast Asian Studies 29, 158–178.
Park, D. (2000). ‘The dichotomy between Northeast Asian capitalism and Southeast Asian capitalism’. Journal of the Asia Pacific Economy 5, 234–254.
Perkins, D.H. (2013). East Asian Development: Foundations and Strategies. Cambridge MA: Harvard University Press.
Puthucheary, M.C. (1978). The Politics of Administration: The Malaysian Experience. New York: Oxford University Press.
Ragayah, Haji M. Z. (2008). ‘Income inequality in Malaysia’. Asian Economic Policy Review 3, 114–132.
Ranis, G. and Stewart, F. (2012). ‘Success and failure in human development, 1970–2007’. Journal of Human Development and Capabilities 13, 167–195.
Rasiah, R. and Shari, I. (2001). ‘Market, government and Malaysia’s New Economic Policy’. Cambridge Journal of Economics 25, 57–78.
Ravallion, M. (2019) ‘Ethnic Inequality and Poverty in Malaysia since 1969’. NBER Working Paper 25640, March.
Ravallion, M. (2009) ‘Are There Lessons for Africa from China’s Success Against Poverty?’. World Development, 37(2): 303-313.
Rodrigo, S.K.A. and Mansor, N. (2013). ‘Narrowing disparities via the New Economic Model (NEM): is Malaysia set to excel beyond its MDGs targets?’. In Singh, A., Gonzalez, E.T. and Thomson, S.B. (eds), Millennium Development Goals and Community Initiatives in the Asia Pacific. New Delhi: Springer.
Rodrik, D., Subramanian, A. and Trebbi, F. (2004). ‘Institutions rule: the primacy of institutions over geography and integration in economic development’. Journal of Economic Growth 9 131–165.
Rodrik, D. (1999). ‘Where did all the growth go? External shocks, social conflict, and growth collapses’. Journal of Economic Growth 4, 385–412.
Roslan, A.H. (2003). ‘Income inequality, poverty and redistribution policy in Malaysia’. Asian Profile, 31(3): 217-238.
Savoia, A. and Sen, K. (2015). ‘Measurement, evolution, determinants and consequences of state capacity: a review of recent research’. Journal of Economic Surveys 29, 441–458.
Saw, S.-H. (1964). ‘A note on the under-registration of births in Malaya during the intercensal period 1947–1957’. Population Studies 18, 35–52
Saw, S.-H. (1988). The Population of Peninsula Malaysia. Singapore University Press.

www.gdi.manchester.ac.uk 34
Solt, Frederick. 2016. ‘The Standardized World Income Inequality Database’. Social Science Quarterly. 97(5):1267-1281.
Sen, K. and Tyce, M. (2017). ‘The politics of structural (de)transformation: the unravelling of Malaysia and Thailand’s dualistic deals strategies’. In Pritchett, L., Sen, K. and Werker, E. (eds), Deals and Development: The Political Dynamics of Growth Episodes. Oxford: Oxford University Press.
Sen, A. (1999). Development as Freedom. Oxford: Oxford University Press.
Shah, S.N. (2017). Charting the Economy: Early 20th Century Malaya and Contemporary Malaysian Contrasts. Oxford: Oxford University Press.
Shari, I. (2000). ‘Economic growth and income inequality in Malaysia, 1971–95’. Journal of the Asia Pacific Economy, 5(1-2): 112–124.
Slater, D. (2012). ‘Strong-state democratization in Malaysia and Singapore’. Journal of Democracy 23, 19–33.
Snodgrass, Donald R. Zainal Aznam Yusof & Ishak Shaari. (2002). Managing Economic Growth and Ethnic Diversity: Malaysia 1970 - 1990. Cambridge: Harvard University Press.
Stiglitz, J. (2007). ‘The Malaysian miracle’. Guardian, 13 September, https://www.theguardian.com/commentisfree/2007/sep/13/themalaysianmiracle.
Tan, J. (2014). ‘Running out of steam? Manufacturing in Malaysia’. Cambridge Journal of Economics 38, 153–180.
Teorell, J., Dahlberg, S., Holmberg, S., Rothstein, B., Khomenko, A. and Svensson, R. (2017). The Quality of Government Standard Dataset, version Jan17. Gothenburg: Quality of Government Institute (http://www.qog.pol.gu.se).
Thillainathan, R. and Cheong, K.-C. (2016). ‘Malaysia’s New Economic Policy, growth and distribution: revisiting the debate’. Malaysian Journal of Economic Studies 53, 51–68.
Tillman, R. (1964). Bureaucratic Transition in Malaysia. Durham NC: Duke University Press.
UNDP (2005). Malaysia: Achieving the Millenium Development Goals 2005, Kuala Lumpur: United Nations Country Team, Malaysia.
Venables, A.J. (2016). ‘Using natural resources for development: why has it proven so difficult?’. Journal of Economic Perspectives, 30(1): 161-184.
Wenar, L. (2013). ‘Fighting the resource curse’. Global Policy 4, 298–304. doi:10.1111/1758-5899.12069.
World Bank (1993). East Asian Miracle: Economic Growth and Public Policy. Washington DC: Oxford University Press.
World Bank (2010). Malaysia Economic Monitor: Inclusive Growth. Washington DC: World Bank.
World Bank (2016). World Development Indicators 2016 [online version available at http://documents.worldbank.org/curated/en/805371467990952829/World-development-indicators-2016]. accessed: April 2016.

www.gdi.manchester.ac.uk 35
World Economic Forum (2017). Global Competitiveness Report 2016–2017. [available at www.weforum.org/gcr].
Yusof, Z.A. (2011). ‘The developmental state: Malaysia’. In Collier, P. and Venables, A.J. (eds), Plundered Nations? Successes and Failures in Natural Resource Extraction. London: Palgrave MacMillan.


