
Air Force Institute of Technology Air Force Institute of Technology
AFIT Scholar AFIT Scholar
Theses and Dissertations Student Graduate Works
12-26-2014
Exploring Individual Differences in Workload Assessment Exploring Individual Differences in Workload Assessment
Danielle K. Boeke
Follow this and additional works at: https://scholar.afit.edu/etd
Part of the Systems Engineering Commons
Recommended Citation Recommended Citation Boeke, Danielle K., "Exploring Individual Differences in Workload Assessment" (2014). Theses and Dissertations. 2. https://scholar.afit.edu/etd/2
This Thesis is brought to you for free and open access by the Student Graduate Works at AFIT Scholar. It has been accepted for inclusion in Theses and Dissertations by an authorized administrator of AFIT Scholar. For more information, please contact [email protected].

EXPLORING INDIVIDUAL DIFFERENCES IN WORKLOAD ASSESSMENT
THESIS
Danielle K. Boeke, Captain, USAF
AFIT-ENV-MS-14-D-31
DEPARTMENT OF THE AIR FORCE
AIR UNIVERSITY
AIR FORCE INSTITUTE OF TECHNOLOGY
Wright-Patterson Air Force Base, Ohio
DISTRIBUTION STATEMENT A. APPROVED FOR PUBLIC RELEASE;
DISTRIBUTION IS UNLIMITED

The views expressed in this thesis are those of the author and do not reflect the official
policy or position of the United States Air Force, Department of Defense, or the U.S.
Government.

AFIT-ENV-MS-14-D-31
EXPLORING INDIVIDUAL DIFFERENCES IN WORKLOAD ASSESSMENT
THESIS
Presented to the Faculty
Department of Systems Engineering and Management
Graduate School of Engineering and Management
Air Force Institute of Technology
Air University
Air Education and Training Command
In Partial Fulfillment of the Requirements for the
Degree of Master of Science in Systems Engineering
Danielle K. Boeke, BS
Captain, USAF
December 2014
DISTRIBUTION STATEMENT A. APPROVED FOR PUBLIC RELEASE;
DISTRIBUTION UNLIMITED

AFIT-ENV-MS-14-D-31
EXPLORING INDIVIDUAL DIFFERENCES IN WORKLOAD ASSESSMENT
Danielle K. Boeke, BS
Captain, USAF
Approved:
//SIGNED 12 Dec 2014
Michael Miller, Ph.D. (Chairman) Date
//SIGNED 12 Dec 2014
Christina Rusnock, Maj, USAF (Member) Date
//SIGNED 12 Dec 2014
Brett Borghetti, Ph.D. (Member) Date

iv
Acknowledgments
I would like to express my gratitude to my faculty advisor, Dr. Michael Miller, for
his continued guidance, patience, and understanding throughout this process. I would also
like to thank my committee members, Maj Christina Rusnock and Dr. Brett Borghetti, for
their timely expertise and insight. I am extremely grateful for my husband whose
unwavering support and sacrifices allowed me to dedicate my time and energy to this
thesis effort.
Danielle K. Boeke

v
Table of Contents
Page
Acknowledgments.............................................................................................................. iv
Table of Contents .................................................................................................................v
List of Figures .................................................................................................................. viii
List of Tables ..................................................................................................................... ix
Abstract ................................................................................................................................1
I. Introduction .....................................................................................................................2
General Issue ................................................................................................................2
Problem Statement........................................................................................................6
Research Objectives .....................................................................................................7
Investigative Questions ................................................................................................8
Methodology Overview ................................................................................................9
Hypothesis ..................................................................................................................10
Assumptions and Limitations .....................................................................................11
Implications ................................................................................................................11
Organization of Thesis ...............................................................................................12
II. Literature Review ..........................................................................................................13
Chapter Overview .......................................................................................................13
Task load, Workload, and Performance .....................................................................13
Subjective Workload Measures ..................................................................................18
Objective Workload Models.......................................................................................21
Workload Theories .....................................................................................................22
Human Performance Modeling and IMPRINT ..........................................................27
vi
Physiological Measures and Workload ......................................................................30
Individual Differences ................................................................................................35
Summary.....................................................................................................................37
III. Methodology ................................................................................................................38
Chapter Overview .......................................................................................................38
Participants .................................................................................................................38
Experimental Design and Apparatus ..........................................................................39
Procedure ....................................................................................................................42
Model Selection and Validation .................................................................................48
Model Assumptions and Limitations..........................................................................55
Data Analysis..............................................................................................................56
IV. Analysis and Results ....................................................................................................60
Chapter Overview .......................................................................................................60
NASA-TLX and Performance Score Results .............................................................60
NASA-TLX and Performance Score Discussion .......................................................65
VACP Red-line Characteristics Results .....................................................................67
VACP Red-line Characteristic Discussion .................................................................70
Divergent Participant Physiological Measures and VACP Results ...........................71
Divergent Participant Physiological Measures and VACP Discussion ......................79
V. Conclusions and Recommendations ............................................................................81
Introduction of Research ............................................................................................81
Summary of Research Gap, Research Questions .......................................................81
vii
Question 1: Are the participants’ individual data sets divergent from one another
based upon perceived workload ratings (NASA-TLX) and performance? ................82
Question 2: Which measures are characteristic of red-lined individuals based on
their objective workload profile as modeled in IMPRINT and how do these measures
vary for the identified individuals throughout the tasks? ...........................................83
Question 3: Do the physiological measures: blinks, saccades, HR, HRV, correlate
with the objective workload profile for all divergent participants and conditions? ...84
Study Limitations .......................................................................................................86
Recommendations for Future Research......................................................................87
Significance of Research ............................................................................................87
Appendix A ........................................................................................................................89
Appendix B ........................................................................................................................97
Appendix C ........................................................................................................................98
Bibliography ......................................................................................................................89

viii
List of Figures
Page
Figure 1: Frequently Assumed Relationship between workload and physiologic response6
Figure 2: An alternate relationship between workload and physiologic response .............. 7
Figure 3: Depiction of the Hebb/Yerkes-Dodson Hybrid Adaptation (adapted from
(Teigen 1994)) ............................................................................................................ 15
Figure 4: Operator Workload & Red-line (Adapted from (Cassenti and Kelley 2006)) .. 17
Figure 5: ECG Signal ........................................................................................................ 33
Figure 6: Vigilant Spirit Control Station (Far left monitor) ............................................. 43
Figure 7: Vigilant Spirit Control Station (Middle monitor).............................................. 43
Figure 8: Multi-Modal Communication............................................................................ 44
Figure 9: Surveillance Scenario Baseline Task Network Diagram .................................. 49
Figure 10: Tracking Scenario Baseline Task Network Diagram ...................................... 49
Figure 11: Tracking Scenario with Two Targets Baseline Task Network Diagram ......... 50
Figure 12: Workload Profile ............................................................................................. 55
Figure 13: Surveillance Data ............................................................................................ 61
Figure 14: Tracking Data .................................................................................................. 61
Figure 15: Z-Score Plot of Participant Centroids ............................................................. 63
Figure 16: Variance Predicted by Physiological Measures when Correlated with VACP 77
Figure 17: Variance Predicted when Correlated with HR ................................................ 78

ix
List of Tables
Page
Table 1: Variables and Measurement Techniques Applied in the Current Research ......... 7
Table 2: Scenarios and Conditions ................................................................................... 45
Table 3: Scenario Timeline ............................................................................................... 47
Table 4: VACP Workload Assigned by Task Node ......................................................... 54
Table 5: Participant and Distances from Origin ............................................................... 62
Table 6: NASA-TLX Tukey HSD Results ....................................................................... 65
Table 7: Performance Tukey HSD Results ....................................................................... 65
Table 8: Divergent Participants ........................................................................................ 66
Table 9: Descriptive Statistics of Divergent Participants ................................................. 66
Table 10: NASA-TLX and Performance Rankings .......................................................... 68
Table 11: Descriptive VACP Statistics of Top and Bottom Ten ...................................... 69
Table 12: Time Spent across Surveillance Tasks of Top and Bottom Ten ....................... 69
Table 13: Descriptive Statistics ........................................................................................ 71
Table 14: Participant 2 Pearson Correlation Matrix ......................................................... 73
Table 15: Participant 8 Pearson Correlation Matrix ......................................................... 74
Table 16: Participant 9 Pearson Correlation Matrix ......................................................... 75
Table 17: Participant 11 Pearson Correlation Matrix ....................................................... 75
Table 18: Participant 7 Pearson Correlation Matrix ......................................................... 76
Table 19: Participant 10 Pearson Correlation Matrix ....................................................... 77
Table 20: One-tailed, one-sample t-tests Statistics ........................................................... 79

1
AFIT/GSE/ENV/14-D-31
Abstract
Air Force missions continue to increase in complexity often imposing higher
levels of task load from cognitive tasks on the operators. This increased task load
manifests itself in increased cognitive workload and potentially derogated performance.
While cognitive workload has been studied for decades, recent advances in objective
workload models and physiology monitoring have the potential to provide a more robust
understanding of workload, potentially allowing systems to adaptively employ
automation to maintain operator peak performance. The current research sought to
provide insight into the relationship between subjective workload, task performance,
objective workload, and select physiology measures. Analysis of an existing data set was
performed to determine if individuals exhibiting low performance and high workload
were more likely to have physiology responses that increased with workload due to a
stress response than other participants. This analysis provides an approach to
investigating the relationships among the four classes of workload information.
However, the results indicate that certain physiology measures are significantly
correlated with objective workload, regardless of the performance and workload range of
the participants. Unfortunately, relatively low correlations were observed among all
dependent measures and therefore, further research is necessary to confidently address
the hypothesis of the current research.

2
EXPLORING INDIVIDUAL DIFFERENCES IN WORKLOAD ASSESSMENT
I. Introduction
General Issue
Current military operations have expanded the use of Unmanned Aerial Vehicles
(UAVs) and Unmanned Aircraft Systems (UASs). A UAV is an aircraft without a pilot
on board which is capable of being controlled through a remote ground control station
and is comprised of other elements beyond the physical air vehicle. Currently, UAVs are
used for targeting and decoy, reconnaissance, combat, combat search and rescue (CSAR),
research and development, as well as civil and commercial use (Office of the Secretary of
Defense 2005). High mission demands and greater mission endurance can increase
manpower requirements, especially since some UAVs can fly for more than 24 hours
before refueling. The reliance on these systems, leading to more frequent and longer
duration missions are a direct result of technological advancements. These advancements
will require the role of the operator to be adjusted to ensure safe and effective system
performance with the increased task load (United States Air Force 2013).
The number and scope of recent Department of Defense (DoD) missions require
increasing numbers of dedicated pilots to meet the task demands of the missions. Due to
manpower constraints, a new approach is required to mitigate these high demands. From
2008 to 2010 there was over a 300% growth in Combat Air Patrols (CAPs) for the MQ-1
Predator and MQ-9 Reaper combined (Coombs 2009). As a result, the U.S. DoD UAV
Roadmap emphasizes the need for continued advancements in all areas from
3
Autonomous Control Levels (ACL) in UAVs to fully autonomous UAV swarms
(Clapper, et al. 2009) to address the manpower limitations.
Autonomy is the capability of a machine to make decisions without human
intervention. Currently UASs employ low level flight control functions, such as stability
control or direction control along a pre-planned route through automation. These
low-level functions require significant human oversight and planning. Human
involvement is therefore necessary in pre-planning actions, management of sensors, as
well as in contingency plan situations (Ng, Hubbard and O'Young 2010). Further, it is
expected that human interaction will be necessary in these and other critical functions for
the foreseeable future.
The need to conduct the increased number missions required by UAVs with a
constrained number of operators has resulted in a growing need for creating seamless
interaction between operators and systems employing various levels of automation.
However, in designing this interaction, one important consideration is operator workload.
The combination and complexity of tasks, or task load, result in varying levels of
operator workload (Merlin 2013), where workload is the combination of task demands on
the operator and the operator’s response to those demands (Keller 2002). The operator’s
perceived workload effects how they divide their time, attention, and energy across
specific tasks and can be useful in understanding the differences in performance results, if
there is a performance gap, and who is affected by the performance gap. According to
The RPA Vector: Vision and Enabling Concepts 2013-2038, emerging areas of autonomy
technology which can help manage human workload include:

4
Sensor Fusion in which information such as diagnostics or prognostics
across sensors on the vehicle are integrated to maximize information
attainment and transmission to the operator
Communications in which the system coordinates and communicates
information which is sometimes imperfect and incomplete
Motion/Path Planning in which nuanced and dynamic paths are
automatically generated that meet mission objectives and constraints
Trajectory Generation in which the generation of control maneuvers to
follow a path or visit mission critical locations
Task Allocation and Scheduling in which the automatic allocation of tasks
amongst operators and autonomous agents complying with time,
equipment, maintenance, repair, and performance constraints
Cooperative Tactics in which the sequencing and distribution of tasks
between operators and other resources to improve success across all
missions (United States Air Force 2013).
Autonomy research desires to improve system performance by alleviating
operators from undesirable circumstances. At times, human performance and behavior is
mimicked in an attempt to achieve the goal of improving system performance. Recently,
artificial intelligence has begun to fuse expert systems, neural networks, machine
learning, natural language processing, and machine vision, with automatic control of
mobile systems to enhance technological development in autonomy research.
5
Since it is difficult to effectively replace human decision making in these systems,
there is concern that low-level tasks will be performed by autonomous systems, leaving
the operator to perform only high level, difficult decision-making. This could prevent the
operators from being able to effectively transition or address low-level tasks when needed
and at times result in them having little to low task load and mental under-load. As the
operator will be required to rapidly gather and assimilate a significant amount of
information to perform these tasks effectively, the potential exists to impose a significant
mental workload on the operator; as operator performance is degraded by excessive
workload, it is important to insure these systems are designed such that operator
workload is controlled. Unfortunately, previous systems have not considered the
operator during the design of the autonomy system, often resulting in systems that reduce
operator task load during periods of time where operator workload would have been
manageable, but increase operator workload during periods of peak operator interaction
(J. M. Colombi, et al. 2012).
According to the Air Force Automation Strategy (Overholt and Kearns 2013), this
improved human-system integration will require the automation system to become more
aware of and respond to the state of the operator. This state information might be
obtained through devices, such as physiology sensors, which determine the level of stress
an operator experiences and adjust the task load imposed upon the operator. These
systems will require an improved understanding of operator mental workload and how it
affects performance. As knowledge, skill, and abilities vary among operators,
influencing their response to a given task load, including their physiologic response, it is
6
important that these measures consider not only the response of humans, in general, but
differences between individuals.
Problem Statement
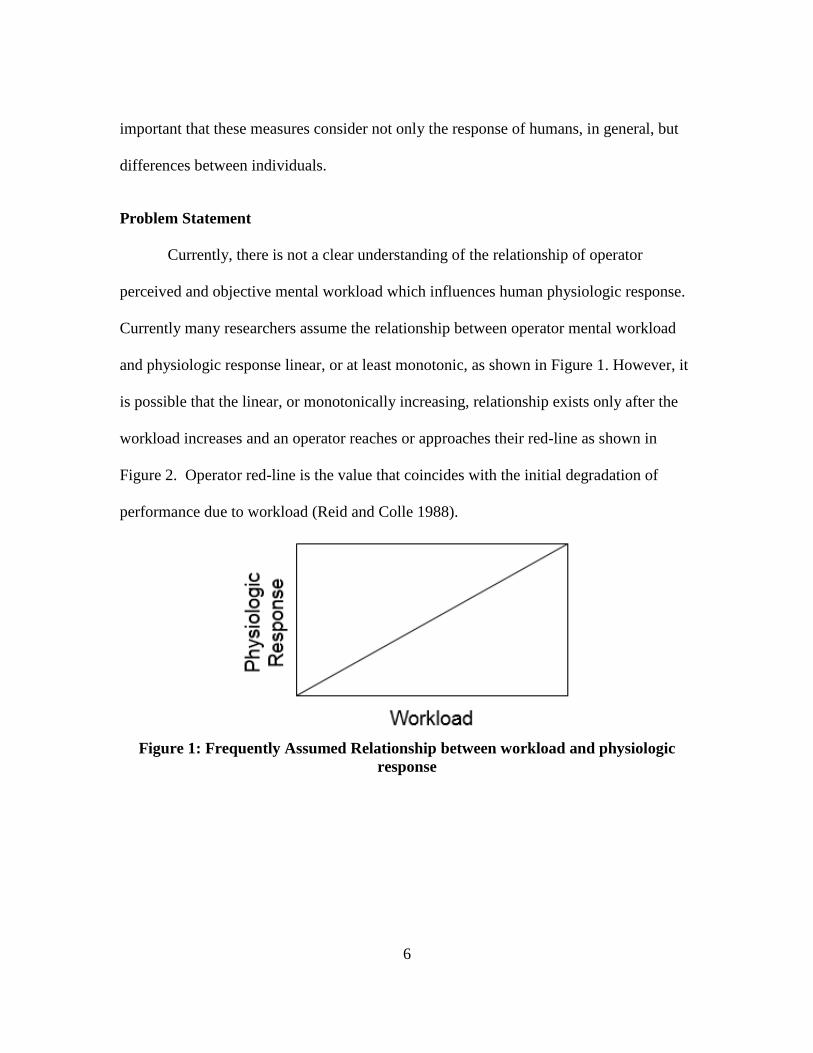
Currently, there is not a clear understanding of the relationship of operator
perceived and objective mental workload which influences human physiologic response.
Currently many researchers assume the relationship between operator mental workload
and physiologic response linear, or at least monotonic, as shown in Figure 1. However, it
is possible that the linear, or monotonically increasing, relationship exists only after the
workload increases and an operator reaches or approaches their red-line as shown in
Figure 2. Operator red-line is the value that coincides with the initial degradation of
performance due to workload (Reid and Colle 1988).
Figure 1: Frequently Assumed Relationship between workload and physiologic
response

7
Figure 2: An alternate relationship between workload and physiologic response
An improved understanding of this relationship could improve system
assessment of operator state. State assessment is a necessary element in determining
methods to automatically or autonomously delegate tasks to an operator, in order to
modulate task load and the resulting workload to sustain effective operator performance
in cognitively challenging environments.
Research Objectives
This research seeks to provide insight into the relationship between mental
workload of individuals and their physiological response based upon a spectrum of task
load. This research will leverage a combination of variables and measurement techniques
as listed in Table 1.
Table 1: Variables and Measurement Techniques Applied in the Current Research
Variable Measurement Technique
Subjective Workload NASA-Task Load Index (NASA-TLX)
Objective Workload Models of Human Performance (VACP)
Task Performance Response times and Goal attainment
Human Physiologic
Response
Electrocardiography (ECG) and Electrooculography
(EOG)

8
NASA-TLX is a multi-dimensional rating scale that measures perceived workload
of the operator based on six independent subscales, including: mental demand, physical
demand, temporal demand, perceived performance, effort, and frustration (NASA 1986),
and will be used to understand the operator’s perceived level of workload across a variety
of tasks. NASA-TLX scores will be paired with operator performance to differentiate
operators that are likely experiencing task overload and are therefore more likely to
experience psychological stress.
Objective workload values will be generated for several operator tasks using an
Improved Performance Research Integration Tool (IMPRINT) model. IMPRINT is a
dynamic, stochastic, discrete event simulator (Army Research Laboratory 2010).
IMPRINT models workload by assessing it across the Visual, Auditory, Cognitive,
Psychomotor, and Speech channels (Bierbaum, Szabo and Aldrich 1989). This measure
employs Multiple Resource Theory where workload demands are assessed across
multiple channels to develop an objective measure of workload specifically accounting
for demands placed on each channel, and potentially the conflict between these channels
(Wickens 2002). The correlation of each of these measures or their combination will be
assessed with physiological measures including blinks and saccades as determined from
Electrooculography (EOG) signals, and heart rate (HR) and heart rate variability (HRV)
as determined from Electrocardiography (ECG).
Investigative Questions
The research objective will be addressed by answering several key investigative
questions.

9
1) Given an existing data set containing appropriate data for a number of individuals,
which participants’ individual data sets are divergent from one another based
upon perceived workload ratings (NASA-TLX)-performance relationship?
2) Which descriptive statistics and patterns are characteristic of red-lined individuals
based on their objective workload profile as modeled in IMPRINT? Specifically,
how do these patterns vary for the identified individuals throughout the tasks?
3) Do the physiological measures blinks, saccades, HR, and HRV, correlate with the
objective workload profile for all divergent participants and conditions?
If not, do these measures correlate better for participants that provide high
perceived workload ratings, poorer task performance and/or higher objective
workload?
Note that these questions are designed to address the underlying hypothesis that
traditional physiologic responses, including heart rate and eye movements, likely
represent psychological stress rather than perceived workload and therefore are likely to
indicate changes in perceived workload near operator red-line more so than general
workload.
Methodology Overview
Analysis will be performed on existing data from a human experiment conducted
by the Air Force Research Labs (AFRL). The experiment collected performance metrics,
physiology signals, and subjective or perceived workload through NASA-TLX. In the
current research, individuals were grouped into 4 divergent groups based on perceived
workload ratings and performance data. A MANOVA was used to determine how the

10
individuals differed statistically. Models of objective workload were developed in
IMPRINT based on individual participant’s performance data and task times. The
objective workload profiles generated by IMPRINT were based on the task design and
validated by Subject Matter Experts (SME). An analysis of objective workload profiles
was performed to identify measures representative of red-line individuals. The
physiological measures of the divergent participants were used to determine how the
performance and workload data related to each other through a correlation analyses.
Hypothesis
1) It is hypothesized that there will be four divergent groups with individuals who
will fit in each based upon their perceived workload ratings from NASA-TLX and
their performance across all 16 trials.
2) It is hypothesized that there will be measures from the objective workload
profiles, as modeled by IMPRINT, which will allow individuals to be identified as
red-line or not.
3) It is hypothesized that there will be a weak correlation between the objective
workload (VACP) and physiological data when the perceived workload
(NASA-TLX) is low. However, moderate to high correlation will be observed
between the objective workload (VACP) and physiological data when the
perceived workload (NASA-TLX) is high. Similar relationships might also exist
for users having generally high or degraded performance.

11
Assumptions and Limitations
An existing data set is being used and additional data will not be collected at this
time. Each participant in the existing human-participants experiment experienced 16
different scenarios in a unique order, completing these scenarios on each of the four
different days. It was assumed that the training provided to the participants prior to the
study overcame any learning effects and that the randomized order of the conditions
resulted in no order effects and did not affect the workload or physiological changes in
this investigation. It is assumed the data represents the general population and the
workload experienced by the participants is comparable to the workload experienced by
current UAV operators. Further, it is assumed that there is enough variability between the
skills and abilities of the participants to represent the variability in the existing
population.
Implications
This research is expected to broaden the understanding of the relationship
between perceived workload (NASA-TLX), objective workload profiles as modeled in
IMPRINT (VACP), and physiological measures associated with differing levels of
mental workload. It seeks to provide insight into how mental workload effects
physiological changes and how task performance, cognitive performance, workload
stress, and physiological measures relate. It will also help develop a cognitive workload
profile model for use in automation that can eventually predict or estimate and manage an
operators workload in real-time.

12
Organization of Thesis
This thesis is in a traditional format. Chapter 2 provides a template of pertinent
terminology and past research which will be referenced throughout the thesis. It provides
an overview of the main research topics to include workload, workload measures,
modeling techniques, relationships between workload and performance, and
physiological measures. Chapter 3 provides a synopsis of how the experiment was
conducted and that data used for the analysis. Chapter 4 explains the analysis procedures
and results. Finally, Chapter 5 discusses the research objectives and lays a foundation for
future research.

13
II. Literature Review
Chapter Overview
Relevant background information is provided on task load, workload,
performance, and physiological measures are provided in this chapter to motivate and
support the methods applied in this research. Additionally, individual differences in
relationship to workload, performance, and physiological measures are discussed.
Additionally, challenges in real-time human-performance measures are summarized.
Task load, Workload, and Performance
It is imperative to understand the similarities and differences between task load,
perceived workload, objective workload estimates, system performance, and human
performance. Task load, also referred to as task demand, refers to the frequency,
consistency, and difficulty of activities an operator or user performs to complete a task or
mission (Soliday 1965). Task load considers the amount of time allocated to complete
the specific task, the level of cognitive information processing required, and the
constraints of the individual actions a user must complete (Hardman, et al. 2008). Task
load refers to the work or task demands placed on the user. It does not change based on
the user’s abilities or the perception of the work or tasks.
Workload is then experienced by a user in response to these task demands. It
varies based upon the operator’s ability to perform the individual actions. Workload is a
conceptual way to express the perceived task demands which have been placed on the
user (Beevis, et al. 1999). . Workload can further be divided into physical and cognitive

14
workload. Although most tasks have both a physical and cognitive component, the
current research is concerned primarily with mental or cognitive workload. Mental
workload is the perceived mental effort required by a user to respond to a specific task
load (Keller 2002). Besides the task load, mental workload is influenced by how a
person divides their time, attention, and energy when performing specific tasks and is
influenced by their capacity. According to Neerincx (2003) there are three levels of
cognitive information processing: automatic processes or skills, routine problem solving
or rules, and more complex analysis of information. The overall mental workload
imposed by a task or the task load experienced by the user depends a great deal on the
level of information processing required by a specific operator. Highly experienced
operators may perform a task using an automatic process while a less experienced
operator must perform complex analysis of information to complete the same task. Thus,
the mental workload imposed by a given task load can vary significantly between
individuals.
Task load and workload affect a user’s overall performance. The relationship
between mental workload and performance is complex but is often times described by the
Hebb/Yerkes-Dodson Law (Teigen 1994). The standard explanation of the
Hebb/Yerkes-Dodson Law represents the relationship of arousal and performance in
simple and complex tasks suggesting that moderate levels of arousal will improve
performance by allowing concentration on relevant cues, whereas higher levels may be
detrimental because relevant cues may no longer be available to the individual (Teigen
1994, Hebb 1955). It has been noted that the optimum workload level is higher in simple

15
tasks than in complex tasks which can be seen in the figure below. This is shown in
Figure 3 as an adaptation of the Hebb/Yerkes-Dodson law with a simple and difficult
task. Hebb introduced the inverted U to describe this relationship and future researchers
extrapolated his work and the relationship can be found in recent work explaining stress
(Teigen 1994, Hebb 1955). Performance increases up to a certain level of arousal and
then begins to degrade as an individual reaches their maximum level. A similar
relationship has been applied to describe the relationship between mental workload and
performance. When applied to workload, the level of workload resulting in maximum
performance can be describes as an individual’s red-line. An individual’s red-line is the
point in which they can no longer sustain the level of performance at the current task load
and often times visibly manifest itself in a stress response based on the workload they are
experiencing.
Figure 3: Depiction of the Hebb/Yerkes-Dodson Hybrid Adaptation (adapted from
(Teigen 1994))

16
It is at this red-line point where an individual would have to shed a task or tasks to
continue performing (Grier, et al. 2008). Another way to look at workload and where
red-line occurs was described by DeWaard (1996) in a reference to Meister’s work where
there are three regions describing the relationship between task demand and task
performance. The three regions are: A; where increase in demands do not cause a
performance decrement, B; in which task demands increase workload, which causes
performance decrements, and C; when extreme levels of task load result in high levels of
mental workload, resulting in reduced performance. Performance then declines with
further increases in mental workload to a minimum level where it remains with increased
task demands (Meister 1976). Subjective measures of workload may be sensitive to
overload or redlining in the B-region and clearly reveal overload in the C-region, but
overall are not sensitive to increases in workload in the A-region were performance
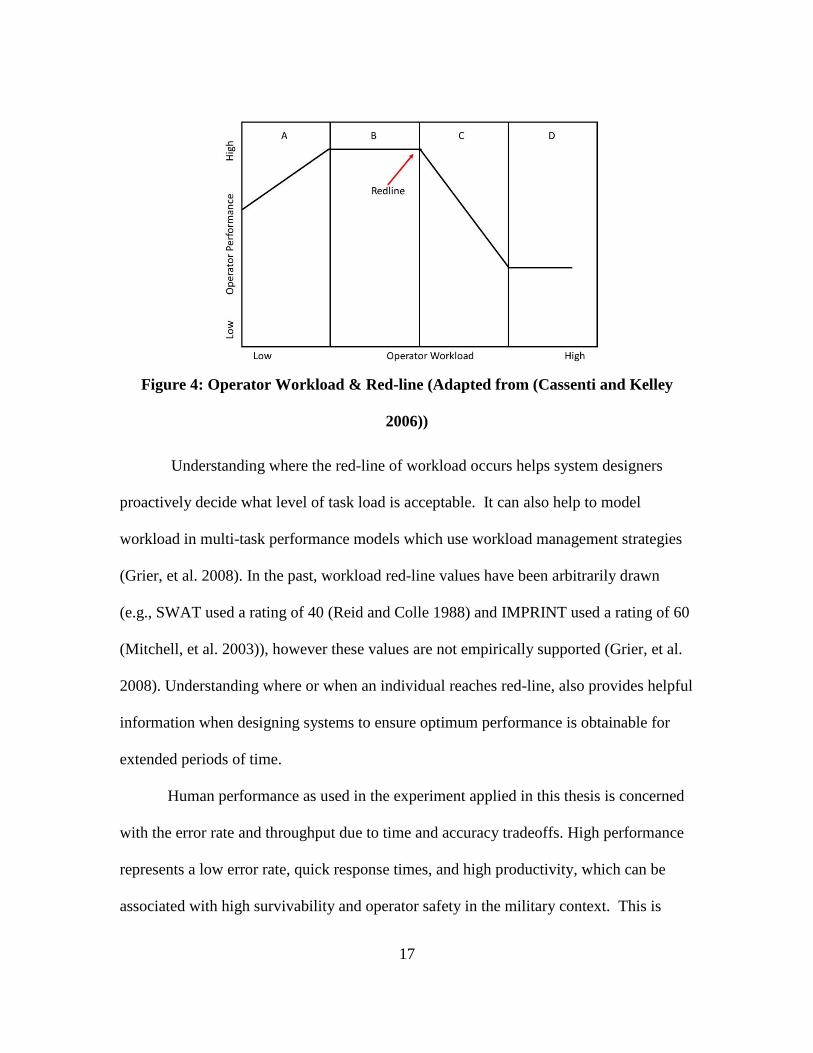
remains stable. Cassenti and Kelley hypothesized a workload curve with four regions in
which qualitative descriptions of the performance function in increasing order with
increases in workload include, undertaxed, ceiling performance, steady decline in
performance, and floor performance (Cassenti and Kelley 2006). This model is similar to
Meister’s, however it accounts for the under-load condition. Using this model, the
red-line occurs near the transition from region B to C as depicted in Figure 4.
17
Figure 4: Operator Workload & Red-line (Adapted from (Cassenti and Kelley
2006))
Understanding where the red-line of workload occurs helps system designers
proactively decide what level of task load is acceptable. It can also help to model
workload in multi-task performance models which use workload management strategies
(Grier, et al. 2008). In the past, workload red-line values have been arbitrarily drawn
(e.g., SWAT used a rating of 40 (Reid and Colle 1988) and IMPRINT used a rating of 60
(Mitchell, et al. 2003)), however these values are not empirically supported (Grier, et al.
2008). Understanding where or when an individual reaches red-line, also provides helpful
information when designing systems to ensure optimum performance is obtainable for
extended periods of time.
Human performance as used in the experiment applied in this thesis is concerned
with the error rate and throughput due to time and accuracy tradeoffs. High performance
represents a low error rate, quick response times, and high productivity, which can be
associated with high survivability and operator safety in the military context. This is

18
expressed in the form of a score for both the primary and secondary task in the dataset to
be applied in this thesis. If the task load and workload are too high, a user’s overall
performance will be low. Productivity or accuracy may be sacrificed when operators are
required to attend to more than one task. Understanding the relationship between
workload and performance will help facilitate future developments and improvements in
human performance. Studying workload helps one to answer human performance
questions and gain a better understanding of operator states (Durkee, et al. 2013). Of
importance to the current thesis is the notion that as mental workload increases
monotonically, performance does not. Therefore, one would expect individuals
experiencing moderate levels of workload to perform better than individuals experiencing
extreme levels of workload.
Subjective Workload Measures
Subjective measures have been used to create psychological scales since Stevens’
power law was proposed. Stevens’ power law used observers’ responses to psychological
attributes and developed an interval scale by assigning numbers which corresponded with
their responses (Stevens 1961). Subjective measures are influenced by an individual’s
personal judgment. Typically subjective measures use a scaling system to record an
individual’s judgment about a situation, task, or experience after the fact. Subjective
workload measures are used to estimate the perceived mental workload an individual
experiences based on the specific task load. There are numerous subjective workload
measures which have gained acceptance in human performance and workload research to
include the Subjective Workload Assessment Technique (SWAT) and NASA-Task Load

19
Index (NASA-TLX) (Reid and Colle 1988, Wynn and Richardson 2008, Hart and
Staveland 1988).
SWAT captures the multidimensional aspects of mental workload. It uses a scale
development phase and an event scoring phase (Reid and Colle 1988). Participants
respond using a three point scale to the following questions:
1) How much spare time do you have?
2) What is your stress level?
3) What is your mental effort? (Hancock and Scallen 1997)
SWAT allows relatively real-time assessment of perceived mental workload due to the
short nature of the measure. SWAT also causes little disturbance to the primary task,
which is an important attribute of an effective subjective workload measure.
NASA-TLX is an empirical workload assessment tool which collects subjective
or perceived workload data. It was developed by the Human Performance Group at
NASA’s Ames Research Center and initially tested in over 40 laboratory simulations
(NASA 1986). The highly sensitive nature and acceptance of the NASA-TLX combined
with the low intrusiveness and implementation requirements make it an attractive
subjective workload measure (Hart and Staveland 1988). A disadvantage of the
NASA-TLX resides in the low timeliness of the measure. That is, individuals complete
the NASA-TLX as a reflection of the task, rather than in the moment. This separation in
time between experience and reporting can cause a disconnect where a user may not
recall their workload accurately. However, it has been shown that the bias shown in
subjective ratings can actually provide insight into significant cognitive processes (Hart

20
and Staveland 1988). Also, NASA-TLX may not be sensitive to specific aspects of the
task environment. Additionally, how or why an individual approached the task a certain
way may not be readily accessible to their conscious evaluation. If their performance was
poor, they may suppress their mechanisms, approach, or perceived difficulty as a result.
If the measure is not properly explained or individuals choose not to read the descriptions
prior to rating, they may confuse what each subscale actually means. NASA-TLX does
not use standard word anchoring, thus allowing participants to determine their own and
often differing anchors.
Each subscale is scored in five point increments on a 100 point scale. Descriptions
of the six subscales are typically given in the form of questions and are shown below:
Mental Demand: How much mental and perceptual activity was required? Was the
task easy or demanding, simple or complex?
Physical Demand: How much physical activity was required? Was the task easy or
demanding, slack or strenuous?
Temporal Demand: How much time pressure did you feel due to the pace at which
the tasks or task elements occurred? Was the pace slow or rapid?
Overall Performance: How successful were you in performing the task? How
satisfied were you with your performance?
Frustration Level: How irritated, stressed, and annoyed versus content, relaxed, and
complacent did you feel during the task?
Effort: How hard did you have to work (mentally and physically) to accomplish your
level of performance? (Hart and Staveland 1988)

21
Phrasing the descriptions in this manner has been found to help individuals
complete the workload measure more accurately (Schuff, Corral and Turetken 2011).
NASA-TLX scores have been shown to increase as the task difficulty in an experiment
increases (Wynn and Richardson 2008). The current research provided descriptive
questions when participants completed the NASA-TLX. This approach provides a more
in-depth understanding of how the participants’ perceived their workload during each
aspect of the task. NASA-TLX are commonly reported as raw scores, a single score
reported as an average across all of the subscales or as a single score as a weighted
combination of the raw scores. The weighted score uses participant pairwise comparisons
of which subscale was more relevant to workload, with the resulting number of times
each subscale was chosen being the weighted score (Hart and Staveland 1988). The
overall task load index is calculated taking the weighted score multiplied by the score of
each subscale divided by 15, resulting in a value from 0-100, which results in a
composite score tailored to the individual’s workload definition (Hart 2006). Originally,
the weighting scale was thought to increase sensitivity for relevant variables based on the
experiment and decrease between-rater variability (Hart 2006). Many researchers have
eliminated the weighting process by averaging the workload scores to create estimates of
overall workload to simplify the process (Hart 2006). A meta-analysis of 29 different
studies showed mixed results as to the preferred method (Hart 2006).
Objective Workload Models
Measuring mental workload through subjective means permits a researcher to
gain insight to the mental state of a human operator and the influence of task load on

22
performance. However, obtaining subjective workload values during system design is
not always possible. To obtain subjective ratings of the workload imposed by a system
on an operator, the operator must use the system and then provide a rating. However,
since the system or even realistic emulations of the operator workstation are frequently
not available during the early stages of system design, it is often not possible to permit an
operator to experience the systems to gain the experience necessary to form subjective
ratings of their mental workload. Therefore, objective workload models have been
constructed to assess operator workload. Such models help system designers understand
the impact of a system design on operator workload early in the design process. The
models may also help the designer avoid undesirable system implementations. For
example, early RPA interfaces often exposed the operators to long periods of low
workload mixed with short periods of extremely high workload (Merlin 2013), resulting
in less than an ideal work environment. Objective workload models should ideally
permit one to estimate human workload during the early stages of system design and
adjust the system design to avoid similar undesirable work conditions. Objective
workload models are derived from and explained through the application of workload
theories.
Workload Theories
The unitary-resource model proposed by Kahneman (1973), suggests a limited
amount of attention can be applied to different types of mental processes. The tasks can
be executed simultaneously if they fall within the capacity of the resource, but once they
exceed the capacity, performance will decrease. Results supported the hypothesis that a

23
primary task would be attended to before a secondary task (Posner and Boies 1971). An
assumption of this model is that the attentional resources which are applied to the
different tasks are the same regardless of when or how the tasks are performed (Proctor
and Van Zandt 2011).
Wickens’ proposed the Multiple Resource Theory (MRT) suggesting that humans
have multiple pools of resources which can individually be tapped (Sarno and Wickens
1995). MRT is concerned with three components: demand, resource overlap, and
allocation policy (Wickens 2008). If a pair of tasks requires the same pool of resources,
the tasks must be handled sequentially. If the pair of tasks requires different resources,
then the two tasks could be performed in parallel, although perfect time sharing is not
guaranteed (Wickens 2008). Further, some tasks may require multiple resources, creating
bottlenecks that limit parallel processing.
According to MRT, a decrement in performance occurs when there is a shortage
of some resources. It suggests humans have a limited cognitive resources, restricting
their ability to process information. Excess workload from a task demand can result in
less efficient and less accurate performance from an individual (Wickens 2008).
Wickens’ theory suggests that tasks can be performed concurrently. The tasks may
interfere with each other and as the difficulty increases in one task, the performance will
decrease in another task. However, further research showed that the workload and
performance relationship is more complex. Nachreiner demonstrated that both high and
low workload can negatively affect performance (Nachreiner 1995). Additionally,

24
increased workload can result in improved performance based on the participant’s
strategy for mitigating the task demands.
The Time-Line Analysis and Prediction (TLAP) workload model by Parks and
Boucek is based on the assumption that task performance will break down if the time
required to perform the tasks were greater than 80% of the time available (Parks and
Boucek Jr. 1989). The TLAP workload model proposes the presence of five separate
channels: vision, audition (both hearing and speech), hands, feet, and cognition (Parks
and Boucek Jr. 1989). TLAP only accounts for the amount of time the task takes to
complete and does not consider the complexity of the task and the demand the specific
task places on the cognitive processing channel or channel conflicts (Sarno and Wickens
1995). It assumes the task fully demands a specific channel or it does not.
The Workload Index (W/INDEX) uses the MRT framework (North and Riley
1989) to capture channel conflicts using a conflict matrix which ranges from 0.0 to 1.0
(North and Riley 1989). It produces relative measures of interference between resources
and assumes the task interference is directly proportional to predicted workload (Sarno
and Wickens 1995). The Interference Matrix can be derived for other sources such as the
Visual, Auditory, Cognitive, and Psychomotor (VACP) theory described below. It is
important to note the W/INDEX model does not discriminate channel conflict within a
task from channel conflict between specific tasks (Sarno and Wickens 1995). W/INDEX
does however, assume workload channels overlap which generate the interference.
Similar to MRT in some aspects, the VACP model developed by Bierbaum,
Szabo, and Aldrich (Bierbaum, Szabo and Aldrich 1989), which was an adaption of the

25
McCracken and Aldrich VACP model, can be used to predict workload (McCracken and
Aldrich 1984). This theory builds on Multiple Resource Theory where workload demands
are assessed across the following channels: Visual, Auditory, Cognitive, Speech, Tactile,
Fine Motor, and Gross Motor to develop projective measure of workload (Wickens
2002). The VACP scales were created by subject matter experts (SMEs) who rated
subtasks of flight-related activities (Wickens 2002). VACP specifically looks at excess
demands placed on one channel (Wickens 2002). All task demands are decomposed into
subtasks that must be performed by one of the seven channels. VACP suggests all visual
and auditory components are external stimuli to which the individual attends. The
cognitive channel refers to the information processing required by the task, and the
psychomotor channel describes the physical actions required by the task (Keller 2002).
The VACP scale produces a rating to explain the degree to which each resource
component is used in the particular task over time.
Excess VACP demands can result in cognitive overload which inhibits
performance. The operator may not be aware of the degraded performance due to task
saturation (Ng, Hubbard and O'Young 2010). It has been shown that mental under-load,
in the workload context, can be detrimental to overall performance and successful task
completion (Young and Stanton 2002). Mental under-load typically occurs when the
operator monitors a system for prolonged periods such as during vigilance or sustained
attention tasks waiting for a signal to appear which can result in slower response speed
and accuracy (Hancock and Chignell 1988).

26
Malleable Attentional Resource Theory (MART) suggests that mental under-load
affects not only performance, but the mental resources (e.g., channel bandwidth)
available at any moment in time. MART suggests an operator’s resource pool will shrink
with a lower task load (Young and Stanton 2002), suggestive of a process similar to a
sleep mode for a digital processor. Once the resource pool has shrunk, the operator may
experience a degradation of attention and performance when a critical situation arises
(Young and Stanton 2002) until such time as additional mental resources can be
activated. Young & Stanton (2002) claim, excessive reductions in workload actually
shrink attentional resource pool capacity, which is separate from disparities in arousal or
effort.
Neerincx developed the Cognitive Task Load (CTL) model to better understand
the relationship between task performance and mental effort (Grootjen, Neerincx and van
Weert 2006). The three load factors of interest were percentage of time occupied, level of
information processing, and task-set switching (Grootjen, Neerincx and van Weert 2006).
Overall, over and under-load situations result in more errors, slower performance,
load-sharing, and load-shedding (M. A. Neerincx 2007). These types of behavior are
known as self-adaptive strategies. Load-sharing and load-shedding strategies are thought
to be the most commonly applied (Schulte and Donath 2011). Load-sharing involves
changing of the way a task is accomplished (Schulte and Donath 2011). Load-shedding
strategy is characterized by task prioritization, dismissal of subtasks, changes in task
success rates, and or attention allocation variation (Veltman and Jansen 2005).
Self-adaptive strategies are used to maintain the desired level of performance for as long
27
as possible with increased task load. Individuals adopt self-adaptive strategies due to
workload debt, workload debt cascade, and workload overload. Workload debt occurs
when an individual is unable to complete all relevant tasks in the allotted time because
their cognitive workload is too high (Smith 2009). As a result the individual will
strategize consciously or subconsciously and embark on load shedding, postponing a task
to permit another decision action to be completed in a required timeframe (Smith 2009).
An escalation of workload debt, or workload debt cascade, occurs when postponed tasks
stack, such that the individual is unable to catch up with the required tasks, resulting in
task failures (Smith 2009). Workload overload occurs when individuals stop trying to
complete the tasks, typically as a result of workload debt cascade. All of these contribute
to the way an individual adapts as they approach and surpass red-line.
Human Performance Modeling and IMPRINT
Modeling and simulation are useful when trying to understand the capabilities of
new system designs and human interaction with the system. One way of modeling human
performance is through the use of reductionist models which decompose the human or
system task structure into lower level tasks which can each be analyzed to reasonably
estimate human performance (Laughery 1998). First Principles or cognitive models
provide another way of modeling human performance and uses an organizational
framework based on theories of mechanisms which facilitate human behavior such as
perception, central processing, and working memory (Laughery 1998). First Principles of
human behavior combined with Task Network Models enables the modeling of cognitive
workload, human response, and performance of complex systems (Laughery 1998).

28
Task Network models can interact with models of system hardware and system
software to fully represent the human/machine system which allows for the prediction of
system dynamics and helps answer human centered design questions (Laughery 1999,
December). Discrete Event Simulation (DES) models, a class of models, can be used to
analyze the cognitive demands of operators during specific tasks and provide an output
highlighting their workload at discrete time intervals throughout the scenario. Improved
Performance Research Integration Tool (IMRPINT) is an example of this type of tool
which provides an objective measure of operator cognitive workload in the form of
workload profiles (Army Research Laboratory 2010).
In IMPRINT, networks are constructed using task level information which
represent the flow and performance of higher level tasks or missions. This is
accomplished by first completing a task analysis. A task analysis outlines the sequence of
tasks performed, timing of the tasks, workload associated with each task, and the
background scenario details (Army Research Laboratory 2010). Typical task level inputs
are: mission-function-task breakdown, task time and accuracy, failure consequence,
system-subsystem-component breakdown, mean operational units between failure
(MOUBF), and level of environmental stressors such as heat, cold, noise, etc. (Army
Research Laboratory 2010).
During a task analysis, a workload value from 1-7 is given to each task for each
VACP channel and entered into the model. A task cannot score higher than a 7 for a
specific channel. The model takes the workload ratings for each resource of VACP and
sums within and across channels for concurrent tasks creating workload profiles. The

29
result is a model representing the objective workload of a task. Workload models can
predict if the operator:
1) Has the capability to perform the required tasks
2) Has enough spare capacity to take on additional tasks
3) Has enough spare capacity to handle emergency situations (Eisen and Hendy
1987)
In addition to simply adding VACP demand values for the tasks, IMPRINT can
additionally determine conflict values between the tasks and/or different channels,
increasing workload under conditions where multiple tasks impose requirements on
competing mental resources in overlapping time frames.
In IMPRINT, these workload profiles can be generated to examine the
crew-workload distribution and soldier-system task allocation (Army Research
Laboratory 2010). The workload profile enables system designers to effectively 1)
monitor increases in workload and 2) determine when these workload increases warrant
system design changes to maintain desired levels of workload. The resulting outputs
include workload graphs and levels, task performance timeline, and diagnostic reports of
subfunction and task failures (Army Research Laboratory 2010). Additionally, the
models are used to understand if the task or equipment can be altered to change the
amount of spare capacity of the user or the amount of mental workload (Eisen and Hendy
1987).

30
Physiological Measures and Workload
Another way to measure workload is through physiology measures. Physiology
measures provide an objective measure of biological responses under specific conditions.
These measures employ sensing equipment designed to measure physical phenomena
related to the biological processes within the human operator with transducers. The
transducers output the information in the form of an electric signal which can later be
analyzed to provide insight into physiological changes. Physiological measures allow
continuous objective assessments of physical phenomena which are believed to be
correlated with functions, such as stress and mental workload. However, changes in
physiology are influenced by stimuli through complex relationships, often making it
difficult to link specific physiological responses to cognitive or physical states. Previous
research has documented the relationship of behavioral performance and nervous system
activity, specifically changes in the autonomous nervous system (Durantin, et al. 2014).
Shifts from low to high cognitive workload are often correlated with increases in pupil
size and Heart Rate (HR) (Durantin, et al. 2014), as well as decreases in heart rate
variability (HRV) (Brookhuis and Waard 2010). These changes, however, are not
uniquely coupled to workload as changes in pupil size also occur with changes in
illumination or arousal (Fishel, Muth and Hoover 2007), and changes in heart rate and
heart rate variability can occur with physical exertion (Achten and Jeukendrup 2003).
Typical physiological measures associated with workload are: electrooculography
(EOG), electromyography (EMG), pupil diameter, electrocardiography (ECG),
respiration, electroencephalography (EEG), and skin conductance (Popovic, et al. 2013).
31
Physiology measures can be obtained in the same manner for each participant.
However, these measures often vary significantly between individuals. To overcome this
between-participant variability, it is common to calculate differences between an operator
state during an experimental condition and a known baseline, often associated with the
resting state of the user. The use of this difference-from-baseline measure ensures an
individual with a fast or slow heart rate or unique physiological measure will not add
unnecessary bias to the data. Individual baseline measures are typically taken at the
beginning of each experimental session to calibrate the measures to the specific
participant. However, it is also known that such baseline measures do not always
represent a relaxed, resting state as participants can be anxious prior to an experiment,
especially after the unique experience of having several physiology sensors attached to
their body (Splawn 2013). Another approach to measuring the difference is to use a
“vanilla” baseline condition which uses a minimally demanding task and seeks to
overcome the traditional baseline requirement of having an extended period of inactivity,
free from exercise, metabolic activation of food or altering substances for 12 hours, or
emotional excitement (Jennings, et al. 1992).
An electrocardiogram (ECG) is used to measure heart rate (HR) and heart rate
variability (HRV). HR is the number of beats within a fixed amount of time, typically
measured in beats per minute. HRV takes into account the patterns and frequency
content of inter-beat intervals (IBI) (Brookhuis and Waard 2010). The electrical activity
of the heart is collected using the ECG which produces data on the variation of time
duration between heartbeats. This allows researchers to monitor the HR and HRV. It has

32
been shown that operators who experience an increase in mental effort will exhibit an
increase in HR and a decrease in HRV when compared to baseline measures (Brookhuis
and Waard 2010). This change in HR and HRV is reflective of a defense reaction
typically found in effortful cognitive tasks (Brookhuis and Waard 2010). Research has
also shown HR may be sensitive to unpredictable task load changes (Hancock,
Jagacinski, et al. 2013). However, HR and HRV do not provide a way for differentiating
between resources to identify the cause of the overload due to task load changes.
One measure of HRV is the ratio of low frequency (LF) variability of HR (0.04
to 0.15 Hz), usually associated with blood pressure control to the high frequency
variability (HF) (0.15 to 0.40 Hz) which typically correspond to respiratory sinus
arrhythmia (RSA) (Durantin, et al. 2014). The RSA is the oscillation of the RR, or
interval between successive Rs in the tachogram output. An R expresses itself as a peak
in the QRS complex. The LF/HF ratio of HRV has been shown to provide a reliable
measure of cognitive workload (Durantin, et al. 2014). Another measure of HRV is
through the analysis of ECG data in the time-domain. The R wave and peak are
identified using QRS detection algorithms identifying the RR intervals (Bolanos, Nazeran
and Haltiwanger 2006) as shown in the ECG example in Figure 5: ECG SignalFigure 5.
Interpolation and re-sampling are performed to produce a uniform tachogram. Problems
with the tachogram data are identified and corrected, and a smoothing function is run.
HRV has been shown to have an inverse correlation with workload (DeWaard 1996).

33
Figure 5: ECG Signal
Eye movements, blinks, saccades, and pupil dilation all provide insight into how
users interact with complex visual displays and the underlying cognitive processes
(Marshall 2002). Gaze tracking measures the angle of the gaze of the participant to
determine eye and head position to project a point on a surface corresponding to the
location of the user’s fovea. Specifically, the eye-gaze is computed using points in the
model of the face and points in the camera image (Kim and Ramakrishna 1999). It uses
video cameras which are typically mounted to the desk or table. Gaze tracking requires
calibration of the individual participant with the apparatus, but is noninvasive after initial
set-up. This calibration takes into account the eye glint, pupil location, and automatically
detected facial features for reference such as inner and outer eye corners, mouth corners,
and tip of nose. Potential issues with gaze tracking arise when individuals have dark
colored irises or small pupils, require corrective glasses (Kim and Ramakrishna 1999), or
rotate their head to remove their face from the view of the camera. This causes the
software to not be able to accurately track the gaze continuously.

34
Video-based eye trackers can also capture and record pupil diameter. The Index
of Cognitive Activity (ICA) measures abrupt discontinuities in pupil diameter signals
which have been shown to vary as a function of objective workload (Marshall 2002).
ICA does not require the averaging of trials; it can be applied to all signal lengths, and is
nearly real-time (Marshall 2002). ICA was used to compare a task with no cognitive
effort to one with cognitive effort that used an arithmetic item in light and dark scenarios.
High levels of ICA were recorded during the effort task and low levels during the no
effort task across two different, controlled lighting conditions (Marshall 2002). These
results suggest the ICA measures pupil changes based on radial muscles qualifying
mental effort and simultaneously factors out circular muscles contractions resulting from
changes in environmental lighting (Marshall 2002). Absolute pupil diameter is known to
increase with increases in mental effort, but is also influenced by illumination level
(Marshall 2002). Pupil diameter provides a reliable measure of workload; however,
differentiating between resources to identify the cause of the overload cannot be
accomplished by using only pupillometry measures (Proctor and Van Zandt 2011).
Eye movements can also be measured through the use of Electrooculography
EOG, which uses electrodes placed around the eye to detect eye movements by
measuring the cornea-retinal standing potential between the front and back of the eye
(Krupinski and Mazurek 2011). It can be effective for identifying blinks, blink duration,
and saccades. Blinks are recorded based on short pulse shapes with magnitudes
comparable to the entire range (Krupinski and Mazurek 2011). Saccades look at the rapid
value changes separated by nearly constant values. Saccades occur when individuals
35
scan scenes; it is the quick movement when they move from one interesting aspect to
another. The nearly constant values are the fixations and typically occur between
saccades. While similar data can be obtained from video-based eye trackers, EOG data is
not influenced by the appearance of the eye or the video camera’s ability to record an
image of the user’s face.
O’Donnell & Eggemeier (1986) reported that fixation times increased with
increased workload. Similarly, May et al. (1990) showed an increase in mental workload
resulted in a smaller saccadic range. Three components of eye blinks: eye blink rate,
blink duration, and eye blink latency, have been used to measure workload (DeWaard
1996). Some studies have shown that blink latency increases and closure durations
decrease when task demands increase (Kramer 1990). This also suggests there will be
longer fixation times with increased workload.
Individual Differences
Complex systems especially ones using automation, will require an improved
understanding of task load, experienced workload, and how it affects performance. The
relationship of workload and physiological measures may be representative of the entire
spectrum of workload or just those individuals who are considered red-line as previously
depicted in Figure 1and Figure 2. As operator skill and their physiologic response to a
given task load varies between individuals, it is important that these measures consider
not only the response of humans, in general, but the differences between the individuals.
Most workload research groups individuals together and looks at differences that
arise in individuals as noise rather than individual differences (Wickens, Hollands, et al.

36
2013). Other individual difference research explored the personality domain. Szalma
(2009) explored personality and individual differences in the context of optimists and
pessimists and suggested they differed in their coping styles and in how many resources
they had available to allocate to tasks. Guastello, et al. (2013) reported that individual
differences affected all NASA-TLX scales except physical in either anxiety or emotional
intelligence suggesting that anxiety results in higher arousal levels and higher emotional
intelligence scores may have helped them cope and lower their arousal levels. Little work
exploring the red-line aspect of workload and individual differences red-line have been
conducted (Damos 1988).
Cegarra and Hoc (2006) reported there are task committed and resource
committed individuals. Increased complexity resulted in in more functional
representations to reduce cognitive workload for resource-committed individuals whereas
the task-committed individuals accepted the increased workload when testing experts
(Cegarra and Hoc 2006). Bloem and Damos (1985) looked at the performance of
secondary-tasks to understand the workload based on the single resource capacity model.
They found slight evidence suggesting that individuals who exhibit better secondary-task
performance also experienced less frustration and were more satisfied with their
performance which is indicative of them experiencing less workload (Blowem and
Damos 1985). Recently, models with multiple physiological input variables have been
shown to account for the majority of workload variance for specific individuals (Durkee,
et al. 2013). However, there is the potential for there to be individual differences that
have not been sufficiently measured (Durkee, et al. 2013). Understanding these individual

37
differences will continue to provide pertinent information allowing models to account for
more workload variance.
Summary
Understanding the type of information subjective workload, objective workload,
and physiological measures add to the overall body of research within the workload and
performance paradigm is essential to improving complex systems. Subjective measures
can be used to understand the individuals who perceive themselves to be on the extremes
of the workload spectrum. Objective measures can help predict when a participant is
red-line and which tasks are causing the red-line. Objective measures can also identify
which resource channel(s) are overloaded. These measures combined with physiological
measures can help improve researcher's understanding of how or when individuals reach
their red-lines as well as provide insight into when the shift from acceptable workload to
red-line occurs.
38
III. Methodology
Chapter Overview
To address the research questions, the current research utilized an existing data set
from a human-subjects experiment conducted within the 711th
Human Performance Wing
of the Air Force Research Laboratory. To enable the reader to understand this data set,
the participants, experimental design, apparatus, and experimental procedure from this
study is reviewed in this chapter. This chapter further summarizes the workload
assessment models that were created and the data analysis methods that were employed.
Participants
A total of 12 participants (8 males, 4 females) ranging from 18-46 years of age
(M=25.66) completed the study. Two additional participants began the study, but one
withdrew and another failed to follow the experimental directions. Each participant was
randomly assigned to a separate experimental condition in which they experienced the
experimental scenarios in different orders. Recruitment was completed in a gender
neutral manner. Participants were recruited locally (Midwest Region) from among Air
Force Institute of Technology (AFIT) students, Wright State University (WSU) students,
University of Dayton students, Wright Site Junior Force Council members, and Air Force
Research Laboratory personnel. All participants were able to communicate in written
and spoken English. No previous experience with RPAs was required. Participants were
excluded if they were not fluent in English, or if they had specific motor, perceptual, or
cognitive conditions which prevented them from operating a computer, reading small

39
characters on a computer monitor, or hearing and comprehending verbal commands
through computer speakers. All participants were right handed and self reported to have
normal or corrected-to-normal eyesight with no color blindness. All included participants
reviewed and signed an informed consent form in accordance with human research ethics
guidelines and participated in 4 experiment sessions beyond the initial training.
Participants were paid $15 per hour for their participation. Each session averaged an
estimated 3 hours and did not exceed 4 hours.
Experimental Design and Apparatus
This research was conducted at the Human Universal Measurement and
Assessment Network (HUMAN) Laboratory in the 711th
Human Performance Wing
(HPW) Collaborative Interfaces Branch (RHCP) with contracting support from Aptima,
Inc. and Oak Ridge Institute for Science and Education (ORISE). The study was
designed to quantify cognitive states of RPA operators through simulated missions within
a simulated environment known as Vigilant Spirit. The missions or scenarios varied in
difficulty and the type of demands imposed on the operators. During the experiment the
participants’ performance and numerous physiological indicators were collected.
Additionally, subjective workload measures, a Short Stress State Questionnaire, and
background questionnaires were administered.
This study included 2 tasks (surveillance and tracking) each with 4 levels of
difficulty (e.g., task load). For the surveillance task, participants’ were required to find
and track a high value target (HVT) amidst distractors. The task load was manipulated by
modifying the number of distractors (e.g., low; 16 or high; 48) and the clarity of the

40
visual feed (e.g., fuzz or no fuzz). A distractor was anyone walking around during the
task who was not carrying a rifle. The low distractor condition included 8 empty-handed
women, 7 individuals carrying pistols, and 1 individual carrying a shovel. The high
distractor condition included 24 empty-handed women, 20 individuals carrying pistols,
and 4 individuals carrying shovels. For the tracking task, task load was modified by
manipulating the number of targets to follow (1 or 2) and the terrain conditions (country
highway or city streets). Each participant experienced one surveillance condition
followed by one tracking condition using a total of 16 different scenarios. The
surveillance condition always preceded the tracking condition. Within the 16 surveillance
conditions and 16 tracking conditions there were 4 different task load conditions each
experienced 4 times. Even though the task load conditions were repeated, the scenarios
differed based on designed routes of the targets. These manipulations result in two 2x2
full-factorial designs, resulting in 4 difficulty conditions; for additional data points each
participant received each condition 4 times.
Participants completed the tasks using a standard computer having one keyboard,
headset with microphone, a mouse, and three monitors. Each monitor was 24 inches
(diagonal) and participants predominately relied on the information from the middle
monitor. This monitor displayed all information relevant for the primary task and the
monitor on the right displayed the secondary task questions in text form. Performance
measures included: behavioral (i.e. button-press response times, mouse clicks, and voice
and messaging communications which presented the questions) and mission performance
(i.e. the operator’s ability to complete primary and secondary mission objectives)

41
measures. Participants’ performance scores during the surveillance task were based on
the timely identification of the High Value Targets (HVTs) and pursuit of the HVT once
found. Each HVT was worth a total of 200 points. Participants’ performance scores
during the tracking task were based upon the amount of time the target was in a simulated
sensor feed and increased with the centering of the target in the sensor feed for a
maximum of 800 points. Participants always started the experiment with the required
zoom level to achieve maximum points, but had the opportunity to zoom in or out as
desired, knowing that they would lose points if they zoomed out.
During the experiment several physiological measures were collected, including:
electroencephalogram (EEG), electrocardiogram (ECG), electrooculogram (EOG),
respiration (amplitude and frequency), galvanic skin response, video based eye gaze and
pupilometry, and voice stress analysis. Additionally, saliva was collected before and near
the end of each trial to permit exploration of biomarkers. Body-mounted physiology
recordings were collected using the BioRadio 150. The BioRadio 150 is a battery
powered wireless device which was developed by Cleveland Medical Devices. The
device recorded, stored, and completed simple processing of the biologically produced
electrical signals. The User Unit of the BioRadio 150 is capable of amplifying and
filtering data for signal conditioning as well as converting from analog-to-digital. The
current research involved analysis of select physiological data, including ECG and EOG.
ECG and EOG were each recorded with a sampling frequency of 400 Hz. In addition to
the objective measures, participants completed the NASA Task Load Index (TLX) and
the counterpart of the Dundee Stress State Questionnaire (DSQ), the Short Stress State

42
Questionnaire (SSQ), which is located in Appendix A. NASA-TLX was used to collect
subjective or perceived workload and is located in Appendix B. The SSSQ was used to
collect subjective stress state to understand the following task-stressors: task engagement,
distress, and worry. The data was collected immediately following each surveillance trial
and tracking trial, prior to the start of the next scenario. It was transmitted to a centralized
data bus developed by Aptima, Inc. and stored on its own secure closed-network server.
Procedure
The participants completed two sessions(approximately 2 hours in duration)
consisting of study briefings and system training and the other four sessions
(approximately 3 hours in duration) for data collection totaling an average of 17 hours.
The 4 hours of training were divided over two training days, and the experimental
sessions were completed on subsequent days. Participants were told their participation
would help assess cognitive states and define adaptive aiding strategies for RPA
operations. They were reminded they were allowed to stop participating at any time.
Training was completed by first introducing participants to the Vigilant Spirit Control
Station shown in Figure 7: Vigilant Spirit Control Station (Middle monitor)Figure 7 and
Figure 7, and a Multi-Modal Communication tool as shown in Figure 8. The Vigilant
Spirit Control Station was on the far left and middle monitor and the Multi-Modal
Communication tool was on the monitor furthest to the right.

43
Figure 6: Vigilant Spirit Control Station (Far left monitor)
Figure 7: Vigilant Spirit Control Station (Middle monitor)

44
Figure 8: Multi-Modal Communication
The participants were trained to use the Vigilant Spirit Control Station and Multi-
Modal Communication by breaking the required tasks into smaller skills which were
trained one-at-a time to achieve a target minimum level of proficiency. This was
followed by full-length training missions, which integrated all skills. The different
scenarios and conditions are shown in Table 2. The training missions increased in
difficulty throughout the training session. The scenario order for each participant varied
during the actual experimental trials.

45
Table 2: Scenarios and Conditions
Scenario Surveillance Condition Tracking Condition
1 1: Low Distractors, No Fuzz 1: One Target, Country Route
2 1: Low Distractors, No Fuzz 2: Two Targets, Country Route
3 1: Low Distractors, No Fuzz 3: One Target, City Route
4 1: Low Distractors, No Fuzz 4: Two Targets, City Route
5 2: High Distractors, No Fuzz 1: One Target, Country Route
6 2: High Distractors, No Fuzz 2: Two Targets, Country Route
7 2: High Distractors, No Fuzz 3: One Target, City Route
8 2: High Distractors, No Fuzz 4: Two Targets, City Route
9 3: Low Distractors, Fuzz 1: One Target, Country Route
10 3: Low Distractors, Fuzz 2: Two Targets, Country Route
11 3: Low Distractors, Fuzz 3: One Target, City Route
12 3: Low Distractors, Fuzz 4: Two Targets, City Route
13 4: High Distractors, Fuzz 1: One Target, Country Route
14 4: High Distractors, Fuzz 2: Two Targets, Country Route
15 4: High Distractors, Fuzz 3: One Target, City Route
16 4: High Distractors, Fuzz 4: Two Targets, City Route
Each of the experimental sessions included a period for sensor calibration and a
baseline physiological data collection task in which the physiology measures were
recorded while the participants completed a subjective questionnaire to include
demographic and lifestyle factors. Each participant completed 16 scenarios with each one
lasting approximately 17 minutes. However, the exact duration of the experimental trial
depended on the task conditions being performed, with the maximum session not
exceeding four total hours. As mentioned, each of the 16 experimental trials were
completed with one of the surveillance conditions followed by one of the tracking
conditions for a total of 16 surveillance and 16 tracking combinations as shown in Table
2. The unique order or trial order of scenarios each participant experienced differed and
are provided in Appendix C.

46
During each scenario, participants operated the VSCS which simulated
instrument, control, and display panels, simulating control of multiple RPAs. The MMC
tool simulated audio call signals, radio chatter, and chat (text) messages to the operator
during the scenarios. Following the completion of each surveillance condition and each
tracking condition of a scenario the participants filled out the NASA TLX and the Short
Stress State Questionnaire (SSSQ) subjective assessments as mentioned above. The
questionnaires and assessments were collected in an electronic format using Aptima’s
Scenario-based Performance Observation Tool for Learning in Team Environments
(SPOTLITETM
). SPOTLITETM
is a generic platform used to streamline the observer
based measures or self-reported measures data collection process.
Physiological data were collected continuously throughout the scenarios for all
sessions. Performance data were collected as participants completed or failed to complete
tasks in the scenarios. The scenario timeline is shown in Table 3. The surveillance or
tracking tasks were the primary task variables. There was an additional secondary task
during each scenario representing two-way communications over a radio in the form of
math questions. The participants were instructed to answer the four auditory math
questions within 30 seconds of hearing it, if they felt they could successfully complete
both tasks. Additionally, the audio transcript was displayed as text in the MMC window
of the control station. Participants were able to reference the text version of the question
prior to answering the math question. Participants answered the questions by holding
down the spacebar and orally saying their response.

47
Table 3: Scenario Timeline

48
Scoring was based on individual performance, and points in the surveillance
scenarios were awarded for locating the HVT carrying a weapon in the market place and
keeping the HVT on screen at the correct zoom level before the target disappeared under
a tent. Performance points in the tracking scenarios were awarded for having the target on
the screen and additional points were awarded based on how close the target was to the
center of the screen. Supplementary points in both scenarios were awarded for correctly
answering the math questions within thirty seconds of hearing the questions. Points were
deducted for incorrect answers during the secondary task and no points were awarded or
deducted for failing to answer the communications. The maximum score for either task
was 1000 points.
Model Selection and Validation
Discrete Event Simulation (DES) models can be used to estimate dynamic system
or operator performance over time. DES using IMPRINT permits an analyst to model the
cognitive demands of operators during specific tasks to provide an objective estimate of
operator cognitive workload. To construct such a model, a task analysis was performed
on the surveillance and tracking scenarios, task networks were developed as shown in
Figure 9, Figure 10, and Figure 11. The Task Network Diagrams help illustrate the tasks
participants completed throughout the scenarios. The difficulty varied within the number
of distracters present for the surveillance model and the number of targets and route in
the tracking model. The difficulty is not portrayed in the Task Network Diagrams below,
but rather is captured in the individual task times probability distributions. Pink tasks
were completed by the interface and blue tasks were completed by the participant.

49
Figure 9: Surveillance Scenario Baseline Task Network Diagram
Figure 10: Tracking Scenario Baseline Task Network Diagram

50
Figure 11: Tracking Scenario with Two Targets Baseline Task Network Diagram

51
Visual, auditory, cognitive, and perceptual workload values were assigned to each
task within the model. Task response times, obtained from the performance data for each
participant for each scenario were added to create a set of 16 unique, user-specific models
for each participant. The reader should note that while IMPRINT models typically
include stochastic variables, the models employed here were deterministic in nature,
modeling the tasks with the exact times taken from each individual’s performance data.
Once the model was completed for each participant, a simulation was run for each
participant in IMPRINT to obtain objective cognitive workload values as a function of
time.
As shown in the timeline in Table 3 and in Figure 9, the Surveillance Scenario
Baseline Task Network Diagram started with a HVT which appeared 10 seconds after the
trial began. There were four HVTs and the remaining three HVTs appeared at 69, 129,
189 seconds. Tasks 2 was the time spent searching for the target. Task 3 was the time
spent following a target that had been found. If the participant lost the target, Task 4
would initiate until they either re-found the current HVT or the target permanently
disappeared into the tent. The HVTs entered the tent at 69, 129, 189, and 264 seconds
during each trial as shown in Task 5. This process repeats until the last HVT entered the
tent, at which point the trial ended. During the trial, the participants would hear a
question in Task 6 at 33, 93, 153, and 228 seconds. Participants then considered the
question from 1-30 seconds in Task 8 and responded in Task 7. Once the internal clock
reached 265 seconds and all four questions had been asked, which coincided with the
fourth target entering the tent, the scenario ended.

52
There were two separate tracking scenarios, one in which there was one HVT and
another in which there were two HVTs. As shown in the timeline in Table 3 and Figure
10, the Tracking Scenario Baseline Task Network Diagram started with a HVT which
appeared 20 seconds after the trial began. Once the participant located the HVT where
they were trained to look for it, they followed the HVT on foot in Task 2. If they lost the
HVT during this time, they searched for the HVT in Task 5. They continued to follow the
HVT on the Bike in Task 15 starting at 80 seconds until the HVT enter a tent at the end
of the scenario in Task 23. If the participant lost the HVT at any point they would search
for the HVT on the Bike in Task 17. After the HVT entered the tent, the trial ended.
During the trial the participants would hear a question in Task 12 at 134, 194, 254, and
314 seconds. Participants then considered the question from 1-30 seconds in Task 28 and
responded in Task 13. Once the internal clock reached 380 seconds which coincided
with the HVT entering the tent, the scenario ended.
As shown in the timeline in Table 3 and in Figure 11, the Tracking Scenario with
Two Targets Baseline Task Network Diagram started with a HVT which appeared 20
seconds after the trial began. Once the participant located HVT1 where they were trained
to look for it, they followed the HVT in Task 10. They continued to follow HVT1 on the
Bike in Task 15 starting at 80 seconds until HVT1 enter a tent at the end of the scenario
in Task 23. If the participant lost HVT1 at any point they would search for HVT1 on the
Bike in Task 17. The second HVT appeared at 50 seconds. Once the participant located
HVT2 where they were trained to look for it, they followed HVT2 in Task 11. They
continued to follow HVT2 on the Bike starting at 110 seconds in Task 24 and eventually

53
watched HVT2 enter a tent at the end of the scenario in Task 27. If the participant lost
HVT2 at any point they would search for HVT2 on the Bike in Task 26. Thus, the
participant was responsible for tracking both targets simultaneously. After both HVTs
entered the tents, the trial ended. During the trial the participants would hear a question
in Task 28 at 134, 194, 254, and 314 seconds. Participants then considered the question
from 1-30 seconds in Task 30 and responded in Task 29. Once the internal clock reached
410 seconds which coincided with both HVTs entering the tent, the scenario ended.
Verification of the baseline model was conducted using peer walkthroughs and a
subject matter expert (SME) from 711th
Human Performance Wing (HPW) Collaborative
Interfaces Branch (RHCP) who provided workload data. The SME, who helped designed
the study, walked through the Task Network Diagrams for logical flow and gave
predicted workload values based on the baseline model task descriptions and an
explanation of VACP. Additionally the model was validated against task times and
performance. IMPRINT measures workload based on the length of time an operator
spends doing a specific task in relationship to the combined VACP value determined for
the interfaces of each specific task as seen in Table 4. The DES models cognitive
workload which enables the creation of initial workload profiles. These workload
profiles are used to show the individual differences in objective operator workload.
Figure 12 provides an example of a workload profile.

54
Table 4: VACP Workload Assigned by Task Node
Brain
(Cognitive)
Headset
(Auditory)
Headset
(Speech)
Keyboard
(Fine
Motor)
Mouse
(Fine
Motor) Monitor (Visual)
HVT
Appears
0.0 0.0 0.0 0.0 0.0 0.0
Find HVT 4.6 (Evaluation/
Judgment)
0.0 0.0 0.0 2.6
(Continuous
Adjustive)
6 .0
(Visually Scan/
Search/Monitor)
Follow
HVT
4.6 (Evaluation/
Judgment)
0.0 0.0 0.0 2.6
(Continuous
Adjustive)
4.4
(Visually Track/
Follow)
Lose HVT 4.6 (Evaluation/
Judgment)
0.0 0.0 0.0 2.6
(Continuous
Adjustive)
6 .0
(Visually Scan/
Search/Monitor)
HVT in
Tent
0.0 0.0 0.0 0.0 0.0 0.0
Hear
Question
0.0 6 .0
(Interpret
Semantic
Content)
0.0 0.0 0.0 0.0
Respond
0.0 0.0 2 .0
(Simple)
2.2
(Discrete
Actuation)
0.0 0.0
Consider
Question
7 .0
(Estimation,
Calculation,
Conversion)
0.0 0.0 0.0 0.0 0.0
There are no Gross Motor Workload values because there are no high physical strain activities.
There are no Tactile Workload values because there are no system alerts that touch the human body.
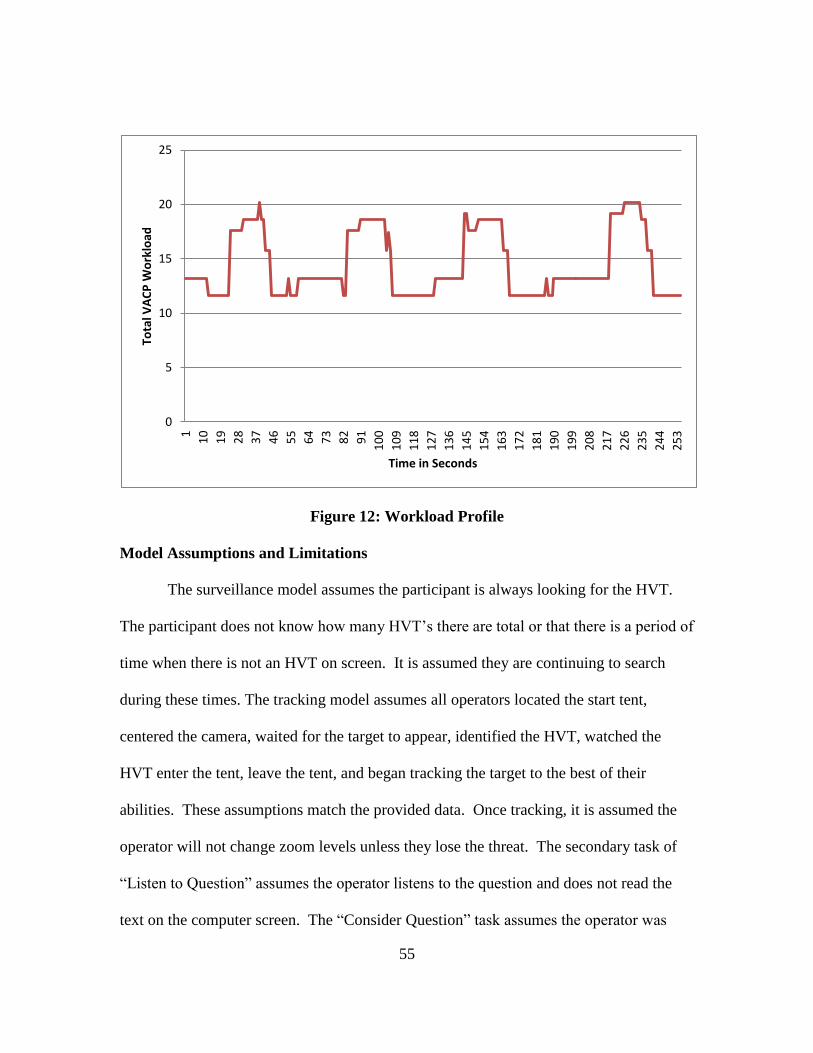
55
Figure 12: Workload Profile
Model Assumptions and Limitations
The surveillance model assumes the participant is always looking for the HVT.
The participant does not know how many HVT’s there are total or that there is a period of
time when there is not an HVT on screen. It is assumed they are continuing to search
during these times. The tracking model assumes all operators located the start tent,
centered the camera, waited for the target to appear, identified the HVT, watched the
HVT enter the tent, leave the tent, and began tracking the target to the best of their
abilities. These assumptions match the provided data. Once tracking, it is assumed the
operator will not change zoom levels unless they lose the threat. The secondary task of
“Listen to Question” assumes the operator listens to the question and does not read the
text on the computer screen. The “Consider Question” task assumes the operator was
0
5
10
15
20
25
1
10
19
28
37
46
55
64
73
82
91
10
0
10
9
11
8
12
7
13
6
14
5
15
4
16
3
17
2
18
1
19
0
19
9
20
8
21
7
22
6
23
5
24
4
25
3
Tota
l VA
CP
Wo
rklo
ad
Time in Seconds

56
calculating the answer from the time the question ended until they pressed the space bar
to provide an answer. The individual models account for the actual performance of the
participants. A major limitation of this study is the small sample size and the relative high
performance of most participants for the tracking task.
Data Analysis
The hypothesis that there were four distinct divergent groups of individuals based
on their average perceived workload ratings from NASA-TLX and their performance was
tested looking for the most extreme participants based on the Euclidian distance from the
origin and a MANOVA for statistical significance. The raw NASA-TLX scores were
used due to the specific nature of this experiment and the similarity of dimensions
required by the task across all scenarios. The NASA-TLX and performance data for both
the surveillance and tracking conditions were checked for normality by comparing he
skewness and kurtosis values combined and separately against the threshold range of -1
to 1 (Field 2009). If one of the conditions did not pass the test for normality, it would be
scaled or eliminated from further analysis. The NASA-TLX and performance values were
each normalized using z-scores to determine each participants’ centroid. A participant
centroid was calculated for each participant using the average of each participant’s
normalized workload and performance scores across the scenarios to compute a vector
(mean normalized workload, mean normalized performance). The distance was
calculated using the participant centroid coordinates, specifically the Euclidean distance
of the centroid from the origin and is shown in Equation 1.

57
Equation 1
2 2
x y x y((S , S ), (0,0)) ((S -0) +(S -0) )Dist
(1)
where:
Sx= NASA-TLX average for Participant
Sy= Performance average for Participant
The MANOVA examined each participant as its own separate group, combining
the NASA-TLX and performance scores for each individual to represent the participant
across all 16 scenarios. Participants were grouped together to determine if overall, they
were divergent from each other across all scenarios. The MANOVA quantitatively tested
if the participants differed across the NASA-TLX and performance spectrums separately.
Individuals, who showed statistical significance for both scales, would be said to
represent the distinct groups. Participants who visually looked like they were more
representative of the distinct group were added in the remaining analyses, noting they
were not significant representations of that group.
The hypothesis that there were measures which were characteristic of red-line
individuals was tested by first looking for the specific scenarios in which participants
were identified as being in the top ten highest workload and bottom ten lowest performers
as well as the bottom ten lowest workload and top ten highest performers based on the
scores for all 192 scenarios. The objective workload of these specific scenarios and
individuals were analyzed looking at the minimum, maximum, average, range, total sum
of VACP, and time spent in each task, to determine if patterns existed in those areas
which were representative of red-line participants and not. Since patterns were found,

58
VACP was used to analyze the overarching hypothesis, that there would be a weak
correlation between the objective workload (VACP) and physiological data when the
perceived workload (NASA-TLX) was low and moderate to high correlation between the
objective workload (VACP) when the perceived workload (NASA-TLX) was high.
The tracking condition one (one target, country route) was used as a vanilla
baseline in a portion of the physiology analysis. The tracking condition one was chosen
because it was a minimally demanding task. Specifically, the time from when the
participant started tracking the target on the motorcycle to the moment just before the
first question was asked was used to compute a vanilla baseline value. This was a 24
second period of time. Each participant experienced this condition four times. Two
vanilla baselines were calculated. One encompassed all four conditions, which spread
across multiple sessions on different days. The other used the 24 seconds from the second
session. This second session occurred on the second day. The second session on the
second day was chosen as one of the vanilla baselines to ensure the data was not the first
experimental scenario on any day and to help minimize potential learning effects which
could have occurred. The change in HR and HRV were calculated by taking the scenario
specific data from HR and HRV minus the vanilla baseline. Blinks were counted across a
sliding 60 second interval and given a value for each second. The fixation values
represent the amount of time between saccades. It was expected that there would be a
higher correlation with the physiological measures when individuals reported being
stressed, which manifest itself in higher NASA-TLX scores.
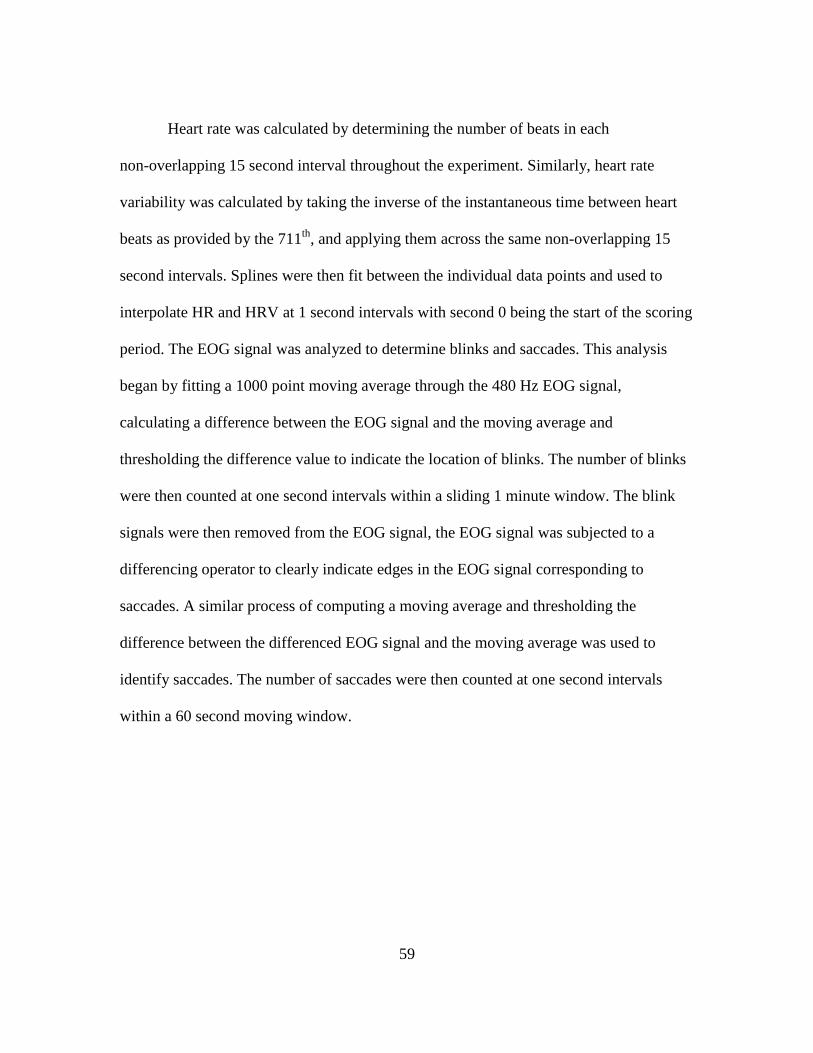
59
Heart rate was calculated by determining the number of beats in each
non-overlapping 15 second interval throughout the experiment. Similarly, heart rate
variability was calculated by taking the inverse of the instantaneous time between heart
beats as provided by the 711th
, and applying them across the same non-overlapping 15
second intervals. Splines were then fit between the individual data points and used to
interpolate HR and HRV at 1 second intervals with second 0 being the start of the scoring
period. The EOG signal was analyzed to determine blinks and saccades. This analysis
began by fitting a 1000 point moving average through the 480 Hz EOG signal,
calculating a difference between the EOG signal and the moving average and
thresholding the difference value to indicate the location of blinks. The number of blinks
were then counted at one second intervals within a sliding 1 minute window. The blink
signals were then removed from the EOG signal, the EOG signal was subjected to a
differencing operator to clearly indicate edges in the EOG signal corresponding to
saccades. A similar process of computing a moving average and thresholding the
difference between the differenced EOG signal and the moving average was used to
identify saccades. The number of saccades were then counted at one second intervals
within a 60 second moving window.

60
IV. Analysis and Results
Chapter Overview
The analysis of the data as outlined by Chapter 3 is explained in Chapter 4.
Detailed results for each investigation are provided. The results are interpreted and
summarized in the discussions in context to the current areas of interests.
NASA-TLX and Performance Score Results
Normality was examined by looking at the skewness and kurtosis of the raw
NASA-TLX and performance data for both the surveillance and tracking tasks as well as
the data from the combination of the tasks. The raw data separated by task type,
Surveillance and Tracking, are shown in Figure 13 and Figure 14 respectively. As
visually demonstrated in Figure 13, Surveillance scores appear to differ along both the
NASA-TLX and Performance axes while the participants’ performance was generally
high across all experimental trials for the tracking task. The Surveillance and Tracking
data when combined were normally distributed, with NASA-TLX having a skewness of
0.391 (SE= 0.125) and kurtosis of -0.457 (SE=0.248) and performance a skewness of
-0.622 (SE= 0.125) and kurtosis of -0.811 (SE=0.248). Data is normally distributed if the
skewness and kurtosis values fall within the range from -1 to 1 (Field 2009). When
separated, data for the surveillance task alone was also normally distributed, with
NASA-TLX having a skewness of 0.332 (SE= 0.175) and kurtosis of -0.383 (SE=0.349)
and performance having a skewness of -0.135 (SE= 0.175) and kurtosis of -0.723
(SE=0.349). However, data for the tracking task alone was non-normality distributed,

61
with NASA-TLX having a skewness of 0.421 (SE= 0.175) and kurtosis of -0.553
(SE=0.349) and performance having a skewness of -3.202 (SE= 0.175) and kurtosis of
14.187 (SE=0.349). This statistical description confirms that there is a clear ceiling effect
in participants’ performance scores for the tracking task. As the primary focus of this
thesis is to investigate individual differences between participants whose subjective
workload ratings and performance scores differed, the tracking task was eliminated from
further analysis, permitting focused investigation of the surveillance task data.
Figure 13: Surveillance Data
Figure 14: Tracking Data
0
200
400
600
800
1000
0 20 40 60 80 100
Pe
rfo
rman
ce D
ata
NASA-TLX Data
0
200
400
600
800
1000
0 20 40 60 80 100
Pe
rfo
rman
ce D
ata
NASA-TLX Data
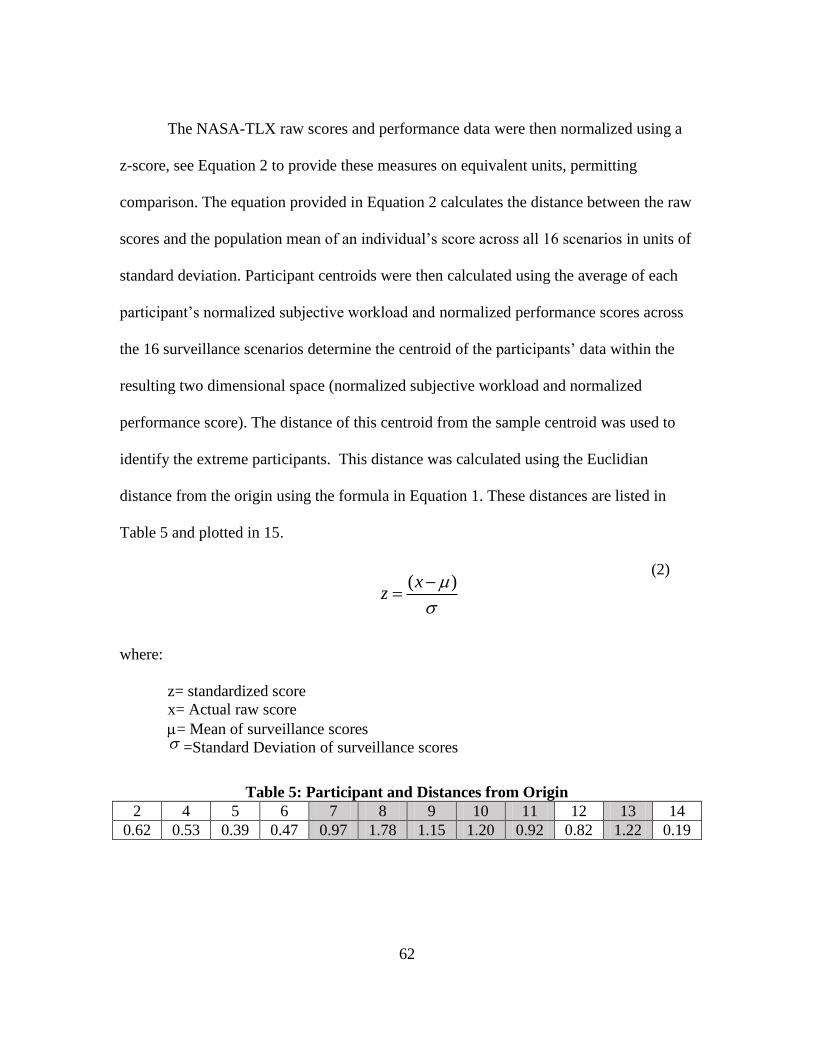
62
The NASA-TLX raw scores and performance data were then normalized using a
z-score, see Equation 2 to provide these measures on equivalent units, permitting
comparison. The equation provided in Equation 2 calculates the distance between the raw
scores and the population mean of an individual’s score across all 16 scenarios in units of
standard deviation. Participant centroids were then calculated using the average of each
participant’s normalized subjective workload and normalized performance scores across
the 16 surveillance scenarios determine the centroid of the participants’ data within the
resulting two dimensional space (normalized subjective workload and normalized
performance score). The distance of this centroid from the sample centroid was used to
identify the extreme participants. This distance was calculated using the Euclidian
distance from the origin using the formula in Equation 1. These distances are listed in
Table 5 and plotted in 15.
Equation 2
( )xz
(2)
where:
z= standardized score
x= Actual raw score
= Mean of surveillance scores =Standard Deviation of surveillance scores
Table 5: Participant and Distances from Origin
2 4 5 6 7 8 9 10 11 12 13 14
0.62 0.53 0.39 0.47 0.97 1.78 1.15 1.20 0.92 0.82 1.22 0.19
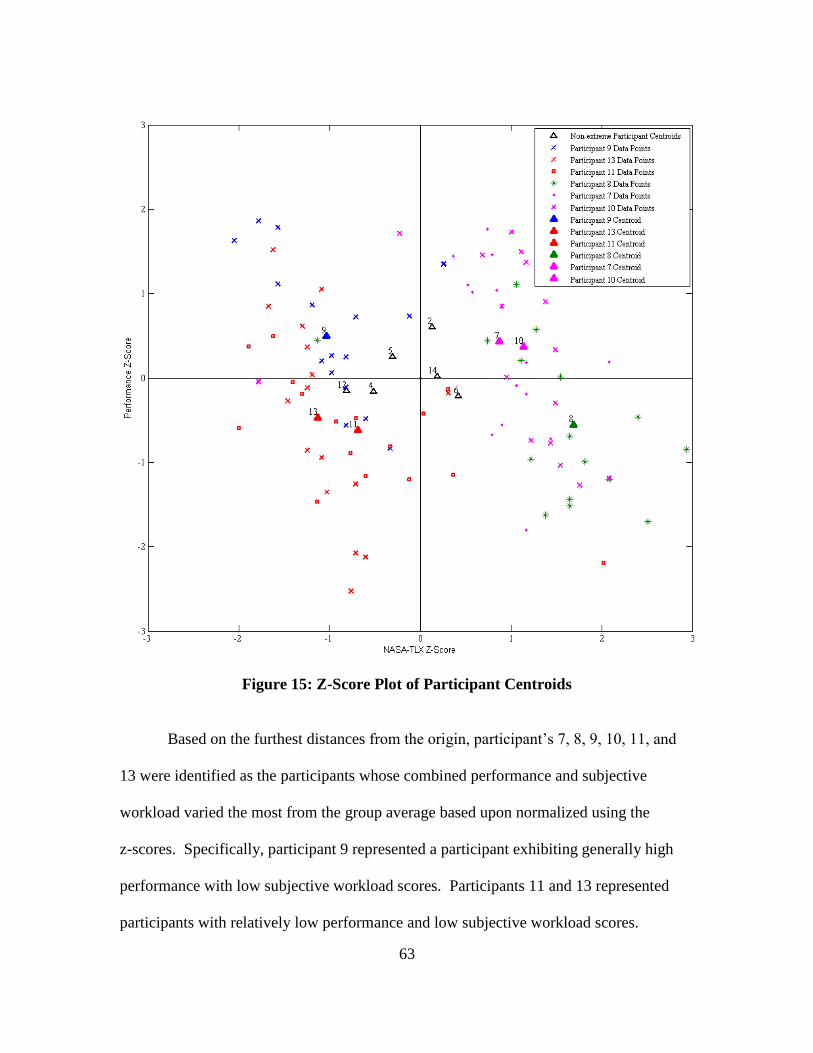
63
Figure 15: Z-Score Plot of Participant Centroids
Based on the furthest distances from the origin, participant’s 7, 8, 9, 10, 11, and
13 were identified as the participants whose combined performance and subjective
workload varied the most from the group average based upon normalized using the
z-scores. Specifically, participant 9 represented a participant exhibiting generally high
performance with low subjective workload scores. Participants 11 and 13 represented
participants with relatively low performance and low subjective workload scores.

64
Participants 7 and 10 represent participants with generally high performance and high
subjective workload scores and participant 8 exhibited relatively low performance and
high subjective workload scores.
To quantitatively test if the participants differed across both of the NASA-TLX
and performance spectrua, a MANOVA was applied to the surveillance data. The
MANOVA combined the NASA-TLX and performance scores for each individual as a
group to represent the participant across all 16 surveillance scenarios. A MANOVA
examined NASA-TLX and Performance as Dependent Variables (DVs) and the groups of
participants as Independent Variables (IVs). A one-way MANOVA revealed a significant
multivariate main effect for participants; Wilks’ λ = .140, F (22, 258) = 27.20, p <. 001,
partial eta squared = .626. Wilks’ lambda directly measures the proportion of variance in
the combination of DVs that is unaccounted for by the IV and ranges from 0 (no variance
in the DV is predicted by the IV) to 1 (the variance in the DV is fully predicted by the
IV).
A Tukey’s Post Hoc test was used to determine the difference between mean
NASA-TLX and Performance values between participants. Table 6 shows the results of
the Tukey HSD test which found the highlighted participant combinations to be
significantly different from each other based on NASA-TLX scores (p< 0.05).

65
Table 6: NASA-TLX Tukey HSD Results
2 4 5 6 7 8 9 10 11 12 13
4 0.027 -
5 0.438 0.992 -
6 0.916 0.000 0.006 -
7 0.004 0.000 0.000 0.365 -
8 0.000 0.000 0.000 0.000 0.001 -
9 0.000 0.166 0.005 0.000 0.000 0.000 -
10 0.000 0.000 0.000 0.006 0.948 0.111 0.000 -
11 0.001 0.999 0.633 0.000 0.000 0.000 0.744 0.000 -
12 0.000 0.896 0.197 0.000 0.000 0.000 0.986 0.000 1.000 -
13 0.000 0.042 0.001 0.000 0.000 0.000 1.000 0.000 0.389 0.848 -
14 1.000 0.009 0.239 0.984 0.014 0.000 0.000 0.000 0.000 0.000 0.000
Table 7 shows the results of the Tukey HSD test for performance. Highlighted
cells indicate participant mean difference values which were indicated to indicate
statistically different scores between pairs of participants (p< 0.05).
Table 7: Performance Tukey HSD Results
2 4 5 6 7 8 9 10 11 12 13
4 0.483 -
5 0.996 0.984 -
6 0.371 1.000 0.959 -
7 1.000 0.830 1.000 0.732 -
8 0.029 0.989 0.384 0.997 0.127 -
9 1.000 0.713 1.000 0.599 1.000 0.076 -
10 1.000 0.913 1.000 0.843 1.000 0.199 1.000 -
11 0.016 0.965 0.286 0.987 0.076 1.000 0.044 0.126 -
12 0.506 1.000 0.987 1.000 0.846 0.986 0.734 0.924 0.958 -
13 0.061 0.999 0.556 1.000 0.225 1.000 0.144 0.329 1.000 0.998 -
14 0.837 1.000 1.000 1.000 0.985 0.852 0.955 0.996 0.743 1.000 0.944
NASA-TLX and Performance Score Discussion
NASA TLX scores for participants 9 and 11 were statistically lower than the
NASA TLX scores for participants 2 and 8, suggesting participants 9 and 11 represent
individuals who provided low subjective workload ratings and 2 and 8 represent

66
participants who provided high subjective workload ratings. Mean performance scores
for participants 2 and 9 was statistically higher than the mean performance score for
participant 11. This finding suggests that participant 11 is representative of a low
performing individual among the available participants and 2 and 9 represent the high
performing individuals among the available participants. The performance for participant
8 was statistically lower than the performance for participant 2 suggesting participant 8
represents the low performing individual. Although the performance for participants 7
and 10 was not statistically different from the performance of participants 8, their
NASA-TLX values were statistically higher than the NASA TLX values for most
participants, including participant 2, which is in the same high performance-high
subjective workload quadrant. Therefore, the data from these participants was retained
for further analysis since their centroids were further from the origin as displayed in 15
than participant 2. This interpretation is visually represented in Table 8 and the
descriptive statistics of the divergent participants are shown in Table 9.
Table 8: Divergent Participants
Low Workload High Workload
High Performance Participant 9 Participant 2
(with analysis of 7&10)
Low Performance Participant 11 Participant 8
Table 9: Descriptive Statistics of Divergent Participants
Descriptive Statistics P2 P8 P9 P11 P7 P10
Mean-NASA-TLX 42.24 66.51 24.12 29.58 53.75 57.92
Standard Deviation- NASA-TLX 6.08 9.15 7.90 16.43 4.35 8.78
Mean-Performance 660.42 469.09 642.50 458.46 631.82 621.30
Standard Deviation-Performance 114.20 144.48 134.69 116.93 166.24 184.30

67
As shown in Table 8, participants’ individual data sets were shown to differ from
one another based upon perceived workload ratings (NASA-TLX) and performance. The
individual differences between participants were identified using the greatest distance
from the origin and as well as quantitatively through the MANOVA analysis. Further
analysis of theses participants’ data will be conducted to answer Investigative Questions
2 and 3. This analysis generally confirms Hypothesis 1 as the performance of some
individuals were statistically different from other participants in terms of their subjective
workload scores, performance or both.
VACP Red-line Characteristics Results
Individual participant scenarios were ranked according to a combination of
performance and NASA TLX. From these rankings the 3 participant scenarios with the
most extreme rankings were selected to explore the workload conditions associated with
red-line. For Participant 9, scenarios 11, 3, and 2, were identified as the most
representative for the high performing, low subjective workload participants. For
Participant 8, scenarios 13 and 8, and for participant 11, scenario 6, were identified as the
most representative for the low performing, high subjective workload participants. In
Table 10, Table 11, and Table 12, PX SY represents Participant number X in Scenario
number Y. The ranking of NASA-TLX and performance for each of the chosen scenarios
are shown in Table 10 with ranks ranging from 1 to 192.

68
Table 10: NASA-TLX and Performance Rankings
NASA-TLX Ranking Performance Ranking
P9 S11 1 9
P9 S3 4 1
P9 S2 9 3
P8 S13 182 179
P11 S6 186 191
P8 S8 191 186
Once identified, the objective workload values, as modeled by VACP, for the
specific participants and scenarios were analyzed to attempt to identify patterns that
differentiated red-lined participant-condition combinations from those that were not. The
minimum, maximum, range, time weighted average and sum of VACP values were
examined for each participant and scenario of interest and shown in Table 11. These
metrics showed that participant-scenario combinations having a high subjective workload
and low performance experienced a higher VACP average, except for P8 S13. Also, the
participant-scenario conditions having a high subjective workload and low performance
reached a higher maximum VACP value and had a higher sum of VACP values than
those in the low subjective workload, high performance category except for P8 S13.

69
Table 11: Descriptive VACP Statistics of Top and Bottom Ten
Low NASA-TLX Workload,
High Performance
High NASA-TLX Workload,
Low Performance
VACP P9 S11 P9 S3 P9 S2 P8 S13 P11 S6 P8 S8
Min 11.6 11.6 11.6 11.6 11.6 11.6
Max 19.20 18.60 19.20 20.20 20.20 20.20
Average 14.82 15.15 14.92 15.07 16.17 16.14
Range 7.6 7 7.6 8.60 8.60 8.60
Sum 3783.8 3862.8 3803.8 3844.6 4125.6 4114.8
Cond
Type
Low
Distractor
Fuzz
Low
Distractor
No Fuzz
Low
Distractor
No Fuzz
High
Distractor
Fuzz
High
Distractor
No Fuzz
High
Distractor
No Fuzz
The different surveillance subtasks are shown in Table 11 along with their
associated VACP values in parentheses. The total number of seconds each participant
spent in the outlined subtask throughout the scenario are also shown in Table 12.
Table 12: Time Spent across Surveillance Tasks of Top and Bottom Ten
Low NASA-TLX
Workload,
High Performance
High NASA_TLX
Workload,
Low Performance
Subtask (VACP value) P9 S11 P9 S3 P9 S2 P8 S13 P11 S6 P8 S8
Following HVT (11.6) 54 46 54 22 17 11
Find (Search for) HVT or
Lose HVT (13.2) 98 93 94 150 118 124
Follow HVT & Respond
(15.8) 11 10 12 2 0 3
Find (Search for) HVT &
Respond (17.4) 1 0 0 8 9 3
Follow HVT & Hear
Question (17.6) 23 28 23 0 0 0
Follow HVT & Consider
Question (18.6) 63 78 67 5 0 15
Find (Search for) HVT &
Hear Question (19.2) 5 0 5 28 28 28
Find (Search for) HVT &
Consider Question (20.2) 0 0 0 40 83 71
This information provided a noticeable pattern. The first three columns of Table
12, which includes participant-scenario combinations with low subjective workload and
70
high performance, show the participant always found the HVT before considering the
questions. Additionally, there were very few occurrences when the participant was
searching for the HVT while they heard the questions (10 seconds total) or while they
responded to the questions (1 second total). In contrast, the last three columns of Table
12, corresponding to participant-scenario combinations with high subjective workload
and low performance, show that the participants had not found the HVT when they heard
the questions. Additionally, there were very few occurrences when the participants were
following the HVT while they considered the questions (20 seconds total) or while they
responded to the questions (5 seconds total).
VACP Red-line Characteristic Discussion
Question one analyzed the performance and subjective workload of individual
participants across all surveillance scenarios. Question two initially determined the most
extreme scenarios in terms of both performance and subjective workload to identify the
scenarios which simultaneously had the lowest performance and highest subjective
workload ratings or had the highest performance and the lowest subjective workload
ratings. Participants who had difficulty performing the task and indicated high subjective
workload were analyzed separately in two groups of scenarios in an attempt to identify
scenarios which were clearly manageable by the participant. Through these means,
trends in VACP score were explored which might indicate differences in manageable
workload conditions versus workload conditions that were above red-line for at least
some period of time. Perhaps not surprisingly, the measures which are characteristics of
red-lined experimental conditions based on this analysis appear to stem from the addition

71
of the secondary task. The scenarios with high task performance and low subjective
workload generally included conditions in which the participant was able to quickly
identify the HVT, before the secondary task was introduced. Conversely, the scenarios
with low task performance and high subjective workload generally included conditions in
which the participant was not able to quickly identify the HVT and continued to search
for the HVT past the moment in time when the secondary task was introduced. However,
more analysis needs to be completed specifically breaking the 16 scenarios into groups
based on the four conditions. This will determine if the patterns were reliable measures to
identify individuals as red-line or not across similar scenario conditions.
Divergent Participant Physiological Measures and VACP Results
In order to investigate if the physiological measures correlated with the objective
workload profile for all of the divergent participants the HR, HRV, Blinks, and Fixations
were examined. Descriptive statistics of the physiological and VACP measures for the
participants whose subjective workload and performance differed the most from the mean
across participants are outlined in Table 13.
Table 13: Descriptive Statistics
P2 P8 P9 P11 P7 P10
Mean-HR 87.23 94.87 59.07 59.51 82.08 58.08
Standard Deviation-HR 6.20 10.93 5.98 6.95 7.56 7.75
Mean-HRV 0.03 0.04 0.05 0.11 0.04 0.06
Standard Deviation-HRV 0.03 0.05 0.03 0.08 0.03 0.09
Mean-Blinks 17.40 8.79 11.07 9.71 28.61 13.94
Standard Deviation-Blinks 7.80 4.06 4.69 4.61 7.52 6.78
Mean-Fixation 0.02 0.02 0.02 0.01 0.02 0.01
Standard Deviation-Fixation 0.01 0.004 0.01 0.002 0.004 0.003
Mean-VACP 15.03 15.41 15.42 14.84 15.29 14.96
Standard Deviation-VACP 3.02 3.21 3.16 2.99 3.08 3.05

72
HR, HRV, blinks, and fixations (saccades) were correlated with the objective
workload profile for all divergent participants across all 16 surveillance scenarios. It was
originally hypothesized that there would be a weak correlation between the objective
workload (VACP) and physiological data when the perceived workload (NASA-TLX)
was low and moderate to high correlation between the objective workload (VACP) when
the perceived workload (NASA-TLX) was high. This analysis assumed if a participant
was in the high workload, low performance or high workload, high performance, they
had a higher likelihood of experiencing red-line during the scenarios. Note that this
differs from the traditional definition of red-line. However, this assumption was
necessary to provide data from multiple participants in the red-line condition to facilitate
comparison.
Correlations of the physiological measures were run for each of the identified
participants to determine which physiological measures were statistically significant out
of HR, HRV, blinks, and fixations. HR and HRV metrics were determined as the
difference from vanilla baseline. The correlations for Participants 2, 8, 9, 11, 7 and 10 are
shown in Table 14, Table 14, Table 15, Table 16, Table 17, and Table 18, respectively
and statistically significant correlations are highlighted.
Participant 2 had a high subjective workload and high performance score and was,
therefore, assumed to be operating beyond red-line for at least a portion of some
experimental conditions. As shown in the correlation table for P2, there was a positive
and statistically significant correlation between VACP and HR, HRV, Blink Rate, and
Fixation which indicated that the higher the participant’s VACP the higher the

73
participant’s HR, HRV, Blink Rate, and Fixation. It is important to note, overall the data
did not show strong linear relationships and are likely not strong enough to be
meaningful. While significant, the low Pearson correlation coefficients indicated that a
very small portion of the variance in the VACP scores were accounted for by the
physiology measures, with these variance values ranging from 0.17% for HRV to 1.53%
for HR. The correlation between VACP and HR supports the hypothesis that HR will be
positively correlated for participants considered to be red-lined. The fact that the
correlation between VACP and HRV, Blink Rate, and Fixations was positive, opposite of
what was hypothesized. It is worth noting, however, that HR was negatively correlated
with HRV, blink rate and fixation rate as is typical in previous research.
Table 14: Participant 2 Pearson Correlation Matrix
HR HRV Blink Rate Fixation
HRV -0.168*** -
Blink Rate -0.079*** 0.127*** -
Fixation -0.050** 0.066*** 0.448*** -
VACP 0.124*** 0.041** 0.120*** 0.082*** Significance: * p-value < .05; ** p-value <.01; *** p-value <.001
Participant 8 had a high subjective workload and low performance score. As
predicted and shown in the correlation table for P8, there was a statistically significant
positive correlation between VACP and HR. Unexpectedly, Blink Rate also increased
with increasing VACP. There were not significant correlations between VACP and HRV
or Fixations. Again, the correlation among the measures was quite low. While
significant, Blink rate accounted for only 2.40% of the variance in the VACP score. HR
accounted for only 3.06% of the variance in the VACP score. The correlation between
VACP and HR supports the hypothesis that HR will be positively correlated for
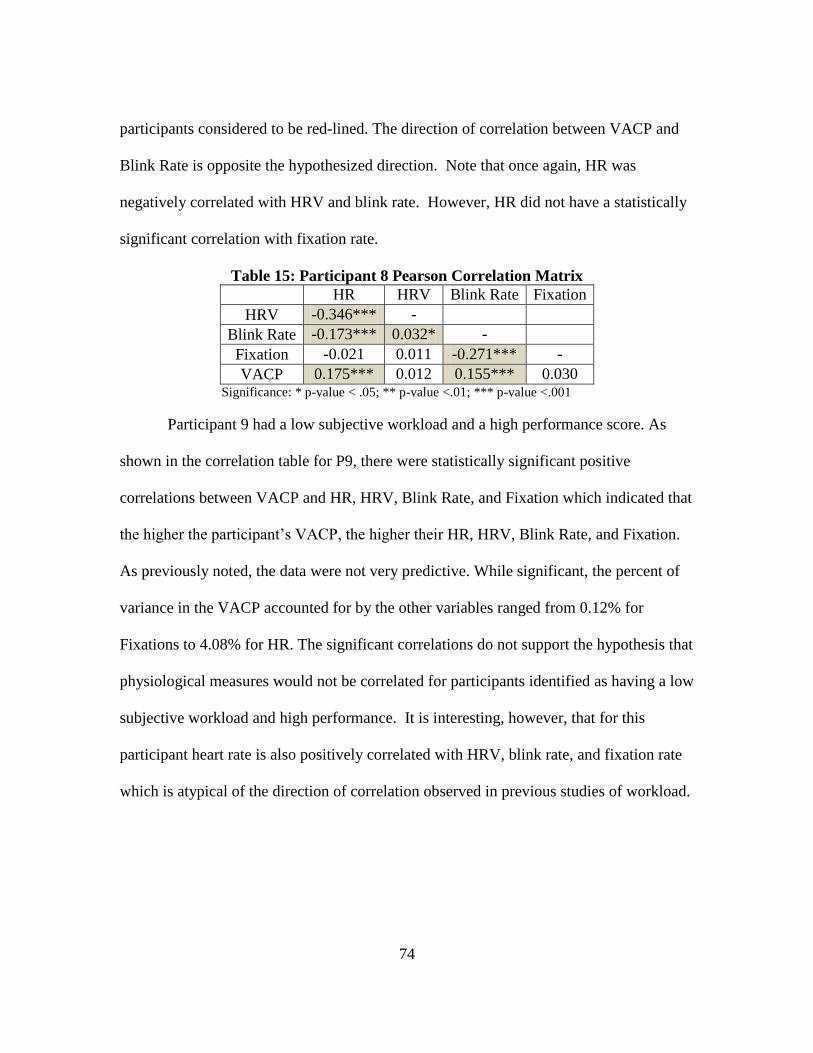
74
participants considered to be red-lined. The direction of correlation between VACP and
Blink Rate is opposite the hypothesized direction. Note that once again, HR was
negatively correlated with HRV and blink rate. However, HR did not have a statistically
significant correlation with fixation rate.
Table 15: Participant 8 Pearson Correlation Matrix
HR HRV Blink Rate Fixation
HRV -0.346*** -
Blink Rate -0.173*** 0.032* -
Fixation -0.021 0.011 -0.271*** -
VACP 0.175*** 0.012 0.155*** 0.030 Significance: * p-value < .05; ** p-value <.01; *** p-value <.001
Participant 9 had a low subjective workload and a high performance score. As
shown in the correlation table for P9, there were statistically significant positive
correlations between VACP and HR, HRV, Blink Rate, and Fixation which indicated that
the higher the participant’s VACP, the higher their HR, HRV, Blink Rate, and Fixation.
As previously noted, the data were not very predictive. While significant, the percent of
variance in the VACP accounted for by the other variables ranged from 0.12% for
Fixations to 4.08% for HR. The significant correlations do not support the hypothesis that
physiological measures would not be correlated for participants identified as having a low
subjective workload and high performance. It is interesting, however, that for this
participant heart rate is also positively correlated with HRV, blink rate, and fixation rate
which is atypical of the direction of correlation observed in previous studies of workload.

75
Table 16: Participant 9 Pearson Correlation Matrix
HR HRV Blink Rate Fixation
HRV 0.091*** -
Blink Rate 0.176*** 0.026 -
Fixation 0.122*** 0.038* -0.162*** -
VACP 0.202*** 0.036* 0.072*** 0.034* Significance: * p-value < .05; ** p-value <.01; *** p-value <.001
Participant 11 had a low subjective workload and low performance score. As
shown in the correlation table for P11, there were statistically significant positive
correlations between VACP and HR and Blink Rate which indicated that the higher the
participant’s VACP, the higher their HR and Blink Rate. Similarly, the measures were
not highly correlated. While significant, the variance in the VACP scores accounted for
by the other measures ranged from only 0.88% for HRV to 1.98% for HR. The significant
correlations do not support the hypothesis that physiological measures would not be
correlated for participants identified as having a low subjective workload and low
performance. However, once again, HR was atypically positively correlated with HRV
and blink rate. HR was not significantly correlated with fixation rate.
Table 17: Participant 11 Pearson Correlation Matrix
HR HRV Blink Rate Fixation
HRV 0.384*** -
Blink Rate 0.070*** 0.123*** -
Fixation -0.009 -0.056*** -0.390*** -
VACP 0.141*** 0.024 0.094*** -0.003 Significance: * p-value < .05; ** p-value <.01; *** p-value <.001
Participant 7 was left in for further analysis as a participant who had a high
subjective workload and high performance score. As shown in the correlation table for
P7, there were statistically significant positive correlations between VACP and HR and
Blink Rate which indicated that the higher the participant’s VACP, the higher their HR

76
and Blink Rate. Again, the correlation was quite low. While significant, HRV accounted
for only 0.36% of the variance in VACP and HR accounted for only 5.81% of the
variance in the VACP score. The correlation between VACP and HR supports the
hypothesis that HR will be positively correlated for participants with high workload. The
correlation between VACP and Blink Rate is opposite of what was hypothesized.
However, HR is negatively correlated with HRV as expected but unexpectedly positively
correlated with fixation rate.
Table 18: Participant 7 Pearson Correlation Matrix
HR HRV Blink Rate Fixation
HRV -0.170*** -
Blink Rate -0.009 -0.030 -
Fixation 0.228*** -0.046** -0.178*** -
VACP 0.241*** 0.015 0.060*** -0.003 Significance: * p-value < .05; ** p-value <.01; *** p-value <.001
Participant 10 was also retained in the analysis as a participant who had a high
subjective workload and high performance score. As shown in the correlation table for
P10, there were statistically significant positive correlations between VACP and HR,
HRV, and Fixations which indicated that the higher the participant’s VACP, the higher
their HR, HRV, and Fixation rate. As previously noted, the correlation coefficients were
quite low. While significant, the variance of the VACP values accounted for by the other
measures ranged from 0.23% for HRV to1.35% for HR. The correlation between VACP
and HR supports the hypothesis that HR will be positively correlated for participants
considered to be red-lined. The correlations between VACP and HRV and Fixation rate
are opposite of the hypothesized direction. HR was positively correlated with HRV,

77
blink rate, and fixation which would not have been anticipated from previous workload
studies.
Table 19: Participant 10 Pearson Correlation Matrix
HR HRV Blink Rate Fixation
HRV 0.362*** -
Blink Rate -0.195*** -0.015 -
Fixation 0.200*** -0.018 -0.134*** -
VACP 0.116*** 0.048** 0.029 0.049** Significance: * p-value < .05; ** p-value <.01; *** p-value <.001
Figure 12 graphically shows the variance accounted for by each of the
physiological measures when correlated with VACP. Participant’s measures outlined in
black were statistically significant. Participant’s measures outlined in red were not
statistically significant. As shown, the correlation with HR was generally higher than
any other measure but the percent variance in the VACP score accounted for any
physiology measure never exceeded 6% for any participant.
Figure 16: Variance Predicted by Physiological Measures when Correlated with
VACP

78
Figure 13 graphically shows the variance predicted by each of the physiological
measures and VACP when correlated with HR. Participant’s measures outlined in black
were statistically significant. Participant’s measures outlined in red were not statistically
significant. Perhaps not surprisingly, the highest correlations with HR occurred for HRV
but again the squared correlation coefficients never exceeded 0.15.
Figure 17: Variance Predicted when Correlated with HR
HR and Blink Rate provided the two statistically significant correlations when
examining across all identified statistically relevant participants (P2, P8, P9, and P11)
and scenarios. One-tailed, one-sample t-tests were conducted to compare HR and HRV
differences from baseline to the vanilla baseline for HR and HRV for P2, P8, P9, P11,
P7, and P10 separately. Table 20 shows the results of the one-sample t-tests for P2, P8,
P9, P11, P7, and P10. All participants’ showed a statistical significant difference for the
change in HR from the vanilla baseline as well as for the change in HRV from the vanilla

79
baseline. These results suggest that the changes in HR and HRV as calculated from the
vanilla baselines are statistically different from zero. However, they are in the opposite
direction as expected. It was anticipated that HR would be in the positive direction and
HRV would be in the negative direction.
Table 20: One-tailed, one-sample t-tests Statistics
HR HRV
t Sig.
(1-tailed)
Effect Size
(r2)
t Sig.
(1-tailed)
Effect Size
(r2)
P2 -11.79 0.000 0.03 8.22 0.000 0.02
P8 -23.40 0.000 0.12 6.72 0.000 0.01
P9 -7.25 0.000 0.01 19.92 0.000 0.09
P11 -9.84 0.000 0.02 -3.19 0.000 0.002
P7 -28.84 0.000 0.17 9.62 0.000 0.02
P10 15.50 0.000 0.06 11.25 0.000 0.03
Divergent Participant Physiological Measures and VACP Discussion
Correlations were run to determine if the physiological measures provided
statistically significant and relevant information. Only the HR and Blink Rate provided
significant data across all divergent participants. The direction of the HR correlations for
the high workload participants were as expected, increasing with increased objective
workload. However, they did not provide higher correlations than the low workload
participants as was hypothesized. While Blink Rate provided statistically significant
correlations, none were in the hypothesized direction, decreasing with increased objective
workload.
One-sample t-tests were conducted to determine if the change from baseline HR
measures were statistically different from the vanilla baselines, which would demonstrate
that HR across all experimental trials were statistically higher than HR during the

80
baseline. This would suggest that the workload across all workload conditions actually
affected the HR compared to the baseline since it was reliably above zero. The effect size
was calculated which measured the percentage of the variability accounted for by the
measure. P2 and P8 accounted for a higher percentage of variability than P9 and P11.
While the t-test provided significant results, they were in the opposite direction
than was hypothesized. Additionally, the hypothesis that there would be a weak
correlation between the objective workload (VACP) and physiological data when the
perceived workload (NASA-TLX) is low and moderate to high correlation between the
objective workload (VACP) when the perceived workload (NASA-TLX) is high was not
fully supported. Further analysis specifically looking at the four types of task load
conditions (1) No Fuzz, Low Distractors 2) Fuzz, Low Distractors 3) No Fuzz, High
Distractors 4) Fuzz, High Distractors) should be explored further.

81
V. Conclusions and Recommendations
Introduction of Research
Increased task load in AF missions manifests itself in increased workload and at
times derogated performance. Analysis of subjective workload, as measured by
NASA-TLX, and performance sought to classify individuals in one of four categories:
low performance and low workload, high performance and low workload, low
performance and high workload, and high performance and high workload. The objective
workload as modeled by IMPRINT was analyzed to determine if persons exhibiting low
performance and high workload, and therefore assumed to be operating above their
red-line more often than not, exhibited certain characteristics or patterns that could be
used to identify them as red-lined or not. Physiological measures were correlated for the
identified participants in hopes of understanding if the physiology measures indicated
greater changes in stress response across participants having generally high workload
than generally low workload across the range of experimental conditions.
Summary of Research Gap, Research Questions
The design of systems employing adaptive automation requires a deeper
understanding of means to determine the cognitive workload of an operator to permit
maintenance of near ideal operator cognitive workload levels in systems that
automatically adjust the level of automation. Approaches to this problem include
applying objective workload measures or human physiology measures to understand
operator workload.
82
The current research compared physiologic responses and workload at low and at
high, presumed red-line, workload during different task load conditions. This research
was designed to test the underlying hypothesis that traditional physiologic responses,
including heart rate and eye movements, likely represent psychological stress rather than
perceived workload and therefore are likely to indicate changes in perceived workload
near operator red-line than general workload. The investigative questions seek to provide
insight by providing a process to investigate the relationship among subjective workload,
objective workload, performance, and physiological measures. It is believed that a
deeper understanding of the relationship among these variables, will help system
designers and operators to overcome the challenges presented in the design of systems
employing adaptive automation. This deeper understanding is explored by answering the
three investigative questions of this thesis.
Question 1: Are the participants’ individual data sets divergent from one another
based upon perceived workload ratings (NASA-TLX) and performance?
As hypothesized four divergent groups with individuals who fit in each quadrant
based upon their perceived workload ratings from NASA-TLX and their performance
were evident using the distance of participants’ centroid from the origin within the
normalized two-dimensional response formed from their subjective workload score and
performance across each task. Statistically relevant differences were found through the
MANOVA analysis supporting this hypothesis. Participant 11 represented a low
performing individual with low perceived workload. Participant 9 represented a high
performing individual with high perceived workload. Participant 8 represented a low

83
performing individual with high perceived workload. Lastly, participant 2 represented a
high performing individual with high perceived workload.
This finding is not surprising based upon the research of Hart and Staveland
(1988, 2006). Perhaps not surprising is the fact that it was most difficult to identify
participants who were clearly in the high workload, high performance quadrant as it is
expected that performance will be degraded at high workload levels (Wynn and
Richardson 2008). While participant 2 was identified as being indicative of this
quadrant, the average workload for this participant was near the average workload for the
sample of participants. Participants 7 and 10 provided higher average workload values
but their performance was not statistically higher than participant 8 who was clearly in
the high workload, low performance quadrant within this analysis.
Question 2: Which measures are characteristic of red-lined individuals based on
their objective workload profile as modeled in IMPRINT and how do these
measures vary for the identified individuals throughout the tasks?
It was hypothesized that there would be measures from the objective workload
profiles, as modeled by IMPRINT, which would allow individuals to be identified as
red-line or not. Extreme scenarios of participants were used to identify and explore trends
in the objective workload (VACP) results to understand the differences in manageable
workload conditions versus workload conditions that were deemed to be above a
participant’s red-line.
The measures which were characteristic of red-lined experimental conditions
manifested themselves with the addition of the secondary task. Specifically, the

84
participants were unable to complete a relatively intensive task (i.e., finding the target)
before the secondary task was imposed. Other factors may have contributed to those
participants’ who were unable to locate the HVT prior to the initiation of the secondary
task such as the way they performed the task (i.e. search pattern, task shedding, etc.).
However, additional data, such as videos collected for this experiment, would need to be
explored. A deeper analysis based on participant and task load conditions specifically
looking at all potential red-line scenarios could determine if the patterns were transferable
or not.
Question 3: Do the physiological measures: blinks, saccades, HR, HRV, correlate
with the objective workload profile for all divergent participants and conditions?
It was hypothesized that there would be a weak correlation between the objective
workload (VACP) and physiological data when the perceived workload (NASA-TLX)
was low and moderate to high correlation between the objective workload (VACP) and
the physiological data when the perceived workload (NASA-TLX) was high. Similar
relationships were also expected for participants having generally high or degraded
performance. Overall, the correlations were very weak. In the high workload participants,
P2, P8, P7, and P10, HR was positively correlated with VACP as hypothesized.
However, the correlations were not stronger than those who reported low subjective
workload, P9 and P11. Blink rate also provided statistically significant correlations, but
blink rates increased with increases in objective workload which is in the opposite
direction as hypothesized based on previous literature (Kramer 1990). Given that there is
limited research on the correlation of physiology and objective workload measures in the

85
literature, it is useful to additionally explore the correlation of the various physiology
measures. Very little variance in objective workload was explained by the physiological
measures. This suggest that either the correlation of physiological measures and objective
workload measures is very weak, that the experimental design was not correct for
analyzing this relationship, or there was a mediating variable that would explain more of
the relationship.
One-sample t-tests determined the baseline HR and HRV were statistically
different from the vanilla baseline of HR and HRV, but they were in the opposite
direction than expected. It was expected HR would be positively correlated and HRV
would be negatively correlated. HR was actually slower in the surveillance scenarios than
it was in the baseline condition opposite of what has been seen in past literature
(Brookhuis and Waard 2010). HRV actually increased from the baseline during the
surveillance scenarios which is as expected since the HR decreased in the scenarios, but
not in line with past research (Brookhuis and Waard 2010).This could be due to the short
amount of time used to calculate the vanilla baseline, possibly due to the vanilla baselines
being collapsed across the different days, or the fast-paced nature of the tracking task
may have actually induced higher workload on the participant than the surveillance task.
Statistically significant results were found, but the data does not fully support the
hypothesis that those with perceived high workload would have a stronger correlation,
than those with perceived low workload.

86
Study Limitations
Each participant experienced four different task load conditions four different
times. The scenario orders differed for each participant as well as the HVT paths,
making it difficult to draw conclusion of which factors caused the task load to be reported
in the manner it was and the cause was not found. Participants’ were awarded points for
tracking the HVT, once found, while arguably their highest amount of workload occurred
searching for the HVT, a non-scoring period. Participants’ performances were largely a
matter of chance based on if they instituted the correct searching mechanism for the
specific HVT pattern, rather than a measure of reaction time. Scenarios were scored for a
set period of time, while the physiological measures were collected for the duration of the
trial, adding complexity when analyzing data.
The complex experimental design provided challenges when interpreting the data
and especially when trying to group participants to analyze the different task loads. There
were a limited number of participants who completed the experiments. Additionally, the
data were provided rather than collected in-house, which limited the breadth of
understanding based on observations and personal anecdotal explanations which would
have been experienced first-hand. The HUMAN lab instituted data collection procedures
and stored the data for their own research efforts. This resulted in limited flexibility with
how the data were presented, categorized, and sampled during collection. In order to
analyze the data across the proposed measures at one second intervals, interpolation was
required. As with any post hoc analysis, the data analysis relied on existing data to
answer a question beyond the scope of the original experimental design. This fact limited

87
the data analysis opportunities which will be explained further in the recommendations
for future research.
Recommendations for Future Research
In the future, the presented method should be applied to an experiment designed
to have very clear task loads and fewer variables. The experimental design should be able
to accurately detect any mediating variables. Additionally, the experiment should
measure performance based on a more concrete metric which would account for when
workload would likely be higher based on task load. This process can and should be
extended to other efforts collecting subjective workload and physiological measures as
well as modeling objective workload to provide a broader body of knowledge to
understand where and when a participant’s red-line occurs. Additionally, VACP should
be adapted to accurately reflect the type of work and potential workload associated with
tasks specific to computer interfaces and control stations. Understanding of the workload
and physiological relationship is crucial in order to continue to improve system design by
providing useful information of when operator workload is manageable or not.
Significance of Research
The primary focus of this thesis was to investigate individual differences between
participants whose subjective workload ratings varied as well as their performance and
relate them to objective workload and physiological measures. Overall, a process for
analyzing this relationship was developed and illustrated on experimental data. The
process provides insight into how mental workload effects physiological changes and
how task performance, cognitive performance, workload stress, and physiological
88
measures relate. It is hoped that this method will provide a deeper understanding for how
physiological measures relate to workload across the entire workload spectrum
specifically investigating when a person is red-lined or not. Deepening this understanding
has the potential to improve system design by providing useful information and data
interpretation across the workload spectrum which operators experience based on
different task loads, especially task loads at the extremes of operator performance which
often result in operator performance degradation (Wickens 2008, Nachreiner 1995, Ng,
Hubbard and O'Young 2010, Young and Stanton 2002).

89
Bibliography
Achten, Juul, and Asker E. Jeukendrup. "Heart Rate Monitoring." Sports Medicine 33,
no. 7 (June 2003): 517-538.
Army Research Laboratory. Improved Perfromance Research Integration (IMPRINT)
Tool. Army Research Laboratory. 2010.
https://dap.dau.mil/aphome/das/Lists/Software%20Tools/DispForm.aspx?ID=58.
Beevis, David, et al. Analysis techniques for human-machine system design: A report
produced under the auspices of NATO Defence Research Group Panel 8. No.
CSERIAC SOAR 99-01, 1999.
Bierbaum, C. R., S. M. Szabo, and T. Aldrich. "Task Analysis of the UH-60 Mission and
Decision Rules for Developing a UH-60 Workload Prediction Model." Army
Research Institute, 1989: 89-08.
Blowem, K. A., and D. L. Damos. "Individual Differences in Secondary Task
Performance and Subjective Estimation of Workload." Psychological Reports 56, no.
1 (1985): 311-322.
Bolanos, M., H. Nazeran, and E. Haltiwanger. "Comparison of Heart Rate Variability
Signal Features Derived from Electrocardiography and Photoplethysmography in
Healthy Individuals." IEEE, 2006: 4289-4294.
Brookhuis, Karel A., and Dick de Waard. "Monitoring Drivers' Mental Workload in
Driving Simulators using Physiological Measures." Accident Analysis and Prevention
42 (2010): 898-903.
Cassenti, D. N., and T.D. Kelley. "Towards the shape of mental workload." In
Proceedings of the Human Factors and Ergonomics Society Annual Meeting. Sage
Publications, 2006. 1147-1151.
Cegarra, Julien, and Jean-Michel Hoc. "Cognitive Styles as an Explanation of Experts'
Individual Differences: A Case Study in Computer-Assisted Troubleshooting
Diagnosis." International Journal Human-Computer Studies 64 (2006): 123-136.
Clapper, James R., et al. FY 2009-2034 Unmanned Systems Integrated Roadmap.
Department of Defense: Office of the Secretary of Defense Unmanned Systems
Roadmap, 2009.

90
Colombi, J., M. E. Miller, M. Schneider, J. McGrogan, D. S. Long, and J. Plaga. "
Predictive mental workload modeling: implications for system design." Journal of
Systems Engineering 15, no. 4 (2012): 448-460.
Colombi, John M, Michael E Miller, Michael Schneider, Jason McGorgan, David S
Long, and John Ploga. "Predictive mental workload modeling for semi-autonomous
system design: Implications for systems of systems." Journal of Systems Engineering
15, no. 4 (2012): 448-460.
Coombs, Christopher. "Contributions of Unmanned Aircraft Systems to the Nation’s Air
Arsenal." National Museum of the Air Force Wings and Things Guest Lecture, May
2009.
Damos, Diane L. "Individual Differences in Subjective Estimates of Workload." In
Human Mental Workload, by Meshkati N. and Hancock P.A., 231-237. Elsevier
Science Publishers B.V. , 1988.
DeWaard, Dick. The Measurement of Drivers’ Mental Workload. The Traffic Research
Center VSC, University of Groningen, 1996.
Durantin, Gautier, J F Gagnon, S Tremblay, and F Dehais. "Using Near Infrared
Spectroscopy and Heart Rate Variability to Detect Mental Overload." Behavioural
Brain Research 259 (2014): 16-23.
Durkee, Kevin, Alexandra Geyer, Scott Pappada, Andres Ortiz, and Scott Galster. "Real-
time Workload Assessment as a Foundation for Human Perfromance Augmentation."
Foundations of Augmented Cognition (Springer Berlin Heidelberg) 8027 (2013): 279-
288.
Eisen, P. S., and K. C. Hendy. "A Preliminary Examination of Mental Workload: Its
Measurement and Prediction." Defence and Civil Institute of Environmental
Medicine, 1987.
Field, Andy. Discovering Statistics using SPSS. Sage Publications, 2009.
Fishel, Stephanie R., Eric R. Muth, and Adam W. Hoover. "Establishing Appropriate
Physiological Baseline Procedures for Real-Time Physiological Measurement."
Journal of Cognitive Engineering and Decision Making 1, no. 3 (2007): 286-308.
Grootjen, Marc, Mark A. Neerincx, and J.C. M. van Weert. "Task Based Interpretation of
Operator State Information for Adaptive Support." Foundations of Augmented
Cognition, 2006: 236-242.

91
Guastello, Stephen J., Anton Shircel, Matthew Malon, and Paul Timm. "Individual
Differences in the Experience of Cognitive Workload." Theoretical Issues in
Ergonomics Science 16, no. 1 (2013): 20-52.
Hancock, P.A., and S. F. Scallen. "The Performance and Workload Effects of Task Re-
location during Automation." Displays 17, no. 2 (1997): 61-68.
Hancock, Peter A., and Mark H. Chignell. "Mental Workload Dynamics in Adaptive
Interface Design." IEEE Transactions on Systems, Man and Cybernetics 18, no. 4
(1988): 647-658.
Hancock, Peter A., Richard J. Jagacinski, Raja Parasurman, Christopher D. Wickens,
Glenn F. Wilson, and David B. Kaber. "Human-Automation Interaction Research:
Past, Present, and Future." Ergonomics in Design: The Quarterly of Human Factors
Applications 21, no. 2 (April 2013): 9-14.
Hardman, N., J. Colombi, D. Jacques, and J. Miller. "Human Systems Integration within
the DOD Architecture Framework." IIE Annual Conference and Expo. Vancouver,
BC, 2008. 840-845.
Hart, Sandra G. "NASA-Task Load Index (Nasa-TLX); 20 Years Later." Human Factors
and Ergonomics Society Annual Meeting Proceedings. 2006. 904-908.
Hart, Sandra G., and Lowell E. Staveland. "Development of NASA-TLX (Task Load
Index): Results of Empirical and Theoretical Research." Advances in Psychology 52
(1988): 139-183.
Hebb, Donald Olding. "Drives and the CNS (Conceptual Nervous System)."
Psychological review 62, no. 4 (1955): 243.
Jennings, Richard J, Thomas Kamarck, Christopher Steward, Michael Eddy, and Paul
Johnson. "Alternate cardiovascular baseline assessment techniques: Vanilla or resting
baseline." Psychophysiology 29, no. 6 (1992): 742-750.
Kahneman, Daniel, and Amos Tversky. "On the Psychology of Prediction."
Psychological Review 80, no. 4 (1973): 237-251.
Keller, John. "Human performance modeling for discrete-event simulation: workload." In
Proceedings of the Winter Simulation Conference. IEEE, 2002. 157-162.
Kim, Kyung-Nam, and R. S. Ramakrishna. "Vision-Based Eye-Gaze Tracking for Human
Computer Interface." IEEE, 1999: 324-329.

92
Kramer, Arthur F. "Physiological Metrics of Mental Workload: A Review of Recent
Progress." Interim report 1 Jan-1 Oct 1989, 1990.
Krupinski, Robert, and Przemyslaw Mazurek. "Optimization-Based Technique for
Separation and Detection of Saccadic Movements and Eye-Blinking in
Electrooculography Biosignals." In Software Tools and Algorithms for Biological
Systems, by Hamid R. Arabnia and Quoc-Nam Tran, 537-545. Springer Science &
Business Media, 2011.
Laughery, Romn. "Computer simulation as tool for studying human-centered systems."
In Proceedings of the 30th conference on Winter simulation. IEEE Computer Society
Press, 1998. 61-66.
—. "Using discrete-event simulation to model human performance in complex systems."
In Proceedings of the 31st conference on Winter simulation: Simulation---a bridge to
the future. 1999, December. 815-820.
Marshall, Sandra P. "The Index of Cognitive Activity: Measuring Cognitive Workload."
Human Factors and Power Plants. Scottsdale Arizona: IEEE, 2002. 5-9.
May, James G., Robert S. Kennedy, Mary C. Williams, William P. Dunlap, and Julie R.
Brannan. "Eye Movement Indices of Mental Workload." Acta Psychologica 75, no. 1
(1990): 75-89.
McCracken, J. H., and T. B. Aldrich. Analyses of Selected LHX Mission Functions:
Implications for Operator Workload and System Automation Goals. (No. ASI479-
024-84). ANACAPA SCIENCES INC FORT RUCKER AL, 1984.
Meister, David. Behavioral Foundations of System Development. Oxford: John Wiley &
Sons, 1976.
Merlin, Peter William. "Human Factors in Accidents Involving Remotely Piloted
Aircraft." 84th ASMA Annual Scientific Meeting. Chicago, IL, 2013.
Nachreiner, Friedhelm. "Standards for Ergonomics Principles Relating to the Design of
Work Systems and to Mental Workload." Applied Ergonomics 26, no. 4 (1995): 259-
263.
NASA. "NASA Task Load Index (TLX)." Vol. 1.0. Moffett Field, CA, 1986.
Neerincx, M. A. "Cognitive Task Load Design: Model, Methods and Examples." In
Handbook of Cognitive Task Design, 283-305. 2003.

93
Neerincx, Mark A. "Modelling Cognitive and Affective Load for the Design of Human-
Machine Collaboration." Engineering Psychology and Cognitive Ergonomics, HCII,
2007: 568-574.
Ng, Luke, Paul Hubbard, and Siu O'Young. "Simulation of Fully Autonomous Control of
Unmanned Air Vehicles for Maritime Surveillance." In Proceedings of the 2010
Spring Simulation Multiconference. Society for Computer Simulation International,
2010. 40.
North, Robert A., and Victor A. Riley. "W/INDEX: A Predictive Model of Operator
Workload." Applications of Human Performance Models to System Design , 1989:
81-89.
O'Donnell, Robert D., and Thomas F. Eggemeier. Handbook of Perception and Human
Performance, Vol 2: Cognitive Processes and Performance. Oxford, England: John
Wiley and Sons, 1986.
Office of the Secretary of Defense. "Unmanned Aircraft Systems Roadmap 2005-2030."
2005.
Overholt, Jim, and Kris Kearns. "Air Force Automation Strategy." AFRL Autonomy. July
11, 2013.
Parks, Donald L., and George P. Boucek Jr. "Workload Prediction, Diagnosis, and
Continuing Challenges." Applications of Human Performance Models to System
Design , 1989: 47-63.
Popovic, Djordje, Maja Stikic, Chris Berka, David Klyde, and Theodore Rosenthal.
"PHYSIOPRINT: A Workload Assessment Tool Based on Physiological Signals."
Automotive UI, 2013: 1-7.
Posner, Michael I, and Stephen J Boies. "Components of Attention." Psychological
Review 78, no. 5 (Sep 1971): 391-408.
Proctor, Robert W., and Trisha Van Zandt. Human factors in simple and complex
systems. CRC, 2011.
Reid, Gary B., and Herbert A. Colle. "Critical SWAT values for Predicting Operator
Overload." In Proceedings of the Human Factors and Ergonomics Society Annual
Meeting. Santa Monica : Sage Publications, 1988. 1414-1418.

94
Sarno, Kenneth J., and Christopher D. Wickens. "Role of Multiple Resources in
Predicting Time-Sharing Efficiency: Evaluation of Three Workload Models in a
Multiple-Task Setting." The International Journal of Aviation Psychology 5, no. 1
(1995): 107-130.
Schuff, David, Karen Corral, and Ozgur Turetken. "Comparing the Understandability of
Alternative Data Warehouse Schemas: An Empirical Study." Decision Support
Systems 52, no. 1 (2011): 9-20.
Schulte, Axel, and Diana Donath. "Measuring self-adaptive UAV operators’ load-
shedding strategies under high workload." Engineering Psychology and Cognitive
Ergonomics (Springer Berlin Heidelberg) 6781 (2011): 342-351.
Smith, K. Tara. "Predicitive Operational Performance (PrOPer) Model." Proceedings of
the International Conference on Contemporary Ergonomics. Dunfermline Fife,
Scotland: Taylor & Francis, 2009.
Soliday, Stanley M. Effects of Task Loading on Pilot Performance During Simulated
Low-Altitude High-Speed Flight. Technical Report, Fort Eustis: U.S. Army
Transportation Research Command, 1965.
Splawn, Joshua M. "Applying Hyperspectral Imaging to Heart Rate Estimation for
Adaptive Automation." March 30, 2013. 1-74.
Stevens, Stanley Smith. "To Honor Fechnew and repeal his law." Science 133 (1961): 80-
86.
Szalma, James L. "Individual Differences in Performance, Workload, and Stress in
Sustained Attention: Optimism and Pessimism." Personality and Individual
Differences 47 (2009): 444-451.
Teigen, Karl Halvor. "Yerkes-Dodson: A law for all Seasons." Theory and Psychology
(Sage) 4, no. 4 (1994): 525-547.
United States Air Force. RPA Vector: Vision and Enabling Concepts 2013-2038.
CreateSpace Independent Publishing Platform, 2013.
Veltman, J. A., and C. Jansen. "The role of operator state assessment in adaptive
automation." (No. TD2005-0450). TNO DEFENCE SECURITY AND SAFETY
SOESTERBERG (NETHERLANDS), 2005.

95
Wickens, Christopher D. "Multiple Resources and Mental Workload." Human Factors:
The Journal of Human Factors and Ergonomics Society 50, no. 3 (2008): 449-455.
Wickens, Christopher D. "Multiple resources and performance prediction." Theoretical
issues in ergonomics science 3, no. 2 (2002): 159-177.
Wickens, Christopher D., Justin G. Hollands, Simon Banbury, and Raja Parasura.
"Mental Workload, Stress, and Individual Differences: Cognitive and
Neuroergonomic Perspectives." In Engineering Psychology and Human Performance,
by Justin G. Hollands, Simon Banbury, Raja Parasuraman Christopher D. Wickens,
346-376. Peachpit Press, 2013.
Wynn, Tony, and John H. Richardson. "Comparison of Subjective Workload Ratings and
Performance Measures of a Reference IVIS Task." Tools and Methodologies for
Safety and Usability, 2008: 79-88.
Young, Mark S., and Neville A. Stanton. "Malleable Attentional Resources Theory: A
New Explanation for the Effects of Mental Underload on Performance." Human
Factors: The Journal of the Human Factors and Ergonomics Society 44, no. 3
(2002): 365-375.

96
Appendix A
Short Stress State Questionnaire

97
Appendix B
NASA-TLX

98
Appendix C
Participant Experimental Order of Conditions as Experienced by Scenarios

99

REPORT DOCUMENTATION PAGE Form Approved OMB No. 074-0188
The public reporting burden for this collection of information is estimated to average 1 hour per response, including the time for reviewing instructions, searching existing data sources, gathering and maintaining the data needed, and completing and reviewing the collection of information. Send comments regarding this burden estimate or any other aspect of the collection of information, including suggestions for reducing this burden to Department of Defense, Washington Headquarters Services, Directorate for Information Operations and Reports (0704-0188), 1215 Jefferson Davis Highway, Suite 1204, Arlington, VA 22202-4302. Respondents should be aware that notwithstanding any other provision of law, no person shall be subject to an penalty for failing to comply with a collection of information if it does not display a currently valid OMB control number.
PLEASE DO NOT RETURN YOUR FORM TO THE ABOVE ADDRESS.
1. REPORT DATE (DD-MM-YYYY)
26-12-2014 2. REPORT TYPE
Master’s Thesis 3. DATES COVERED (From – To)
Sep 2013 – Dec 2014
4. TITLE AND SUBTITLE
Exploring Individual Differences in Workload Assessment
5a. CONTRACT NUMBER
5b. GRANT NUMBER
5c. PROGRAM ELEMENT NUMBER
6. AUTHOR(S)
Boeke, Danielle K., Captain, USAF
5d. PROJECT NUMBER
5e. TASK NUMBER
5f. WORK UNIT NUMBER
7. PERFORMING ORGANIZATION NAMES(S) AND ADDRESS(S)
Air Force Institute of Technology
Graduate School of Engineering and Management (AFIT/EN)
2950 Hobson Way, Building 640
Wright-Patterson AFB OH 45433-7765
8. PERFORMING ORGANIZATION REPORT NUMBER
AFIT-ENV-MS-14-D-31
9. SPONSORING/MONITORING AGENCY NAME(S) AND ADDRESS(ES)
Scott Galster
2947 Fifth Street
Wright Patterson AFB, OH 45433-7212
10. SPONSOR/MONITOR’S ACRONYM(S) 711
th HPW/RHCP
11. SPONSOR/MONITOR’S REPORT NUMBER(S)
12. DISTRIBUTION/AVAILABILITY STATEMENT
Distribution Statement A. Approved for Public Release; Distribution Unlimited.
13. SUPPLEMENTARY NOTES
This material is declared a work of the U.S. Government and is not subject to copyright protection in the United
States. 14. ABSTRACT
Air Force missions continue to increase in complexity often imposing higher levels of task load from cognitive tasks
on the operators. This increased task load manifests itself in increased cognitive workload and potentially derogated
performance. While cognitive workload has been studied for decades, recent advances in objective workload
models and physiology monitoring have the potential to provide a more robust understanding of workload,
potentially allowing systems to adaptively employ automation to maintain operator peak performance. The current
research sought to provide insight into the relationship between subjective workload, task performance, objective
workload, and select physiology measures. Analysis of an existing data set was performed to determine if
individuals exhibiting low performance and high workload were more likely to have physiology responses that
increased with workload due to a stress response than other participants. This analysis provides an approach to
investigating the relationships among the four classes of workload information. However, the results indicate that
certain physiology measures are significantly correlated with objective workload, regardless of the performance and
workload range of the participants. Unfortunately, relatively low correlations were observed among all dependent
measures and therefore, further research is necessary to confidently address the hypothesis of the current research. 15. SUBJECT TERMS
Workload, Individual Differences, Physiological, Human Performance, Human System Integration
16. SECURITY CLASSIFICATION OF:
17. LIMITATION OF ABSTRACT
UU
18. NUMBER OF PAGES
110
19a. NAME OF RESPONSIBLE PERSON
Michael Miller, Dr., ENV a. REPORT
U
b. ABSTRACT
U
c. THIS PAGE
U
19b. TELEPHONE NUMBER (Include area code)
(937) 255-3636 x4651 ([email protected])
Standard Form 298 (Rev. 8-98) Prescribed by ANSI Std. Z39-18


