
Multidisciplinary Journal of Research in Engineering and Technology, Volume 4, Issue 3, Pg.1266-1278
1266 | P a g e M3-4-3-7-2017
EXTENSIVE FRAMEWORK FOR STOCK MARKET ANALYSIS
Priti Gawade , Snehal Gawade , Harshada Karle
Chetana Dhore, Prof. Swati Gore
Department of Computer Engineering, Jaihind College of Engineering , Kuran
Abstract: Stock market is a most widely used purchase scheme promising great returns but it
has some possibility of risks. An brilliant stock prediction models would be mandatory. There are
so many techniques are available for the prediction of the stock market value. Some are: Data
Mining, Neural Network (NN), Neuro Fuzzy system, Hidden Markov Model (HMM) etc. We
outline design of the Neural Network model with its customizable parameters and salient
features. A number of functions for activation are implemented along with multiple options for
cross validation sets.
Keywords: Artificial neural networks, Multi-layer neural network, Prediction methods, Stock markets.
1. INTRODUCTION
One financial market which has been thoroughly analyzed by different methods is the stock
market. Lots of work has been done in mining the financial markets, with multiple researches
having a common aim of predicting stock market trends. The most difficult challenge faced by
analysts is modeling the behavior of human traders. Constant changing of their behavioural
patterns has made predictions quite hard. To solve this problem, researchers have used a
variety of approaches. A large group of researchers put the problem into a machine learning
framework. Many of those researchers believed that historical trading volume and pricing gave
enough information to predict future trends. Another group of researchers think that there are
other sources which may have a greater effect on behavior than historical prices. They have
Journal homepage: www.mjret.in
ISSN:2348 - 6953
Multidisciplinary Journal of Research in Engineering and Technology, Volume 4, Issue 3, Pg.1266-1278
1267 | P a g e M3-4-3-7-2017
done various researches and evaluated different sources to prove their claims. However, there
are various influential factors that lead to volatility in the stock market. Existing researches
tendto focus mainly on some factors, while ignoring other ones. For example, the effect of both
news articles and technical indicators are seldom analyzed in a single research model.
Moreover, although existing researches mostly use a systematic way to select the companies
for their empirical based study, the selection is biased towards large companies in well-known
stock indexes. Accordingly, we will address these research gaps by analyzing the effect of both
news articles and technical indicators in a single framework using companies of different sizes.
This paper focuses more on a conceptual model for the prediction of stock market trends. We
employed service oriented architecture to allow flexible replacement of different analytical
methods, such as mining algorithms on the data. To summarize, our primary contributions in
this paper are:
To propose an efficient stock movement direction prediction framework using various
sources.
To analyze the impact of different sources on companies with different sizes.
To illustrate the effectiveness of the proposed model using real-world data.
To analyze the impact of metric learning methods on stock market prediction.
2. LITERATURE SURVEY
A] Application of wrapper approach and composite classifier to the stock trend
prediction:
So many researchers tried to predict the immediate future stock indices or prices based on
technical indices with various mathematical models and machine learning techniques such as
support vector machines (SVM), artificial neural networks (ANN), and ARIMA models. In that
paper employs wrapper approach to select the optimal feature subset from original feature set
cover of 23 technical indices and then uses voting scheme that mixes the different classification
algorithms to predict the trend in Korea and Taiwan stock markets.
Disadvantages: In this paper they did not use the combination of different classifiers like as
weighted voting and find other useful features besides the ordinarily used technical indices to
achieve a better performance in stock market trend prediction application.
B] An svm-based approach for stock market trend prediction:

Multidisciplinary Journal of Research in Engineering and Technology, Volume 4, Issue 3, Pg.1266-1278
1268 | P a g e M3-4-3-7-2017
In this paper, Support Vector Machines (SVM) algorithm is work for to predict daily stock market
trends: downs and ups. Purpose of that is to examine the effect of macroeconomic data, global
stock markets, and technical analysis indicators on the accuracy of the classifiers. In this paper
we use the empirical and theoretical approach to apply SVM strategy to predict the NIFTY
closing level. We propose a prediction based on temporal correlation between commodities,
global stock markets, and other financial products to predict the next day closing level (trend) of
NIFTY.
Disadvantages: In this paper the theoretical analysis of the better performance on forecasting
the constituents is a worth studying.
3. IMPLEMENTATION
Implementation Details:
Our aim to build a framework which can predict the stock for feature.
User
Registration
Registration
Login
Upload dataset
Stock
Medium Small Large
Historical
Prices
Choosing
A

Multidisciplinary Journal of Research in Engineering and Technology, Volume 4, Issue 3, Pg.1266-1278
1269 | P a g e M3-4-3-7-2017
Fig 1.System Architecture Diagram
In System, First Process is User Registration and then Login. After Login User get Upload the
Dataset and Calculate the Start, Close and Volume Values. By Using Neural Network, Calculate
the Final Prediction Value.
By using following formula Calculate the Prediction Values:
Then to express the activation ith neuron, the formulas are modified as follows:
Monthly
Extracting financial Indicators
Integrating
Normalizing
A
Choosing
Neural Network
Evaluation
Get and calculate final
predict values
Exit
Multidisciplinary Journal of Research in Engineering and Technology, Volume 4, Issue 3, Pg.1266-1278
1270 | P a g e M3-4-3-7-2017
where 𝑥! maybe the output of another neuron or an external input. As shown in figure The proposals are treated as related work in considering different sources for
stock market prediction. It is used a wrapper approach to choose the best feature subset of 23
technical indices and then combined different classification algorithms to predict the future
trends of the Korea and Taiwan stock markets. Compared the application of four models
including the artificial neural network (ANN) for stock market trend prediction. Two different
approaches have been taken to provide the inputs for these models. In the first approach, ten
technical parameters were computed based on stock price data while the second approach
focused on representing these technical parameters as trend deterministic data.
Mathematical Model:- System = S;
S = {I, P, O}
Success condition:
User will get prediction of the stock.
Failure Condition:
User will not prediction of the stock.
Input = Input
Input will be the query request for predict the stock.
P = Processing
In processing it takes a reference of dataset values. And according to that it will going to predict
the stock prize.
O = Output will be the prediction of stock.
where 𝑥! is the output of another neuron or an external input.

Multidisciplinary Journal of Research in Engineering and Technology, Volume 4, Issue 3, Pg.1266-1278
1271 | P a g e M3-4-3-7-2017
Algorithm:-
This project uses data processing technique to check historical information concerning share
market in order that it will predict the desired values a lot of accurately.
Algorithm:-
1. Accept input sample
2. Perform its weighted summation.
3. Apply it to input layer neurons.
4. Process all inputs at each neuron by transfer function to get individual.
5. Hidden layer and repeat 1,2,3,4 steps pass it as an input to all neurons of for hidden
layer neurons.
6. Pass output of hidden layer neurons to all output layers and repeat 1,2,3,4 steps to get
final output.
7. Display the final output.
DESIGN SCREENSHOTS:
Fig 2. User Registration
User Registration: This is registration page. In this system first step is user registration then
user login.

Multidisciplinary Journal of Research in Engineering and Technology, Volume 4, Issue 3, Pg.1266-1278
1272 | P a g e M3-4-3-7-2017
Fig 3. Login
Login Page: This is User Login Page. In this System First Registered User is Login, then after
Login other System is work.
Fig 4.Train Dataset
Train Dataset: This is Train Dataset Page. In this page Upload the dataset and find the dataset
values.
Multidisciplinary Journal of Research in Engineering and Technology, Volume 4, Issue 3, Pg.1266-1278
1273 | P a g e M3-4-3-7-2017
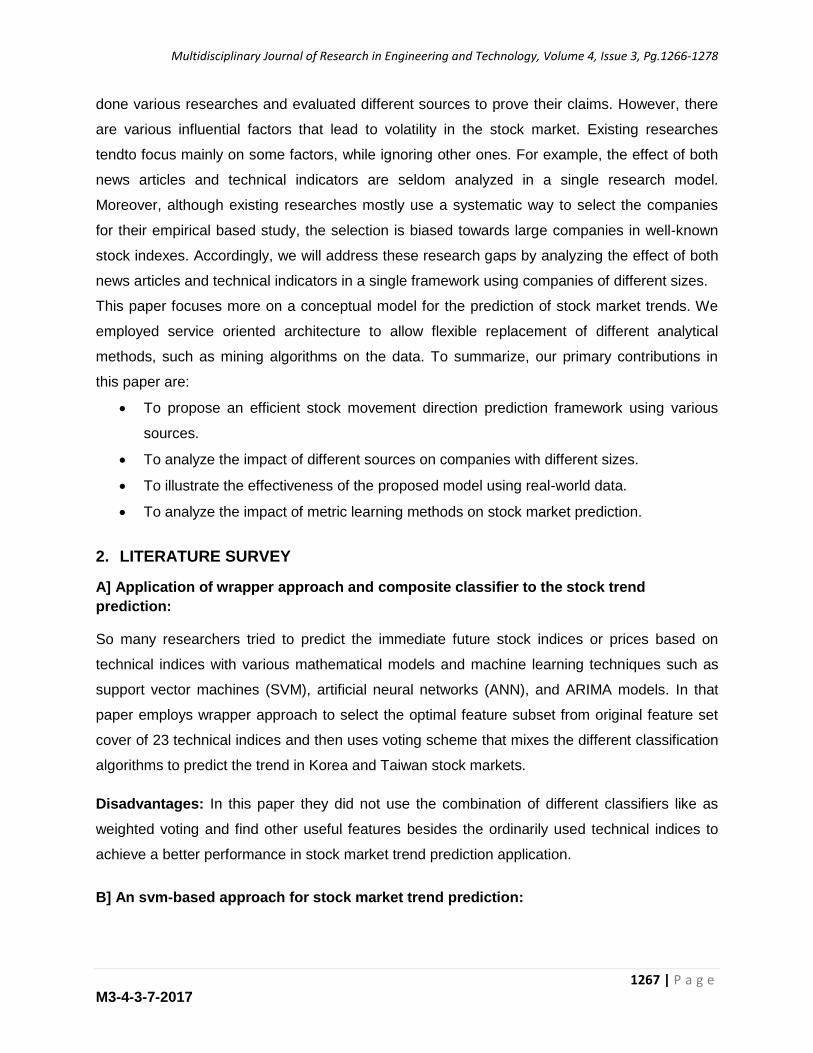
Fig 5.Dataset Graph
Dataset Graph: This is Graph Generation Page. First Dataset Successfully Trained and
Generate the Graph.
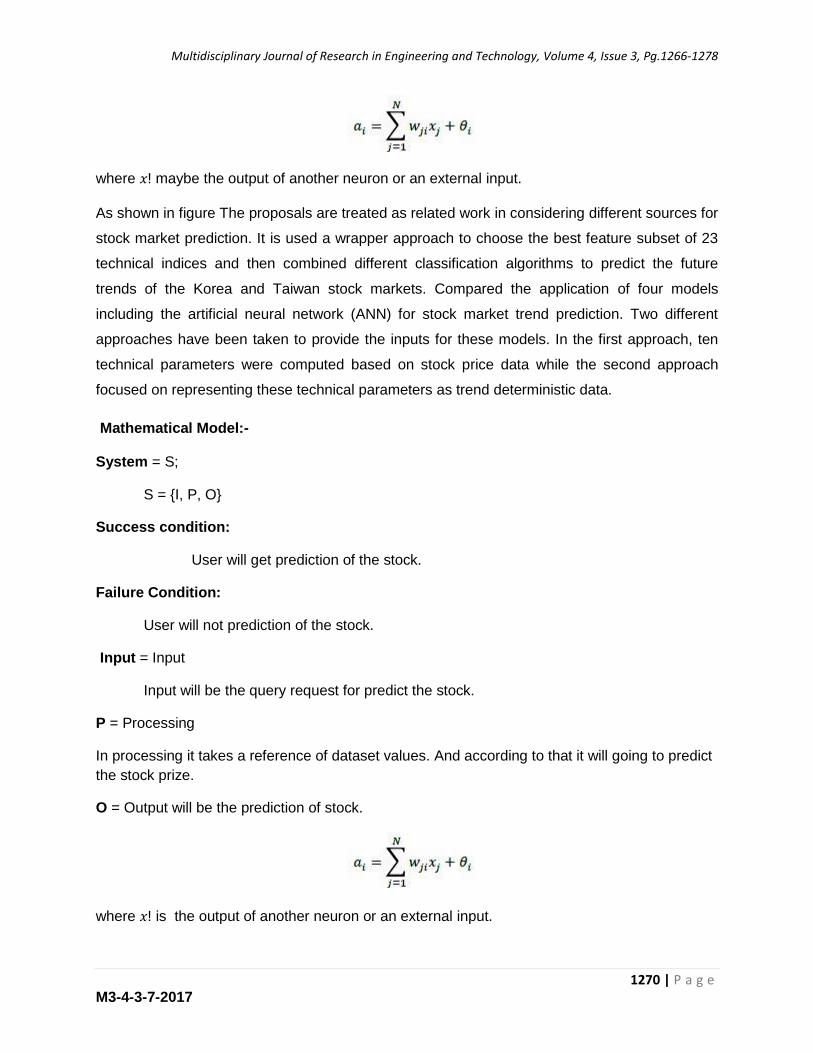
Fig 6.Predicted Value
Predicted Value: This is Upload Dataset Page. In This Page Upload the dataset and find the
absolute predicted value in their dataset. By using following formula Calculate the Prediction
Values: Then to express the activation ith neuron, the formulas are modified as follows:
Multidisciplinary Journal of Research in Engineering and Technology, Volume 4, Issue 3, Pg.1266-1278
1274 | P a g e M3-4-3-7-2017
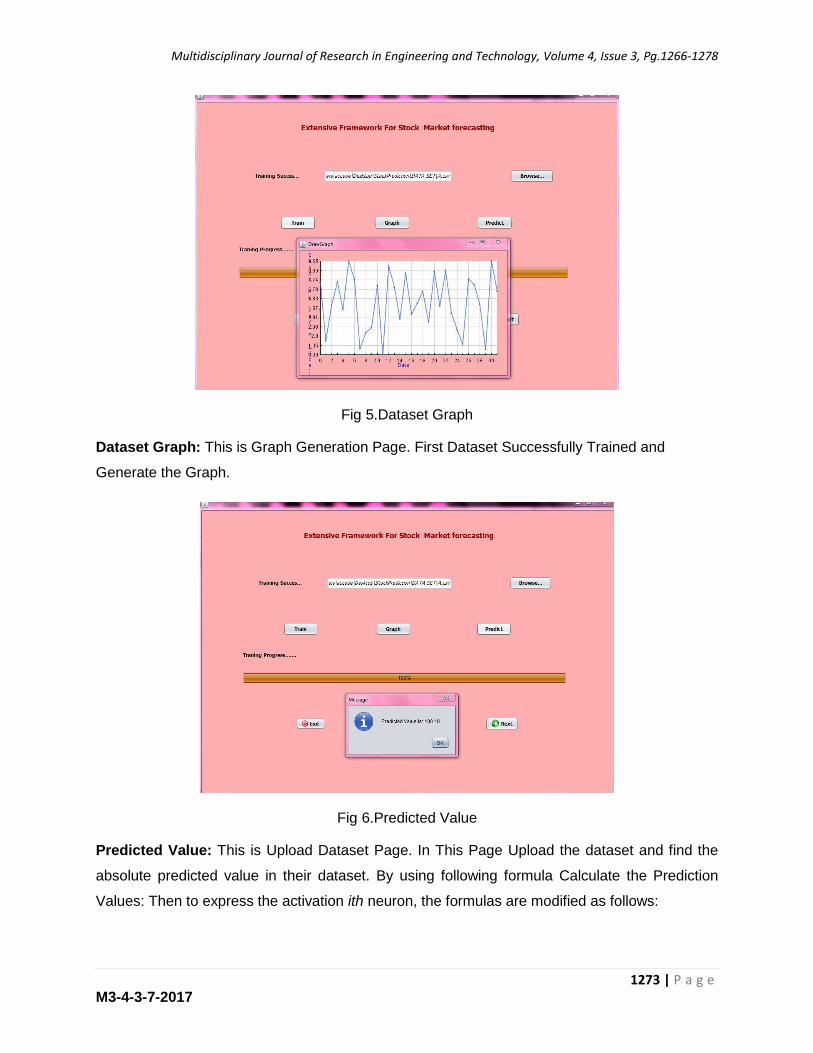
where 𝑥! maybe the output of another neuron or an external
input.
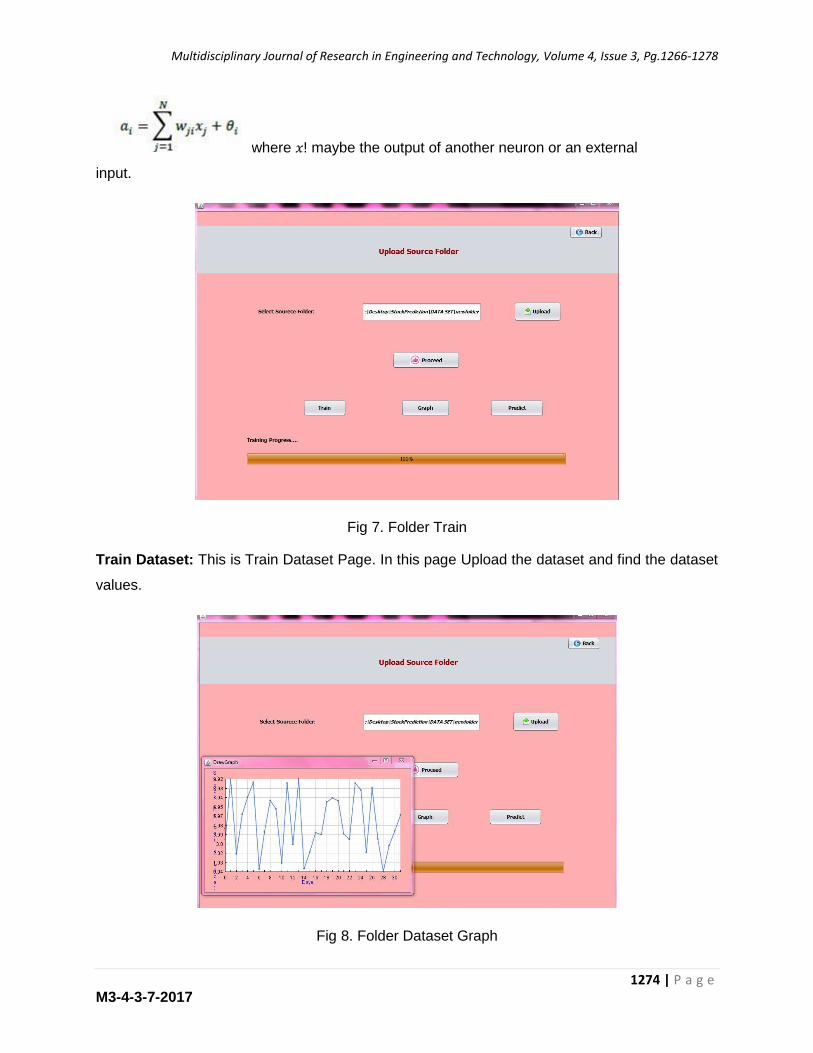
Fig 7. Folder Train
Train Dataset: This is Train Dataset Page. In this page Upload the dataset and find the dataset
values.
Fig 8. Folder Dataset Graph

Multidisciplinary Journal of Research in Engineering and Technology, Volume 4, Issue 3, Pg.1266-1278
1275 | P a g e M3-4-3-7-2017
Folder Dataset Graph: This is Graph Generation Page. First Dataset Successfully Trained and
Generate the Graph.
Fig8. Folder Dataset Predicted Value
Folder Dataset Predicted Value: In This Page Calculate the Start, End and Volume Predicted Values.
Fig9. Admin Login
Admin Login: This is Admin Login Page. In this System First Admin User is Login, then after
Login Open the Admin Panel.
Multidisciplinary Journal of Research in Engineering and Technology, Volume 4, Issue 3, Pg.1266-1278
1276 | P a g e M3-4-3-7-2017
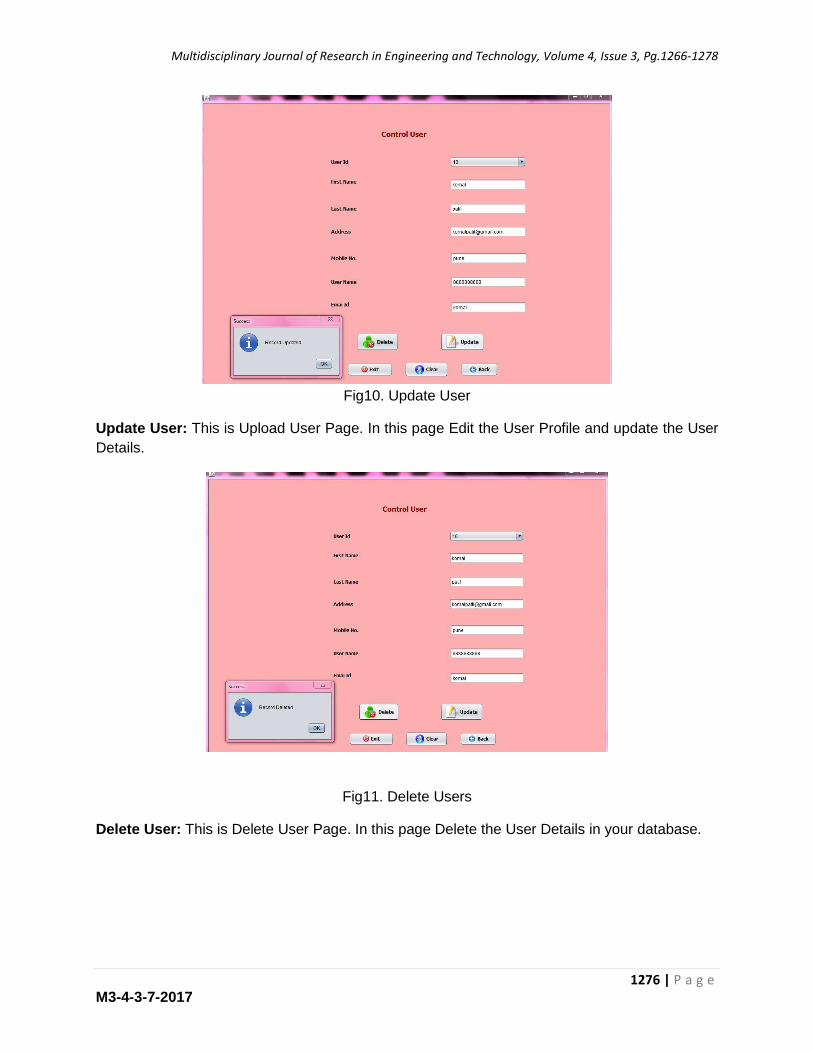
Fig10. Update User
Update User: This is Upload User Page. In this page Edit the User Profile and update the User
Details.
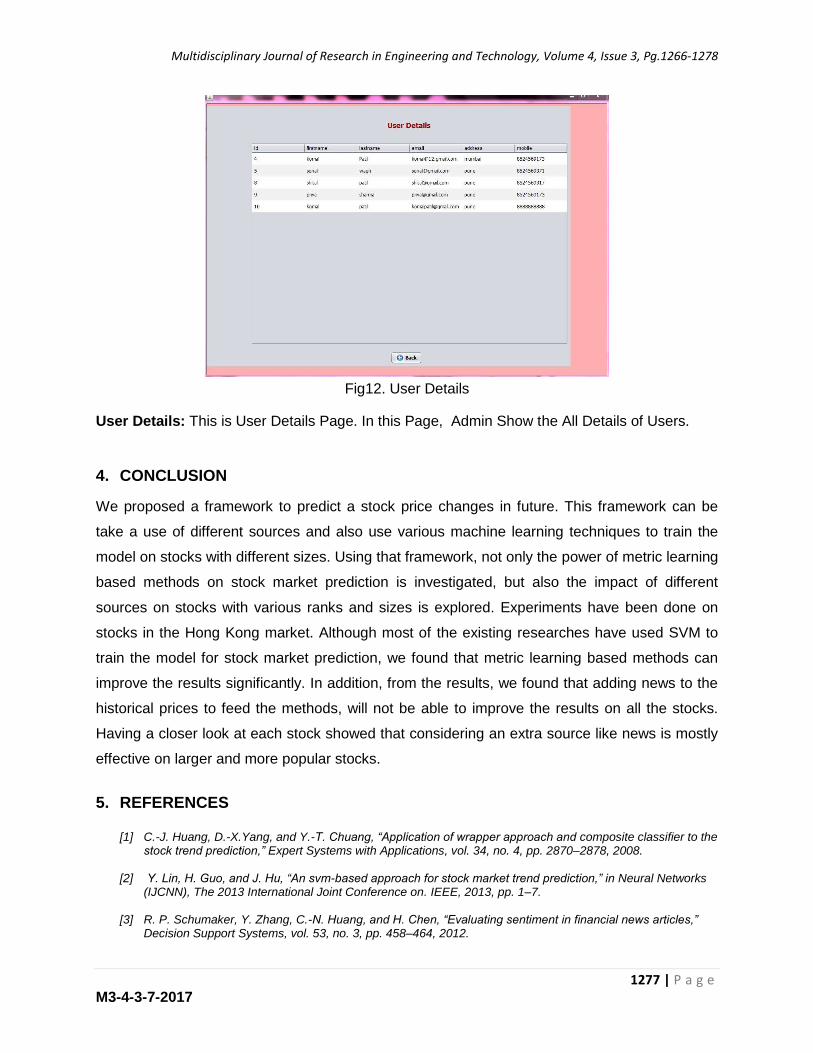
Fig11. Delete Users
Delete User: This is Delete User Page. In this page Delete the User Details in your database.
Multidisciplinary Journal of Research in Engineering and Technology, Volume 4, Issue 3, Pg.1266-1278
1277 | P a g e M3-4-3-7-2017
Fig12. User Details
User Details: This is User Details Page. In this Page, Admin Show the All Details of Users.
4. CONCLUSION
We proposed a framework to predict a stock price changes in future. This framework can be
take a use of different sources and also use various machine learning techniques to train the
model on stocks with different sizes. Using that framework, not only the power of metric learning
based methods on stock market prediction is investigated, but also the impact of different
sources on stocks with various ranks and sizes is explored. Experiments have been done on
stocks in the Hong Kong market. Although most of the existing researches have used SVM to
train the model for stock market prediction, we found that metric learning based methods can
improve the results significantly. In addition, from the results, we found that adding news to the
historical prices to feed the methods, will not be able to improve the results on all the stocks.
Having a closer look at each stock showed that considering an extra source like news is mostly
effective on larger and more popular stocks.
5. REFERENCES [1] C.-J. Huang, D.-X.Yang, and Y.-T. Chuang, “Application of wrapper approach and composite classifier to the
stock trend prediction,” Expert Systems with Applications, vol. 34, no. 4, pp. 2870–2878, 2008.
[2] Y. Lin, H. Guo, and J. Hu, “An svm-based approach for stock market trend prediction,” in Neural Networks (IJCNN), The 2013 International Joint Conference on. IEEE, 2013, pp. 1–7.
[3] R. P. Schumaker, Y. Zhang, C.-N. Huang, and H. Chen, “Evaluating sentiment in financial news articles,”
Decision Support Systems, vol. 53, no. 3, pp. 458–464, 2012.
Multidisciplinary Journal of Research in Engineering and Technology, Volume 4, Issue 3, Pg.1266-1278
1278 | P a g e M3-4-3-7-2017
[4] J. Benthaus and R. Beck, “It’s more about the content than the users!the influence of social broadcasting on stock markets,” in European Conference on Information Systems, 2015.
[5] S. Wang, L. Yu, H. Chen, and K. K. Lai, “Evolving least squares support vector machines for stock market
trend mining,” Evolutionary Computation, IEEE Transactions on, vol. 13, no. 1, pp. 87–102, 2009.
[6] J. Patel, S. Shah, P. Thakkar, and K. Kotecha, “Predicting stock and stock price index movement using trend deterministic data preparation and machine learning techniques,” Expert Systems with Applications, vol. 42, no. 1, pp. 259–268, 2015.
[7] Q. Li, L. Jiang, P. Li, and H. Chen, “Tensor-based learning for predicting stock movements,” in Twenty-Ninth
AAAI Conference on Artificial Intelligence, 2015.
[8] X. Li, H. Xie, L. Chen, J. Wang, and X. Deng, “News impact on stock price return via sentiment analysis,” Knowledge-Based Systems, vol. 69, pp. 14–23, 2014.
[9] X. Li, H. Xie, Y. Song, S. Zhu, Q. Li, and F. L. Wang, “Does summarization help stock prediction? a news
impact analysis,” Intelligent Systems, IEEE, vol. 30, no. 3, pp. 26–34, 2015.
[10] X. Li, H. Xie, R. Wang, Y. Cai, J. Cao, F. Wang, H. Min, and X. Deng, “Empirical analysis: stock market prediction via extreme learning machine,” Neural Computing and Applications, vol. 27, no. 1, pp. 67–78, 2016.
[11] Q. Li, T. Wang, Q. Gong, Y. Chen, Z. Lin, and S.- k. Song, “Media-aware quantitative trading based on
public web information,” Decision support systems, vol. 61, pp. 93–105, 2014.
[12] N. Prollochs, S. Feuerriegel, and D. Neumann, “Enhancing sentiment analysis of financial news by detecting negation scopes,” in System Sciences (HICSS), 2015 48th Hawaii International Conference on. IEEE, 2015, pp. 959–968.
[13] A. Bellet, A. Habrard, and M. Sebban, “A survey on metric learning for feature vectors and structured data,”
arXiv preprint arXiv:1306.6709, 2013.


