
Thursday, 02 June 2011
1
Facilitating Sustainability through Surface Engineering by Measurement and StandardsM G GeeNational Physical Laboratory
14th June 2011IMF Fair

2
Sustainability and Surface Engineering
Surface engineering can help with the sustainable use of materials and resources by e.g.:
Enabling the use of lightweight materials in transport applications leading to fuel efficiencyDevelopment of low friction in power plant and transmissions giving improved fuel efficiencyImproved durability of components and systems Improved manufacturing efficiencyLower materials use
To design effective surface engineering solutions we require good data for design
3
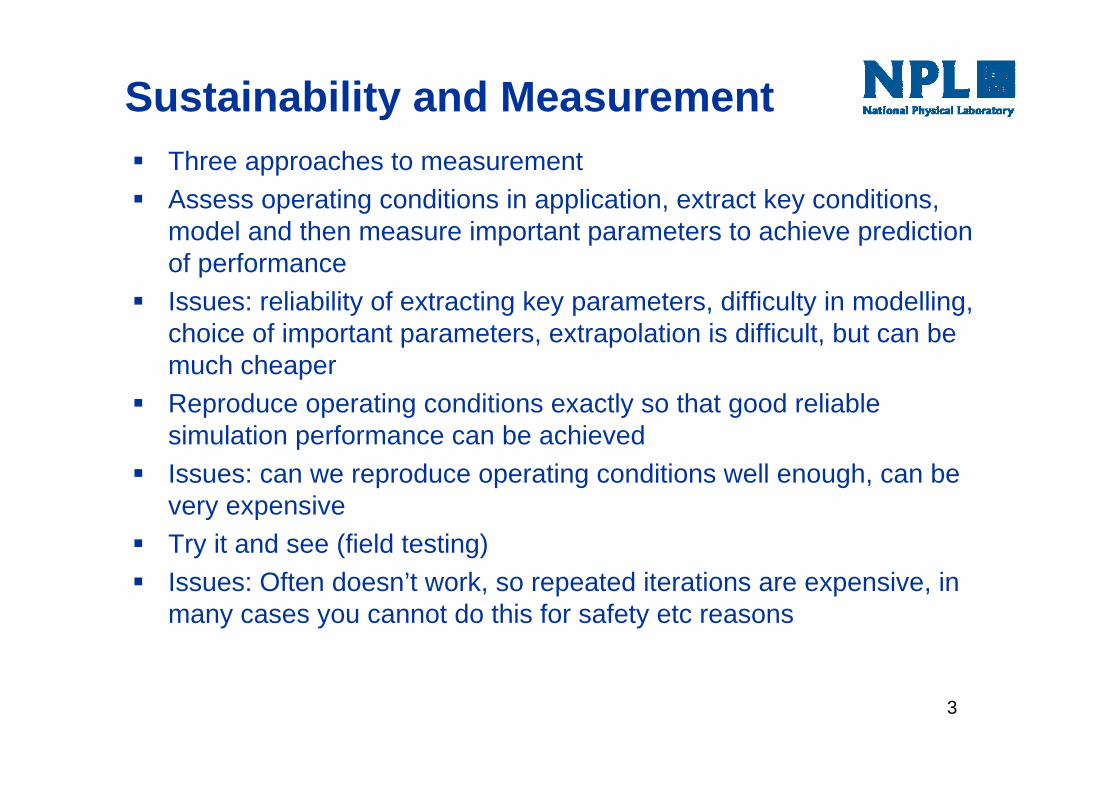
Sustainability and MeasurementThree approaches to measurementAssess operating conditions in application, extract key conditions, model and then measure important parameters to achieve prediction of performanceIssues: reliability of extracting key parameters, difficulty in modelling, choice of important parameters, extrapolation is difficult, but can be much cheaperReproduce operating conditions exactly so that good reliable simulation performance can be achievedIssues: can we reproduce operating conditions well enough, can be very expensiveTry it and see (field testing)Issues: Often doesn’t work, so repeated iterations are expensive, in many cases you cannot do this for safety etc reasons

4
Coatings MeasurementMeasurements needed in areas such as:
ThicknessChemistryStrength and adhesionHardness and elastic propertiesMeasuring wear and frictionDurabilityResidual stress
Aim is to make measurements simpler, more relevant, cheaper, more robustStandardisation can give improved framework for measurements

5
Video
Acoustic emission
Strain gauge
Load cell
Rollers
Motor drive
Displacement Sensor
Measuring Coating Integrity by Bend Testing
ContextNeed to provide information on integrity of coatings under mechanical loading
ScienceUse instrumented bend testing Acoustic emissionVideo to detect cracking
Future VisionIs being taken forward into work to provide simple test for near shop floor environmentProposal for standardisation in CEN

6
Bend Testing
Force displacement curves Acoustic emission

7
Bend Testing - Comparison of Samples
Hydroxyapatite
Chromium Carbide: Fine Ground
Chromium Carbide: Coarse Ground
Tungsten Carbide: Fine Ground
Tungsten Carbide: Coarse Ground
Hard Chrome
Codeposited Electroplate

8
Bend Testing - Case Study
Coated tubeCompare performance of oxidised and unoxidisedtube
Force vs displacement summary(all pipes)
0
100
200
300
400
500
600
700
800
900
-2 0 2 4 6 8
Displacement (mm)
Forc
e (N
)
Coated 1
Coated 2
Coated 3
Ox 1000 1
Ox 1000 2
Ox 1000 3
Ox 1100 1
Ox 1100 1b
Uncoated 1
Uncoated 2
Uncoated 3

9
Rockwell adhesion test
Radius of delamination , r
Load
Radius of indenter, a
Rockwell C indent made into coated specimen
Fracture and delamination around indent indicates adhesion properties

Rockwell Indentation Adhesion Test: Drory and Hutchinson Analysis
MCrAlY Coating on Mar M002 Substrate
ΓC=1470 J m-2ΓC= 680 J m-2
11
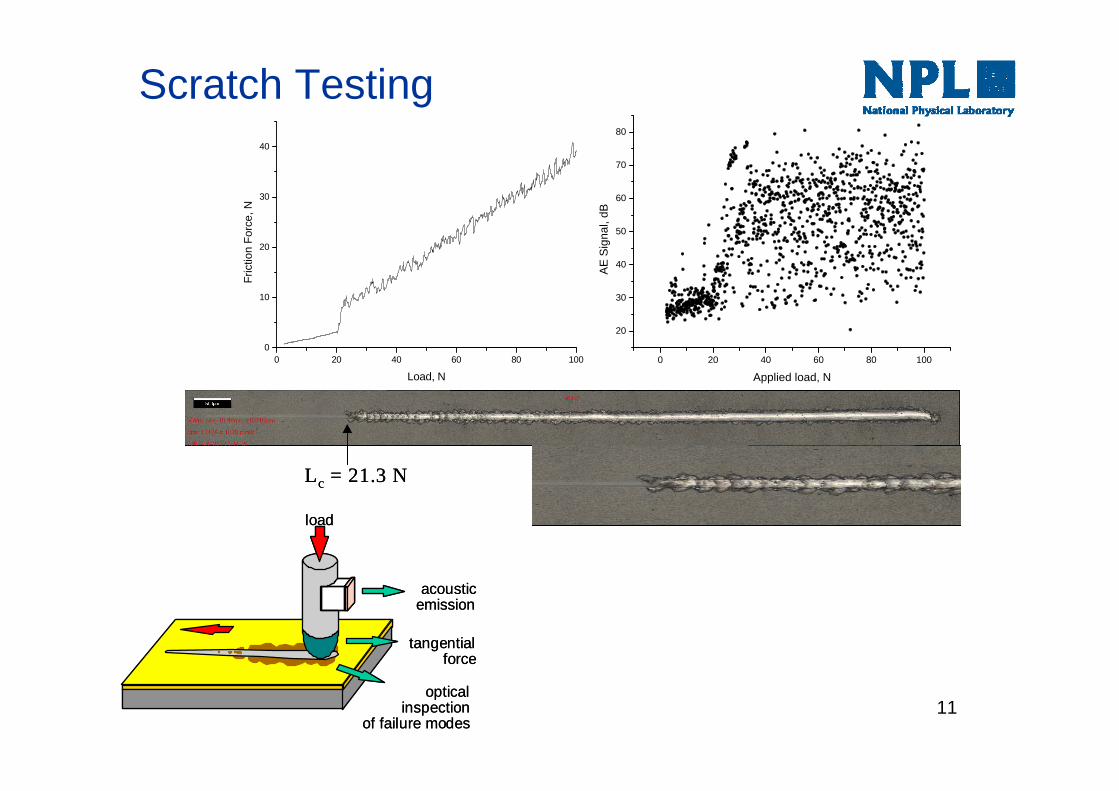
Scratch Testing
acousticemission
tangentialforce
load
opticalinspection
of failure modes
acousticemission
tangentialforce
load
opticalinspection
of failure modes
0 20 40 60 80 1000
10
20
30
40
Fric
tion
Forc
e, N
Load, N0 20 40 60 80 100
20
30
40
50
60
70
80
AE
Sig
nal,
dB
Applied load, N
Lc = 21.3 NLc = 21.3 N

12
Scratch Testing - TranverseNormal Load(10 to 80 N)
Coating
Substrate
Rockwell Indenter
Direction of Travel
Substrate
Coating
Direction of Travel
10 N
80 N
Cra
ck le
ngth
, µm
Critical Load (Lc)
0
200
400
600
800
1000
0 20 40 60 80 100 120 140 160 180 200
Indenter Load, N
50 N
80 N
10 N
13
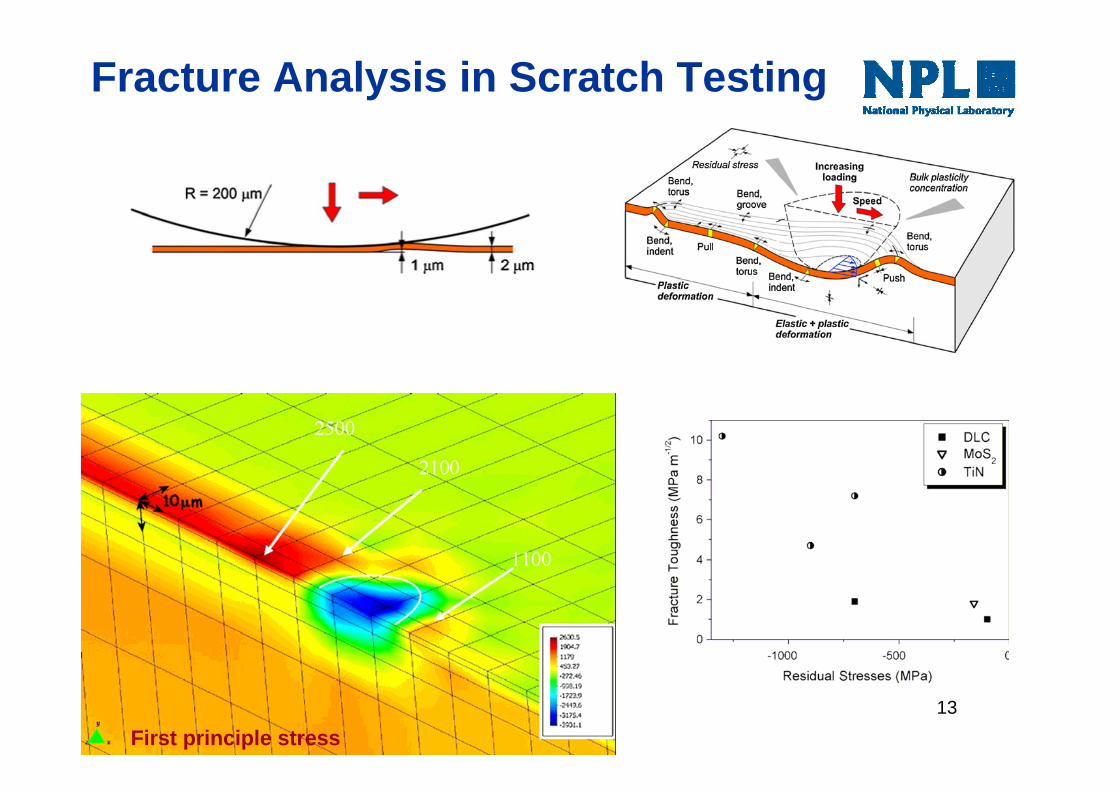
Fracture Analysis in Scratch Testing
First principle stress
14
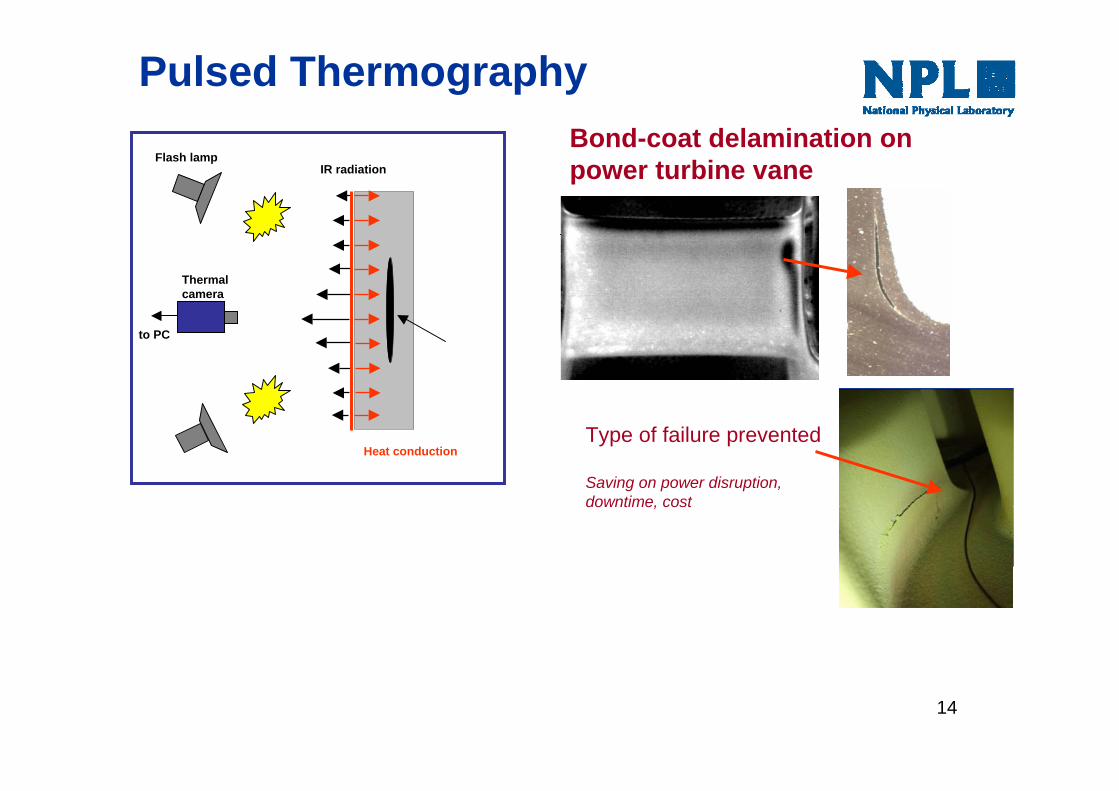
Pulsed Thermography
Heat conduction
IR radiationFlash lamp
Thermal camera
to PC
Bond-coat delamination on power turbine vane
Type of failure prevented
Saving on power disruption, downtime, cost

15
Coupon Bending for Residual Stress Measurement
Residual stress from thermal expansion mismatch and processing effectsFor thin coatings Stoneyformula; thick coatings more complex formulaMethods for measurement
Profilometry- Flexus
Optical microscopeLVDT

16
-20 -10 0 10 20 30-250
-200
-150
-100
-50
0
Def
lect
ion,
μm
Distance, mm
Optical Flexus
-60 -50 -40 -30 -20 -10 0
0.0
0.5
1.0
1.5
2.0
Hei
ght,
mm
Distance,mm
Substrate Finish and Thickness Fine, 1.2 Fine, 2 Fine, 3 Coarse, 1.2 Coarse, 2 Coarse, 3
1.0 1.2 1.4 1.6 1.8 2.0 2.2 2.4 2.6 2.8 3.0 3.20
100
200
300
400
500
600
700
800
900
1000
1100
1200
Res
idua
l Stre
ss, M
Pa
Substrate Thickness, mm
Coarse Freund Fine Freund Coarse Stoney Fine Stoney
Coupon Bending for Residual Stress Measurement
Optical microscope measurements on thermally sprayed coatings
Profilometer measurements on Fecralloy Sample (574 MPa)
Comparison between optical and profilometer measurements
Comparison between Stoney and Freund analysis LVDT jig

17
Coating Measurement Using SAWs
Movie from http://www.novelengineers.com/LaWave.ppt
Non-contact measurement method using high power laser
Short (400ps) laser pulse is adsorbed by materialThermo-elastic expansion generates wide
bandwidth SAW packetsSAWs detected by piezo-wedgeVelocity used to calculate Elastic
Modulus, Poisson’s ratio, Film thickness, Porosity & Density
3060
3080
3100
3120
3140
3160
3180
3200
3220
0 20 40 60Frequency, f (MHz)
Pha
se V
eloc
ity, c
(m/s
)
Steel
3µm TiNon Steel

18
Impact Excitation Apparatus
Resonant Frequencies
ContextNeed for simple measurement of coating modulusModulus can be measure of quality and integrity of coating
ScienceUse impact excitation where transducer measures the resonant frequency f.Modulus E is function of geometry and resonant frequency
Future VisionDevelop into portable easy to use apparatus for shop floor use
19
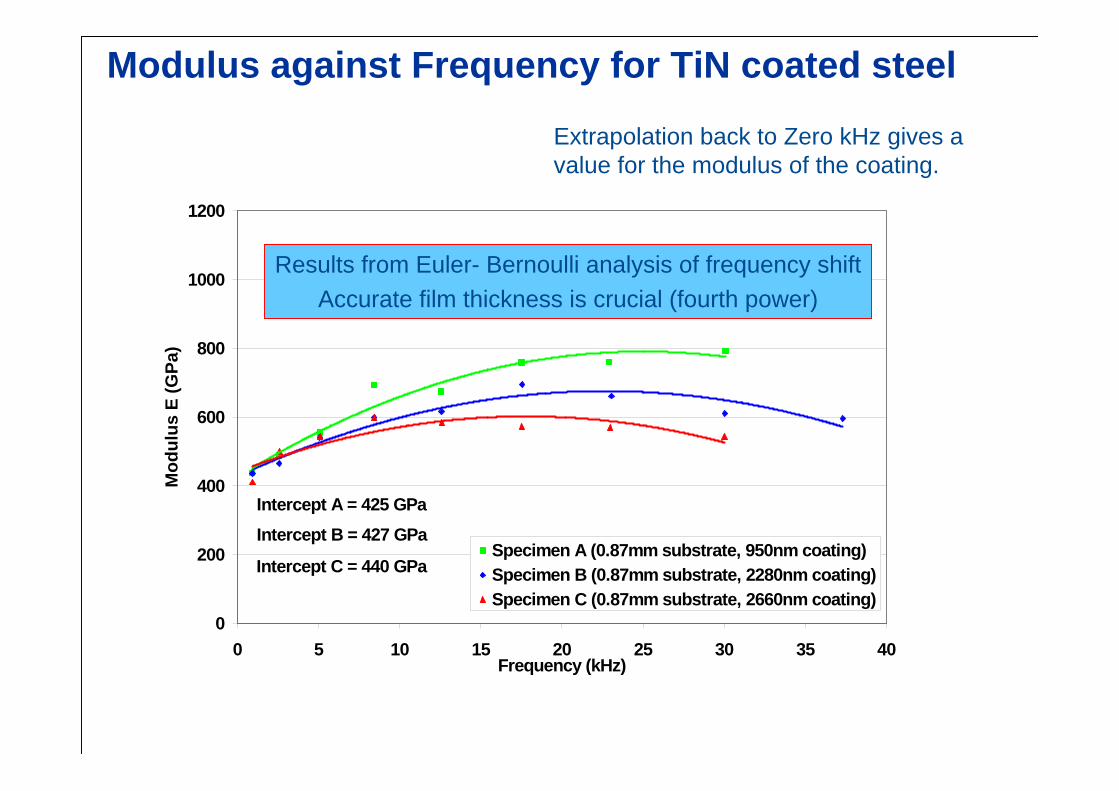
Modulus against Frequency for TiN coated steel
Extrapolation back to Zero kHz gives a value for the modulus of the coating.
Intercept B = 427 GPaIntercept A = 425 GPa
Intercept C = 440 GPa
0
200
400
600
800
1000
1200
0 5 10 15 20 25 30 35 40Frequency (kHz)
Mod
ulus
E (G
Pa)
Specimen A (0.87mm substrate, 950nm coating)Specimen B (0.87mm substrate, 2280nm coating)Specimen C (0.87mm substrate, 2660nm coating)
Results from Euler- Bernoulli analysis of frequency shiftAccurate film thickness is crucial (fourth power)

20
Before Wear
After Wear
Before Wear
After Wear
After Wear
Correlated and Subtracted Images
Profile from above
3D Optical Microscopy for Wear MeasurementSimilar to confocalmicroscopyHeight data combined with image dataDataset correlationReal volume measurement
21
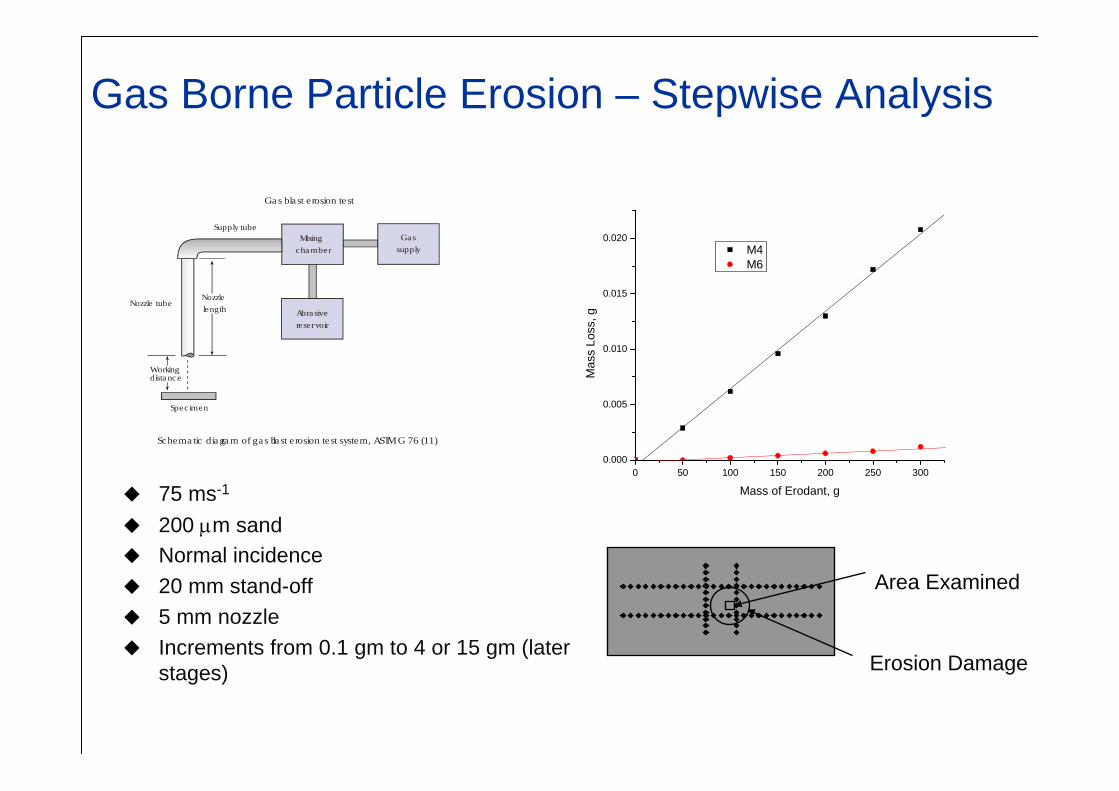
Gas Borne Particle Erosion – Stepwise Analysis
Supply tubeMixing
cha mberGas
supply
Abra sivereservoir
Nozzle tube
Spec imen
Workingdista nce
Ga s bla st erosion test
Nozzlelength
Schematic diagram of gas bla st erosion test system, ASTM G 76 (11)
75 ms-1
200 μm sandNormal incidence20 mm stand-off5 mm nozzleIncrements from 0.1 gm to 4 or 15 gm (later stages)
0 50 100 150 200 250 3000.000
0.005
0.010
0.015
0.020
Mas
s Lo
ss, g
Mass of Erodant, g
M4 M6
Erosion Damage
Area Examined
22
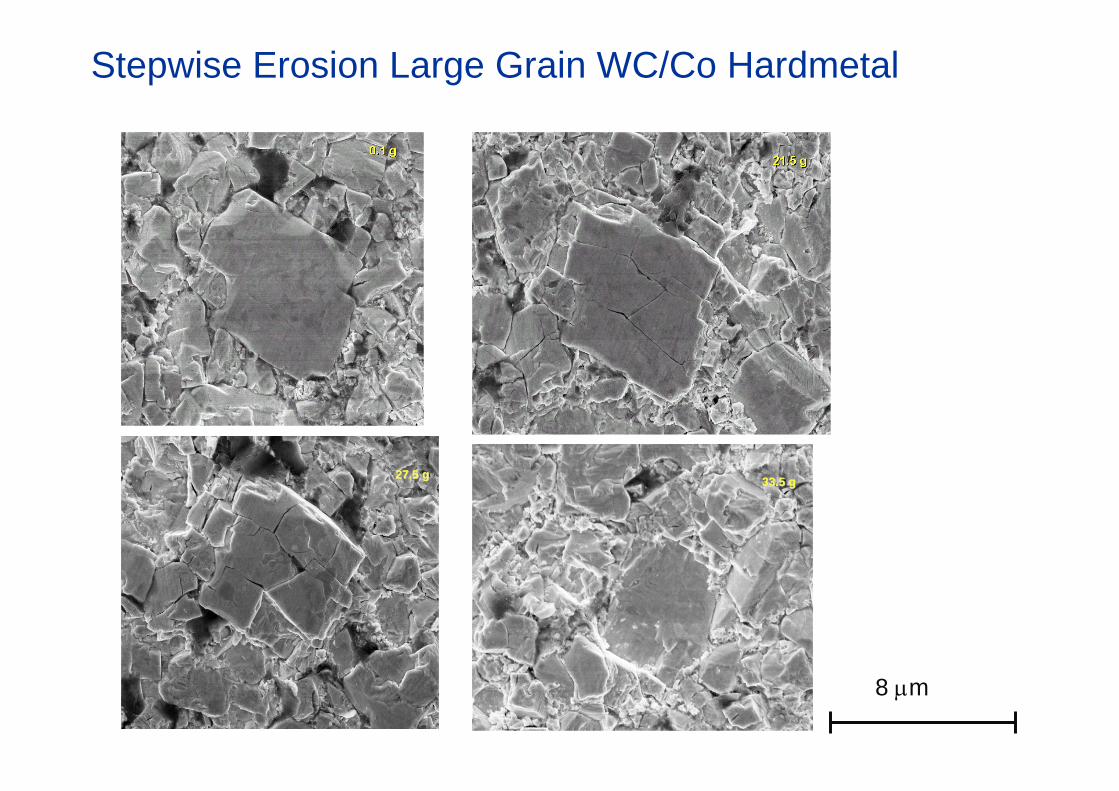
Stepwise Erosion Large Grain WC/Co Hardmetal
8 μm
27.5 g27.5 g 33.5 g33.5 g

23
Monitoring Degradation of Surfaces Due to Wear
Develop sensors that give signature that can be related to wear processesSetting up four different approaches
Electrostatic probeElectromagnetic probeChromatic aberration probe
- Reflectivity- Distance
Real time video of moving surface through linescancamera system
Booth et al, Tribology International 39 (2006) 1564–1575

24
Chromatic Aberration ProbeUses optics giving enhanced chromatic aberrationDifferent wavelengths are focussed at different depthsMeasuring colour of reflected light gives measure of distance
Non-contactFast
-10
-5
0
5
10
15
0 500 1000 1500 2000 2500 3000 3500 4000Time (s)
Arm
Dis
plac
emen
t(mic
rom
etre
s)
7.86
7.87
7.88
7.89
7.9
7.91
7.92
7.93
7.94
7.95
7.96
Opt
ical
Pro
be O
utpu
t (V)
Displacement-sdOpto Probe

25
New In-situ Micro-tribology Test System
A new micro-tribology test system has been designed and fabricated (within the SEM) to perform tests on a range of low friction coatings. The test system is being applied to three initial areas:1. A study of the abrasion resistance of tool materials such as WC/Co2. Examination of the tribological performance of low friction carbon based coatings3. Tribological assessment of Inorganic Fullerene Like coatings: EU project
Friction with time for micro-tribology experiment on CPxfilms from LinköpingUniversity
26
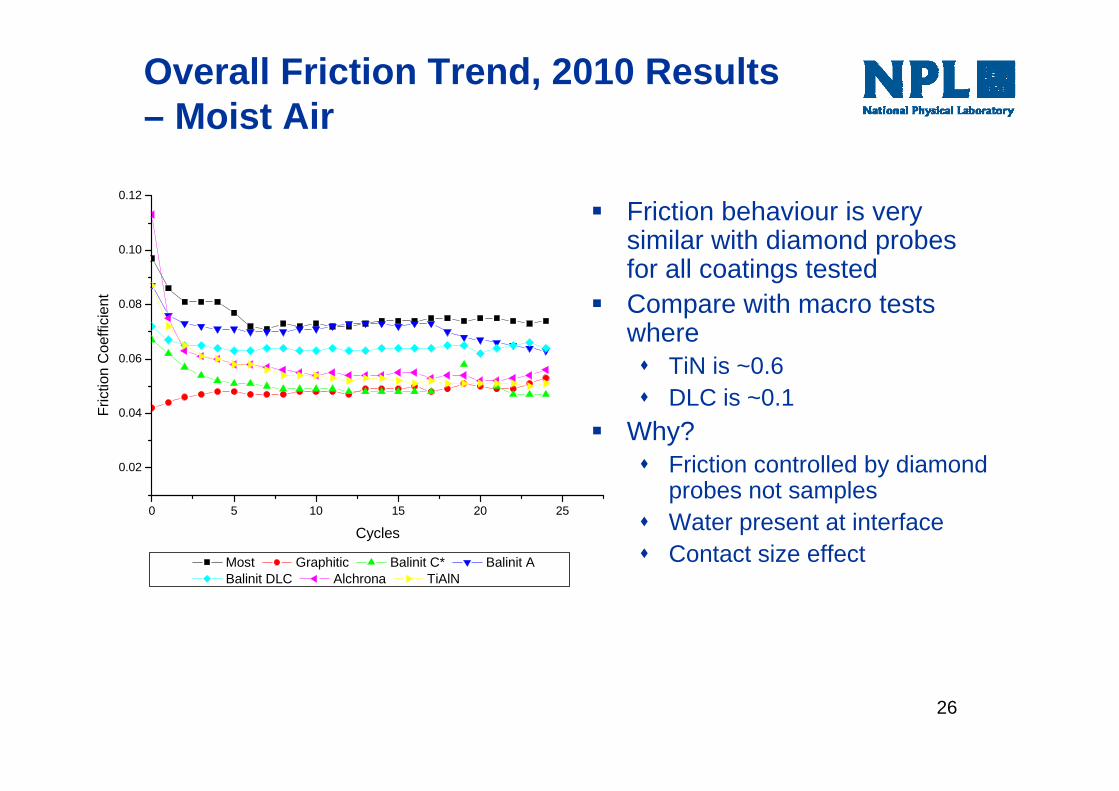
Overall Friction Trend, 2010 Results – Moist Air
0 5 10 15 20 25
0.02
0.04
0.06
0.08
0.10
0.12
Fric
tion
Coe
ffici
ent
Cycles
Most Graphitic Balinit C* Balinit A Balinit DLC Alchrona TiAlN
Friction behaviour is very similar with diamond probes for all coatings testedCompare with macro tests where
TiN is ~0.6DLC is ~0.1
Why?Friction controlled by diamond probes not samplesWater present at interfaceContact size effect
27
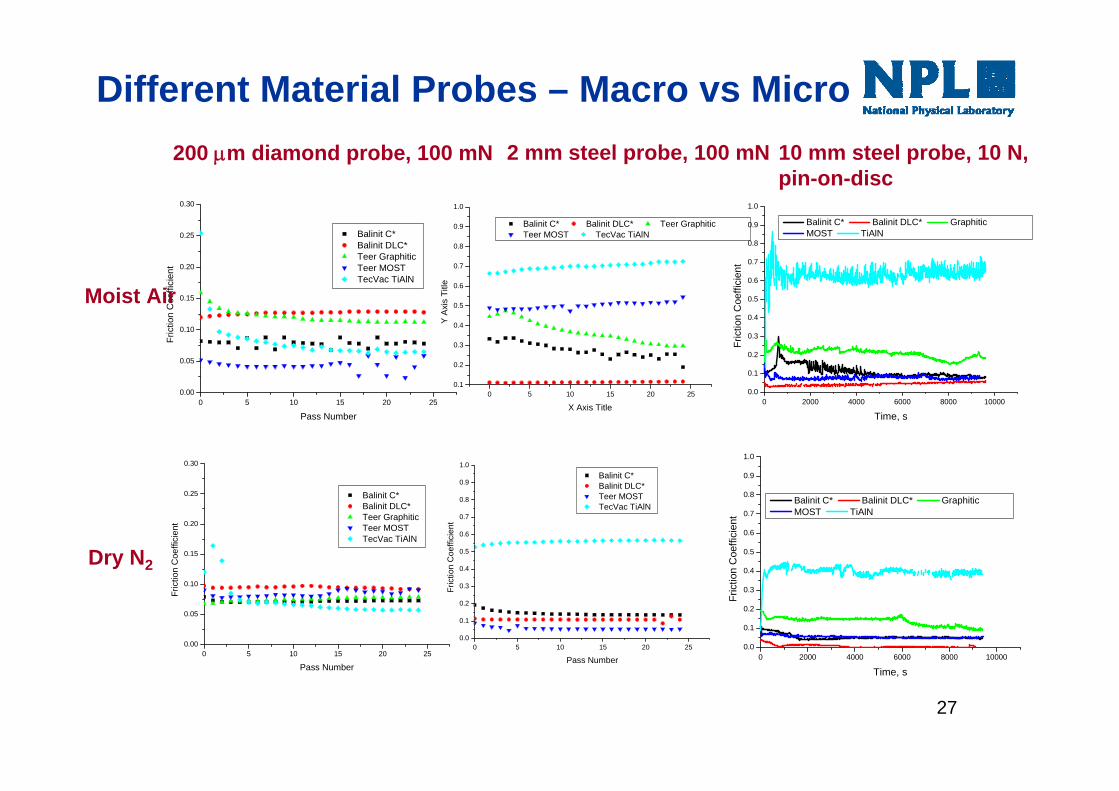
Different Material Probes – Macro vs Micro
0 5 10 15 20 250.1
0.2
0.3
0.4
0.5
0.6
0.7
0.8
0.9
1.0
Balinit C* Balinit DLC* Teer Graphitic Teer MOST TecVac TiAlN
Y Ax
is T
itle
X Axis Title0 5 10 15 20 250.00
0.05
0.10
0.15
0.20
0.25
0.30
Balinit C* Balinit DLC* Teer Graphitic Teer MOST TecVac TiAlN
Fric
tion
Coe
ffici
ent
Pass Number
0 5 10 15 20 250.00
0.05
0.10
0.15
0.20
0.25
0.30
Balinit C* Balinit DLC* Teer Graphitic Teer MOST TecVac TiAlN
Fric
tion
Coe
ffici
ent
Pass Number
0 5 10 15 20 250.0
0.1
0.2
0.3
0.4
0.5
0.6
0.7
0.8
0.9
1.0 Balinit C* Balinit DLC* Teer MOST TecVac TiAlN
Fric
tion
Coe
ffici
ent
Pass Number
0 2000 4000 6000 8000 100000.0
0.1
0.2
0.3
0.4
0.5
0.6
0.7
0.8
0.9
1.0
Fric
tion
Coe
ffici
ent
Time, s
Balinit C* Balinit DLC* Graphitic MOST TiAlN
0 2000 4000 6000 8000 100000.0
0.1
0.2
0.3
0.4
0.5
0.6
0.7
0.8
0.9
1.0
Balinit C* Balinit DLC* Graphitic MOST TiAlN
Fric
tion
Coe
ffici
ent
Time, s
Moist Air
Dry N2
200 μm diamond probe, 100 mN 2 mm steel probe, 100 mN 10 mm steel probe, 10 N,pin-on-disc
28
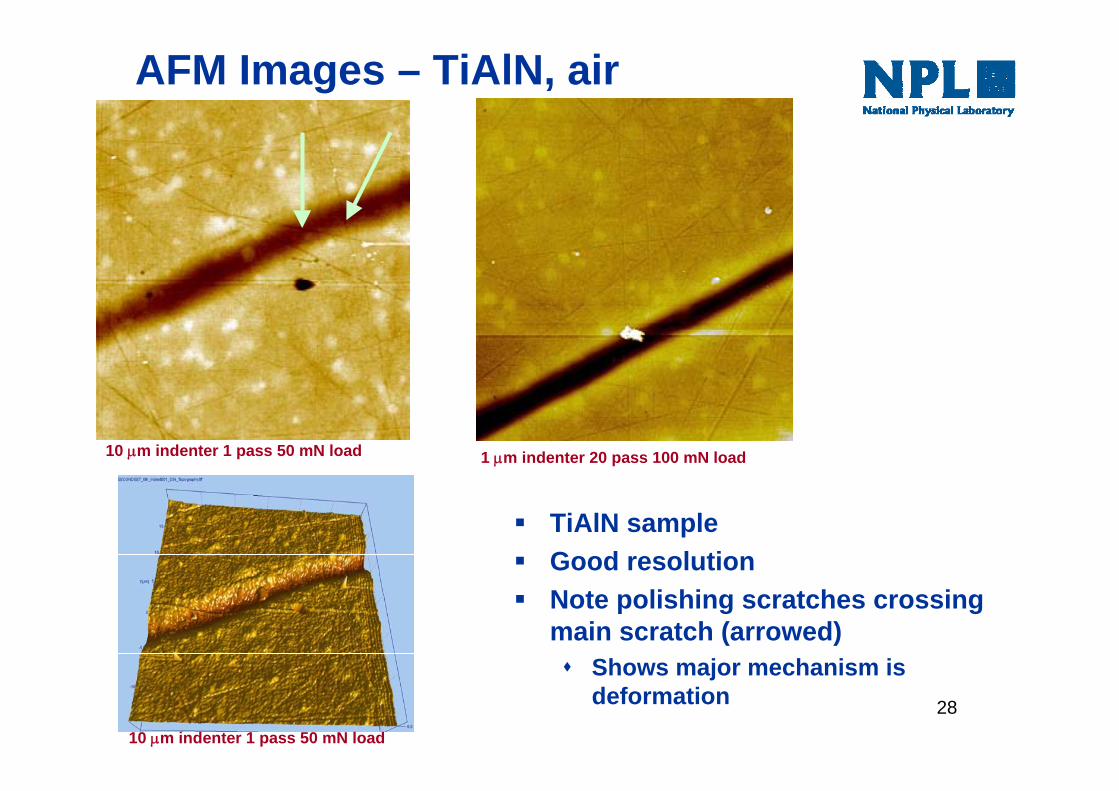
AFM Images – TiAlN, air
TiAlN sampleGood resolutionNote polishing scratches crossing main scratch (arrowed)
Shows major mechanism is deformation
10 μm indenter 1 pass 50 mN load
10 μm indenter 1 pass 50 mN load
1 μm indenter 20 pass 100 mN load

29
TiAlN Scratch Profiles (AFM)
Used SPIP to obtain average profiles from scratches (average of 50)Shows uplift at edge of scratch (particularly for 1 μm)Width of scratch is same for 1 μm and 10 μm
-10000 -5000 0 5000 10000-200
-150
-100
-50
0
50
Hei
ght,
nm
Distance, nm
1 pass 2 pass 10 pass 20 pass 50 pass
-10000 -5000 0 5000 10000-45
-40
-35
-30
-25
-20
-15
-10
-5
0
5
10
15
20
Hei
ght,
nm
Distance, nm
2 pass 10 pass 20 pass 50 pass
-10000 -5000 0 5000 10000
-150
-100
-50
0
50
Hei
ght,
nm
Distance, nm
1 μm 10 μm
50 mN 1 μm indenter 50 mN 10 μm indenter
30
Help Available?
IOM3 Technology Hub on IOM3 Surface Engineering Division Board web site being developed to give guidance and access to literatureAcademic centres across UKNPL Good Practice Guide No 83, An Introduction to the MechanicalTesting of Coatings, M G Gee and N M JennettMeasurement standards in many ASTM, CEN and ISO committees
Metallic and other inorganic coatings, BS STI/33, CEN 262, ISO TC 107Ceramic coatings, BS RPI/13, CEN 184 WG5, ISO TC 206Thermal sprayed coatings, BS STI/40, CEN 240

31
To Sum UpWide range of measurement methods availableRange of accessibityNeed to think about relevance of measurements to applicationsNPL is available to help


