
D.U. Journal of Marketing, Vol. 16, No. 1, June 2013 (Published in December, 2015)
FACTORS CONSIDERED IN BUSINESS BUYING ACROSS
DIFFERENT LEVELS OF DISTRIBUTION CHANNELS: A
STUDY ON CEMENT INDUSTRY OF BANGLADESH
Abu Naser Ahmed Ishtiaque1
Moutushi Tanha2
Arifur Rahman3
Abstract: The significance of business buying of distribution channel
members in cement industry is multifaceted. Cement industry itself has a
great strategic value in economy. It is the major component in construction
sector. In Bangladesh, some local cement companies are dominating the
market with their quality products, adoption of state-of-the-art technologies
and effective marketing strategy including countrywide distribution channel
whereas some multinational companies also are operating with financial
power and technological acumen backed by global reputation. Distribution
channel members of cement in the country sometimes face unfavorable
circumstances and fail to reap the multifarious benefits from such lucrative
industry. The current study aims at identifying and analyzing the factors
that distribution channel members of cement consider while buying cement.
The study found high demand, high quality, high commission rate, rational,
competitive and reasonable price, good Brand-Image, delivery as per
scheduled time, quick delivery, transportation facility and credit time,
availability, good and effective communication are important economic and
non-economic factors considered while buying cement in the context of
Bangladesh.
Keywords: Cement, SCM, Distributor, Dealer, Retailer, Channel Conflict,
Brand
INTRODUCTION
In recent years supply chain management (SCM) has become a highly discussed
topic in economics and business throughout the world (Arntzen et al., 1995).
There has been much interest amongst managers and academics regarding SCM
and supply chain integration. The term SCM is used frequently in today‟s
materials management environment and is generally associated with advanced
information technologies, rapid and responsive logistics services, effective
physical distribution, supplier management, and customer relationship
management (Lee and Billington, 1995). According to Lee and Billington (1995)
most managers are familiar with the supply chain slogan– “suppliers‟ supplier to
customers‟ customer.” Physical distribution system backed by the necessary
1 Professor, Department of Marketing, University of Dhaka, Bangladesh.
2 Associate Professor, Department of Marketing, University of Dhaka, Bangladesh. 3 Associate Professor, Department of Marketing, University of Dhaka, Bangladesh.

82 D.U. Journal of Marketing, Vol. 16, No. 1, June 2013
flows (Bovet and Martha, 2003) is one of the key function of managing a supply
chain apart from material sourcing, production scheduling. Successful
management of the distribution channel is required for competitive advantage.
Cement industry is considered as one of the most energy-intensive manufacturing
industries around the world as it is the basic component of making concrete.
Therefore, this industry is a priority one requiring a careful planning and
controlling of its manufacturing and managerial activities and operations (The
Daily Star, 2010). Cement industry, a relatively fast growing industry in
Bangladesh, is developing in keeping pace with increasing building and
construction activities. Cement, being the major component in construction
sector, the industry itself has a great strategic value. Though there are some
multinational cement companies with financial power and technological acumen
backed by global reputation; certain local companies are dominating the market
with their quality products, adoption of state-of-the-art technologies and effective
marketing strategy including countrywide distribution channel (The Daily Star,
2010).
From the above discussion it is evident that proper utilization of an effective and
efficient distribution network is a perquisite for sustaining in this fiercely
competitive industry of cement in Bangladesh. And distribution channel
members are the role players of such network. Dynamics of their behavior across
distribution channel are very influential for smooth flows of distribution of
cement. This study is therefore worthy to research.
LITERATURE REVIEW
The management of supply chain is gaining increased attention due to the
expansion and complexity of the distribution networks. Yuva (2002) identified
that managing an efficient distribution system in a supply chain is one of the
important factors required to reduce the costs and thereby increasing profit. The
supply chain consists of many stages including fulfilling a customer request.
Fawcett and Magan (2002) argued that the supply chain not only includes the
manufacturer and suppliers, but also transporters, warehouses and all other
related operations and processes. Past research on supply chain management
mainly focused on some of its implementation issues (Handfield and Nichols Jr.,
1999) which includes all functions involved in filling the customer request. Such
functions include, but are not limited to, new product development, marketing,
operations, distribution, and finance and customer services. The primary purpose
for the existence of any supply chain is to satisfy customer needs. Distribution
activities begin with the customer orders and end after delivering the required
items to the right customer at the right place (Mentzer et al., 2001). A company‟s
supply chain encompasses all of the facilities, functions and activities involved in
producing a product or schedule, facility location, transportation and distribution.
All these are affected by product demand in the short run and by utilizing new
technology in addition to market demand in the long run (Davis and Drumm,
Factors Considered In Business Buying Across Different Levels Of Distribution Channels 83
2001). Distribution of cement is not beyond an exception. In Bangladesh, there is
an expanded and complicated distribution activity in cement industry.
The purchase of components and services has direct effects on the business.
According to prior studies of Chisnall (1985), Brands (1994), Gadde and
Hakansson (1994), Hurt and Speh (1998) and Cavinato (1999), industrial
purchasing involves many activities: identifying the supplier base, establishing
bidding competition, creating tools for managing the purchasing activity,
minimizing supplier related risk, evaluating and comparing the potential supply
partners, and forming supply contracts. Despite the complexity of purchasing
process the essential choices are manifested in companies‟ purchasing strategies
in different contextual buying settings (Faces et al., 2001; Hurt and Speh, 1998).
Key dilemmas in strategy formulation relate to the nature of exchange and to the
selection of suppliers among the excess of potential actors (Cavinato, 1999; Faes
et al., 2001).
Business buying is something different form consumer buying in terms of the use
of the product. According to Kotler and Armstrong (2012) business buyers do not
use products for their consumption rather for reselling or further processing
purpose whereas consumer buyers use for their own consumption. Distribution
channel members are business buyers and therefore, their buying is much more
rational and responsible buying unlike consumer buyer.
Distribution channel consists of different levels including supplier, manufacturer,
distributor and consumer and is a network of companies that influences each
other from raw materials to finished goods (Christopher et al., 2002; chain,
2003). For formulating effective distribution strategy it is important to identify
different levels of distribution network of any industry. Lamming et al. (2001)
suggested that there are varying degrees of supply chain visibility or sharing of
information between partners in a supply chain and refers to it as transparency.
According to Lamming‟s et al. (2001) categorization of the varying degrees of
transparency is Opaque, Translucent and Transparent. An increasing in available
supply chain data gives the illusion of visibility, however, it can add to a firm‟s
challenge of matching insights from the analyses to strategy.
According to Chan (2003), visibility for a distribution network is important for
accurate and fast delivery of information. Therefore, which actors are playing in
a particular distribution channel and the existing network is significant.
Identifying distribution channel members of cement and the information flow
among them is therefore justified to a large extent. In connection with this
argument, Lee et al. (1997) stated that lack of accurate information can cause
certain negative consequences such as the bullwhip-effect in supply chains.
According to Svensson (2004) the two main influences on the perception of
corporate vulnerability in supply chains are the degree of transparency and the
degree of obscurity. He stated that the more accurate the information, the higher
the transparency, but the more accurate the information deteriorates, the higher

84 D.U. Journal of Marketing, Vol. 16, No. 1, June 2013
becomes the obscurity. He believed that, together, these two influences create a
conceptual framework and contribute to the dilemma of corporate vulnerability.
Therefore, effective communication between channel members is prerequisite for
successful distribution. Trust and dependence are elementary qualities in
customer-supplier relationships of networked organizations. Some level of trust
is a necessary condition for all repeated inter organizational transactional (Das
and Teng, 1998; Ring and Van de Ven, 1992) and as a relationship develops
further, the interdependence between the partners is likely to increase (Pfeffer
and Salancik, 1978). However, the increasing dependence may contribute to the
fear of partner‟s opportunistic behavior, the magnitude of expected coordination
costs, and the difficulties of the relationship coordination (Gulati and Singh,
1998; Krishnan et al., 2006).
Sterling and Lambert (1989) studied the office systems and furniture industry and
the plastic industry in some depth. From a large number of variables (99 and 112,
respectively) representing product, price, promotion and physical distribution,
they were able to determine those that were most important to the buyers,
customers and influencers of purchases from these industries. Based on mean
scores of importance, as indicated by respondents on a one to seven point scale,
they rank ordered the service (physical distribution) elements in each of these
industries. They ranked customer service variables by order of importance for 2
industries: office systems and furniture industry and plastic industry. For office
systems and furniture industry, they considered ability of manufacturer to meet
promised delivery date, accuracy in filling orders, overall manufacturing and
design quality relative to price, competitiveness of price, advance notice on
shipping delays, timely response to requests for assistance from manufacturer‟s
representatives, action on customer service complaints, order cycle consistency
(small variability), accuracy of manufacturer in forecasting estimated ship dates,
overall aesthetics and finish, continuity (nonobsolescence of products),
manufacturer‟s willingness to accept returns of damaged products, length of
promised lead time for quick-ship orders, completeness of contract orders,
completeness of quick-ship orders and realistic and consistent pricing policy.
And for plastic industry they considered supplier‟s resins are of consistent
quality, accuracy in filling orders (correct product is shipped), competitiveness of
price, processability of resin (main ingredients of plastic), consistent lead times
(vendor consistently meets expected delivery date), consistent melt flow, ability
to expedite emergency orders in a fast responsive manner, information provided
when order is placed– projected shipping date, advance notice of shipping delays,
adequate quality of resin relative to price, overall quality of resin relative to
price, actions on complaints (e.g., order servicing, shipping, product etc.), length
of promised lead times (from order submission to delivery-in-stock products) and
inventory availability.

Factors Considered In Business Buying Across Different Levels Of Distribution Channels 85
Their research showed that physical distribution is an integral and necessary
component of the marketing mix, and that it offers a significant opportunity for
firms to gain differential advantage in the marketplace. Evaluation of the 16
variables rated as most important by dealers, end users and architectural and
design firms disclosed that at least one-half were physical distribution variables
(Sterling and Lambert, 1989).
In another study conducted by Lambert and Harrington (1989), 9 of the 18
variables rated as most important were related to logistics in case of plastic
industry. Of the remaining variables, 5 related to product quality, 2 to price and 2
to the sales force. The Sterling-Lambert research certainly suggested that
logistics customer service is dominant in the minds of customers in the office
systems and furniture industry and the plastics industry. Although such a small
sample of industries may not be overly convincing, others have observed the
same phenomenon. In a similar study of the auto glass after market, Innis and
LaLonde (1994) found that 6out of the top 10 customer service attributes were
logistical in nature.
Notably, high fill rates, frequency of delivery and information on inventory
availability, projected shipping date and projected delivery date at the time of
order placement received high ratings among the retail customer base. Further,
LaLonde and Zinszer (1994) found that product availability (order completeness,
order accuracy and stocking levels) and order-cycle time (order-transit time and
time for assembly and shipping) were dominant in the minds of users, being most
important to 63% of the respondents in their study.
Marr (1994) also surveyed a number of firms with the following conclusions:
only one respondent mentioned cost of service, of the top seven elements, only
one was outside the control of distribution management, the most important
service element was speed of delivery.
Shycon Associates surveyed purchasing and distribution executives across a
large cross section of American industry, asking them to rate their suppliers
(Baritz and Zissman, 1983). Their study showed the most common service
complaints from customer part. Late delivery, a logistics customer service
variable, accounted for nearly half of the mentioned service infractions, while
product or quality mistakes represented about a third. Besides, damaged goods,
frequently cut items are also important. Jackson et al. (1986) were able to show
how service elements take on different degrees of importance, depending on the
product type being purchased. They surveyed 254 purchasing agents in 25
companies about the importance of 6 physical distribution service elements: in-
stock performance, lead time, consistency of delivery time, order progress
information, protective packaging, cooperation in handling, shipping problems.
Their results showed ranking of six physical distribution service elements by
product type. In summary, the following are considered the most important

86 D.U. Journal of Marketing, Vol. 16, No. 1, June 2013
logistics customer service elements: on-time delivery, order fill rate, product
condition and accurate documentation.
According to Kotler and Armstrong (2010), during supplier selection, the buyers
often draw up a list of the desired supplier attributes and their relative
importance. Such attributes include product and service quality, reputation, on-
time delivery, ethical corporate behavior, honest communication and competitive
prices. The buyers rate suppliers against these attributes and identify the best
supplier(s).
Finally, dynamism of channel relationships consist of degree of collaboration,
commitment and trust among channel members, power and dependence (Cravens
and Piercy, 2009). They argued that the extent of collaboration is influenced by
the complexity of the product, the potential benefits of collaboration, and the
willingness of channel members to work together as partners. Distribution
channel model encourages collaboration and information-sharing between
suppliers and producers. Like any distribution channel network, cement also
demands largely a fair amount of collaboration, commitment and trust among its
channel members. Absence of such factors results in obvious conflict of interest.
According to Cravens and Piercy (2009), highly collaborative relationships
among channel members call for a considerable degree of commitment and trust
between the partners. In every business, the cooperating organizations provide
access to confidential product plans, market data and other trade secrets. Bovet
and Martha (2003) argued that trust normally develops as the partners learn to
work with each other and find the relationship to be favorable to each partner‟s
objectives. Conventional channel relationships may, nevertheless, result in some
channel members possessing more bargaining power than others. In many
sectors, suppliers face unprecedented pressure from powerful channel members.
Responses may include suppliers reclaiming important value-added services from
distributors to build stronger relationships with end-users, eliminating layers in
the conventional channel; or creating new channels.
Lastly, conflict of interest is another dimension of channel behavioral dynamism.
According to Cravens and Piercy (2009), conflicts are certain to occur between
the channel members and in multi-channeling between channels, because of
differences in objectives, priorities and corporate cultures. Looking at a proposed
channel relationship by each participating organization may identify areas (e.g.,
incompatible objectives) that are likely to lead to major conflicts. In such
situations, management may decide to seek another channel partner. Accurate
and timely flow of information is necessary to reduce conflict among channel
members that is also justified by Cravens and Piercy (2009) that effective
communications before and after establishing the channel relationships can also
help to eliminate or reduce conflicts.

Factors Considered In Business Buying Across Different Levels Of Distribution Channels 87
OBJECTIVES
The foremost thrust of the study is to explore the factors that are considered in
business buying of distribution channel members (manufacturers, dealers,
distributors and retailers) of cement industry across different levels of the
distribution channel. In the light of this main objective, specific objectives
(Malhotra, 2007) of the study are:
1. to identify the distribution channel members across different levels of the
distribution channel of cement,
2. to explore the reasons behind preference of selling a particular brand of
cement by distributors, dealers and retailers,
3. to discover the reasons behind distributors‟ discouragement as perceived by
dealers and retailers,
4. to explore the reasons behind dealers‟ discouragement stated by retailers,
5. to know the dealers‟ efforts to induce retailers to sell specific brands,
6. to know dealers‟ motive to push specific brands to retailers,
7. to identify conflict among distribution channel members of cement, and
8. to draw some recommendations.
METHODOLOGY
An exploratory followed by descriptive study on the channel members
(manufacturers, dealers, distributors, retailers) was conducted in the context of
Bangladeshi cement industry. At first, qualitative approach was used. In-depth
interviews with distributors, dealers, retailers, institutional buyers and individual
buyers were conducted. Survey was conducted for addressing descriptive aspect
of the study.
Both primary and secondary data have been collected to conduct this study. The
survey was conducted in 10 districts of Bangladesh. The primary data were
collected from 5 respondent bases that included distributors, dealers, retailers,
institutional buyers and individual buyers. The sample size was 555. The quota
sampling technique was used in this research. At the first, researchers developed
the quotas of population elements i.e., respondent bases and in the second stage,
respondents were selected on the basis of judgment. Structured questionnaire
were used in tapping the information which was designed in the light of the
objectives of the study according to the level of channel members.
The secondary data sourced from various published materials especially from
books, journals, Internet, and seminar proceedings as well as some working
papers. An extensive review of literatures helped to make coherent picture on the
topic of the study.
Data have been processed and tabulated by using sophisticated statistical package
used in social science then an effort has been taken to summarize the data in the

88 D.U. Journal of Marketing, Vol. 16, No. 1, June 2013
table by calculating simple percentage. Final analysis has been made on the
relevant statistic like rank order.
At present Holcim, Shah, Heidelberg, Premier, Crown, 7 Rings, King Brand,
Lafarge Surma, Akiz, Cemex, Fresh, Mir, Tiger, Anwar, Metrocem, Elephant,
and Seven Horse are the brands of cement mostly operating in Bangladesh.
Manufacturers taken for this study have almost similar distribution network of
channel members. Due to the privacy policy of the study, the name of the brands
has not been disclosed. Different brands are denoted here as Brand A, B, C and
the like.
MAJOR FINDINGS
Findings of the conducted interviews are presented in accordance with the
sequence followed in questionnaire i.e. identification of the distribution channel
members across different levels of the distribution channel of cement in
Bangladesh; of the reasons behind preference of selling a particular brand of
cement by distributors, dealers and retailers; of the reasons behind distributors‟
discouragement as perceived by dealers and retailers; of the perceived reasons
behind dealers‟ discouragement stated by retailers; of the dealers‟ efforts to
induce retailers to sell specific brands; of the dealers‟ motive to push specific
brands to retailers and of the conflict among distribution channel members of
cement.
Cement’s Channel of Distribution
In Bangladesh, distribution channel of cement is mostly indirect and in some
cases direct. In case of indirect distribution channel, manufacturers use appointed
distributors. Distributors buy from manufacturers and sell to dealers and retailers.
Dealers generally buy from distributors but also buy from manufacturers directly.
Retailers buy generally from dealers. They also buy from distributors. Retailers
generally don‟t have any direct contact with manufacturers. On the other hand, in
case of direct distribution channel, institutional buyers buy directly from
manufacturers. Finally, individual house builders buy, in small scale, from
retailers.
The current distribution channel of cement is presented in Figure 1 which is
followed by the modes of operation of the channel as shown in Table 1 (See the
appendix).

Factors Considered In Business Buying Across Different Levels Of Distribution Channels 89
Figure 1: Distribution System of Cement
Source: Researchers Contribution
Channel Members’ Preferences for Different Brands of Cement
Unlike consumer buying, buying of channel members considers several rational
factors. As their prime buying motive is reselling, therefore, their buying
consideration is much more cost-benefit analysis oriented and less emotion
oriented. In this study, we identified preference of dealers and retailers.
Preference of dealers: Dealers usually go for dealership of cements on the basis
of their individual preference based on local demand. Several brands of cement
that are mostly preferred by dealers are shown in Table: 2 (See the appendix). In
terms of the 1st preference of most dealers, Brand-B Cement is found to take the
first position preferred by 9 dealers (20.4 %). It was followed by Brand-A 7
(16%) and Brand-D Cement 6 (13.6%). However, when all the brands are ranked
based on the first three preferences, Brand-A tops the list having been followed
by Brand-B, Brand-C, Brand-D and Brand-E, in order of performance. The
„Others‟ category includes Brand-M, Brand-N, Brand-O, Brand-P, Brand-Q, etc.
The study shows that the most preferred reason behind dealership of a specific
brand of cement is its high sales (high demand) as stated by 21 (60%) of the
dealers followed by high quality reported by 23% of the dealers. However, when
all the reasons are ranked based on the first three recalls the same order persists
among the reasons behind selling cement; i.e., high sales, high quality, high
commission rate, good brand image, etc. ( See the appendix: Table: 3)
In response to the question as to which brand brings about the most profit (per
bag) from selling to retailers, 9 (21.4%) dealers stated that Brand-B Cement is in
the first position which is followed by Brand-E Cement (12%), Brand-D (9.5%),
Brand-A (9.5%) and Brand-F (9.5%) follow suit . However, when all the

90 D.U. Journal of Marketing, Vol. 16, No. 1, June 2013
companies are ranked based on the first three profit yielding levels, Brand-B
Cement still tops the list having been succeeded by Brand-E, Brand-D, Brand-A,
and Brand-F (See the appendix: Table: 4).
Table 5 (See the appendix) presents a dismal picture which should not be ignored
to set things on the right track. This may be a worthwhile cause of concern for
many cement companies.
Preference of retailers. Retailers usually deal in cements of some 3 to 8 brands
of their individual preference. Several brands of cement that are mostly preferred
by retailers (See the appendix: Table: 6). In terms of the 1st preference of the
most retailers, Brand-B Cement is found to take the first position preferred by 36
retailers (17.4 %). It was followed by Brand-C 29 (14%) and Brand-A Cement 25
(12.1%). However, when all the brands are ranked based on the first three
preferences, Brand-B Cement tops the list having been succeeded by Brand-C,
Brand-A and Brand-H. In this respect the position of Brand-E is only 9th. The
„Others‟ category includes Brand-M, Brand-N, Brand-O, Brand-Q, Brand-P
brands, etc.
The first preferred reason behind retailing a specific brand of cement is its high
sales (high demand) as stated by 124 (70.9%) of the retailers followed by high
quality reported by 20.0% of the retailers shown in the Table 7 (See the
appendix). However, when all the reasons are ranked based on the first three
recalls the same order is maintained among the reasons behind selling cement;
i.e., high sales, high quality, quick delivery, good brand image, etc.
In response to the question as to which brand brings about the most profit (per
bag) from retailing, 28 (14.6%) retailers stated that Brand-B Cement is in the first
position which is followed by Brand-K Cement (12.5%) and Brand-A (7.8%) and
Brand-D (7.8%). However, when all the companies are ranked based on the first
three profit yielding levels, Brand-B Cement still tops the list having been
followed by Brand-K, Brand-A, Brand-C, Brand-F and Brand-D. In this respect
Brand-E is in the 9th position (See the appendix: Table 8).
The study shows that the dealers of which company are more aggressive (i.e., put
more effort) in pushing the products of their companies to the retailers shown in
Table: 9 (See the appendix). In terms of the top (1st) level effort, Brand-B, Brand-
A, Brand-I and Brand-K are more enthusiastic than Brand-E, Brand-C, King and
Brand-F. In this respect Brand-E is in the 5th position. The dealers of the
remaining competitors are much more lagging behind them. However, when all
three levels of effort are put together, the order remains almost same.
The driving forces are shown in the Table 10 (See the appendix) behind such
enthusiasm of dealers. In this matter „high profit‟ is found to be more effective
than all other factors. However, high quality of cement also plays a prominent
role.

Factors Considered In Business Buying Across Different Levels Of Distribution Channels 91
Table 11 (See the appendix) presents a dismal picture which should not be
ignored to set things on the right track. This may be a worthwhile cause of
concern for the management of cement companies.
The key reason as perceived by retailers is low availability of Brand-E cement to
the concerned distributor(s). Table 12 (See the appendix) presents a dismal
picture which should not be ignored to set things on the right track. This may be
worthwhile causes of concern for the management of cement companies.
Channel Conflict
Distribution channel members of cement very often engage in conflicting
situations due to their conflict of interest. The identified areas of conflicts among
them are worthy to mention.
Conflict of retailers with companies: The areas of conflict between the retailers
on the one side and companies on the other are demonstrated in the table: 13 (See
the appendix). It is observed that the most common complaint is about delay in
delivery. Direct selling to corporate clients and low commission rate are also
important areas of complaint.
The Table 14 (See the appendix) also resonate the same complaint about which
the companies need to pay heed. Timely supply of cement to retailers and prompt
payment of retailer commission are important areas for improvement. Direct
selling should be as less as possible.
Conflict of retailers with dealers: The areas of dealer-retailer conflict are
shown in the Table: 15 (See the appendix). The common complaints are non-
availability of dealers at the time of need, charging of uneven prices and
application of force for making payment.
Conflict of retailers with distributors: The complaints of retailers against the
distributors which are more or less the same as with dealers are demonstrated in
the Table: 16 (See the appendix).
Conflict among retailers: The main reason behind the conflicts among retailers
is the variation of price of cement from retailer to retailer, which should be
another area needing company‟s attention. Such price variation should be as less
as possible (See the appendix: Table: 17).
Conflict of dealers with companies: The areas of conflict between the dealers
on the one side and companies on the other are shown in the Table: 18 (See the
appendix). It is observed that the most common complaint is about delay in
delivery. Direct selling to corporate clients and low commission rate are also
important areas of complaint.
The study also resonate the same complaints about which the companies need to
pay heed. Timely supply of cement to dealers, prompt payment of dealer
commission and informing the qualities of cement are important areas for

92 D.U. Journal of Marketing, Vol. 16, No. 1, June 2013
improvement. Direct selling should be as less as possible. (See the appendix:
Table: 19)
The complaints of dealers against the distributors are shown in the table: 20 (See
the appendix) in which the major reason is stated as direct selling to retailers
followed by unavailability and higher price charged.
The main reason behind the conflicts among the dealers is the variation of price
of cement from dealer to dealer, which should be another area needing
company‟s attention. Such price variation should be as less as possible (See the
appendix: Table: 21).
Business Buying of Institutional Buyers (IBs) and Individual House Builders
(IHBs)
According to the study, institutional buyers and individual buyers also are
channel members of cement apart from distributors, dealers and retailers. The
study identified that IBs e.g. government, defense, real estates, developers,
commercial organizations, contractors and so on buy generally directly from
manufacturers due to their large volume of buying. On the other hand, IHBs
generally do not buy directly from manufacturers due to their small scale buying.
Buying of individual house builders (IHBs): In case of selection of retailers by
IHBs, proximity is observed to be in the first position as cited by 77 of the 152
IHBs among whom 72 (59%) cited it to be the „first‟ consideration (recall),
which is followed by quick delivery (11.5%) and large stock (5.7%) (See the
appendix: Table: 22). However, when all the factors are ranked based on the first
two recalls, proximity is observed to be on top of the list succeeded by quick
delivery. The „Others‟ category includes mainly familiar retailers, good
relationship, quick delivery and large stock.
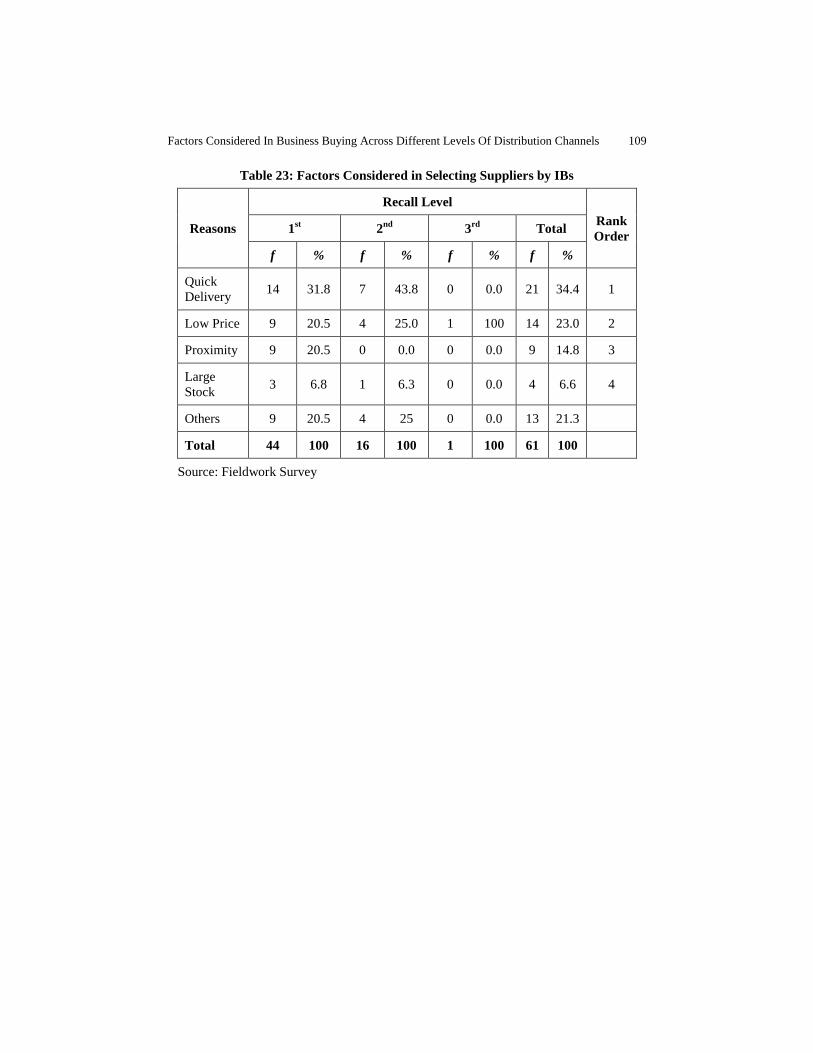
Buying of individual buyers (IBs): In case of selection of suppliers by IBs,
quick delivery is observed to be in the first position as cited by 31.8% of IBs,
which is followed by low price (20.5%), proximity (20.5%), large stock (6.8%)
(See the appendix: Table: 23). However, when all the factors are ranked based on
the first three recalls, quick delivery still is observed to be on top of the list
followed by low price and proximity.
RECOMMENDATIONS
The identification of different channel members and different factors considered
in business buying of channel members in cement industry is helpful for
distribution professionals and practitioners in a number of ways.
First, it helps to identify economic and noneconomic factors of business buying
of distribution channel members under different circumstances in case of cement
industry particularly in Bangladesh. As mentioned by the findings of the study,
some factors in terms of high demand, high quality, high commission rate,
Factors Considered In Business Buying Across Different Levels Of Distribution Channels 93
rational, competitive and reasonable price, good brand-Image, delivery as per
scheduled time, quick delivery, transportation facility and credit time,
availability, good and effective communication are important economic and non-
economic factors considered while buying cement in the context of Bangladesh.
Second, it can aid practitioners in looking for underlying reasons behind their
business buying.
Third, it can help them to design strategies to check and balance the feasibility of
their purchase by determining the optimum level.
Effective distribution depends on how channel members are organized across the
particular channel and play their expected role. Organized performance of
distribution channel members is prerequisite for distribution success. In this
study existing distribution routes of cement can be effectively used if the channel
members (manufacturers, wholesalers, retailers, dealers and distributors) play
their due and expected roles and each distribution partner considers the buying
factors of his buyers. As found from the study, dealers prefer high sales, high
quality, high commission rate, good brand image etc. As dealers directly buy
from distributors and sometimes from manufacturers, distribution arrangement
should be based on agreed upon terms and conditions so that conflicts between
manufacturers, distributors and dealers would not arise. Distributors and
manufacturers should pay attention to these factors. Again, retailers prefer high
sales, high quality, quick delivery, good brand image etc. that are almost similar
with factors preferred by dealers.
As retailers‟ most common complaints found from the study are delayed
delivery, direct selling to corporate clients and low commission rate. Therefore,
dealers and distributors who deal with retailers should pay attention to these
factors. Again, common conflicts of dealers with distributors are charging of
unequal prices and application of force for making payment that should be dealt
with proper action.
Manufacturers, their appointed distributors and dealers should strictly handle
these issues for the sake of overall effectiveness of the distribution network of
cement.
CONCLUSION
This study addresses the factors that business buyers consider while buying
cement and in order to address factors, objectives have been set to identify the
distribution channel members across different levels of the distribution channel
of cement, to explore the reasons behind preference of selling a particular brand
of cement by distributors, dealers and retailers, to discover the reasons behind
distributors‟ discouragement as perceived by dealers and retailers, to explore the
reasons behind dealers‟ discouragement stated by retailers, to know the dealers‟
efforts to induce retailers to sell specific brands, to know dealers‟ motive to push

94 D.U. Journal of Marketing, Vol. 16, No. 1, June 2013
specific brands to retailers, to identify conflict among distribution channel
members of cement and to draw some recommendations.
All these objectives have been achieved in the context of cement industry of
Bangladesh. By following a systematic literature review and conducting survey
on operating companies and their distribution channel members, this study
attempts to achieve these objectives.
This study is, to our knowledge, the first comprehensive review of the factors
bringing together evidence from the fields of purchasing and supply management
and marketing management. The findings of this study may be useful for
marketers as well as distribution and supply chain specialists for formulating
strategies.
Further research on distribution channel members operating across vertical and
horizontal level can be pursued as an extension of this study.
REFERENCES
Arntzen, B. C., Brown, G. G., Harrison, T. P. and Trafton, L. (1995). “Global Supply
Chain Management at Digital Equipment Corporation”, Interfaces, Vol. 25, No. 1
pp.69-93.
Austin, R. D. and Nolan, R. L. (1999). “How to Manage ERP Initiatives”, Harvard
Business School, Cambridge, MA.
Ballaou, H. R. and Srivastava, K. S. (2007). “Business Logistics/Supply Chain
Management”, 5th
edition, Pearson, USA.
Baritz, G. S. and Zissman, L. (1983). “Researching Customer Service: The Right Way”,
Proceedings of the National Council of Physical Distribution Management, Vol. 2
(New Orleans), LA, pp.608-619.
Bovet, D. and Martha, J. (2003). “Supply Chain Hidden Profits”, Mercer Management
consulting, Visit <www.valuenets.com/bookAnSf Preint.pdf>, Retrieved on
August 8, 2013).
Brandes, H. (1994). “Strategic Changes in Purchasing: Two Main Tracks”, European
Journal of ________________
Cavinato, J. L. (1999). “Fitting Purchasing to the Five Stages of Strategic Management”,
European Journal of Purchasing and Supply Management, Vol. 5, pp.75-83.
Chan, F. T. S. (2003). “Performance Measurement in a Supply Chain”, International
Journal of Advanced Manufacturing Technology, Vol. 21, pp.534-48.
Chisnall, P. M. (1985). “Strategic Industrial Marketing”, Prentice- Hall International,
London.
Chopra, S. and Meindl, P. (2007). “Supply Chain Management: Strategy, Planning and
Operation”, Social Sciences Literature Publishing House, Beijing, p.26.
Christopher, M. G., Mckinnin, A., Sharp, J., Wilding, R., Prck, H., Chapman, P., Juttner,
U. and Bolumole, V. (2002). “Supply Chain Vulnerability”, Report for the
Department of Transport, Local Government and the Regions, Cranfield
University, Cranfield.
Das, T. and Teng, B. S. (1998). “Between Trust and Control: Developing Confidence in
Partner Cooperation in Alliances”. The Academy of Management Review, Vol. 23,
No. 3, pp.491-512.

Factors Considered In Business Buying Across Different Levels Of Distribution Channels 95
Das, T. and Teng, B. S. (2003). “Partner Analysis and Alliance Performance”,
Scandinavian Journal of Management, Vol. 19, No. 3, pp.279-308.
Davis, W. H. and Drumm, H. W. (2001). “Logistics Costs and Service 2001”, Annual
Conference Proceedings, (Kansas City, MO: Council of Logistics Management)
Faces, W., Knight, L. and Matthyssens, P. (2001). “Buyer Profiles: An Empirical
Investigation of Changing Organizational Requirements”, European Journal of
Purchasing and Supply Management, Vol. 7, No. 3, pp.197-208.
Fawcett, E. S. and Magan M. G. (2002). “The Rhetoric and Reality of Supply Chain
Integration”, International Journal of Physical Distribution & Logistics
Management, Vol. 32, No. 5, pp. 339-361
Ferguson, B. (2000). “Implementing Supply Chain Management”, Production &
Inventory Management Journal, Vol. 41, pp.64-67.
Gadde, L. E. and Hakansson, H. (1994). “The Changing Role of Purchasing:
Reconsidering Three Strategic Issues”, European Journal of Purchasing and
Supply Management, Vol. 1, No. 1, pp.27-35.
Gulati, R. and Singh, H. (1998). “The Architecture of Cooperation: Managing
Coordination Costs and Appropriation Concerns in Strategic Alliance”,
Administrative Science Quarterly, Vol. 43, No. 4, pp.718-814.
Hakansson, H. and Snehota, I. (1995). “Developing Relationships in Business Networks”,
Routledge, London.
Hakansson, H. and Ford, D. (2002). “How Should Companies Interact in Business
Environments”, Journal of Business Research, Vol. 55, pp.133-139.
Handfield B. R. and Nichols Jr. L. E. (1999). “Introduction to Supply Chain
Management”, Upper Saddle River, NJ: Prentice-Hall, p.2
Holcim (2009). Cement Industry of Bangladesh, Retrieved on November 20, 2009 from
<http:/www.Brand-A.com.bd/>
Hurt, M. D. and Speh, T. W. (1998). “Business Marketing Management: A Strategic
View of Industrial and Organizational Markets”, 6th
edition, The Dryden Press,
Orlando, FL.
Innis, E. D. and LaLonde, J. B. (1994). “Customer Service: The Key to Customer
Satisfaction, Customer Loyalty, and Market Share”, Journal of Business Logistics,
Vol. 15, No. 1, pp.1-27.
Jackson, W. D., Keith, E. J. and Burdick, K. R. (1986). “Examining the Relative
Importance of Physical Distribution Service Elements”, Journal of Business
Logistics, Vol. 7, No. 2, pp.14-32.
Kotler, P. and Armstrong, G. (2010). “Principles of Marketing”, 13th
edition, Prentice
Hall, NY.
LaLonde and Zinszer (1994). “Customer Service: Meaning and Measurement”, Prentice
Hall.
Lambert, M. D. and Harrington, C. T. (1989). “Establishing Customer Service Strategies
within the Marketing Mix: More Empirical Evidence,” Journal of Business
Logistics, Vol. 10, No. 2, p.50.
Lamming, R. C., Caldwell, N. D., Harrison, D. A. and Phillips, W. (2001). “Transparency
in Supply Relationship: Concept and Practice”, Journal of Supply Chain
Management, Vol. 37, No. 4, p.4.
Lee, H. L. and Billington, C. (1995). “The Evolution of Supply Chain Management
Models and Practice at Hewlett Packard”, Interfaces, Vol. 25, No. 1, pp.42-63.

96 D.U. Journal of Marketing, Vol. 16, No. 1, June 2013
Lee, H. L., Padmanabhan, V. and Whang, S. (1997). “The Bullship Effect in Supply
Chains”, Sloan Management Review, Vol. 38 No. 3, pp.93-102.
Malhotra, K. N. (2007), “Marketing Research– An Applied Orientation”, 5th
edition,
Prentice-Hall Inc., NJ.
Marr, E. N., (1994). “Do Managers Really Know What Service Their Customers
Require?” International Journal of Physical Distribution & Logistics
Management’, Vol. 24 No. 4, pp.24 -31.
McAfee, A. P. (1998). “The Impact of Information Technology on Operational
Effectiveness: An Empirical Investigation”, Working paper, Harvard Business
School, Cambridge, MA.
Mentzer, T. J., DeWitt, W., Keebler,S. J., Min, N., Nix, W. N., Smith, D. C. and
Zacharia, G. Z. (2001). “Defining Supply Chain Management”, Journal of
Business Logistics, Volume. 22, No. 2, pp.1-25
Pfeffer, J. and Salancik, G. R. (1978). “The External Control of Organizations: A
Resource Dependence Perspective”, New York: Harper and Row, Purchasing and
Supply Management, Vol. 1 No. 2, pp.77-78.
Ring, P. and Ven de Ven, A. (1992). “Structuring Cooperative Relationships between
Organizations”, Strategic Management Journal, Vol. 13 No. 7, pp.483-498.
Sterling, U. J. and Lambert, M. D. (1989). “Customer Service Research: Past, Present,
and Future”, International Journal of Physical Distribution & Materials
Management, Vol. 19 No. 2, p.17.
Svensson, G. (2004). “Key Areas, Causes and Contingency Planning of Corporate
Vulnerability in Supply Chains. A Qualitative Approach”, International Journal of
Physical Distribution & Logistics Management, Vol. 34 No. 9, pp.728-48.
The Daily Star (2010). “Distribution Channels of the Cement Companies”, Dhaka,
Bangladesh.
Yuva, J. (2002). “Collaborative Logistics: Building a United Network”, Inside Supply
Management, Volume. 13, No. 5, p.50
Zacharia, G. Z. (2001). “Defining Supply Chain Management”, Journal of Business
Logistics, Volume. 22, No. 2, pp.1-25

Factors Considered In Business Buying Across Different Levels Of Distribution Channels 97
APPENDIX
Table 1: Modes of Operation of the Cement’s Distribution channel
Sl. Channel Flow Specification of
Expenses Expense Bearing Entity
1. Cement
manufacturer
to Institutional
Buyers
Transportation Cost Cement manufacturer
Loading and
unloading cost
Cement manufacturer
2. Cement
manufacturer to
Distributors
Transportation Cost Distributors/ Hired transportation
agency
Loading Cement manufacturer
Unloading Distributors/ Transporter
3. Distributors to
Dealer
Transportation Cost Distributors/ Dealers/ Hired
transportation agency
Loading cost Cement manufacturer
Unloading cost Distributors/ Dealers/Hired
transportation agency
4. Distributors to
Retailers
Transportation Cost Distributors
Loading cost Cement manufacturer/ Distributors
Unloading cost Distributors
5. Cement
manufacturer
to Dealers
Transportation Dealers/ Hired transportation agency
Loading cost Cement manufacturer
Unloading cost Dealers/ Transporter
6. Dealers to
Retailers
Transportation Dealers/ Hired transportation agency
Loading cost Cement manufacturer
Unloading cost Dealers/ Hired transportation agency
7. Dealers to End-
user
Transportation Dealers
Loading cost Cement manufacturer
Unloading cost Dealers
Source: Fieldwork Survey

98 D.U. Journal of Marketing, Vol. 16, No. 1, June 2013
Table 2: Highly Preferred Brands by Dealers
Brands
Preference
Rank
Order 1st 2nd 3rd Total
f % f % f % f %
Brand-A 7 16.3 4 13.8 2 9.1 13 13.7 1
Brand-B 9 20.9 1 3.4 1 4.5 11 11.6 2
Brand-C 4 9.3 5 17.2 1 4.5 10 10.5 3
Brand-D 6 14.0 1 3.4 2 9.1 9 9.5 4
Brand-E 5 11.6 2 6.9 1 4.5 8 8.4 5
Brand-F 3 7.0 3 10.3 2 9.1 8 8.4 5
Brand-G 2 4.7 3 10.3 1 4.5 6 6.3 7
Brand-H 2 4.7 0 0.0 3 13.6 5 5.3 8
Brand-I 1 2.3 2 6.9 2 9.1 5 5.3 8
Brand-J 1 2.3 2 6.9 0 0.0 3 3.2 10
Others 3 7.0 6 20.7 7 31.8 17 17.9
Total 43 100 29 100 22 100 95 100
Source: Fieldwork Survey
Table 3: Reasons behind Selling Particular Cement Brands by Dealers
Reasons
Recall Level Rank
Order 1st 2nd 3rd Total
f % f % f % f %
High Sales 21 60.0 4 26.7 0 0.0 25 48.1 1
High Quality 8 22.9 7 46.7 0 0.0 15 28.8 2
High Commission
Rate
2 5.7 1 6.7 1 50.0 4 7.7 3
Good Brand-Image 2 5.7 1 6.7 1 50.0 4 7.7 3
Quick Delivery 2 5.7 0 0.0 0 0.0 2 3.8 5
Transportation
Facility
0 0.0 1 6.7 0 0.0 1 1.9 6
Credit Time 0 0.0 1 6.7 0 0.0 1 1.9 6
Total 35 100 15 100 2 100 52 100
Source: Fieldwork Survey

Factors Considered In Business Buying Across Different Levels Of Distribution Channels 99
Table 4: Most Profit Yielding Brands to Dealers
Brand
Name
Profit Yielding Levels
Rank
Order 1st 2nd 3rd Total
f % f % f % f %
Brand-B 9 21.4 1 6.7 1 20.0 11 17.7 1
Brand-E 5 12.0 2 13.3 1 20.0 8 12.9 2
Brand-D 4 9.5 3 20.0 0 0.0 7 11.3 3
Brand-A 4 9.5 1 6.7 1 20.0 6 9.7 4
Brand-F 4 9.5 0 0.0 1 20.0 5 8.1 5
Brand-H 3 7.1 2 13.3 0 0.0 5 8.1 5
Brand-K 3 7.1 0 0.0 0 0.0 3 4.8 7
Brand-C 1 2.4 1 6.7 0 0.0 2 3.2 8
Brand-I 0 0.0 2 13.3 0 0.0 2 3.2 8
Brand-G 2 4.8 0 0.0 0 0.0 2 3.2 8
Others 7 16.7 3 20.0 1 20.0 11 17.7
Total 42 100 15 100 5 100 62 100
Source: Fieldwork Survey
Table 5: Reasons behind Distributors' Discouragement as perceived by Dealers
Reasons
Recall Level
Rank
Order 1st 2nd Total
f % f % f %
Low Profit 2 25.0 0 0.0 2 22.0 1
Poor Transportation
Facility 1 12.5 0 0.0 1 11.0 2
Low Availability 0 0.0 1 100 1 11.0 2
Others 5 62.5 0 0.0 5 56.0
Total 8 100 1 100 9 100
Source: Fieldwork Survey

100 D.U. Journal of Marketing, Vol. 16, No. 1, June 2013
Table 6: Preference for Various Cement Brands by Retailers
Brands
Preference
Rank
Order 1
st 2
nd 3
rd Total
f % f % f % f %
Brand-B 36 17.4 32 16.1 21 12.2 89 15.3 1
Brand-C 29 14.0 37 18.6 16 9.3 82 14.0 2
Brand-A 25 12.1 24 12.1 14 8.1 63 10.8 3
Brand-H 14 6.8 19 9.5 19 11.0 52 9.1 4
Brand-K 21 10.1 16 8.0 12 7.0 49 8.4 5
Brand-I 12 5.8 7 3.5 13 7.6 32 5.6 6
Brand-F 9 4.3 11 5.5 12 7.0 32 5.6 6
Brand-G 15 7.2 7 3.5 7 4.1 29 4.9 8
Brand-E 12 5.8 6 3.0 8 4.7 26 4.5 9
Brand-J 4 1.9 11 5.5 9 5.2 24 4.2 10
Brand-D 8 3.9 5 2.5 7 4.1 20 3.5 11
Others 22 10.6 24 12.1 34 14.7 80 14.1
Total 207 100 199 100 172 100 578 100
Source: Fieldwork Survey
Table 7: Reasons behind Selling Particular Brands by Retailers
Reasons
Recall Level
Rank
Order 1
st 2
nd 3
rd Total
f % f % f % f %
High Sales 124 70.9 30 29.4 1 5.0 155 52.2 1
High Quality 35 20.0 35 34.3 8 40.0 78 26.3 2
Quick Delivery 4 2.3 11 10.8 2 10.0 17 5.7 3
Good Brand-
Image 5 2.9 7 6.9 4 20.0 16 5.4 4
High
Commission 3 1.7 9 8.8 2 10.0 14 4.7 5

Factors Considered In Business Buying Across Different Levels Of Distribution Channels 101
Reasons
Recall Level
Rank
Order 1
st 2
nd 3
rd Total
f % f % f % f %
Rate
Credit Time 4 2.3 5 4.9 1 5.0 10 3.3 6
Transportation
Facility 0 0.0 5 4.9 2 10.0 7 2.4 7
Total 175 100 102 100 20 100 297 100
Source: Fieldwork Survey
Table 8: Most Profit Yielding Brands to Retailers
Brands
Profit Yielding Levels
Rank
Order 1
st 2
nd 3
rd Total
F % f % f % f %
Brand-B 28 14.6 21 22.3 10 24.4 59 18.0 1
Brand-K 24 12.5 5 5.3 2 4.9 31 9.5 2
Brand-A 15 7.8 5 5.3 5 12.2 25 7.6 3
Brand-C 9 4.7 11 11.7 4 9.8 24 7.3 4
Brand-F 12 6.3 10 10.6 1 2.4 23 7.0 5
Brand-D 15 7.8 3 3.2 4 9.8 22 6.7 6
Brand-G 11 5.7 4 4.3 5 12.2 20 6.1 7
Brand-I 10 5.2 7 7.4 2 4.9 19 5.8 8
Brand-E 9 4.7 6 6.4 3 7.3 18 5.5 9
Brand-H 7 3.6 8 8.5 2 4.9 17 5.2 10
Brand-J 3 1.6 4 4.3 0 0.0 7 2.1 11
Others 49 25.5 10 10.6 3 7.3 62 19.0
Total 192 100 94 100 41 100 327 100
Source: Fieldwork Survey

102 D.U. Journal of Marketing, Vol. 16, No. 1, June 2013
Table 9: Dealers’ Efforts to Induce Retailers to Sell Specific Brands
Brands
Recall Level
Rank
Order 1
st 2
nd 3
rd Total
f % f % f % f %
Brand-B 31 18.1 28 22.8 11 12.8 70 18.4 1
Brand-I 18 10.5 13 10.6 13 15.1 44 11.6 2
Brand-A 24 14.0 8 6.5 8 9.3 40 10.5 3
Brand-C 10 5.9 15 12.2 12 14.0 37 9.7 4
Brand-H 7 4.1 14 11.4 10 11.5 31 8.2 5
Brand-F 9 5.3 8 6.5 7 8.1 24 6.3 6
Brand-K 15 8.8 7 5.6 1 1.2 23 6.0 7
Brand-E 11 6.4 4 3.3 5 5.8 20 5.3 8
Brand-G 10 5.9 5 4.1 3 3.5 18 4.7 9
Brand-D 7 4.1 9 7.3 1 1.2 17 4.5 10
Brand-J 3 1.8 5 4.1 3 3.5 11 3.0 11
Brand-L 2 1.1 0 0.0 1 1.2 3 1.0 12
Others 24 14.0 7 5.6 11 12.8 42 11.0
Total 171 100 123 100 86 100 380 100
Source: Fieldwork Survey

Factors Considered In Business Buying Across Different Levels Of Distribution Channels 103
Table 10: Dealers' Motive to Push Specific Brands to Retailers
Reasons
Motivation Level
Rank
Order 1
st 2
nd 3
rd Total
f % f % f % f %
High Profit 64 46.4 5 10.4 1 11.1 70 35.9 1
High Quality 49 35.5 7 14.6 1 11.1 57 29.2 2
Available 5 3.6 22 45.8 5 55.5 32 16.4 3
High
Commission
Rate
7 5.1 6 12.5 1 11.1 14 7.2 4
Transportation
Facility 4 2.9 5 10.4 0 0.0 9 4.6 5
Others 9 6.5 3 6.3 1 11.1 13 6.7
Total 138 100 48 100 9 100 195 100
Source: Fieldwork Survey
Table 11: Perceived Reasons behind Dealers' Discouragement Stated by Retailers
Reasons
Recall Level
Rank
Order 1
st 2
nd 3
rd Total
f % f % f % f %
low
Availability 34 59.6 1 12.5 1 100.0
36 54.5 1
low Profit 6 10.5 0 0.0 0 0.0 6 9.1 2
Others 17 29.9 7 87.5 0 0.0 24 35.3
Total 57 100 8 100 1 100 66 100
Source: Fieldwork Survey

104 D.U. Journal of Marketing, Vol. 16, No. 1, June 2013
Table 12: Perceived Reasons behind Distributors' Discouragement Stated by
Retailers
Reasons
Recall Level
Rank
Order 1
st 2
nd 3
rd Total
f % f % f % f %
Unavailability 19 44.2 1 33.3 1 100.0 21 44.7 1
Low Profit 10 23.3 0 0.0 0 0.0 10 21.3 2
Low Transportation
Facility 0 0.0 2 66.7 0 0.0
2 4.3 3
Low Commission
Rate 1 2.3 0 0.0 0 0.0
1 2.1 4
Others 13 30.2 0 0.0 0 0.0 13 27.6
Total 43 100 3 100 1 100 47 100
Source: Fieldwork Survey
Table 13: Conflict of Retailers with Cement Companies
Reasons
Recall Level Rank
Order 1
st 2
nd 3
rd Total
f % f % f % f %
Delay in Delivery 31 39.7 13 54.
2 0 0.0 44 41.5 1
Direct Selling to
Corporate Clients 18 23.1 0 0.0 0 0.0 18 17.0 2
Low Commission Rate 10 12.8 2 8.3 0 0.0 12 11.3 3
Delay Payment of
Commission 3 3.8 3
12.
5 1 25.0 7 6.6 4
Forced Decision 5 6.4 0 0.0 0 0.0 5 4.7 5
Others 11 14.1 6 25.
0 3 75.0 20 18.9
Total 78 100 24 100 4 100 106 100
Source: Fieldwork Survey

Factors Considered In Business Buying Across Different Levels Of Distribution Channels 105
Table 14: Retailers’ Expected Service from Cement Companies
Services
Recall Level
Rank
Order 1
st 2
nd 3
rd Total
f % f % f % f %
Timely Cement
Supply 61 46.9 15 34.1 1 11.1 77 42.1 1
Not to Sell Directly
to Other Customers
(Corporate Clients)
23 17.7 9 20.5 1 11.1 33 18.0 2
Timely Payment of
Commission 21 16.2 3 6.8 3 33.3 27 14.7 3
Inform the Qualities
of Cement 6 4.6 2 4.5 2 22.2 10 5.5 4
Not to Force 2 1.5 2 4.5 0 0.0 4 2.2 5
Others 17 13.1 13 29.5 2 22.2 32 17.5
Total 130 100 44 100 9 100 183 100
Source: Fieldwork Survey
Table15: Conflict of Retailers with Dealers
Reasons
Recall Level
Rank
Order 1
st 2
nd 3
rd Total
f % f % f % f %
Unavailable When
Required 24 40.0 3 37.5 0 0.0 27 37.5 1
Force For Payment 8 13.3 1 12.5 2 50.0 11 15.3 2
Higher Price
Charged than Other
Dealers
10 16.7 1 12.5 0 0.0 11 15.3 2
Poor Transportation
Facility 0 0.0 1 12.5 0 0.0 1 1.4 4
Others 18 30.0 2 25.0 2 50.0 22 30.5
Total 60 100 8 100 4 100 72 100
Source: Fieldwork Survey

106 D.U. Journal of Marketing, Vol. 16, No. 1, June 2013
Table 16: Conflict of Retailers with Distributors
Reasons
Recall Level
Rank
Order 1
st 2
nd Total
f % f % f %
Higher Price Charged 8 42.1 1 20.0 9 37.5 1
Unavailable when Required 7 36.8 1 20.0 8 33.3 2
Force for Payment 1 5.3 3 60.0 4 16.7 3
Others 3 15.8 0 0.0 3 12.5
Total 19 100 5 100 24 100
Source: Fieldwork Survey
Table17: Conflict among Retailers
Causes f %
Price Variation 74 81.3
Others 17 18.7
Total 91 100.0
Source: Fieldwork Survey
Table18: Reasons behind Problem with Companies
Reasons
Recall Level
Rank
Order 1
st 2
nd Total
f % f % f %
Delay in Delivery 13 43.3 1 9.0 14 34.1 1
Direct Selling to
Corporate Clients 5 16.7 1 9.0 6 14.6 2
Low Commission Rate 0 0.0 4 36.0 4 9.8 3
Forced Decision 3 10.0 0 0.0 3 7.3 4
Presence of More than
One Dealer or Retailer 3 10.0 0 0.0 3 7.3 4

Factors Considered In Business Buying Across Different Levels Of Distribution Channels 107
Reasons
Recall Level
Rank
Order 1
st 2
nd Total
f % f % f %
Delay Payment of
Commission 1 3.0 0 0.0 1 2.4 6
Others 5 16.7 5 46.0 10 24.4
Total 30 100 11 100 41 100
Source: Fieldwork Survey
Table 19: Stated by Dealers Expected Service from Cement Companies
Services
Recall Level Rank
Orde
r
1st 2
nd 3
rd Total
f % f % f % f %
Timely Cement Supply 9 26.5 12 71.0 0 0.0 21 37.5 1
Timely Payment of
Commission 8 23.5 1 6.0 0 0.0 9 16.1 2
To Inform the Qualities
of Cement 5 14.7 2 12.0 2 40.0 9 16.1 2
Not to Sell Directly to
Other Customers
(Corporate Clients) in
Your Locality
7 20.6 0 0.0 0 0.0 7 12.5 4
Others 5 14.7 2 12.0 3 60.0 10 17.9
Total 34 100 17 100 5 100 56 100
Source: Fieldwork Survey

108 D.U. Journal of Marketing, Vol. 16, No. 1, June 2013
Table 20: Reasons behind Conflict with Distributors Stated by Dealers
Reasons
Recall Level
Rank
Order 1
st 2
nd Total
f % f % f %
Direct Sell to Retailers 3 30.0
3 25.0 1
Unavailable When
Required 2 20.0
2 16.7 2
Higher Price Charged
1 50.0 1 8.3 3
Others 5 50.0 1 50.0 6 50.0
Total 10 100 2 100 12 100
Source: Fieldwork Survey
Table 21: Conflict among Dealers Stated by Dealers
Reasons f %
Price Variation 16 36.4
System 28 63.6
Total 44 100
Source: Fieldwork Survey
Table 22: Factors behind Selection of Retailers by Individual House Builders
Reasons
Recall Level
Rank
Order 1
st 2
nd Total
f % f % f %
Proximity 72 59.0 5 12.0 77 46.7 1
Quick Delivery 14 11.5 16 37.0 30 18.2 2
Large Stock 7 5.7 4 9.0 11 6.7 3
Others 29 23.8 18 42.0 47 28.4
Total 122 100 43 100 165 100
Source: Fieldwork Survey
Factors Considered In Business Buying Across Different Levels Of Distribution Channels 109
Table 23: Factors Considered in Selecting Suppliers by IBs
Reasons
Recall Level
Rank
Order 1
st 2
nd 3
rd Total
f % f % f % f %
Quick
Delivery 14 31.8 7 43.8 0 0.0 21 34.4 1
Low Price 9 20.5 4 25.0 1 100 14 23.0 2
Proximity 9 20.5 0 0.0 0 0.0 9 14.8 3
Large
Stock 3 6.8 1 6.3 0 0.0 4 6.6 4
Others 9 20.5 4 25 0 0.0 13 21.3
Total 44 100 16 100 1 100 61 100
Source: Fieldwork Survey


