
2016
HOW DOES YOUR STATE COMPARE?&FACTS FIGURES

In 1941, we introduced our first edition of Facts & Figures. “There is need for concise and accurate data,” we wrote. “Facts give a broader perspective; facts dissipate predilections and prejudices. . . [and] this collection of data is an important step to meet the challenge presented by the broad problems of public finance.”
Facts & Figures 2016: How Does Your State Compare? builds on these seven decades of tradition. Mailed to every state legislator and governor, this handbook is designed to be a pocket- and purse-sized guide to state rankings on tax rates, collections, burdens, and more.
Theses tables were compiled by Tax Foundation staff and updated by Economist Nicole Kaeding. We hope these facts contribute to a healthy public debate.
Tax Foundation1325 G Street NW, Suite 950
Washington, DC 20005202.464.6200
TaxFoundation.org
© 2016 Tax Foundation. All rights reserved.Printed in the United States of America
ISBN: 978-1-942768-08-1
Scott A. Hodge PresidentTax Foundation
Joseph D. Henchman Vice President, State Projects Tax Foundation

Facts & Figures 2016 How Does Your State Compare?
Table of Contents
Number Title DateTaxes and Tax Measures
1 Tax Freedom Day by State 20152 State-Local Tax Burdens 20123 State Business Tax Climate Index 20164 State Tax Collections per Capita 20145 State Revenue per Capita 2013
6 State & Local Tax Collections per Capita 2013
7 State & Local Revenue per Capita 2013
8 Sources of State & Local Tax Collections 2013
9 Federal Aid as a Percentage of State General Revenue 2013
10 Federal Income Tax Payments by Income Percentile 2013
11 Federal Tax Rates 2016
Individual Income Taxes12 State Individual Income Tax Rates 2016
13 State Individual Income Tax Collections per Capita 2014
14 State & Local Individual Income Tax Collections per Capita 2013
Corporate Income Taxes 15 State Corporate Income Tax Rates 2016
16 State Corporate Income Tax Collections per Capita 2014
17 State and Local Corporate Income Tax Collections per Capita 2013
18 State Gross Receipts Taxes 2016
General Sales Taxes19 State & Local Sales Tax Rates 2016
20 State General Sales Tax Collections per Capita 2014
21 State & Local General Sales Tax Collections per Capita 2013
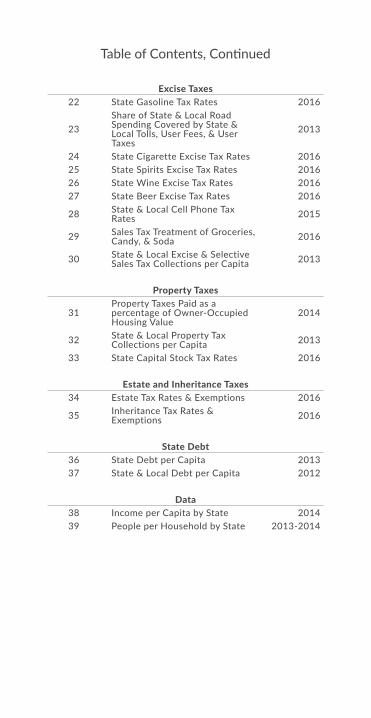
Table of Contents, Continued
Excise Taxes22 State Gasoline Tax Rates 2016
23Share of State & Local Road Spending Covered by State & Local Tolls, User Fees, & User Taxes
2013
24 State Cigarette Excise Tax Rates 201625 State Spirits Excise Tax Rates 201626 State Wine Excise Tax Rates 201627 State Beer Excise Tax Rates 2016
28 State & Local Cell Phone Tax Rates 2015
29 Sales Tax Treatment of Groceries, Candy, & Soda 2016
30 State & Local Excise & Selective Sales Tax Collections per Capita 2013
Property Taxes
31Property Taxes Paid as a percentage of Owner-Occupied Housing Value
2014
32 State & Local Property Tax Collections per Capita 2013
33 State Capital Stock Tax Rates 2016
Estate and Inheritance Taxes34 Estate Tax Rates & Exemptions 2016
35 Inheritance Tax Rates & Exemptions 2016
State Debt36 State Debt per Capita 201337 State & Local Debt per Capita 2012
Data38 Income per Capita by State 201439 People per Household by State 2013-2014

Table 1. Tax Freedom Day by State Calendar Year 2015
Taxes and Tax Measures
Note: Tax Freedom Day represents how long into the year Americans work before they have earned enough money to pay all federal, state, and local taxes for the year. New Tax Freedom Day data is released every spring at www.TaxFreedomDay.org. D.C.’s rank does not affect states’ ranks, but the figure in parentheses indicates where it would rank if included.
Source: Tax Freedom Day 2015, which is based on data from the Bureau of Economic Analysis.
StateTax Freedom
Day RankU.S. April 24Ala. April 9 4Alaska April 15 15Ariz. April 15 15Ark. April 14 10Calif. May 3 46Colo. April 25 36Conn. May 13 49Del. April 20 26Fla. April 20 26Ga. April 15 15Hawaii April 19 25Idaho April 14 10Ill. April 30 43Ind. April 18 24Iowa April 16 18Kans. April 21 31Ky. April 11 6La. April 2 1Maine April 14 10Md. May 5 47Mass. May 2 45Mich. April 20 26Minn. April 30 43Miss. April 4 2Mo. April 14 10
Mont. April 17 20Nebr. April 17 20Nev. April 20 26N.H. April 23 35N.J. May 13 49N.M. April 11 6N.Y. May 8 48N.C. April 16 18N.D. April 29 41Ohio April 17 20Okla. April 14 10Ore. April 22 32Pa. April 25 36R.I. April 26 39S.C. April 12 8S.D. April 8 3Tenn. April 9 4Texas April 17 20Utah April 20 26Vt. April 22 32Va. April 27 40Wash. April 29 41W.Va. April 13 9Wis. April 25 36Wyo. April 22 32D.C. April 23 (35)
StateTax Freedom
Day Rank

Taxes and Tax Measures
Table 2. State-Local Tax Burdens per Capita & as a Percentage of Income Fiscal Year 2012
State
State-Local Tax Burden as a Share
of State Income RankTotal Tax Burden
(per Capita)U.S. 9.9% $4,420Ala. 8.7% 37 $3,067Alaska 6.5% 50 $3,229Ariz. 8.8% 36 $3,276Ark. 10.1% 17 $3,519Calif. 11.0% 4 $5,237Colo. 8.9% 34 $4,304Conn. 12.6% 2 $7,869Del. 10.2% 13 $4,412Fla. 8.9% 34 $3,738Ga. 9.1% 32 $3,426Hawaii 10.2% 13 $4,576Idaho 9.3% 26 $3,318Ill. 11.0% 4 $5,235Ind. 9.5% 22 $3,585Iowa 9.2% 30 $4,037Kans. 9.5% 22 $4,131Ky. 9.5% 22 $3,298La. 7.6% 45 $2,950Maine 10.2% 13 $3,997Md. 10.9% 7 $5,920Mass. 10.3% 10 $5,872Mich. 9.4% 25 $3,631Minn. 10.8% 8 $5,185Miss. 8.6% 40 $2,742Mo. 9.3% 26 $3,591Mont. 8.7% 37 $3,389Nebr. 9.2% 30 $4,197Nev. 8.1% 43 $3,349N.H. 7.9% 44 $3,961N.J. 12.2% 3 $6,926N.M. 8.7% 37 $3,141N.Y. 12.7% 1 $6,993N.C. 9.8% 18 $3,659

Taxes and Tax Measures
Table 2, Continued. State-Local Tax Burdens per Capita & as a Percentage of Income Fiscal Year 2012
Note: Data for years 1977 to present are available at www.taxfoundation.org/burdens. Payments made to out-of-state governments are tallied in the taxpayer’s state of residence where possible. D.C.’s rank does not affect states’ ranks, but the figure in parentheses indicates where it would rank if included. See Table 39 for average people per household by state.
Source: Tax Foundation, State-Local Tax Burdens FY 2012.
N.D. 9.0% 33 $4,867Ohio 9.8% 18 $3,924Okla. 8.6% 40 $3,515Ore. 10.3% 10 $4,095Pa. 10.2% 13 $4,589R.I. 10.8% 8 $4,998S.C. 8.4% 42 $2,936S.D. 7.1% 48 $3,318Tenn. 7.3% 47 $2,805Texas 7.6% 45 $3,340Utah 9.6% 21 $3,556Vt. 10.3% 10 $4,557Va. 9.3% 26 $4,623Wash. 9.3% 26 $4,541W.Va. 9.8% 18 $3,331Wis. 11.0% 4 $4,734Wyo. 7.1% 48 $4,407D.C. 10.6% (10) $7,541
State
State-Local Tax Burden as a Share
of State Income RankTotal Tax Burden
(per Capita)

Taxes and Tax Measures
Table 3. 2016 State Business Tax Climate Index As of July 1, 2015
State
Overall Index Rank
Ranking on Five Component Taxes
Corp. Tax
Ind. Income
Tax Sales Tax
Unemp. Ins. Tax
Prop. Tax
Ala. 29 25 22 41 26 17Alaska 3 30 1 5 21 21Ariz. 24 22 19 49 9 6Ark. 38 42 29 43 43 27Calif. 48 35 50 40 13 13Colo. 18 15 16 44 33 12Conn. 44 33 36 29 20 49Del. 14 50 33 1 3 15Fla. 4 17 1 17 37 20Ga. 39 9 42 35 45 31Hawaii 31 10 37 14 39 14Idaho 19 24 23 33 14 4Ill. 23 36 10 11 34 45Ind. 8 20 11 24 10 5Iowa 40 49 32 32 46 40Kans. 22 40 18 9 41 19Ky. 28 29 30 9 28 23La. 37 38 27 50 47 28Maine 34 45 26 10 48 41Md. 41 19 45 8 29 42Mass. 25 39 13 18 12 46Mich. 13 11 15 7 18 26Minn. 47 46 46 36 2 30Miss. 20 13 21 28 42 35Mo. 17 3 28 23 31 8Mont. 6 23 20 3 7 9Nebr. 27 31 24 26 32 39Nev. 5 4 1 39 16 7N.H. 7 48 9 2 6 43N.J. 50 43 48 47 1 50N.M. 35 27 34 48 27 1N.Y. 49 12 49 42 49 47N.C. 15 7 14 31 35 32N.D. 26 14 35 22 16 3

Taxes and Tax Measures
Table 3, Continued. 2016 State Business Tax Climate Index As of July 1, 2015
Ohio 42 26 47 30 6 11Okla. 33 8 40 38 1 18Ore. 11 37 31 4 27 10Pa. 32 47 17 25 50 38R.I. 45 34 38 27 49 44S.C. 36 16 41 19 35 25S.D. 2 1 1 34 40 22Tenn. 16 18 8 46 25 37Texas 10 41 6 37 15 34Utah 9 5 12 16 19 2Vt. 46 44 44 15 17 48Va. 30 6 39 6 38 29Wash. 12 28 6 45 23 24W.Va. 21 21 25 21 22 16Wis. 43 32 43 13 36 33Wyo. 1 1 1 12 30 36D.C. (42) (36) (34) (40) (27) (39)
State
Overall Index Rank
Ranking on Five Component Taxes
Corp. Tax
Ind. Income
Tax Sales Tax
Unemp. Ins. Tax
Prop. Tax
Note: The State Business Tax Climate Index measures how each state’s tax laws affect economic performance. A rank of 1 means the state’s tax system is more favorable for business; a rank of 50 means the state’s tax system is less favorable for business. Component rankings do not average to the total. States without a given tax rank equally as number 1. D.C.’s ranks do not affect states’ ranks, but the figures in parentheses indicate where it would rank if included.
Source: Tax Foundation, 2016 State Business Tax Climate Index.

Taxes and Tax Measures
Table 4. State Tax Collections per Capita Fiscal Year 2014
Note: D.C. is included only in combined state and local data. See Table 39 for average people per household by state.
Source: Census Bureau; Tax Foundation calculations.
StateCollections per Capita Rank
U.S. $2,677Ala. $1,924 43Alaska $4,601 3Ariz. $1,973 42Ark. $3,021 15Calif. $3,594 10Colo. $2,230 38Conn. $4,501 4Del. $3,432 11Fla. $1,806 49Ga. $1,864 46Hawaii $4,283 5Idaho $2,277 37Ill. $3,040 14Ind. $2,564 26Iowa $2,675 22Kans. $2,534 28Ky. $2,524 30La. $2,095 40Maine $2,895 17Md. $3,189 13Mass. $3,762 9Mich. $2,505 31Minn. $4,267 6Miss. $2,532 29Mo. $1,860 47
Mont. $2,618 24Nebr. $2,609 25Nev. $2,560 27N.H. $1,726 50N.J. $3,332 12N.M. $2,759 21N.Y. $3,909 7N.C. $2,376 33N.D. $8,458 1Ohio $2,335 35Okla. $2,362 34Ore. $2,465 32Pa. $2,675 22R.I. $2,817 19S.C. $1,873 45S.D. $1,903 44Tenn. $1,817 48Texas $2,085 41Utah $2,174 39Vt. $4,724 2Va. $2,292 36Wash. $2,789 20W.Va. $2,903 16Wis. $2,857 18Wyo. $3,881 8
StateCollections per Capita Rank

Table 5. State Revenue per Capita Fiscal Year 2013
Note: “Revenue” refers to the Census Bureau’s General Revenue classification. This measure includes taxes, fees, licenses, and intergovernmental revenue but excludes revenue from government enterprises such as utilities and liquor stores, as well as insurance trust revenue. D.C. is included only in combined state and local data. See Table 39 for average people per household by state.
Source: Census Bureau; Tax Foundation calculations.
StateRevenue per
Capita RankU.S. $5,403Ala. $4,712 39Alaska $16,653 1Ariz. $4,400 44Ark. $5,852 19Calif. $5,719 21Colo. $4,388 45Conn. $7,074 8Del. $8,423 5Fla. $3,814 50Ga. $3,842 49Hawaii $7,684 7Idaho $4,551 42Ill. $5,086 35Ind. $5,098 34Iowa $5,994 16Kans. $5,267 28Ky. $5,212 31La. $5,458 25Maine $6,014 15Md. $5,859 17Mass. $6,884 9Mich. $5,489 24Minn. $6,393 13Miss. $5,854 18Mo. $4,412 43
Mont. $5,686 22Nebr. $5,253 30Nev. $4,086 48N.H. $4,636 41N.J. $6,047 14N.M. $6,850 10N.Y. $8,390 6N.C. $4,832 37N.D. $11,138 2Ohio $5,267 28Okla. $5,398 27Ore. $5,813 20Pa. $5,457 26R.I. $6,585 12S.C. $4,647 40S.D. $4,774 38Tenn. $4,218 47Texas $4,262 46Utah $5,101 33Vt. $8,986 4Va. $4,976 36Wash. $5,115 32W.Va. $6,687 11Wis. $5,620 23Wyo. $10,168 3
StateRevenue per
Capita Rank
Taxes and Tax Measures

Taxes and Tax MeasuresTaxes and Tax Measures
Table 6. State & Local Tax Collections per Capita Fiscal Year 2013
Note: “Revenue” refers to the Census Bureau’s General Revenue clas-sification. This measure includes revenue such as taxes, fees, licenses, and intergovernmental revenue but excludes revenue from government enterprises such as utilities and liquor stores, as well as insurance trust revenue. D.C.’s rank does not affect states’ ranks, but the figure in paren-theses indicates where it would rank if included. See Table 39 for average people per household by state.
Source: Census Bureau; Tax Foundation calculations.
StateCollections per Capita Rank
U.S. $4,600Ala. $3,048 50Alaska $9,211 1Ariz. $3,417 44Ark. $3,639 36Calif. $5,328 13Colo. $4,339 23Conn. $7,263 4Del. $4,611 19Fla. $3,378 45Ga. $3,324 46Hawaii $5,708 8Idaho $3,165 48Ill. $5,374 12Ind. $3,793 33Iowa $4,459 20Kans. $4,457 21Ky. $3,508 40La. $3,796 32Maine $4,818 15Md. $5,470 10Mass. $5,723 7Mich. $3,750 34Minn. $5,548 9Miss. $3,431 43Mo. $3,460 42
Mont. $3,798 31Nebr. $4,653 17Nev. $3,877 29N.H. $4,197 26N.J. $6,309 5N.M. $3,673 35N.Y. $8,049 3N.C. $3,610 37N.D. $8,823 2Ohio $4,274 24Okla. $3,492 41Ore. $3,909 27Pa. $4,626 18R.I. $5,131 14S.C. $3,196 47S.D. $3,509 38Tenn. $3,106 49Texas $3,863 30Utah $3,509 38Vt. $5,420 11Va. $4,239 25Wash. $4,416 22W.Va. $3,899 28Wis. $4,803 16Wyo. $5,795 6D.C. $9,514 (1)
StateCollections per Capita Rank

Taxes and Tax Measures
Table 7. State & Local Revenue per Capita Fiscal Year 2013
Note: “Revenue” refers to the Census Bureau’s General Revenue clas-sification. This measure includes revenue such as taxes, fees, licenses, and intergovernmental revenue but excludes revenue from government enterprises such as utilities and liquor stores, as well as insurance trust revenue. D.C.’s rank does not affect states’ ranks, but the figure in paren-theses indicates where it would rank if included. See Table 39 for average people per household by state.
Source: Census Bureau; Tax Foundation calculations.
StateCollections per Capita Rank
U.S. $8,503Ala. $7,243 41Alaska $20,651 1Ariz. $6,686 47Ark. $7,237 42Calif. $9,320 13Colo. $8,254 27Conn. $10,425 5Del. $10,005 7Fla. $6,979 45Ga. $6,541 49Hawaii $9,863 8Idaho $6,432 50Ill. $8,518 21Ind. $7,492 33Iowa $9,176 14Kans. $8,383 25Ky. $6,985 44La. $8,534 19Maine $8,525 20Md. $9,126 15Mass. $9,774 10Mich. $7,842 31Minn. $9,495 12Miss. $8,201 29Mo. $7,133 43
Mont. $7,950 30Nebr. $8,714 17Nev. $6,727 46N.H. $7,459 36N.J. $9,856 9N.M. $8,773 16N.Y. $13,175 4N.C. $7,492 33N.D. $14,003 3Ohio $8,251 28Okla. $7,464 35Ore. $8,657 18Pa. $8,471 22R.I. $9,564 11S.C. $7,380 37S.D. $7,373 38Tenn. $6,559 48Texas $7,250 40Utah $7,359 39Vt. $10,416 6Va. $7,780 32Wash. $8,414 23W.Va. $8,407 24Wis. $8,367 26Wyo. $14,485 2D.C. $18,397 (2)
StateCollections per Capita Rank

State PropertyGeneral
SalesIndividual Income
Corporate Income
Other Taxes
(a)U.S. 31.3% 22.5% 23.3% 3.6% 19.3%Ala. 18.0% 29.6% 22.5% 2.6% 27.3%Alaska 20.8% 3.2% 0.0% 9.3% 66.7%Ariz. 29.5% 39.8% 15.0% 2.9% 12.7%Ark. 18.1% 35.8% 24.6% 3.7% 17.7%Calif. 25.6% 21.7% 32.6% 3.6% 16.3%Colo. 30.7% 26.8% 24.2% 2.9% 15.5%Conn. 37.5% 14.8% 29.9% 2.2% 15.6%Del. 17.9% 0.0% 27.8% 7.4% 46.9%Fla. 36.0% 34.2% 0.0% 3.1% 26.7%Ga. 30.4% 27.6% 26.4% 2.4% 13.2%Hawaii 16.5% 38.8% 21.6% 1.5% 21.6%Idaho 28.0% 25.9% 25.3% 3.9% 16.8%Ill. 36.9% 14.1% 23.9% 6.4% 18.7%Ind. 25.5% 27.3% 24.8% 3.1% 19.3%Iowa 34.0% 20.5% 25.7% 3.1% 16.8%Kans. 32.0% 29.3% 22.9% 3.0% 12.8%Ky. 20.9% 19.6% 31.7% 5.0% 22.9%La. 22.4% 38.6% 15.6% 1.4% 22.0%Maine 39.6% 16.7% 23.9% 2.7% 17.1%Md. 27.5% 12.7% 37.7% 2.9% 19.2%Mass. 36.2% 13.5% 33.5% 4.9% 11.9%Mich. 35.2% 22.8% 23.1% 2.4% 16.5%Minn. 27.9% 17.1% 29.8% 4.5% 20.8%Miss. 26.2% 31.1% 17.1% 4.1% 21.5%Mo. 28.2% 25.4% 27.2% 2.2% 17.0%Mont. 37.0% 0.0% 27.1% 4.4% 31.4%Nebr. 35.4% 23.1% 24.2% 3.2% 14.1%Nev. 25.1% 36.8% 0.0% 0.0% 38.2%N.H. 64.1% 0.0% 1.8% 10.0% 24.1%N.J. 47.4% 15.0% 21.5% 4.1% 12.0%N.M. 18.6% 38.2% 16.2% 3.5% 23.5%
Taxes and Tax Measures
Table 8. Sources of State & Local Tax Collections, Percentage of Total from Each Source Fiscal Year 2013

N.Y. 31.0% 16.3% 31.7% 7.3% 13.7%N.C. 25.0% 22.0% 31.1% 3.6% 18.2%N.D. 12.9% 22.9% 10.1% 3.5% 50.5%Ohio 28.4% 21.4% 29.7% 1.0% 19.5%Okla. 17.0% 33.5% 21.7% 4.3% 23.4%Ore. 32.9% 0.0% 40.8% 3.4% 23.0%Pa. 29.7% 16.8% 26.0% 4.3% 23.1%R.I. 44.5% 16.3% 20.2% 2.7% 16.4%S.C. 33.7% 23.4% 22.0% 2.5% 18.3%S.D. 35.1% 39.9% 0.0% 1.3% 23.8%Tenn. 27.0% 40.1% 1.3% 6.2% 25.3%Texas 40.4% 31.9% 0.0% 0.0% 27.7%Utah 27.1% 24.9% 28.0% 3.2% 16.8%Vt. 43.0% 10.5% 19.5% 3.1% 23.8%Va. 33.7% 14.0% 31.1% 2.2% 18.9%Wash. 30.6% 44.8% 0.0% 0.0% 24.6%W.Va. 20.5% 17.4% 24.9% 3.4% 33.9%Wis. 38.4% 17.3% 26.2% 3.5% 14.7%Wyo. 37.5% 25.7% 0.0% 0.0% 36.8%D.C. 31.9% 17.6% 26.6% 7.3% 16.7%
Taxes and Tax Measures
Table 8, Continued. Sources of State & Local Tax Collections, Percentage of Total from Each Source Fiscal Year 2013
(a) “Other Taxes” include excise taxes (such as those on alcohol, tobacco, motor vehicles, utilities, and licenses), severance taxes, stock transfer taxes, estate and gift taxes, and other miscellaneous taxes.
Note: Percentages may not add to 100 due to rounding.
Source: Census Bureau; Tax Foundation calculations.
State PropertyGeneral
SalesInd.
IncomeCorporate
Income
Other Taxes
(a)

Taxes and Tax Measures
Table 9. Federal Aid as a Percentage of State General Revenue Fiscal Year 2013
Note: Figures are calculated by dividing each state’s “Intergovernmental Revenue” into its “General Revenue.” “General Revenue” includes all tax revenue but excludes utility revenue, liquor store revenue, and investment income from state pension funds. D.C. is included only in combined state and local data.
Source: Census Bureau; Tax Foundation calculations.
State
Fed. Aid as a Percentage of General Revenue Rank
U.S. 30.03%Ala. 36.15% 9Alaska 22.37% 48Ariz. 34.85% 14Ark. 32.87% 22Calif. 24.96% 42Colo. 27.79% 35Conn. 23.38% 46Del. 24.75% 45Fla. 31.46% 28Ga. 37.31% 7Hawaii 21.49% 49Idaho 34.37% 15Ill. 25.89% 40Ind. 33.41% 20Iowa 31.92% 27Kans. 24.85% 44Ky. 35.10% 12La. 41.94% 2Maine 35.30% 10Md. 28.62% 33Mass. 28.66% 32Mich. 32.81% 23Minn. 26.38% 39Miss. 42.89% 1Mo. 38.21% 5
Mont. 37.42% 6Nebr. 32.13% 26Nev. 24.95% 43N.H. 27.07% 38N.J. 25.54% 41N.M. 36.57% 8N.Y. 28.01% 34N.C. 32.52% 25N.D. 18.97% 50Ohio 33.61% 19Okla. 33.79% 17Ore. 34.98% 13Pa. 30.42% 29R.I. 33.63% 18S.C. 30.23% 30S.D. 39.03% 4Tenn. 39.49% 3Texas 32.62% 24Utah 29.03% 31Vt. 33.18% 21Va. 22.88% 47Wash. 27.30% 37W.Va. 34.14% 16Wis. 27.73% 36Wyo. 35.18% 11
State
Fed. Aid as a Percentage of General Revenue Rank

Taxes and Tax Measures
Table 10. Federal Income Tax Payments by Income Percentile Calendar Year 2013
Note: There are 138,313,155 total federal income tax filers. Total adjusted gross income (AGI) is $9,033,840,000,000. The top 1% of earners have AGI above $428,713; the top 5% have AGI above $179,760; the top 10% have AGI above $127,695; the top 25% have AGI above $74,955; and the top 50% have AGI above $36,841.
Source: Tax Foundation, “Summary of Latest Federal Individual Income Tax Data” (November 2015).
Income Percentile
Income Taxes Paid ($ millions)
Group's Share of Total AGI
Group's Share of
Income TaxesAverage Tax Rate
All Taxpayers $1,231,911 100.0% 100.0%Top 1% $465,705 19.0% 37.8% 27.1%Top 5% $721,242 34.4% 58.6% 23.2%Top 10% $859,863 45.9% 69.8% 20.8%Top 25% $1,062,798 68.1% 86.3% 17.3%Top 50% $1,197,603 88.5% 97.2% 15.0%Bottom 50% $34,307 11.5% 2.8% 3.3%

Taxes and Tax Measures
Table 11. Selected Federal Tax RatesCalendar Year 2016
(a) These are total payroll tax rates. The Social Security tax is split evenly between employer and employee (6.2% each) for all income up to $118,500. The 1.45% Medicare tax is levied on both employers and employees on all income. The Additional Medicare Tax of 0.9% is levied only on employees with wages and compensation exceeding $200,000.
(b) In state excise tax Tables 22–28, federal gasoline, alcohol, cell phone, and tobacco excise taxes are included under the “Federal” line and are in addition to any state taxes.
Source: Tax Foundation; Internal Revenue Service; Commerce Clearing House; American Petroleum Institute; Alcohol and Tobacco Tax and Trade Bureau.
Individual Income TaxSingle
Rates Brackets10% > $015% > $9,27525% > $37,65028% > $91,15033% > $190,15035% > $413,35039.6% > $415,050
Married Filing JointlyRates Brackets10% > $015% > $18,45025% > $74,90028% > $151,20033% > $230,45035% > $411,50039.6% > $464,850
Head of HouseholdRates Brackets10% > $015% > $13,25025% > $50,40028% > $130,15033% > $210,80035% > $413,35039.6% > $441,000
Social Security and Medicare Payroll Taxes (a)
15.3% > $02.9% > $118,5003.8% > $200,000
Corporate Income TaxRates Brackets15% > $025% > $50,00034% > $75,00039% > $100,00034% > $335,00035% > $10,000,00038% > $15,000,00035% > $18,333,333
Select Federal Excise Taxes (b)Item RatePistols & Revolvers 10%Other Firearms 11%Ammunition 11%Medical Devices 2.3%Indoor Tanning 10%Tackle Boxes 3%Arrow Shafts 49¢/shaftAir Transportation 7.5%Truck Bodies 12%Liq. Natural Gas 24.3¢/gallonSurface Coal 4.4% or
$0.55/ton

Individual Income Taxes
Table 12. State Individual Income Tax Rates As of January 1, 2016
State Rates BracketsAla. (e,f) 2% > $0
4% > $500 5% > $3,000
Alaska NoneAriz. (a) 2.59% > $0
2.88% > $10,0003.36% > $25,0004.24% > $50,0004.54% > $150,000
Ark. (c,d,g) 0.9% > $0 2.5% > $4,299 3.5% > $8,399 4.5% > $12,599 6.0% > $20,999 6.9% > $35,099
Calif. (a,d) 1.0% > $0 2.0% > $7,850 4.0% > $18,610 6.0% > $29,372 8.0% > $40,773 9.3% > $51,530
10.3% > $263,222 11.3% > $315,866 12.3% > $526,443 13.3% >
Colo. 4.63% of federal taxable income
Conn. (g) 3.0% > $0 5.0% > $10,000 5.5% > $50,000 6.0% > $100,000 6.5% > $200,000 6.9% > $250,000
Del. (f) 2.20% > $2,000 3.90% > $5,000 4.80% > $10,000 5.20% > $20,000 5.55% > $25,000 6.60% > $60,000
Fla. NoneGa. 1% > $0
2% > $750 3% > $2,250 4% > $3,750 5% > $5,250 6% > $7,000
Hawaii 1.4% > $0 3.2% > $2,400 5.5% > $4,800 6.4% > $9,600 6.8% > $14,400 7.2% > $19,200 7.6% > $24,000 7.9% > $36,000
8.25% > $48,000 Idaho (a,d) 1.6% > $0
3.6% > $1,452 4.1% > $2,904 5.1% > $4,356 6.1% > $5,808 7.1% > $7,260 7.4% > $10,890
Ill.3.75% of federal
adjusted gross income with modifications
Ind. (f)3.30% of federal
adjusted gross income with modifications
Iowa (d,e) 0.36% > $00.72% > $1,5392.43% > $3,0784.50% > $6,1566.12% > $13,8516.48% > $23,0856.80% > $30,7807.92% > $46,1708.98% > $69,255
Kans. (f) 2.70% > $0 4.60% > $15,000
State Rates Brackets

Individual Income Taxes
Ky. (f) 2.0% > $0 3.0% > $3,000 4.0% > $4,000 5.0% > $5,000 5.8% > $8,000 6.0% > $75,000
La. (e) 2% > $0 4% > $12,500 6% > $50,000
Maine (d,h) 5.8% > $0 6.75% > $21,049 7.15% > $37,499
Md. (f) 2.00% > $0 3.00% > $1,000 4.00% > $2,000 4.75% > $3,000 5.00% > $100,000 5.25% > $125,000 5.50% > $150,000 5.75% > $250,000
Mass. 5.10% > $0
Mich. (f)4.25% of federal
adjusted gross income with modification
Minn. (d) 5.35% > $0 7.05% > $25,180 7.85% > $82,740 9.85% > $155,650
Miss. 3% > $0 4% > $5,000 5% > $10,000
Mo. (e,f) 1.5% > $0 2.0% > $1,000 2.5% > $2,000 3.0% > $3,000 3.5% > $4,000 4.0% > $5,000 4.5% > $6,000 5.0% > $7,000 5.5% > $8,000
6.0% > $9,000 Mont. (a,d,e) 1.0% > $0
2.0% > $2,900 3.0% > $5,100 4.0% > $7,800 5.0% > $10,500 6.0% > $13,500 6.9% > $17,400
Nebr. (d,g) 2.46% > $0 3.51% > $3,060 5.01% > $18,370 6.84% > $29,590
Nev. NoneN.H. (b) 5% > $0 N.J. (f) 1.40% > $0
1.75% > $20,000 3.50% > $35,000
5.525% > $40,000 6.37% > $75,000 8.97% > $500,000
N.M. 1.7% > $0 3.2% > $5,500 4.7% > $11,000 4.9% > $16,000
N.Y. (f,g) 4.00% > $0 4.50% > $8,450 5.25% > $11,650 5.90% > $13,850 6.45% > $21,300 6.65% > $80,150 6.85% > $214,000 8.82% > $1,070,350
N.C. 5.75% > $0N.D. (d) 1.10% > $0
2.04% > $37,450 2.27% > $90,750 2.64% > $189,300 2.90% > $411,500 3.22% > $405,100
Table 12, Continued. State Individual Income Tax Rates As of January 1, 2016
State Rates Brackets State Rates Brackets

Individual Income Taxes
Ohio (a,d,f) 0.495% > $0 0.990% > $5,200 1.980% > $10,400 2.476% > $15,650 2.969% > $20,900 3.465% > $41,700 3.960% > $83,350 4.597% > $104,250 4.997% > $208,500
Okla. 0.50% > $0 1.00% > $1,000 2.00% > $2,500 3.00% > $3,750 4.00% > $4,900 5.00% > $7,200 5.25% > $8,700
Ore. (d,e,f) 5.0% > $0 7.0% > $3,350 9.0% > $8,450 9.9% > $125,000
Pa. (f) 3.07% > $0 R.I. (d) 3.75% > $0
4.75% > $60,850 5.99% > $138,300
S.C. (d) 3% > $2,920 4% > $5,840 5% > $8,760 6% > $11,680 7% > $14,600
S.D. NoneTenn. (b) 6% > $0 Texas NoneUtah 5% > $0 Vt. (d) 3.55% > $0
6.80% > $39,9007.80% > $93,4008.80% > $192,4008.95% > $415,600
Va. 2.00% > $0 3.00% > $3,000 5.00% > $5,000 5.75% > $17,000
Wash. NoneW.Va. 3.0% > $0
4.0% > $10,000 4.5% > $25,000 6.0% > $40,000 6.5% > $60,000
Wis. (d) 4.00% > $0 5.84% > $11,150 6.27% > $22,230 7.65% > $244,750
Wyo. NoneD.C. 4.00% > $0
6.00% > $10,000 7.00% > $40,000 8.50% > $60,0008.95% > $350,000
Table 12, Continued. State Individual Income Tax Rates As of January 1, 2016
State Rates Brackets State Rates Brackets

Table 12, Continued. State Individual Income Tax Rates As of January 1, 2016
(a) 2016 rates but 2015 brackets for California, Idaho, Montana, and Ohio. Laws in these states forbid revenue officials from inflation indexing brackets until midyear. Arizona will begin inflation adjusting in 2016.
(b) Tax applies to interest and dividend income only.
(c) Rates apply to individuals earning more than $75,000. Two special tax tables exist for low- and middle-income individuals: one for individuals below $21,000 in income and one for those between $21,000 and $75,000. Additionally, those between $75,000 and $80,000 in income receive a small bracket adjustment.
(d) Bracket levels are adjusted for inflation each year.
(e) These states allow some or all of federal income tax paid to be deducted from state taxable income.
(f) Local income taxes are excluded. Fourteen states have county- or city-level income taxes; the average rate within each jurisdiction is: 0.5% in Alabama; 0.63% in Delaware; 1.56% in Indiana; 0.45% in Iowa; <0.01% in Kansas; 2.10% in Kentucky; 2.90% in Maryland; 1.75% in Michigan; 0.5% in Missouri; 0.50% in New Jersey; 2.11% in New York; 2.25% in Ohio; 0.36% in Oregon; and 2.96% in Pennsylvania. Weighted local rates are from the Tax Foundation, 2016 State Business Tax Climate Index.
(g) Arkansas, Connecticut, New York, and Nebraska have “tax benefit recapture,” by which many high-income taxpayers pay their top tax rate on all income, not just on amounts above the bracket threshold.
Note: Brackets are for single taxpayers. Some states double bracket widths for joint filers (Ala., Ariz, Conn., Hawaii, Idaho, Kans., La., Maine, Nebr., Ore.). New York doubles all except the 6.85% bracket, which is effective at $300,000. California doubles all but the top bracket. Some states increase but do not double brackets for joint filers (Ga., Minn., N.M., N.C., N.D., Okla., R.I., Vt., Wis.). Maryland decreases some and increases others. New Jersey adds a 2.45% rate and doubles some bracket widths. Consult the Tax Foundation website for tables for married joint filers and married separate filers.
Source: Tax Foundation; state tax statutes, forms, and instructions; Commerce Clearing House.
Individual Income Taxes

Individual Income Taxes
Table 13. State Individual Income Tax Collections per Capita Fiscal Year 2014
(a) State has no individual income tax.
(b) State does not tax wage income but does tax interest and dividend income.
Note: D.C. is included only in combined state and local data. See Table 39 for average people per household by state.
Source: Census Bureau; Tax Foundation calculations.
StateCollections per Capita Rank
U.S. $975Ala. $662 37Alaska (a) $0 --Ariz. $515 41Ark. $877 26Calif. $1,753 4Colo. $1,057 17Conn. $2,162 2Del. $1,112 14Fla. (a) $0 --Ga. $888 24Hawaii $1,229 11Idaho $818 30Ill. $1,247 10Ind. $742 33Iowa $1,028 21Kans. $865 27Ky. $850 28La. $592 39Maine $1,063 16Md. $1,301 9Mass. $1,961 3Mich. $794 31Minn. $1,746 5Miss. $557 40Mo. $884 25
Mont. $1,039 19Nebr. $1,128 13Nev. (a) $0 --N.H. (b) $70 42N.J. $1,340 7N.M. $622 38N.Y. $2,176 1N.C. $1,045 18N.D. $674 36Ohio $726 34Okla. $764 32Ore. $1,674 6Pa. $845 29R.I. $1,032 20S.C. $709 35S.D. (a) $0 --Tenn. (b) $37 43Texas (a) $0 --Utah $981 22Vt. $1,077 15Va. $1,306 8Wash. (a) $0 --W.Va. $958 23Wis. $1,180 12Wyo. (a) $0 --
StateCollections per Capita Rank

Individual Income Taxes
Table 14. State & Local Individual Income Tax Col-lections per Capita Fiscal Year 2013
(a) State has no individual income tax.
(b) State does not tax wage income but does tax interest and dividend income.
Note: D.C.’s rank does not affect states’ ranks, but the figure in parentheses indicates where it would rank if included. See Table 39 for average people per household by state.
Source:Census Bureau; Tax Foundation calculations.
StateCollections per Capita Rank
U.S. $1,070Ala. $687 37Alaska (a) $0 --Ariz. $512 41Ark. $896 30Calif. $1,739 5Colo. $1,049 22Conn. $2,172 2Del. $1,283 10Fla. (a) $0 --Ga. $878 32Hawaii $1,232 14Idaho $801 34Ill. $1,283 10Ind. $941 29Iowa $1,145 17Kans. $1,022 25Ky. $1,111 20La. $592 39Maine $1,153 16Md. $2,061 3Mass. $1,919 4Mich. $866 33Minn. $1,651 6Miss. $587 40Mo. $942 28
Mont. $1,031 24Nebr. $1,124 18Nev. (a) $0 --N.H. (b) $75 42N.J. $1,359 8N.M. $595 38N.Y. $2,550 1N.C. $1,124 18N.D. $887 31Ohio $1,268 12Okla. $757 35Ore. $1,594 7Pa. $1,201 15R.I. $1,034 23S.C. $704 36S.D. (a) $0 --Tenn. (b) $40 43Texas (a) $0 --Utah $982 26Vt. $1,057 21Va. $1,318 9Wash. (a) $0 --W.Va. $969 27Wis. $1,258 13Wyo. (a) $0 --D.C. $2,526 (2)
StateCollections per Capita Rank

Corporate Income Taxes
Table 15. State Corporate Income Tax Rates As of January 1, 2016
State Rates BracketsAla. 6.5% > $0 Alaska 0% > $0
2% > $25,000 3% > $49,000 4% > $74,000 5% > $99,000 6% > $124,000 7% > $148,000 8% > $173,000 9% > $198,000
9.4% > $222,000 Ariz. 5.5% > $0 Ark. (a) 1% > $0
2% > $3,000 3% > $6,000 5% > $11,000 6% > $25,000
6.5% > $100,000 Calif. 8.84% > $0 Colo. 4.63% > $0 Conn. (b) 9% > $0 Del. (c) 8.7% > $0 Fla. 5.5% > $0 Ga. 6% > $0 Hawaii 4.4% > $0
5.4% > $25,000 6.4% > $100,000
Idaho 7.4% > $0 Ill. (d) 7.75% > $0 Ind. (e) 6.5% > $0 Iowa 6% > $0
8% > $25,000 10% > $100,000 12% > $250,000
Kans. 4% > $0 7% > $50,000
Ky. 4% > $0 5% > $50,000 6% > $100,000
La. 4% > $0 5% > $25,000 6% > $50,000 7% > $100,000 8% > $200,000
Maine 3.50% > $0 7.93% > $25,000 8.33% > $75,000 8.93% > $250,000
Md. 8.25% > $0 Mass. 8.00% > $0 Mich. 6.00% > $0 Minn. 9.8% > $0 Miss. 3% > $0
4% > $5,000 5% > $10,000
Mo. 6.25% > $0 Mont. 6.75% > $0 Nebr. 5.58% > $0
7.81% > $100,000 Nev. (c)N.H. 8.5% > $0 N.J. (f) 9% > $100,000 N.M. (g) 4.8% > $0
6.4% > $500,000 6.6% > $1,000,000
N.Y. 6.5% > $0 N.C. 4.0% > $0 N.D. 1.41% > $0
3.55% > $25,000 4.31% > $50,000
Ohio (c)Okla. 6% > $0 Ore. 6.6% > $0
7.6% > $1,000,000 Pa. 9.99% > $0 R.I. 7% > $0 S.C. 5% > $0 S.D. None
State Rates Brackets

Table 15, Continued. State Corporate Income Tax Rates As of January 1, 2016
Tenn. 6.5% > $0 Texas (c)Utah 5% > $0 Vt. 6.0% > $0
7.0% > $10,000 8.5% > $25,000
Va. (c) 6% > $0 Wash. (c)W.Va. 6.5% > $0 Wis. 7.9% > $0 Wyo. NoneD.C. 9.40% > $0
State Rates Brackets
(a) Arkansas assesses a surcharge of 3% of the taxpayer’s total liability.
(b) The rate includes a 20% surtax, which effectively increases the rate from 7.5% to 9%. Surtax is required by businesses with at least $100 million annual gross income.
(c) Nevada, Ohio, Texas, and Washington do not have a corporate income tax but do have a gross receipts tax with rates not strictly comparable to corporate income tax rates. See Table 18 for more information. Delaware and Virginia have gross receipts taxes in addition to corporate income taxes.
(d) Illinois’ rate includes two separate corporate income taxes, one at a 5.25% rate and one at a 2.5% rate.
(e) The tax rate in Indiana will decrease to 6.25% on July 1, 2016.
(f) Corporations with entire net income greater than $100,000 pay 9% on all taxable income, companies with entire net income greater than $50,000 and less than or equal to $100,000 pay 7.5% on all taxable income, and companies with entire net income less than or equal to $50,000 pay 6.5% on all taxable income.
(g) The tax rate in New Mexico will decrease to 6.2% in 2017.
Note: In addition to regular income taxes, many states impose other taxes on corporations such as gross receipts taxes and franchise taxes. Some states also impose an alternative minimum tax and special rates on financial institutions.
Source: Tax Foundation; state tax statutes, forms, and instructions; Commerce Clearing House.
Corporate Income Taxes
Corporate Income Taxes
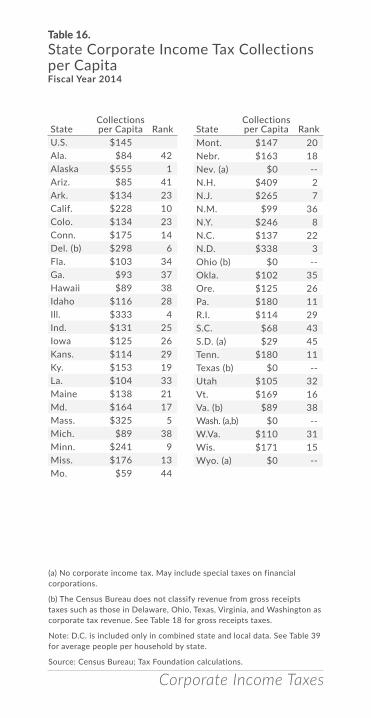
Table 16. State Corporate Income Tax Collections per Capita Fiscal Year 2014
(a) No corporate income tax. May include special taxes on financial corporations.
(b) The Census Bureau does not classify revenue from gross receipts taxes such as those in Delaware, Ohio, Texas, Virginia, and Washington as corporate tax revenue. See Table 18 for gross receipts taxes.
Note: D.C. is included only in combined state and local data. See Table 39 for average people per household by state.
Source: Census Bureau; Tax Foundation calculations.
StateCollections per Capita Rank
U.S. $145Ala. $84 42Alaska $555 1Ariz. $85 41Ark. $134 23Calif. $228 10Colo. $134 23Conn. $175 14Del. (b) $298 6Fla. $103 34Ga. $93 37Hawaii $89 38Idaho $116 28Ill. $333 4Ind. $131 25Iowa $125 26Kans. $114 29Ky. $153 19La. $104 33Maine $138 21Md. $164 17Mass. $325 5Mich. $89 38Minn. $241 9Miss. $176 13Mo. $59 44
Mont. $147 20Nebr. $163 18Nev. (a) $0 --N.H. $409 2N.J. $265 7N.M. $99 36N.Y. $246 8N.C. $137 22N.D. $338 3Ohio (b) $0 --Okla. $102 35Ore. $125 26Pa. $180 11R.I. $114 29S.C. $68 43S.D. (a) $29 45Tenn. $180 11Texas (b) $0 --Utah $105 32Vt. $169 16Va. (b) $89 38Wash. (a,b) $0 --W.Va. $110 31Wis. $171 15Wyo. (a) $0 --
StateCollections per Capita Rank

Corporate Income Taxes
Table 17. State & Local Corporate Income Tax Col-lections per Capita Fiscal Year 2013
(a) No corporate income tax.
(b) The Census Bureau does not classify revenue from gross receipts taxes such as those in Delaware, Ohio, Texas, Virginia, and Washington as corporate tax revenue. See Table 18 for gross receipts taxes.
Note: D.C.’s rank does not affect states’ ranks, but the figure in parentheses indicates where it would rank if included. See Table 39 for average people per household by state.
Source: Census Bureau; Tax Foundation calculations.
StateCollections per Capita Rank
U.S. $168Ala. $79 42Alaska $856 1Ariz. $100 36Ark. $136 24Calif. $194 11Colo. $124 31Conn. $159 18Del. (b) $341 5Fla. $106 35Ga. $80 41Hawaii $88 39Idaho $124 31Ill. $346 4Ind. $119 33Iowa $139 21Kans. $133 25Ky. $175 13La. $55 44Maine $129 29Md. $160 17Mass. $281 7Mich. $90 38Minn. $251 9Miss. $139 21Mo. $75 43
Mont. $169 14Nebr. $147 20Nev. (a) $0 --N.H. $418 3N.J. $256 8N.M. $128 30N.Y. $591 2N.C. $131 27N.D. $312 6Ohio (b) $44 45Okla. $152 19Ore. $132 26Pa. $201 10R.I. $137 23S.C. $81 40S.D. $44 45Tenn. $193 12Texas (a,b) $0 --Utah $114 34Vt. $168 15Va. (b) $93 37Wash. (a,b) $0 --W.Va. $131 27Wis. $166 16Wyo. (a) $0 --D.C. $698 (2)
StateCollections per Capita Rank

Corporate Income Taxes
Table 18. State Gross Receipts Taxes As of January 1, 2016
(a) Virginia’s tax is locally levied and rates vary by business and jurisdiction. Approximately half of counties do not levy the tax. Some counties instead levy a capital stock tax.
Note: Gross receipts taxes are complex business taxes imposed at a low rate but on a wide base of transactions, resulting in high effective tax rates that can vary by industry. These taxes also often have minimum taxes that can result in much higher effective rates for some small businesses.
Source: Commerce Clearing House; state revenue departments; Weldon Cooper Center for Public Service.
State Name of Tax Range of Rates
Del. Manufacturers' & Merchants' License Tax 0.0945% to .7468%
Nev. Commerce Tax 0.0051%-0.331%Ohio Commercial Activities Tax (CAT) 0.26%Texas Margin Tax 0.331% to .75%Va. (a) Business/Professional/
Occupational License Tax (BPOL)0.02% - 0.58%
Wash. Business & Occupation Tax (B&O) 0.13% - 3.3%

General Sales Taxes
StateState Tax
Rate Rank
Avg. Local Tax Rate (a)
Combined Rate Rank
Ala. 4.00% 38 4.97% 8.97% 4Alaska -- -- 1.78% 1.78% 46Ariz. 5.60% 28 2.65% 8.25% 11Ark. 6.50% 9 2.80% 9.30% 2Calif. (b) 7.50% 1 0.98% 8.48% 10Colo. 2.90% 45 4.62% 7.52% 15Conn. 6.35% 12 -- 6.35% 31Del. -- -- -- -- --Fla. 6.00% 16 0.66% 6.66% 30Ga. 4.00% 38 3.01% 7.01% 21Hawaii (c) 4.00% 38 0.35% 4.35% 45Idaho 6.00% 16 0.03% 6.03% 36Ill. 6.25% 13 2.39% 8.64% 7Ind. 7.00% 2 -- 7.00% 22Iowa 6.00% 16 0.79% 6.79% 28Kans. 6.50% 9 2.10% 8.60% 8Ky. 6.00% 16 -- 6.00% 37La. 4.00% 38 5.00% 9.00% 3Maine 5.50% 29 -- 5.50% 42Md. 6.00% 16 -- 6.00% 37Mass. 6.25% 13 -- 6.25% 33Mich. 6.00% 16 -- 6.00% 37Minn. 6.875% 7 0.39% 7.27% 17Miss. 7.00% 2 0.07% 7.07% 20Mo. 4.225% 37 3.64% 7.86% 14Mont. (d) -- -- -- -- --Nebr. 5.50% 29 1.37% 6.87% 26Nev. 6.85% 8 1.13% 7.98% 13N.H. -- -- -- -- --N.J. (e) 7.00% 2 -0.03% 6.97% 24N.M. (c) 5.125% 32 2.38% 7.51% 16N.Y. 4.00% 38 4.49% 8.49% 9
Table 19. State & Local Sales Tax Rates As of Jan 1, 2016

General Sales Taxes
N.C. 4.75% 35 2.15% 6.90% 25N.D. 5.00% 33 1.82% 6.82% 27Ohio 5.75% 27 1.39% 7.14% 19Okla. 4.50% 36 4.32% 8.82% 6Ore. -- -- -- -- --Pa. 6.00% 16 0.34% 6.34% 32R.I. 7.00% 2 -- 7.00% 22S.C. 6.00% 16 1.22% 7.22% 18S.D. (c) 4.00% 38 1.84% 5.84% 40Tenn. 7.00% 2 2.46% 9.46% 1Texas 6.25% 13 1.92% 8.17% 12Utah (b) 5.95% 26 0.74% 6.69% 29Vt. 6.00% 16 0.17% 6.17% 35Va. (b) 5.30% 31 0.33% 5.63% 41Wash. 6.50% 9 2.39% 8.89% 5W.Va. 6.00% 16 0.20% 6.20% 34Wis. 5.00% 33 0.41% 5.41% 44Wyo. 4.00% 38 1.42% 5.42% 43D.C. 5.75% (27) -- 5.75% (41)
Table 19, Continued. State & Local Sales Tax Rates As of Jan 1, 2016
(a) City, county, and municipal rates vary. These rates are weighted by population to compute an average local tax rate.
(b) Three states levy mandatory, statewide local add-on sales taxes at the state level: California (1%), Utah (1.25%), and Virginia (1%). We include these in their state sales tax rates.
(c) The sales taxes in Hawaii, New Mexico, and South Dakota have broad bases that include many business-to-business services.
(d) Due to data limitations, the table does not include sales taxes in local resort areas in Montana.
(e) Some counties in New Jersey are not subject to statewide sales tax rates and collect a local rate of 3.5%. Their average local score is repre-sented as a negative.
Note: D.C.’s ranks do not affect states’ ranks, but the figures in parenthe-ses indicate where it would rank if included.
Source: Sales Tax Clearinghouse; Tax Foundation calculations.
StateState Tax
Rate Rank
Avg. Local Tax Rate (a)
Combined Rate Rank

Table 20. State General Sales Tax Collections per Capita Fiscal Year 2014
(a) No state-level general sales tax.
(b) The sales taxes in Hawaii, New Mexico, and South Dakota have broad bases that include many services, so figures are not strictly comparable to other states.
Note: Some states levy gross receipts taxes in addition to sales taxes, which the Census Bureau includes in sales tax collections data. D.C. is included only in combined state and local data. See Table 18 for information on gross receipts taxes. See Table 39 for average people per household by state.
Source: Census Bureau; Tax Foundation calculations.
StateCollections per Capita Rank
U.S. $851Ala. $494 43Alaska (a) $0 --Ariz. $891 21Ark. $1,055 12Calif. $960 17Colo. $488 44Conn. $1,108 7Del. (a) $0 --Fla. $1,079 9Ga. $508 42Hawaii (b) $1,989 1Idaho $840 26Ill. $661 34Ind. $1,061 11Iowa $855 24Kans. $1,028 13Ky. $710 30La. $629 37Maine $896 20Md. $702 31Mass. $817 27Mich. $849 25Minn. $997 15Miss. $1,104 8Mo. $542 41
Mont. (a) $0 --Nebr. $937 19Nev. $1,349 4N.H. (a) $0 --N.J. $994 16N.M. (b) $1,006 14N.Y. $641 36N.C. $588 39N.D. $1,784 2Ohio $881 22Okla. $670 33Ore. (a) $0 --Pa. $742 29R.I. $868 23S.C. $698 32S.D. (b) $1,072 10Tenn. $946 18Texas $1,199 6Utah $619 38Vt. $566 40Va. $427 45Wash. $1,666 3W.Va. $661 34Wis. $804 28Wyo. $1,310 5
StateCollections per Capita Rank
General Sales Taxes

General Sales Taxes
Table 21. State & Local General Sales Tax Collections per Capita Fiscal Year 2013
Note: Some states levy gross receipts taxes in addition to sales taxes, which the Census Bureau includes in collections data. D.C.’s rank does not affect states’ ranks, but the figure in parentheses indicates where it would rank if included. See Table 18 for information on gross receipts taxes. See Table 39 for average people per household by state.
Source: Census Bureau; Tax Foundation calculations.
StateCollections per Capita Rank
U.S. $1,034Ala. $902 28Alaska $294 46Ariz. $1,361 9Ark. $1,303 12Calif. $1,159 17Colo. $1,162 16Conn. $1,072 20Del. $0 --Fla. $1,155 18Ga. $916 25Hawaii $2,214 1Idaho $821 34Ill. $759 39Ind. $1,034 22Iowa $913 27Kans. $1,307 11Ky. $687 42La. $1,465 5Maine $807 35Md. $693 41Mass. $773 38Mich. $855 31Minn. $946 24Miss. $1,067 21Mo. $880 29
Mont. $0 --Nebr. $1,075 19Nev. $1,425 6N.H. $0 --N.J. $949 23N.M. $1,403 7N.Y. $1,310 10N.C. $795 36N.D. $2,024 2Ohio $915 26Okla. $1,171 15Ore. $0 --Pa. $778 37R.I. $837 32S.C. $749 40S.D. $1,398 8Tenn. $1,247 13Texas $1,231 14Utah $873 30Vt. $571 45Va. $593 44Wash. $1,978 3W.Va. $677 43Wis. $831 33Wyo. $1,489 4D.C. $1,671 (4)
StateCollections per Capita Rank
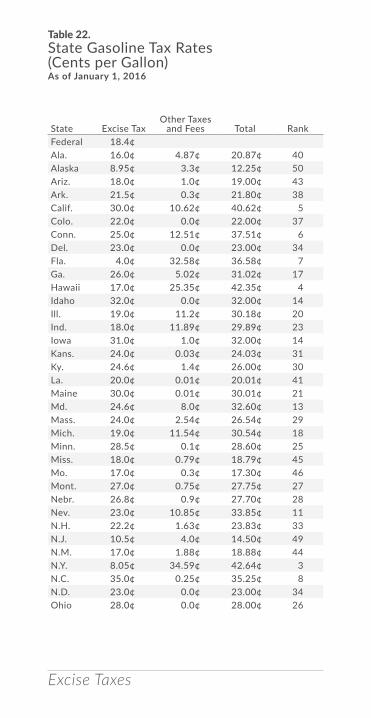
Excise Taxes
State Excise TaxOther Taxes
and Fees Total RankFederal 18.4¢Ala. 16.0¢ 4.87¢ 20.87¢ 40Alaska 8.95¢ 3.3¢ 12.25¢ 50Ariz. 18.0¢ 1.0¢ 19.00¢ 43Ark. 21.5¢ 0.3¢ 21.80¢ 38Calif. 30.0¢ 10.62¢ 40.62¢ 5Colo. 22.0¢ 0.0¢ 22.00¢ 37Conn. 25.0¢ 12.51¢ 37.51¢ 6Del. 23.0¢ 0.0¢ 23.00¢ 34Fla. 4.0¢ 32.58¢ 36.58¢ 7Ga. 26.0¢ 5.02¢ 31.02¢ 17Hawaii 17.0¢ 25.35¢ 42.35¢ 4Idaho 32.0¢ 0.0¢ 32.00¢ 14Ill. 19.0¢ 11.2¢ 30.18¢ 20Ind. 18.0¢ 11.89¢ 29.89¢ 23Iowa 31.0¢ 1.0¢ 32.00¢ 14Kans. 24.0¢ 0.03¢ 24.03¢ 31Ky. 24.6¢ 1.4¢ 26.00¢ 30La. 20.0¢ 0.01¢ 20.01¢ 41Maine 30.0¢ 0.01¢ 30.01¢ 21Md. 24.6¢ 8.0¢ 32.60¢ 13Mass. 24.0¢ 2.54¢ 26.54¢ 29Mich. 19.0¢ 11.54¢ 30.54¢ 18Minn. 28.5¢ 0.1¢ 28.60¢ 25Miss. 18.0¢ 0.79¢ 18.79¢ 45Mo. 17.0¢ 0.3¢ 17.30¢ 46Mont. 27.0¢ 0.75¢ 27.75¢ 27Nebr. 26.8¢ 0.9¢ 27.70¢ 28Nev. 23.0¢ 10.85¢ 33.85¢ 11N.H. 22.2¢ 1.63¢ 23.83¢ 33N.J. 10.5¢ 4.0¢ 14.50¢ 49N.M. 17.0¢ 1.88¢ 18.88¢ 44N.Y. 8.05¢ 34.59¢ 42.64¢ 3N.C. 35.0¢ 0.25¢ 35.25¢ 8N.D. 23.0¢ 0.0¢ 23.00¢ 34Ohio 28.0¢ 0.0¢ 28.00¢ 26
Table 22. State Gasoline Tax Rates (Cents per Gallon) As of January 1, 2016

Excise Taxes
Okla. 16.0¢ 1.0¢ 17.00¢ 47Ore. 30.0¢ 1.10¢ 31.10¢ 16Pa. 0.0¢ 50.4¢ 50.40¢ 1R.I. 33.0¢ 1.0¢ 34.00¢ 10S.C. 16.0¢ 0.75¢ 16.75¢ 48S.D. 28.0¢ 2.0¢ 30.00¢ 22Tenn. 20.0¢ 1.4¢ 21.40¢ 39Texas 20.0¢ 0.0¢ 20.00¢ 42Utah 29.4¢ 0.01¢ 29.41¢ 24Vt. 12.1¢ 18.36¢ 30.46¢ 19Va. 19.83¢ 2.5¢ 22.33¢ 36Wash. 44.5¢ 0.0¢ 44.50¢ 2W.Va. 20.5¢ 14.1¢ 34.60¢ 9Wis. 30.9¢ 2.0¢ 32.90¢ 12Wyo. 23.0¢ 1.0¢ 24.00¢ 32D.C. 23.5¢ 0.0¢ 23.50¢ (34)
Table 22, Continued. State Gasoline Tax Rates (Cents per Gallon) As of January 1, 2016
Note: The American Petroleum Institute (API) has developed a methodology for determining the average tax rate on a gallon of fuel. Rates may include any of the following: excise taxes, environmental fees, storage tank taxes, other fees or taxes, and general sales tax. In states where gasoline is subject to the general sales tax, or where the fuel tax is based on the average sale price, the average rate determined by API is sensitive to changes in the price of gasoline. States that fully or partially apply general sales taxes to gasoline are California, Connecticut, Georgia, Illinois, Indiana, Michigan, and New York. D.C.’s rank does not affect states’ ranks, but the figure in parentheses indicates where it would rank if included.
Source: American Petroleum Institute.
State Excise TaxOther Taxes
and Fees Total Rank

Excise Taxes
State
Gasoline & License
Taxes RankTolls & User
Fees
Total: Tolls, User Fees, & User Taxes Rank
U.S. 41.4% 11.1% 52.5%Ala. 35.1% 37 1.4% 36.5% 43Alaska 8.8% 50 5.4% 14.3% 50Ariz. 43.1% 17 0.8% 43.8% 32Ark. 39.5% 26 0.7% 40.1% 40Calif. 46.7% 11 7.4% 54.1% 15Colo. 44.8% 13 6.5% 51.3% 21Conn. 41.1% 23 3.9% 44.9% 28Del. 22.1% 49 40.6% 62.7% 9Fla. 52.5% 6 19.7% 72.1% 3Ga. 43.3% 15 1.8% 45.1% 27Hawaii 74.4% 1 5.3% 79.8% 1Idaho 43.9% 14 4.2% 48.1% 23Ill. 41.5% 21 14.3% 55.8% 12Ind. 47.9% 9 0.6% 48.5% 22Iowa 45.5% 12 1.4% 46.9% 25Kans. 36.9% 33 5.7% 42.6% 36Ky. 39.4% 27 1.1% 40.5% 39La. 27.5% 43 2.4% 29.9% 45Maine 38.0% 29 14.3% 52.2% 18Md. 41.0% 24 22.0% 63.0% 8Mass. 36.7% 34 19.0% 55.7% 13Mich. 55.5% 5 6.3% 61.8% 10Minn. 40.1% 25 3.3% 43.4% 34Miss. 34.8% 38 0.2% 34.9% 44Mo. 36.6% 35 2.2% 38.8% 42Mont. 41.4% 22 2.6% 44.0% 30Nebr. 37.1% 32 4.3% 41.4% 38Nev. 42.4% 18 1.3% 43.7% 33N.H. 29.7% 42 22.7% 52.3% 17N.J. 26.4% 44 47.2% 73.6% 2N.M. 37.6% 31 2.0% 39.6% 41N.Y. 31.5% 41 38.4% 69.9% 4N.C. 63.3% 2 1.3% 64.5% 7N.D. 24.1% 47 2.2% 26.4% 46Ohio 47.4% 10 6.6% 53.9% 16
Table 23. Share of State & Local Road Spending Covered by State & Local Tolls, User Fees, & User Taxes Fiscal Year 2013

Excise Taxes
Okla. 48.6% 8 11.0% 59.6% 11Ore. 58.0% 4 6.9% 64.9% 6Pa. 32.6% 40 14.8% 47.4% 24R.I. 38.9% 28 5.0% 43.9% 31S.C. 62.2% 3 7.6% 69.8% 5S.D. 23.5% 48 1.5% 25.0% 49Tenn. 51.6% 7 0.3% 51.9% 20Texas 43.2% 16 11.2% 54.4% 14Utah 42.0% 19 3.2% 45.2% 26Vt. 24.3% 45 1.1% 25.4% 48Va. 37.8% 30 7.0% 44.8% 29Wash. 41.8% 20 10.3% 52.0% 19W.Va. 34.5% 39 9.0% 43.4% 34Wis. 36.6% 35 5.9% 42.5% 37Wyo. 24.3% 45 1.4% 25.8% 47D.C. 22.4% (49) 6.3% 28.7% (46)
Table 23, Continued. Share of State & Local Road Spending Covered by State & Local Tolls, User Fees, & User Taxes Fiscal Year 2013
Note: D.C.’s ranks do not affect states’ ranks, but the figures in parentheses indicate where it would rank if included.
Source: Tax Foundation calculations from the Census Bureau, State and Local Government Finance and Federal Highway Administration data. The state and local table includes state and local road expenses but excludes federal aid.
State
Gasoline & License
Taxes RankTolls & User
Fees
Total: Tolls, User Fees, & User Taxes Rank
Excise Taxes
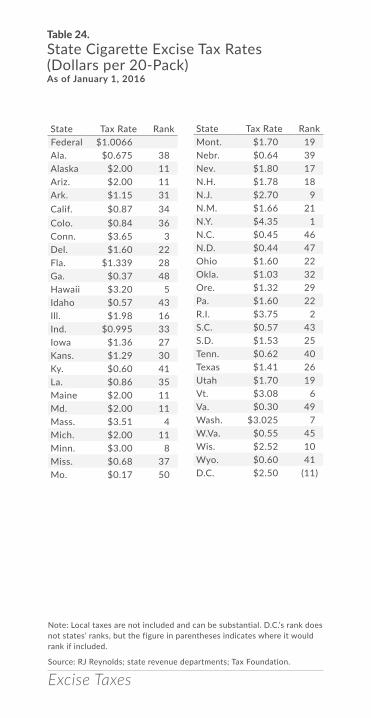
Table 24. State Cigarette Excise Tax Rates (Dollars per 20-Pack) As of January 1, 2016
Note: Local taxes are not included and can be substantial. D.C.’s rank does not states’ ranks, but the figure in parentheses indicates where it would rank if included.
Source: RJ Reynolds; state revenue departments; Tax Foundation.
State Tax Rate RankFederal $1.0066Ala. $0.675 38Alaska $2.00 11Ariz. $2.00 11Ark. $1.15 31Calif. $0.87 34Colo. $0.84 36Conn. $3.65 3Del. $1.60 22Fla. $1.339 28Ga. $0.37 48Hawaii $3.20 5Idaho $0.57 43Ill. $1.98 16Ind. $0.995 33Iowa $1.36 27Kans. $1.29 30Ky. $0.60 41La. $0.86 35Maine $2.00 11Md. $2.00 11Mass. $3.51 4Mich. $2.00 11Minn. $3.00 8Miss. $0.68 37Mo. $0.17 50
Mont. $1.70 19Nebr. $0.64 39Nev. $1.80 17N.H. $1.78 18N.J. $2.70 9N.M. $1.66 21N.Y. $4.35 1N.C. $0.45 46N.D. $0.44 47Ohio $1.60 22Okla. $1.03 32Ore. $1.32 29Pa. $1.60 22R.I. $3.75 2S.C. $0.57 43S.D. $1.53 25Tenn. $0.62 40Texas $1.41 26Utah $1.70 19Vt. $3.08 6Va. $0.30 49Wash. $3.025 7W.Va. $0.55 45Wis. $2.52 10Wyo. $0.60 41D.C. $2.50 (11)
State Tax Rate Rank
Excise Taxes
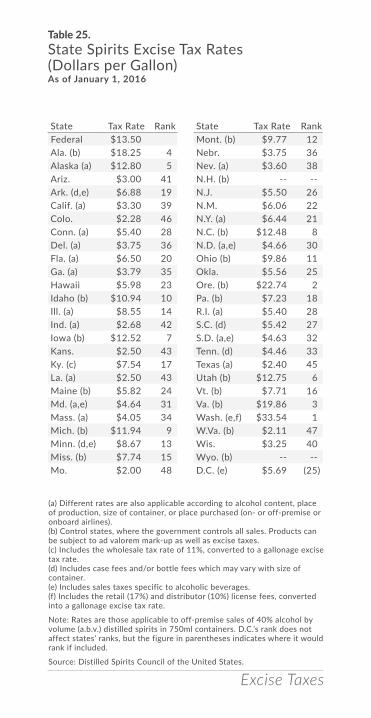
Table 25. State Spirits Excise Tax Rates (Dollars per Gallon) As of January 1, 2016
(a) Different rates are also applicable according to alcohol content, place of production, size of container, or place purchased (on- or off-premise or onboard airlines). (b) Control states, where the government controls all sales. Products can be subject to ad valorem mark-up as well as excise taxes. (c) Includes the wholesale tax rate of 11%, converted to a gallonage excise tax rate. (d) Includes case fees and/or bottle fees which may vary with size of container. (e) Includes sales taxes specific to alcoholic beverages. (f) Includes the retail (17%) and distributor (10%) license fees, converted into a gallonage excise tax rate.
Note: Rates are those applicable to off-premise sales of 40% alcohol by volume (a.b.v.) distilled spirits in 750ml containers. D.C.’s rank does not affect states’ ranks, but the figure in parentheses indicates where it would rank if included.
Source: Distilled Spirits Council of the United States.
State Tax Rate RankFederal $13.50Ala. (b) $18.25 4Alaska (a) $12.80 5Ariz. $3.00 41Ark. (d,e) $6.88 19Calif. (a) $3.30 39Colo. $2.28 46Conn. (a) $5.40 28Del. (a) $3.75 36Fla. (a) $6.50 20Ga. (a) $3.79 35Hawaii $5.98 23Idaho (b) $10.94 10Ill. (a) $8.55 14Ind. (a) $2.68 42Iowa (b) $12.52 7Kans. $2.50 43Ky. (c) $7.54 17La. (a) $2.50 43Maine (b) $5.82 24Md. (a,e) $4.64 31Mass. (a) $4.05 34Mich. (b) $11.94 9Minn. (d,e) $8.67 13Miss. (b) $7.74 15Mo. $2.00 48
Mont. (b) $9.77 12Nebr. $3.75 36Nev. (a) $3.60 38N.H. (b) -- --N.J. $5.50 26N.M. $6.06 22N.Y. (a) $6.44 21N.C. (b) $12.48 8N.D. (a,e) $4.66 30Ohio (b) $9.86 11Okla. $5.56 25Ore. (b) $22.74 2Pa. (b) $7.23 18R.I. (a) $5.40 28S.C. (d) $5.42 27S.D. (a,e) $4.63 32Tenn. (d) $4.46 33Texas (a) $2.40 45Utah (b) $12.75 6Vt. (b) $7.71 16Va. (b) $19.86 3Wash. (e,f) $33.54 1W.Va. (b) $2.11 47Wis. $3.25 40Wyo. (b) -- --D.C. (e) $5.69 (25)
State Tax Rate Rank

Excise Taxes
Table 26. State Wine Excise Tax Rates (Dollars per Gallon) As of January 1, 2016
(a) Different rates also applicable according to alcohol content, place of production, size of container, place purchased (on- or off-premise or on board airlines) or type of wine (carbonated, vermouth, etc.).
(b) Control states, where the government controls all sales. Products can be subject to ad valorem mark-up as well as excise taxes.
(c) Includes the wholesale tax rate of 11%, converted to a gallonage excise tax rate.
(d) Includes case fees and/or bottle fees which may vary with size of container.
(e) Includes sales taxes specific to alcoholic beverages.
Note: Rates are those applicable to off-premise sales of 11% alcohol by volume (a.b.v.) non-carbonated wine in 750ml containers. Federal rates vary by alcohol content and type of wine, ranging up to $3.15 for 21–24% alcohol and $3.40 for sparking wine. D.C.’s rank does not affect states’ ranks, but the figure in parentheses indicates where it would rank if included.
Source: Distilled Spirits Council of the United States.
State Tax Rate RankFederal $1.07Ala. (a) $1.70 5Alaska $2.50 2Ariz. (a) $0.84 26Ark. (d,e) $1.35 12Calif. (a) $0.20 43Colo. (a) $0.32 38Conn. (a) $0.72 27Del. $0.97 22Fla. (a) $2.25 3Ga. (a) $1.51 7Hawaii (a) $1.38 11Idaho (a) $0.45 36Ill. (a) $1.39 10Ind. (a) $0.47 35Iowa (a) $1.75 4Kans. (a) $0.30 40Ky. (c) $3.30 1La. (a) $0.11 45Maine (a) $0.60 31Md. (e) $1.35 12Mass. (a) $0.55 32Mich. (a) $0.51 34Minn. (d,e) $1.18 16Miss. (a,b) -- --Mo. $0.42 37
Mont. (a) $1.06 18Nebr. (a) $0.95 23Nev. (a) $0.70 29N.H. (a,b) -- --N.J. $0.88 24N.M. (a) $1.70 5N.Y. $0.30 40N.C. (a) $1.00 20N.D. (a) $1.06 18Ohio (a) $0.32 38Okla. (a) $0.72 27Ore. (a) $0.67 30Pa. (b) -- --R.I. (a) $1.40 9S.C. (a) $1.08 17S.D. (a,e) $1.27 14Tenn. (d) $1.27 14Texas (a) $0.20 43Utah (b) -- --Vt. (a) $0.55 32Va. (a) $1.51 7Wash. (a) $0.87 25W.Va. (a) $1.00 20Wis. (a) $0.25 42Wyo. (b) -- --D.C. (a,e) $1.72 (5)
State Tax Rate Rank

Excise Taxes
Table 27. State Beer Excise Tax Rates (Dollars per Gallon) As of January 1, 2016
(a) Different rates are also applicable according to alcohol content, place of production, size of container, or place purchased (on- or off-premise or onboard airlines).
(b) Includes statewide local tax in Alabama ($0.52) and Georgia ($0.53).
(c) Includes sales taxes specific to alcoholic beverages.
(d) Includes case fees and/or bottle fees which may vary with the size of container.
(e) Includes the wholesale tax rate in Kentucky (11%) and Tennessee (17%), converted into a gallonage excise tax rate.
Note: Rates are those applicable to off-premise sales of 4.7% a.b.v. beer in 12 ounce containers. D.C.’s rank does not affect states’ ranks, but the figure in parentheses indicates where it would rank if included.
Source: Distilled Spirits Council of the United States; Tax Foundation.
State Tax Rate RankFederal $0.58Ala. (b) $1.07 3Alaska $0.16 35Ariz. $0.35 17Ark. (c,d) $0.20 28Calif. $0.08 45Colo. $0.23 26Conn. $0.16 35Del. $0.64 7Fla. (a) $0.48 10Ga. (a,b) $0.48 10Hawaii (a) $0.93 4Idaho (a) $0.15 38Ill. $0.23 26Ind. $0.12 41Iowa (a) $0.19 31Kans. $0.18 32Ky. $0.84 5La. $0.32 19Maine $0.35 17Md. (c) $0.49 9Mass. $0.11 44Mich. $0.20 28Minn. (a,c) $0.47 12Miss. $0.43 13Mo. $0.06 48
Mont. $0.14 39Nebr. $0.31 20Nev. $0.16 35N.H. $0.30 21N.J. $0.12 41N.M. $0.41 14N.Y. $0.14 39N.C. (a) $0.62 8N.D. (a) $39.00 1Ohio (a) $0.18 32Okla. (a) $0.40 16Ore. $0.08 45Pa. $0.08 45R.I. (d) $0.12 41S.C. $0.77 6S.D. $0.27 22Tenn. (e) $1.29 2Texas (a) $0.20 28Utah (a) $0.41 14Vt. $0.27 22Va. (a) $0.26 24Wash. (a) $0.26 24W.Va. $0.18 32Wis. (a) $0.06 48Wyo. $0.02 50D.C. (c) $0.64 (7)
State Tax Rate Rank

Excise Taxes
Table 28. State & Local Cell Phone Tax Rates As of July 1, 2015
(a) The federal tax listed is the federal Universal Service Fund (USF).
Note: The local tax rate is calculated as the average of the tax in the largest city and the capital city. D.C.’s rank does not affect states’ ranks, but the figure in parentheses indicates where it would rank if included.
Source: Tax Foundation, “Record High Taxes and Fees on Wireless Consumers in 2015” (November 2015).
State
Average State-Local
Tax Rate RankFederal (a) 6.46%Ala. 9.75% 26Alaska 12.69% 13Ariz. 11.98% 17Ark. 14.31% 8Calif. 11.60% 18Colo. 10.78% 23Conn. 7.44% 40Del. 6.29% 46Fla. 14.66% 7Ga. 9.22% 28Hawaii 7.61% 39Idaho 2.17% 48Ill. 17.46% 4Ind. 11.06% 21Iowa 8.71% 32Kans. 13.53% 10Ky. 10.56% 25La. 7.29% 42Maine 7.35% 41Md. 12.67% 14Mass. 8.93% 30Mich. 8.28% 36Minn. 9.54% 27Miss. 9.14% 29Mo. 14.79% 5
Mont. 6.11% 47Nebr. 18.53% 2Nev. 1.95% 49N.H. 8.22% 37N.J. 8.93% 30N.M. 11.22% 20N.Y. 17.90% 3N.C. 8.59% 33N.D. 12.27% 15Ohio 8.42% 35Okla. 10.88% 22Ore. 1.80% 50Pa. 14.14% 9R.I. 14.70% 6S.C. 10.58% 24S.D. 13.14% 11Tenn. 11.99% 16Texas 11.53% 19Utah 12.77% 12Vt. 8.50% 34Va. 6.61% 44Wash. 18.69% 1W.Va. 6.43% 45Wis. 7.17% 43Wyo. 7.95% 38D.C. 11.63% (18)
State
Average State-Local
Tax Rate Rank

Excise Taxes
State
State General
Sales TaxGrocery
Treatment
Candy Treated as Groceries?
Soda Treated as Groceries?
Ala. 4.00% Included in Base Yes YesAlaska -- -- -- --Ariz. 5.60% Exempt Yes YesArk. 6.50% 1.50% Yes YesCalif. (a) 7.50% Exempt Yes NoColo. 2.90% Exempt No NoConn. 6.35% Exempt No NoDel. -- -- -- --Fla. 6.00% Exempt No NoGa. 4.00% Exempt Yes YesHawaii 4.00% Included in Base Yes YesIdaho 6.00% Included in Base Yes YesIll. 6.25% 1.00% No NoInd. 7.00% Exempt No NoIowa 6.00% Exempt No NoKans. 6.50% Included in Base Yes YesKy. 6.00% Exempt No NoLa. 4.00% Exempt Yes YesMaine 5.50% Exempt No NoMd. 6.00% Exempt No NoMass. 6.25% Exempt Yes YesMich. 6.00% Exempt Yes YesMinn. 6.875% Exempt No NoMiss. 7.00% Included in Base Yes YesMo. 4.225% 1.225% Yes YesMont. -- -- -- --Nebr. 5.50% Exempt Yes YesNev. 6.85% Exempt Yes YesN.H. -- -- -- --N.J. 7.00% Exempt No NoN.M. 5.125% Exempt Yes YesN.Y. 4.00% Exempt No NoN.C. 4.75% Exempt No NoN.D. 5.00% Exempt No NoOhio 5.75% Exempt Yes No
Table 29. Sales Tax Treatment of Groceries, Candy, & Soda As of January 1, 2016

Excise Taxes
Table 29, Continued. Sales Tax Treatment of Groceries, Candy, & Soda As of January 1, 2016
(a) Three states collect a separate, uniform 1% “local” add-on sales tax: California, Utah, and Virginia. We include this in their state sales tax rates.
Source: Tax Foundation, “Overreaching on Obesity: Governments Consider New Taxes on Soda and Candy” (October 2011); Commerce Clearing House.
Okla. 4.50% Included in Base Yes YesOre. -- -- -- --Pa. 6.00% Exempt Yes NoR.I. 7.00% Exempt No NoS.C. 6.00% Exempt Yes YesS.D. 4.00% Included in Base Yes YesTenn. 7.00% 5.00% Yes YesTexas 6.25% Exempt No NoUtah (a) 5.95% 1.75% Yes YesVt. 6.00% Exempt Yes YesVa. (a) 5.30% 2.50% Yes YesWash. 6.50% Exempt Yes NoW.Va. 6.00% Exempt No NoWis. 5.00% Exempt No NoWyo. 4.00% Exempt Yes YesD.C. 5.75% Exempt Yes No
State
State General
Sales TaxGrocery
Treatment
Candy Treated as Groceries?
Soda Treated as Groceries?
Excise Taxes
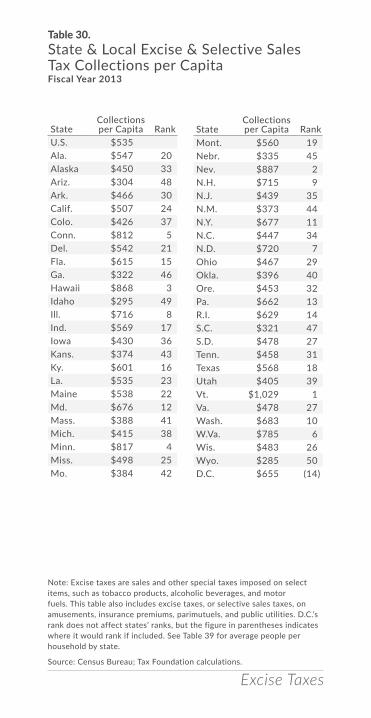
Table 30. State & Local Excise & Selective Sales Tax Collections per Capita Fiscal Year 2013
Note: Excise taxes are sales and other special taxes imposed on select items, such as tobacco products, alcoholic beverages, and motor fuels. This table also includes excise taxes, or selective sales taxes, on amusements, insurance premiums, parimutuels, and public utilities. D.C.’s rank does not affect states’ ranks, but the figure in parentheses indicates where it would rank if included. See Table 39 for average people per household by state.
Source: Census Bureau; Tax Foundation calculations.
StateCollections per Capita Rank
U.S. $535Ala. $547 20Alaska $450 33Ariz. $304 48Ark. $466 30Calif. $507 24Colo. $426 37Conn. $812 5Del. $542 21Fla. $615 15Ga. $322 46Hawaii $868 3Idaho $295 49Ill. $716 8Ind. $569 17Iowa $430 36Kans. $374 43Ky. $601 16La. $535 23Maine $538 22Md. $676 12Mass. $388 41Mich. $415 38Minn. $817 4Miss. $498 25Mo. $384 42
Mont. $560 19Nebr. $335 45Nev. $887 2N.H. $715 9N.J. $439 35N.M. $373 44N.Y. $677 11N.C. $447 34N.D. $720 7Ohio $467 29Okla. $396 40Ore. $453 32Pa. $662 13R.I. $629 14S.C. $321 47S.D. $478 27Tenn. $458 31Texas $568 18Utah $405 39Vt. $1,029 1Va. $478 27Wash. $683 10W.Va. $785 6Wis. $483 26Wyo. $285 50D.C. $655 (14)
StateCollections per Capita Rank

Property Taxes
Table 31. Property Taxes Paid as a Percentage of Owner-Occupied Housing Value Calendar Year 2014
Note: The figures in this table are mean effective property tax rates on owner-occupied housing (total real taxes paid/total home value). As a result, the data exclude property taxes paid by businesses, renters, and others. D.C.’s rank does not affect states’ ranks, but the figure in parentheses indicates where it would rank if included.
Source: 2014 American Community Survey, available from the Census Bureau; Tax Foundation calculations.
StateEffective Tax
Rate RankU.S. 1.20%Ala. 0.40% 49Alaska 1.01% 21Ariz. 0.66% 37Ark. 0.64% 40Calif. 0.73% 34Colo. 0.59% 42Conn. 1.53% 10Del. 0.55% 44Fla. 0.98% 25Ga. 0.91% 27Hawaii 0.28% 50Idaho 0.73% 34Ill. 1.98% 4Ind. 0.56% 43Iowa 1.42% 14Kans. 1.30% 16Ky. 0.80% 31La. 0.50% 48Maine 1.20% 18Md. 1.00% 23Mass. 1.11% 19Mich. 1.46% 11Minn. 1.09% 20Miss. 0.65% 39Mo. 1.00% 23
Mont. 0.75% 32Nebr. 1.65% 8Nev. 0.71% 36N.H. 1.99% 3N.J. 2.11% 2N.M. 0.66% 37N.Y. 1.38% 15N.C. 0.84% 29N.D. 9.00% 1Ohio 1.58% 9Okla. 0.85% 28Ore. 1.01% 21Pa. 1.46% 11R.I. 1.46% 11S.C. 0.55% 44S.D. 1.22% 17Tenn. 0.75% 32Texas 1.67% 7Utah 0.63% 41Vt. 1.70% 6Va. 0.81% 30Wash. 0.94% 26W.Va. 0.53% 46Wis. 1.74% 5Wyo. 0.51% 47D.C. 0.54% (46)
StateEffective Tax
Rate Rank

Property Taxes
Table 32. State & Local Property Tax Collections per Capita Fiscal Year 2013
StateCollections per Capita Rank
U.S. $1,439Ala. $548 50Alaska $1,913 10Ariz. $1,009 33Ark. $659 48Calif. $1,365 22Colo. $1,333 24Conn. $2,726 2Del. $825 44Fla. $1,216 28Ga. $1,011 32Hawaii $943 38Idaho $888 41Ill. $1,982 9Ind. $968 36Iowa $1,515 16Kans. $1,425 19Ky. $732 46La. $849 42Maine $1,907 11Md. $1,504 17Mass. $2,069 8Mich. $1,320 25Minn. $1,547 15Miss. $899 40Mo. $977 34
Mont. $1,407 20Nebr. $1,649 13Nev. $972 35N.H. $2,690 3N.J. $2,989 1N.M. $685 47N.Y. $2,494 4N.C. $903 39N.D. $1,140 30Ohio $1,215 29Okla. $595 49Ore. $1,285 26Pa. $1,376 21R.I. $2,282 6S.C. $1,077 31S.D. $1,231 27Tenn. $838 43Texas $1,560 14Utah $952 37Vt. $2,331 5Va. $1,430 18Wash. $1,350 23W.Va. $798 45Wis. $1,843 12Wyo. $2,173 7D.C. $3,032 (1)
StateCollections per Capita Rank
Note: D.C.’s rank does not affect states’ ranks, but the figure in parentheses indicates where it would rank if included. See Table 39 for average people per household by state.
Source: Census Bureau; Tax Foundation calculations.

Property Taxes
Table 33. State Capital Stock Tax Rates As of January 1, 2016
State Tax Rate Max PaymentAla. 0.175% $15,000Ark. 0.3% UnlimitedConn. (a) 0.31% $1,000,000Del. 0.0350% $180,000Ga. (b) $5,000Ill. 0.1% $2,000,000La. 0.3% UnlimitedMass. 0.26% UnlimitedMiss. 0.25% UnlimitedNebr. (b) $11,995N.Y. (a,c) 0.125% $1,000,000N.C. 0.15% UnlimitedOkla. 0.125% $20,000S.C. 0.1% UnlimitedTenn. 0.25% UnlimitedWyo. (a) 0.02% Unlimited
(a) Taxpayer pays the greater of corporate income tax or capital stock tax liability.
(b) Based on a fixed dollar payment schedule. Effective tax rates decrease as taxable capital increases.
(c) Tax is being phased out; liability limited to liability in tax year ending December 31, 2010.
Note: Capital stock taxes are levied on net assets of a company or its market capitalization.
Source: State statutes; Commerce Clearing House.

Estate and Inheritance Taxes
Table 34. Estate Tax Rates & ExemptionsAs of January 1, 2016
State Exemption Rate (Min. to Max.)Conn. $2,000,000 7.2% - 12.0%Del. $5,450,000 0.8% - 16.0%Hawaii $5,450,000 0.8% - 16.0%Ill. $4,000,000 0.8% - 16.0%Maine $5,450,000 8.0% - 12.0%Md. (a) $2,000,000 16.0%Mass. $1,000,000 0.8% - 16.0%Minn. $1,600,000 9.0% - 16.0%N.J. (a) $675,000 0.8% - 16.0%N.Y. (b) $3,125,000 3.06% - 16.0%Ore. $1,000,000 10%-16%R.I. $1,500,000 0.8% - 16.0%Vt. $2,750,000 0.8% - 16.0%Wash. $2,078,000 10.0% - 20.0%D.C. $1,000,000 0.8% - 16.0%
(a) Maryland and New Jersey have both an estate and an inheritance tax. See Table 35.
(b) Exemption increases to $4,187,500 on April 1, 2016.
Source: Family Business Coalition; state statutes.

Estate and Inheritance Taxes
Table 35. Inheritance Tax Rates & ExemptionsAs of January 1, 2016
State Heir type ExemptionRate
(Min. to Max.)Iowa (a) Class A 100% exempt 0
Class B No exemption 5% - 10%Class C No exemption 10% - 15%Class D No exemption 15%Class E No exemption 10%Class F No exemption 5%Class G 100% exempt 0%
Ky. Class A 100% exempt 0Class B $1,000 4% - 16%Class C $500 6% - 16%
Md. (b) Spouse/Lineal Heirs 100% exempt 0%All others No exemption 10%
Nebr. (c) Immediate Relative $40,000 1%Remote Relative $15,000 13%
All others $10,000 15%N.J. (b,d) Class A 100% exempt 0%
Class C $0 11 - 16%Class D $0 15 - 16%Class E 100% exempt 0%
Pa. (e) Spouses 100% exempt 0%Lineal Heirs No exemption 4.5%
Siblings No exemption 12%Others No exemption 15%
(a) Class D is for-profit organizations; Class E, foreign charitable organizations; Class F, unknown heirs; and Class G, recognized charities. (b) Maryland and New Jersey have both an estate tax and an inheritance tax. See Table 34. (c) Nebraska’s inheritance tax is levied at the county level. (d) New Jersey’s inheritance tax only applies to estates over $1m. Class E is charitable organizations. (e) Parent-to-child transfers to children 21 years and under, transfers of farms and farming equipment, and transfers of some family-owned businesses are exempt.
Note: Inheritance taxes are levied on the posthumous transfer of assets based on relationship to the decedent. Generally, Class A beneficiaries are spouses, children, and often siblings. Class B beneficiaries are non-immediate family members. Class C beneficiaries are non-family members. Unlike estate taxes, the term “exemption” here applies not to the size of the estate but to the size of the gift itself.
Source: Family Business Coalition; state statutes.

State Debt
Table 36. State Debt per Capita Fiscal Year 2013
Note: This shows debt at the end of the fiscal year. D.C. is included only in combined state and local data.
Source: Census Bureau; Tax Foundation.
StateDebt per
Capita RankU.S. $3,594Ala. $1,875 43Alaska $8,432 4Ariz. $2,070 40Ark. $1,334 46Calif. $3,962 19Colo. $3,094 28Conn. $8,995 3Del. $6,219 8Fla. $1,934 42Ga. $1,330 47Hawaii $5,905 9Idaho $2,262 38Ill. $4,939 11Ind. $3,434 24Iowa $2,150 39Kans. $2,358 37Ky. $3,407 25La. $4,017 17Maine $4,045 15Md. $4,391 12Mass. $11,352 1Mich. $3,068 30Minn. $2,504 33Miss. $2,378 36Mo. $3,195 27
Mont. $3,508 21Nebr. $988 49Nev. $1,294 48N.H. $6,626 7N.J. $7,215 5N.M. $3,466 22N.Y. $6,907 6N.C. $1,935 41N.D. $2,535 32Ohio $2,863 31Okla. $2,469 34Ore. $3,462 23Pa. $3,678 20R.I. $9,088 2S.C. $3,088 29S.D. $4,052 14Tenn. $953 50Texas $1,495 45Utah $2,428 35Vt. $5,310 10Va. $3,389 26Wash. $4,370 13W.Va. $3,970 18Wis. $4,037 16Wyo. $1,750 44
StateDebt per
Capita Rank

State Debt
Table 37. State & Local Debt per Capita Fiscal Year 2013
Note: This shows total outstanding debt at the end of the fiscal year. D.C.’s rank does not affect states’ ranks, but the figure in parentheses indicates where it would rank if included. See Table 39 for average people per household by state.
Source: Census Bureau; Tax Foundation.
StateDebt per
Capita RankU.S. $9,338Ala. $6,546 37Alaska $13,039 3Ariz. $7,339 32Ark. $4,784 47Calif. $10,941 9Colo. $10,092 12Conn. $12,058 4Del. $9,005 16Fla. $7,473 31Ga. $5,573 43Hawaii $10,151 11Idaho $3,645 49Ill. $11,536 6Ind. $7,520 30Iowa $5,982 40Kans. $8,925 17Ky. $9,479 15La. $8,435 22Maine $6,326 39Md. $8,238 23Mass. $14,213 2Mich. $7,708 28Minn. $8,863 19Miss. $4,724 48Mo. $7,541 29
Mont. $5,231 45Nebr. $8,008 24Nev. $9,606 14N.H. $8,643 21N.J. $11,334 7N.M. $7,823 26N.Y. $17,584 1N.C. $5,233 44N.D. $6,438 38Ohio $7,128 34Okla. $4,899 46Ore. $8,858 20Pa. $10,188 10R.I. $11,692 5S.C. $8,874 18S.D. $6,954 35Tenn. $5,667 42Texas $9,989 13Utah $6,759 36Vt. $7,247 33Va. $7,919 25Wash. $11,084 8W.Va. $5,882 41Wis. $7,737 27Wyo. $3,420 50D.C. $19,104 (1)
StateDebt per
Capita Rank
Data
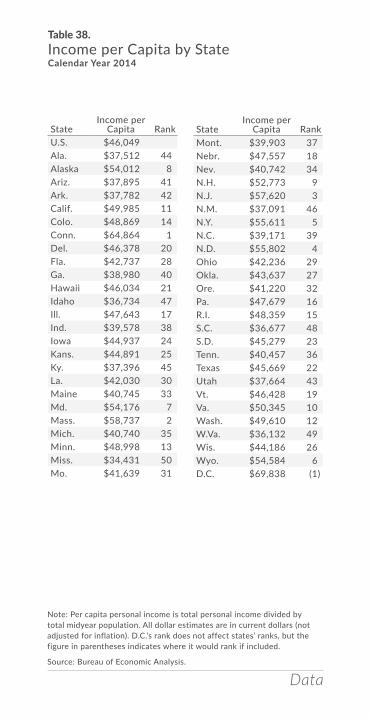
Table 38. Income per Capita by State Calendar Year 2014
Note: Per capita personal income is total personal income divided by total midyear population. All dollar estimates are in current dollars (not adjusted for inflation). D.C.’s rank does not affect states’ ranks, but the figure in parentheses indicates where it would rank if included.
Source: Bureau of Economic Analysis.
StateIncome per
Capita RankU.S. $46,049Ala. $37,512 44Alaska $54,012 8Ariz. $37,895 41Ark. $37,782 42Calif. $49,985 11Colo. $48,869 14Conn. $64,864 1Del. $46,378 20Fla. $42,737 28Ga. $38,980 40Hawaii $46,034 21Idaho $36,734 47Ill. $47,643 17Ind. $39,578 38Iowa $44,937 24Kans. $44,891 25Ky. $37,396 45La. $42,030 30Maine $40,745 33Md. $54,176 7Mass. $58,737 2Mich. $40,740 35Minn. $48,998 13Miss. $34,431 50Mo. $41,639 31
Mont. $39,903 37Nebr. $47,557 18Nev. $40,742 34N.H. $52,773 9N.J. $57,620 3N.M. $37,091 46N.Y. $55,611 5N.C. $39,171 39N.D. $55,802 4Ohio $42,236 29Okla. $43,637 27Ore. $41,220 32Pa. $47,679 16R.I. $48,359 15S.C. $36,677 48S.D. $45,279 23Tenn. $40,457 36Texas $45,669 22Utah $37,664 43Vt. $46,428 19Va. $50,345 10Wash. $49,610 12W.Va. $36,132 49Wis. $44,186 26Wyo. $54,584 6D.C. $69,838 (1)
StateIncome per
Capita Rank

Data
Table 39. People per Household by State2013-2014
Note: This does not include persons living in institutionalized housing, defined as adult or juvenile correctional institutions, some medical and military facilities, hospitals, and psychiatric facilities.
Source: Census Bureau; Tax Foundation.
State 2013 2014U.S. 2.65 2.65Ala. 2.59 2.57Alaska 2.88 2.84Ariz. 2.70 2.71Ark. 2.56 2.55Calif. 2.97 2.98Colo. 2.57 2.57Conn. 2.60 2.57Del. 2.66 2.60Fla. 2.65 2.66Ga. 2.74 2.74Hawaii 3.02 3.05Idaho 2.69 2.71Ill. 2.63 2.64Ind. 2.55 2.56Iowa 2.42 2.42Kans. 2.53 2.55Ky. 2.50 2.50La. 2.60 2.63Maine 2.36 2.35Md. 2.68 2.70Mass. 2.54 2.55Mich. 2.52 2.53Minn. 2.49 2.50Miss. 2.66 2.64Mo. 2.48 2.50
Mont. 2.43 2.42Nebr. 2.49 2.47Nev. 2.75 2.74N.H. 2.47 2.47N.J. 2.74 2.74N.M. 2.71 2.68N.Y. 2.64 2.63N.C. 2.55 2.56N.D. 2.33 2.33Ohio 2.47 2.46Okla. 2.58 2.58Ore. 2.52 2.53Pa. 2.50 2.50R.I. 2.49 2.47S.C. 2.58 2.57S.D. 2.45 2.45Tenn. 2.55 2.55Texas 2.84 2.84Utah 3.17 3.16Vt. 2.37 2.34Va. 2.62 2.62Wash. 2.58 2.58W.Va. 2.44 2.45Wis. 2.44 2.43Wyo. 2.54 2.45D.C. 2.23 2.23
State 2013 2014
The Tax Foundation is the nation’s leading independent tax policy research organization. Our research and analysis is guided by the principles of sound tax policy:
SIMPLICITY: Administrative costs are a loss to society, and complicated taxation undermines voluntary compliance by creating incentives to shelter and disguise income. TRANSPARENCY: Tax legislation should be based on sound legislative procedures and careful analysis. A good tax system requires that taxpayers be informed and understand how tax assessment, collection, and compliance works. There should be open hearings, and revenue estimates should be fully explained and replicable.
NEUTRALITY: Taxes should not encourage or discourage certain economic decisions. The purpose of taxes is to raise needed revenue, not to favor or punish specific industries, activities, and products.
STABILITY: When tax laws are in constant flux, long-range financial planning is difficult. Lawmakers should avoid enacting temporary tax laws, including tax holidays and amnesties.
Visit taxfoundation.org for data, research, analysis, and commentary on important tax issues.
CONNECT: facebook.com/taxfoundation @taxfoundation linkedin.com/company/tax-foundation taxfoundation.org/subscribe
AVAILABLE IN APRIL 2016: The Facts & Figures App

AVAILABLE INAPRIL 2016
THE FACTS & FIGURES APPACCURATE DATA AT YOUR FINGERTIPS


