
Tourism in Sweden
Facts & statistics
2010
Effects of tourism on the economy, exports and employment and tourism volumes, behaviour and supply & demand

Additional copies of this publication may be ordered from www.tillvaxtverket.se/publikationer
© Swedish Agency for Economic and Regional GrowthStockholm, November 2011Print run: 500 copies; thereafter, print on demandAuthor: Peter Terpstra Production: Swedish Agency for Economic and Regional GrowthGraphic design: Ordförrådet ABPrinting: Danagårds Grafiska AB Info 0372ISBN: 978-91-86987-13-8
Contents
Tourism in Sweden 3
Challenges and development 4
Key figures 8
Effects of tourism on the economy 10
Export value of tourism 19
Effects of tourism on employment 24
International tourism 28
Tourism in Sweden 32
Domestic tourism 42
Inbound tourism 50
Outbound tourism 61
International meetings 67
Definitions and sources 69
3
Tourism in Sweden
The Swedish Agency for Economic and Regional Growth, the authority responsible for tourism industry issues, develops enterprise policies for the promotion of tourism initiatives and entrepreneurship. The Agency is also responsible for official tourism statistics and the production and dissemination of knowledge about the development of tourism and its effects on Swedish economy.
The global economy continued to strengthen in 2010 and this had a positive effect on travel. In Sweden, the total turnover for tourism rose by 3.2 percent to almost SEK 255 billion. Both employment and export value (foreign visitors’ consumption in Sweden) continued to rise, which helped to create growth in Sweden. According to international analyses, travel and tour-ism will achieve global annual growth of just over 5 percent between now and 2020. Sweden is well placed to take a share of this increase, as it has the basic resources – attractive desti-nations and facilities, and value-added natural environments and culture – that are needed to meet the expected demand from leisure and business travellers.
Many different parties are dependent on decision support data. Authorities, the business community, tourism organisa-tions, tourism consultants and research institutions often use the sources quoted in this publication in addition to their own investigations when analysing specific issues.
Tourism as an activity is a highly complex phenomenon, which often defies simple description. In this publication, travel and tourism are illustrated from many different per-spectives, such as the economy, employment, volumes, behav-iour and supply & demand. It is our aim that the data con-tained in Tourism in Swedish will contribute to increased knowledge and continuing development of the sector.
Stockholm, October 2011
Christina Lugnet Peter Terpstra Director General Tourism Analyst
T O U R I S M I N S W E D E N

4
Challenges and development
What is tourism?The UN’s internationally accepted definition describes tour-ism as the activities of persons travelling to and staying in places outside their usual environment for not more than one consecutive year for leisure, business or other purposes. The definition covers virtually all activities and consumption di-rectly connected with travel, including business travel.
It is the person who consumes and not what is produced that determines what is tourism. This is in contrast with tradition-al definitions of different sectors, industries and segments. The traditional definition of the airline industry, for example, is based on what the industry’s companies produce.
Although a large proportion of the activity within the air line industry is attributable to tourism, it is only 88 percent, as the other 12 percent relates to activities such as cargo handling and technical services. Similarly, only half of the activity with-in the hotel & restaurant sector counts as tourism. This is be-cause the remaining consumption, particularly in restaurants, is by the local population and is, by definition, not tourism. See also the definitions at the end of this publication.
Conceptualisation is a critical factor in the achievement of a strong information culture and effective knowledge develop-ment. It is hard to develop and work with tourism statistics and statistics-based information if the definitions and concep-tualisation are not distinct and taken on board by both the producer and user of the information.
C H A L L E N G E S A N D D E V E LO PM E N T

5
Why tourism?Not only does travel and tourism help to create understanding and build bridges between people from different places and cul-tures, it is also a trade-creating and wealth-building tool. Sus-tainable development of a wider range of natural and cultural activities, restaurants and attractions, can also create more at-tractive living environments. Travel and tourism provides in-come for many businesses and creates jobs. It also generates tax revenue and plays an essential part in the creation and develop-ment of a larger and more attractive infrastructure.
New primary industryTotal tourism turnover in Sweden rose by 3.2 percent to al-most SEK 255 billion in 2010. Almost 50 percent of this figure was attributable to domestic leisure travellers, while 17 percent was attributable to domestic business travellers and just over 34 percent to foreign visitors. Tourism’s export value, meas-ured as foreign visitors’ consumption in Sweden, increased by 1.7 percent to just over SEK 87 billion in 2010, which was over 50 percent more than the iron and steel exports and more than double the value of Swedish car exports.
Although the export value of the tourism industry makes a significant contribution to the Swedish economy, the indus-try’s ability to boost employment has also been a key develop-ment in recent years. Tourism is also able to create jobs for young people and has a need for the skills offered by people with foreign backgrounds. While employment in many tradi-tional primary industries in Sweden has declined, tourism has created 31,300 new jobs since 2000. In 2010, there were over 162,000 jobs in the tourism industry.
Competitiveness and attractivenessCompetitiveness is widely perceived as something that is cre-ated from within companies. However, where tourism is con-cerned another decisive factor comes into play, namely the at-tractiveness of the location or activity in question. The interaction of companies and attractiveness represents a key success factor.
C H A L L E N G E S A N D D E V E LO PM E N T

6
Attractiveness is the sum of everything that characterises a particular location or activity – its natural and cultural envi-ronment, events, hosting venues, infrastructure and so on. Consequently, cooperation between many different players must be developed in order to generate effective competitive-ness. In addition to companies in different sectors, public or-ganisations are particularly relevant players, as they have a much more important and active role in tourism than in other more traditional sectors.
Coordinating public initiativesIn its capacity as the owner and manager of many attraction resources, such as national parks, historic monuments and in-frastructure, the public sector has a significant influence on the tourism industry’s growth potential. Tourism is also af-fected by numerous decisions, regulations and conditions in a wide range of other sectors and political spheres. Substantial resources are also allocated to direct and indirect promotion of the travel & tourism industry in a number of different sec-tors at both national and regional levels.
The aim of the Swedish tourism policy is that Sweden shall be a highly attractive tourist destination with competitive long-term tourism, contributing to sustainable growth and increased employment throughout the country. In order to achieve these goals, a common strategy must be adopted, as well as effective cross-sectoral coordination of initiatives by government agen-cies that do not specialise in tourism, but whose activities are of importance to the development of tourism, or vice versa.
Knowledge and statistics are key success factorsAs awareness of the importance of tourism increases, public and private players are showing more interest in getting in-volved in this area. In addition to public and private input, the tourism policy imposes specific requirements regarding meas-urement of the importance and development of tourism, as the effects are seldom or never seen in existing production sta-tistics. Neither public nor private initiatives can contribute to success if it is not based on knowledge. Knowledge is needed in the form of statistics and studies, in order to assess whether
C H A L L E N G E S A N D D E V E LO PM E N T

7
initiatives are having an impact, and to allow effective market-ing, product and destination development.
There is also a need to strengthen research in this area. It is still the case that many public R & D programmes and other initiatives mainly target traditional manufacturing industries, which also means there is considerable scope for improve-ment.1
The export value of tourism, i.e., foreign visitors’ consumption in Sweden, makes an important contribution to the Swedish economy. With a domestic market of just over nine million inhabitants, the anticipated growth will be dependent on for-eign markets. A continuous border survey to measure vol-umes, visitor preferences and consumption patterns will en-sure effective product development and marketing of Sweden as a destination. To this end, data collection for a new national border survey began in 2011.
Global challengeGlobal tourism’s main challenge for the future is how to achieve environmentally sustainable development. As tourism is by its very nature international, solutions for more eco-friendly travel must be sought within the framework of inter-national cooperation and regulations. It is not enough to rely on changes in traveller demand to set tourism development on the right track. The sector’s operators also have a large individ-ual responsibility for adapting their offerings. Airlines, ship-ping companies, coach companies and car rental companies can drive development forward by setting strict requirements for their own suppliers, and in doing so protect their own in-terests.
1 Tillväxtfakta/Growth facts 2010, Swedish Agency for Growth Policy Analysis and Swedish Agency for Economic and Regional Growth
C H A L L E N G E S A N D D E V E LO PM E N T
8
Key figures
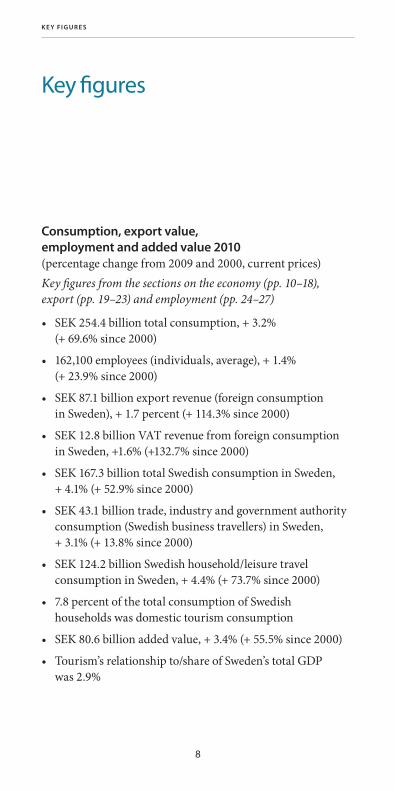
Consumption, export value, employment and added value 2010(percentage change from 2009 and 2000, current prices)Key figures from the sections on the economy (pp. 10–18), export (pp. 19–23) and employment (pp. 24–27)
• SEK 254.4 billion total consumption, + 3.2% (+ 69.6% since 2000)
• 162,100 employees (individuals, average), + 1.4% (+ 23.9% since 2000)
• SEK 87.1 billion export revenue (foreign consumption in Sweden), + 1.7 percent (+ 114.3% since 2000)
• SEK 12.8 billion VAT revenue from foreign consumption in Sweden, +1.6% (+132.7% since 2000)
• SEK 167.3 billion total Swedish consumption in Sweden, + 4.1% (+ 52.9% since 2000)
• SEK 43.1 billion trade, industry and government authority consumption (Swedish business travellers) in Sweden, + 3.1% (+ 13.8% since 2000)
• SEK 124.2 billion Swedish household/leisure travel consumption in Sweden, + 4.4% (+ 73.7% since 2000)
• 7.8 percent of the total consumption of Swedish households was domestic tourism consumption
• SEK 80.6 billion added value, + 3.4% (+ 55.5% since 2000)
• Tourism’s relationship to/share of Sweden’s total GDP was 2.9%
K E Y F I G U R E S
9
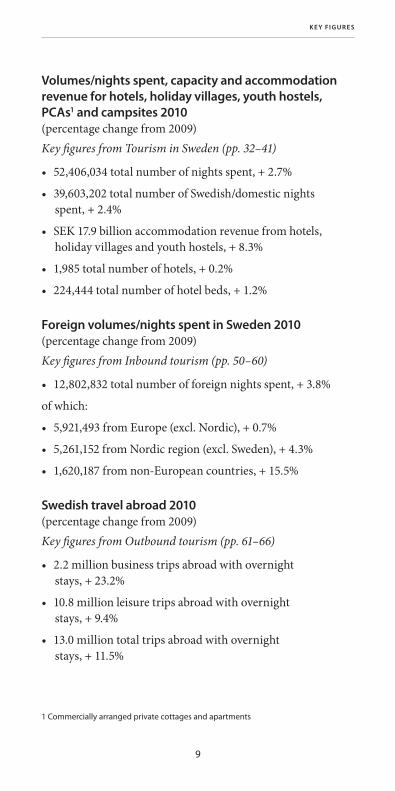
Volumes/nights spent, capacity and accommodation revenue for hotels, holiday villages, youth hostels, PCAs1 and campsites 2010(percentage change from 2009)Key figures from Tourism in Sweden (pp. 32–41)
• 52,406,034 total number of nights spent, + 2.7%
• 39,603,202 total number of Swedish/domestic nights spent, + 2.4%
• SEK 17.9 billion accommodation revenue from hotels, holiday villages and youth hostels, + 8.3%
• 1,985 total number of hotels, + 0.2%
• 224,444 total number of hotel beds, + 1.2%
Foreign volumes/nights spent in Sweden 2010(percentage change from 2009)Key figures from Inbound tourism (pp. 50–60)
• 12,802,832 total number of foreign nights spent, + 3.8%
of which:
• 5,921,493 from Europe (excl. Nordic), + 0.7%
• 5,261,152 from Nordic region (excl. Sweden), + 4.3%
• 1,620,187 from non-European countries, + 15.5%
Swedish travel abroad 2010(percentage change from 2009)Key figures from Outbound tourism (pp. 61–66)
• 2.2 million business trips abroad with overnight stays, + 23.2%
• 10.8 million leisure trips abroad with overnight stays, + 9.4%
• 13.0 million total trips abroad with overnight stays, + 11.5%
1 Commercially arranged private cottages and apartments
K E Y F I G U R E S

10
Annual figures for Swedish tourism Key figures 2000–2010 (current prices, SEK millions)
Tota
l tou
rism
co
nsu
mp
tion
in
Sw
eden
Swed
ish
tour
ism
co
nsu
mp
tion
in
Swed
en
Fore
ign
con
sum
pti
on
in S
wed
en (e
xpor
t)
Ad
ded
val
ue
Emp
loye
d in
tour
ism
(in
div
idua
ls, a
vera
ge)
Shar
e of
tota
l GD
P, %
2000 150 019 109 387 40 632 51 798 130 800 2.7
2001 165 360 118 015 47 344 55 318 138 700 2.8
2002 171 147 121 707 49 441 58 517 136 900 2.8
2003 169 826 124 958 44 867 59 906 132 500 2.8
2004 175 636 126 794 48 841 60 709 130 100 2.7
2005 191 927 135 459 56 469 62 925 131 100 2.7
2006 213 547 145 444 68 104 69 604 140 200 2.8
2007 222 358 146 544 75 814 72 142 143 900 2.7
2008 239 081 157 736 81 345 76 120 150 600 2.8
2009* 246 400 160 781 85 620 77 894 159 900 3.0
2010* 254 371 167 299 87 073 80 561 162 100 2.9
10/09, % 3.2 4.1 1.7 3.4 1.4
10/00, % 69.6 52.9 114.3 55.5 23.9
* Preliminary information Source: Swedish Agency for Economic and Regional Growth/Statistics Sweden
Effects of tourism on the economy
The information in the sections dealing with effects of tourism on the economy, export value and employment is based on data from the Tourism Satellite Account for Sweden (see infor-mation box on page 27), unless otherwise stated.
Increase in tourism consumption in Sweden 2010Total tourism consumption in Sweden rose by 3.2 percent in 2010. Total tourism consumption in Sweden has increased by almost 70 percent since 2000 based on current prices. Over the same period, the export value (i.e., the value of foreign visitors’
E FFE C T S O F T O U R I S M O N T H E E CO N O M Y

11
consumption in Sweden) has increased by almost 115 percent or an average of 8.2 percent per annum at current prices.
Export value’s share of the total consumption has increased from approx. 27 to just over 34 percent since 2000. Added val-ue and the number employed in tourism have also increased since 2000. Tourism’s relationship to/share of Sweden’s total GDP has fluctuated between 2.7 and 3.0 percent since 2000, which is a relatively constant level in comparison with the overall economy. However, changes in other areas of the econ-omy affect tourism’s GDP share more than fluctuations within the tourism industry itself.
Tourism generates significant revenuesIn 2010, foreign visitors spent over SEK 87 billion, while Swed-ish leisure and business travellers spent over SEK 167 billion in Sweden. The illustration below shows the sectoral distribution. Goods represented the largest category of tourist expenditure, with a share of approx. 40 percent and revenue of over SEK 102 billion. This was followed by accommodation and restau-
Source: Swedish Agency for Economic and Regional Growth/Statistics Sweden
Distribution of tourism consumption in Sweden2010 (SEK billions) with percentage change from 2009
� Accommodation, 41.4 (+3.7)� Restaurants, 35.1 (+4.3)
� Culture/recreation, 14.5 (+0.0)� Other services, 7.5 (–5.1)
� Air travel, 23.4 (+5.3)� Travel agencies, 10.1 (+21.0)� Overland travel, 9.4 (+0.6)� Car hire, 4.3 (+8.3)� Rail travel, 3.3 (+5.0)� Sea travel, 3.0 (–0.8)
� Other goods, 49.7 (+1.2)
� Provisions, 26.3 (+1.4)� Fuel, 26.3 (+1.1)
Accommodation & restaurants76.5 (+5.0)
Transport53.6 (+6.9)
Retail (goods)102.3 (+1.2)
Culture & services22.0 (–1.8)
Foreignvisitors
87.1 (+1.7)
Swedish leisuretravellers
124.2 (+4.4)
TOURISM IN SWEDEN 254.4 (+3.2)
Swedish businesstravellers 43.1 (+3.1)
E FFE C T S O F T O U R I S M O N T H E E CO N O M Y

12
rants, which achieved revenue of SEK 76.5 billion or approx. 30 percent of the total. Revenue from the transport sector (e.g., air and train tickets, rental cars) amounted to SEK 54 billion, or just over 21 percent. With a turnover of almost SEK 15 bil-lion, culture and recreation is one of the smallest sectors, but is also one of the sectors experiencing the fastest growth. Val-ue-added culture and nature are also sectors contributing to the attraction factor that drives growth in travel and boosts growth in other sectors too. Swedish travellers accounted for just over 65 percent of total consumption, the majority of which (approx. 75 percent) was attributable to leisure travel-lers. Export value (foreign visitors’ consumption) represented approx. 35 percent of total consumption.
Strong growth for tourism since 2000Total tourism turnover in Sweden has increased by almost 70 percent since 2000 based on current prices. Expressed in fixed prices (taking into account inflation), the increase was approx. 45 percent.
Foreign consumption in Sweden has increased more than twice as much as domestic consumptionTotal turnover for Swedish tourism has increased by almost 70 percent since 2000, with domestic tourism consumption in Sweden having risen by 53 percent based on current prices. Over the same period, export value, i.e. foreign visitors’ con-sumption in Sweden, has increased by more than twice as much (almost 115 percent) based on current prices.
Development of total turnover for tourism in Sweden (SEK billions)
Source: Swedish Agency for Economic and Regional Growth/Statistics Sweden
Current prices2000 prices
150
175
200
225
250
20102009200820072006200520042003200220012000
E FFE C T S O F T O U R I S M O N T H E E CO N O M Y

13
Leisure travellers spent more and business travellers lessSwedish leisure travellers accounted for almost three-quarters of the total domestic tourism consumption in Sweden. Leisure travellers’ share of the domestic tourism consumption has in-creased from 65 percent to almost 75 percent since 2000. Dur-ing the same period, business travellers’ share has fallen from 35 to 25 percent. The financial crisis and recession were the main reasons why business travellers’ consumption fell by ap-prox. SEK 2 billion in 2009. Business travel consumption rose again in 2010, by just over three percent or SEK 1.3 billion, but is still not back at the same level as in 2008. Business travel con-sumption has increased by almost 14 percent since 2000 based on current prices. However, measured at 2000 prices, business travel consumption was static. Leisure travel consumption in-creased by SEK 5.2 billion or 4.4 percent in 2010. Since 2000,
Tourism consumption in Sweden (current prices, SEK billions)
Source: Swedish Agency for Economic and Regional Growth/Statistics Sweden
Total tourism consumptionSwedish/domestic consumptionExport value (foreign consumption in Sweden)
0
50
100
150
200
250
20102009200820072006200520042003200220012000
Swedish/domestic tourism consumption in Sweden (current prices, SEK billions)
Source: Swedish Agency for Economic and Regional Growth/Statistics Sweden
Swedish leisure travellersSwedish business travellers(trade, industry & authorities)
0
20
40
60
80
100
120
20102009200820072006200520042003200220012000
E FFE C T S O F T O U R I S M O N T H E E CO N O M Y

14
private tourism consumption has increased by approx. 74 per-cent at current prices or almost 50 percent at 2000 prices.
Tourism consumption by Swedish households increasing more than households’ total consumptionPrivate tourism consumption by Swedish households has in-creased by approx. 74 percent since 2000. Over the same peri-od, households’ total consumption increased by almost 44 percent at current prices. However, between 2009 and 2010, households’ total consumption rose a little more than domes-tic tourism consumption. Households’ tourism consumption in Sweden has increased its share of total household consump-tion of goods and services in Sweden from 6.4 percent to 7.8 percent since 2000.
Goods purchases largest single expenditure item for travellersSwedish and foreign leisure and business travellers spent over SEK 254.4 billion in Sweden, of which just over 40 percent was on the purchase of goods e.g., shopping, food and fuel. Accommodation accounted for just over 16 percent of total consumption, while eating out accounted for 14 percent. For-eign visitors spent more on goods than did Swedish travellers. Goods purchases accounted for almost half of foreign visitors’ consumption, with a high proportion of cross-border trade. The share of goods purchases for Swedish leisure travellers was just under 30 percent. Foreign visitors’ expenditure in restau-rants was also a little higher than that of their Swedish coun-
Index for household tourism consumption in Sweden in relation to total household consumption (current prices). Index 2000 = 100.
Source: Swedish Agency for Economic and Regional Growth/Statistics Sweden
Tourism consumptionTotal consumption
100
120
140
160
180
20102009200820072006200520042003200220012000
E FFE C T S O F T O U R I S M O N T H E E CO N O M Y

15
terparts. Almost 17 percent of foreign visitors’ consumption was on eating out, while the equivalent figure for domestic lei-sure and business travellers was just under 14 percent. For Swedish business travellers, commercial accommodation rep-resented a considerably high proportion of consumption, while Swedish leisure travellers accounted for a high propor-tion of expenditure on private holiday cottages.
Source: Swedish Agency for Economic and Regional Growth/Statistics Sweden
Distribution of consumption for di�erent sectors 2010 (SEK billions)
0 10 20 30 40 50
Sea travel
Rail travel
Other overland travel
Car hire
Taxis
Other services
Travel agency services
Culture, recreation
Air travel
Fuel
Restaurant meals
Accommodation
Goods
Leisure travellers/Swedish households Business travellers/trade, industry & auth. Export/foreign visitors
High proportion of goods purchases for foreign visitorsOn average, foreign visitors spent considerably more on goods than did Swedish travellers in Sweden during 2010.
Foreign visitors’ expenditure on culture and recreation was also a little higher than that of their Swedish counterparts. However, the proportion of expenditure on travel and trans-port for foreign visitors in Sweden was lower than that of Swedish travellers.
E FFE C T S O F T O U R I S M O N T H E E CO N O M Y

16
Tourism most important to travel agencies and tour operatorsMost sectors are affected in some way by tourism. It is most important to travel agencies and tour operators, where tour-ism represents 100 percent of the added value. Airlines are next, with 88 percent, while the corresponding figure for the retail sector (goods) is approx. 6 percent. However, the retail sector, with just over SEK 19 billion, had the second highest added value in 2010.
At just over SEK 21 billion, the hotel & restaurant sector had the highest added value. The reason why tourism’s share of the hotel & restaurant sector was only 50 percent of the added val-ue is that a large proportion of consumption at restaurants was by the local population whose activities are not classified as tourism. In order to calculate the added value, i.e., produc-tion value minus consumption value, tourists’ expenditure is combined with production statistics from Statistics Sweden (SCB).
Source: Swedish Agency for Economic and Regional Growth/Statistics Sweden
Distribution of Swedish/domestic consumption by type of expenditure in Sweden 2010
Accommodation and restaurants, 34% Travel and transport, 26% Culture, recreation, 5% Goods, 20%Fuel, 11% Other services, 3%
Source: Swedish Agency for Economic and Regional Growth/Statistics Sweden
Distribution of foreign visitors' consumption by type of expenditure in Sweden 2010
Accommodation & restaurants, 22% Travel & transport, 12% Culture, recreation, 7% Goods, 48%Fuel, 9%Other services, 2%
E FFE C T S O F T O U R I S M O N T H E E CO N O M Y

17
Source: Swedish Agency for Economic and Regional Growth/Statistics Sweden
Tourism’s added value in Sweden (current prices, SEK billions)
50
55
60
65
70
75
80
85
20102009200820072006200520042003200220012000
77.980.6
76.1
72.1
69.6
62.960.7
59.958.5
55.3
51.8
Tourism’s production and added valueTourism’s total production value for 2010 was SEK 176 billion. Hotels & restaurants had the highest production value (SEK 52.8 billion), followed by goods (SEK 32.5 billion), and air travel (SEK 23.4 billion). Total added value for the Swedish tourism industry has risen from SEK 51.8 billion to SEK 80.6 billion since 2000. This is an increase of just over 55 percent at current prices.
Source: Swedish Agency for Economic and Regional Growth/Statistics Sweden
Total added value and tourism’s share for di erent sectors 2010 (SEK billions)
0 50 100 150 200 250 300 350
Sea travel
Rail travel
Rental
Other services
Travel agencies,tour operators
Other overland travel
Air travel
Culture, recreation, service companies
Private holiday cottages
Goods
Hotels & restaurants
Tourism’s share of added value 10%
19%
13%
4%
100%
17%
88%
11%
10%
6%
49%
E FFE C T S O F T O U R I S M O N T H E E CO N O M Y
18
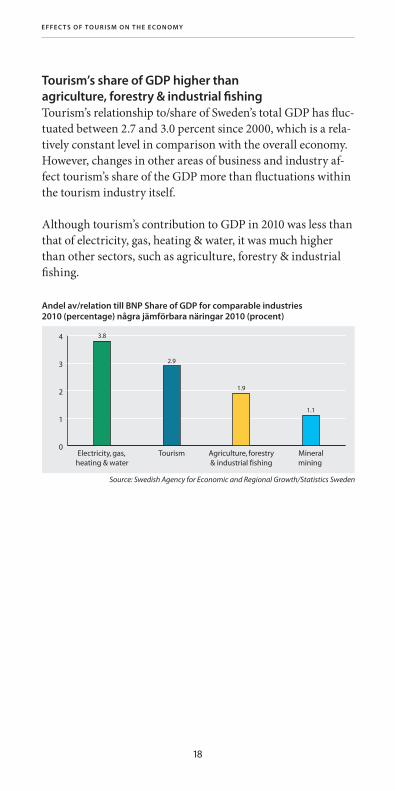
Tourism’s share of GDP higher than agriculture, forestry & industrial fishingTourism’s relationship to/share of Sweden’s total GDP has fluc-tuated between 2.7 and 3.0 percent since 2000, which is a rela-tively constant level in comparison with the overall economy. However, changes in other areas of business and industry af-fect tourism’s share of the GDP more than fluctuations within the tourism industry itself.
Although tourism’s contribution to GDP in 2010 was less than that of electricity, gas, heating & water, it was much higher than other sectors, such as agriculture, forestry & industrial fishing.
Source: Swedish Agency for Economic and Regional Growth/Statistics Sweden
Andel av/relation till BNP Share of GDP for comparable industries 2010 (percentage) några jämförbara näringar 2010 (procent)
0
1
2
3
4
Mineralmining
Agriculture, forestry& industrial fishing
TourismElectricity, gas, heating & water
1.1
1.9
2.9
3.8
E FFE C T S O F T O U R I S M O N T H E E CO N O M Y

19
Export value of tourism
Tourism’s export value higher than for many key product areasExpenditure by a person travelling from one country to an-other generates both an import and export value. Expenditure by Swedes abroad is the equivalent of imports, while expendi-ture by foreign visitors to Sweden is the equivalent of exports, as it creates an inward flow of foreign currency into Sweden. International tourism in Sweden may therefore be considered to be an export sector like any other goods or service export-ing sector. Tourism’s share of total Swedish exports in 2010 was higher than for many important product areas. Tourism’s export value increased by 1.7 percent to just over SEK 87 bil-lion during 2010, which was over 50 percent more than the iron and steel exports (SEK 57.1 billion) and more than double the value of Swedish car exports (SEK 38.4 billion).
Source: Swedish Agency for Economic and Regional Growth/Statistics Sweden
Tourism’s export value (foreign consumption in Sweden) and export values for some important product areas in Sweden in 2010 (SEK billions)
0
20
40
60
80
100
FurnitureWood productsCarsFoodIron & steel Tourism
16.3
32.138.4
45.2
57.1
87.1
E X P O R T VA LU E O F T O U R I S M

20
Tourism’s export value rising faster than total Swedish exportsAfter a sharp decline in 2009 (-12.8%), Sweden’s total exports of goods and services rose again in 2010 (+10.3%). This was a much higher increase than tourism’s export value, which rose by 1.7 percent in 2010. However, between 2008 and 2010, tour-ism’s export value increased by approx. 7 percent, while Swe-den’s total exports declined by approx. 3.9 percent. In a longer perspective, growth for Sweden’s total exports has been very good, increasing by approx. 56 percent since 2000. Over the same period, tourism’s export value, i.e., foreign visitors’ con-sumption in Sweden, has increased by more than twice as much (almost 115 percent) based on current prices.
Index for tourism’s export value compared with Sweden’s total exports (goods and services), current prices. Index 2000 = 100.
Source: Swedish Agency for Economic and Regional Growth/Statistics Sweden
Tourism's export value (foreign consumption in Sweden)Sweden's total exports (goods & services)
100
120
140
160
180
200
220
20102009200820072006200520042003200220012000
Tourism Iron & steel Food Cars Wood products Furniture
Source: Swedish Agency for Economic and Regional Growth/Statistics Sweden
Tourism’s export value (foreign consumption in Sweden) and export values for some important product areas (current prices, SEK billions)
0
20
40
60
80
100
201020092008200720062005
E X P O R T VA LU E O F T O U R I S M

21
Tourism’s share of total exports is increasingTourism’s export value (foreign consumption in Sweden) has more than doubled since 2000, while tourism’s export value as a percentage of Sweden’s total exports of goods and services has risen from 3.9 to 5.3 percent.
VAT revenue from foreign visitors’ consumption in Sweden (current prices, SEK billions)
Source: Swedish Agency for Economic and Regional Growth/Statistics Sweden
0
3
6
9
12
15
20102009200820072006200520042003200220012000
12.6 12.811.8
10.99.9
8.0
6.66.16.76.5
5.5
Tourism’s export value as a percentage of Sweden’s total exports (goods and services)
Source: Swedish Agency for Economic and Regional Growth/Statistics Sweden
0
2
4
6
8
20102009200820072006200520042003200220012000
5.7%5.3%
4.7%4.7%4.5%4.2%4.0%4.1%4.6%4.4%
3.9%
Tourism is the only export sector delivering direct VAT revenue to the TreasuryVAT on foreign visitors’ consumption in Sweden was SEK 12.8 billion in 2010, an increase of approx. SEK 7.3 billion or over 130 percent since 2000.
E X P O R T VA LU E O F T O U R I S M

22
Import value for travel expenditure in the balance of payments increased more than export valueIn 2010, the export value for travel expenditure in the balance of payments, i.e., what foreign visitors bought Swedish curren-cy for, increased by SEK 1.4 billion to SEK 79.9 billion. At the same time, the import value (total of foreign currency pur-chased by Swedes for travel abroad) rose by SEK 5.4 billion, which meant the travel expenditure deficit increased from SEK 12.7 billion in 2009 to SEK 16.7 billion in 2010. However, there has been a marked change in the relationship between the import and export value since 1993. In 1993, the import value (purchase of foreign currency) was almost 70 percent higher than the export value (purchase of Swedish currency). Since then, the gap has shrunk and the import value is now down to just over 20 percent higher than the export value.
Source: Swedish Central Bank/Statistics Sweden
Travel expenditure development (current prices, SEK billions)
-40
0
40
80
120
100908070605040302010099989796959493
Imports (Swedish expenditure abroad) Exports (Foreign expenditure in Sweden)
Net travel expenditure
E X P O R T VA LU E O F T O U R I S M

23
Travel expenditure in the balance of payments Statistics Sweden produces quarterly statistics on travel ex-penditure on behalf of the Swedish Central Bank. The travel expenditure statistics include the purchase and sale of curren-cies. The purchase of Swedish currency creates an export val-ue, while the purchase of foreign currency creates an import value. Amounts spent by Swedes on trips abroad represent im-ports and amounts spent by foreign visitors to Sweden repre-sent exports. Foreign tourism in Sweden may therefore be con-sidered to be an export sector like any other goods or service exporting sector. In addition to travellers’ direct spending, travel expenditure statistics also include items such as currency speculation, re-exchanging of currency and online shopping. The Swedish Central Bank makes adjustments for some of these items.
The export value for travel expenditure in the balance of pay-ments is less than the total export value for tourism (SEK 87 billion in 2010) because the import and export values for pas-senger transport are not included in travel expenditure in the balance of payments.
E X P O R T VA LU E O F T O U R I S M

24
Effects of tourism on employment
Tourism contributes to increased employmentMeasured as the average number of employees, the number of people working in tourism has increased by approx. 24 per-cent since 2000.
More employees in tourism than in many large companies put togetherThe number of persons employed as a result of tourism in Sweden in 2010 exceeded the number of employees in Sweden in the following major companies: Volvo AB and subsidiaries, Ericsson, Volvo Cars, Peab, Scania, Sandvik, Saab (Group), Skanska, ABB Norden, Vattenfall, TeliaSonera, AstraZeneca, Mölnlycke, SCA and Bravida, which together employed more than 160,000 people in 2010.
Average number of employees in tourism in SwedenAverage number of employees in Sweden, overall
Source: Swedish Agency for Economic and Regional Growth/Statistics Sweden
Index for tourism employment trend in comparison with overall employment trend in Sweden. Index 2000 = 100
90
100
110
120
130
20102009200820072006200520042003200220012000
E FFE C T S O F T O U R I S M O N E M P LOY M E N T

25
Highest tourism employment in hotels & restaurantsThe hotel & restaurant sector had the highest share of tourism employment in 2010, with 75,300 (just over 45 percent) of the tourism industry’s total 162,100 employees. The second-largest sector was the combined travel and transport sector (travel agencies and all transport providers), which employed 33,200 individuals (20 percent), while the retail sector (goods) was not far behind with almost 31,800.
Swedish tourism Volvo AB and subsidiariesEricssonVolvo CarsPeabScaniaSandvikSaab (Group)SkanskaABB NordenVattenfallTeliaSoneraAstraZenecaMölnlyckeSCABravida
Source: Swedish Agency for Economic and Regional Growth/Statistics Sweden and the companies
Comparison of numbers employed in Sweden 2010
0
50,000
100,000
150,000
200,000
162,100 160,822
Tourism employment in hotels and restaurants shows highest growthSince 2000, the employment generated by tourism within the hotel and restaurant sector has shown the highest growth. 24,600 new jobs have been created, an increase of just over 48
Source: Swedish Agency for Economic and Regional Growth/Statistics Sweden
Number of employees (individuals, average) in different tourism sectors 2010
0 20,000 40,000 60,000 80,000
OtherSea travel
RentalRail travels
Air travelOther services
Other overland travelTravel agencies
Culture, recreation, sportGoods
Hotels & restaurants
500
1 200
1 500
1 800
6 200
7 500
10 800
11 700
13 800
31 800 75 300
E FFE C T S O F T O U R I S M O N E M P LOY M E N T

26
percent. The retail sector (goods) has gained 9,800 new jobs as a result of increased tourism. The culture and recreation sec-tor has also experienced tourism employment growth, with 4,800 new jobs. However, tourism employment has shown a negative trend in the transport sector (-14%) and the travel agency sector (-13%), corresponding to a decline of 5,100 jobs since 2000.
Employment declining in many primary industries, but rising in tourismWhile employment in many of Sweden’s traditional primary industries has declined, tourism has supplied over 31,000 new jobs since 2000. Over the same period, the number of hours worked in agriculture, forestry & industrial fishing has fallen by almost 20 percent, and this sector has trailed tourism in terms of hours worked since 2006.
Source: Swedish Agency for Economic and Regional Growth/Statistics Sweden
Development of numbers of employed (individuals, average) with tourism within different sectors
0
20,000
40,000
60,000
80,000
20102009200820072006200520042003200220012000
Hotels & restaurants
Goods
Culture & recreation
Transport
Travel agencies
E FFE C T S O F T O U R I S M O N E M P LOY M E N T

27
Source: Swedish Agency for Economic and Regional Growth/Statistics Sweden
Index for hours worked within tourism compared with some other key industries. Index 2000 = 100
80
90
100
110
120
20102009200820072006200520042003200220012000
Tourism
Product manufacturers
Agriculture, forestry & shing
Credit agencies and insurers
Engineering
Satellite account measures the impact of tourism on the economy and employmentSweden has adopted the United Nations’ internationally ac-cepted definition of tourism. Since 2000, the effects of tourism on the economy, export value and employment in Sweden have been measured using what are known as satellite account calculations, which collate the share of consumption coming from tourism in the different sectors in the national accounts. The satellite account measures the value of Swedish and for-eign travellers’ direct consumption of Swedish goods and serv-ices. The method for satellite account calculation, the Tourism Satellite Account (TSA), is an internationally accepted method which has been developed by the UN World Tourism Organiza-tion (UNWTO) in collaboration with the OECD and travel and tourism bodies. In Sweden, calculations are carried out for the Swedish Agency for Economic and Regional Growth by the Na-tional Accounts at Statistics Sweden (SCB). Like other national accounts, the time series are revised annually and previous time series are not therefore always comparable with the latest published data.
E FFE C T S O F T O U R I S M O N E M P LOY M E N T

28
International tourism
Sweden increasing more than rest of EuropeAccording to the UN World Tourism Organization (UN-WTO), worldwide international travel has increased by more than 110 percent since 1991. In recent years, significant growth in the Middle East and Asia has accounted for much of the global increase. In Europe, the increase has been almost 80 percent. Foreign tourism in Sweden, measured as the number of foreign nights spent, has grown by over 120 percent during the same period. This means that, as a destination, Sweden’s growth is the same as or better than the rest of the world, and considerably better than the rest of Europe. The fi-nancial crisis and recession were behind a 4-percent decline in global travel in 2009. Global travel showed a recovery in 2010, with growth of 6.6 percent. After a sharp decline of five per-cent in 2009, there was an increase of 3.5 percent in travel to and in Europe in 2010.
Source: Swedish Agency for Economic and Regional Growth/Statistics Sweden, UNWTO
Index for worldwide trips with at least one overnight stay (UNWTO) and nights spent by foreign visitors at hotels, holiday villages and youth hostels in Sweden (Swedish Agency for Economic and Regional Growth/Statistics Sweden). Index 1991=100
100
120
140
160
180
200
220
1009080706050403020100999897969594939291
SwedenWorldEurope
I N T E R N AT I O N A L T O U R I S M

29
World Tourism Organization predicts continuing growthAlthough global tourism trends have been somewhat irregular in recent years, the United Nations World Tourism Organiza-tion (UNWTO) is maintaining its long-term forecast for in-ternational travel contained in Tourism 2020 Vision, but is in the process of producing a new vision titled Tourism Towards 2030.
In its current vision, UNWTO predicts that international travel will rise globally by approx. 70 percent to a total of 1.6 billion trips by 2020. The corresponding increase in travel to and in Europe is expected to be just over 50 percent, reaching a total of 717 million trips by 2020. As shown above, Sweden has followed international volume trends since the early 1990s and has achieved volume growth on par with or better than the rest of the world and Europe.
Middle East and Asia growing faster than rest of the worldGlobal travel increased by 6.6 percent in 2010. Travel to and within all parts of the world increased, although the growing economies of the Middle East and Asia accounted for the larg-est increases. According to UNWTO, this is a trend that is ex-pected to continue in the future. Asia’s share of global travel will have increased to just over 25 percent by 2020, while Eu-rope’s share is expected to fall from just over 50 percent to ap-prox. 45 percent by 2020.
Source: UNWTO
World Tourism Organization’s Tourism 2020 Vision. Number of international arrivals (millions)
0
200
400
600
800
1,000
1,200
1,400
1,600
20202010200019901980197019601950
South Asia Middle East AfricaEast Asia/PacificAmericasEurope
I N T E R N AT I O N A L T O U R I S M

30
Recovery for travel in most parts of Europe in 2010As illustrated in the first diagram in this chapter, travel to and in Europe declined by approx. 5 percent in 2009. According to UNWTO’s preliminary calculations, travel recovered in much of Europe in 2010. However, total volumes in northern Europe remained at the same levels as in 2009. This is because travel to the UK and Ireland (included in UNWTO’s figures for northern Europe) continued to decline in 2010. In France, Spain and Italy, ranking among the top destinations in the world and the top destinations in Europe, the recovery was not as strong as for certain destinations in Central and West-ern Europe, which showed average growth of 4.2 and 5.1 per-cent in 2010.
Source: UNWTO
Distribution of international arrivals with overnight stays by continent/region 2010, with volume change from 2009, percent
Europe, 51 (+3.5)Asia/Pacic, 22 (+13.0) America,16 (+7.0)Africa, 5 (+6.0) Middle East, 6 (+14.0)
Source: UNWTO and Swedish Agency for Economic and Regional Growth/Statistics Sweden
International comparison of inbound tourism in Europe (percentage change between 2009 and 2010)
-2 0 2 4 6 8 10 12
UK
Northern Europe
Italy
Spain
Southern Europe
France
Finland
Europe
Austria
Sweden
Central Europe
Western Europe
Turkey
Hungary
Norway
Netherlands
Germany
-0.5
-0.1
0.0
+1.4
+2.0
+2.8
+3.3
+3.5
+3.5
+3.8
+4.2
+5.1
+5.8
+7.2
+8.9
+11.0
+11.8
I N T E R N AT I O N A L T O U R I S M
31
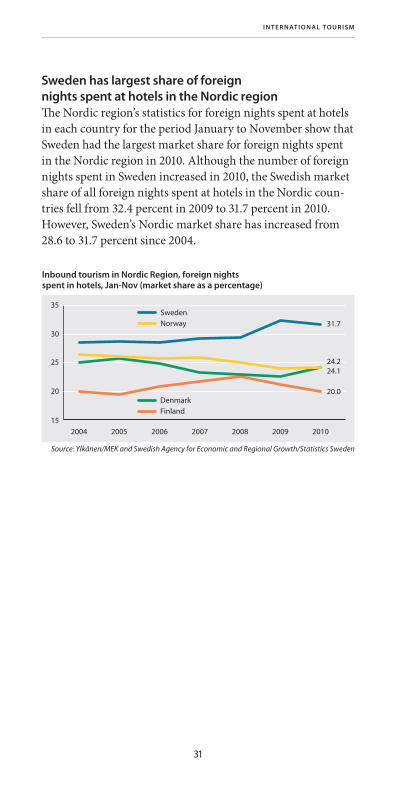
Sweden has largest share of foreign nights spent at hotels in the Nordic regionThe Nordic region’s statistics for foreign nights spent at hotels in each country for the period January to November show that Sweden had the largest market share for foreign nights spent in the Nordic region in 2010. Although the number of foreign nights spent in Sweden increased in 2010, the Swedish market share of all foreign nights spent at hotels in the Nordic coun-tries fell from 32.4 percent in 2009 to 31.7 percent in 2010. However, Sweden’s Nordic market share has increased from 28.6 to 31.7 percent since 2004.
DenmarkFinland
Source: Ylkänen/MEK and Swedish Agency for Economic and Regional Growth/Statistics Sweden
Inbound tourism in Nordic Region, foreign nights spent in hotels, Jan-Nov (market share as a percentage)
15
20
25
30
35
2010200920082007200620052004
SwedenNorway 31.7
24.224.1
20.0
I N T E R N AT I O N A L T O U R I S M

32
Tourism in Sweden
Steady increase in volumesThe number of nights spent at Swedish hotels, holiday villages, youth hostels, campsites and in commercially arranged private cottages and apartments in 2010 rose to 52.4 million, which is an increase of 2.7 percent. These are the highest volumes ever recorded. It was the foreign market, i.e., foreign nights spent, which showed the highest growth, with an increase of 3.8 per-cent. Domestic nights spent rose by 2.4 percent in 2010. See page 60 for facts about the accommodation statistics.
Fastest growth for volumes from abroadThe total number of nights spent in hotels, holiday villages and youth hostels has risen by over 43 percent since 1995. The increase for the domestic market was a little lower, at just over 37 percent. Growth for the foreign market was over 65 per-cent, and the foreign share of total volumes for hotels, holiday villages and youth hostels rose from 20.1 to 23.2 percent dur-ing the period.
Source: Swedish Agency for Economic andRegional Growth/Statistics Sweden
Nights spent at hotels, holiday villages, youth hostels,PCAs* and campsites by market area (thousands)
0
10,000
20,000
30,000
40,000
50,000
60,000
201020092008
Total
Swedish/domestic
Foreign/inbound
50,097
38,133
11,964
51,011
38,681
12,330
52,406+ 2.7%
39,603+2.4%
12,803+3.8%
* Commercially arranged private cottages and apartments
T O U R I S M I N S W E D E N

33
Highest volumes in Dalarna and mayor city areasThe majority of regions experienced volume increases in 2010. The largest numbers of nights spent were in the three main
InboundDomestic
Source: Swedish Agency for Economic and Regional Growth/Statistics Sweden
Nights spent at hotels, holiday villages and youth hostels (thousands)
0
5,000
10,000
15,000
20,000
25,000
30,000
35,000
10090807060504030201009998979695
Nights spent at hotels, holiday villages, youth hostels, PCAs* and campsites, by region, 2010
8.2–10.14.5–5.52.1–2.7
1.1–2.00.9–1.00.6–0.9
Millions of nights spent
Source: Swedish Agency forEconomic and Regional
Growth/Statistics Sweden* Commercially arranged private cottages and apartments
T O U R I S M I N S W E D E N
34
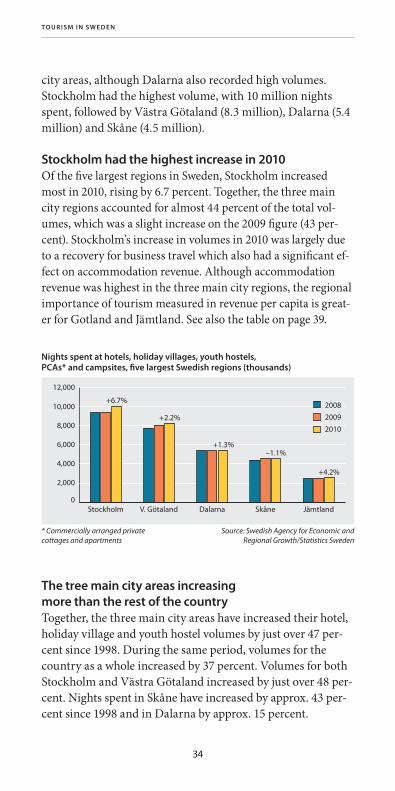
city areas, although Dalarna also recorded high volumes. Stockholm had the highest volume, with 10 million nights spent, followed by Västra Götaland (8.3 million), Dalarna (5.4 million) and Skåne (4.5 million).
Stockholm had the highest increase in 2010Of the five largest regions in Sweden, Stockholm increased most in 2010, rising by 6.7 percent. Together, the three main city regions accounted for almost 44 percent of the total vol-umes, which was a slight increase on the 2009 figure (43 per-cent). Stockholm’s increase in volumes in 2010 was largely due to a recovery for business travel which also had a significant ef-fect on accommodation revenue. Although accommodation revenue was highest in the three main city regions, the regional importance of tourism measured in revenue per capita is great-er for Gotland and Jämtland. See also the table on page 39.
Source: Swedish Agency for Economic andRegional Growth/Statistics Sweden
Nights spent at hotels, holiday villages, youth hostels, PCAs* and campsites, five largest Swedish regions (thousands)
0
2,000
4,000
6,000
8,000
10,000
12,000
JämtlandSkåneDalarnaV. GötalandStockholm
2008
2009
2010
+6.7%
+2.2%
+1.3%–1.1%
+4.2%
* Commercially arranged privatecottages and apartments
The tree main city areas increasing more than the rest of the countryTogether, the three main city areas have increased their hotel, holiday village and youth hostel volumes by just over 47 per-cent since 1998. During the same period, volumes for the country as a whole increased by 37 percent. Volumes for both Stockholm and Västra Götaland increased by just over 48 per-cent. Nights spent in Skåne have increased by approx. 43 per-cent since 1998 and in Dalarna by approx. 15 percent.
T O U R I S M I N S W E D E N

35
Hotels showed highest increase in 2010The total number of nights spent at hotels, holiday villages, youth hostels, campsites and in commercially arranged pri-vate cottages and apartments in Sweden increased by 2.7 per-cent to 52.4 million in 2010. In 2010, the number of nights spent at hotels showed the highest increase, rising by 5.3 per-cent. Volumes at commercially arranged private cottages and apartments rose by 3.1 percent, while holiday villages in-creased by 0.7 percent and youth hostels by 0.3 percent. Total volumes at campsites decreased by 1 percent.
SkåneDalarna
Source: Swedish Agency for Economic and Regional Growth/Statistics Sweden
Nights spent at hotels, holiday villages and youth hostels, in the four largest regions in Swedish (thousands)
0
2,000
4,000
6,000
8,000
10,000
10090807060504030201009998
Stockholm
V. Götaland
Source: Swedish Agency for Economic andRegional Growth/Statistics Sweden
Nights spent by type of accommodation (thousands)
0
5,000
10,000
15,000
20,000
25,000
30,000
Youth hostelsHoliday villagesPCAs*CampsitesHotels
2008
2009
2010
+5.3%
–1.0%
+3.1% +0.7% +0.3%
* Commercially arranged privatecottages and apartments
Increase in number of leisure travellers in summerSummer 2010 generated almost 24 million nights spent in Sweden, which was an increase of approx. 3 percent on sum-mer 2009. The summer months (June-August) accounted for
T O U R I S M I N S W E D E N

36
Source: Swedish Agency for Economic andRegional Growth/Statistics Sweden
Nights spent at hotels, holiday villages, youth hostels, PCAs* and campsites, month-by-month (thousands)
0
2,000
4,000
6,000
8,000
10,000
12,000
DecNovOktSepAugJulJunMayAprMarFebJan
2008
2009
2010
* Commercially arranged privatecottages and apartments
–2.3%+9.2%+4.3%+3.9%
+5.6%
+4.1%
–3.6%
+0.6%+0.5%
+6.9%+2.0%
–0.9%
almost 46 percent of the year’s total volumes for hotels, holi-day villages, youth hostels, campsites and commercially ar-ranged private cottages and apartments. This was a slight in-crease on summer 2009. In general, there is always an increase in leisure travel in the summer months, while business travel, which generates higher revenue, declines. In 2010, the volumes increased in July and August, but declined in June. July was the summer month which showed the highest growth in abso-lute figures, while August increased most in relative figures.
More beds at hotels, holiday villages and youth hostelsThe number of beds at Swedish hotels, holiday villages and youth hostels increased by less than 1 percent to 308,000 in
Other accommodationHotels
Source: Swedish Agency for Economic and Regional Growth/Statistics Sweden
Beds at hotels, holiday villages and youth hostels (thousands)
0
50
100
150
200
250
300
350
10090807060504030201009998979695949392
Note: The major shift in bed share between 2001 and 2002 is due to a revised definition of the youth hostel category in January 2002. About 250 establishments were reclassified and moved from the hotel category to the youth hostel category at the end of 2001.
T O U R I S M I N S W E D E N

37
2010. The number of hotel beds increased by just over 1 per-cent, while the number of youth hostel and holiday village beds remained on par with 2009. Between 1992 and 2010, the number of beds for all three forms of accommodation in-creased by just over 35 percent.
Key figures for capacity 2010
HotelsHoliday villages
Youth hostels Campsites
Number of establishments 1,985 271 782 1 066
Number of rooms/cottages 110,413 8,113 - 108 843 pitches11 973 cott.
Number of beds 224,444 41,528 42,642 -
Nights spent, millions 27.3 3.3 2.9 14.3
Occupancy rate/rooms/cottages
50% 37% - -
Occupancy rate, beds 37% 27% 25% -
Source: Swedish Agency for Economic and Regional Growth/Statistics Sweden
High percentage of rooms sold to business travellersOvernight stays for conference and business travellers nor-mally involve one guest in a room. In the case of overnight stays for leisure travellers, it is much more likely that there will be more than one guest in a room. Consequently, conference and business travellers dominate the number of rooms sold by target group, together accounting for just over 60 percent of hotel rooms sold in 2010.
Business travellers, 43.4Conference guests, 18.8Private group travellers, 7.6Private individual travellers, 30.2
Source: Swedish Agency for Economic and Regional Growth/Statistics Sweden
Target group distribution, hotel rooms occupied/sold in 2010 (percent)
Accommodation revenue increased in 2010Hotels accounted for over 80 percent of volumes at Swedish hotels, holiday villages and youth hostels, and for 93 percent of total accommodation revenue in 2010. Holiday villages, the
T O U R I S M I N S W E D E N

38
Hotels, 81Holidayvillages, 10Youth hostels, 9
Hotels, 93Holidayvillages, 3Youth hostels, 4
Source: Swedish Agency for Economic and Regional Growth/Statistics Sweden
Volumes and revenue by type of accommodation 2010 (percent)
VOLUMES/NIGHTS SPENT
ACCOMMODATIONREVENUE
Accommodation revenueVolumes/nights spent
Source: Swedish Agency for Economic and Regional Growth/Statistics Sweden
Index for accommodation revenue (current prices) and volumes. Index 2002 = 100
90
95
100
105
110
115
120
125
201020092008200720062005200420032002
second largest form of accommodation, accounted for 10 per-cent of volumes and 3.3 percent of accommodation revenue. Accommodation revenue for hotels rose by almost 1.4 billion or 8.4 percent in 2010, while the increase for holiday villages and youth hostels was almost 80 million or 6.7 percent.
Revenue grew more than volumes in 2010In 2003, 2004 and 2005, volumes measured by the number of nights spent at hotels, holiday villages and youth hostels in-creased, while accommodation revenue fell. In 2006, 2007 and 2008, revenue grew considerably faster than volumes. The trend reversed during the 2009 recession, but in 2010 revenues grew faster than volumes once again. At current prices, total accommodation revenue for hotels, holiday villages and youth hostels has risen by approx. 24 percent since 2002. However, at 2002 prices, the increase is just 10 percent. Volumes measured as the number of nights spent increased by almost 25 percent during the same period. In 2010, the recovery in business trav-
T O U R I S M I N S W E D E N

39
el was a key contributor to the increase in accommodation revenue for hotels.
Accommodation revenue as a measure of tourism’s regional significanceVolumes measured by number of commercial nights spent are widely used as an indicator of tourism trends, both locally and regionally. This can be used as a stand-alone variable and the volume data on a national level can be supplemented with financial data on import and export values, added value, employment, etc. By also recording accommodation revenue from accommodation statistics, another variable is added to measure tourism’s regional significance. Although accommo-dation revenue is highest in the three main city regions, the regional importance of tourism measured in revenue per capita is higher for Gotland and Jämtland.
Accommodation revenue for hotels, holiday villages and youth hostels, by region and per inhabitant, 2010
Region
Total accommodation revenue per region
(SEK thousands)
Accommodation revenue per
inhabitant, SEK10/09,
percent
Gotland 238,621 4,167 11.4
Jämtland 403,892 3,188 -0.1
Stockholm 6,542,866 3,185 12.9
Dalarna 709,203 2,560 4.0
Norrbotten 580,337 2,334 5.8
Västra Götaland 2,810,026 1,778 8.8
Kalmar 390,797 1,673 -0.5
Västerbotten 373,691 1,441 4.3
Halland 430,818 1,439 3.3
Skåne 1,776,822 1,429 2.1
Värmland 372,765 1,364 11.5
Västernorrland 321,169 1,324 4.0
Jönköping 439,847 1,306 1.9
Östergötland 557,081 1,297 6.4
Blekinge 194,098 1,267 8.0
Uppsala 413,483 1,231 13.6
Kronoberg 217,943 1,185 9.5
Södermanland 312,281 1,153 9.6
Örebro 308,485 1,101 4.4
Gävleborg 296,102 1,071 7.2
Västmanland 230,763 913 6.6
Whole country 17 921 089 1 734 8.3
Source:Swedish Agency for Economic and Regional Growth/Statistics Sweden
T O U R I S M I N S W E D E N

40
Liseberg most popular attractionThe main purpose of the Swedish Agency for Economic and Regional Growth’s database of attractions is to allow analysis of changes in different attraction categories over time, and identification of changes in preferences and behaviour. Infor-mation on visitors who are tourists by definition is difficult to
Attractions in Sweden in 2010 with changes from 2009. The list shows the number of visits (in some cases estimated) to major attractions (permanent) in Sweden, and is based on data obtained from each establishment.
Attraction Location No. of
visits 2010 Change10/09,
percent
1 Liseberg Gothenburg 2,900,000 -200,000 -6.5
2 Folkets Park Malmö 2,857,058 207,058 7.8
3 Kulturhuset Stockholm 2,090,743 -233,092 -10
4 Sälens Ski Resort 2 Malung 2,020,000,1 -54,000 -2.6
5 Fyrishov Uppsala 1,721,878 -56,122 -3.2
6 Globe Arena Stockholm 1,580,000 280,000 21.5
7 Stockholm Int. Fairs Stockholm 1,320,934 178,410 15.6
8 Gröna Lund Stockholm 1,305,612 57,477 4.6
9 Skansen Stockholm 1,285,122 -120,006 -8.5
10 Swedish Exhib. Ctr. Gothenburg 1,191,033 45,684 4.0
11 Eriksdal Pool Stockholm 1,135,057 -131,979 -10.4
12 Vasa Museum Stockholm 1,129,184 -25,431 -2.2
13 Åre/Duved, skiing Åre 1,060,0001 -28,000 -2.6
14 Rosvalla Nyköping 958,000 24,000 2.6
15 Royal Palace, total Stockholm 862,245 163,945 23.5
16 Ales Stenar Ystad 750,000 - -
17 Söderåsen Nature Res. Svalöv m fl 750,000 - -
18 Lund Cathedral Lund 700,000 -80,000 -10.3
19 Dunkers Kulturhus Helsingborg 655,571 -11,000 -1.8
20 Scandinavium Gothenburg 648,514 -30,975 -4.6
21 Uppsala Cathedral Uppsala 600,000 - -
22 Gustavsvik Waterpark Örebro 598,000 -102,000 -14.6
23 Idre Fjäll, skiing Älvdalen 568,0001 20,000 3.6
24 Swedish Museum Stockholm 545,000 -75,141 -12.1
25 Kolmårdens Wildlife P. Norrköping 543,185 -78,167 -12.6
26 Vemdalen/Klövsjö, skiing
Härjedalen 543,0001 -5,000 -0.9
27 Aqua Mera Pool Växjö 540,000 91,350 20.4
28 Mariebergsskogen, City Park
Karlstad 537,000 42,000 8.5
29 Universeum Gothenburg 519,761 -4,273 -0.8
30 Valhalla Pool Gothenburg 501,729 33,691 7.2 1 Number of skiing days 2009/10 season2 Lindvallen/Tandådalen-Hundfjället/Kläppen/Stöten
Source: Swedish Agency for Economic and Regional Growth/Resurs AB
T O U R I S M I N S W E D E N

41
collect and the proportion of attraction visitors who are tour-ists varies considerably depending on the type of attraction.
Västra Götaland accounts for almost half of all nights spent at guest marinasThe Swedish Agency for Economic and Regional Growth and Riksföreningen Gästhamnar Sverige (RGS) conduct surveys to measure occupancy at Swedish guest marinas. A total of 1,487,144 nights were registered in guest marinas in 2010, which is an increase of 4.2 percent on the 2009 figure. Almost half (over 45 percent) of all nights spent were registered in Västra Götaland County, followed by Stockholm County with 16.7 percent. The remaining 38 percent was spread evenly around the country, with Skåne accounting for 9.4 percent and Kalmar to 6.1 percent of the total nights spent. Virtually every region showed an increase in the number of nights spent in 2010. The number of boat nights in guest marinas remained at about the same level as in 2009.
Total number of nights spent in guest marinas in private leisure boats, by region, 2010
Region Number Percentage 10/09, percent
Västra Götaland 678,252 45.6 5.0
Stockholm 248,436 16.7 3.5
Skåne 140,033 9.4 3.1
Kalmar 89,998 6.1 5.5
Blekinge 63,641 4.3 11.5
Östergötland 1 62,017 4.2 2.8
Västernorrland 48,482 3.3 6.6
Sördermanland 46,113 3.1 5.0
Gotland 26,648 1.8 6.7
Halland 26,020 1.7 -2.5
Gävleborg 15,294 1.0 3.8
Värmland 12,225 0.8 23.8
Norrbotten 9,304 0.6 6.1
Västmanland 2 5,642 0.4 3.6
Örebro 5,628 0.4 34.0
Uppsala 5,561 0.4 -61.5
Västerbotten 3,850 0.3 4.0
Whole country 1,487,144 100% 4.2
1 Östergötland includes guest marinas from Jönköping County. 2 Västmanland includes guest marinas from Kopparberg
County which are part of the Strömsholm canal system.
Source: Swedish Agencyfor Economic and
Regional Growth/RGS
T O U R I S M I N S W E D E N

42
Source: Swedish Agency for Economic andRegional Growth/Statistics Sweden
Number of domestic nights spent, by type of accommodation, 2010 (thousands)
0 5,000 10,000 15,000 20,000 25,000
Youth hostels
Holiday villages
PCAs 1
Campsites
Hotels
2,246 (2,223) (Figures in brackets refer to 2009)
2,575 (2,564)
2,888 (2,814)
10,920 (11,209)
20,975 (19,871)
1 Commercially arranged privatecottages and apartments
In addition, approx. 53.9 (46.9) million nights were spent in accommodation provided by friends and relatives, approx. 32.3 (28.3) million in self-owned holiday cottages and apartments and approx. 7.2 (7.2) million in privately rented cottages and apartments. Source: Resurs AB/TDB
Domestic tourism
Domestic volumes continued to increase in 2010The number of domestic/Swedish nights spent at hotels, holi-day villages, youth hostels, campsites and in commercially ar-ranged private cottages and apartments in Sweden increased by 2.4 percent to 39.6 million in 2010. However, between 1995 and 2010, the proportion of domestic nights spent at hotels, holiday villages and youth hostels fell from approx. 80 to just over 76 percent. In 2010, the number of domestic guest nights at hotels showed the biggest increase, rising by 5.6 percent. Volumes at youth hostels increased by 1 percent, holiday vil-lages rose by 0.4 percent and commercially arranged private cottages and apartments showed a 2.6 percent increase. Do-mestic volumes at campsites declined by 2.6 percent.
Gävleborg and Gotland have highest share of domestic tourismThe majority of regions experienced volume increases in 2010. The largest numbers of domestic nights spent were in the three mayor city areas, although Dalarna also recorded high volumes.
D O M E S T I C T O U R I S M

43
Stockholm had the highest volume, with almost 6.7 million nights spent, followed by Västra Götaland (5.9 million), Dalarna (4.5 million) and Skåne (3.5 million). The ratio of domestic nights spent to total nights spent varied considerably across the country. Gävleborg had the highest proportion of domestic vol-umes at almost 92 percent, followed by Gotland with just under 90 percent. At 57 percent, Kronoberg had the lowest share of do-mestic volumes, while Värmland, Stockholm, Norrbotten and Västa Götaland were also regions with a low share of domestic volumes in 2010. See also the table on page 53.
Summer months accounted for over 43 percent of volumesThe three summer months (June to August) accounted for just over 43 percent of the year’s total volumes. The two biggest
Number of domestic nights spent at hotels, holiday villages, youth hostels, PCAs* and campsites, by region, in 2010
5.9–6.73.5–4.61.3–2.2
0.9–1.20.7–0.80.4–0.7
Millions of nights spent
Source: Swedish Agency forEconomic and Regional
Growth/Statistics Sweden* Commercially arranged private cottages and apartments
D O M E S T I C T O U R I S M

44
Source: Resurs AB/TDB
Travel destinations 2010, trips with overnight stays in Sweden (percent)
0 5 10 15 20 25 30
JämtlandÖstergötland
KalmarHallandDalarna
SkåneStockholm
Västra GötalandRegion
ÖstergötlandVästernorrland
UppsalaDalarna
JönköpingSkåne
Västra GötalandStockholm
Region
4.34.54.75.0
6.98.7
15.416.6
LEISURE TRIPS
3.13.73.83.9
4.49.7
16.629.1
BUSINESS TRIPS
months, July and August, have shown an increase in volumes over the last three years.
Västra Götaland most popular with Swedish leisure travellersSwedish travellers made a total of 44.7 million trips with over-night stays in Sweden in 2010, which is an increase of almost 15 percent from 2009. Leisure travel accounted for almost 90 percent (39.7 million) of these trips, an increase of just over 13 percent from 2009. Business travel increased by over 20 percent
Source: Swedish Agency for Economic andRegional Growth/Statistics Sweden
Number of domestic/Swedish nights spent at hotels, holiday villages, youth hostels, PCAs* and campsites, by month (thousands)
0
2,000
4,000
6,000
8,000
10,000
DecNovOktSepAugJulJunMayAprMarFebJan
2008
2009
2010
* Commercially arranged privatecottages and apartments
–0.9%+11.5%+3.7%+2.5%
+5.5%
+2.2%
–3.6%+0.7%
+3.5%+6.5%
–0.9%–0.3%
D O M E S T I C T O U R I S M

45
in 2010, rising to over five million trips with an overnight stay. The tables below show trips with overnight stays and the per-centage share of the total number of leisure and business trips. The tables are based on data obtained from the Travel & Tour-ism Database (TDB). Stockholm is the most important desti-nation for domestic business travellers. More than one in four business trips with an overnight stay in Sweden was to Stock-holm. Almost 17 percent of business trips were to Västra Göta-land, while 9.7 percent were to Skåne. Just over 55 percent of all business trips in Sweden were to the three mayor city areas. Jönköping had a 4.4 percent share of domestic business travel, while the other regions were below 4 percent. With a 16.6 per-cent share, Västra Götaland was the most popular destination for leisure travel, followed by Stockholm (15.4 percent) and Skåne (8.7 percent). Approx. 40 percent of all domestic Swedish leisure trips were made to the three mayor city areas. Dalarna and Halland had 6.9 percent and 5 percent, respectively, while the remaining regions were all below 5 percent each.
Internal business travel and visiting friends and relatives most common purposeThe most common reason for Swedish domestic business trav-ellers’ trips with overnight stays was to make visits or attend meetings within their own company or organisation. This was
Source: Resurs AB/TDB
Main purpose of travel 2010, trips with overnight stays in Sweden (percent)
0 10 20 30 40 50 60
Pleasure and entertainmentWedding, funeral, baptism etc
Spending time with othersStaying in holiday cottage
Peace and quiet/relaxationGetting away
Visiting friends and relativesLEISURE TRIPS
tripIncentive/reward tripStudy trip
Trade fair/exhibitionWork at other locationBusiness trip/external
Conf./convention/courseBusiness trip/internal
BUSINESS TRIPS
6.77.3
14.615.015.2
24.6
59.7
1.20.2
2.515.8
16.929.2
34.1
(Does not add up to 100% as more than one answer was possible)
D O M E S T I C T O U R I S M

46
the reason for over 34 percent of all business trips in 2010. The second most common reason was to attend a conference, con-vention, course or seminar. Business trips with an overnight stay in Sweden increased by over 20 percent in 2010. The per-centage of individual business trips increased while there was a decline in the percentage of visits to conferences, conven-tions, courses and seminars. The number of leisure trips with overnight stays increased by just over 13 percent in 2010. Al-most 60 percent of Swedish leisure travellers made trips in Sweden to meet friends and family. This category has risen a little in recent years.
Large seasonal variations for travel in SwedenThe general industrial holiday month of July still dominates leisure travel. However, business travel is lowest in June, July and August, peaking in April, May and September.
Source: Resurs AB/TDB
Business trips with stays in Sweden, by month, 2010 (thousands)
0
100
200
300
400
500
600
DecNovOktSepAugJulJunMayAprMarFebJan
Source: Resurs AB/TDB
Leisure trips with overnight stays in Sweden, by month, 2010 (thousands)
0
1 000
2 000
3 000
4 000
5 000
6 000
7 000
DecNovOktSepAugJulJunMayAprMarFebJan
D O M E S T I C T O U R I S M

47
Car most common for travel in SwedenThe car was by far the most popular method of transport for Swedish leisure and business travellers making trips in Swe-den. Three-quarters of leisure trips and just over half of busi-ness trips were by car. Rail was the second most frequently used method of transport for leisure trips and air travel for business trips. Total overnight trips increased by almost 15 percent in 2010, although the distribution of methods of trans-port has not shown any appreciable change in recent years.
Car, 54.0Air, 21.3Train, 20.1Bus, 2.1Other, 2.5
Car, 75.2Train, 14.0Bus, 5.2Air, 2.5Other, 3.1
Source: Resurs AB/TDB
Methods of transport 2010, trips with overnight stays in Sweden (percentage share of total trips)
BUSINESS TRIPS LEISURE TRIPS
Increase in business and leisure travel, but decline in expenditure in 2010Although the number of business trips with an overnight stay in Sweden increased by over 20 percent in 2010, expenditure per business traveller and per day fell by almost 10 percent. Business travellers spent an average of SEK 1,960 per person per day in 2010, which is almost five times as much as for lei-sure travellers. Leisure travellers spent an average of SEK 417 per person per day, which was a decline of just over 3 percent from 2009. One explanation for the big difference between business and leisure travellers is that almost all business over-night stays are arranged commercially, while a large propor-tion of leisure overnight stays are with friends and relatives.
Source: Resurs AB/TDB
Expenditure 2010, trips with overnight stays in Sweden (SEK per person per day)
0 500 1,000 1,500 2,000 2,500
Leisure trips
Business trips
417
1,960
D O M E S T I C T O U R I S M
48
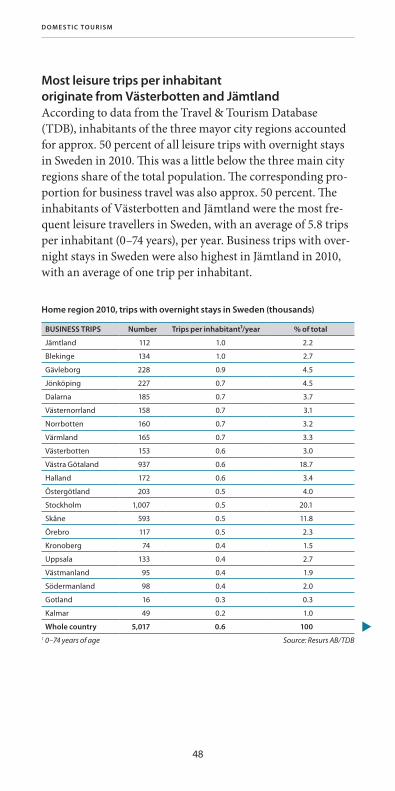
Most leisure trips per inhabitant originate from Västerbotten and JämtlandAccording to data from the Travel & Tourism Database (TDB), inhabitants of the three mayor city regions accounted for approx. 50 percent of all leisure trips with overnight stays in Sweden in 2010. This was a little below the three main city regions share of the total population. The corresponding pro-portion for business travel was also approx. 50 percent. The inhabitants of Västerbotten and Jämtland were the most fre-quent leisure travellers in Sweden, with an average of 5.8 trips per inhabitant (0–74 years), per year. Business trips with over-night stays in Sweden were also highest in Jämtland in 2010, with an average of one trip per inhabitant.
t
Home region 2010, trips with overnight stays in Sweden (thousands)
BUSINESS TRIPS Number Trips per inhabitant¹/year % of total
Jämtland 112 1.0 2.2
Blekinge 134 1.0 2.7
Gävleborg 228 0.9 4.5
Jönköping 227 0.7 4.5
Dalarna 185 0.7 3.7
Västernorrland 158 0.7 3.1
Norrbotten 160 0.7 3.2
Värmland 165 0.7 3.3
Västerbotten 153 0.6 3.0
Västra Götaland 937 0.6 18.7
Halland 172 0.6 3.4
Östergötland 203 0.5 4.0
Stockholm 1,007 0.5 20.1
Skåne 593 0.5 11.8
Örebro 117 0.5 2.3
Kronoberg 74 0.4 1.5
Uppsala 133 0.4 2.7
Västmanland 95 0.4 1.9
Södermanland 98 0.4 2.0
Gotland 16 0.3 0.3
Kalmar 49 0.2 1.0
Whole country 5,017 0.6 1001 0–74 years of age Source: Resurs AB/TDB
D O M E S T I C T O U R I S M

49
t
Home region 2010, trips with overnight stays in Sweden (thousands), cont’d
LEISURE TRIPS Number Trips per inhabitant¹/year % of total
Västerbotten 1,376 5.8 3.5
Jämtland 663 5.8 1.7
Västernorrland 1,195 5.5 3.0
Jönköping 1,626 5.3 4.1
Kronoberg 845 5.1 2.1
Östergötland 1,933 4.9 4.9
Norrbotten 1,106 4.9 2.8
Uppsala 1,521 4.9 3.8
Gävleborg 1,209 4.9 3.0
Stockholm 9,121 4.8 23.0
Västra Götaland 6,823 4.7 17.2
Kalmar 982 4.7 2.5
Örebro 1,165 4.6 2.9
Dalarna 1,134 4.6 2.9
Västmanland 1,031 4.5 2.6
Värmland 1,085 4.4 2.7
Södermanland 975 4.0 2.5
Halland 1,074 3.9 2.7
Blekinge 532 3.9 1.3
Skåne 4,095 3.6 10.3
Gotland 161 3.1 0.4
Whole country 39,652 4.6 1001 0–74 years of age Source: Resurs AB/TDB
D O M E S T I C T O U R I S M

50
Inbound tourism
Increase in foreign volumes in 2010The number of foreign nights spent at Swedish hotels, holiday villages, youth hostels, campsites and in commercially ar-ranged private cottages and apartments rose by 3.8 percent to just over 12.8 million in 2010. Between 1995 and 2010, the share of foreign nights spent at hotels, holiday villages and youth hostels increased from 20.1 to 23.2 percent. In 2010, the number of foreign nights spent at hotels increased most (4.5 percent), followed by foreign nights spent at campsites, which rose by 4.2 percent. However, foreign volumes at youth hostels declined by 1.9 percent. Hotels was the most common type of commercial accommodation for foreign visitors to Sweden, accounting for almost half of all nights spent (6.3 million) in 2010. Campsites came next, with just over 3.4 million nights spent. Together, other types of accommodation accounted for just over 3 million foreign nights spent in 2010.
Source: Swedish Agency for Economic andRegional Growth/Statistics Sweden
Foreign nights spent by type of accommodation, 2010 (thousands)
0 2,000 4,000 6,000 8,000
Youth hostels
Holiday villages
PCAs 1
Campsite
Hotels
691 (705) (Figures in brackets refer to 2009)
726 (716)
1,618 (1,555)
3,405 (3,267)
6,363 (6,087)
1 Commercially arranged privatecottages and apartments
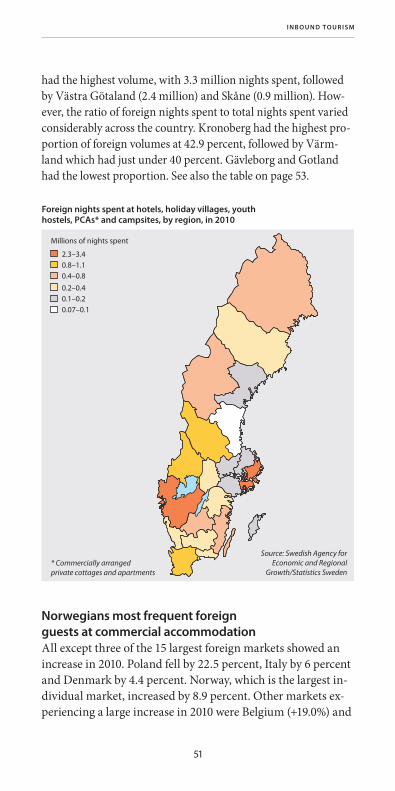
Highest share of foreign tourism for Kronoberg and VärmlandThe majority of regions experienced volume increases in 2010. In addition to the large volumes in the three mayor city areas, most foreign nights spent were in Värmland and Dalarna. Stockholm
I N B O U N D T O U R I S M
51
had the highest volume, with 3.3 million nights spent, followed by Västra Götaland (2.4 million) and Skåne (0.9 million). How-ever, the ratio of foreign nights spent to total nights spent varied considerably across the country. Kronoberg had the highest pro-portion of foreign volumes at 42.9 percent, followed by Värm-land which had just under 40 percent. Gävleborg and Gotland had the lowest proportion. See also the table on page 53.
Norwegians most frequent foreign guests at commercial accommodationAll except three of the 15 largest foreign markets showed an increase in 2010. Poland fell by 22.5 percent, Italy by 6 percent and Denmark by 4.4 percent. Norway, which is the largest in-dividual market, increased by 8.9 percent. Other markets ex-periencing a large increase in 2010 were Belgium (+19.0%) and
Foreign nights spent at hotels, holiday villages, youth hostels, PCAs* and campsites, by region, in 2010
2.3–3.40.8–1.10.4–0.8
0.2–0.40.1–0.20.07–0.1
Millions of nights spent
Source: Swedish Agency forEconomic and Regional
Growth/Statistics Sweden* Commercially arranged private cottages and apartments
I N B O U N D T O U R I S M
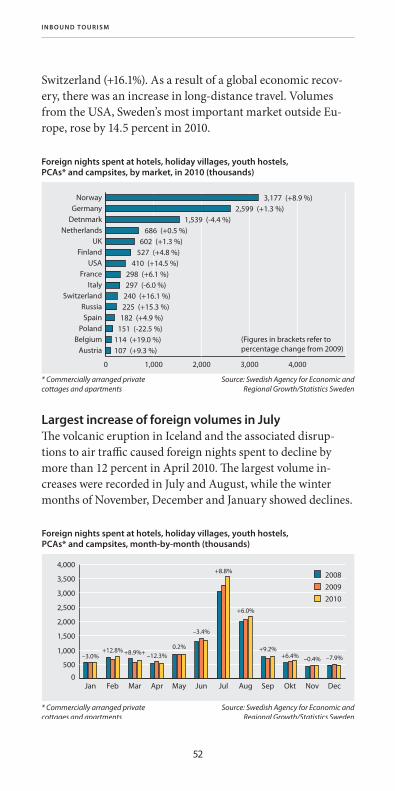
52
Switzerland (+16.1%). As a result of a global economic recov-ery, there was an increase in long-distance travel. Volumes from the USA, Sweden’s most important market outside Eu-rope, rose by 14.5 percent in 2010.
Largest increase of foreign volumes in JulyThe volcanic eruption in Iceland and the associated disrup-tions to air traffic caused foreign nights spent to decline by more than 12 percent in April 2010. The largest volume in-creases were recorded in July and August, while the winter months of November, December and January showed declines.
0 1,000 2,000 3,000 4,000
Austria Belgium
Poland Spain
Russia Switzerland
Italy France
USA Finland
UK Netherlands
Detnmark Germany
Norway
Source: Swedish Agency for Economic andRegional Growth/Statistics Sweden
* Commercially arranged privatecottages and apartments
Foreign nights spent at hotels, holiday villages, youth hostels, PCAs* and campsites, by market, in 2010 (thousands)
(Figures in brackets refer to percentage change from 2009)
3,177 (+8.9 %) 2,599 (+1.3 %) 1,539 (-4.4 %) 686 (+0.5 %) 602 (+1.3 %) 527 (+4.8 %) 410 (+14.5 %) 298 (+6.1 %) 297 (-6.0 %) 240 (+16.1 %) 225 (+15.3 %) 182 (+4.9 %) 151 (-22.5 %)114 (+19.0 %)107 (+9.3 %)
Source: Swedish Agency for Economic andRegional Growth/Statistics Sweden
Foreign nights spent at hotels, holiday villages, youth hostels, PCAs* and campsites, month-by-month (thousands)
* Commercially arranged privatecottages and apartments
0
500
1,000
1,500
2,000
2,500
3,000
3,500
4,000
DecNovOktSepAugJulJunMayAprMarFebJan
2008
2009
2010
–7.9%–0.4%+6.4%+9.2%
+6.0%
+8.8%
–3.4%
0.2%–12.3%+8.9%++12.8%
–3.0%
I N B O U N D T O U R I S M

53
Gotland and Uppsala show highest increase in foreign volumesOn average, total volumes from abroad rose by 3.8 percent in 2010. Gotland experienced the largest increase (20 percent), fol-lowed by Uppsala (17.4 percent). Together, the three main city regions accounted for almost 53 percent of all foreign nights spent. The corresponding figure for domestic nights spent was just 40 percent. On average, foreign visitors accounted for just over 24 percent of all nights spent at hotels, holiday villages, youth hostels, campsites and commercially arranged private cottages and apartments. In addition to Kronoberg, Värmland and Stockholm, which had the highest proportion of foreign nights spent, Norrbotten, Västa Götaland, Jönköping and Ble-kinge were all above the national average in 2010. It can also be seen that some regions have a relationship between high vol-umes and a high proportion of foreign volumes.
Swedish and foreign nights spent at hotels. holiday villages. youth hostels. PCAs* and campsites. by region. 2010. with change from 2009
Region
Inbound Total 2010
Change.total
10/09. %
Change. inbound10/09. %Number %
Kronoberg 323.940 42.9 755.081 2.8 -0.3
Värmland 828,642 39.2 2,111,579 7.7 3.9
Stockholm 3,362,596 33.5 10,048,122 6.7 5.5
Norrbotten 648,527 32.3 2,007,469 4.1 3.9
Västra Götaland 2,373,292 28.7 8,257,293 2.2 4.4
Jönköping 421,626 28.7 1,469,880 5.3 9.6
Blekinge 230,004 25.6 898,447 3.5 4.1
Skåne 1,024,659 22.6 4,532,988 -1.1 -5.1
Jämtland 555,064 21.3 2,605,439 4.2 9.5
Västerbotten 302,749 20.7 1,462,651 6.0 6.0
Örebro 211,122 18.8 1,123,169 3.4 9.4
Östergötland 242,951 16.9 1,441,701 2.5 5.9
Kalmar 430,367 16.6 2,586,894 -7.6 -11.1
Dalarna 900,934 16.6 5,437,984 1.3 12.8
Uppsala 158,687 16.1 986,868 7.1 17.4
Västmanland 98,762 15.6 635,059 -5.1 -7.2
Södermanland 153,344 15.3 1,002,336 0.1 -5.8
Halland 256,875 11.4 2,252,180 -0.9 -7.3
Västernorrland 102,414 11.1 923,116 -1.4 9.6
Gotland 97,392 10.5 926,927 12.7 20.7
Gävleborg 78,885 8.4 940,851 7.5 -3.8
Whole country 12,802,832 24.4 52 406,034 2.7 3.8
* Commercially arranged privatecottages and apartments
Source: Swedish Agency for Economic andRegional Growth/Statistics Sweden
I N B O U N D T O U R I S M

54
One in four nights spent from abroad are in Stockholm Stockholm, which accounted for just over 26 percent of all for-eign nights spent in 2010, increased its volumes by 5.5 percent. However, Dalarna was the region among the ten largest re-gions that experienced the highest increase in volumes, which rose by 12.8 percent. Volumes in Kalmar and Skåne declined in 2010. This may be partly due to the fact that they recorded large increases in 2009.
Source: Swedish Agency for Economic andRegional Growth/Statistics Sweden
Foreign nights spent at hotels, holiday villages, youth hostels, PCAs* and camp-sites, ten largest Swedish regions, 2010 (thousands), with change from 2009
0
500
1,000
1,500
2,000
2,500
3,000
3,500
Krono-berg
Jön-köping
KalmarJämt-land
Norr-botten
Värm-land
DalarnaSkåneVästraGötaland
Stock-holm
* Commercially arranged privatecottages and apartments
–0.3+9.6–11.1+9.5+3.9+3.9+12.8–5.1
+4.4
+5.5
Good growth for non-European marketsThe non-European markets achieved a growth of 15.5 percent in 2010. The USA showed the largest increase in nights spent, rising by 14.5 percent. However, Sweden’s neighbouring mar-
Source: Swedish Agency for Economic andRegional Growth/Statistics Sweden
* Commercially arranged privatecottages and apartments
Foreign nights spent at hotels, holiday villages, youth hostels, PCAs* and campsites, by market area (thousands)
0
1,000
2,000
3,000
4,000
5,000
6,000
7,000
Non-EuropeanNordic (excl. Sweden)Europe (excl. Nordic)
2008
2009
2010
+15.5%
+4.3%
+0.7%
I N B O U N D T O U R I S M

55
kets have increased most during the last three years. The number of foreign nights spent originating from the Nordic region has increased by over 750,000, or 17 percent, since 2008. The rest of Europe, which is the largest individual mar-ket area outside Sweden, increased by almost 1 percent in 2010, but has declined by 1.4 percent since 2008. The main contributors to the decline were the UK and the Netherlands.
Norway and Germany the largest foreign marketsOf the five largest foreign markets for hotels, holiday villages and youth hostels, Norway, Germany and Finland showed an increase in 2010, while Denmark and the UK declined. Den-mark has had the largest increase since 2002, with growth of almost 32 percent, followed by Germany (just over 29 per-cent), Finland, (26 percent) and Norway (almost 20 percent). Volumes from the UK have been virtually static since 2002.
Source: Swedish Agency for Economic and Regional Growth/Statistics Sweden
Foreign nights spent at hotels, holiday villages and youth hostels, five largest foreign markets (thousands)
0
200
400
600
800
1,000
1,200
1,400
100908070605040302
Norway
Finland
Germany
Denmark
UK
Increase in the proportion of foreign nights spentThe proportion of foreign nights spent at hotels, holiday vil-lages and youth hostels has experienced a slow but steady in-crease from 20.1 to 23.2 percent between 1995 and 2010. Total foreign volumes at hotels, holiday villages and youth hostels have risen by just over 60 percent. During the same period, domestic volumes increased by approx. 38 percent.
I N B O U N D T O U R I S M

56
Västra Götaland top destination for NorwegiansThe regional distribution of the number of foreign nights spent in hotels, holiday villages, hostels, commercially ar-
Source: Swedish Agency for
Economic and RegionalGrowth/Statistics Sweden
Regional share of total nights spent in Sweden from Norway and Germany in 2010, percent
NORWAY
Under 2.5%
14.2%
12.4%
9.0%
7.2%
6.1%
5.8%
GERMANY
Under 5.0%
14.7%
5.6%
7.5%7.7%
18.0%
6.9%
10.3%
32.2%
Source: Swedish Agency for Economic and Regional Growth/Statistics Sweden
Foreign nights spent at hotels, holiday villages and youth hostels – percentage share of total number of nights spent, with trend line
18
19
20
21
22
23
24
10090807060504030201009998979695
23.3 23.222.922.922.823.123.0
22.422.522.3
21.321.421.5
20.820.5
20.1
I N B O U N D T O U R I S M

57
ranged private cottages and apartments (PCAs) and campsites for each foreign market/country varies across the country. The most popular destination with Norwegians, who accounted for almost 25 percent of all foreign nights spent in Sweden in 2010, was Västra Götaland, while Stockholm was most popu-lar with Germans.
Good spread of nights spent from Denmark and the NetherlandsDenmark, with just over 1.5 million nights spent in Sweden, is the third largest foreign market. 25 percent of nights spent by residents of Denmark in 2010 were in Dalarna. Just over 17 percent of the 685,000 nights spent from the Netherlands in 2010 were in Stockholm, while almost 16 percent were in Dalarna.
Regional share of total nights spent in Sweden from Denmark and the Netherlands in 2010, percent
DENMARK
Under 4.0%
12.3%
4.9%
14.6%6.2%
10.7%
6.5%
25.0%
NETHERLANDS
Under 3.5%
13.9%
7.8%
15.8%
3.5%
17.4%
6.2%
10.2%
Source: Swedish Agency for
Economic and RegionalGrowth/Statistics Sweden
I N B O U N D T O U R I S M

58
Stockholm top destination for UK and Finnish travellersOver half of the total nights spent by UK residents in 2010 were in Stockholm. Västra Götaland, with almost 17 percent, was also a popular destination with UK travellers. Stockholm was also the top destination for Finnish travellers, although Norrbotten and Jämtland also had high market shares.
Regional share of total nights spent in Sweden from the UK and Finland in 2010, percent
UK
Under 1.6%
16.8%2.2%
8.8%
3.7%
51.2%
3.1%
1.7%
FINLAND
Under 3.7%
7.1%3.7%
4.1%
10.9%
35.7%
9.2%
4.9%
Source: Swedish Agency for
Economic and RegionalGrowth/Statistics Sweden
High concentration to Stockholm from the USA and FranceOver 60 percent of nights spent from the USA and 53 percent from France were in Stockholm. Västra Götaland, with more than 14 percent, and Skåne, with just over 7 percent of nights spent from the USA and France, were also important destina-tions.
I N B O U N D T O U R I S M
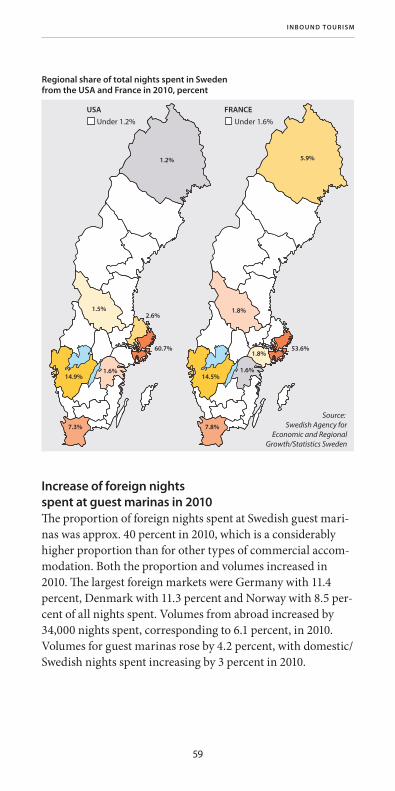
59
Increase of foreign nights spent at guest marinas in 2010The proportion of foreign nights spent at Swedish guest mari-nas was approx. 40 percent in 2010, which is a considerably higher proportion than for other types of commercial accom-modation. Both the proportion and volumes increased in 2010. The largest foreign markets were Germany with 11.4 percent, Denmark with 11.3 percent and Norway with 8.5 per-cent of all nights spent. Volumes from abroad increased by 34,000 nights spent, corresponding to 6.1 percent, in 2010. Volumes for guest marinas rose by 4.2 percent, with domestic/Swedish nights spent increasing by 3 percent in 2010.
Regional share of total nights spent in Sweden from the USA and France in 2010, percent
USA
Under 1.2%
14.9%1.6%
7.3%
2.6%
60.7%
1.2%
1.5%
FRANCE
Under 1.6%
14.5%1.6%
1.8%
5.9%
53.6%1.8%
7.8%
Source: Swedish Agency for
Economic and RegionalGrowth/Statistics Sweden
I N B O U N D T O U R I S M

60
Accommodation statistics The accommodation statistics is part of Sweden’s official statis-tics and is produced for the Swedish Agency for Economic and Regional Growth by Statistics Sweden (SCB). The statistics in-clude accommodation in hotels, holiday villages, youth hostels, campsites and commercially arranged private cottages and apartments (PCAs). The statistics include volumes for the number of nights spent, guest nationalities, numbers of rooms sold, average room revenue, occupancy rates and growth in different parts of Sweden. Over 3,000 establishments provide monthly data. The statistics are reported back the information providers, although many other parties also rely on them for effective decision support data. Policy makers, authorities, the business community, tourism organisations, tourism consult-ants and research institutions use the statistics for their own analyses.
Nights spent at guest marinas on private leisure boats, by nationality, 2010
Nationality Nights spent Percentage 10/09, %
Sweden 893,775 60.1 3.0
Germany 169,534 11.4 10.0
Denmark 168,047 11.3 21.4
Norway 126,407 8.5 -23.6
Finland 55,024 3.7 83.6
Netherlands 22,307 1.5 -34.9
Rest of Europe 49,076 3.3 56.5
Rest of World 2,974 0.2 -47.9
Total 1,487,144 100 4.2
Source: Tillväxtverket/RGS
I N B O U N D T O U R I S M

61
Outbound tourism
Large proportion of leisure tripsAccording to data from Resurs AB and the Travel & Tourist Data Base (TDB), the number of trips abroad with overnight stays rose by 11.5 percent in 2010. This represented a strong re-covery for travel abroad after a similarly large decline (12%) in 2009. 2.2 million of the 13 million trips abroad with overnight stays by Swedes in 2010 were business trips, while 10.8 million were leisure trips. The tables below show the most common destinations and purpose to travel (unless otherwise specified).
Finland and Spain top destinations for SwedesFinland, with over 11 percent of all foreign overnight trips, and Spain, with 9.6 percent, were the most popular destina-tions. There was a sharp increase in the number of trips to both Finland and Spain in 2010. With the exception of the USA, all the top ten foreign destinations showed an increase.
Source: Resurs AB/TDB1 Thailand, Malaysia etc
Travel destinations 2010, total number of trips abroad (business and leisure) with overnight stays (thousands)
0
500
1000
1500
2000
1009080706050403020100
Share of total number of trips2010 (percent)
Finland 11.4Spain 9.6Denmark 9.3Germany 9.3Norway 7.6UK 5.7Italy 4.4France 4.3Malay Peninsula1 3.8USA 3.7
O U T B O U N D T O U R I S M

62
Germany, Italy and Finland were the top ten destinations that recorded the largest increases in 2010. Travel to the top ten destinations, which accounted for almost 70 percent of all travel abroad in 2010, has increased by 27 percent since 2000.
Germany top destination for business travellersA total of 2.2 million business trips abroad with overnight stays were made in 2010. Germany was the largest destination with just over 306,000 trips, and accounted for almost 14 per-cent of all business trips abroad. Because approx. 83 percent of all trips abroad are leisure trips, the top ten leisure destina-tions do not differ much from the top ten destinations for all trips abroad.
Source: Resurs AB/TDB
Travel destinations 2010, number of trips abroad with overnight stays (thousands)
0 300 600 900 1,200
FranceTurkiet
Malay Peninsula1 Italy
UKNorway
GermanyDenmark
SpainFinland
LEISURE TRIPS
SpainItaly
BelgiumUSA
FranceUK
DenmarkFinlandNorway
GermanyBUSINESS TRIPS
1 Thailand, Malaysia etc
437452
475489
575702
9061,009
1,1961,206
588389101
129172
207277289306
Individual business trips and getting away most common purposeThe main reason for Swedish business trips abroad in 2010 was individual business trips. Swedish leisure travellers trav-elled primarily in order to get away, although visiting friends and relatives was also a common reason.
O U T B O U N D T O U R I S M

63
Source: Resurs AB/TDB
Main purpose of travel 2010, trips abroad with overnight stays (percent)
0 10 20 30 40 50
Different experiencesFood & drink
Spending time with othersPleasure and entertainment
Peace and quiet/relaxationSun and beach
Visiting friends and relativesGetting away
LEISURE TRIPS
Incentive/reward trip Study trip
Trade fair/exhibitionWork at another locationConf./convention/course
Business trip/externalBusiness trip/internal
BUSINESS TRIPS
(Does not add up to 100% as more than one answer was possible.)
9.810.711.1
15.121.3
23.028.3
37.5
0.43.0
4.813.8
18.520.0
39.4
Source: Resurs AB/TDB
Business trips abroad with overnight stays, by month, 2010 (thousands)
0
50
100
150
200
250
300
350
DecNovOktSepAugJulJunMayAprMarFebJan
Source: Resurs AB/TDB
Leisure trips abroad with overnight stays, by month, 2010 (thousands)
0
500
1,000
1,500
2,000
DecNovOktSepAugJulJunMayAprMarFebJan
O U T B O U N D T O U R I S M
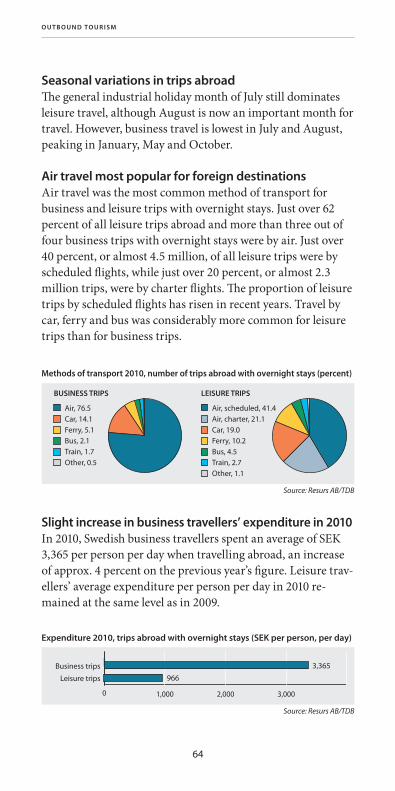
64
Seasonal variations in trips abroadThe general industrial holiday month of July still dominates leisure travel, although August is now an important month for travel. However, business travel is lowest in July and August, peaking in January, May and October.
Air travel most popular for foreign destinationsAir travel was the most common method of transport for business and leisure trips with overnight stays. Just over 62 percent of all leisure trips abroad and more than three out of four business trips with overnight stays were by air. Just over 40 percent, or almost 4.5 million, of all leisure trips were by scheduled flights, while just over 20 percent, or almost 2.3 million trips, were by charter flights. The proportion of leisure trips by scheduled flights has risen in recent years. Travel by car, ferry and bus was considerably more common for leisure trips than for business trips.
Air, 76.5Car, 14.1Ferry, 5.1Bus, 2.1Train, 1.7Other, 0.5
Air, scheduled, 41.4Air, charter, 21.1Car, 19.0Ferry, 10.2Bus, 4.5Train, 2.7Other, 1.1
Source: Resurs AB/TDB
Methods of transport 2010, number of trips abroad with overnight stays (percent)
BUSINESS TRIPS LEISURE TRIPS
Slight increase in business travellers’ expenditure in 2010In 2010, Swedish business travellers spent an average of SEK 3,365 per person per day when travelling abroad, an increase of approx. 4 percent on the previous year’s figure. Leisure trav-ellers’ average expenditure per person per day in 2010 re-mained at the same level as in 2009.
Source: Resurs AB/TDB
Expenditure 2010, trips abroad with overnight stays (SEK per person, per day)
0 1,000 2,000 3,000
Leisure trips
Business trips
966
3,365
O U T B O U N D T O U R I S M

65
Residents of Stockholm travel most abroad An average of 1.3 leisure trips abroad (with overnight stays) per person (0–74 years) were made in Sweden in 2010. After Stockholm, which accounted for an average of 1.7 trips abroad per person, the inhabitants of Skåne (1.4 trips abroad per per-son) and Halland (1.3 trips abroad per person) made most lei-sure trips abroad in 2010. On average, three out of ten Swedes made a business trip abroad in 2010. The highest number of business trips originated from Stockholm and Blekinge, where four out of ten persons made a business trip abroad in 2010. However, business travel was not evenly distributed among the inhabitants of each region; some individuals make a large number of trips while others do not travel at all.
Home region 2010, number of trips abroad with overnight stays (thousands)
BUSINESS TRIPS Number Trips per inhabitant¹/year % of total
Stockholm 762 0.4 34.4
Blekinge 49 0.4 2.2
Västra Götaland 450 0.3 20.3
Uppsala 93 0.3 4.2
Västmanland 62 0.3 2.8
Östergötland 100 0.3 4.5
Halland 69 0.3 3.1
Västerbotten 58 0.2 2.6
Gävleborg 56 0.2 2.5
Skåne 249 0.2 11.2
Värmland 46 0.2 2.1
Jämtland 19 0.2 0.9
Västernorrland 31 0.1 1.4
Dalarna 35 0.1 1.6
Jönköping 42 0.1 1.9
Örebro 29 0.1 1.3
Kronoberg 18 0.1 0.8
Kalmar 17 0.1 0.8
Södermanland 20 0.1 0.9
Norrbotten 15 0.1 0.7
Gotland - - -
Whole country 2,217 0.3 1001 0–74 years of age Source: Resurs AB/TDB
t
O U T B O U N D T O U R I S M
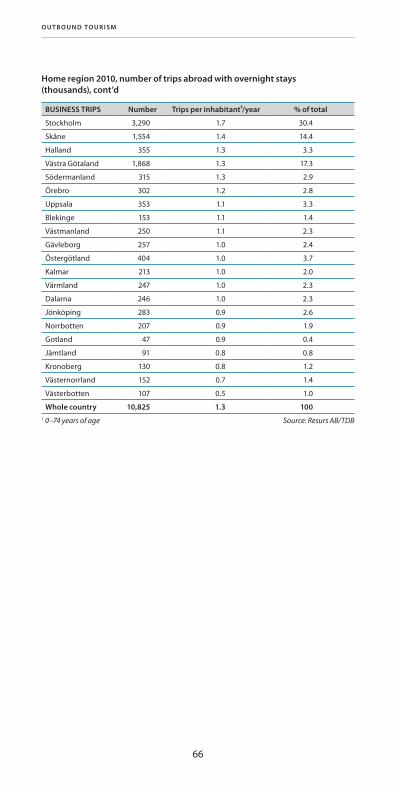
66
Home region 2010, number of trips abroad with overnight stays (thousands), cont’d
BUSINESS TRIPS Number Trips per inhabitant¹/year % of total
Stockholm 3,290 1.7 30.4
Skåne 1,554 1.4 14.4
Halland 355 1.3 3.3
Västra Götaland 1,868 1.3 17.3
Södermanland 315 1.3 2.9
Örebro 302 1.2 2.8
Uppsala 353 1.1 3.3
Blekinge 153 1.1 1.4
Västmanland 250 1.1 2.3
Gävleborg 257 1.0 2.4
Östergötland 404 1.0 3.7
Kalmar 213 1.0 2.0
Värmland 247 1.0 2.3
Dalarna 246 1.0 2.3
Jönköping 283 0.9 2.6
Norrbotten 207 0.9 1.9
Gotland 47 0.9 0.4
Jämtland 91 0.8 0.8
Kronoberg 130 0.8 1.2
Västernorrland 152 0.7 1.4
Västerbotten 107 0.5 1.0
Whole country 10,825 1.3 1001 0–74 years of age Source: Resurs AB/TDB
O U T B O U N D T O U R I S M
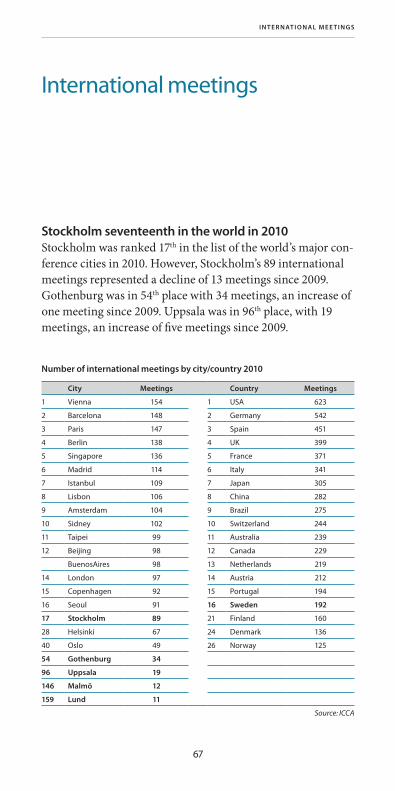
67
International meetings
Stockholm seventeenth in the world in 2010Stockholm was ranked 17th in the list of the world’s major con-ference cities in 2010. However, Stockholm’s 89 international meetings represented a decline of 13 meetings since 2009. Gothenburg was in 54th place with 34 meetings, an increase of one meeting since 2009. Uppsala was in 96th place, with 19 meetings, an increase of five meetings since 2009.
Number of international meetings by city/country 2010
City Meetings Country Meetings
1 Vienna 154 1 USA 623
2 Barcelona 148 2 Germany 542
3 Paris 147 3 Spain 451
4 Berlin 138 4 UK 399
5 Singapore 136 5 France 371
6 Madrid 114 6 Italy 341
7 Istanbul 109 7 Japan 305
8 Lisbon 106 8 China 282
9 Amsterdam 104 9 Brazil 275
10 Sidney 102 10 Switzerland 244
11 Taipei 99 11 Australia 239
12 Beijing 98 12 Canada 229
BuenosAires 98 13 Netherlands 219
14 London 97 14 Austria 212
15 Copenhagen 92 15 Portugal 194
16 Seoul 91 16 Sweden 192
17 Stockholm 89 21 Finland 160
28 Helsinki 67 24 Denmark 136
40 Oslo 49 26 Norway 125
54 Gothenburg 34
96 Uppsala 19
146 Malmö 12
159 Lund 11
Source: ICCA
I N T E R N AT I O N A L M E E T I N G S
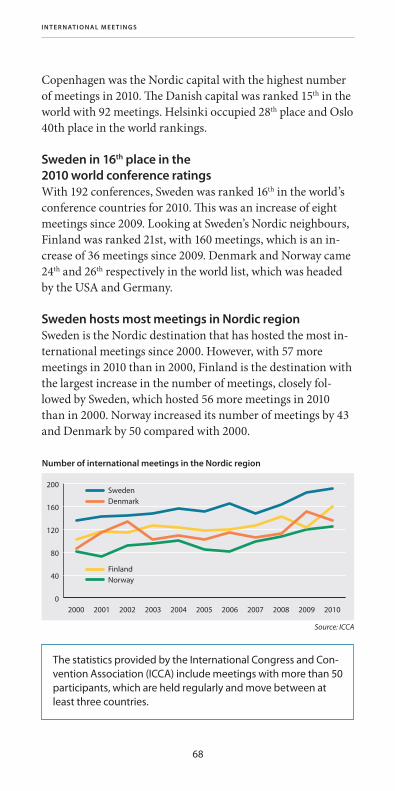
68
Copenhagen was the Nordic capital with the highest number of meetings in 2010. The Danish capital was ranked 15th in the world with 92 meetings. Helsinki occupied 28th place and Oslo 40th place in the world rankings.
Sweden in 16th place in the 2010 world conference ratingsWith 192 conferences, Sweden was ranked 16th in the world’s conference countries for 2010. This was an increase of eight meetings since 2009. Looking at Sweden’s Nordic neighbours, Finland was ranked 21st, with 160 meetings, which is an in-crease of 36 meetings since 2009. Denmark and Norway came 24th and 26th respectively in the world list, which was headed by the USA and Germany.
Sweden hosts most meetings in Nordic regionSweden is the Nordic destination that has hosted the most in-ternational meetings since 2000. However, with 57 more meetings in 2010 than in 2000, Finland is the destination with the largest increase in the number of meetings, closely fol-lowed by Sweden, which hosted 56 more meetings in 2010 than in 2000. Norway increased its number of meetings by 43 and Denmark by 50 compared with 2000.
SwedenDenmark
FinlandNorway
Source: ICCA
Number of international meetings in the Nordic region
0
40
80
120
160
200
20102009200820072006200520042003200220012000
The statistics provided by the International Congress and Con-vention Association (ICCA) include meetings with more than 50 participants, which are held regularly and move between at least three countries.
I N T E R N AT I O N A L M E E T I N G S

69
Definitions and sources
UN definition of tourismSweden has adopted the United Nations’ internationally ac-cepted definition of tourism. Tourism comprises the activities of persons travelling to and staying in places outside their usu-al environment for not more than one consecutive year for lei-sure, business or other purposes.
Forms of tourismThere are three defined forms of tourism which describe trips that cross land borders. “Country” in this definition can be replaced by region, municipality or other administrative area.
1. Domestic tourismResidents of a particular country travelling in that country.
2. Inbound tourismPeople travelling in a particular country who are residents of another country.
3. Outbound tourismResidents of a particular country who are travelling in another country.
Although the reporting in this publication refers to the three basic forms of tourism separately, it also covers the total of do-mestic and inbound volumes in Sweden under the heading “Tourism in Sweden”.
In the chapter entitled “International tourism”, volumes are reported in terms of numbers of trips abroad with at least one overnight stay, numbers of international arrivals or foreign nights spents in each country or part of the world.
D E F I N I T I O N S A N D S O U R C E S

70
Source: Swedish Agency for Economic and Regional Growth
and information from:
International Congress and Convention Association (ICCA)
Swedish National Accounts (NR)
Resurs AB/Travel & Tourism Database (TDB)
Riksföreningen Gästhamnar Sverige (RGS)
Statistics Sweden (SCB)
Sweden’s central bank/Statistics Sweden
Tom Ylkänen/Finnish Tourist Board (MEK)
World Tourism Organization (UNWTO)
When quoting, please remember to acknowledge the source.
D E F I N I T I O N S A N D S O U R C E S

INF
O 0
37
2. D
ES
IGN
: OR
DF
ÖR
RÅ
DE
T. P
RIN
TIN
G: D
AN
AG
ÅR
DS
GR
AF
ISK
A. P
RIN
T R
UN
50
0 E
X, N
OV
EM
BE
R 2
01
1. T
HE
RE
AF
TE
R, P
RIN
T O
N
DE
MA
ND
.
The aim of the Swedish Agency for Economic and Regional Growth – Tillväxtverket – is to work pro-actively for nationwide, sustainable growth by facilitating entrepreneurship.
TillväxtverketSwedish Agency for Economic and Regional Growth Tel +46 8 681 91 00www.tillvaxtverket.se
The Swedish Agency for Economic and Regional Growth provides knowledge about the development of tourism in Sweden
The Swedish Agency for Economic and Regional Growth is the authority responsible for tourism industry issues, and develops enterprise policies for the promotion of tourism initiatives and entrepreneurship. The Agency is also responsible for official tourism statistics, and the production and dissemination of knowledge about the development of tourism and its effects on the Swedish economy.
More information about the develop-ment of tourism in Sweden can be found on the Agency’s website www.tillvaxtverket.se under English pages and Tourism industry issues and statistics, where you can also order or download this publication.


