
Family History and Risk Assessment in Black South African Women
with Breast Cancer
Ms Tasha Wainstein – 0611283G
BSc (Hons) Human Genetics
Supervisor -Prof Amanda Krause
MBBCh (Wits), PhD, Associate Professor and Head of Clinical Section
Co-supervisor - Ms Chantel van Wyk
MSc (Med) Genetic Counselling, Genetic Counsellor and Honourary
Associate Lecturer
NOVEMBER 2011
A research report submitted to the Faculty of Health Science, University of the Witwatersrand,
Johannesburg, in partial fulfillment of the requirements for the degree of Master of Science in Medicine in
the field of Genetic Counselling.

Page | ii
CANDIDATE’S DECLARATION
I, Tasha Wainstein, declare that this research report is my own, unaided work. It is being
submitted for the degree of Master of Science (Medicine) in Genetic Counselling at the
University of the Witwatersrand, Johannesburg. It has not been submitted before for any
degree or examination in any other University.
______________________________
Tasha Wainstein
11th day of November 2011

Page | iii
DEDICATION
For my family:
My mother, Donna Wainstein – a more strong-willed, brave and passionate woman than you
does not exist. Thank you for teaching me that even the most enormous of tasks can be
accomplished when you take one step at a time.
My father, Alan Wainstein – I am greatful to you for instilling in me the strongest work ethic
and for your unconditional love.
My sister, Kyra Wainstein - you have been an inspiration to me every day of my life. I am
greatful that I can always rely on your guidance and wisdom.
Also, for the women at the Breast and Plastic Clinic, Chris Hani Baragwanath Hospital:
Thank you for allowing me to use your information and for being willing to take the first steps
in finding answers for future generations of women.
Page | iv
ABSTRACT
Black South African women who have breast cancer have been found in general to be diagnosed at a
younger age, have a more aggressive disease and a poorer prognosis in comparison to their
Caucasian counterparts. However, there is a paucity of research related to the manner in which
breast cancer is inherited in black South African families. It is also not known whether these
individuals harbour deleterious mutations in breast cancer predisposition genes. As 5-10% of breast
cancers have been shown to be inherited, in white populations, this study aimed to investigate family
history and inheritance of breast cancer in black South African women. It also aimed to evaluate the
use and consistency of existing risk assessment models in this population.
A retrospective, file-based analysis of 45 black South African women who were diagnosed with breast
cancer before the age of 50 years was performed. The probands were ascertained from the Genetic
Counselling Clinic held weekly at the Breast and Plastic Clinic, Chris Hani Baragwanath Hospital.
Information was obtained from the subjects’ genetic counselling files as well as the Oncology
database that is housed at the Clinic. Information pertaining to the personal breast disease history of
the probands as well as their family histories (three generation pedigrees) was entered into a
spreadsheet and analysed.
The results of this study indicated that there were very few young black South African women with
breast cancer who had a significant family history of cancer (4/45; 9%). Family history is an important
factor in assessing an individual’s breast cancer risks. Results also suggested that age at diagnosis
may not be an appropriate predictor of inherited breast cancer risk in this population. A significant
proportion of black South African women diagnosed with breast cancer younger than 50 years might
be proven to have sporadic rather than inherited breast cancers.
Three risk assessment tools (The Claus Model, the Tyrer-Cuzick Model and the Manchester Scoring
system) were evaluated in this study. They were shown to have some degree of consistency and
each had unique advantages and disadvantages of use within this population. The main limitation of
these risk assessment tools is that they were designed based on data from Caucasian populations
and as such their applicability to a non-Caucasian population has not been validated. Their true
validity within this population can only be established once molecular genetic analysis has been
performed.
This study highlights the necessity of molecular genetic screening in this population in order to further
delineate which individuals in this population are truly at an increased risk of developing inherited
breast cancer. This information is important because it can inform which individuals would benefit
from cancer risk assessments and various cancer prevention and reduction strategies. Information
obtained from this study will be useful to direct future research in this population with respect to
genetic counselling for inherited breast cancer.

Page | v
ACKNOWLEDGEMENTS
“If I have seen further it is by standing on the shoulders of giants”
-Sir Isaac Newton (1676)
I greatfully acknowledge the following giants:
My supervisor, Professor Amanda Krause, for providing me with the opportunity to
perform this research and for all your support along the way. I am greatful for your faith
in my abilities, your painstaking comments on my work and your unparalleled intellectual
generosity.
My co-supervisor, Ms Chantel van Wyk, for taking an active interest in my work and for
all your encouragement and support along the way.
Dr Herbert Cubasch, for allowing me to carry out research in your clinic and for
welcoming me with open arms and boundless enthusiasm. Also, the staff of the Breast
and Plastic Clinic, CHB, especially Ms Nelly Ndwambi, for your assistance and
willingness to help.
Dr Robyn Kerr, for being the catalyst of this project and for your guidance and
encouragement.
Sr Merlyn Glass and Ms Shelley Macaulay for your always valuable advice, and for
having made this journey truly enjoyable and memorable for me. Thank you also for your
patience, warmth, generosity, friendship and kindness and for giving me a sense of
belonging.
Staff and students of the clinical and counselling section, Human Genetics Department,
in particular Ms Tina-Marié Wessels, Ms Marianne Gomes, Ms Noelene Kinsley, Ms
Suretha Erasmus, Ms Megan Morris, Ms Kara Stoler, Ms Chanelle le Roux, Dr Candice
Feben, Dr Anneline Lochan, Dr Shahida Moosa and Ms Tabitha Haw for support, comic
relief, care and friendship.
The University of The Witwatersrand (WITS) and the National Health Laboratory Service
(NHLS) for financial assistance.
Dr Lesley-Anne Katz for your assistance with some of the statistics and for your love.
Friends and extended family for moral and emotional support, patience and
understanding.

Page | vi
TABLE OF CONTENTS
CANDIDATE’S DECLARATION ................................................................................ ii
DEDICATION ............................................................................................................ iii
Abstract .................................................................................................................... iv
ACKNOWLEDGEMENTS .......................................................................................... v
Table of Contents .................................................................................................... vi
List of Figures ......................................................................................................... ix
List of Tables ............................................................................................................ x
Abbreviations .......................................................................................................... xi
1 Introduction ........................................................................................................ 1
1.1 Breast Cancer ....................................................................................................... 2
1.1.1 Breast Cancer Classification ............................................................................ 2
1.1.2 Receptors in Breast Cancer ............................................................................. 2
1.1.3 Breast Cancer Diagnosis, Treatment and Management ................................... 3
1.1.4 Risk Factors for Breast Cancer ........................................................................ 4
1.2 Breast Cancer Incidence and Epidemiology ....................................................... 6
1.2.1 Changing Breast Cancer Epidemiology in Africa .............................................. 6
1.3 Familial / Inherited Breast Cancer ....................................................................... 8
1.3.1 Cancer Genes .................................................................................................. 8
1.3.2 Hereditary Breast and Ovarian Cancer Syndrome ......................................... 10
1.3.3 BRCA1 and BRCA2 Genes ............................................................................ 10
1.4 Evidence for Inherited Breast Cancer in African Populations ......................... 12
1.4.1 Nigerian Studies ............................................................................................ 12
1.4.2 African-American Studies............................................................................... 13
1.5 HBOC in South Africa ......................................................................................... 14
1.6 Breast Cancer Cohort Profile ............................................................................. 15
1.7 Breast Cancer Genetic Counselling Services ................................................... 15
1.8 Breast Cancer Risk Assessment ....................................................................... 17
1.8.1 Baseline Risk Assessment ............................................................................. 17
1.8.2 Risk Assessment Tools .................................................................................. 17
1.8.3 Lifetime vs. Mutation Risks ............................................................................ 18
1.8.4 Applicability of Risk Assessment Tools in Non-Caucasian Populations .......... 20
1.9 Research Motivation and Questions ................................................................. 22

Page | vii
1.9.1 Aims and Objectives ...................................................................................... 23
2 Subjects and Methods ..................................................................................... 24
2.1 Subjects: ............................................................................................................. 24
2.1.1 Sample .......................................................................................................... 24
2.2 Methods ............................................................................................................... 26
2.2.1 Information and File Collection ....................................................................... 26
2.2.2 Terminology ................................................................................................... 27
2.2.3 Risk Assessment ........................................................................................... 30
2.2.4 Risk Assessment Consistency ....................................................................... 31
2.3 Data Analysis ...................................................................................................... 32
3 Results .............................................................................................................. 34
3.1 Demographics ..................................................................................................... 34
3.1.1 Age Range ..................................................................................................... 34
3.1.2 Ethnicity ......................................................................................................... 34
3.2 Breast Disease Profile ........................................................................................ 36
3.2.1 Stage at Presentation .................................................................................... 36
3.2.2 Receptor Status ............................................................................................. 37
3.2.3 Hormonal Factors Contributing to Breast Disease ......................................... 38
3.3 Pedigree Analysis ............................................................................................... 39
3.3.1 At-Risk Female Relatives ............................................................................... 39
3.3.2 Affected Relatives .......................................................................................... 39
3.4 Risk Assessment ................................................................................................ 44
3.4.1 Baseline Family History Risk Assessment ..................................................... 44
3.4.2 Claus Model ................................................................................................... 44
3.4.3 Tyrer-Cuzick Model ........................................................................................ 45
3.4.4 Manchester Scoring System .......................................................................... 47
3.5 Analysis of Risk Assessment Model Consistency ........................................... 48
3.5.1 Claus Model vs. Tyrer-Cuzick Model .............................................................. 48
3.5.2 Tyrer-Cuzick Model vs. Manchester Scoring System ..................................... 49
3.5.3 Comparison of All Models .............................................................................. 50
4 Discussion ....................................................................................................... 52
4.1 Demographics ..................................................................................................... 52
4.1.1 Socioeconomic and Cultural Factors .............................................................. 52
4.1.2 Age at diagnosis ............................................................................................ 53
4.2 Breast Disease Profile ........................................................................................ 55

Page | viii
4.3 Pedigree Analysis ............................................................................................... 57
4.3.1 Family Structure ............................................................................................. 57
4.3.2 Comparison of Maternal and Paternal Family Histories .................................. 58
4.3.3 Third Degree Relatives .................................................................................. 59
4.3.4 Other Cancers in the Family .......................................................................... 59
4.3.5 At-risk Female Relatives ................................................................................ 60
4.3.6 Comparison of At-risk and Affected Relatives ................................................ 60
4.4 Risk Assessment ................................................................................................ 61
4.4.1 Baseline Family History Risk Assessment ..................................................... 61
4.4.2 Claus Model ................................................................................................... 62
4.4.3 Tyrer-Cuzick Model ........................................................................................ 62
4.4.4 Manchester Scoring System .......................................................................... 63
4.4.5 Comparison of Risk Assessment Models ....................................................... 63
5 Conclusions ..................................................................................................... 66
5.1 Summary of Study Findings............................................................................... 66
5.2 Summary of Study Limitations .......................................................................... 68
5.3 Study Recommendations ................................................................................... 69
5.3.1 Recommendations for identifying black South African women at increased risk
for a familial breast cancer syndrome ........................................................................... 69
5.3.2 Recommendations for Future Research: ........................................................ 71
5.3.3 Recommendations Regarding the Genetic Counselling Service for Inherited
Breast Cancer: ............................................................................................................. 71
6 Literature Cited ................................................................................................ 73
6.1.1 Electronic Resources: .................................................................................... 77
7 Appendices ...................................................................................................... 79
7.1 Appendix 1 - Ethics Certificate .......................................................................... 79
7.2 Appendix 2 - Information Sheet and Informed Consent Form ......................... 80
7.3 Appendix 3 - Data Collection Sheets ................................................................. 82
7.4 Appendix 4 - Frequently Used Claus Tables ..................................................... 86
7.4.1 Claus Table 1................................................................................................. 86
7.4.2 Claus Table 2................................................................................................. 86
7.4.3 Claus Table 4................................................................................................. 87
7.5 Appendix 5 - Manchester Scoring System ........................................................ 88
Page | ix
LIST OF FIGURES
Figure 1-1 Independent factors that modify an individual's risk for breast cancer. Factors on the left
indicate those that increase breast cancer risk while those on the right indicate those that
decrease breast cancer risk (Adapted from Steiner et al., 2008). ...................................... 5
Figure 1-2 Process of risk assessment in the context of genetic counselling for Inherited Breast
Cancer syndromes............................................................................................................ 16
Figure 2-1 Hypothetical illustration of the first-, second- and third-degree females relatives of a
proband who would be considered at an increased risk of developing breast cancer in
their lifetime. ..................................................................................................................... 29
Figure 2-2 Summary of subject selection, data collection and methodology ....................................... 33
Figure 3-1 Ethnic origins of the individuals (n=30) who attended breast cancer genetic counselling
consultations ..................................................................................................................... 35
Figure 3-2 Age at breast cancer diagnosis of the probands (n=45) ..................................................... 35
Figure 3-3 Percentage of probands at each stage at presentation (n=41) .......................................... 37
Figure 3-4 Percent of probands having different numbers of affected relatives (n=45) ....................... 40
Figure 3-5 Family history pedigrees of four probands who were found to have two affected relatives:
(A) Proband with an affected half-sister (SDR) and an affected nephew (TDR). (B)
Proband with an affected maternal aunt (SDR) and an affected maternal grandmother
(SDR) ................................................................................................................................ 41
Figure 3-6 Family history pedigrees of the four probands who were found to have two affected
relatives: (C) Proband with an affected sister (FDR) and an affected grandmother (SDR).
The proband’s mother had leukaemia. (D) Proband with an affected cousin (TDR) and an
affected second cousin with bilateral disease. ................................................................. 42
Figure 3-7 Lifetime risks of developing breast cancer for 20 year-old FDR's of probands calculated by
the Claus Model of Risk Assessment (n=45) ................................................................... 45
Figure 3-8 Combined BRCA mutation risks for the families of the probands as predicted by the Tyrer-
Cuzick model (n=45) ......................................................................................................... 46
Figure 3-9 Distribution of relatives and families into categorical risks within each risk assessment
model ................................................................................................................................ 48
Figure 3-10 Comparison of risk output between (A) the Claus model and the Tyrer-Cuzick model and
(B) the Tyrer-Cuzick model and the Manchester scoring system .................................... 49
Figure 3-11 Single- Factor ANOVA analysis indicating the inconsistency of the various breast cancer
risk assessment platforms ................................................................................................ 51
Figure 4-1 2011 Mid-year population estimates for (A) black and (B) white South African Women
(Statistics South Africa, 2011) ........................................................................................ 54
Figure 5-1 Interim breast cancer risk assessment guidelines for black South African women ............ 70

Page | x
LIST OF TABLES
Table 1-1 Features of some genes associated with breast cancer susceptibility (Online
Mendelian Inheritance in Man [OMIM], 2011).................................................... 10
Table 1-2 Comparison of the features of BRCA1 and BRCA2, the two main genes
associated with HBOC (adapted from Haites and Gregory, 2002). .................... 11
Table 1-3 Common BRCA gene founder mutations in the Afrikaner and Ashkenazi Jewish
populations ....................................................................................................... 14
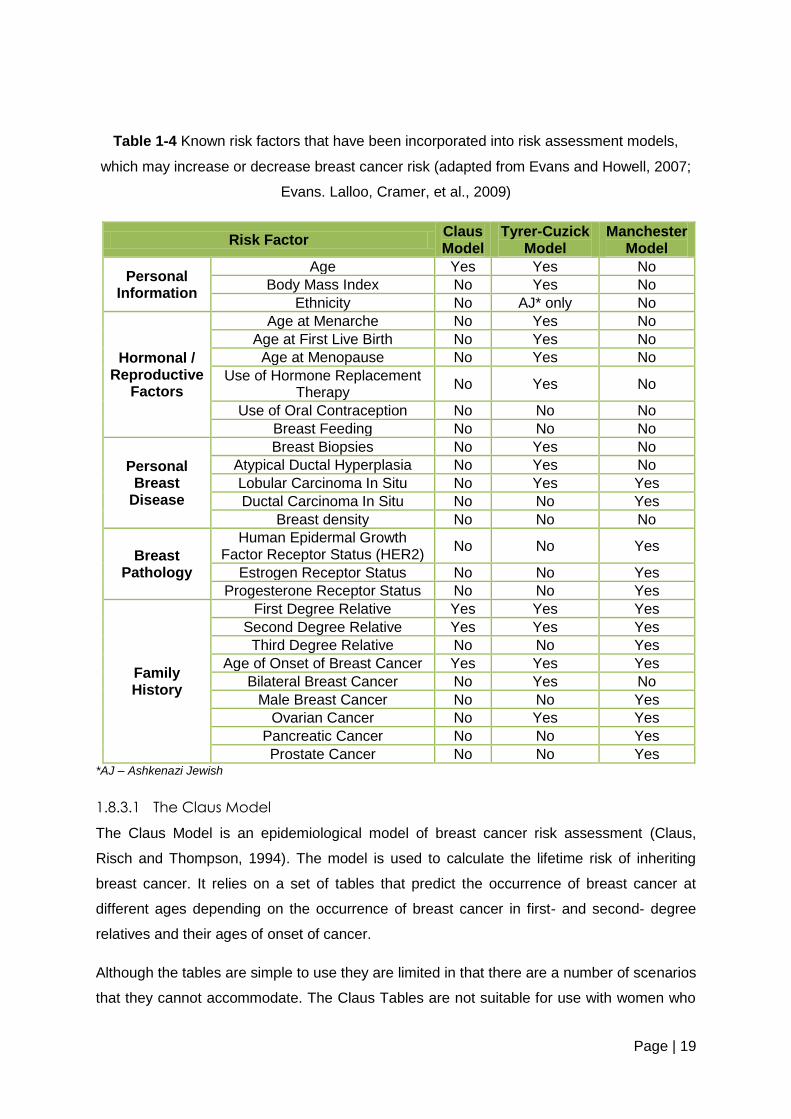
Table 1-4 Known risk factors that have been incorporated into risk assessment models,
which may increase or decrease breast cancer risk (adapted from Evans and
Howell, 2007; Evans. Lalloo, Cramer, et al., 2009) ........................................... 19
Table 2-1 Degrees of Relation (adapted from Harper, 1998) .............................................. 27
Table 2-2 Criteria for the stratification of individuals and families into risk groups according to
family history (adapted from Lee, Beattie, Crawford, et al., 2005) ..................... 30
Table 2-3 Information used to convert various risk assessment data outputs into a standard
format for use in statistical comparisons ........................................................... 32
Table 3-1 Receptor Phenotypes of Probands ..................................................................... 38
Table 3-2 Numbers of affected and at-risk female relatives of probands ............................. 39
Table 3-3 other types of cancers that were reported in the family histories of the probands 43
Table 3-4 Ranges and means of risk outputs from the Tyrer-Cuzick model ........................ 45
Table 3-5 Lifetime risk of developing breast cancer generated for a hypothetical 20-year old
FDR from the Tyrer-Cuzick model ..................................................................... 46

Page | xi
ABBREVIATIONS
AJCC American Joint Committee on Cancer
ANOVA Analysis of Variance
ATM Ataxia Telangiectasia Mutated
BRCA1 Breast Cancer Gene 1
BRCA2 Breast Cancer Gene 2
BRIP1 BRCA1 Interacting Protein C-terminal Helicase 1
CHB Chris Hani Baragwanath Hospital
CHEK2 Checkpoint Homologue
CMJAH Charlotte Maxeke Johannesburg Academic Hospital
DCIS Ductal Carcinoma in situ
ER Estrogen Receptor
ESO European School of Oncology
EUSOMA European Society of Breast Cancer Specialists
FDR First Degree Relative
FNA Fine Needle Aspiration
HBOC Hereditary Breast and Ovarian Cancer
HER2 Human Epidermal Growth Factor Receptor
HNPCC Hereditary Non-Polyposis Colorectal Cancer
IDC Invasive Ductal Carcinoma
ILC Invasive Lobular Carcinoma
LCIS Lobular Carcinoma in situ
MMR Mismatch Repair
OMIM Online Mendelian Inheritance in Man
NHLS National Health Laboratory Services
PALB2 Partner and Localizer of BRCA2
PR Progesterone Receptor
pTEN Phosphatase and Tensin Homologue
SDR Second Degree Relative
TDR Third Degree Relative
TNM Tumour; Node; Metastasis
TSG Tumour Suppressor Gene
WHO World Health Organisation
WITS University of the Witwatersrand

Page | 1
1 INTRODUCTION
Cancer (Latin for “crab”) is a term used to describe a group of non-communicable diseases
characterized by the rapid production of abnormal cells. These cells can grow beyond their
normal boundaries and invade nearby locations as well as more distant locations. Cancer
can occur in any part of the body however the most common sites are: lung, stomach, liver,
colon, rectum, cervix and breast (World Health Organization [WHO], 2011).
An alternative term to describe cancer is “Neoplasia” (“new growth”). However, this term
does not give any indication of whether or not a neoplasm (tumour) is benign or malignant.
This is an important differentiation to make since only a malignant neoplasm has the
potential to metastasize. Metastasis occurs when malignant tumour cells are transported to
locations at a distance from the primary site within the body. This usually has more drastic
implications for an individual than a benign tumour (Paterson and Cronje, 2008).
The focus of the current research is breast cancer, with particular reference to the role of
family history in predicting the occurrence of this form of cancer in the local black South
African population- a historically under-researched group. As an introduction to this topic
this chapter will describe the literature relating to pertinent aspects of breast cancer. The
discussion will start with a description of the most common types of breast cancer including
the inherited forms of breast cancer. Hereditary Breast and Ovarian Cancer syndrome
(HBOC) is the commonest inherited form of breast cancer. The two most common genes
associated with HBOC, namely, BRCA1 and BRCA2 will also be discussed. From this
foundation, breast cancer in the context of the developing world will be highlighted, with
specific reference to the local black South African population. The manner in which
individuals at risk of developing inherited breast cancer are identified will be highlighted.
Emerging from this discussion, this chapter will conclude with a description of the research
questions and specific objectives that were addressed in this research study.
Page | 2
1.1 Breast Cancer
Breast cancer refers to the presence of a malignant neoplasm in the breast tissue. Benign
tumours in the breast also occur. These are not life threatening but may predispose an
individual to developing malignant tumours of the breast at a later stage (Ely and Vioral,
2007). Breast cancer has traditionally been seen as a disease that mostly affects older
women. However younger women, as well as men, develop breast cancer.
Most breast cancer cases (90-95%) are thought to occur as a consequence of sporadic
mutations that accumulate during the lifetime of an individual. In fact, breast cancer may be
considered as having a multifactorial aetiology with genetic, hormonal, environmental,
nutritional and other influences all participating in its development (Jardines, Haffty, Fisher,
et al., 2005). An accumulation of somatic mutations eventually results in transformation of a
normal cell into one with malignant potential. Coupled with environmental influences, breast
cancer can develop (Haites and Gregory, 2002).
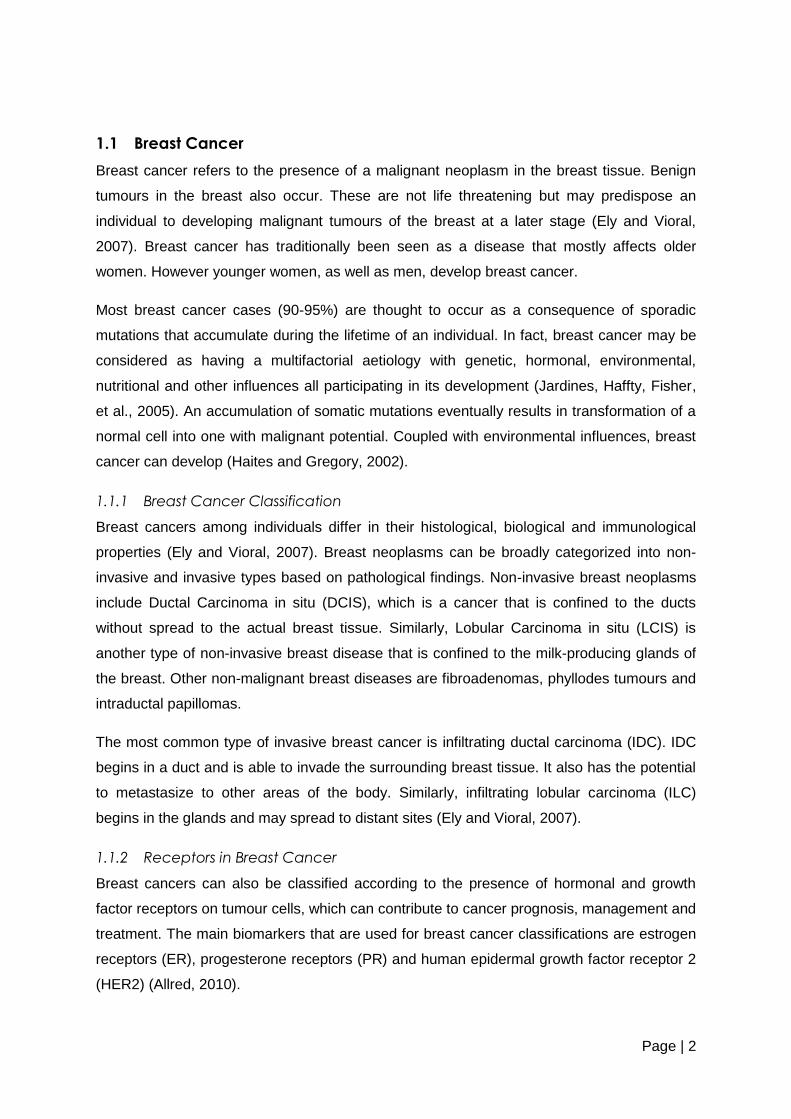
1.1.1 Breast Cancer Classification
Breast cancers among individuals differ in their histological, biological and immunological
properties (Ely and Vioral, 2007). Breast neoplasms can be broadly categorized into non-
invasive and invasive types based on pathological findings. Non-invasive breast neoplasms
include Ductal Carcinoma in situ (DCIS), which is a cancer that is confined to the ducts
without spread to the actual breast tissue. Similarly, Lobular Carcinoma in situ (LCIS) is
another type of non-invasive breast disease that is confined to the milk-producing glands of
the breast. Other non-malignant breast diseases are fibroadenomas, phyllodes tumours and
intraductal papillomas.
The most common type of invasive breast cancer is infiltrating ductal carcinoma (IDC). IDC
begins in a duct and is able to invade the surrounding breast tissue. It also has the potential
to metastasize to other areas of the body. Similarly, infiltrating lobular carcinoma (ILC)
begins in the glands and may spread to distant sites (Ely and Vioral, 2007).
1.1.2 Receptors in Breast Cancer
Breast cancers can also be classified according to the presence of hormonal and growth
factor receptors on tumour cells, which can contribute to cancer prognosis, management and
treatment. The main biomarkers that are used for breast cancer classifications are estrogen
receptors (ER), progesterone receptors (PR) and human epidermal growth factor receptor 2
(HER2) (Allred, 2010).

Page | 3
Estrogen receptors are activated by estrogen and assist growth regulation and differentiation
in normal breast cells. ER expression is predictive of response to hormonal therapies such
as Tamoxifen® and aromatase inhibitors. Approximately 75% of invasive breast cancers
express ER (Allred, 2010).
Progesterone receptors are expressed after activation by progesterone and are associated
with cell proliferation in normal and tumour cells. Although ER also regulates PR expression,
the two are not directly correlated. PR is a predictive factor for response to hormonal
therapy. Even tumours with low levels (≥1%) of PR-positive expression are able to respond
significantly to hormonal therapies like the aromatase inhibitors (Allred, 2010).
HER2 is an epidermal growth factor receptor that regulates cellular proliferation and
apoptosis. The gene encoding the HER2 receptor is up-regulated in 15% of invasive breast
cancers. HER2 expression contributes to chemotherapy choice. HER2-positive tumours
react positively to novel anti-body therapies (e.g. trastuzumab or Herceptin®) which
specifically target HER-2 proteins (Allred, 2010).
Four main phenotypes of expression can result when the three biomarkers are evaluated
together (ER/PR+, HER2+; ER/PR+, HER2-; ER/PR-, HER2+ and ER/PR-, HER2-). Each of
the phenotypes has been found to have different baseline characteristics as well as different
responses to hormonal therapies and eventual outcomes (Onitilo, Engel, Greenlee, et al.,
2009). Tumours that are negative for the expression of all three of these receptors (also
known as triple negative breast cancers) are commonly thought to be more difficult to treat
since they do not respond to hormonal or antibody therapy.
1.1.3 Breast Cancer Diagnosis, Treatment and Management
The process from breast cancer diagnosis to treatment is a multi-step one that may begin
with a physical examination of the breasts when cancer is suspected (O’Connell and Dickey,
2005). Baseline assessments to assess a potential breast cancer diagnosis include a
mammogram, ultrasound, fine needle aspiration (FNA) and core biopsy. Once a diagnosis of
breast cancer has been confirmed, additional tests may be requested (e.g. liver and bone
studies, full blood counts, CT scans and hormone receptor studies) in order to more fully
evaluate the cancer and determine whether metastasis has occurred (O’Connell and Dickey,
2005).
These procedures all contribute to the classification and staging of a tumour. These can be
assigned based on the American Joint Committee on Cancer’s (AJCC) Tumour, Nodes,
Metastases (TNM) staging for breast cancer. Staging is important as it gives an indication of
prognosis. TNM staging is evaluated clinically and then reiterated and adjusted after

Page | 4
histopathological analysis and surgical findings. A number is assigned for each of three
categories, namely: the size and extent of local penetration of a Tumour, the number of
cancerous lymph Nodes, and the presence or absence of distant Metastasis (spread).
Following staging, a tumour will be assigned a grade (from I to IV). This grade is reflective of
how advanced the cancer is (in other words, the higher the number the more advanced the
cancer). The assignment of a tumour to a stage and grade is complex. A comprehensive
explanation can be found at http://www.cancerstaging.org.
Surgery and treatment decisions are made in conjunction with a patient’s wishes based on a
review of imaging studies, clinical examinations as well as FNA, biopsy and histopathological
results (Hammer, Fanning and Crowe, 2008). Surgery is an essential component in the
treatment plan of almost all individuals who have been diagnosed with breast cancer.
Surgical protocol also dictates an assessment of the regional lymph nodes for metastasis
(Hammer et al, 2008).
Breast conservation therapy (also referred to as “partial mastectomy”, “segmental
mastectomy”, “quadrantectomy” or “lumpectomy”), is the process whereby the cancerous
area, as well as the immediate normal tissue surrounding it, is removed. The aim of such a
technique is to achieve a normal appearance of the breast after surgery. This procedure is
generally followed by a course of radiation therapy to treat the remaining breast tissue. This
procedure is not always possible especially in the case of multicentric or large tumours
(Hammer et al, 2008).
A modified radical mastectomy involves removal of the entire breast as well as indicated
lymph nodes but is performed in order to conserve the muscles surrounding the breast. A
simple (or “total”) mastectomy also removes the breast but leaves lymph nodes intact.
Improved aesthetic results can be achieved through the use of skin-sparing mastectomies
and nipple-areola-sparing mastectomies (Hammer et al, 2008).
Adjuvant chemotherapy is included when necessary and chemoprevention medication such
as Tamoxifen® is added if receptor studies indicate that this may be useful (O’Connell and
Dickey, 2005). Reconstruction surgery options are varied and also depend on the
requirements of the patient.
1.1.4 Risk Factors for Breast Cancer
It is important to understand the factors that contribute to an individual’s risk for breast
cancer since this leads to appropriate counselling, treatment and management. Further, it is
necessary to consider that causative and protective factors interact in a complex manner in
order for breast cancer to develop.

Page | 5
The most important risk factors in breast cancer are increasing age and female gender
(Steiner, Klubert and Knutson, 2008). Non-modifiable risks include reproductive factors as
well as genetic mutations and family history. Other modifiable factors that affect an
individual’s risk of developing breast cancer include diet, behaviour and lifestyle (Steiner et
al, 2008). Major factors that alter an individual’s risk for breast cancer are outlined in Figure
1-1.
Family history is the most significant risk factor in breast cancer since collectively it may
indicate the presence of a mutation in a breast cancer predisposing gene (discussed in detail
in section 1.3.1). In this case the risk of developing breast cancer (and other associated
cancers such as ovarian cancer) may be significantly increased.
Figure 1-1 Independent factors that modify an individual's risk for breast
cancer. Factors on the left indicate those that increase breast cancer risk while
those on the right indicate those that decrease breast cancer risk (Adapted from
Steiner et al., 2008).

Page | 6
1.2 Breast Cancer Incidence and Epidemiology
According to the WHO, breast cancer is responsible for ±380 000 female deaths per year
worldwide. The incidence of breast cancer is rising throughout the world, with breast cancer
steadily approaching similar figures to cervical cancer – the commonest cause of female
cancer deaths in the developing world (WHO, 2010). Significant variation in breast cancer
incidence does exist in different parts of the world (Akaralo-Anthony, Ogundiran, and
Adebamowo, 2010). In the United Kingdom, the risk for developing breast cancer in a
woman’s lifetime is 1 in 10 (Kerr, Lalloo, Clancy et al., 2010).
The most recent South African statistics show that the minimum lifetime risks of developing
breast cancer for Caucasian women are 1 in 11, 1 in 18 for women of mixed ancestry and 1
in 55 for African women (Mqoqi, Kellett, Sitas, et al., 2004; National Cancer Registry, 2009).
These lifetime risks are known to be underestimates as a consequence of the fact that data
are collected through a passive pathology-based surveillance system and many
malignancies go unreported. In addition, if information obtained about a particular individual
is incomplete, the related data are disregarded. Delays in publishing reports on South
African cancer statistics have been attributed to difficulties in receiving data from private
pathology laboratories (National Cancer Registry, 2010).
1.2.1 Changing Breast Cancer Epidemiology in Africa
Global incidence of breast cancer is rising steadily (Akaralo-Anthony, et al., 2010). Breast
cancer incidence is relatively lower in developing populations such as Asia and sub-Saharan
Africa. However, as urbanisation becomes increasingly prevalent, the incidence of breast
cancer in these populations is rising (Walker, Adam and Walker, 2004). In large part, this
can be attributed to an increased life expectancy due to changes in diet and reproductive
patterns. Nutritional changes and decreased physical activity have contributed to the age at
onset of menarche decreasing. In addition, better access to education as well as improved
lifestyle choices has caused a delay in the age of first pregnancy. This delay has further
prompted a decreased rate of fertility which in turn has lead to reduced lifetime breast
feeding duration (Akaralo-Anthony, et al., 2010). These changes are thought to influence an
altered pattern of breast cancer incidence.
In the past, this change in the epidemiological trend has constantly been eclipsed by the lack
of control over infectious diseases in developing populations. More recently however, there
has been an increase in attention given to the epidemic of breast cancer as its effects
become more and more apparent in developing countries, of which South Africa is a prime
example (Akaralo-Anthony, et al., 2010).

Page | 7
The black South African population appear to be following similar trends of breast cancer
incidence. Although incidence of breast cancer in this population is lower than Caucasian
and African-American populations, it is increasing.
Other breast cancer trends in African women include a younger age and later stage
presentation at diagnosis (Walker, et al., 2004). Stark, Kleer and Martin, et al., (2010)
indicate that these factors contribute to the rate of mortality in this population being
paradoxically higher than the incidence rate.

Page | 8
1.3 Familial / Inherited Breast Cancer
Although, post-menopausal women are more likely to develop breast cancer, there are an
increasing number of women under the age of 50 years who are developing breast cancer.
In the United States, 2.7% of women affected with breast cancer are younger than 35 years
old (Shannon and Smith, 2003). In Algeria, 55% of women affected with breast cancer are
younger than 50 years old (Uhrhammer, Abdelouahab, Lafarge et al., 2008). Younger
women affected with breast cancer are more likely to have an inherited/familial form of
breast cancer (Fackenthal, Sveen, Gao, et al., 2005).
Approximately 5-10% of all breast cancers are attributable to an inherited susceptibility
(Wood, 2010). An inherited susceptibility to breast cancer is suspected under one or more of
the following circumstances (Jardines, et al., 2005):
Young age at diagnosis
Multiple cases of close relatives with early-onset breast cancer
Ovarian cancer (within the context of a breast and ovarian cancer family history)
An individual with both breast and ovarian cancer (irrespective of age)
Bilateral breast cancer
Male breast cancer
Ancestry from a high risk population (e.g. Ashkenazi Jewish population)
1.3.1 Cancer Genes
Cell division is a highly regulated process dependent on transcription and translation of
genes. If this process malfunctions or is non-functional, cellular growth becomes
disregulated and may result in cancer formation. It has been found that some genes
controlling cell division are mutated in neoplastic tumours. These genes are categorised into
three groups based on their normal functions. They are: proto-oncogenes, tumour
suppressor genes and mismatch repair genes. Oncogenes and tumour suppressor genes
function together to ensure normal regulation of cell division (Paterson and Cronje, 2008).
Proto-oncogenes (e.g. the Ras or myc genes) produce proteins that stimulate cell
proliferation when prompted by internal and external cellular signals (Whalley and
Hammond, 2008). Only a single copy of a proto-oncogene needs to mutate for the gene to
cause unregulated cell division. Therefore conditions involving mutations in proto-oncogenes
are said to be dominantly inherited.
Tumour suppressor genes (TSG) play a fundamental role in regulation of transcription and
inhibition of cellular growth (Hammond, 2008). Tumour suppressor genes are recessive at
the cellular level and require both copies of the gene to be mutated to render a protein

Page | 9
product non-functional. At a phenotypic level, tumour suppressor genes are inherited in a
dominant pattern. Tumour suppressor genes include Breast Cancer Gene 1 (BRCA1),
Breast Cancer Gene 2 (BRCA2), p53 gene and Retinoblastoma gene (Rb) (Hammond,
2008).
DNA Mismatch Repair (MMR) is the mechanism by which erroneously incorporated or
deleted bases during DNA synthesis are corrected. In Hereditary Non-Polyposis Colorectal
Cancer (HNPCC) or Lynch Syndrome, MLH1, MSH2, and MSH6 mismatch repair genes
have been found to be defective (Capovilla, 2008).
If an inherited susceptibility exists in a family history with breast and/or ovarian cancer, it is
most commonly linked to mutations in cancer predisposing genes like BRCA1 or BRCA2.
Germline mutations of BRCA1 and BRCA2 can be heritable. BRCA1 and BRCA2 mutations
account for a large proportion of inherited breast and/or ovarian cancer cases in
European/Caucasian populations (Morrison, Hodgson and Haites, 2002).
Germline mutations in BRCA1 and BRCA2 do not however, account for all cases of familial
breast cancer. Accordingly, low penetrance susceptibility genes that play a role in the
aetiology of inherited breast cancer have also been identified. The commonality between
high (BRCA1, BRCA2, p53 and pTEN) and low (e.g. PALB2, CHEK2 and ATM) penetrance
breast cancer susceptibility genes is that they all function in DNA damage response
pathways (Venkitaraman, 2004).
Mutations in the p53 and pTEN genes have been found to confer high risks of breast cancer
in association with the rare genetic conditions, Li Fraumeni Syndrome and Cowden
Syndrome respectively (Walsh and King, 2007). Fanconi Anaemia, an autosomal recessive
condition that has a high risk of cancer susceptibility, can be caused by biallelic mutations in
BRCA2, PALB2 and BRIP1. Further, heterozygous mutations in PALB2, CHEK2, ATM and
others also confer increased breast cancer risks (approximately double) in the context of
inherited breast cancer. With consideration of all relevant loci and alleles, it is reasonable to
conclude that inherited breast cancer is a highly genetically heterogeneous condition (Walsh
and King, 2007).
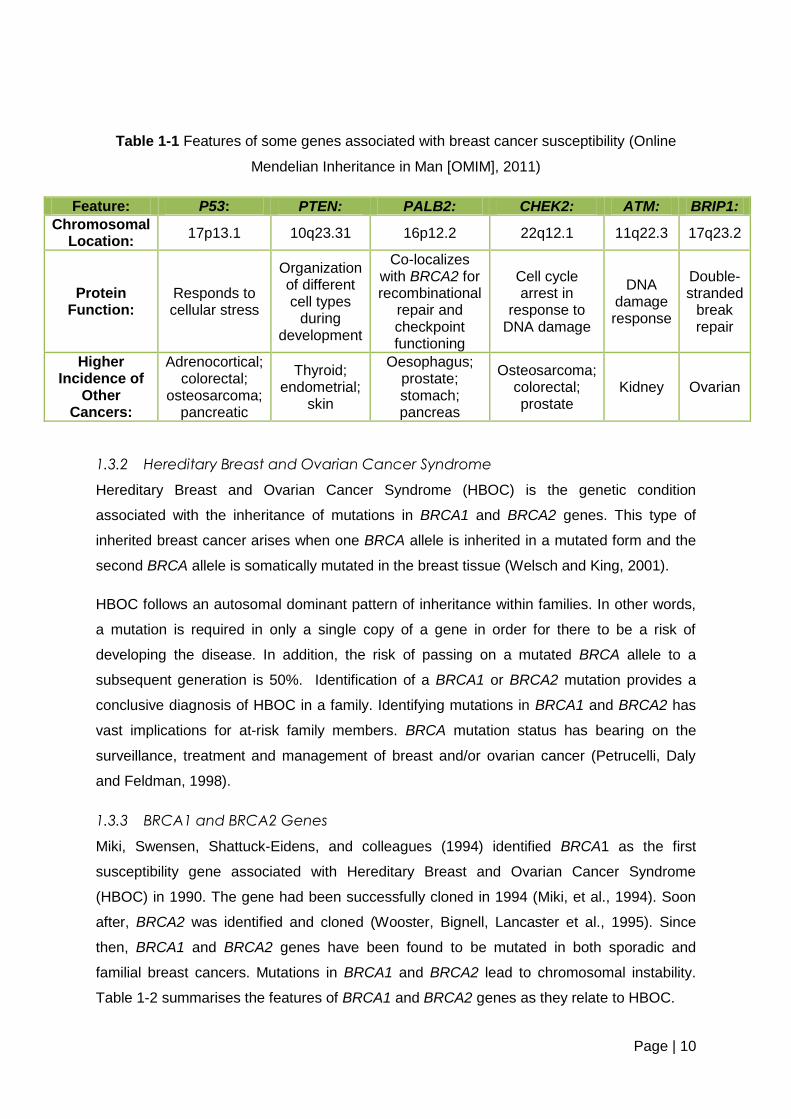
These breast cancer genes have also been found to confer increased risks for other cancers
when mutated. Details of these cancers as well as other aspects of the genes are listed in
table 1-1. Even in the absence of identifying a disease causing mutation, there is clear
benefit from being identified as high risk for developing breast cancer and these individuals
should be offered regular surveillance (Morrison et al., 2002).
Page | 10
Table 1-1 Features of some genes associated with breast cancer susceptibility (Online
Mendelian Inheritance in Man [OMIM], 2011)
Feature: P53: PTEN: PALB2: CHEK2: ATM: BRIP1:
Chromosomal Location:
17p13.1 10q23.31 16p12.2 22q12.1 11q22.3 17q23.2
Protein Function:
Responds to cellular stress
Organization of different cell types
during development
Co-localizes with BRCA2 for recombinational
repair and checkpoint functioning
Cell cycle arrest in
response to DNA damage
DNA damage response
Double-stranded
break repair
Higher Incidence of
Other Cancers:
Adrenocortical; colorectal;
osteosarcoma; pancreatic
Thyroid; endometrial;
skin
Oesophagus; prostate; stomach; pancreas
Osteosarcoma; colorectal; prostate
Kidney Ovarian
1.3.2 Hereditary Breast and Ovarian Cancer Syndrome
Hereditary Breast and Ovarian Cancer Syndrome (HBOC) is the genetic condition
associated with the inheritance of mutations in BRCA1 and BRCA2 genes. This type of
inherited breast cancer arises when one BRCA allele is inherited in a mutated form and the
second BRCA allele is somatically mutated in the breast tissue (Welsch and King, 2001).
HBOC follows an autosomal dominant pattern of inheritance within families. In other words,
a mutation is required in only a single copy of a gene in order for there to be a risk of
developing the disease. In addition, the risk of passing on a mutated BRCA allele to a
subsequent generation is 50%. Identification of a BRCA1 or BRCA2 mutation provides a
conclusive diagnosis of HBOC in a family. Identifying mutations in BRCA1 and BRCA2 has
vast implications for at-risk family members. BRCA mutation status has bearing on the
surveillance, treatment and management of breast and/or ovarian cancer (Petrucelli, Daly
and Feldman, 1998).
1.3.3 BRCA1 and BRCA2 Genes
Miki, Swensen, Shattuck-Eidens, and colleagues (1994) identified BRCA1 as the first
susceptibility gene associated with Hereditary Breast and Ovarian Cancer Syndrome
(HBOC) in 1990. The gene had been successfully cloned in 1994 (Miki, et al., 1994). Soon
after, BRCA2 was identified and cloned (Wooster, Bignell, Lancaster et al., 1995). Since
then, BRCA1 and BRCA2 genes have been found to be mutated in both sporadic and
familial breast cancers. Mutations in BRCA1 and BRCA2 lead to chromosomal instability.
Table 1-2 summarises the features of BRCA1 and BRCA2 genes as they relate to HBOC.

Page | 11
Table 1-2 Comparison of the features of BRCA1 and BRCA2, the two main genes
associated with HBOC (adapted from Haites and Gregory, 2002).
Feature: BRCA1: BRCA2:
Chromosomal Location: 17q21 13q12-13
Coding nucleotides 5592 11 385
Exons 22 27
Amino Acids in Protein 1863 3418
Protein Function: Cell Cycle Control and DNA
damage repair pathways Binding of RAD51
Higher Incidence of Other Cancers:
Ovarian; Colon; Prostate Stomach; Pancreas;
Gallbladder; Melanoma; Prostate
Rijnsburger, Obdejin and Kaas, et al., (2010), have further delineated the features of BRCA1
and BRCA2 mutation carriers. Their study revealed that in comparison with BRCA2 mutation
carriers, BRCA1 mutation carriers are:
Less likely to have tumours detected by mammography.
More likely to be negative for expression of oestrogen, progesterone and Her2/neu
receptors
Less likely to be histologically lobular carcinomas
More likely to develop interval cancers (i.e.: cancers detected between two screening
sessions).
Less likely to develop DCIS.
More likely to have an unfavourable tumour size (>2cm) at the time of diagnosis.
These differences in behaviour necessitate treatment and management programmes that
are tailored more specifically according to whether a tumour is BRCA1- or BRCA2-
associated (Rijnsburger, et al., 2010).

Page | 12
1.4 Evidence for Inherited Breast Cancer in African Populations
Akaralo-Anthony et al., (2010) state that high fertility rates coupled with high mortality rates
have resulted in the African population having a low median age. As a consequence, early
onset breast cancers account for a significant proportion of cases seen at breast cancer
clinics throughout the continent. They argue therefore, that the early age of onset of breast
cancer prevalent in this population is merely due to the low median age and is not
necessarily indicative of an inherent genetic basis for breast cancer in this population
(Akaralo-Anthony, et al., 2010).
Counter to this argument, the phenotype of breast cancer in African women is consistent
with the breast cancer burden that is seen in patients who have a known hereditary
susceptibility, especially to BRCA1 mutations. Since these characteristics (as outlined in
Section 1.3) seem to mirror those for hereditary susceptibility to breast cancer, it would seem
feasible that a significant family history of breast cancer may also characterize the breast
cancer burden in African individuals (Stark et al., 2010). The occurrence of a significant
family history in a lower risk population is therefore less likely to be a chance association.
Considering this, it seems apt to suggest that 5-10% of breast cancer cases can be ascribed
to an inherited susceptibility in this population irrespective of the different cancer burden and
risk profile.
There are few genetic studies regarding BRCA mutations in the African population.
Identification of African women at high risk of developing breast cancer could lead to further
investigations into germline mutations associated with familial/inherited breast cancer. In
addition, there may even be potential scope for improved treatment options especially for
triple negative breast cancer in African women (Stark, et al., 2010).
1.4.1 Nigerian Studies
In order to determine the frequency and spectrum of BRCA1 and BRCA2 mutations in a
Nigerian cohort, Fackenthal et al., (2005) peformed mutational analysis on 39 Nigerian
women with a breast cancer diagnosis under the age of 40 years and 74 controls. Patients
were ascertained for analysis from consecutive cases of newly diagnosed breast cancers
unselected for age or family history. The results revealed a large amount of mutational
variation in BRCA1 and BRCA2 however there was no evidence for a candidate founder
mutation. Of the 39 patients, 29 had at least one variation in either or both of the BRCA
genes. A total of 34 variants were identified, 4 in BRCA1 and 30 in BRCA2. These results
were indicative of a role for BRCA1 and BRCA2 in breast cancer risk in this population
(Fackenthal, et al., 2005).

Page | 13
Following this, complete BRCA1 and BRCA2 sequencing was performed on 434 Nigerian
women with breast cancer (Fackenthal, Zhang, Zhang, et al., 2011). Sixteen BRCA1
mutations (7.1%) were identified in the cohort, 7 of which were novel. In addition, 13 BRCA2
mutations (3.9%) were identified, 6 of which had not been previously reported. In these
patients, mutations were found to be more prevalent in those with family histories of breast
cancer as well as those diagnosed with breast cancer at a younger age (Fackenthal, et al.,
2011).
1.4.2 African-American Studies
In a review of breast cancer genetics in African Americans by Olopade, Fackenthal,
Dunston, et al., (2003), 26 distinct BRCA1 and 18 distinct BRCA2 pathogenic mutations
have been identified in this population. This spectrum of mutations is thought to be unique to
this population. In addition, 23% of pathogenic BRCA1 mutations and 17% of pathogenic
BRCA2 mutations were detected in more than one family of African or African-American
descent (Olopade, et al., 2003).
Traits that characterize breast cancer in African-American women include diagnosis at a
younger age, diagnosis of high grade triple negative receptor tumours (Stark et al., 2010) as
well as higher incidences of male breast cancer (O’Malley, Shema, White, et al., 2005). The
triple negative receptor phenotype (as well as other characteristics) in African-American
women diagnosed with breast cancer has been validated by similar findings in indigenous
African populations from Ghana (Stark et al., 2010), Kenya (Bird, Hill and Houssami, 2008)
and Nigeria and Senegal (Huo, Ikpatt, Khramstov, et al., 2009).

Page | 14
1.5 HBOC in South Africa
HBOC in South Africa is unique from a genetic perspective. Two well-known founder
populations, namely, the Afrikaans and Ashkenazi Jewish populations have been intensively
researched regarding their predispositions to genetic disease. For example, each of these
populations has been found to have common founder mutations in BRCA1 and BRCA2
genes (Table 1-3) (Struewing, Hartge, Wacholder, et al., 1997; Reeves, Yawitch, van der
Merwe, et al., 2004).
Table 1-3 Common BRCA gene founder mutations in the Afrikaner and Ashkenazi Jewish populations
Population: Common BRCA1 founder
mutations Common BRCA2 founder
mutations
Afrikaans c.1374delC; c.2641G>T
c.7934delG
Ashkenazi Jewish c.68_69delAG;
c.5266_5267insC c.5946delT
A third population, namely, the black South African population is not frequently thought of as
a founder population considering the general propensity of African populations towards
increased genetic diversity (Olopade, et al., 2003). Despite this, founder mutations have
been identified in the black population. Examples include founder mutations in the FANCG
gene resulting in Fanconi Anaemia (Morgan, Essop, Demuth, et al., 2005) as well as in the
HDL2 gene resulting in Huntington’s Disease (Magazi, Krause, Bonev, et al., 2008).
Research has not yet been done to ascertain whether or not founder mutations exist in the
Black South African population for HBOC. It is known however that the common mutations
found frequently in the Afrikaans and Ashkenazi Jewish populations and in African-American
populations (e.g. 943ins10 in BRCA1) have not been detected in black South African women
who have breast cancer (Neuhausen, 2000, Yawitch, van Rensburg, Mertz, et al., 2000).
Recently, it has been proposed that a “founder” BRCA2 mutation exists in a group of breast
cancer patients specific to the Western Cape region of South Africa. A c.5771_5774del
(p.Ile1924ArgfsX38) mutation in the BRCA2 gene was found in individuals from both the
mixed ancestry as well as Xhosa populations from this area. Gene flow is postulated to have
occurred from the indigenous Xhosa population to the mixed ancestry population, evidenced
by the common haplotype between them (van der Merwe, Hamel, Schneider, et al., 2011).

Page | 15
1.6 Breast Cancer Cohort Profile
The Breast and Plastic Clinic located at the Chris Hani Baragwanath Hospital (CHB) in
Southern Johannesburg is an academic surgical teaching unit dedicated to the diagnosis
and treatment of both benign and malignant breast conditions (SenoNetwork, 2010). The
clinic falls under the directorship of Dr Herbert Cubasch (FCS SA). The Hospital serves a
population of 2.5 million from Soweto and the surrounding areas. The out-patient clinic,
which runs every Wednesday, is responsible for diagnosis of breast cancer cases while
adjuvant chemo- and radio- therapy is performed at the Charlotte Maxeke Johannesburg
Academic Hospital (CMJAH). Both hospitals are associated with the University of the
Witwatersrand (WITS). The Breast and Plastic Clinic is recognised as a multidisciplinary
breast centre by SenoNetwork, an international network of breast cancer centres under the
joint guidance of the European Society of Breast Cancer Specialists (EUSOMA) and the
European School of Oncology (ESO) (SenoNetwork, 2010).
1.7 Breast Cancer Genetic Counselling Services
Genetic counselling services are available to those individuals at the Breast and Plastic
Clinic, CHB who appear to be at an increased risk of developing breast cancer based on
their family histories as well as other pertinent information (e.g. age at diagnosis or receptor
status). Genetic Counselling is provided based on the tenets set out in the definition below:
“Genetic counseling is the process of helping people understand and adapt
to the medical, psychological and familial implications of genetic
contributions to disease. This process integrates the following:
1) Interpretation of family and medical histories to assess the chance of disease occurrence or recurrence
2) Education about inheritance, testing, management, prevention, resources, and research
3) Counseling to promote informed choices and adaptation to the risk or condition”
(Resta, Biesecker, Bennett, et al., 2006).
A particular aim of breast cancer genetic counselling is to provide accurate and relevant
information regarding a patient’s genetic risk factors in a supportive and educational manner.
In order to guide treatment and management options for individuals with breast cancer as
well as surveillance and prophylaxis options for those family members who are at elevated
risk, risk assessment is essential. Risk assessment can also provide information regarding

Page | 16
whether or not patients require genetic testing (Wood, 2010). Further, risk assessment may
benefit at-risk relatives of a proband seeking genetic counselling and testing (Hampel,
Sweet, Westman, et al., 2003). Figure 1-2 depicts the manner in which risk assessment is
used in the genetic counselling process for breast cancer.
Figure 1-2 Process of risk assessment in the context of genetic counselling for Inherited Breast Cancer syndromes

Page | 17
1.8 Breast Cancer Risk Assessment
Risk assessment can be calculated for a family based on their collective history of breast
cancer. Alternatively, risk assessment can be calculated for an individual based on her/his
personal and family history of cancer. This categorisation is useful in indicating the level of
screening and surveillance that would be prudent for that grouping to follow (Section 2.2.4.1
and Table 2-2). In other words, those families found to be at average risk would not require
increased surveillance; screening recommendations for the general population would apply.
An increased risk for cancer would be conferred on those families found to be at moderate
risk; these families would require increased cancer surveillance. In high risk families, the
family history would be indicative of an inherited cancer syndrome; these families would
benefit from increased cancer surveillance as well as genetic follow-up (Hampel, et al.,
2003).
1.8.1 Baseline Risk Assessment
The risk of having an inherited cancer syndrome in a family is initially assessed based on a
review of the family history. Families can be stratified into average, moderate or high risk of
having an inherited cancer syndrome.
Baseline risk based on family history incorporates:
The proband’s own risk for cancer (e.g. age and gender).
The number of people in the family and the proportion of those people who are
affected with breast cancer.
The degree of relationship, the ethnic background and the type of cancer of affected
family members (Lalloo, Kerr, Friedman, et al., 2005).
In families where an inherited cancer risk exists, a clear autosomal dominant pattern of
inheritance may be observed. However, penetrance and expressivity of a gene may modify
this pattern. Ethnicity (e.g. Ashkenazi Jewish, Finnish, Afrikaans populations) is a particularly
relevant factor to take into consideration since in the absence of a significant family history it
may still indicate a high-risk family (Lalloo et al., 2005).
1.8.2 Risk Assessment Tools
There are numerous risk assessment models that have been developed in order to assess
an individual’s risk of developing breast cancer. Commonly used models are: the Gail model,
the Tyrer-Cuzick Model, the BRCAPRO model, the Manchester Scoring Model, the Claus
Page | 18
Model and the Breast and Ovarian Analysis of Disease Incidence and Carrier Estimation
Algorithm (BOADICEA) model.
These models have been developed for use by individuals from all population groups. The
data used to develop these models however, are taken predominantly from women of
Caucasian descent. They therefore may not be as valid for women of other ethnic groups.
Each of the models calculates risk based on different combinations of breast cancer risk
factors.
1.8.3 Lifetime vs. Mutation Risks
Breast cancer risk is assessed in one of two ways. Some models assess the likelihood of an
individual developing breast cancer in that individual’s lifetime (e.g. Gail Model, Claus
Model). Alternatively, they assess the likelihood that an individual carries a mutation in a
high-risk gene such as BRCA1 and BRCA2 (e.g. Manchester scoring system, BRCAPRO).
Some models of breast cancer risk (e.g. Tyrer-Cuzick Model, BOADICEA) are able to
assess both of these factors simultaneously (Evans and Howell, 2007).
Various evaluations of risk assessment models have shown that no particular model is able
to provide the best risk estimates under all circumstances (Amir, Freedman, Seruga, et al.,
2010). In addition, all models are limited in a number of ways; the ability to factor in adoption
and family size being two common limitations. Analyses have shown that the Gail, Claus and
BRCAPRO models all under-estimate risk especially when a proband only has a single
affected FDR. The BRCAPRO and Tyrer-Cuzick models are both superior in estimating risk
based on a family history of ovarian cancer. The Claus model has repeatedly been shown to
under-estimate risk; however, its ease-of-use makes it an obvious and common choice.
Overall, the Tyrer-Cuzick and BOADICEA models seem to perform the best and most
accurately. Ultimately, risk model performance is highly dependent on circumstance (Amir, et
al., 2010).
The advantages and limitations of each of these programmes are an important consideration
to keep in mind when performing risk assessments. The selection of a particular risk
assessment tool over another often needs to be made on a case by case evaluation. Based
on the relative pros and cons of each of these models as well as their ease of access and
usability, the Claus Model, the Manchester Scoring System and the Tyrer-Cuzick Model
were selected for use in this study. Table 1-4 summarises the risk factors that are taken into
consideration by each of these three models of risk assessment.
Page | 19
Table 1-4 Known risk factors that have been incorporated into risk assessment models,
which may increase or decrease breast cancer risk (adapted from Evans and Howell, 2007;
Evans. Lalloo, Cramer, et al., 2009)
Risk Factor Claus Model
Tyrer-Cuzick Model
Manchester Model
Personal Information
Age Yes Yes No
Body Mass Index No Yes No
Ethnicity No AJ* only No
Hormonal / Reproductive
Factors
Age at Menarche No Yes No
Age at First Live Birth No Yes No
Age at Menopause No Yes No
Use of Hormone Replacement Therapy
No Yes No
Use of Oral Contraception No No No
Breast Feeding No No No
Personal Breast
Disease
Breast Biopsies No Yes No
Atypical Ductal Hyperplasia No Yes No
Lobular Carcinoma In Situ No Yes Yes
Ductal Carcinoma In Situ No No Yes
Breast density No No No
Breast Pathology
Human Epidermal Growth Factor Receptor Status (HER2)
No No Yes
Estrogen Receptor Status No No Yes
Progesterone Receptor Status No No Yes
Family History
First Degree Relative Yes Yes Yes
Second Degree Relative Yes Yes Yes
Third Degree Relative No No Yes
Age of Onset of Breast Cancer Yes Yes Yes
Bilateral Breast Cancer No Yes No
Male Breast Cancer No No Yes
Ovarian Cancer No Yes Yes
Pancreatic Cancer No No Yes
Prostate Cancer No No Yes *AJ – Ashkenazi Jewish
1.8.3.1 The Claus Model
The Claus Model is an epidemiological model of breast cancer risk assessment (Claus,
Risch and Thompson, 1994). The model is used to calculate the lifetime risk of inheriting
breast cancer. It relies on a set of tables that predict the occurrence of breast cancer at
different ages depending on the occurrence of breast cancer in first- and second- degree
relatives and their ages of onset of cancer.
Although the tables are simple to use they are limited in that there are a number of scenarios
that they cannot accommodate. The Claus Tables are not suitable for use with women who

Page | 20
have more than three affected relatives (Claus, et al., 1994). Further, the Claus model does
not take into consideration any non-familial breast cancer risk factors (Rubinstein, O’Neill,
Pieters, et al., 2002). Considering the Claus tables were designed to reflect the risks for
breast cancer in the 1980’s in the USA, it is necessary to adjust the resultant lifetime risk
predictions in order to reflect current incidence rates (Evans and Howell, 2007).
1.8.3.2 The Tyrer-Cuzick Model
The Tyrer-Cuzick Model calculates a risk for both outputs of risk assessment (i.e.: lifetime
and mutation risks) (Evans and Howell, 2007). This computer model evaluates risk more
comprehensively based on extensive family history, endogenous estrogen exposure and
benign breast disease (Evans and Howell, 2007). There are three outputs of the model:
10-year risk prediction
Beyond 10-year risk prediction (i.e.: lifetime risk prediction)
Mutation risk output (Boughey, Hartmann, Anderson, et al., 2010).
The key advantage of the Tyrer-Cuzick model is that it incorporates multiple genes with
varying degrees of penetrance (Evans and Howell, 2007). The Tyrer-Cuzick model has
however been found to over-estimate the risk of breast cancer especially in women who
have benign breast disease (Boughey, et al., 2010).
1.8.3.3 The Manchester Model
The Manchester scoring system estimates the risk of harbouring a mutation in one of the two
main predisposing breast cancer genes (BRCA1 and BRCA2) (Evans, Eccles, Rahman, et
al., 2004). A score is assigned for each cancer on the same side of the family (i.e.: in a direct
blood line). The scoring system also includes the presence of ovarian, pancreatic and
prostate cancers in a family history (Antoniou, Hardy, Walker, et al., 2008). A combined
score of 16 points is used as a 10% threshold and a combined score of ≥ 20 corresponds to
a 20% threshold (Evans, et al., 2004; Evans et al., 2009). Thresholds have been
implemented as cut-offs for testing based on cost-benefit analyses since genetic testing of
BRCA1 and BRCA2 is a costly exercise. The Manchester scoring system has higher
sensitivity but lower specificity in comparison with other models when 10% and 20%
thresholds are utilised (Antoniou, et al., 2008).
1.8.4 Applicability of Risk Assessment Tools in Non-Caucasian Populations
Considering risk assessment models have been designed and implemented based on data
predominantly from Caucasian populations, it is reasonable to question their accuracy in a
non-Caucasian population. Bondy and Newman (2003) reviewed the usefulness of the Gail
Page | 21
and Claus models in African-American women. The Gail model proved to be particularly
limited in its generalizability to the African-American population.
The Claus model calculates risk based on the number and ages of first degree relatives with
breast cancer. It would therefore seem that this approach would be less likely to have ethnic
disparities given that family history data are considered a reliable breast cancer risk factor. In
accordance with this, McTiernan, Kuniyuki and Yasui et al., (2001) showed that the Gail
model gave a lower average lifetime risk (6.1%) in an African-American population than the
Claus Model (10.3%). The Gail model and the modified Gail model have since been shown
to significantly underestimate the lifetime risk of developing breast cancer in African-
American women (Adams-Cambell, Makambi, Palmer et al., 2007). In a Caucasian
population the average lifetime risk as calculated according to the Gail model was 13.2%
compared to 11.2% according to the Claus model. Despite this, reliable evaluation was not
possible due to small sample sizes in the African-American population and the associated
lack of statistical power (Bondy and Newman, 2003).
Bondy and Newman (2003) describe significant differences among individual breast cancer
risk factors between African-American and Caucasian women. These authors concluded that
it is likely that risk assessment models would require significant modification in order to be
applicable to an ethnically diverse patient group.
Currently, there are no data that give any indication of the performance of these models in
the local South African population. In addition, no research has been done to assess the use
of the Tyrer-Cuzick model and the Manchester Scoring System in other population groups.

Page | 22
1.9 Research Motivation and Questions
Little has been documented about family history and inheritance of breast cancer within
black South African families despite the increasing incidence of the condition in this
population (Walker, et al., 2004). It would therefore be useful to examine whether or not
there are significant family histories in black South African women who have breast cancer.
Through this, it may be possible to determine which individuals are likely to be at an
increased risk of developing familial breast cancer. These at-risk individuals may then be
able to participate in cancer risk assessments and various cancer prevention or reduction
strategies. This study was therefore designed and implemented in order to answer the
following questions:
Do black South African women who have been diagnosed with breast cancer have
significant family histories of breast cancer?
How do existing risk assessment models perform in black South African women who
have been diagnosed with breast cancer?
In order to answer these questions, black South African women who had been diagnosed
with breast cancer at a younger age or who had a known family history of breast cancer will
be assessed. This information was used to ascertain which individuals in this population
could be considered at increased risk of developing breast cancer via the use of existing
breast cancer risk assessment models and programmes. In addition, the information
obtained may be useful to direct future studies which would aim to examine whether or not
mutations exist in the BRCA (and other) genes of these individuals and ultimately assess
which risk assessment tool is the most accurate for black South African women. The results
obtained in this study might also contribute to the development of a new risk assessment
tool to better serve the needs of this population.

Page | 23
1.9.1 Aims and Objectives
In order to achieve the above-mentioned aims, the following specific objectives were
proposed:
1. To obtain the family histories and personal breast disease histories from black South
African women who were:
a. Diagnosed with breast cancer under the age of 50 years.
b. Diagnosed with breast cancer at any age AND who have a known family
history of breast and/or ovarian cancer.
2. To use the information gathered from these individuals to delineate the breast
disease profile of breast cancer in black South African women.
3. To use the information gathered from these individuals to determine the number of
first-, second- and third- degree relatives of affected women who are at increased
risk of developing breast cancer.
4. To use the information gathered from these individuals to calculate the risks for these
women / their offspring / other family members developing cancer in their lifetime or
of having a predisposing breast cancer gene mutation using three different risk
assessment programmes.
5. To compare the consistency of these risk assessment programmes in black South
African women.
Page | 24
2 SUBJECTS AND METHODS
The study was descriptive, retrospective and file-based and the analysis was quantitative in
nature. Ethics approval was obtained from the Human Research Ethics Committee
(Medical), Faculty of Health Sciences, the University of the Witwatersrand, reference
number: M10961 (Appendix 1).
This chapter will provide a description of the subjects that were selected to participate in the
study as well as the manner in which they were recruited. The chapter will also detail the
methods that were employed in order to obtain subject data. Finally, the chapter describes
analysis of data.
2.1 Subjects:
The population under investigation in this study was black South African women. The
subjects were ascertained through convenience sampling at the Genetic Counselling Clinic
held every Wednesday at the Breast and Plastic Clinic (as discussed in 1.6). The Genetic
Counselling Clinic is run by the Department of Human Genetics, National Health Laboratory
Service (NHLS) and University of the Witwatersrand (WITS). Subjects who underwent
genetic counselling as part of their routine management were asked to participate in the
study after their consultation by giving consent for the use of their genetic counselling files in
a research study. Informed consent for the use of these files was obtained (refer to Appendix
2 for information sheet and consent form). Subjects who were seen at the clinic between
June 2010 and June 2011 were approached. These subjects also had the option of having
blood taken for DNA banking and signed written consent for future diagnostic and research
testing in this regard.
2.1.1 Sample
From the inception of the Genetic Counselling Service at the Breast and Plastic Clinic (CHB)
in June 2010 until June 2011, 60 individuals with a confirmed diagnosis of breast cancer
have been seen for genetic counselling. Forty-five individuals were included in the study
based on the criteria outlined in section 2.1.1.1 below. Fifteen individuals were excluded
from the study based on the criteria outlined in section 2.1.1.2.
Page | 25
2.1.1.1 Inclusion Criteria
The following individuals were included in the study:
Black South African women who had a confirmed diagnosis of any type of breast
cancer between the ages of 18 and 50 years. .
Black South African women who had a confirmed diagnosis of any type of breast
cancer at any age in addition to having a first-; second-; or third-degree relative with
breast and/or ovarian cancer.
2.1.1.2 Exclusion Criteria
The following individuals were excluded from the study:
Black South African women who had been diagnosed with breast cancer over 50
years of age and did not have other affected relatives with clinically confirmed breast
and/or ovarian cancers (0).
Women seen at the Genetic Counselling Clinic who were of mixed, white, Indian or
non-South African ancestry (14).
Women whose files did not have sufficient information (1).
Women who did not give consent to participate in the study (0).

Page | 26
2.2 Methods
2.2.1 Information and File Collection
Three-generation pedigrees and risk assessments are performed routinely in genetic
counselling consultations. Counselling files in the Division of Human Genetics, NHLS and
WITS should thus contain standard information regarding the counsellee(s). Information that
was obtained from the genetic counselling files of the 45 selected subjects included: family
history data of breast and related cancers, previous breast disease history, tumour histology
and hormonal receptor status and other breast cancer risk factors.
Information regarding breast cancer histology (e.g. hormonal receptor status and staging
and grading) was also obtained from the Oncology database with the permission of Dr
Herbert Cubasch (Head of Breast and Plastic Clinic, CHB). The database is housed at the
Clinic at CHB and contains information regarding each patient’s diagnosis, histology, and
treatment plan and surgery details. This information was recorded in the genetic counselling
files of the counsellees, in addition to the standard information described above.
It was important that the full names of the subjects were known to the counsellor/s involved
with the case as well as for the purpose of the research. This information could then be used
to link other affected relatives involved in the study, making family history data more reliable.
Once this had been established, a unique “Breast Cancer File Code” was assigned to each
file in order to maintain anonymity for the study. Each of the 45 files represented an
individual with breast cancer. No individuals that were selected were found to be related to
any other individuals.
The researcher was involved in the majority of the genetic counselling sessions and thus
obtained consent from these counsellees herself. For those cases in which the researcher
was not present, the genetic counsellor involved in the case was requested to obtain
consent from the counsellee. The researcher located all the required patient files in the
Department of Human Genetics. Additional information was obtained from the Oncology
database where possible.
2.2.1.1 Data Collection
Information obtained from the files was collated on a data collection sheet that had been
designed for the purposes of the study (refer to Appendix 3). The data collection sheet was
divided into four main sections: general information regarding the proband(s), family history
data of the proband(s), breast disease history of the proband(s) and the risk assessment
data for the proband(s) that was calculated based on the information from the three previous
categories.

Page | 27
General information that was gathered regarding the counsellee(s) included their ages,
gender, ethnic origin and their employment status. The family history data that were obtained
included a three-generation pedigree drawing that detailed the ages, dates of birth, types of
cancer and causes of death for all relevant relatives. These data were used to assess the
number of affected, unaffected and at-risk relatives within the family. The type, laterality,
staging, histology and other factors regarding the proband’s breast cancer were recorded
under the breast disease history heading. Lastly, the risk assessment data was recorded for
the Claus, Tyrer-Cuzick and Manchester outputs (Sections 1.6.3.2 – 1.6.3.3).
2.2.2 Terminology
The following considerations and definitions were taken into account when data were
obtained from the files:
The term “proband” referred to the individual affected with breast cancer. The proband was
also the individual who attended the Genetic Counselling Clinic. The minimum proband age
for the study was 18 years. The maximum age was 50 years or greater than 50 years if the
proband had a family history of breast cancer. The proband had to have a confirmed
diagnosis of breast cancer in order to be considered for participation in the study.
A “relative” referred to an individual who is related to the proband by blood. This therefore
excluded individuals who were related to the proband by marriage or adoption. Relatives
were further stratified as presented in Table 2-1:
Table 2-1 Degrees of Relation (adapted from Harper, 1998)
Type: Individuals Considered:
Amount of Genetic
Information shared
with Proband (%):
First Degree Relative
(FDR)
Sibling, dizygotic twin, parent,
child 50
Second Degree
Relative (SDR)
Half sibling, uncle, aunt, nephew,
niece, double first cousin,
grandparent
25
Third Degree
Relative (TDR)
First cousin, half-uncle, half-aunt,
half-nephew, half-niece 12.5

Page | 28
“Ethnic origin” of the proband was determined using first-language as a proxy. This was
possible since first language is most commonly chosen from one of the 11 official languages
of South Africa based on its relation to a kinship or ethnic population group (Byrnes, 1996).
Language was determined from patient-reported information during the counselling session
as obtained from the counselling file. Pedigree Analysis
In order to explore the relationship between family history and the occurrence of breast
cancer in black South African women, the family histories of the subjects were examined and
categorized based on the number of affected and unaffected first- second- and third-degree
relatives. Other factors were also examined such as the age of onset of cancers in these
relatives, the types of cancer as well as the age and cause of death.
In order to assess the number of affected, unaffected and at-risk relatives in a family, the
pedigree was redrawn on the data sheet and analysed. In instances where a proband had
more than one consultation, the most recent pedigree was utilised. No identifiable
information (names or surnames) were included on the pedigree for the relatives of the
proband.
“At-risk female relatives” referred to as first-, second- and third- degree relatives, were
deemed to be at an increased risk of developing breast cancer in their lifetime based on the
numbers of affected members of the family (refer to Figure 2-1). The at-risk female relatives
included relatives from the proband’s generation as well as the generations directly above
and below the proband. “At-risk” relatives were not age stratified. Consequently, some
individuals who were classified as “at-risk” were young. Males were excluded from the “at-
risk” group based on the consideration that breast cancer is 100 times more common in
women than in men (Bernstein, 2003).

Page | 29
Figure 2-1 Hypothetical illustration of the first-, second- and third-degree females relatives of a proband who would be
considered at an increased risk of developing breast cancer in their lifetime.

Page | 30
2.2.3 Risk Assessment
The data collected from the personal and family history information were used for risk
calculations. Initially, baseline risk was assessed through an examination of the pedigree
only. Following this, pedigree information and personal breast disease history was used to
calculate risks using the various tools. In order for the results to be consistent and
comparable to one another, lifetime risks were calculated for a hypothetical first-degree
relative of the proband who was twenty-years old and mutation risks were calculated for the
family. These risk assessments were carried out using three different methods, namely: The
Claus Model, the Tyrer-Cuzick Model and The Manchester scoring system. These risk
assessments were compared to the baseline risk according to the pedigree analysis.
2.2.3.1 Baseline Family History Risk Assessment
Probands were differentiated into three categories based on their age and/or family histories.
The criteria for inclusion into an average, moderate or high risk category are outlined in
Table 2-2.
Table 2-2 Criteria for the stratification of individuals and families into risk groups according to
family history (adapted from Lee, Beattie, Crawford, et al., 2005)
Risk Category:
Criteria:
Average
One relative with breast cancer over 50 years old
One breast cancer under 50 years old in a second degree relative with an otherwise negative family history
One cancer in the proband or in a FDR/SDR that is not a hereditary “red-flag” cancer site (e.g. ovarian, fallopian tube, melanoma, colorectal, pancreatic,
gastric, bile duct, uterine, or “abdominal”)
Moderate
One breast cancer under age 50 years in a first or second degree paternal relative
Any one of the “red-flag” cancers listed above in the proband or in one FDR
Family history of two or more breast cancers at any age
High
Two or more breast cancers with at least one under age 50 years on the same side of the family
Proband with breast cancer under the age of 40 years
Male breast cancer
Two or more “red-flag” cancers in the proband or on one side of the family
Proband has breast or colorectal cancer under the age of 50 or ovarian cancer at any age and the maternal/paternal history is unknown
Breast and ovarian cancer on the same side of the family
Any family member with bilateral breast cancer
Page | 31
2.2.3.2 The Claus Model
The Claus model is an epidemiological model. The model calculates the lifetime risk of
developing breast cancer for a relative of the subject. For consistency, a hypothetical 20-
year old FDR of the proband was used for calculations. It relies on a set of tables that predict
the occurrence of breast cancer at different ages depending on the occurrence of breast
cancer in first- and second- degree relatives and their ages of onset of cancer (refer to
Appendix 4 for Claus Tables frequently used in this study). The Claus model does not take
into consideration any non-familial breast cancer risk factors (Rubinstein, et al., 2002).
2.2.3.3 The Tyrer-Cuzick Model
The Tyrer-Cuzick Model calculated a risk for both outputs (i.e. lifetime and mutation risks).
This computer model evaluates risk based on extensive family history, endogenous
oestrogen exposure and benign breast disease. There were three outputs of the model,
namely, a 10-year risk prediction, a beyond 10-year risk prediction (lifetime risk) as well as
the mutation risk output (Boughey, et al., 2010). The mutation risk probabilities are
calculated with consideration of an autosomal dominant pattern of inheritance and thus
would not exceed 50% for a 20 year old FDR.
2.2.3.4 The Manchester Scoring System
The Manchester scoring system was utilized in order to estimate the risk of the proband’s
family harbouring a mutation in one of the two main predisposing breast cancer genes
(BRCA1 and BRCA2). A score is assigned for each cancer on the same side of the family
(i.e. in a direct blood line). Scores for BRCA1 and BRCA2 are combined to give an overall
score (refer to Appendix 4 for Manchester Scoring System) (Antoniu, et al., 2008).
2.2.4 Risk Assessment Consistency
Each of the models used to analyse risk in this study provided an output in an alternate
format (i.e.: categorical; ratio; percentage; score). In order to evaluate whether or not the risk
outputs of these models were consistent, it was necessary to convert all of the output data
into a single format. For the purposes of this research, a categorical format was selected in
the form: average risk, moderate risk, or high risk. The output data were converted and
categorised based on the information outlined in Table 2-3 below. Following this, further
statistical analyses could be done in order to compare the consistency of these models.

Page | 32
Table 2-3 Information used to convert various risk assessment data outputs into a standard
format for use in statistical comparisons
Original Risk
Output Format:
Alteration To: Reference:
Average Moderate High
Family History Risk Categorical N/A N/A N/A N/A
Claus Output Ratio (converted to percentage)
<17% 17-30% ≥30% NICE (2006)
Tyrer-Cuzick Output 1 (Lifetime Risk)
Percentage <17% 17-30% ≥30% NICE (2006)
Tyrer-Cuzick Output 2 (BRCA Mutation
Risk) Percentage <3% 3.0-9.9% ≥10%
Evans, G., 2011, personal communication,
18 July
Manchester Output Score <10 10-20 >20 Evans, G., 2011,
personal communication, 18 July
2.3 Data Analysis
Data analysis was performed by examining the similarities and differences in the family
histories of the black women who have had breast cancer. The risks that were generated by
the three models as well as the baseline risk assessments were compared and contrasted in
order to determine their consistency.
The data generated were entered into a database and analysed using descriptive statistics.
Frequency distributions, central tendency statistics, associations and inference were also
employed to gain an understanding of the study data and examine whether any patterns
emerged from the immediate group of data. Inferential statistics were also employed.
Pearson correlations were calculated to examine the relationships between age and stage at
diagnosis of breast cancer, the risk outputs of the Claus and Tyrer-Cuzick models and
finally, the risk outputs of the Tyrer-Cuzick model and the Manchester Scoring system.
Lastly, in order to evaluate the consistency across all types of risk assessment, a single-
factor ANOVA was performed.
Figure 2-2 presents a summary of the subjects chosen as well as some of the methods used
in this study. The study design did not allow for the determination of absolute risks for these
patients and their relatives. However, it will form the basis of a future study that will aim to
investigate the accuracy of these risk predictions by performing BRCA screening on those
families who appear to have moderate to high risk for having an inherited form of breast
cancer.

Page | 33
Figure 2-2 Summary of subject selection, data collection and methodology

Page | 34
3 RESULTS
Results were generated from the 45 breast cancer subject files. This chapter will highlight
the results obtained from the analysis of data collected from these files. The chapter will
begin with outlining the findings regarding the subjects’ demographics. Following this, a
generalised breast disease profile of the subjects will be delineated. The data regarding
family histories of the subjects will be discussed. The main findings with respect to the
performance of risk assessment tools in black women with breast cancer will be presented.
Lastly, the consistency of these tools when used in this population will be assessed.
3.1 Demographics
All the probands included in the study were black females who were diagnosed with breast
cancer at 50 years or younger. No women diagnosed with breast cancer over the age of 50
years but who had a family history of breast and/or ovarian cancers were identified during
the time period of the study. Further, no male probands with breast cancer were identified for
inclusion in the study.
Of the 45 probands, only two (4%) attended their genetic counselling consultation at the
Breast and Plastic Clinic, CHB, with a support person. One proband attended with her sibling
and the other with her mother. All other probands (n=43; 96%) attended alone. Twenty-five
of the 45 probands (56%) reported that they were unemployed at the time of the
consultation. Seventeen subjects (38%) reported that they were employed and three
subjects (7%) reported that they had been previously employed but were not working at the
time of the consultation.
3.1.1 Age Range
The age of the probands at the time of their consultations ranged from 24 to 59 years with a
median age of 39 ± 7.13 years and a mode of 34 years. The age at breast cancer diagnosis
of the probands is illustrated in Figure 3-1. The age at diagnosis ranged from 23 to 50 years
with a median age at diagnosis of 38 ± 6.41 years and a mode of 38 years.
3.1.2 Ethnicity
Information regarding the first language of the subjects was available for 30 of the 45
subjects (67%). This information was used as a proxy for ethnicity / tribal origin (as
discussed in section 2.2.2.1). The distribution of ethnicities is demonstrated in Figure 3-2.
The majority of the probands (n=12; 40%) indicated that isiZulu was their first language. The
second largest group of probands (n=6; 20%) consisted of individuals who spoke isiXhosa
as their first language and the third largest group indicated that seSotho was their first
language. No subjects reported having isiNdebele or siSwati as their first-languages.

Page | 35
6
121
5
31 2
isiXhosa
isiZulu
Sepedi
Sesotho
Setswana
Tshivenda
Xitsonga
1
2
11 11 11
8
1
0
2
4
6
8
10
12
20-24 25-29 30-34 35-39 40-44 44-49 50
No
. In
div
idu
als
Age Range (years)
Figure 3-2 Age at breast cancer diagnosis of the probands (n=45)
Figure 3-1 Ethnic origins of the individuals (n=30) who attended
breast cancer genetic counselling consultations

Page | 36
3.2 Breast Disease Profile
Of the 45 breast cancer diagnoses made in the probands, greater than 95% (n=43) were
found to have unilateral disease while the remainder had bilateral disease (n=2; 4%). In
addition, the majority (n=44; 98%) of the breast cancers were ductal carcinomas. Lobular
carcinomas accounted for 2% (n=1) of the probands.
Seven probands (16%) were found to have an additional cancer other than breast cancer.
Upon closer inspection, four of these were found to be metastases (two in the lungs, one on
the sternum and one in an unreported location). The three remaining probands reported an
additional primary cervical cancer. It is unsure whether or not this is related to the pattern of
inherited breast cancer in this population.
The majority of probands (n=32; 71%) underwent therapeutic mastectomies as part of their
treatment protocol. A further 16% of probands (n=7) were treated with breast conservation
therapy. The remainder of patients (n=6; 13%) had received only neo-adjuvant treatment
(chemotherapy and/or radiation) at the time of their genetic counselling consultation and
were awaiting a surgical and/or management decision.
3.2.1 Stage at Presentation
Breast cancer TNM staging and grading information was obtained from 41 of 45 (91.11%)
proband files. Stage was assigned according to AJCC guidelines as discussed in Section
1.1.3. Figure 3-3 illustrates the number of individuals within the cohort who presented with
each stage of disease. As can be seen from this figure, the majority of individuals (n=36;
87%) had stage II or III disease at the time of presentation.

Page | 37
The Pearson correlation co-efficient for age and stage at diagnosis was 0.12. This could be
considered a positive but weak relationship. In other words, when age at diagnosis
increases, stage at diagnosis also increases. Age at diagnosis accounted for 1% of the
variance in stage at diagnosis.
3.2.2 Receptor Status
Information regarding ER, PR and HER2 status was obtained from 40 of the 45 (88.89%)
proband files. Data were stratified according to the phenotypes outlined by Onitilo, et al.,
(2009). Table 3-1 illustrates the number of probands that were assigned to each receptor
phenotype. Of particular interest is 40% of probands (16/40) had triple receptor positive
phenotypes (ER/PR+; HER2+) and 20% of probands (8/40) had triple receptor negative
(ER/PR-; HER2-) phenotypes.
0 10 20 30 40 50
Percent of Individuals
Sta
ge
at
Pre
sen
tati
on
Stage I Stage II Stage III Stage IV
Figure 3-3 Percentage of probands at each stage at presentation (n=41)
3
19
17
2

Page | 38
Table 3-1 Receptor Phenotypes of Probands
3.2.3 Hormonal Factors Contributing to Breast Disease
Some hormonal factors that are known to contribute to the risk of developing breast cancer
were examined in the probands. Data were not available for all probands regarding each of
the factors.
The age at menarche of the probands ranged from 13 to 20 years with a median age
of 15 ± 2.16 years and a mode of 13 years (ascertained from 27 of 45 proband files).
Sixty percent (n=15) of probands reported using assorted types of contraception for
various durations while the other 40% (n=10) reported no use of contraception
(ascertained from 25 of 45 proband files). Analysis of the types of contraceptives
used could not be performed due to insufficient data.
The age at first pregnancy of the probands ranged from 15 to 34 years with a median
age of 21 ± 4.72 years and a mode of 19 years (ascertained from 39 of 45 proband
files). The remaining 6 probands did not have any children.
The total duration of breast feeding (for all children) by probands ranged from 4 to 96
months with a median duration of 24 ± 27.44 months and a mode of 4 months. Six
women reported never having breast fed (ascertained from 24 of 45 proband files).
There are insufficient data on these factors within the population of interest in order to be
able to comment on the manner in which these factors influence breast cancer risk.
Receptor Phenotype: Probands Exhibiting Phenotype
N %
ER/PR+ ; HER2+ 16 40
ER/PR+ ; HER2- 9 22
ER/PR- ; HER2+ 7 18
ER/PR- ; HER2- 8 20
Total 40 100

Page | 39
3.3 Pedigree Analysis
The numbers of affected and at-risk relatives were calculated in the 45 probands’ families. In
total, 76% of probands (n=34) had no family history of breast and/or ovarian cancer.
Information from the pedigree analysis is illustrated in Table 3-2. The ratio of first- and
second- degree affected family members to at-risk females were slightly raised compared to
the 1 in 55 general population risk of breast cancer in the black South African population.
The calculation of these ratios was performed without including the affected probands as this
would have given a biased representation of family history in these families. Nevertheless,
these figures do not reflect the approximate 20-30% rate of affected family members on one
side of a family that would be expected from a high risk cohort showing autosomal dominant
inheritance and a penetrance of 40-60%.
3.3.1 At-Risk Female Relatives
In a total of 921 unaffected first-, second, and third- degree relatives of the probands, 400
female relatives were deemed to be at an increased risk of developing breast cancer in their
lifetime (refer to section 2.2.3 as well as figures 2-1 and 2-2). The mean number of at-risk
female relatives per family was calculated as being 8.89 ± 3.83 (range: 2-18). Males were
not considered in the calculation of at-risk relatives because of their significantly decreased
risk for breast cancer.
Table 3-2 Numbers of affected and at-risk female relatives of probands
*SD – Standard Deviation
3.3.2 Affected Relatives
Eleven of the 45 probands (24%) were found to have other family members affected with
breast cancer. As can be seen in Figure 3-4, seven probands (64%) had one relative who
also had breast cancer and 4 probands (36%) had two relatives who also had breast cancer
(these four pedigrees are illustrated in Figure 4-2 and Figure 4-3 in the discussion). None of
Degree of
Relation
Affected Relatives At-Risk Female Relatives Ratio of
Affected: At-Risk
Females N
Mean number of
individuals per
family ± SD*
N
Mean number of
individuals per
family ± SD*
FDR 4 0.09 ± 0.29 126 2.80 ± 1.69 ± 1:31
SDR 6 0.13 ± 0.40 220 4.89 ± 2.85 ± 1:37
TDR 5 0.11 ± 0.38 54 1.20 ± 2.61 ± 1:11
Total: 15 0.33 ± 0.64 400 8.89 ± 3.83 1:27
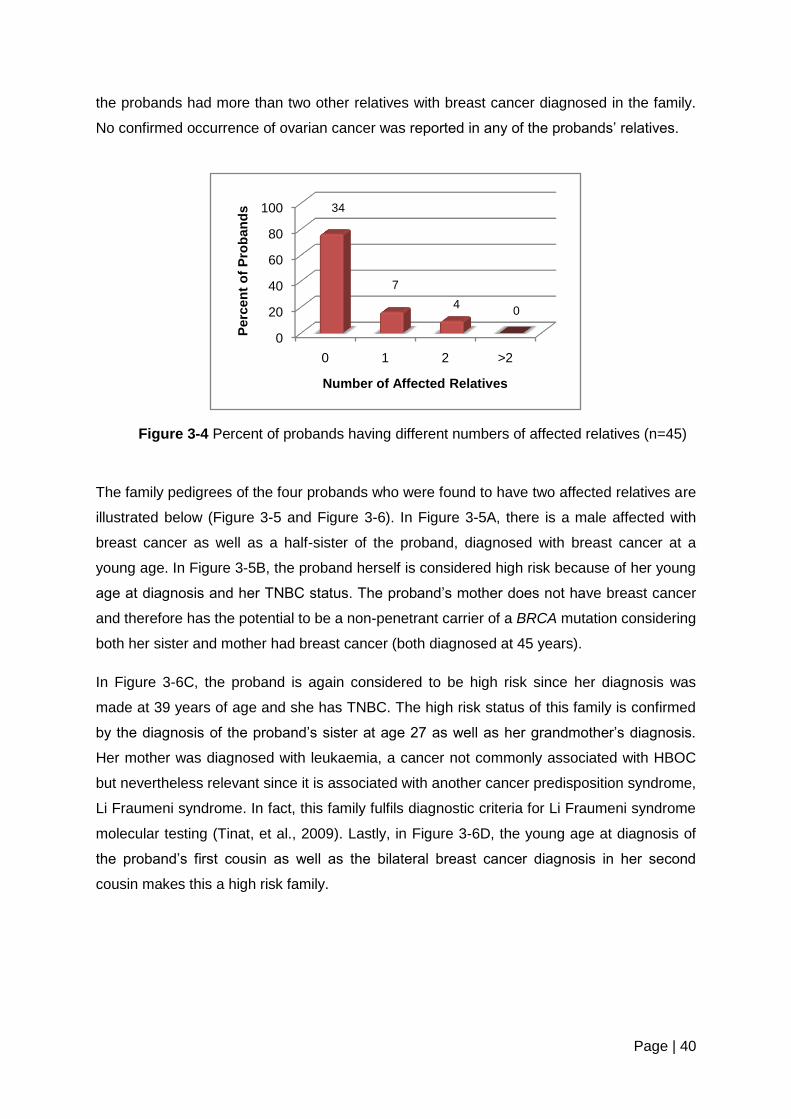
Page | 40
the probands had more than two other relatives with breast cancer diagnosed in the family.
No confirmed occurrence of ovarian cancer was reported in any of the probands’ relatives.
The family pedigrees of the four probands who were found to have two affected relatives are
illustrated below (Figure 3-5 and Figure 3-6). In Figure 3-5A, there is a male affected with
breast cancer as well as a half-sister of the proband, diagnosed with breast cancer at a
young age. In Figure 3-5B, the proband herself is considered high risk because of her young
age at diagnosis and her TNBC status. The proband’s mother does not have breast cancer
and therefore has the potential to be a non-penetrant carrier of a BRCA mutation considering
both her sister and mother had breast cancer (both diagnosed at 45 years).
In Figure 3-6C, the proband is again considered to be high risk since her diagnosis was
made at 39 years of age and she has TNBC. The high risk status of this family is confirmed
by the diagnosis of the proband’s sister at age 27 as well as her grandmother’s diagnosis.
Her mother was diagnosed with leukaemia, a cancer not commonly associated with HBOC
but nevertheless relevant since it is associated with another cancer predisposition syndrome,
Li Fraumeni syndrome. In fact, this family fulfils diagnostic criteria for Li Fraumeni syndrome
molecular testing (Tinat, et al., 2009). Lastly, in Figure 3-6D, the young age at diagnosis of
the proband’s first cousin as well as the bilateral breast cancer diagnosis in her second
cousin makes this a high risk family.
0
20
40
60
80
100
0 1 2 >2
Perc
en
t o
f P
rob
an
ds
Number of Affected Relatives
Figure 3-4 Percent of probands having different numbers of affected relatives (n=45)
34
7
4 0

Page | 41
Figure 3-5 Family history pedigrees of four probands who were found to have two
affected relatives: (A) Proband with an affected half-sister (SDR) and an affected
nephew (TDR). (B) Proband with an affected maternal aunt (SDR) and an affected
maternal grandmother (SDR)

Page | 42
Figure 3-6 Family history pedigrees of the four probands who were found to have
two affected relatives: (C) Proband with an affected sister (FDR) and an affected
grandmother (SDR). The proband’s mother had leukaemia. (D) Proband with an
affected cousin (TDR) and an affected second cousin with bilateral disease.

Page | 43
Seventy-three percent of the probands (8/11) who had a family history of breast cancer were
diagnosed with breast cancer under the age of 40 years. None of these probands had
bilateral disease. The age at breast cancer diagnosis in the affected relatives of the
probands ranged from 23 to 74 years with a median age of 42.5 ± 15.3 years and a mode of
45 years. A single relative of a proband affected with breast cancer was a male (Figure 4-
2A) and a single relative had bilateral breast cancer (Figure 4-3D). Eighty percent (12/15) of
affected relatives were related to the proband on the maternal side; however a significant
number of probands had reported not having information on the paternal side of the family.
A total of 24 other types of cancers were self-reported in the family histories of the probands.
The most common type of cancer indicated in the families was throat cancer (33%) followed
by “womb” cancer (25%). The breakdown of these types of cancers is demonstrated in Table
3-3.
Table 3-3 other types of cancers that were reported in the family histories of the probands
*Cancers that may be associated with HBOC (if “womb” is “ovarian cancer” as opposed to “uterine cancer” or “cervical cancer”)
Type of Cancer: Affected Individuals
N %
Brain 1 4
Cervical 1 4
Leukemia 1 4
Prostate* 3 14
Stomach* 1 4
Throat 8 33
Tongue 1 4
Unknown 2 8
“Womb”* 6 25
Total 24 100

Page | 44
3.4 Risk Assessment
3.4.1 Baseline Family History Risk Assessment
Family histories were additionally analysed in order to group the probands’ families into
average, moderate or high risk of having an inherited cancer syndrome (as outlined in Table
2-2). The following breakdown resulted for the 45 probands assessed:
No families were found to be at average risk
Fifteen (33%) families were found to be at moderate risk
Thirty (67%) families were found to be at high risk
Twenty of the 30 (67%) high risk families were placed in this category only as a result of the
young age at diagnosis of the proband (less than 40 years) but were not found to have any
other affected relatives. An additional 7 families (23%) were placed at high risk based on the
young age of the proband in addition to the presence of a family history. The remaining three
families (10%) were placed in a high risk category based on the presence of a family history
alone; the ages of the probands in these three families were all older than 40 years.
3.4.2 Claus Model
The Claus model of risk assessment (see Appendix 4) was used to calculate the lifetime risk
of developing breast cancer for a hypothetical 20 year-old FDR of the proband. The lifetime
risks for these individuals are presented in Figure 3-5.
Most individuals were assigned a Claus risk based only on a single affected relative (i.e.: the
proband). As can be seen, 73% (33/45) of these individuals were assigned a risk of between
14.3% (1 in 7) and 20% (1 in 5). Significantly less individuals (3/45; 7%) were given a risk of
25% or greater. Eight individuals could not be assigned a risk using the Claus model as an
appropriate Claus Table was not available for their particular family structure. Family
structures that excluded the use of the Claus tables were those that had more than two
affected relatives or had a clear pattern of autosomal dominant inheritance.

Page | 45
Figure 3-7 Lifetime risks of developing breast cancer for 20 year-old FDR's of probands
calculated by the Claus Model of Risk Assessment (n=45)
3.4.3 Tyrer-Cuzick Model
The Tyrer-Cuzick Model is a software program that is used to calculate 10-year risks and
lifetime risks for a 20 year-old FDR of a proband as well as a mutation risk for the proband’s
family. Table 3-4 outlines the ranges and means calculated for all outputs from the Tyrer-
Cuzick Model. Table 3-5 shows how 20 year-old FDRs of the probands are stratified for
lifetime risk by the Tyrer-Cuzick model.
Table 3-4 Ranges and means of risk outputs from the Tyrer-Cuzick model
Risk Output Range (%) Median Mode
20- year old FDR 10-year 0.13 - 1.68 0.18 0.22
Lifetime 17.74 - 33.99 18.95 17.84
Family BRCA1 mutation 0.16 - 17.25 0.82 0.32
BRCA2 mutation 0.24 - 4.79 0.72 0.26
Combined BRCA 0.41 - 21.05 1.56 0.58
0
10
20
30
40
50
60
70
80
90
100
1 in 2-3 1 in 4 1 in 5 1 in 6-7 1 in 10 cannot be calculated
perc
en
t o
f P
rob
an
ds
Lifetime Risk
8
1 1 2
17 16

Page | 46
Table 3-5 Lifetime risk of developing breast cancer generated for a hypothetical 20-year old
FDR from the Tyrer-Cuzick model
Lifetime Risk (%) Individuals
Number Percentage
17.00-17.99 5 11
18.00-18.99 20 44
19.00-19.99 12 27
≥20.00 8 18
Total 45 100
The Tyrer-Cuzick software calculated mutation risks for BRCA1 and BRCA2 independently.
These scores were then combined in order to give an over-all risk of each family harbouring
a deleterious BRCA mutation as described in Figure 3-6. As can be seen in Figure 3-6, the
majority of families (n=19; 42%) were found to have a combined BRCA mutation risk
between 1.00% and 1.99%. Only 11% (n=5) of families had a score greater than 4%.
Figure 3-8 Combined BRCA mutation risks for the families of the
probands as predicted by the Tyrer-Cuzick model (n=45)
0
10
20
30
40
50
60
70
80
90
100
0.00-0.99 1.00-1.99 2.00-2.99 3.00-3.99 >4.00
Perc
en
t o
f F
am
ilie
s
Combined BRCA mutation risk (%)
10
19
9
2
5

Page | 47
3.4.4 Manchester Scoring System
The Manchester scoring system was utilised to calculate the risk of the probands’ families
having a BRCA mutation that could predispose them to the development of hereditary breast
and/or ovarian cancer. Results of this risk assessment programme showed there to be a
range of Manchester scores from 2 to 24 points with a median score of 8 ± 5 and a mode of
8. The majority of families (n=23; 51%) had a Manchester score of between 5 and 10. Only 3
families (7%) were assigned a Manchester score of greater than 20 points. All three of these
families had multiple affected relatives.
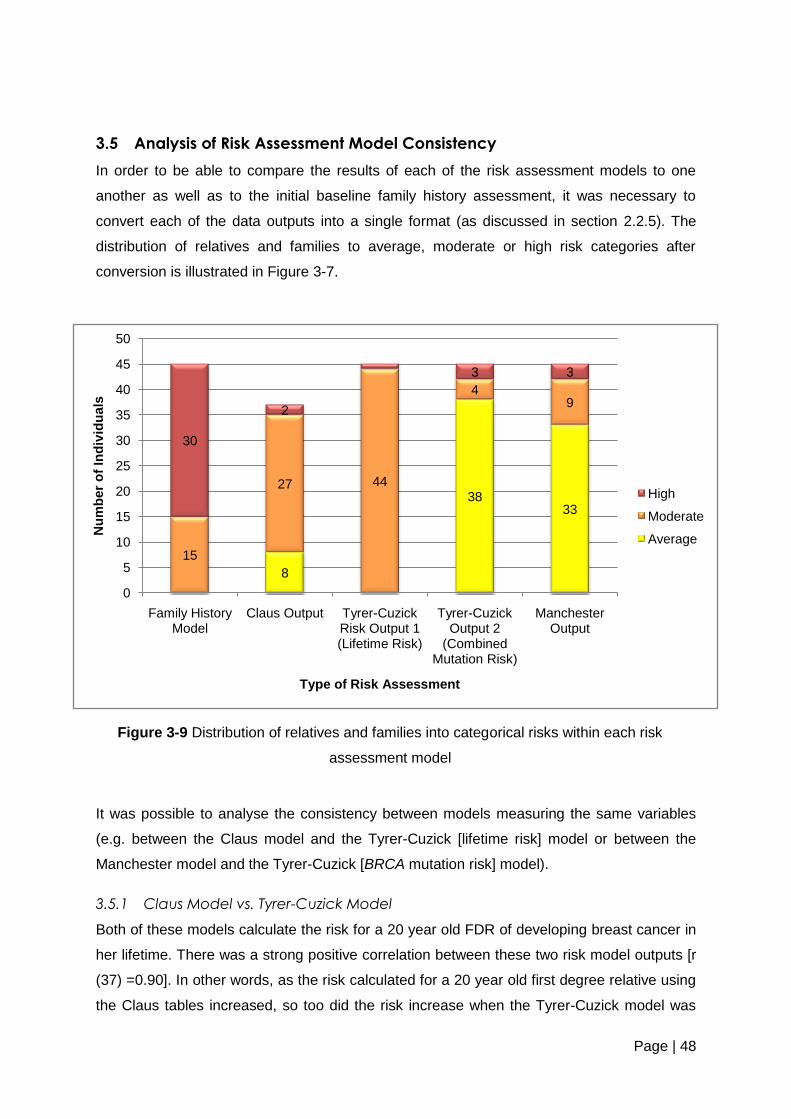
Page | 48
3.5 Analysis of Risk Assessment Model Consistency
In order to be able to compare the results of each of the risk assessment models to one
another as well as to the initial baseline family history assessment, it was necessary to
convert each of the data outputs into a single format (as discussed in section 2.2.5). The
distribution of relatives and families to average, moderate or high risk categories after
conversion is illustrated in Figure 3-7.
It was possible to analyse the consistency between models measuring the same variables
(e.g. between the Claus model and the Tyrer-Cuzick [lifetime risk] model or between the
Manchester model and the Tyrer-Cuzick [BRCA mutation risk] model).
3.5.1 Claus Model vs. Tyrer-Cuzick Model
Both of these models calculate the risk for a 20 year old FDR of developing breast cancer in
her lifetime. There was a strong positive correlation between these two risk model outputs [r
(37) =0.90]. In other words, as the risk calculated for a 20 year old first degree relative using
the Claus tables increased, so too did the risk increase when the Tyrer-Cuzick model was
8
3833
15
27 44
49
30
2
3 3
0
5
10
15
20
25
30
35
40
45
50
Family History Model
Claus Output Tyrer-Cuzick Risk Output 1 (Lifetime Risk)
Tyrer-Cuzick Output 2
(Combined Mutation Risk)
Manchester Output
Nu
mb
er
of
Ind
ivid
uals
Type of Risk Assessment
High
Moderate
Average
Figure 3-9 Distribution of relatives and families into categorical risks within each risk
assessment model

Page | 49
used. The variance in the models was calculated to be 82%. This is illustrated in Figure 3-8
(A).
3.5.2 Tyrer-Cuzick Model vs. Manchester Scoring System
Similar to the above comparison, there was a moderately positive correlation between the
two models that both calculate for the BRCA mutation risk of a family [r (45) =0.65]. This
suggests that as the BRCA-related risk calculated for the family by the Tyrer-Cuzick model
increases, so too does the risk calculated by the Manchester model. This relationship is less
well correlated than the relationship between the lifetime risks calculated by the Claus and
Tyrer-Cuzick models. The variance in the model was calculated to be 43%. This is illustrated
in Figure 3-8 (B). This graph seems to indicate that these two risk assessment tools become
less correlated at higher risks, while they appear better correlated at lower risks.
y = 0.2383x + 14.583R² = 0.8153
0.00
5.00
10.00
15.00
20.00
25.00
30.00
0 10 20 30 40 50
Lif
eti
me R
isk c
alc
ula
ted
by T
yre
r-C
uzic
k M
od
el (%
)
Lifetime risk calculated by Claus Model (%)
y = 0.4922x - 1.7389R² = 0.4288
-5
0
5
10
15
20
25
0 10 20 30Co
mb
ine
d B
RC
A m
uta
tio
n r
isk
calc
ula
ted
by T
yre
r-C
uzic
k
Mo
de
l (%
)
Combined BRCA mutation risk calculated by Manchester Scoring System (%)
Figure 3-10 Comparison of risk output between (A) the
Claus model and the Tyrer-Cuzick model and (B) the Tyrer-
Cuzick model and the Manchester scoring system
A
B

Page | 50
3.5.3 Comparison of All Models
On inspection of the model outputs after they had been coded, the relatives/family of only a
single proband were placed in the same risk category (high risk) by the baseline risk
assessment, the Tyrer-Cuzick lifetime and mutation risk models and the Manchester scoring
system. The Claus model could not be used in this family due to the fact that there was no
appropriate table. All other risk outputs were inconsistent among the various models. To
highlight this finding, an Analysis of Variance (ANOVA) was performed.
The ANOVA (illustrated in Figure 3-9) that was used to evaluate the consistency of the
various risk assessment platforms indicated that there was a significant difference among
the risk predictions made by each of the programmes at the p<0.05 level [F (4,212) = 64.78,
p = 1.03-35]. This illustrated that the risk assessment programmes gave inconsistent risks for
each proband in the cohort.
The family history assessment appears to have little variance with the Claus model. In turn,
the Claus and Tyrer-Cuzick lifetime risk models appear to show less variance between them.
Similarly, the Tyrer-Cuzick mutation risk model and the Manchester scoring system also
appear to show less variance between them. Both the Tyrer-Cuzick model and the
Manchester scoring system appeared to be markedly variable from the family history
assessment.

Page | 51
Figure 3-11 Single- Factor ANOVA analysis indicating the inconsistency of the various breast
cancer risk assessment platforms
Page | 52
4 DISCUSSION
The results of this study have given an overview of the demographics of a sample of the
patients seen for genetic counselling at the Breast and Plastic Clinic, CHB. In addition, the
results have illustrated the profile of breast disease in the probands as well as numerous
factors concerning their family histories. The results concluded with an examination of the
various risk assessment tools that were utilised to make predictions regarding lifetime and
mutation risks in this population.
The following chapter will discuss various aspects of the relevance of these results. Further,
their importance for future research will be discussed and their potential applicability to the
genetic counselling of black women with breast cancer will be outlined.
4.1 Demographics
Black South African women were the population of interest in this study. Specifically, black
South African women who had been diagnosed with breast cancer at a young age (<50
years) were examined. The demographic data relating to this cohort were analysed as
follows.
4.1.1 Socioeconomic and Cultural Factors
It is important to ascertain whether or not the probands in this study were representative of
the larger population of urban black South African women living in the Soweto area.
Accordingly, it was necessary to examine certain socioeconomic factors, the ethnic/tribal
origins of the probands as well as the setting in which the study took place.
The unemployment rate in the cohort was found to be 55.56%. This figure is consistent with
the general rate of unemployment in Soweto, which was quoted as 53% in 2001
(Department of Economic Development [DED], 2009).
The probands were ascertained from Chris Hani Baragwanath Hospital (CHB), the main
tertiary hospital in the Soweto area, and the largest in the country. In addition, referrals are
made to CHB from all parts of the province of Gauteng.
Gauteng is a linguistically diverse area and no particular language is dominant. Having said
this however, 21.5% of people in Gauteng report isiZulu as their mother tongue (Media Club
South Africa, 2011). IsiZulu was found to be the commonest language spoken by the
probands. In fact, 40% of probands (12/30) reported isiZulu as their first language. This is
roughly double the figure given for Gauteng. It is difficult to comment on this difference, as
the sample is small. Most of the other languages were represented in the cohort with the
Page | 53
exception of isiNdebele and siSwati, which are considered minority official languages (Media
Club South Africa, 2011).
Although no data on education and income were collected in the present study, discussions
were held with genetic counsellors, who worked in the cancer clinic, on these issues. They
made some interesting observations. One such observation was that in general, the women
they counselled seemed to be quite well educated and aware of breast cancer surveillance
and detection strategies. This would, to a certain extent, be expected as it is the younger
generation in urban settings who have been exposed to breast cancer awareness
campaigns and education at many levels (e.g. school and media). On the contrary, we would
suspect that the less aware patients living in rural areas are not presenting to the clinic and
are remaining undiagnosed and untreated.
A second observation regarding the women with breast cancer who attend the clinic has also
been made by the genetic counsellors regarding their attitudes towards western and
traditional medicine. A portion of women who come to the clinic for initial evaluations often
default from treatment once they have been given a breast cancer diagnosis. These women
describe returning to the clinic after having consulted a traditional healer without apparent
results. This may, to a small extent, explain the trend towards later stage at breast cancer
presentation, as seen in other African women (Walker, et al., 2004).
It seems apt to suggest from the above, that the cohort of women who were studied for the
purposes of this research are broadly representative of the urban population from whence
they originate with respect to the socioeconomic and cultural aspects described above. As
such, the findings of this study can be extrapolated to this broader population in general (i.e.
urban black South African women with breast cancer under the age of 50 years). Since there
were insufficient data regarding the education, employment and income of these individuals,
it is not possible to extend the based on these factors.
4.1.2 Age at diagnosis
The aim of this study was to target women who were thought to be at an increased risk of
having an inherited cancer syndrome. The selection of probands appropriate for this study
was therefore biased towards younger women diagnosed with breast cancer rather than
older women who had breast cancer in addition to a family history. This is because in
general in most populations, young age at diagnosis is used as a means of identifying those
individuals who are at an increased risk of developing cancer. In other words, young age at
diagnosis is a risk factor for an inherited cancer syndrome.

Page | 54
African populations have a different age distribution with a low median age compared to first
world populations (Akaralo-Anthony, et al., 2010) this distribution is also applicable to the
local black population of South Africa. Figure 4-1 depicts the mid-year population estimates
for (A) black and (B) white South African women, distributed by age (Statistics South Africa,
2011). This shift towards a younger median age is particularly noticeable in comparison with
an equivalent Caucasian population. The trend of a lower median age can, to a limited
extent, be corroborated by data from the Breast and Plastic Clinic (CHB) itself. This data
shows a peak of breast cancer diagnoses between 35 and 40 years of age as well as
between 50 and 55 years of age (Cubasch, H., 2011, personal communication, 20 June).
In consideration of the above, it seems possible to conclude that perhaps the use of young
age at diagnosis of breast cancer may not be a good criterion in a population where the age
distribution is so significantly shifted, as relatively more young patients with sporadic breast
cancer might be expected.
It is important to note that the age of onset of breast cancer in this population could also be
consistent with a diagnosis of Li Fraumeni Syndrome (LFS), an inherited cancer syndrome
that is associated with mutations in the p53 tumour suppressor gene. Probands who are
diagnosed with premenopausal breast cancer before the age of 46 years old can be
considered eligible for p53 molecular genetic testing according to the 2009 Chompret
Criteria for LFS if found in the presence of other LFS associated tumours (such as: soft
tissue sarcoma, osteosarcoma, adrenocortical carcinoma and leukaemia) in the family
history and also in the absence of BRCA mutations (Tinat, Bougeard, Baert-Deusrmont, et
al., 2009).
Figure 4-1 2011 Mid-year population estimates for (A) black and (B) white South African
Women (Statistics South Africa, 2011)

Page | 55
4.2 Breast Disease Profile
There are a number of observations that can be made regarding the breast disease profiles
of the population of interest. In general the breast disease profiles of the cohort studied
tended to be consistent with breast disease profiles of women with breast cancer in general
(Ely and Vioral, 2007) and with women from African populations specifically (Akaralo-
Anthony, et al., 2010; Stark, et al., 2010; Walker, et al., 2004).
Greater than 95% of probands in the cohort were diagnosed with unilateral ductal
carcinomas. This is consistent with a reported incidence of bilateral breast cancer of 7.1%
and therefore a related incidence of unilateral breast cancer of 92.9% in a Caucasian
population (Smith, 1986). No comparable data are available regarding the incidence of
ductal carcinomas and unilateral carcinomas in African populations. There were very few
occurrences of bilateral breast cancers in the probands and in their affected relatives. This
paucity is interesting since bilateral breast cancers are strongly indicative of a possible
inherited breast cancer condition. This could potentially provide further evidence for the
occurrence of sporadic breast cancers in this young cohort rather than inherited breast
cancer susceptibility. Further, the one proband who was diagnosed with bilateral breast
cancer was found to have lobular carcinomas in both breasts. Lobular carcinomas are not
known to be associated with BRCA mutations but rather with mutations in the CDH1 (e-
cadherin) gene associated with Hereditary Diffuse Gastric Cancer (Fitzgerald, Hardwick,
Huntsman, et al., 2009). This finding highlights the idea that inherited cancer susceptibilities
are likely to exist in this population and importantly, this may not be limited to BRCA
mutations but rather may include a variety of other genes. A similar suggestion was put
forward by Fackenthal, et al. (2011) who recommended that multiple genes as well as
relevant genomic pathways be examined in their Nigerian cohort as well as women of
African ancestry in general.
The incidence of cervical cancer as a second primary in three of the probands was 1 in 15.
This is double the overall incidence of cervical cancer in black South African women
reported in 2002 as 1 in 30 (National Cancer Registry, 2009). Despite the small sample size,
this was an interesting observation, however, possibly co-incidental and difficult to interpret.
There is no concrete evidence to suggest that cervical cancer may be a component of
inherited breast cancer syndromes. Also, the relationship between breast cancer and human
papillomavirus (HPV) infection has not been determined (Wang, Chang, Wang, et al., 2011).

Page | 56
There was a high degree of consistency between the stage at presentation of the cohort and
the general group of women who were seen at the Breast and Plastic Clinic, CHB in general
over a period from 2007 to 2011 (Cubasch, H., 2011, personal communication, 20 June). In
both instances, 87% of the patients were found to be either stage II or III at diagnosis.
Despite the limited data that was captured regarding the hormonal factors of the breast
cancer probands, it seems reasonable to suggest that the observations made (section 3.2.3)
were similar to expected trends from other African women. This is unsurprising since there
are no obvious reasons for this population to be at an increased breast cancer risk as a
consequence of environmental or hormonal factors. One possible exception is the use of
injectable progesterone contraceptives, a common practice in this population. The role of
progestins in breast cancer risk is controversial however some research does indicate a
carcinogenic effect, particularly of the breast (Sitruk-Ware and Nath, 2010). The use of this
type of contraceptive and its correlation with breast cancer occurrence could not be
evaluated in this research due to the paucity of data.
An increased incidence of triple receptor negative breast cancer (TNBC; negative for
expression of ER, PR and HER2 receptors) has been well documented in African
populations (Bird, et al., 2008; Huo, et al., 2009; Stark, et al., 2010). Twenty percent of the
cohort were characterised as TNBC. This figure appears to be consistent with the incidence
of TNBC in African American populations which is ±25% (Stark, et al., 2010). The reasons
behind this increased incidence of TNBC are not fully understood. However, recent research
has suggested that higher parity (number of live-born children) and lower prevalence of
breast feeding in African American women is correlated with an increased incidence of
estrogen and progesterone receptor negative expression phenotype (Palmer, Boggs, Wise,
et al., 2011). Whether this is true in the local context remains to be seen and further
research is indicated in this regard. This is especially important since TNBC is seen as a
predictor of an inherited breast cancer. This could be useful in the absence of other typical
predictors as is the case with this cohort, if this is true. However, again, the role of
environmental factors needs to be fully assessed.

Page | 57
4.3 Pedigree Analysis
Information regarding affected, unaffected and at-risk relatives of the probands was
analysed in order to ascertain the general picture of breast cancer family history in this
cohort. Overall, there was a significantly decreased amount of affected relatives in this
cohort. Results indicate that family history information can play a role in predicting which
individuals are at increased risk for developing breast cancer in this population; however it
would be essential to examine alternative methods for risk profiling.
4.3.1 Family Structure
The four families with a significant family history stood out from the rest since they had
distinctive characteristics of an inherited breast cancer syndrome. These four families
appear to be at high risk irrespective of which risk assessment tools are utilised. It would be
prudent to suggest that the forthcoming molecular genetic analysis begins with these four
probands. It is reasonable to suggest that this reinforces the argument put forward
previously (Section 1.4) that 5-10% of breast cancer cases can be ascribed to an inherited
predisposition irrespective of the population’s breast cancer burden and age dynamics. This
would need to be verified by molecular genetic analysis.
The majority of probands (n=34) did not have any family history suggestive of breast and/or
ovarian cancer, or other HBOC associated cancers. In fact, it has been observed in the clinic
that in addition to the absence of confirmed diagnoses of cancers, there was an absence of
reporting of unverifiable or potential cancers. These individuals were therefore classified as
moderate or high risk based only on their ages at diagnosis.
One explanation for the paucity of family history in this cohort could be that the probands
who had breast cancer were unaware of the occurrence of breast and other cancers in their
own families. The issue may further be compounded by the fact that many African people did
not seek the assistance of western medicine in the past and their cancers may have gone
undiagnosed. In addition, if these people had undergone treatment at state hospitals, it is
unlikely that their files would be accessible for confirmation. This may then have led to the
under-estimation of risks in these individuals.
Another factor contributing to the apparent lack of family history in this population is that
previously, African women living in a rural setting may have had certain factors that have
protected them from developing breast cancer. These include a later menarche; earlier age
at birth of first child and a diet low in animal fats and high in fibre (Vorobiof, Sitas and
Vorobiof, 2001). Considering that those patients currently being seen at the Breast and
Plastic Clinic, CHB are living in urban environments and are often the first generation to do

Page | 58
so, they are less likely to be protected by these factors. Thus, breast cancer has become
more prevalent. It is reasonable to suggest that protected individuals from previous
generations are likely to have died from other causes (such as infectious diseases) at young
ages, rather than breast cancer. This could have masked any potential family history of
breast and/or ovarian cancer.
In consideration of the above discussion one must question whether or not family history is
an appropriate screening method for genetic counselling and testing in this population. Data
from this study seem to suggest that although most of the breast cancer diagnoses in this
cohort may not be inherited, family history must still play an important role in risk
determination. Having said this however, it seems essential that other factors be examined
for their impact on risk prediction in this population, in order to ensure that the most
appropriate individuals are identified for genetic follow-up (counselling and testing).
Recent research by Southey, Ramus, Dowty, et al., (2011) suggests that morphological and
histopathological features evident on tumour review (especially for BRCA1 tumours) can be
used to identify, with higher specificity and sensitivity, those women at greater risk of having
a BRCA mutation. These features can be easily and routinely collected at the time of
diagnosis in conjunction with family history data. Southey, et al., (2011) have shown that
even in the absence of a supportive family history of breast cancer, the combination of two
tumour morphological markers, namely, a trabecular growth pattern and a high mitotic index,
were strong indicators of a BRCA mutation. It seems essential that these markers as well as
others be evaluated within the black population to reveal whether or not they have significant
predictive value especially in the absence of a family history of breast and/or ovarian cancer.
4.3.2 Comparison of Maternal and Paternal Family Histories
An additional family structure observation is the bias of maternal family history over paternal
family history. As mentioned previously, 80% of affected relatives were related to the
proband on her maternal side. Even in probands who had no family history, a significant
number of individuals reported not having any information relating to paternal history. This
was an unexpected finding since other studies have suggested no bias towards maternal
history even in the framework of a female-dominated condition such as breast cancer
(Hughes, et al., 2003).
One possible explanation for the lack of paternal family history data in this cohort is the
observation that many of these women were raised in single parent (usually the mother)
families and not in the same household as their fathers. As a consequence they knew very
little information about their paternal family history. As a result, paternal family history may

Page | 59
have been under-ascertained in this cohort. This may impact on the overall family history
results to a small degree.
4.3.3 Third Degree Relatives
The mean number of TDR’s per family (1.20 ± 2.61) was significantly decreased in
comparison with FDR’s (2.80 ± 1.69) and SDR’s (4.89 ± 2.85). It is possible that this is a
result of a recall bias or lack of knowledge on the part of the probands or alternatively a lack
of thorough questioning about more distant relatives by the genetic counsellors. It does not
seem feasible that this should be taken as a true reflection of the structure of the families
within this cohort.
4.3.4 Other Cancers in the Family
Six female relatives of the probands were reported as having been diagnosed with “womb”
cancer. The probands were unaware whether or not this diagnosis was indeed uterine
cancer or alternatively, related cancers such as cervical or ovarian cancers. This would be
an important distinction to make since uterine and cervical cancers are commonly occurring
sporadic cancers. In addition, uterine cancer is also known to be associated with HNPCC.
On the other hand, ovarian cancer is known to be associated with mutations in the BRCA
genes, especially BRCA1, and would have been supportive of an increased risk of HBOC in
these families.
In fact, ovarian cancer is a particularly useful factor in risk assessment for BRCA mutations,
perhaps even more so than breast cancer. This is evidenced in the Manchester scoring
system, which assigns a score of 8 for the presence of ovarian cancer diagnosed at less
than 60 years of age (BRCA1) while the highest score possible for a breast cancer is 6
(BRCA1), for an individual who is less than 30 years old (Appendix 4).
Considering the well known association between breast and ovarian cancer in the context of
inherited breast cancer, it is interesting to note the absence of any reported cases of
confirmed ovarian cancer diagnoses in the probands or their female relatives. Whether or
not this implies a lesser role of BRCA mutations in this population as compared to others
remains to be determined.
Eight relatives of the probands were reported to have throat cancer. All except one of these
individuals were males and six of the eight had a confirmed history of smoking. It is
reasonable to suggest that at least some of these cancers may have been oesophageal
cancer. This diagnosis would be more in keeping with the high incidence (22.3 per 100 000)
of oesophageal cancer, particularly in males, in Southern Africa (Farlay, Shin, Bray, et al.,
2010).

Page | 60
4.3.5 At-risk Female Relatives
As outlined previously, 400 female relatives were deemed to be at an increased risk of
developing breast cancer in their lifetime based on their blood relationship to an individual
diagnosed with premenopausal breast cancer. This might be an over-estimation of the
number of individuals at an increased risk. One reason for this over-estimation is that in fact
an inherited predisposition would only come from one or the other side of the family (for
autosomal dominant patterns of inheritance) whereas these at-risk relatives were counted
from both sides of a proband’s family.
“At-risk” status can only truly be clarified however, once molecular genetic analysis has been
performed. The knowledge of the presence or absence of a BRCA (or other) mutation in a
family is essential to delineate further which individuals are truly at an increased risk. This
knowledge will also be useful in determining individualised screening and prevention
protocols for truly at-risk relatives (Southey, et al., 2011).
4.3.6 Comparison of At-risk and Affected Relatives
In order to gain some insight as to whether or not family history is a useful tool in
determining breast cancer risk in this population, the ratio of affected and at-risk relatives
were calculated within each degree of relation. The figures that resulted for FDR’s and
SDR’s were slightly raised yet comparable with the reported incidence of breast cancer in
the black South African population (1 in 55). This slight increase may give some suggestion
of the cohort being at an increased risk. The TDR ratio was hampered by the ascertainment
bias discussed in section 4.3.3 above.
This comparison is limited by the fact that the data used to calculate the incidence of breast
cancer in the local population is histologically based whereas the ratios of affected to at-risk
relatives are based on family history data. An additional limitation is that this information was
gathered at only a single point in time. There is reason to believe that other individuals in
these families could still develop breast cancer at some future point in time. If one was to
assume an autosomal dominant pattern of inheritance of breast cancer in these families,
then one would expect to see a rate of approximately 20-30% of breast cancer diagnoses on
one side of a family (taking into consideration a penetrance of 60%). The fact that these
ratios were closer to the population risk seems to indicate a trend that there may be a lesser
degree of genetic predisposition in this population.
Page | 61
4.4 Risk Assessment
Existing breast cancer risk assessment tools were analysed for utilisation and consistency
within the cohort. Numerous advantages and disadvantages were identified within each of
the various tools. These are outlined below. The main disadvantage of the use of all of these
risk assessment tools is that they were designed for use in Caucasian populations and their
use in non-Caucasian populations is therefore not validated. Ultimately, these individuals
require detailed mutation screening and analysis in order to determine which, if any, risk
assessment tool is truly useful to calculate risk in this population.
In general, results indicated that all of the risk assessment tools that were used did give an
indication of an elevated risk. This result was more commonly due to a young age at
diagnosis rather than a striking family history. The risk assessment programmes did not
show a highly significant degree of consistency among the probands and their families.
These findings highlight the necessity for the development of a risk assessment tool unique
to this population.
4.4.1 Baseline Family History Risk Assessment
The baseline risk assessment table was used to categorise families into average, moderate
and high risk for a cancer syndrome based on age at diagnosis of the proband as well as
family history (Lee, et al., 2005). The table was most frequently used to place families in a
particular category based on the age of onset of breast cancer in the proband. Only in one
instance did the family history of an individual modify their placement in a particular risk
category. As such, the finding that no families were placed at average risk is not surprising.
As mentioned above, the selection criteria for this study had an innate bias towards young
breast cancer diagnoses (less than 50 years).
Upon closer inspection of the 30 families who were placed at high risk according to this
table, only 3 probands were found to have been diagnosed with breast cancer over the age
of 40 years and had a positive family history. The significance of their placement in this
category as well as the utility of this tool can only be confirmed once molecular genetic
analysis has been performed. However, it seems that this tool is useful for an initial
delineation of risk. In addition, the table is simple enough to be utilised in the genetic
counselling session when family history is first obtained and can be easily adapted to the
circumstances of a particular proband.
The guidelines given in this table were not particularly stringent however and therefore a
large quantity of people might be placed at high risk unrealistically. This may in turn lead to

Page | 62
over-screening and over-testing which is expensive, time-consuming, and potentially
unnecessary and may cause increased anxiety.
4.4.2 Claus Model
The Claus Model appeared to stratify the hypothetical 20 year old FDRs of the probands
more thoroughly than the baseline risk assessment, with individuals being placed in all three
risk categories. Only 2 individuals (4%) were considered to be at high risk (Figure 3-7);
significantly less than the 30 families who were placed in this category using the previous
tool.
The Claus model was designed to be used in the absence of an obvious autosomal
dominant pattern in a family pedigree (Rubinstein, et al., 2002). It therefore proved to be
most useful and simple to use when there was no family history aside from the affected
proband. The Claus tables were not helpful in many of the instances when there was some
kind of family history. For example, no appropriate table existed for hypothetical FDR’s who
had three affected relatives. Although the tables are easy to use, they are restricting in terms
of which families can be analysed. In contrast to the previous tool, they are too stringent and
inflexible.
4.4.3 Tyrer-Cuzick Model
The Tyrer-Cuzick software programme gave information regarding lifetime as well as BRCA
mutation risks. Only eight of the 45 hypothetical 20 year-old FDRs were given a lifetime risk
assessment of greater than 20% by the Tyrer-Cuzick model. In fact, all except one of the 20
year-old FDRs were categorised as moderate risk (Figure 3-7) by this tool (refer to Table 2-
3). In addition, the BRCA scores that were calculated for the families of the probands by this
software were uniformly low (Figure 3-6).
These results seem to indicate that this software programme places a large amount of
emphasis on family history and also takes into consideration unaffected female relatives.
This is in contrast to the previous tools which placed more emphasis on a proband’s age at
breast cancer diagnosis in order to calculate risks. The software tool was limited in its ability
to be manipulated to fit alternative scenarios within the family histories (e.g. TDRs and male
breast cancers). It seems overall, that the Tyrer-Cuzick software was designed for and is
most useful for predictive risk calculations rather than for women who have already been
diagnosed with breast cancer. This is not particularly useful in the setting of the Breast and
Plastic Clinic, CHB, since all of the women seen at this clinic have already been diagnosed
with breast cancer but it can be very useful for their relatives.

Page | 63
4.4.4 Manchester Scoring System
The Manchester scoring system also gave consistently low BRCA mutation scores for the
families of affected probands. This is not surprising since the score places emphasis on
family history and requires counting of all individuals. It is also weighted according to age at
cancer diagnoses. The Manchester score also had the added benefit of being able to include
histological features of a proband’s breast cancer. This had a marked effect on the overall
scores, especially on the BRCA1 scores. It is interesting to note that only three out of 45
families would have been offered molecular genetic testing based on their Manchester Score
result (>20 points) using a threshold of 20%. Only an additional two families would be
offered testing had the threshold been lowered to 10% (equivalent to 16 points).
The Manchester scoring system appears to perform better at stratifying probands and their
families into the various risk categories. This, in addition to its ease of use in the clinical
context, makes it a good candidate for use within this population as an interim solution for
risk clarification.
4.4.5 Comparison of Risk Assessment Models
In order to verify the consistency of these models in terms of their risk predictions for this
cohort, it was necessary to convert the data outputs into categorical data of the nature:
average; moderate and high risk. This manipulation was useful in that it allowed for the
visualisation of how the different tools stratified the probands and their families.
As can be seen in Figure 3-7, the baseline assessment placed thirty families at high risk for
an inherited cancer syndrome. The other three tools all showed a markedly decreased
amount of individuals and families at high risk (range: 1-3). A much more significant number
of people were classified in average or moderate risk categories by these tools. This re-
enforces two important findings of this study:
Family history may be a significant predictor of risk in this population.
The potential contribution of BRCA mutations in a cohort selected on the basis of age
proportionately might be less than expected when compared to other populations
because of the large number of young people in the population.
4.4.5.1 Comparisons between Models
Both the Claus model and the Tyrer-Cuzick model gave an output of lifetime risk for
developing breast cancer. They were found to have a strong positive correlation. The data
appeared to cluster in the moderate risk category with very few individuals at high risk. It is
not known how this information relates to these individuals’ true risks.

Page | 64
The Manchester scoring system was also compared to the Tyrer-Cuzick model since both of
these tools gave a risk of identifying a BRCA mutation. In this instance, the correlation was
positive however not as strong as between the Claus and Tyrer-Cuzick models. There was
clustering on the average to moderate risk end of the curve, with decreasing correlation as
the curve approaches high risk. It is possible to surmise from this that the Manchester and
the Tyrer-Cuzick models are correlated more strongly at lower risk estimates but diverge at
higher risks.
4.4.5.2 Comparison of All Models
The conversion of all risk outputs to a single format highlighted the fact that most probands
had inconsistent risk outputs. These probands tended to have only one or two of the classic
features of an inherited cancer syndrome rather than portraying a classic high risk scenario.
This information highlights the fact that these risk assessment tools were developed for a
very particular subset of individuals of the broader breast cancer population. In general the
cohort that was investigated in this study does not conform to these criteria.
Only a single proband and her family were placed in the same risk category by all of the risk
assessment tools excluding the Claus Model, which could not be utilised for lack of an
appropriate table. This was an interesting observation and necessitated a closer examination
of this individual’s breast disease profile and family history pedigree. This information can be
visualised in Figure 4-3C.
The pedigree illustrates that the proband was diagnosed with stage IIB unilateral ductal
carcinoma at the age of 39 years. In addition, she was found to be negative for expression of
the oestrogen and progesterone hormone receptors as well as the Her2/neu receptor.
Further, she had two relatives who had been diagnosed with and died from breast cancer;
one at a significantly young age (27 years). The combination of these factors (all known to
confer increased risk for breast cancer) was sufficient to place her in a high risk category
irrespective of which risk assessment tool was utilised. Interestingly, this family also
conforms to criteria for Li Fraumeni syndrome and would be eligible for p53 mutation testing.
In the case of this family, the relevant criteria are: A proband with a Li Fraumeni spectrum
tumour (premenopausal breast cancer) AND at least one first- or second- degree relative
with a Li Fraumeni spectrum tumour (mother with leukaemia) before the age of 56 years
(Tinat, et al., 2009).
This information, in conjunction with the ANOVA evaluation, emphasizes the idea that young
black South African women with breast cancer may not necessarily be consistent with the
expected picture of inherited breast cancer as seen in other population groups and the

Page | 65
application of these risk assessment models in this population may not be effective. It also
re-affirms the necessity for the development of a risk assessment programme designed
specifically for this cohort and the broader population that it represents.
The results of the ANOVA analysis emphasized the inconsistency among the various risk
assessment models. This is not necessarily a surprising finding and to some degree, the
inconsistency can be ascribed to the design of the individual programmes. Each tool
considered a unique set of risk factors and parameters in order to produce an output. In
addition, the tools measured different outputs (lifetime or mutation risks). Based on these
intrinsic differences in the programme designs, it is possible to postulate that some of this
inconsistency and variability would be evident in a similarly affected Caucasian population.
These results seem to suggest one of two options for the future of risk assessment and
prediction in this population. Either, it will be necessary to use a combination of these tools
to calculate an accurate risk, or alternatively, develop a new consolidated, risk assessment
tool that is inclusive of all the potential risk factors and specific for the variation in this
population. Ultimately, BRCA (or other genetic) mutation testing is the only way in which it
will be possible to determine which risk assessment (existing or future) will represent risk in
this population more accurately.

Page | 66
5 CONCLUSIONS
This was a unique study and the first to have examined family history in the context of black
South African women diagnosed with breast cancer. The study has shown that the black
South African women examined in this study who have been diagnosed with breast cancer
at a young age tend to have significant family histories of breast and/or ovarian cancer less
frequently than would be expected from a high risk cohort selected based on age of
diagnosis. In addition, existing risk assessment models that are used to predict lifetime and
mutation risks for breast cancer in other populations were found to give increased risks of
breast cancer when diagnoses are made at younger ages and there is a family history.
However, the use of these models within this population should be done with caution due to
the limitations discussed previously. The main findings and limitations of this study are re-
iterated below. Recommendations for genetic counselling practices and future research are
also expounded.
5.1 Summary of Study Findings
The major findings of this study need to be viewed as theoretical since no BRCA (or other)
mutation analysis has been performed as yet. The findings are summarised as follows:
Evidence seems to suggest that the age distribution of breast cancer in this
population may be in part, as a consequence of the population structure rather than
an increased incidence of HBOC in this population. In other words, the fact that many
women were diagnosed with breast cancer at young ages may be reflective of the
fact that the median age of this population is shifted significantly towards the left and
these women might in fact have sporadic breast cancers as opposed to inherited
breast cancers. This is in agreement with previous studies that have shown a trend
towards younger age at diagnosis in African populations (Walker, et al., 2004;
Uhrhammer, et al., 2008;)
Overall, the specifics of breast cancer in this cohort of black South African women
appeared to parallel those of breast cancer in other African populations. That is,
breast cancers were diagnosed at younger ages and later stages and there was an
increased incidence of triple negative breast cancer.
It is possible that mutations in BRCA genes might not be the only contributors to
breast cancer predisposition in this population. This necessitates an extensive
molecular genetics workup in this cohort, including other high penetrance genes (e.g.
p53 and pTEN) and lower penetrance genes (e.g. PALB2, CHEK2, ATM).
The pedigree analysis revealed that there was a paucity of family history related data
in this cohort. Those four probands and their families, who were found to have a
Page | 67
significant family history, are most likely to have an inherited predisposition to breast
cancer. However, the many other probands who were the only affected member in a
family are more likely to have sporadic breast cancers irrespective of the young age
at diagnosis. It seems that this population would benefit from an investigation into
alternative predictors of breast cancer risk since they do not appear to conform to
existing strategies of identification. Age at diagnosis, in particular, may be a poor
predictor of risk.
The various risk assessment tools proved to have many different advantages and
disadvantages with respect to their general usage and specifically with respect to
their use in this population. There was some degree of consistency among the
various tools; however they should be used in this population with caution. Risk
assessment tools should be re-evaluated in this population once genetic testing has
been performed on these probands. It is likely that a risk assessment tool will need to
be designed specifically for use in this population.
Only once comprehensive genetic screening, perhaps of many genes, has been
performed, will the epidemiology of breast cancer in black South African women be
fully interpreted.
Page | 68
5.2 Summary of Study Limitations
The major limitations of this study are outlined below:
Even though the cohort appeared to be well matched to the greater population of
young, urban, black South African women with breast cancer in terms of
demographics and socioeconomic factors, the sample size was small (N=45). This
made generalization of the statistical analyses to the population of interest more
complex.
Collection of family history data was impeded for a number of reasons discussed
above. Family history data collection is a notoriously difficult task to perform
accurately. In addition an accurate and complete family history is often obtained over
an extensive period of time with significant effort on the proband’s behalf. This is not
feasible in a busy clinical setting especially when dealing with young women who
have recently been diagnosed with breast cancer. Even in the instance of accurate
information, only an extremely obvious family history would be useful as a predictive
tool for breast cancer risk.
The risk assessment programmes utilized in this study were all designed on the basis
of Caucasian breast cancer data. Consequently, their applicability and utility in a non-
Caucasian population remains to be verified.
The lack of mutation data specific to this population makes all risk data presented in
this study unverifiable at present.
Page | 69
5.3 Study Recommendations
A number of recommendations can be made based on the findings of the present study.
5.3.1 Recommendations for identifying black South African women at increased
risk for a familial breast cancer syndrome
Women who have been identified as being at elevated risk for HBOC are most likely
to benefit from specifically designed management and screening programmes, which
include genetic counselling. These strategies are well defined for breast cancer
prevention and less so for ovarian cancer. There is reasonable evidence to suggest
that a combination of these strategies can impact on the occurrence as well as
morbidity and mortality of breast and/or ovarian cancer in many populations (Hughes,
et al., 2003). Strategies should include the encouragement of self- and clinical-
breast examinations as well as mammography at appropriate ages. It is therefore
prudent to suggest that such strategies be implemented and reinforced in the black
South African population even in the absence of concrete proof of a genetic
contribution to breast cancer in this population and in the presence of a limited
resource environment.
In order to establish such strategies effectively, it is essential that the process of
identifying women at high risk in the black South African population be adapted to
best suit these women. An appropriate screening protocol for identifying women who
require a more intensive screening and management programme could be proposed
based on the results of this study. Figure 5-1 suggests an interim risk assessment
tool.
It is essential to bear in mind that the strategy put forward here needs to be seen as
an interim solution and would need to be re-evaluated pending the completion of
molecular genetic analysis in this population. As a consequence of this, it would be
important that the criteria used to identify at-risk women be kept flexible rather than
stringent at present. A potentially damaging drawback of this is that women who are
not truly at high risk might be identified. The anxiety level of such a woman might be
unnecessarily raised.

Page | 70
Figure 5-1 Interim breast cancer risk assessment guidelines for black South African women

Page | 71
5.3.2 Recommendations for Future Research:
Considering the results of this study suggest that there may be a potentially smaller
role for inherited breast cancer in this population, it seems vital that molecular genetic
analysis of other familial cancer related genes (e.g. p53, pTEN, PALB2, CHEK2,
ATM) be undertaken in addition to the imminent BRCA gene analysis in order to
ensure the full spectrum of potentially contributing genes are evaluated within this
population.
It seems that an important step in the delineation of HBOC in this population would
be to investigate whether or not any family history of cancer exists for black South
African women who have been diagnosed with ovarian cancer. Since ovarian cancer
is a significant predictor of HBOC, such a study would help to confirm the results of
the present research as well as inform the overall picture of HBOC in the local
context.
It also seems important to suggest that the research performed in this study be
expanded to include a larger cohort of affected black South African women of all
ages and from other parts of Gauteng specifically and South Africa in general. In this
way, the findings presented here may be corroborated or refuted and it will be
possible to gain a greater understanding of the scope of inherited breast cancer in
the black South African population.
5.3.3 Recommendations Regarding the Genetic Counselling Service for Inherited
Breast Cancer:
It has been noted that there is an increase in interest (from patients and staff) in, as
well as referrals to the genetic counselling service at the Breast and Plastic Clinic,
CHB. This, in conjunction with the indication that inherited breast cancer is very likely
to be present in the black South African population (albeit to a lesser extent),
indicates that the genetic counselling service should remain functional at this clinic.
Appropriately triaged new patients as well as their families should be offered genetic
counselling as part of routine breast cancer management.
Following from this, it would be essential to take an active approach in educating
medical professionals about inherited breast cancer in general as well as the
appropriate referrals within this population to genetic counselling specifically. This
could be achieved through workshops, seminars and presentations to those doctors

Page | 72
involved in treating affected individuals within this population. The importance of
family history taking should be emphasized to these professionals. Nurses involved
with the treatment of individuals with breast cancer should also be encouraged to
make appropriate referrals to genetic counselling.
Individuals previously seen for genetic counselling in the breast cancer context
should be given follow-up appointments regularly to monitor their progression as well
as maintain up-to-date information regarding other affected family members and at-
risk individuals. It is essential that at-risk individuals be provided with information
regarding their risks (perhaps in the form of an information leaflet) as well as their
options regarding genetic counselling, surveillance and testing (including contact
information). A data management system would be essential to maintain the
information of patients seen as well as their relatives and allow for prompt
identification of at-risk individuals.
It has become apparent that the breast cancer patients being seen at the Genetic
Counselling Clinic would find it beneficial to have additional non-medical support
systems in place. For example, there is potential for the Genetic Counselling Clinic to
play a role in initiating and maintaining a patient-run support group at the Breast and
Plastic Clinic, CHB.
The above summary indicates that this study has contributed to the current understanding of
family history and inheritance of breast cancer in black South African women. Further, this
study has been instrumental in providing a framework and direction for future research with
respect to the genetics of breast cancer in this population as well as informing genetic
counselling practice in the context of HBOC or other cancer predisposition syndromes. This
study also highlights the importance of genetic counselling services within routine breast
cancer management, which will improve with increasing knowledge.

Page | 73
6 LITERATURE CITED
Adams-Campbell, L. L., Makambi, K. H., Palmer, J. R. and Rosenberg, L. (2007). Diagnostic accuracy of
the Gail model in the black women’s health study. The Breast Journal, 13, 4, 332-336.
Akaralo-Anthony, S. N., Ogundiran, T. O. and Adebamowo, C. A. (2010). Emerging Breast cancer
epidemic: evidence from Africa. Breast Cancer Research, 12 (Suppl 4):S8
Allred, D. C. (2010). Issues and updates: evaluating estrogen receptor-α, progesterone receptor, and HER2
in breast cancer. Modern Pathology, 23, S52-S59.
Antoniou, A. L., Hardy, R., Walker, L., Evans, D. G., Shenton, A., Eeles, R., et al. (2008). Predicting the
likelihood of carrying a BRCA1 or BRCA2 mutation: validation of BOADICEA, BRCAPRO, IBIS, Myriad and
the Manchester Scoring system using data from UK genetics clinics. Journal of Medical Genetics, 45, 425-
431.
Bernstein, L. (2003). Endocrine Risk Factors. In: Morrow, M., and Jorfan, V. C. (editors). Managing Breast
Cancer Risk. USA: BC Decker Inc.
Bird, P. A., Hill, A. G. and Houssami, N. (2008). Poor hormone receptor expression in East African breast
cancer: evidence of a biologically different disease? Annals of Surgical Oncology, 15, 1983-1988.
Bondy, M. L. and Newman, L. A. (2003). Breast cancer risk assessment models- Applicability to African-
American women. Cancer, 97, 1 (Suppl), 230-235.
Boughey, J. C., Hartmann, L. C., Anderson, S. S., Degnim, A. C., Vierkant, R. A., Reynolds, C.A., et al.
(2010). Evaluation of the Tyrer-Cuzick (International Breast Cancer Intervention Study) Model for breast
cancer risk prediction in women with atypical hyperplasia. Journal of Clinical Oncology, 28, 22, 3591-3596.
Byrnes, R. M. (1996). Ethnic groups and language in South Africa; A Country Study. Washington GPO for
the Library of Congress.
Capovilla, A. (2008). Mammalian DNA repair. In: Mendelow, B., Ramsay, M., Chetty, N., Stevens, W.
(editors). Molecular Medicine for Clinicians. South Africa: Wits University Press. 227-237.
Claus, E. B., Risch, N. and Thompson, W. D. (1994). Autosomal dominant inheritance of early-onset breast
cancer. Implications for risk prediction. Cancer, 73, 3, 643-651.
Ely, S. and Vioral, A. N. (2007). Breast Cancer Overview. Plastic Surgical Nursing, 27, 3, 128-133.
Evans, D. G. R. Eccles, D. M., Rahman, N., Young, K., Bulman, M., Amir, E., et al. (2004). A new scoring
system for the chances of identifying a BRCA1/2 mutation outperforms existing models including
BRCAPRO. Journal of Medical Genetics, 41, 474-480.
Evans, D. G. R. and Howell, A. (2007). Breast cancer risk-assessment models. Breast Cancer Research, 9,
5, 213-221.
Evans, D. G. R., Lalloo, F., Cramer, A., Jones, E. A., Knox, F., Amir, E. and Howell, A. (2009). Addition of
pathology and biomarker information significantly improves the performance of the Manchester scoring
system for BRCA1 and BRCA2 testing. Journal of Medical Genetics, 46, 811-817.

Page | 74
Fackenthal, J. D., Sveen, L., Gao, Q., Kohlmeit, E. K., Adebamowo, C., Ogundiran, T. O., et al. (2005).
Complete allelic analysis of BRCA1 and BRCA2 variants in young Nigerian breast cancer patients. Journal
of Medical Genetics, 42, 276-281.
Farlay, J., Shin, H-R., Bray, F., Forman, D., Mathers, C. and Parkin, D. M. (2010). Estimates of worldwide
burden of cancer in 2008: GLOBOCAN 2008. International Journal of Cancer, 127, 2893-2917.
Fitzgerald, R. C., Hardwick, R., Huntsman, D., Carneiro, F., Guilford, P., Blair, V., et al. (2009). Hereditary
diffuse gastric cancer: updated consensus guidelines for clinical management and directions for future
research. Journal of Medical Genetics, 47, 436-444.
Haites, N. and Gregory, H.. (2002). Overview of the clinical genetics of breast cancer. In: Morrison, P. J.,
Hodgson, S. V. and Haites, N. E. (editors). Familial Breast and Ovarian Cancer. Genetics, Screening and
Management. Cambridge: Cambridge University Press. 6-21.
Hammer, C., Fanning, A. And Crowe, J. (2008). Overview of breast cancer staging and surgical treatment
options. Cleveland Clinic Journal of Medicine, 75, S1, S10-S16.
Hammond, K. (2008). Tumour Suppressor Genes and Inherited Susceptibility to cancer. IN: Mendelow, B.,
Ramsay, M., Chetty, N., Stevens, W. (editors). Molecular Medicine for Clinicians. South Africa: Wits
University Press. 238-248.
Hampel, H., Sweet, K., Westman, J. A., Offit, K. and Eng, C. (2003). Referral for cancer genetics
consultation: a review and compilation of risk assessment criteria. J Med Genet, 41, 81-91.
Harper, P. S. (1998). Practical Genetic Counselling. 5th edition. P122. Butterworth-Heinemann, Oxford.
Hughes, K. S., Roche, C., Campbell, C. T., Siegel, N., Salisbury, L., Chekos, A., Katz, M. S. and Edell, E.
(2003). Prevalence of family history of breast and ovarian cancer in a single primary care practice using a
self-administered questionnaire. The Breast Journal, 9, 1, 19-25.
Huo, D., Ikpatt, F., Khramtsov, A., et al. (2009). Population differences in breast cancer: survey in
indigenous African women reveals over-expression of triple negative breast cancer. Journal of Clinical
Oncology, 27, 4515-4521.
Jardines, L., Haffty, B.G., Fisher, P., Weitzel, J. and Royce, N. (2005). Breast Cancer Overview. Risk
factors, screening, genetic testing, and prevention. In: Pazdur, R., Wagman, L. D., Camphausen, K. A.,
Hoskins, W. J. (editors). Cancer Management: A multidisciplinary approach. Medical Surgical and Radiation
Oncology. Melville, NY: PPR, Inc. p175-202.
Kerr, B., Lalloo, F., Clancy, T. and Evans, G. (2010). The Manchester Clinical Guide to Cancer Genetics.
Genetic Medicine, St Mary’s Hospital, Manchester, UK.
Lalloo, F., Kerr, B., Friedman, J. and Evans, G. (2005). Risk Assessment and Management in Cancer
Genetics. Oxford University Press: England.
Lee, R., Beattie, M., Crawford, B., Mak, J., Stewart, N., Komaromy, M., et al. (2005). Recruitment, genetic
counselling, and BRCA testing for underserved women at a public hospital. Genetic Testing, 9, 4, 306-312.
Magazi, D. S., Krause, A., Bonev, M., Iqbal, Z., Dludla, M. and van der Meyden, C. H. (2008). Huntington’s
disease: genetic heterogeneity in black African patients. South African Medical Journal, 98, 3, 200-203.

Page | 75
McTiernan, A., Kuniyuki, A., Yasui, Y., et al. (2001). Comparisons of two breast cancer risk estimates in
women with a family history of breast cancer. Cancer Epidimiology and Biomarkers Prevention, 10, 333-338.
Miki, Y., Swensen, J., Shattuck-Eidens, D., Futreal, P. A., Harshman, A., Tavtigian, S., et al., (1994). A
strong candidate for the breast and ovarian cancer susceptibility gene BRCA1. Science, 266, 66-71.
Morgan, N. V., Essop, F., Demuth, I., de Ravel, T., Jansen, S., Tischkowitz, M., et al. (2005). A common
Fanconi anemia mutation in black populations of sub-Saharan Africa. Blood, 9, 3542-3544.
Morrison, P. J., Hodgson, S. V. and Haites, N. E. (2002). Familial Breast and Ovarian Cancer. Genetics,
Screening and Management. Cambridge: Cambridge University Press.
Mqoqi, N., Kellett, P., Sitas, F. and Jula, M. (2004). Incidence of histologically diagnosed cancer in South
Africa, 1998-1999. National Cancer Registry of South Africa, National Health Laboratory Service,
Johannesburg.
National Institute for Health and Clinical Excellence [NICE]. (2006). NICE Clinical Guideline 41 – familial
breast cancer: the classification and care of women at high risk of familial breast cancer in primary,
secondary and tertiary care. London: National Collaborating Centre for Primary Care.
Neuhausen, S. (2000). Founder populations and their uses for breast cancer genetics. Breast Cancer
Research, 2, 2, 77-81.
O’Connell, C. and Dickey, V. L. (2005). Blueprints, Haematology and Oncology. Blackwell Publishing:
Massachusetts, USA. P136-140.
Olopade, O. I., Fackenthal, J. D., Dunston, G., Tainsky, M. A., Collins, F. And Whitfield-Broome, C. (2003).
Breast cancer genetics in African Americans. Cancer Supplement, 97, 1, 236-245.
O’Malley, C., Shema, S., White, F., et al. (2005). Incidence of male breast cancer in California, 1988-2000:
racial/ethnic variation in 1759 men. Breast Cancer Research and Treatment, 93, 145-150.
Onitilo, A. A., Engel, J. M., Greenlee, R. T., and Mukesh, B. N. (2009). Breast cancer subtypes based on
ER/PR and Her2 expression: comparison of clinicopathologic features and survival. Clinical Medicine and
Research, 7, 1, 4-13.
Palmer, J. R., Boggs, D. A., Wise, L. A., Ambrosone, C.B., Adams-Campbell, L. And Rosenberg, L. (2011).
Parity and lactation in relation to estrogen receptor negative breast cancer in African American women.
Cancer Epidemiology, Biomarkers and Prevention, 20, 9, 1-9. [Abstract].
Paterson, A. C. and Cronje, L. (2008). Neoplasia: General Considerations. In: Mendelow, B., Ramsay, M.,
Chetty, N, Stevens, W. (editors). Molecular Medicine for Clinicians. South Africa: Wits University Press. 208-
217.
Reeves, M. D., Yawitch, T. M., van der Merwe, N., van den Berg, H. J., Dreyer, G. And van Rensburg, E. J.
(2004). BRCA1 mutations in South African Breast and/or ovarian cancer families: evidence of a novel
founder mutation in Afrikaner families. International Journal of Cancer, 110, 677-682.
Resta, R., Bieseker, B., Bennet, R. L., Blum, S., Estabrooks Hahn, S., Strecker, M. N. and Williams, J. L.
(2006). A new definition of genetic counseling: National Society of Genetic Counselors’ Task Force Report.
Journal of Genetic Counseling, 15, 2, 77-84.

Page | 76
Rijnsburger, A. J., Obedeijn, I-M., Kaas, R., Tilanus-Linthorst, M. M. A., Boetes, C., Loo, C. E., et al. (2010).
BRCA1-associated breast cancers present differently from BRCA2-associated and familial cases: long-term
follow-up of the Dutch MRISC Screening Study. Journal of Clinical Oncology, 28, 36, 5265-5273.
Rubinstein, W. S., O’Neill, S. M., Peters, J. A., Rittmeyer, L. J. and Stadler, M. P. (2002). Mathematical
modelling for breast cancer risk assessment. Oncology, 16, 8, 1082-1094.
Shannon, C. and Smith, I. E. (2003). Breast cancer in adolescents and young women. European Journal of
Cancer, 39, 2632-2642.
Sitruk-Ware, R. And Nath A. (2010). The use of newer progestins for contraception. Contraception, 82, 410-
417.
Smith, E. B. (1986). Primary bilateral breast cancer. Journal of the National Medical Association, 78, 11,
1069-1072.
Southey, M. C., Ramus, S. J., Dowty, J. G., Smith, L. D., Tesoriero, A. A., Wong, E. E. M., et al. (2011).
Morphological predictors of BRCA1 germline mutations in young women with breast cancer. British Journal
of Cancer, 104, 903-909.
Steiner, E., Klubert, D. and Knutson, D. (2008). Assessing breast cancer risk in women. American Family
Physician, 78, 12, 1361-1366.
Struewing, J. P., Hartge, P., Wacholder, S., Baker, S. M., Berlin, M., McAdams, M., et al. (1997). The risk of
cancer associated with specific mutations of BRCA1 and BRCA2 among Ashkenazi Jews. New England
Journal of Medicine, 336, 20, 1401-1408.
Tinat, J., Bougeard, G., Baert-Desurmont, S., Vasseur, S., Martin, C., Bouvignies, E., et al. (2009). 2009
Version of the Chompret Criteria for Li Fraumeni Syndrome. Journal of Clinical Oncology, 27, 26, e108-109.
Uhrhammer, N., Abdelouahab, A., Lafarge, L., Feillel, V., Ben Dib, A. and Bignon, Y-J. (2008). BRCA1
mutations in Algerian breast cancer patients: high frequency in young, sporadic cases. International Journal
of Medical Science, 5, 197-202.
Venkitaraman, A. R. (2004). Tracing the network connecting BRCA and Fanconi anaemia proteins. Nature
Reviews Cancer, 4, 266-276.
Vorobiof, D. A., Sitas, F. And Vorobiof, G. (2001). Breast cancer incidence in South Africa. Journal of
Clinical Oncology, 19, 125s-127s.
Walker, A. R. P., Adam, F. I. and Walker, B. F. (2004). Breast Cancer in Black African Women: a changing
situation. Journal of the Royal Society for the Promotion of Health, 124, 2, 81-85.
Walsh, T. And King, M-C. (2007). Ten genes for inherited breast cancer. Cancer Cell, 11, 103-105.
Welsch, P. L. and King, M-C. (2001). BRCA1 and BRCA2 and the genetics of breast and ovarian cancer.
Human Molecular Genetics, 10, 7, 705-713.
Whalley, N. A. and Hammond, K. (2008). Oncogenes. In: Mendelow, B., Ramsay, M., Chetty, N. Stevens,
W. (editors). Molecular Medicine for Clinicians. South Africa: Wits University Press. 218-226.
Wood, M. E. (2010). A clinician’s guide to breast cancer risk assessment. Cancer Genetics, 8, 1, 15-20.
Page | 77
Wooster, R., Bignell, G., Lancaster, J., Swift, S., Seal, S., Mangion, J., et al. (1995). Identification of the
breast cancer susceptibility gene BRCA2. Nature, 378, 789-792.
Yawitch, T. M., van Rensburg, E. J., Mertz, M. and Falkson, C. I. (2000). Absence of commonly recurring
BRCA1 mutations in Black South African women with breast cancer. South African Medical Journal, 90, 8,
788.
6.1.1 Electronic Resources:
Department of Economic Development [DED] (2009). The five year Soweto Economic Development Plan
2008-2013. Retrieved on 12 August 2011 from
http://www.joburg-archive.co.za/2009/pdfs/economic_development/regd_plan.pdf
Fackenthal, J. D., Zhang, J., Zhang, B., Zheng, Y., Hagos, F., Burill, D., et al. (2011). High Prevalence of
BRCA1 and BRCA2 mutations in unselected Nigerian breast cancer patients. Retrieved on 8 November
2011 from
http://0-onlinelibrary.wiley.com.innopac.wits.ac.za/doi/10.1002/ijc.27326/abstract
Media Club South Africa (2011). South Africa’s nine provinces. Retrieved on 11 August 2011 from
http://www.mediaclubsouthafrica.com/index.php?option=com_content&view=article&id=163:provinces_new&
catid=33:land_bg_Itemid=70#languages#ixzz1UiieZHa2
National Cancer Registry (2009). Cancer Statistics. Retrieved on 13 April 2011 from
http://www.nioh.ac.za/?page=cancer_statistics&id=163
National Cancer Registry. (2010). National Cancer Registry. Retrieved on 28 June 2011 from
http://www.nioh.ac.za/?page=national_cancer_registry&id=41
Online Mendelian Inheritance in Man [OMIM]. (2011). Breast Cancer. MIM Number: #114480. Retrieved on
20 August 2011 from
http://omim.org/entry/114480
Petrucelli, N., Daly, M. B. and Feldman, G. L. (1998). BRCA1 and BRCA2 Hereditary Breast and Ovarian
Cancer. Retrieved on 21 March 2011 from
http://www.ncbi.nlm.nih.gov/books/NBK1247/#BRCA1.REF.haffty.2002.1471
SenoNetwork (2010). Chris Hani Baragwanath Hospital – Johannesburg/Soweto, South Africa. Retrieved
on 27 April 2011 from
http://www.senonetwork.org/Breast+Unit+Directory/South+Africa/Chirs+Hani+Baragwanath+Hospital/4,9,169
Stark, A., Kleer, C. G., Martin, I., Awuah, B., Nsiah-Asare, A., Takyi, V., et al. (2010). African ancestry and
higher prevalence of triple negative breast cancer. Retrieved on 26 July 2010 from
http://0-www3.interscience.wiley.com.innopac.wits.ac.za/cgi-bin/fulltext/123582156/HTMLSTART
Statistics South Africa (2011). Mid-year population estimates 2011. Retrieved on 10 August 2011 from
http://www.statssa.gov.za/publications/statsdownload.asp?PPN=P0302&SCH=4986

Page | 78
Van der Merwe, N., Hamel, N., Schneider, S-R., Apffelstaedt, J. P., Wijnen, J. T. and Foulkes, W. D. (2011).
A founder BRCA2 mutation in no-Afrikaner breast cancer patients of the Western Cape of South Africa.
Clinical Genetics, in pres. Epub ahead of print retrieved on 1 February 2011 from
http://0-onlinelibrary.wiley.com.innopac.wits.ac.za/doi/10.1111/j.1399-0004.2010.01617.x/pdf
Wang, T., Chang, P., Wang, L., Yao, Q., Guo, W., Chen, J., et al. (2011). The role of human papillomavirus
infection in breast cancer, in pres. Epub ahead of print retrieved on 29 August 2011 from
http://www.springerlink.com/content/t12v2141m08m2121/ [Abstract]
World Health Organisation [WHO]. (2010). World Health Report. Executive Summary. Retrieved on 27
April 2011 from http://www.who.int/whr/2010/en/index.html
WHO (2011). Cancer. Fact Sheet No 297. Retrieved on 5 April 2011 from
http://www.who.int/mediacentre/factsheets/fs297/en/index.html
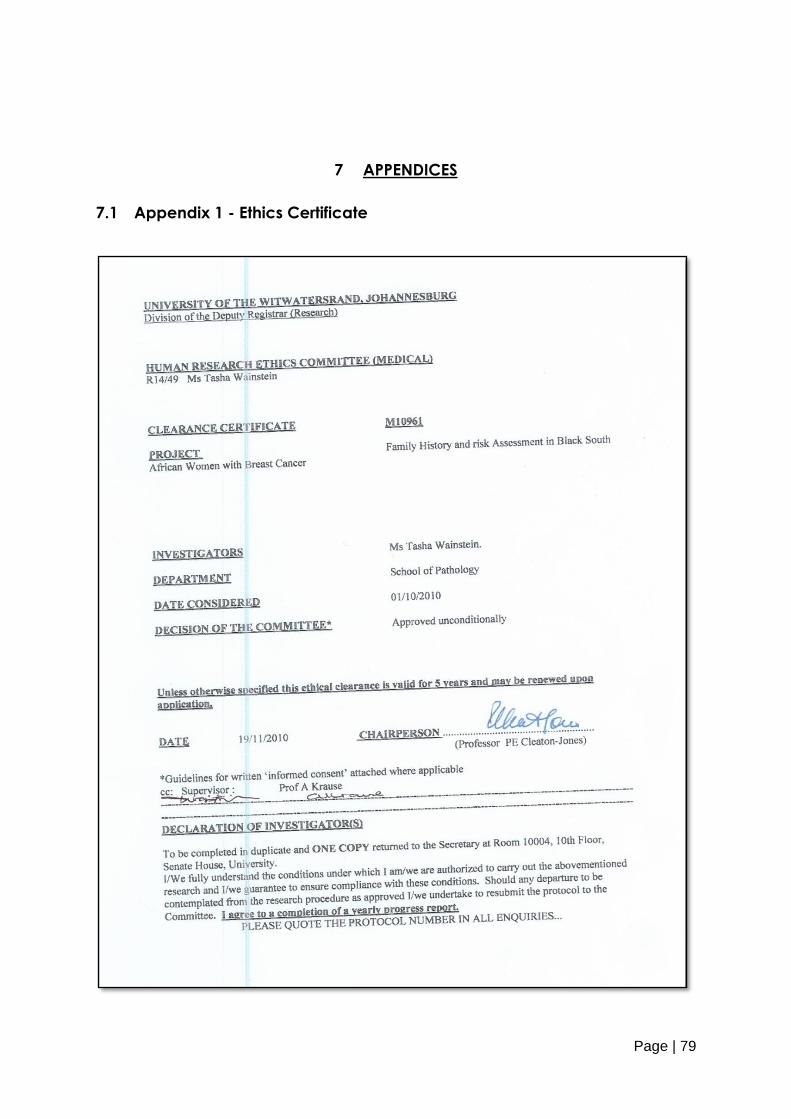
Page | 79
7 APPENDICES
7.1 Appendix 1 - Ethics Certificate

Page | 80
National Health Laboratory ServiceUniversity of the Witwatersrand, School Of Pathology
Division Human Genetics
GENETIC COUNSELLING CLINIC
Hospital Street, Johannesburg 2001 PO Box 1038, Johannesburg 2000
Telephone: +27-11-489-9224/9223/9211 Fax: +27-11-489-9226
Prof A Christianson 011 489-9211 Prof A Krause 011 489-9219 Ms T Wessels 011 489-9243
7.2 Appendix 2 - Information Sheet and Informed Consent Form
Information Sheet: Family History and Risk Assessment in Black South African Women with Breast Cancer
Investigator: Tasha Wainstein, MSc (Med) Genetic Counselling Student
Good day, my name is Tasha Wainstein. I am a student in the Division of Human Genetics, National Health Laboratory Service (NHLS) and the University of the Witwatersrand (Wits).
As part of my studies, I will be conducting research to try to understand why African women develop breast cancer. Breast cancer affects many women worldwide. In South Africa, approximately 1 in 50 black women will develop breast cancer in their lifetime. At present, little is known about the way in which breast cancer occurs within black South African families. Although most forms of breast cancer occur by chance, some cases can be inherited from one generation to the next. My study therefore aims to identify whether or not there is a significant family history in black women who have breast cancer. I will be using risk assessment programmes to predict the theoretical risks for you and your family members of developing breast cancer in your lifetimes or of having a gene that may cause breast cancer. In the future, those individuals who are found to be at an increased risk may then be able to participate in various cancer prevention strategies and genetic testing research.
I would like to invite you to participate in this study by allowing me to use your family history information and assess your personal breast disease history in my analysis by analysing your genetic counselling file in more detail after your routine genetic consultation.
This information will be gathered and discussed in detail in a routine genetic consultation that will take place at the Breast and Plastic Clinic at the Chris Hani Baragwanath Hospital. This consultation will take approximately one hour. During the genetic consultation, you will be asked numerous questions about your family history and this information will be used to construct a family pedigree. Information such as the names, ages, and possible diagnoses of your children, siblings, parents and other relatives will be sought. We will also discuss aspects of your personal breast cancer history and treatment. Following this, we will discuss current knowledge of the genetics of breast cancer as well as important information regarding screening and management for yourself and your family members. I will use the family pedigree drawn in the session and the personal breast disease history that you or your doctor has provided in my analysis.
This project will help us to understand more about inherited breast cancer in the black population. This study might not help you directly. It will not make you better. Your treatment will continue just as before. This may help your family as well as other families in the future.
Your participation in this study is voluntary. You have the right to refuse to participate in the study. Also, you have the right to withdraw from the study at any time. Your refusal or withdrawal will not affect present or future treatments. This would not exclude you from being offered genetic counselling, which is part of the routine service we offer at the Breast and Plastic Clinic.
All your personal information will be kept strictly confidential and data obtained from the study will be anonymised.
If you have any questions about your participation, please do not hesitate to contact me or my colleagues on the numbers listed below.
Thank you,
Ms. Tasha Wainstein - BSc (Hons) Human Genetics, Genetic Counselling Student - 011-489-9223/4
Prof Amanda Krause - MBBCh, PhD, Associate Professor and Head of Clinical Section - 011-489-9219
Ms. Chantel van Wyk - MSc (Med) Genetic Counselling, Genetic Counsellor - 011-489-9236
If you have any queries, complaints or problems regarding this information please contact the Chairman of the Research Ethics Committee, Professor Peter Cleaton-Jones, on 011 717 1234.

Page | 81
Consent Form
Family History and Risk Assessment in Black South African Women with Breast Cancer
I, _________________________________________________, certify that:
1. The research has been explained to me and I understand that my family history and personal breast
disease history will be analysed.
2. The information collected about me will be kept confidential.
3. I understand why the study is being done and that it may have benefits for me/my child/my extended
family. The study will help researchers to understand inherited breast cancer so that they may develop
ways to prevent inherited breast cancer in the future.
4. I have had sufficient opportunity to ask questions about the research and I have decided to participate in
the study without coercion.
5. I understand that I do not have to participate in this study. If I choose not to participate, it will not affect
the way I am treated at the hospital/clinic. Similarly, if I choose to withdraw from the study at any time, it
will not affect any future treatment I may require.
My decision for the use of my information once the study is completed is (please mark with an X):
If possible, my information should be stored for future analysis in my interest (on my request).
My information may be used for medical research:
With my name,
Without my name (anonymous). This means that I cannot be informed about eventual results.
My information must be discarded once the study is completed.
I would like to be notified of results of the study
I give permission for the researcher to view my clinical notes.
I give permission for the researcher to receive copies of my histology reports and scans.
Signed on this ________ day of __________ 20______ at ___________________________________________
Patient
Name: _________________________ Signature: ___________________________
Witness
Name: _________________________ Signature: ___________________________
Researcher:
Name: ________________________ Signature: ___________________________

Page | 82
7.3 Appendix 3 - Data Collection Sheets
1. General Information
Subject Code:
Related to other family file code:
Date of Birth: dd mm yyyy
Age: current at diagnosis
Gender: male female
Ethnicity / Tribal Origin: IsiNdebele IsiXhosa IsiZulu
Sepedi Sesotho Setswana
siSwati Tshivenda Xitsonga
Description of Counsellee(s): Breast Cancer
<50 years
Breast Cancer >50 years + family history
Description of Support Person/s parent of proband
child of proband
sibling of proband
non-relative
Occupation Status: employed unemployed previously employed

Page | 83
2. Family History Data
Pedigree drawing including necessary information* for healthy and affected children, siblings, parents, aunts, uncles, cousins and grandparents:
*"Necessary Information" includes: age; date of death; age at diagnosis; type of cancer; cause of death
Number of affected 1st degree relatives Number of unaffected 1st degree relatives
Number of affected 2nd degree relatives Number of unaffected 2nd degree relatives
Total number of affected relatives Total number of unaffected relatives
Number of 1st degree at-risk female relatives**
Number of 2nd degree at-risk relatives
Total number of at-risk relatives
** "at-risk female relatives" have an increased risk of developing breast cancer in their lifetime and include relatives from the proband's generation and below as well as from the proband's parents' generation
Page | 84
3. Proband Breast Disease History
Precancerous Breast Conditions:
Atypical Ductal Hyperplasia Ductal Carcinoma In Situ Lobular Carcinoma In Situ
Breast Cancer Type:
Ductal Lobular Other*
Breast Cancer Laterality:
Unilateral Bilateral
Tumour Staging*:
Tumour Size Node Involvement Metastasis
Histology*:
Oestrogen Receptor Status Progesterone Receptor Status
Her2 Receptor Status
Other Cancers:
Ovarian Cervical Uterine
Thyroid Melanoma Other*
Hormonal Factors*:
Age at 1st Period Age at 1st Pregnancy Duration of Contraception Use
Duration of Breast Feeding (for all children)
Age at Menopause Duration of HRT Use
Surgery:
Lumpectomy Therapuetic Mastectomy Prophylactic Mastectomy
Hysterectomy Oophorectomy
*Specify

Page | 85
4. Risk Assessment Data
Risk of Having an inherited cancer syndrome in the family*
*Based on family history data alone (refer to Table 1, page 4 of Research Proposal)
Average Moderate High
Claus Output**
Tyrer-Cuzick Output**
10 year risk prediction output beyond 10 year risk prediction ouput mutation risk output
Manchester Score**
BRCA1 Score BRCA2 Score Combined Score
** Risk calculated for a twenty-year old first-degree female relative of the affected individual

Page | 86
7.4 Appendix 4 - Frequently Used Claus Tables
7.4.1 Claus Table 1
7.4.2 Claus Table 2

Page | 87
7.4.3 Claus Table 4

Page | 88
7.5 Appendix 5 - Manchester Scoring System

Page | 89


