
2003 Final Annual Report
Project No. CU1231
Fe(0)-Based-Bioremediation of
RDX-Contaminated Groundwater
Submitted to: Dr. Andrea Leeson
SERDP/ESTCP Cleanup Project Manager 901 N. Stuart Street, Suite 303
Arlington, VA 22203 703-696-2118 (V) 703-696-2114 (F)
by
Joshua D. Shrout, Brett Sutton, Leslie Sherburne, Phil Larese-Casanova, Michelle M. Scherer, Gene F. Parkin, Richard L. Valentine, Craig L. Just, and Pedro J.J. Alvarez*
Department of Civil and Environmental Engineering,
The University of Iowa, Iowa City, IA 52242-1527
Fax: (319) 335-5660
E-mail: [email protected]
January 15, 2004

Fe(0)-Based-Bioremediation of RDX-Contaminated Groundwater
Project CU1231 Page 2 1st Quarter Progress Report
SUMMARY
RDX (hexahydro-1,3,5-trinitro-1,3,5-triazine) is an explosive compound that is gaining
notoriety as a recalcitrant and toxic groundwater contaminant at many military installations.
Batch and flow-through column studies suggest that permeable reactive iron barriers (PRBs)
should effectively intercept and degrade RDX plumes, and that treatment efficiency could be
enhanced by some biogeochemical interactions. This project addressesed the potential to
enhance RDX degradation by bioaugmentation of an Fe(0) permeable reactive barrier, with focus
on investigating RDX mechanisms and the sustainability and robustness of an integrated
microbial-Fe(0) treatment system.
Activities completed this year included chemical characterization including assessing the
subsequent “degradability” of unknown soluble metabolites formed during RDX transformation.
Such byproducts were mineralized faster and to a greater extent to carbon dioxide than the parent
RDX compound. A significant fraction of carbon from RDX formed under abiotic conditions
was confirmed to be formaldehyde. We also continued to run flow-through column studies to
investigate the sustainability of these systems. The RDX degradation profile for columns
containing “aged” iron was determined and these columns were characterized with respect to
their microbial communities and iron oxides formed along the length of the simulated Fe(0)
barrier. Lastly, our investigation with the homoacetogen Acetobacterium paludosum has
indicated that RDX can serve as a nitrogen source for this bacterium.
This report details the importance, relevance, and scope of this work and the achievement
of milestones for this research in 2003.
Fe(0)-Based-Bioremediation of RDX-Contaminated Groundwater
Project CU1231 Page 3 1st Quarter Progress Report
INTRODUCTION
RDX is a recalcitrant and toxic contaminant present in the subsurface at many military
installations. Because of its persistence, low tendency to volatilize (dimensionless Henry’s
constant, H’ = 2 × 10-11), and high mobility in aquifers (log Kow = 0.8), clean-up of RDX-
contaminated sites is a challenging problem. Several ex situ physical-chemical and biological
practices to remove RDX from contaminated sites exist, but these are not cost-effective to treat
large volumes of contaminated groundwater. In addition, complete destruction of RDX is not
always achieved. The recalcitrance of RDX motivated this project to develop a new and efficient
method to remediate RDX-contaminated aquifers. This method is based on combining a novel
chemical process (reductive treatment with permeable Fe(0) barriers) with a promising
bioremediation approach (in situ reactive zones). This integrated Fe(0)-microbial system should
improve the capability and reduce the cost of RDX remediation.
SUMMARY OF WORK
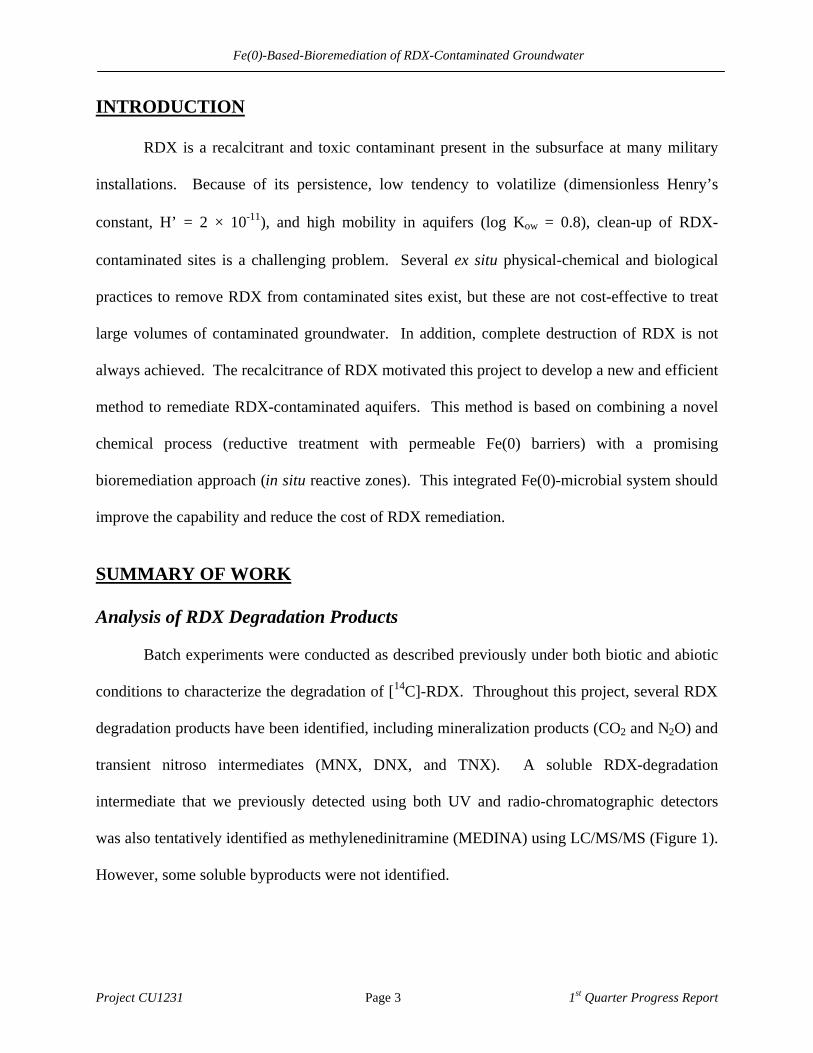
Analysis of RDX Degradation Products Batch experiments were conducted as described previously under both biotic and abiotic
conditions to characterize the degradation of [14C]-RDX. Throughout this project, several RDX
degradation products have been identified, including mineralization products (CO2 and N2O) and
transient nitroso intermediates (MNX, DNX, and TNX). A soluble RDX-degradation
intermediate that we previously detected using both UV and radio-chromatographic detectors
was also tentatively identified as methylenedinitramine (MEDINA) using LC/MS/MS (Figure 1).
However, some soluble byproducts were not identified.

Fe(0)-Based-Bioremediation of RDX-Contaminated Groundwater
Project CU1231 Page 4 1st Quarter Progress Report
N
N
NNO2
NO2
O2N N
N
N
NO2
NOO2N N
N
NNO
NO
O2NN
N
NNO
NO
ON
NH
NH
NO2
O2N
HOH2CN
CH2OH
NO2
NHHOH2C
O2NHN
H
NO2
HCHO
N2O
HCOOH
CH4 CO2 CH3OH
N2
NHO H2C R
R'O
NHCH2OH
NO
+
RDX MNX DNX TNX
methylenedinitraminebis(hydroxymethyl)nitramine
hydroxymethylnitraminenitramine hydroxymethylnitrosamine
+acetogens
methanogens
amide linkage &sequestration byhumic backbone
H2O2 HCHO
3 H2O
2 H2O
H2O
3
3 HCHO 3
H2O3
R = NO or NO2
Fig. 1. Proposed RDX degradation pathway, based on work by Hawari et al.(2001). Species
detected in this research are underlined (Source: Oh et al., 2001).
Experiments described below have yielded at least one additional metabolite that is not
methylenedinitramine. RDX metabolite identification has been attempted using an Agilent 1100
series liquid chromatograph/mass spectrometer (LC/MS). Initial screenings have utilized full
scan data acquisition in either positive or negative ion mode. A C18 column and 50/50
acetonitrile/water with 0.1% acetic acid at 1 mL/min was used for positive ion analysis. Acetic
acid was replaced with ammonium acetate for negative ion analysis.
To date, with the exception of the identification of formaldehyde (which has been found
to be a major byproduct in abiotic systems), identification efforts have been inconclusive mainly
due to lack of MS sensitivity in full scan mode. The identification of unknown metabolites can
Fe(0)-Based-Bioremediation of RDX-Contaminated Groundwater
Project CU1231 Page 5 1st Quarter Progress Report
be a very difficult task, particularly if the compound(s) of interest are uncommon and not
commercially available for verification and quantification as is the case here. Nevertheless,
additional characterization was conducted by performing fundamental chemical investigation to
determine the volatility and octanol-water partitioning of the RDX metabolite(s), was described
below
Materials and Methods
High performance liquid chromatography (HPLC) analysis of RDX and its nitroso
derivatives MNX, DNX, and TNX was performed using a Hewlett Packard 1100 Series HPLC
equipped with a 250 x 4.6 mm SupelcosilTM LC-18 column. The mobile phase consisted of
deionized water and methanol (4:6, v/v) at a flow rate of 1.0 mL/min. UV detection was at 240
nm. [14C]-RDX and its [14C]-metabolites were analyzed by HPLC using a radioactivity detector
(Radiomatic, Series A-500, Packard Instrument Co., Downers Grove, IL). RDX mineralization
was determined from trapped [14C]-CO2 in the 0.5N NaOH tubes that were in the bottles.
Batch experiments were also conducted to investigate the degradability of 14C-RDX
degradation products eluting from the Bioaugmented column described below in Column
Studies, and a separate 14C-RDX metabolite from incubations with Acetobacterium paludosum.
Mineralization assays were conducted under both aerobic and anaerobic conditions. Inoculums
for some treatments consisted of soil collected from the University of Iowa Campus, Iowa City,
IA. The soil was air dried for 24 hours and passed through a 1-mm sieve before use. The soil
served as the source of indigenous microorganisms for the aerobic treatments. Additional
microcosms were inoculated with activated and anaerobic sludge from the Iowa City South
Waste Water Treatment Plant.
Fe(0)-Based-Bioremediation of RDX-Contaminated Groundwater
Project CU1231 Page 6 1st Quarter Progress Report
The synthetic groundwater medium for all microcosms contained (in mg/L): K2SO4
(40.0), NH4Cl (16.0), CaCl2 (6.66), MgCl2•6H20 (12.2), K2HPO4 (3.48), H3BO3 (3.71 × 10⁻⁴),
Ni(NO3)2•6H2O (1.74 × 10⁻³), CuSO4•5H20 (1.50 × 10⁻³), ZnSO4•7H20 (1.73 × 10⁻³),
CoSO4•7H20 (1.69 × 10⁻³), (NH4)6Mo7O24 (1.06 × 10⁻³). The medium was buffered with
NaHCO3 (200) and the pH was adjusted to 7.0 units with HCl. Batch reactors used to investigate
the mineralization of 14C-labeled RDX degradation products contained the following: 2.5 mL of
synthetic groundwater medium, 5.0 mL of diluted activated sludge (10% v:v, sludge:water), 5.0
mL of anaerobic sludge, and 12.5 mL of the unknown metabolite (0.007 µCi). RDX treatments
contained the following: 13 mL of synthetic groundwater medium, 5.0 mL of diluted activated
sludge (10% v:v, sludge:water), 5.0 mL of anaerobic sludge, 2.0 mg/L of 12C RDX, and 0.007
µCi of 14C RDX. All reactors contained 2.0 ml of 0.5 N NaOH in disposable glass tubes as a
trap to collect CO2 for monitoring the mineralization of RDX or the unknown metabolite. All of
the 225-mL serum bottles were sealed with gray septa and aluminum crimps.
Metabolite products identified two separate RDX-degrading treatments described during
previous quarters of this project were tested. The first unknown RDX-degradation metabolite
composite was obtained from the Bioaugmented Column (as described in Column Studies below)
effluent. Six treatment sets were monitored in duplicate: (1) unknown metabolite (UM-BC) and
activated sludge, (2) UM-BC and anaerobic sludge, (3) UM-BC alone, (4) RDX and activated
sludge, (5) RDX and anaerobic sludge, and (6) RDX alone.
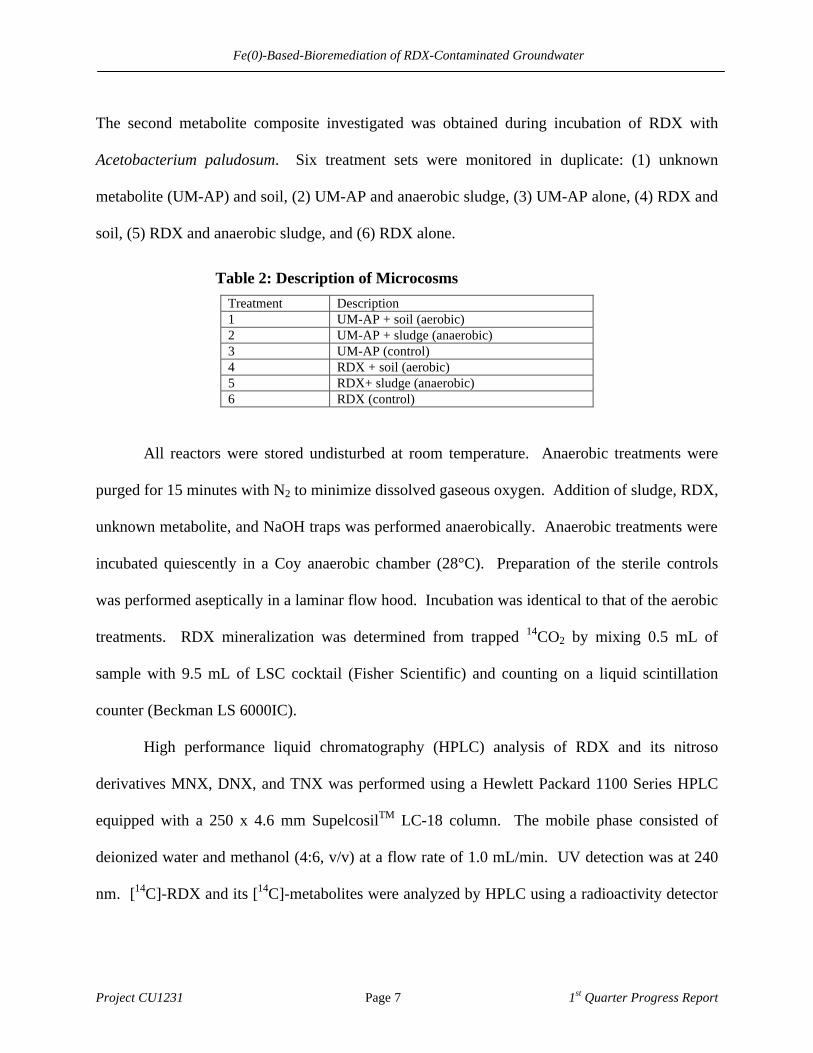
Table 1: Description of Microcosms Treatment Description 1 UM-BC + activated sludge 2 UM-BC + anaerobic sludge 3 UM-BC (control) 4 RDX + activated sludge 5 RDX+ anaerobic sludge 6 RDX (control)
Fe(0)-Based-Bioremediation of RDX-Contaminated Groundwater
Project CU1231 Page 7 1st Quarter Progress Report
The second metabolite composite investigated was obtained during incubation of RDX with
Acetobacterium paludosum. Six treatment sets were monitored in duplicate: (1) unknown
metabolite (UM-AP) and soil, (2) UM-AP and anaerobic sludge, (3) UM-AP alone, (4) RDX and
soil, (5) RDX and anaerobic sludge, and (6) RDX alone.
Table 2: Description of Microcosms Treatment Description 1 UM-AP + soil (aerobic) 2 UM-AP + sludge (anaerobic) 3 UM-AP (control) 4 RDX + soil (aerobic) 5 RDX+ sludge (anaerobic) 6 RDX (control)
All reactors were stored undisturbed at room temperature. Anaerobic treatments were
purged for 15 minutes with N2 to minimize dissolved gaseous oxygen. Addition of sludge, RDX,
unknown metabolite, and NaOH traps was performed anaerobically. Anaerobic treatments were
incubated quiescently in a Coy anaerobic chamber (28°C). Preparation of the sterile controls
was performed aseptically in a laminar flow hood. Incubation was identical to that of the aerobic
treatments. RDX mineralization was determined from trapped 14CO2 by mixing 0.5 mL of
sample with 9.5 mL of LSC cocktail (Fisher Scientific) and counting on a liquid scintillation
counter (Beckman LS 6000IC).
High performance liquid chromatography (HPLC) analysis of RDX and its nitroso
derivatives MNX, DNX, and TNX was performed using a Hewlett Packard 1100 Series HPLC
equipped with a 250 x 4.6 mm SupelcosilTM LC-18 column. The mobile phase consisted of
deionized water and methanol (4:6, v/v) at a flow rate of 1.0 mL/min. UV detection was at 240
nm. [14C]-RDX and its [14C]-metabolites were analyzed by HPLC using a radioactivity detector

Fe(0)-Based-Bioremediation of RDX-Contaminated Groundwater
Project CU1231 Page 8 1st Quarter Progress Report
(Radiomatic, Series A-500, Packard Instrument Co., Downers Grove, IL). RDX mineralization
was determined from trapped [14C]-CO2 in the 0.5N NaOH tubes that were in the bottles.
Results and Discussion
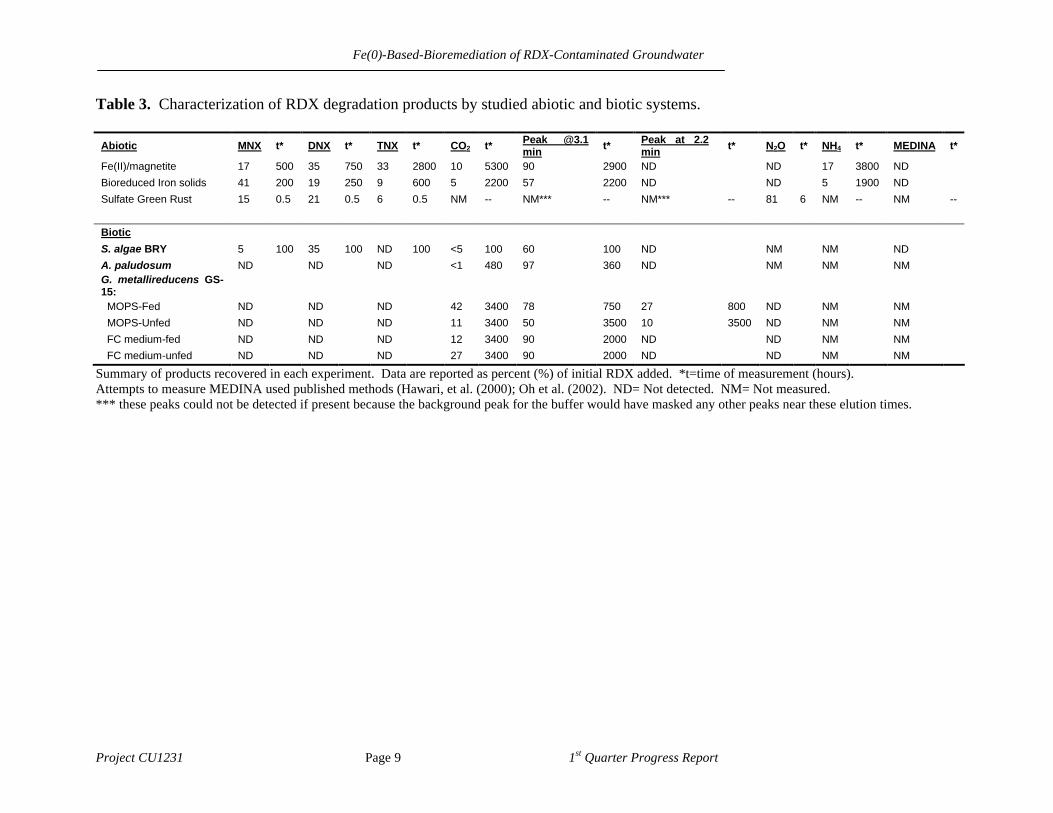
Two unidentified metabolites have been observed from the performed experiments (Table
3). A rigorous analysis of samples and known compounds has showed that these metabolites are
not MEDINA. It is noteworthy that the metabolite observed at 3.1 minutes by HPLC analysis
appears in both abiotic and biotic RDX-degrading treatments. The metabolite observed at 2.2
minutes by HPLC analysis is obtained only in some biotic systems.
Fe(0)-Based-Bioremediation of RDX-Contaminated Groundwater
Project CU1231 Page 9 1st Quarter Progress Report
Table 3. Characterization of RDX degradation products by studied abiotic and biotic systems.
Abiotic MNX t* DNX t* TNX t* CO2 t* Peak @3.1 min t* Peak at 2.2
min t* N2O t* NH4 t* MEDINA t*
Fe(II)/magnetite 17 500 35 750 33 2800 10 5300 90 2900 ND ND 17 3800 ND
Bioreduced Iron solids 41 200 19 250 9 600 5 2200 57 2200 ND ND 5 1900 ND
Sulfate Green Rust 15 0.5 21 0.5 6 0.5 NM -- NM*** -- NM*** -- 81 6 NM -- NM --
Biotic
S. algae BRY 5 100 35 100 ND 100 <5 100 60 100 ND NM NM ND
A. paludosum ND ND ND <1 480 97 360 ND NM NM NM G. metallireducens GS-15:
MOPS-Fed ND ND ND 42 3400 78 750 27 800 ND NM NM
MOPS-Unfed ND ND ND 11 3400 50 3500 10 3500 ND NM NM
FC medium-fed ND ND ND 12 3400 90 2000 ND ND NM NM
FC medium-unfed ND ND ND 27 3400 90 2000 ND ND NM NM
Summary of products recovered in each experiment. Data are reported as percent (%) of initial RDX added. *t=time of measurement (hours). Attempts to measure MEDINA used published methods (Hawari, et al. (2000); Oh et al. (2002). ND= Not detected. NM= Not measured. *** these peaks could not be detected if present because the background peak for the buffer would have masked any other peaks near these elution times.

Fe(0)-Based-Bioremediation of RDX-Contaminated Groundwater
Project CU1231 Page 1 Yearly Report
In an effort to learn more about the toxicity of the unknown metabolite(s), products
formed by A. paludosum and A. fimetarium were investigated for their relative toxicity to RDX.
This investigation was performed using a Microbics Microtox 500 Analyzer. The toxicity of
samples containing the “3.1 minute” metabolite (see Table 3) were compared to a mix of
metabolite and RDX to a positive and negative control. The samples used were taken from the
previous mineralization experiment in which A. paludosum and A. fimetarium were exposed to
approximately 2.7 mg/L RDX. Whereas there were initially six reactors in which bacteria were
added (three with A. paludosum, and three with A. fimentarium), only four (two of each
experimental condition) were still viable at the time of sampling. Thus the toxicities of the liquid
samples from these four reactors were compared to the toxicities of two control samples. The
positive (i.e., toxic response) control consisted of anaerobic medium amended with RDX and the
negative control contained the same anaerobic medium without RDX. The initial pH of all
samples was adjusted near circumneutral using 5N HCl. Table 4 describes the RDX-metabolized
samples tested.
Table 4. Microtox Sample Information
Sample Approximate pH RDX (mg/L) Metabolite % Peaks HPLC-RAD (3.1 minute peak)
Medium 6.8 0 0 Medium with RDX 6.8 3.64 0 A. Paludosum 7.1 0 (initial RDX 2.7 mg/L) 98 A. Paludosum (dupl.) 6.8 0 (initial RDX 2.7 mg/L) 97 A. Fimentarium 1 6.8 1.4 (initial RDX 2.9 mg/L) 50 A. Fimentarium (dupl.) 6.8 1.6 (initial RDX 2.8 mg/L) 45
The Microtox test determines the toxicity of a sample to a well-characterized,
bioluminescent, marine bacterium, Photobacterium phosphoreum. Prior to the assay, bacteria
were grown under optimal conditions as per the Microtox protocol, harvested, then lyophilized.

Fe(0)-Based-Bioremediation of RDX-Contaminated Groundwater
Project CU1231 Page 2 Yearly Report
Before starting a test, the bacteria are rehydrated using Microtox Reconstitution Solution. Once
hydrated, the bacteria are viable for approximately 5-8 hours.
The assay involves incubating the rehydrated bacteria with the test sample. The light
output of the bacteria exposed to the sample is compared to the light output of the negative and
positive controls. The principle of the test is that the toxicity of a sample is indirectly
proportional to the light production, that is, the more toxic the sample, the less light will be
produced.
A dose-response curve from the data collected can then be used to find the EC50 under a
specific exposure time and test temperature (which is always 15 oC for this model analyzer). The
EC50 is the effective concentration of a sample at which the light output is reduced by 50%.
Thus a higher EC50 value means a less toxic compound, and vice versa. The EC50 is often
recorded after the bacteria are exposed to the sample for 5 minutes and for 15 minutes.
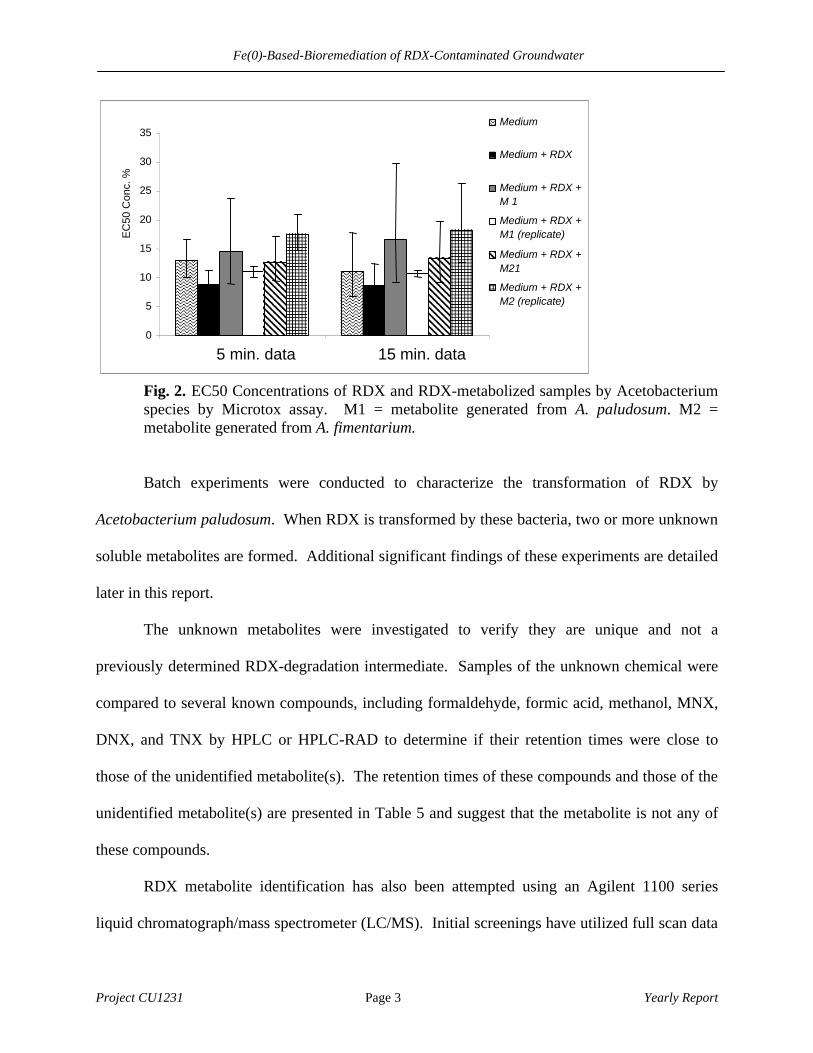
Microtox data for these samples revealed no significant statistical difference between
RDX and formed compounds, however there appeared to be a trend towards lower toxicity in
samples containing metabolized RDX. Further investigation will be required to verify this
potential trend. The results suggest that the formed RDX metabolite is not more toxic than
parent RDX. Figure 2 shows the estimated EC50 values for the performed assays. The error
bars shown indicate a 95% confidence range.
Fe(0)-Based-Bioremediation of RDX-Contaminated Groundwater
Project CU1231 Page 3 Yearly Report
Fig. 2. EC50 Concentrations of RDX and RDX-metabolized samples by Acetobacterium species by Microtox assay. M1 = metabolite generated from A. paludosum. M2 = metabolite generated from A. fimentarium.
Batch experiments were conducted to characterize the transformation of RDX by
Acetobacterium paludosum. When RDX is transformed by these bacteria, two or more unknown
soluble metabolites are formed. Additional significant findings of these experiments are detailed
later in this report.
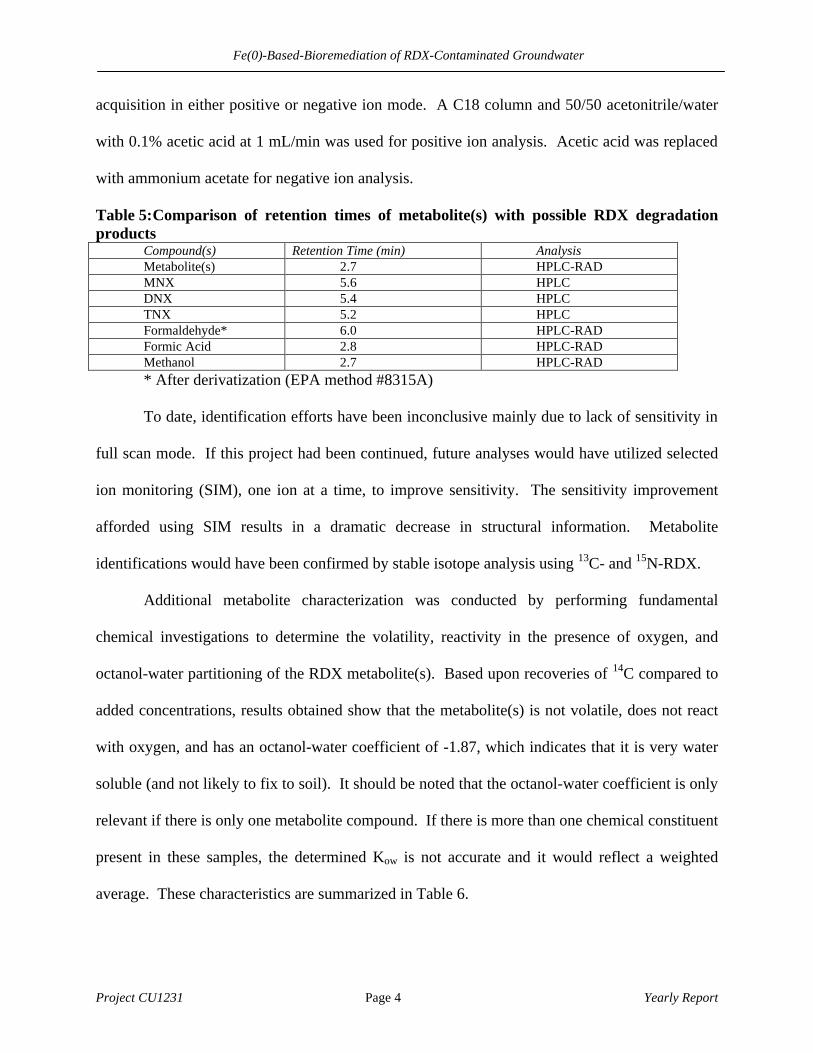
The unknown metabolites were investigated to verify they are unique and not a
previously determined RDX-degradation intermediate. Samples of the unknown chemical were
compared to several known compounds, including formaldehyde, formic acid, methanol, MNX,
DNX, and TNX by HPLC or HPLC-RAD to determine if their retention times were close to
those of the unidentified metabolite(s). The retention times of these compounds and those of the
unidentified metabolite(s) are presented in Table 5 and suggest that the metabolite is not any of
these compounds.
RDX metabolite identification has also been attempted using an Agilent 1100 series
liquid chromatograph/mass spectrometer (LC/MS). Initial screenings have utilized full scan data
0
5
10
15
20
25
30
35 E
C50
Con
c. %
Medium
Medium + RDX
Medium + RDX + M 1 Medium + RDX + M1 (replicate) Medium + RDX + M21 Medium + RDX + M2 (replicate)
5 min. data 15 min. data
Fe(0)-Based-Bioremediation of RDX-Contaminated Groundwater
Project CU1231 Page 4 Yearly Report
acquisition in either positive or negative ion mode. A C18 column and 50/50 acetonitrile/water
with 0.1% acetic acid at 1 mL/min was used for positive ion analysis. Acetic acid was replaced
with ammonium acetate for negative ion analysis.
Table 5: Comparison of retention times of metabolite(s) with possible RDX degradation products
Compound(s) Retention Time (min) Analysis Metabolite(s) 2.7 HPLC-RAD MNX 5.6 HPLC DNX 5.4 HPLC TNX 5.2 HPLC Formaldehyde* 6.0 HPLC-RAD Formic Acid 2.8 HPLC-RAD Methanol 2.7 HPLC-RAD * After derivatization (EPA method #8315A)
To date, identification efforts have been inconclusive mainly due to lack of sensitivity in
full scan mode. If this project had been continued, future analyses would have utilized selected
ion monitoring (SIM), one ion at a time, to improve sensitivity. The sensitivity improvement
afforded using SIM results in a dramatic decrease in structural information. Metabolite
identifications would have been confirmed by stable isotope analysis using 13C- and 15N-RDX.
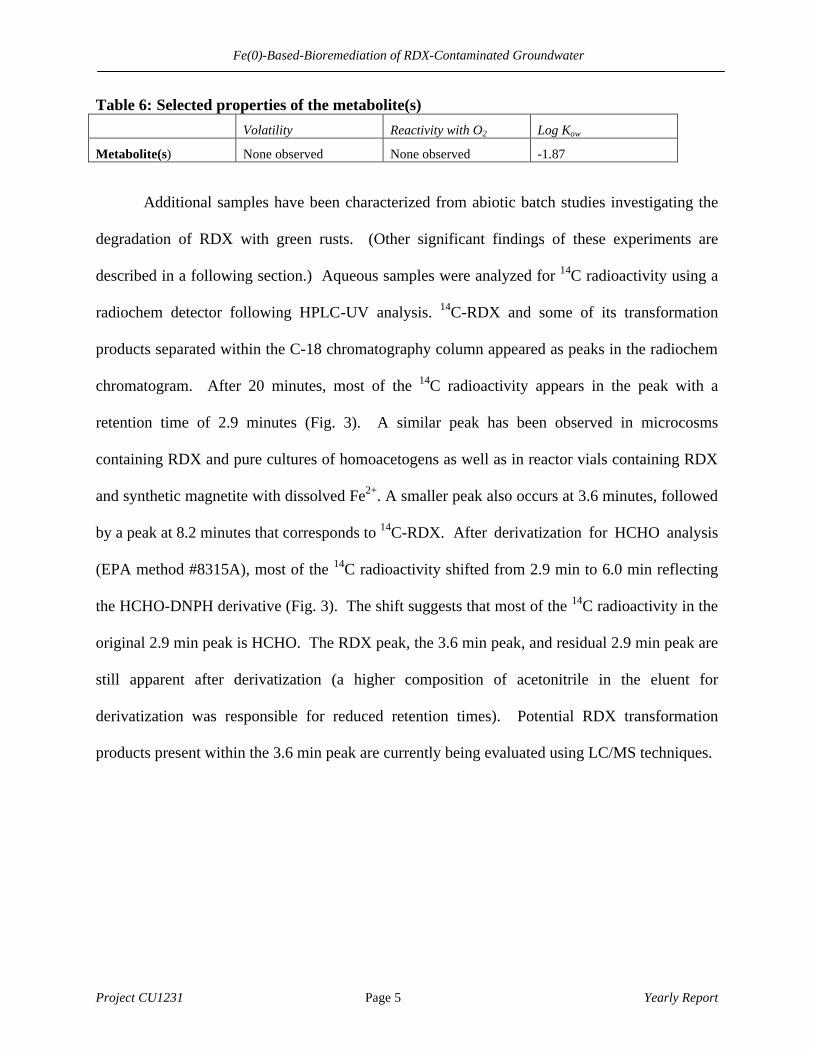
Additional metabolite characterization was conducted by performing fundamental
chemical investigations to determine the volatility, reactivity in the presence of oxygen, and
octanol-water partitioning of the RDX metabolite(s). Based upon recoveries of 14C compared to
added concentrations, results obtained show that the metabolite(s) is not volatile, does not react
with oxygen, and has an octanol-water coefficient of -1.87, which indicates that it is very water
soluble (and not likely to fix to soil). It should be noted that the octanol-water coefficient is only
relevant if there is only one metabolite compound. If there is more than one chemical constituent
present in these samples, the determined Kow is not accurate and it would reflect a weighted
average. These characteristics are summarized in Table 6.
Fe(0)-Based-Bioremediation of RDX-Contaminated Groundwater
Project CU1231 Page 5 Yearly Report
Table 6: Selected properties of the metabolite(s) Volatility Reactivity with O2 Log Kow
Metabolite(s) None observed None observed -1.87
Additional samples have been characterized from abiotic batch studies investigating the
degradation of RDX with green rusts. (Other significant findings of these experiments are
described in a following section.) Aqueous samples were analyzed for 14C radioactivity using a
radiochem detector following HPLC-UV analysis. 14C-RDX and some of its transformation
products separated within the C-18 chromatography column appeared as peaks in the radiochem
chromatogram. After 20 minutes, most of the 14C radioactivity appears in the peak with a
retention time of 2.9 minutes (Fig. 3). A similar peak has been observed in microcosms
containing RDX and pure cultures of homoacetogens as well as in reactor vials containing RDX
and synthetic magnetite with dissolved Fe2+. A smaller peak also occurs at 3.6 minutes, followed
by a peak at 8.2 minutes that corresponds to 14C-RDX. After derivatization for HCHO analysis
(EPA method #8315A), most of the 14C radioactivity shifted from 2.9 min to 6.0 min reflecting
the HCHO-DNPH derivative (Fig. 3). The shift suggests that most of the 14C radioactivity in the
original 2.9 min peak is HCHO. The RDX peak, the 3.6 min peak, and residual 2.9 min peak are
still apparent after derivatization (a higher composition of acetonitrile in the eluent for
derivatization was responsible for reduced retention times). Potential RDX transformation
products present within the 3.6 min peak are currently being evaluated using LC/MS techniques.
Fe(0)-Based-Bioremediation of RDX-Contaminated Groundwater
Project CU1231 Page 6 Yearly Report
14C
Rad
ioac
tivi
ty
1086420Retention Time (min)
2.9 min peak
3.6 min peakRDX
HCHO-DNPHHCHO peak shift
RDX
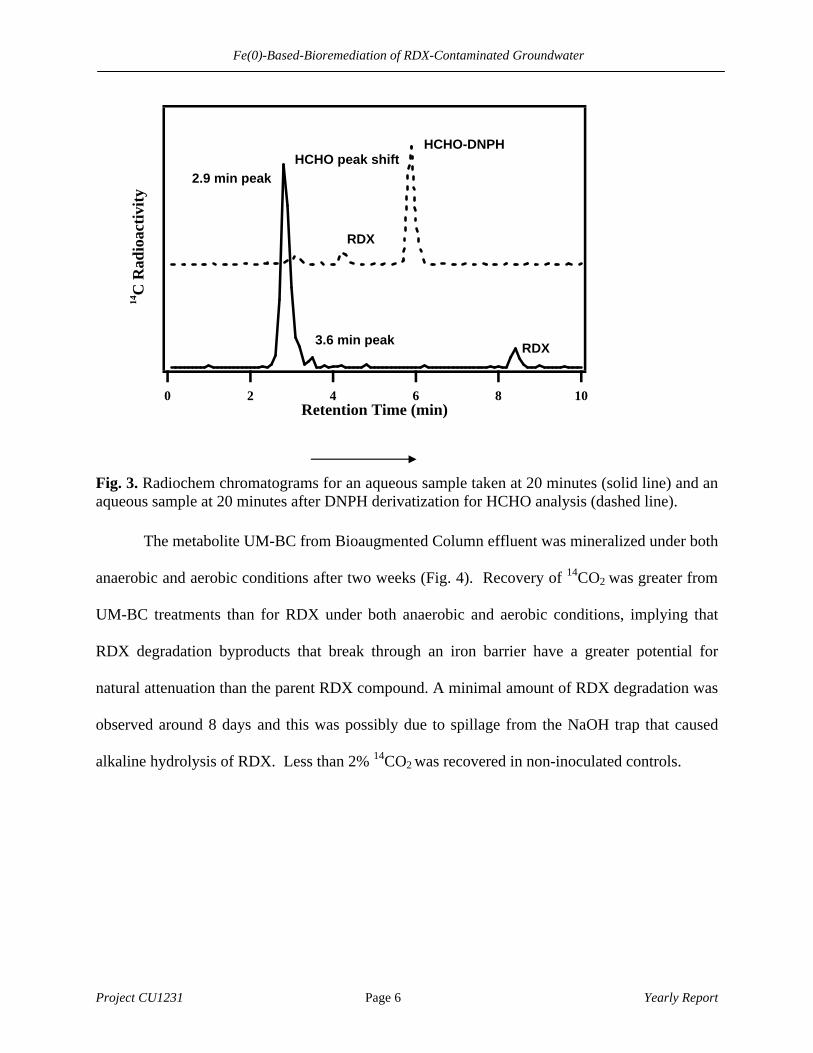
Fig. 3. Radiochem chromatograms for an aqueous sample taken at 20 minutes (solid line) and an aqueous sample at 20 minutes after DNPH derivatization for HCHO analysis (dashed line).
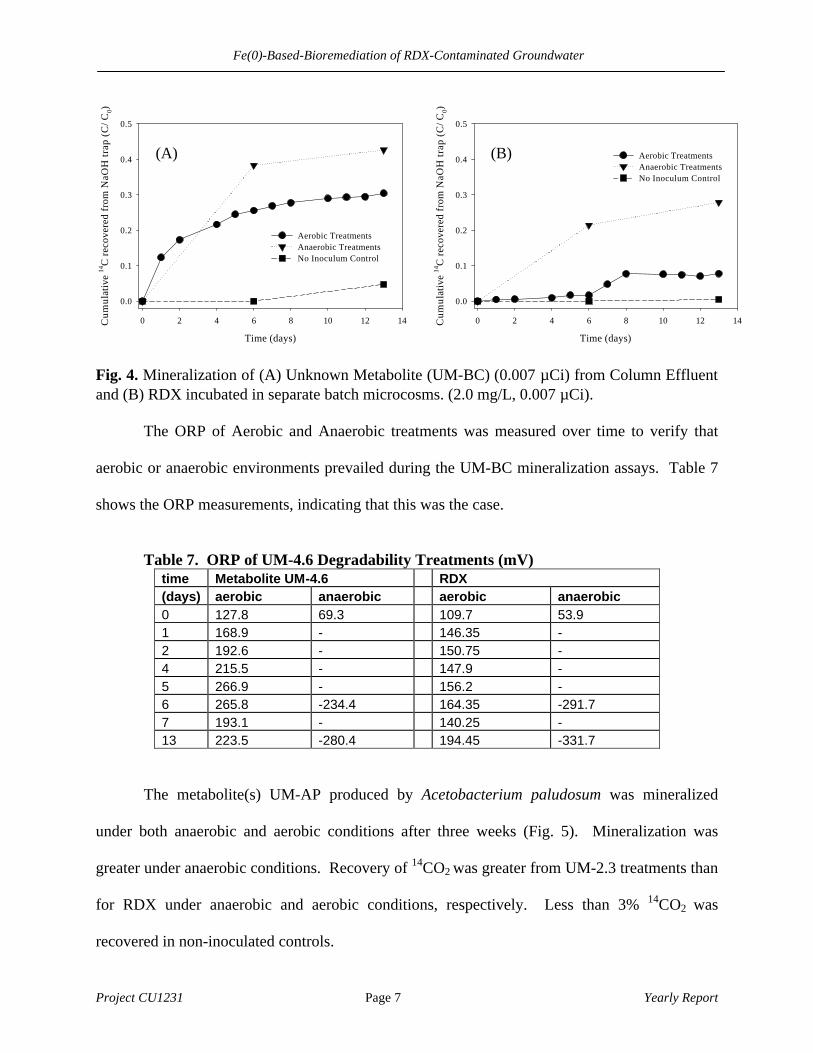
The metabolite UM-BC from Bioaugmented Column effluent was mineralized under both
anaerobic and aerobic conditions after two weeks (Fig. 4). Recovery of 14CO2 was greater from
UM-BC treatments than for RDX under both anaerobic and aerobic conditions, implying that
RDX degradation byproducts that break through an iron barrier have a greater potential for
natural attenuation than the parent RDX compound. A minimal amount of RDX degradation was
observed around 8 days and this was possibly due to spillage from the NaOH trap that caused
alkaline hydrolysis of RDX. Less than 2% 14CO2 was recovered in non-inoculated controls.
Fe(0)-Based-Bioremediation of RDX-Contaminated Groundwater
Project CU1231 Page 7 Yearly Report
Fig. 4. Mineralization of (A) Unknown Metabolite (UM-BC) (0.007 µCi) from Column Effluent and (B) RDX incubated in separate batch microcosms. (2.0 mg/L, 0.007 µCi).
The ORP of Aerobic and Anaerobic treatments was measured over time to verify that
aerobic or anaerobic environments prevailed during the UM-BC mineralization assays. Table 7
shows the ORP measurements, indicating that this was the case.
Table 7. ORP of UM-4.6 Degradability Treatments (mV)
time Metabolite UM-4.6 RDX (days) aerobic anaerobic aerobic anaerobic 0 127.8 69.3 109.7 53.9 1 168.9 - 146.35 - 2 192.6 - 150.75 - 4 215.5 - 147.9 - 5 266.9 - 156.2 - 6 265.8 -234.4 164.35 -291.7 7 193.1 - 140.25 - 13 223.5 -280.4 194.45 -331.7
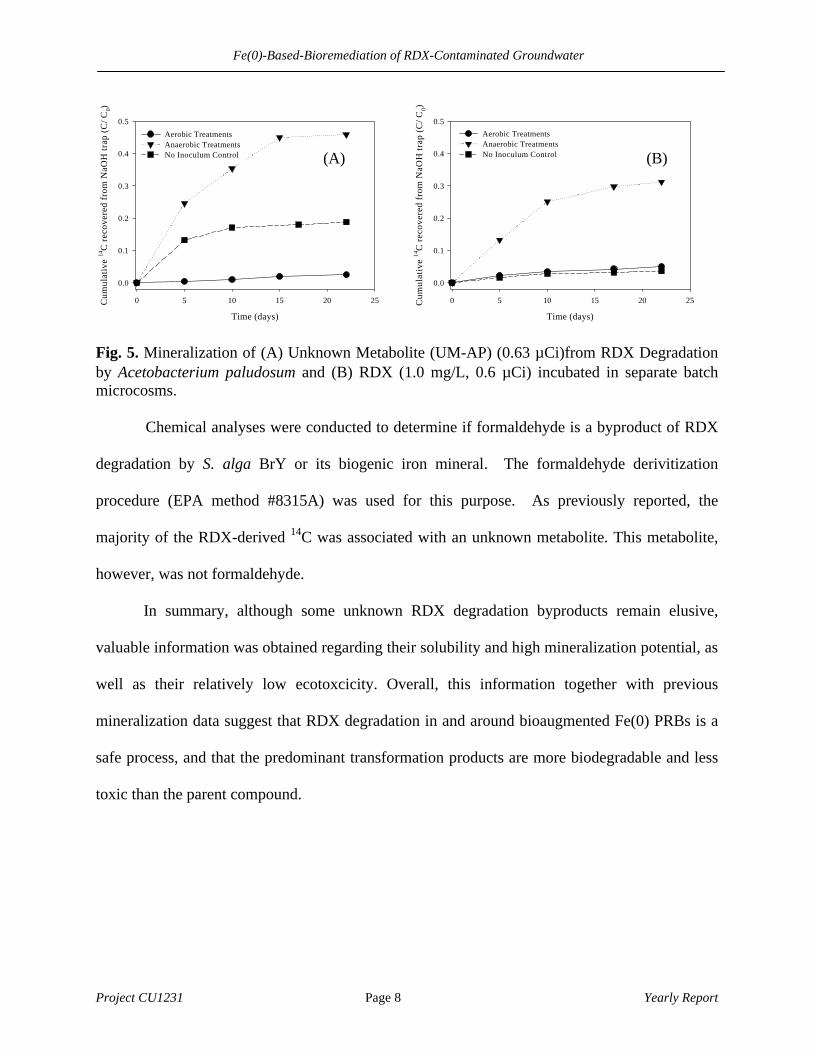
The metabolite(s) UM-AP produced by Acetobacterium paludosum was mineralized
under both anaerobic and aerobic conditions after three weeks (Fig. 5). Mineralization was
greater under anaerobic conditions. Recovery of 14CO2 was greater from UM-2.3 treatments than
for RDX under anaerobic and aerobic conditions, respectively. Less than 3% 14CO2 was
recovered in non-inoculated controls.
Time (days)
0 2 4 6 8 10 12 14Cum
ulat
ive
14C
rec
over
ed f
rom
NaO
H tr
ap (
C/C
0)
0.0
0.1
0.2
0.3
0.4
0.5
Aerobic TreatmentsAnaerobic TreatmentsNo Inoculum Control
Time (days)
0 2 4 6 8 10 12 14Cum
ulat
ive
14C
rec
over
ed f
rom
NaO
H tr
ap (
C/C
0)
0.0
0.1
0.2
0.3
0.4
0.5
Aerobic TreatmentsAnaerobic TreatmentsNo Inoculum Control
(A) (B)
Fe(0)-Based-Bioremediation of RDX-Contaminated Groundwater
Project CU1231 Page 8 Yearly Report
Fig. 5. Mineralization of (A) Unknown Metabolite (UM-AP) (0.63 µCi)from RDX Degradation by Acetobacterium paludosum and (B) RDX (1.0 mg/L, 0.6 µCi) incubated in separate batch microcosms.
Chemical analyses were conducted to determine if formaldehyde is a byproduct of RDX
degradation by S. alga BrY or its biogenic iron mineral. The formaldehyde derivitization
procedure (EPA method #8315A) was used for this purpose. As previously reported, the
majority of the RDX-derived 14C was associated with an unknown metabolite. This metabolite,
however, was not formaldehyde.
In summary, although some unknown RDX degradation byproducts remain elusive,
valuable information was obtained regarding their solubility and high mineralization potential, as
well as their relatively low ecotoxcicity. Overall, this information together with previous
mineralization data suggest that RDX degradation in and around bioaugmented Fe(0) PRBs is a
safe process, and that the predominant transformation products are more biodegradable and less
toxic than the parent compound.
Time (days)
0 5 10 15 20 25Cum
ulat
ive
14C
rec
over
ed f
rom
NaO
H tr
ap (
C/C
0)
0.0
0.1
0.2
0.3
0.4
0.5
Aerobic TreatmentsAnaerobic TreatmentsNo Inoculum Control
Time (days)
0 5 10 15 20 25Cum
ulat
ive
14C
rec
over
ed f
rom
NaO
H tr
ap (
C/C
0)
0.0
0.1
0.2
0.3
0.4
0.5
Aerobic TreatmentsAnaerobic TreatmentsNo Inoculum Control (A) (B)
Fe(0)-Based-Bioremediation of RDX-Contaminated Groundwater
Project CU1231 Page 9 Yearly Report
Column Studies
Background
Flow-through columns were started in November 2000 to evaluate the efficacy of
permeable reactive iron barriers to treat groundwater contamination by RDX. We also used
these columns to evaluate the overall effect of microbial processes (e.g., growth and mineral
dissolution/precipitation) on the permeability and efficiency of Fe(0) barriers.
Materials and Methods
Four columns (30-cm long, 2.5-cm ID) equipped with lateral sampling ports were packed
with a 5-cm layer of soil (Iowa Army Ammunition Plant, Middletown, IA) followed by an 18-cm
layer of Master Builder Fe(0) filings (representing a reactive barrier) and a 7-cm sand layer
(Fig. 6). One of the columns was poisoned with HgCl2 (200 mg/L), sodium azide (200 mg/L),
and a biocide (Kathon, 1 mL/L) to limit biological growth and investigate degradation by Fe(0)
alone. The second (non-sterile) column was used to determine if soil bacteria colonize the Fe(0)
layer, presumably to feed on cathodic H2 produced by anaerobic Fe(0) corrosion. This column
also serves as a baseline to evaluate the benefits of bioaugmentation. The third column was
inoculated with municipal anaerobic sludge (10 mL of stock (6.6 g-VSS/L) added at each port) to
enhance reductive treatment of RDX. The fourth column was prepared with inert glass beads
instead of Fe(0) to control for the effect of indigenous microorganisms on RDX degradation.
RDX (14C-labeled) has been fed continuously at 17 mg/L (10 µCi/L) at 2.3 mL/hr (about 0.5
ft/day superficial velocity) with bicarbonate-buffered synthetic groundwater (von Gunten and
Zobrist, 1993) using a peristaltic pump.

Fe(0)-Based-Bioremediation of RDX-Contaminated Groundwater
Project CU1231 Page 10 Yearly Report
High performance liquid chromatography (HPLC) analysis of RDX was performed using
a Hewlett Packard 1100 Series HPLC equipped with a 250 x 4.6 mm SupelcosilTM LC-18
column. The mobile phase consisted of deionized water and methanol (4:6, v/v) at a flow rate of
1.0 mL/min. UV detection was at 240 nm. [14C]-RDX and its [14C]-metabolites were analyzed
by HPLC using a radioactivity detector (Radiomatic, Series A-500, Packard Instrument Co.,
Downers Grove, IL). Bromide was analyzed by ion chromatograph (IC) using a DIONEX AS-
14 column where separation was achieved by an eluent of carbonate (370 mg/L) and bicarbonate
(84 mg/L) at a flow rate of 1.5 mL/ min.
Fig. 6. Flow-through columns used to simulate permeable reactive iron barriers.
Results and Discussion
These four columns continue to be maintained and operated with an influent feed solution
of approximately 15 mg/L RDX. Previous results have suggested the potential for complete
S a n d
30 cm
Waste Bottle
Medium + RDX
Sand
Iron or Glass-bead
Soil
N2/CO2
Gas cylinder
Peristaltic pump
Fe(0)-Based-Bioremediation of RDX-Contaminated Groundwater
Project CU1231 Page 11 Yearly Report
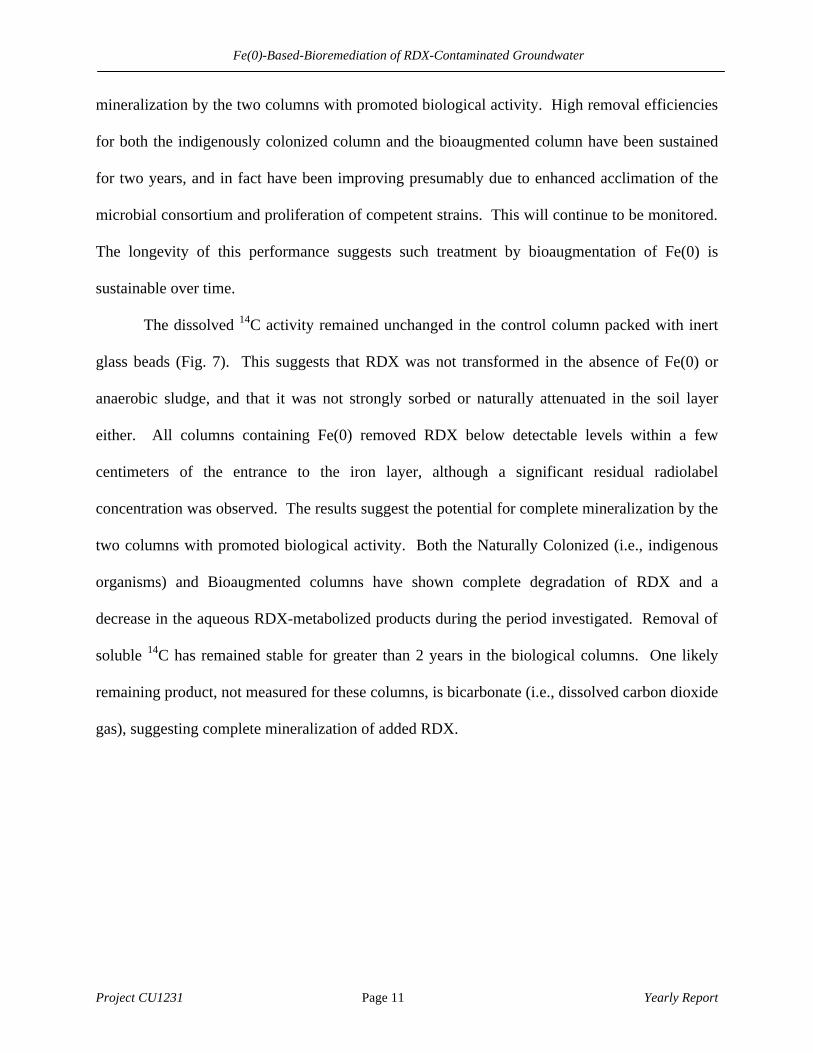
mineralization by the two columns with promoted biological activity. High removal efficiencies
for both the indigenously colonized column and the bioaugmented column have been sustained
for two years, and in fact have been improving presumably due to enhanced acclimation of the
microbial consortium and proliferation of competent strains. This will continue to be monitored.
The longevity of this performance suggests such treatment by bioaugmentation of Fe(0) is
sustainable over time.
The dissolved 14C activity remained unchanged in the control column packed with inert
glass beads (Fig. 7). This suggests that RDX was not transformed in the absence of Fe(0) or
anaerobic sludge, and that it was not strongly sorbed or naturally attenuated in the soil layer
either. All columns containing Fe(0) removed RDX below detectable levels within a few
centimeters of the entrance to the iron layer, although a significant residual radiolabel
concentration was observed. The results suggest the potential for complete mineralization by the
two columns with promoted biological activity. Both the Naturally Colonized (i.e., indigenous
organisms) and Bioaugmented columns have shown complete degradation of RDX and a
decrease in the aqueous RDX-metabolized products during the period investigated. Removal of
soluble 14C has remained stable for greater than 2 years in the biological columns. One likely
remaining product, not measured for these columns, is bicarbonate (i.e., dissolved carbon dioxide
gas), suggesting complete mineralization of added RDX.
Fe(0)-Based-Bioremediation of RDX-Contaminated Groundwater
Project CU1231 Page 12 Yearly Report
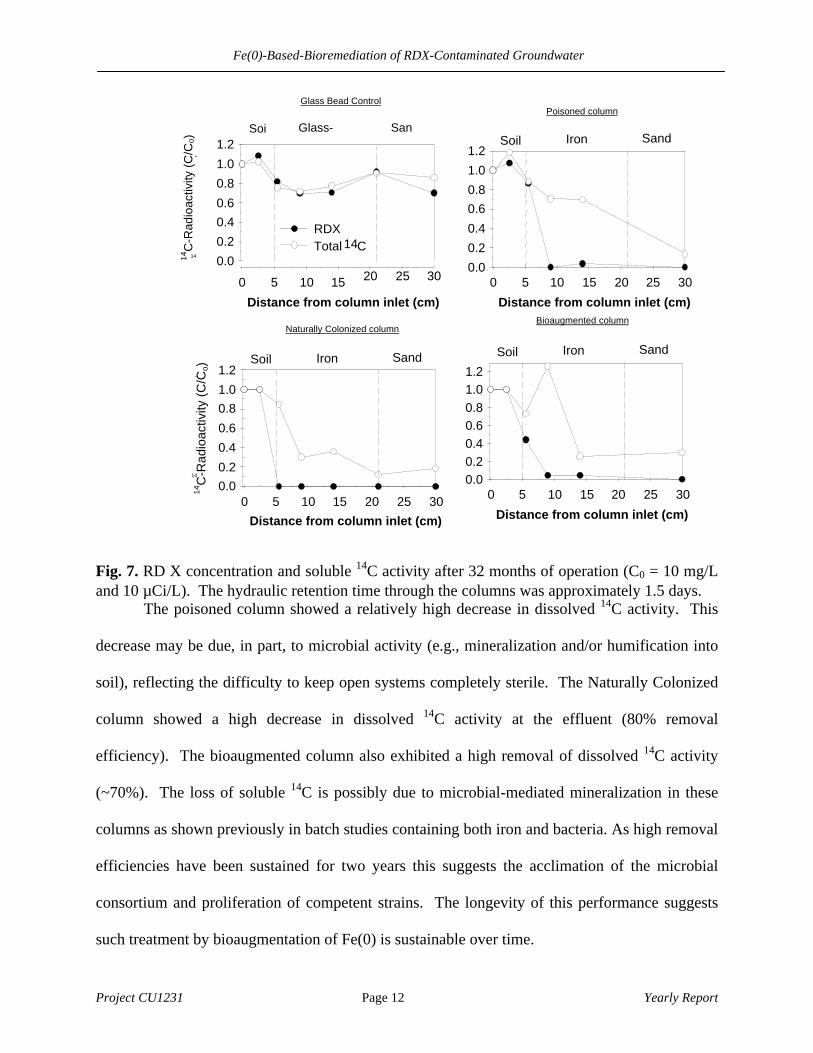
Fig. 7. RD X concentration and soluble 14C activity after 32 months of operation (C0 = 10 mg/L and 10 µCi/L). The hydraulic retention time through the columns was approximately 1.5 days.
The poisoned column showed a relatively high decrease in dissolved 14C activity. This
decrease may be due, in part, to microbial activity (e.g., mineralization and/or humification into
soil), reflecting the difficulty to keep open systems completely sterile. The Naturally Colonized
column showed a high decrease in dissolved 14C activity at the effluent (80% removal
efficiency). The bioaugmented column also exhibited a high removal of dissolved 14C activity
(~70%). The loss of soluble 14C is possibly due to microbial-mediated mineralization in these
columns as shown previously in batch studies containing both iron and bacteria. As high removal
efficiencies have been sustained for two years this suggests the acclimation of the microbial
consortium and proliferation of competent strains. The longevity of this performance suggests
such treatment by bioaugmentation of Fe(0) is sustainable over time.
Soil Iron Sand Poisoned column
Distance from column inlet (cm) 0 5 10 15 20 25 30
0.0 0.2 0.4 0.6 0.8 1.0 1.2
Distance from column inlet (cm) 0 5 10 15 20 25 30
0.0 0.2 0.4 0.6 0.8 1.0 1.2 Soil Iron Sand
Naturally Colonized column Distance from column inlet (cm)
0 5 10 15 20 25 30 0.0 0.2 0.4 0.6 0.8 1.0 1.2
RDX Total 14 C
Soi
Glass-
San
Distance from column inlet (cm) 0 5 10 15 20 25 30
0.0 0.2 0.4 0.6 0.8 1.0 1.2
Soil Iron Sand
Bioaugmented column
Glass Bead Control
14
14C
-Rad
ioac
tivity
(C
/Co)
0
14 14C
-Rad
ioac
tivity
(C
/Co)
0

Fe(0)-Based-Bioremediation of RDX-Contaminated Groundwater
Project CU1231 Page 13 Yearly Report
The hydraulic characteristics of the columns were determined from bromide tracer
studies (NaBr). Such tracer studies will provide a baseline for future determination of changes in
permeability in different columns. A bromide (Br-) solution (50 mg Br-/L) was continuously fed
through packed columns using a peristaltic pump. Effluent samples were collected every hour
with an auto sampler. Effluent bromide concentrations were monitored by ion chromatography
until they reached influent levels. Bromide breakthrough curves were used to calculate the
effective porosity (ηe), dispersion coefficient (D) and retardation factors (Rf) by fitting the
breakthrough data to the 1-D advection-dispersion equation (Domenico and Schwartz, 1998):
+
+
−
=
tf
DR2
teA?
QxR
erfc D
xeA?
Q
exp t
fDR2
teA?
QxR
erfc 2
Co Cff
(Eq.1)
Where C is the effluent concentration, Co is the influent concentration, x is the column length, t
is the elapsed time, Q is the flow rate, A is the cross sectional area, and erfc is the
complementary error function.
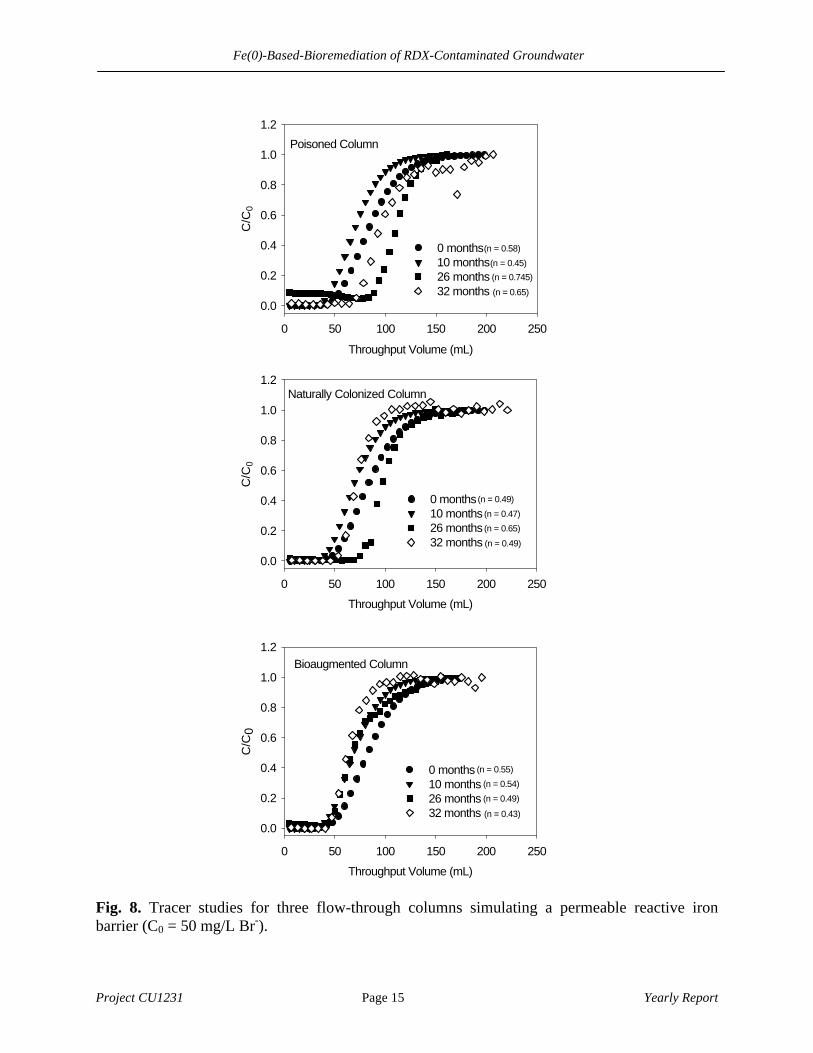
The tracer curves clearly showed that the interconnected pore volume (and the associated
effective porosity) has experience some fluctuation over the 32-month operation of these
columns (Fig. 8). These changes do not necessarily reflect changes in total porosity since other
processes such as gas production and bubble formation could have a significant impact on
hydraulic properties. Shifts in the breakthrough curves towards the left indicate that the
interconnected pore volume (which corresponds to C/C0 = 0.5) has decreased, this is possibly
due to oxide deposition, gas bubbles (e.g., H2) and/or microbial growth. Conversely, a shift to
the right corresponds to a porosity increase possibly due to iron dissolution or gas bubbles
consumption. The effective porosity has decreased only a small amount in the bioaugmented
Fe(0)-Based-Bioremediation of RDX-Contaminated Groundwater
Project CU1231 Page 14 Yearly Report
column and shows no change in the naturally colonized column after 32 months operation. No
problems with clogging have ever been observed with the columns. In combination with the
favorable RDX degradation observed over time in biologically active columns, these results
suggest sustainability of this bioaugmented iron scheme.
Fe(0)-Based-Bioremediation of RDX-Contaminated Groundwater
Project CU1231 Page 15 Yearly Report
Fig. 8. Tracer studies for three flow-through columns simulating a permeable reactive iron barrier (C0 = 50 mg/L Br-).
Throughput Volume (mL)
0 50 100 150 200 250
C/C
0
0.0
0.2
0.4
0.6
0.8
1.0
1.2
0 months10 months26 months32 months (n = 0.43)
Bioaugmented Column
(n = 0.55)
(n = 0.54)
(n = 0.49)
Throughput Volume (mL)
0 50 100 150 200 250
C/C
0
0.0
0.2
0.4
0.6
0.8
1.0
1.2
0 months10 months26 months32 months (n = 0.49)
Naturally Colonized Column
(n = 0.49)
(n = 0.47)
(n = 0.65)
Throughput Volume (mL)
0 50 100 150 200 250
C/C
0
0.0
0.2
0.4
0.6
0.8
1.0
1.2
0 months10 months26 months32 months (n = 0.65)
Poisoned Column
(n = 0.58)
(n = 0.45)
(n = 0.745)
Fe(0)-Based-Bioremediation of RDX-Contaminated Groundwater
Project CU1231 Page 16 Yearly Report
Characterization of “Aged” Fe(0) Column Bioaugmented with Iron Reducers
Background
In order to determine if dissimilatory iron-reducing bacteria (DIRB) enhance barrier
reactivity by reductive dissolution of Fe(III) oxides or by formation of reactive oxides, we
inoculated two additional iron columns with DIRB. These columns were packed with “aged”
iron obtained from columns that had been exposed to TCE, Cr(VI), sulfate, and nitrate mixtures
for 1 year (Gandhi et al, 2002). This iron was used to mimic iron that has been aged in a reactive
barrier over time, which could be amenable for reactivation by DIRB.
Materials and Methods
Regarding this additional column experiment, three columns (30-cm long, 2.5-cm ID)
equipped with lateral sampling ports were packed with a 5-cm layer of soil followed by an 18-cm
layer of the aged iron previously described, and a 7-cm sand layer as described in Fig. 5.
Uncontaminated soil was obtained from the field in Iowa City, IA. One of the columns was used
to determine if soil bacteria colonize the Fe(0) layer, presumably to feed on cathodic H2
produced by anaerobic Fe corrosion. This column also serves as a baseline to evaluate the
benefits of bioaugmentation. The second column was inoculated with the iron-reducing
bacterium Shewanella algae BRY (10 ml of stock (52.6 mg protein/L) added at each port). The
third column was inoculated with the iron-reducing bacterium Geobacter metallireducens GS-15
(10 ml of stock (36 mg protein/L) added at each port). While S. algae can grow autotrophically
on hydrogen, G. metallireducens can only grow under heterotrophic conditions (Lovley, et al.,
1993).
These strains were inoculated to determine if DIRB enhance barrier reactivity by
Fe(0)-Based-Bioremediation of RDX-Contaminated Groundwater
Project CU1231 Page 17 Yearly Report
reductive dissolution of Fe(III) oxides or by formation of reactive oxides. RDX (14C-labeled)
has been fed continuously at 18 mg/L (10 µCi/L) at 2.3 mL/hr (about 0.5 ft/day superficial
velocity) with bicarbonate-buffered synthetic groundwater (von Gunten and Zobrist, 1993) using
peristaltic pump.
Results and Discussion
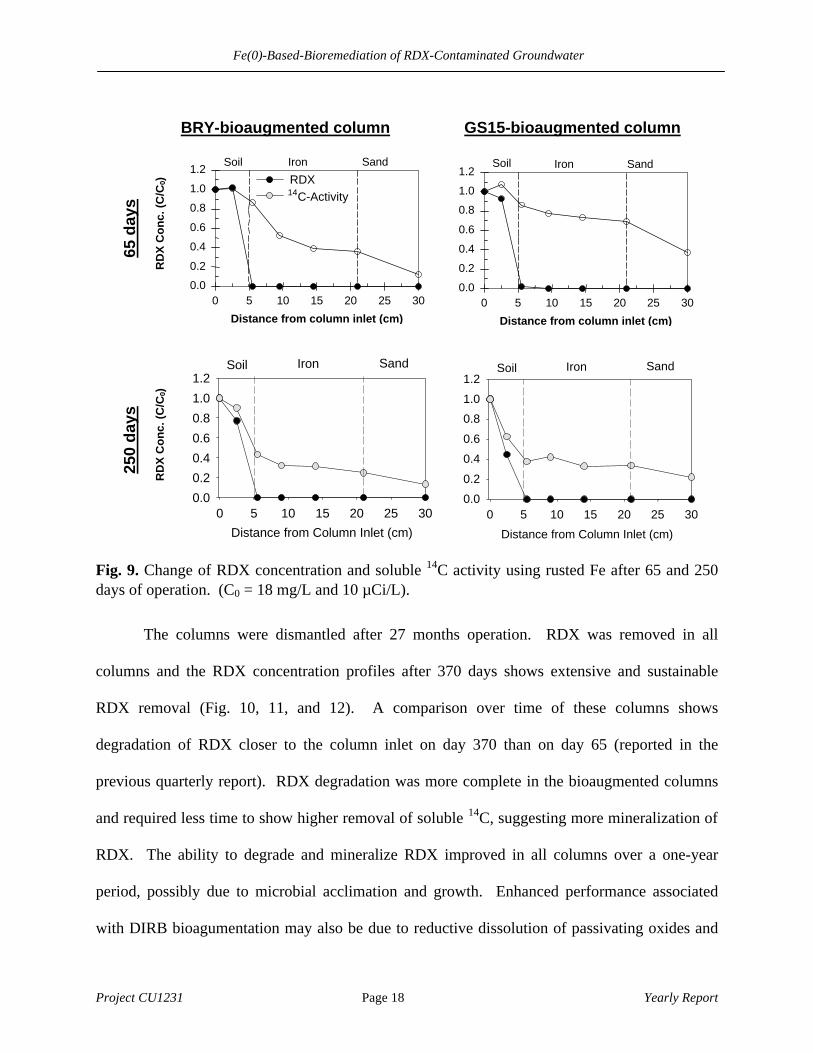
We have monitored RDX removal along the length of the columns by sampling the side
ports and analyzing the samples by HPLC. RDX concentration profiles for 65 and 250 days
showed extensive and sustainable RDX removal in all columns with aged iron filings. The
column colonized by indigenous bacteria showed a decrease in dissolved 14C activity along its
length (Fig. 9). The column inoculated with Shewanella algae BRY exhibited a higher removal
of dissolved 14C activity than the one bioaugmented with Geobacter metallireducens GS-15.
This suggests that Shewanella algae BRY might be able to enhance barrier reactivity faster than
Geobacter metallireducens GS-15, although it is unclear if this is due to higher reductive
dissolution of passivating oxides or to their transformation to more reactive forms (e.g.,
magnetite, green rust, and other forms of surface-bound Fe(II) (Gerlach, et al., 2000)). Whether
BRY participates directly in RDX degradation (perhaps using it as a nitrogen source) will be
addressed later in this report.
Fe(0)-Based-Bioremediation of RDX-Contaminated Groundwater
Project CU1231 Page 18 Yearly Report
Fig. 9. Change of RDX concentration and soluble 14C activity using rusted Fe after 65 and 250 days of operation. (C0 = 18 mg/L and 10 µCi/L).
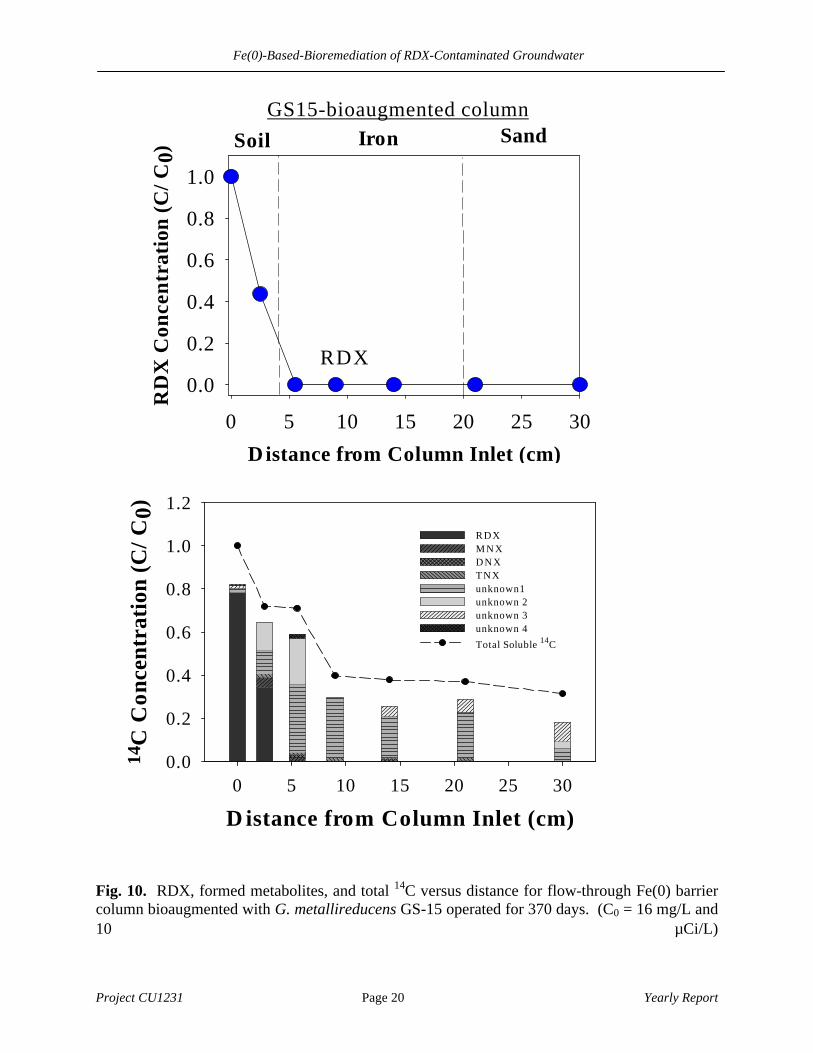
The columns were dismantled after 27 months operation. RDX was removed in all
columns and the RDX concentration profiles after 370 days shows extensive and sustainable
RDX removal (Fig. 10, 11, and 12). A comparison over time of these columns shows
degradation of RDX closer to the column inlet on day 370 than on day 65 (reported in the
previous quarterly report). RDX degradation was more complete in the bioaugmented columns
and required less time to show higher removal of soluble 14C, suggesting more mineralization of
RDX. The ability to degrade and mineralize RDX improved in all columns over a one-year
period, possibly due to microbial acclimation and growth. Enhanced performance associated
with DIRB bioagumentation may also be due to reductive dissolution of passivating oxides and
RD
X C
on
c. (
C/C
0)
Distance from column inlet (cm) 0 5 10 15 20 25 30
0.0 0.2 0.4 0.6 0.8 1.0 1.2 Soil Iron Sand
Distance from column inlet (cm) 0 5 10 15 20 25 30
0.0 0.2 0.4 0.6 0.8 1.0 1.2 Soil Iron Sand
BRY-bioaugmented column GS15-bioaugmented column
RD
X C
on
c. (
C/C
0)
Distance from Column Inlet (cm)
0 5 10 15 20 25 300.0
0.2
0.4
0.6
0.8
1.0
1.2Soil Iron Sand
RDX 14 C-Activity
Distance from Column Inlet (cm) 0 5 10 15 20 25 30
0.0 0.2 0.4 0.6 0.8 1.0 1.2
Soil Iron Sand
65 d
ays
250
day
s
Fe(0)-Based-Bioremediation of RDX-Contaminated Groundwater
Project CU1231 Page 19 Yearly Report
their transformation to more reactive minerals (e.g., green rust, maghemite, siderite, and other
forms of surface-bound Fe(II)).
Four unknown 14C metabolites were identified in these samples. Unknown 1 likely
contains multiple compounds as LC/MS results suggest a mass consistent with MDNA (m/z =
181) was present in Unknown 1, but not in sufficient quantity to represent all 14C recovered.
Unknown 2 was tentatively identified as formaldehyde, based on a derivatization procedure
(EPA Method 8315A).
Fe(0)-Based-Bioremediation of RDX-Contaminated Groundwater
Project CU1231 Page 20 Yearly Report
Fig. 10. RDX, formed metabolites, and total 14C versus distance for flow-through Fe(0) barrier column bioaugmented with G. metallireducens GS-15 operated for 370 days. (C0 = 16 mg/L and 10 µCi/L)
Distance from Column Inlet (cm)
0 5 10 15 20 25 30
RD
X C
once
ntra
tion
(C/C
0)
0.0
0.2
0.4
0.6
0.8
1.0
Soil Iron SandGS15-bioaugmented column
RDX
D istance from Column Inlet (cm)0 5 10 15 20 25 30
14C
Con
cent
rati
on (C
/C0)
0.0
0.2
0.4
0.6
0.8
1.0
1.2
RDXM N XD N XTNXunknown1unknown 2unknown 3unknown 4
Total Soluble 14C
Fe(0)-Based-Bioremediation of RDX-Contaminated Groundwater
Project CU1231 Page 21 Yearly Report
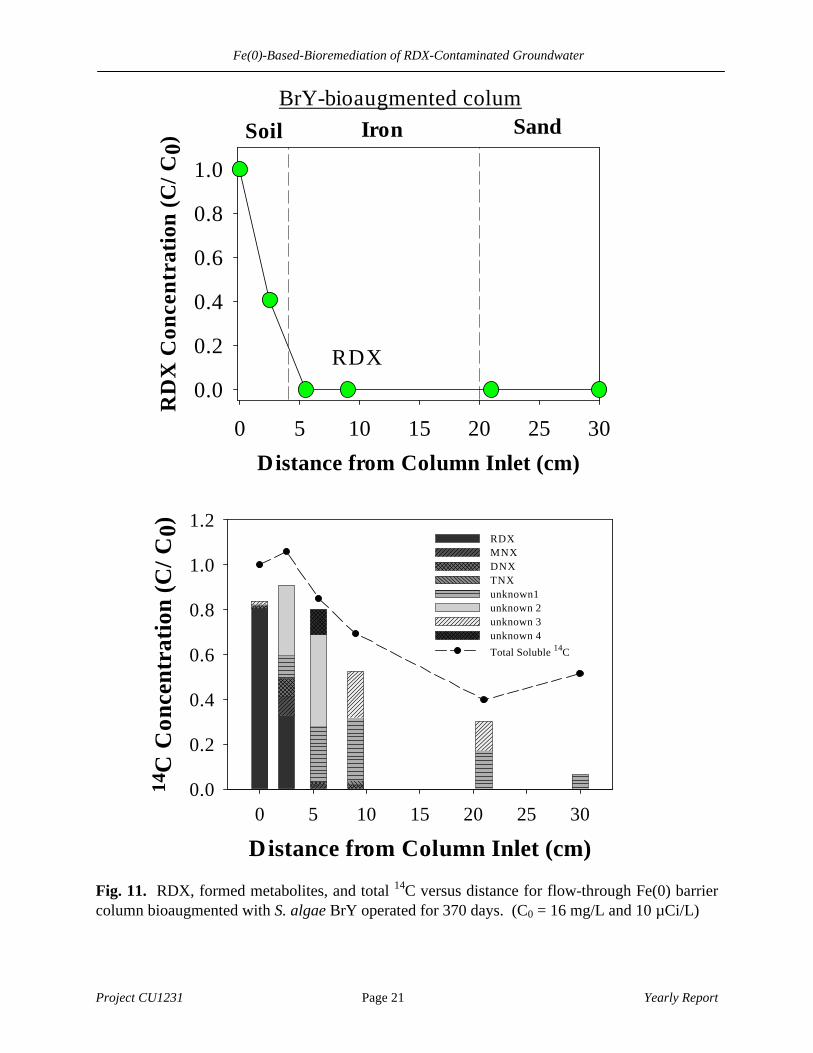
Fig. 11. RDX, formed metabolites, and total 14C versus distance for flow-through Fe(0) barrier column bioaugmented with S. algae BrY operated for 370 days. (C0 = 16 mg/L and 10 µCi/L)
Distance from Column Inlet (cm)
0 5 10 15 20 25 30
RD
X C
once
ntra
tion
(C/C
0)
0.0
0.2
0.4
0.6
0.8
1.0
Soil Iron SandBrY-bioaugmented colum
RDX
Distance from Column Inlet (cm)0 5 10 15 20 25 30
14C
Con
cent
rati
on (C
/C0)
0.0
0.2
0.4
0.6
0.8
1.0
1.2RDXMNXDNXTNXunknown1unknown 2unknown 3unknown 4
Total Soluble 14C
Fe(0)-Based-Bioremediation of RDX-Contaminated Groundwater
Project CU1231 Page 22 Yearly Report
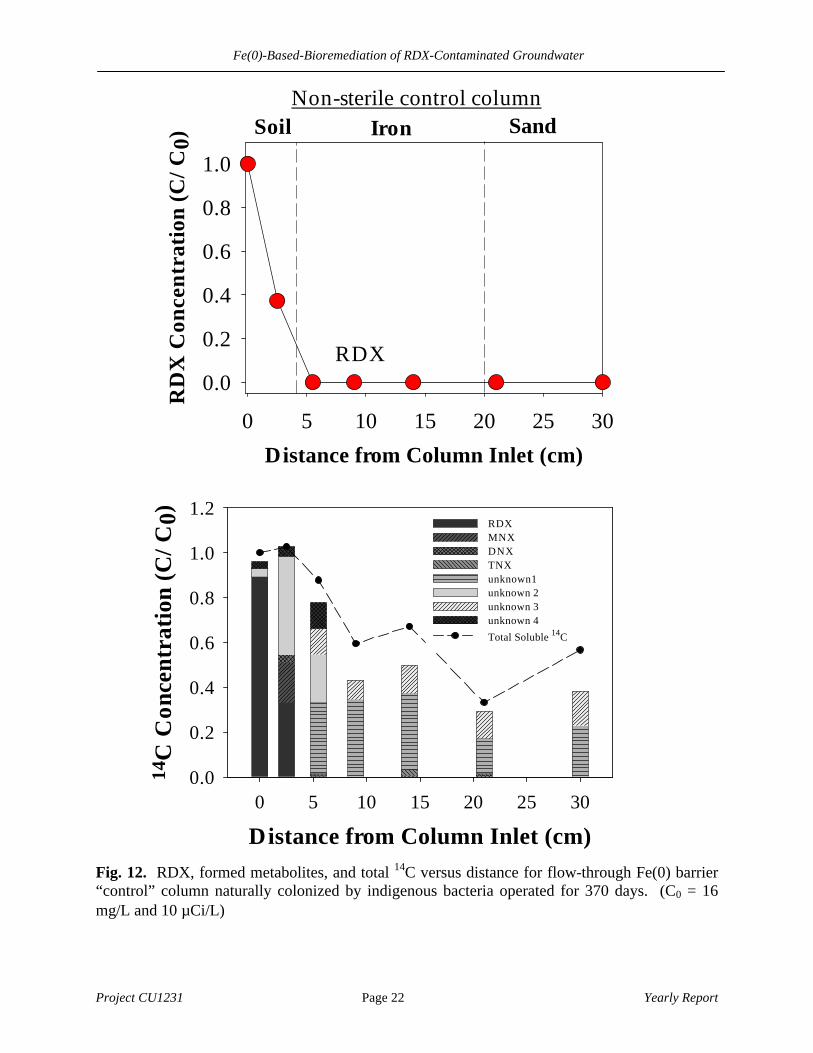
Fig. 12. RDX, formed metabolites, and total 14C versus distance for flow-through Fe(0) barrier “control” column naturally colonized by indigenous bacteria operated for 370 days. (C0 = 16 mg/L and 10 µCi/L)
Distance from Column Inlet (cm)
0 5 10 15 20 25 30
RD
X C
once
ntra
tion
(C/C
0)
0.0
0.2
0.4
0.6
0.8
1.0
Soil Iron SandNon-sterile control column
RDX
Distance from Column Inlet (cm)0 5 10 15 20 25 30
14C
Con
cent
rati
on (C
/C0)
0.0
0.2
0.4
0.6
0.8
1.0
1.2RDXMNXDNXTNXunknown1unknown 2unknown 3unknown 4
Total Soluble 14C
Fe(0)-Based-Bioremediation of RDX-Contaminated Groundwater
Project CU1231 Page 23 Yearly Report
It is currently unclear the roles that Shewanella algae BRY and Geobacter
metallireducens GS-15 have played in these columns, if any, but it is possible that these bacteria
contributed to some degradation of RDX, reductive dissolution of oxides that would passivate
the iron, and transformation of iron species to more reactive forms (e.g., magnetite, green rust,
and other forms of surface-bound Fe(II) (Gerlach, et al., 2000). Production of siderite and
magnetite/maghemite were reported previously for pure cultures of Geobacter metallireducens
GS-15 and Shewanella algae BRY (Annual Report, 2002).
16S rDNA was recovered from all columns at all sampling points. Separation of DNA
using DGGE shows the recovery of multiple species along the length of all three columns (Fig
13). Two primer sets were utilized to off-set any bias of one particular primer set for specific
bacterial genera, such that a more complete investigation of colonized species might be
performed. The recovery of multiple bands from the high-pH Fe(0) areas and post-Fe(0) sand
region of the columns was unexpected given the relatively high pH encountered along the length
of these columns (Fig 14). This DNA recovery shows the presence of bacteria in these regions.
Sequences could not be determined due to the complex nature of the samples and the difficulty to
recover and purify DNA when high iron concentrations are present. Optimization of DGGE and
DNA recovery techniques by Microbial Insights, Inc, was not successful either (other than to
confirm that the columns had been colonized by microorganisms). Thus, the identity of the
bacteria species present in these columns could not be determined, which precluded the
assessment of the survival of added DIRB, primarily due to low DNA recovery..

Fe(0)-Based-Bioremediation of RDX-Contaminated Groundwater
Project CU1231 Page 24 Yearly Report
Fig. 13. DGGE of 16S rDNA amplified using primers (A) 341F and 907R and (B) 1055F and 1392R for Fe(0) barrier columns operated for 370 days.
Control Column
BrY-Bioaugmented
Column
GS15-Bioaugmented
Column
Column Distance (cm)
2.5 5.5 14 22
Column Distance (cm)
2.5 5.5 14 22
Column Distance (cm)
2.5 5.5 14 22
Control Column
BrY-Bioaugmented
Column
GS15-Bioaugmented
Column
Column Distance (cm)
2.5 5.5 14 22
Column Distance (cm)
2.5 5.5 14 22
Column Distance (cm)
2.5 5.5 14 22
(A)
(B)

Fe(0)-Based-Bioremediation of RDX-Contaminated Groundwater
Project CU1231 Page 25 Yearly Report
Fig. 14. pH profile for flow-through Fe(0) columns
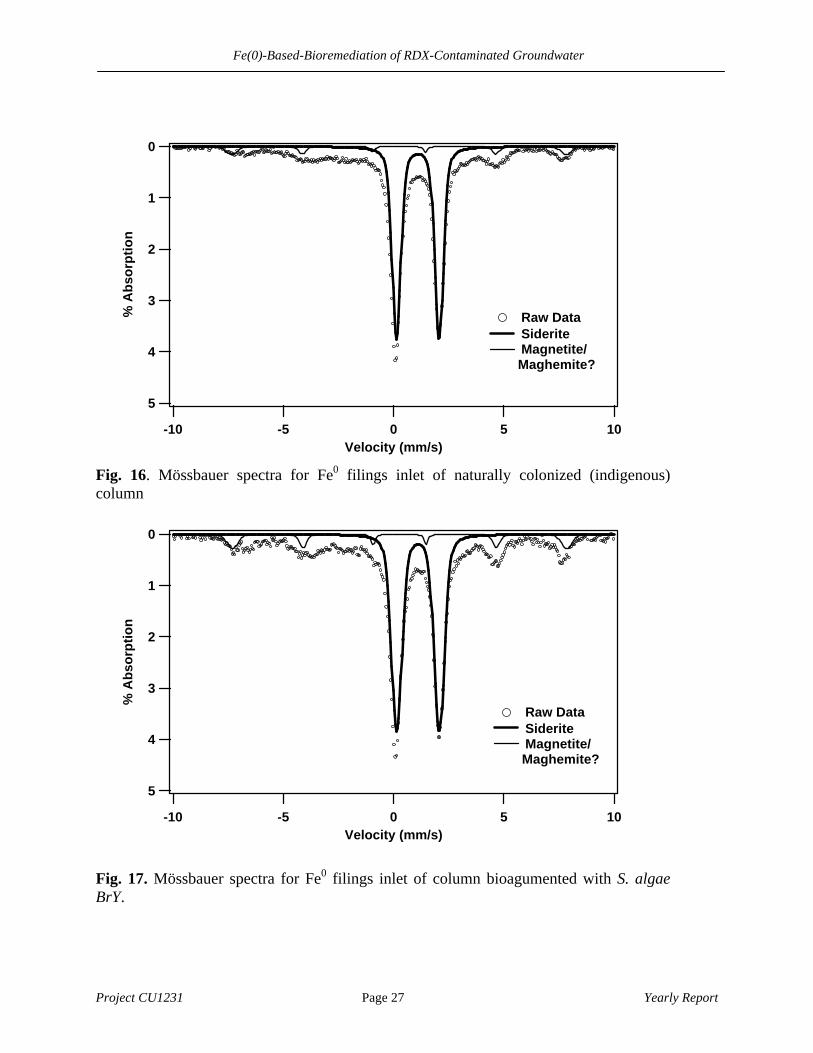
The Mössbauer spectra from each sample (Figures 15-20) show a prominent doublet that
can be identified as siderite (FeCO3, CS=1.11, QSD=1.93 (McCammon, 1995)). Siderite is
likely to form because a high concentration of bicarbonate (2 mM) exists in the column feed
solutions. The spectra from each of the column’s Fe0 filings inlet are similar (Figure 15) and
contain about the same percentage of siderite (about 60%). Siderite has been identified in Fe0
PRBs and in column studies with granular Fe0 (Mackenzie, et al., 1999; Phillips et al., 2000;
Roh, et al., 2000) and has been shown to inhibit the reduction of nitrobenzene in batch reactors
with granular Fe0 (Agrawal, et al., 1996). The percentage of siderite, however, decreased at the
outlet of the Fe0 filings in the G. metallireducens column, possibly due to reaction with RDX,
dissolution, or simply heterogeneities in the column.
Distance from Column Inlet (cm)
0 5 10 15 20 25 30
pH
6
7
8
9
10
11
Control ColumnS. algae BrY ColumnG. metallireducens GS-15 Column

Fe(0)-Based-Bioremediation of RDX-Contaminated Groundwater
Project CU1231 Page 26 Yearly Report
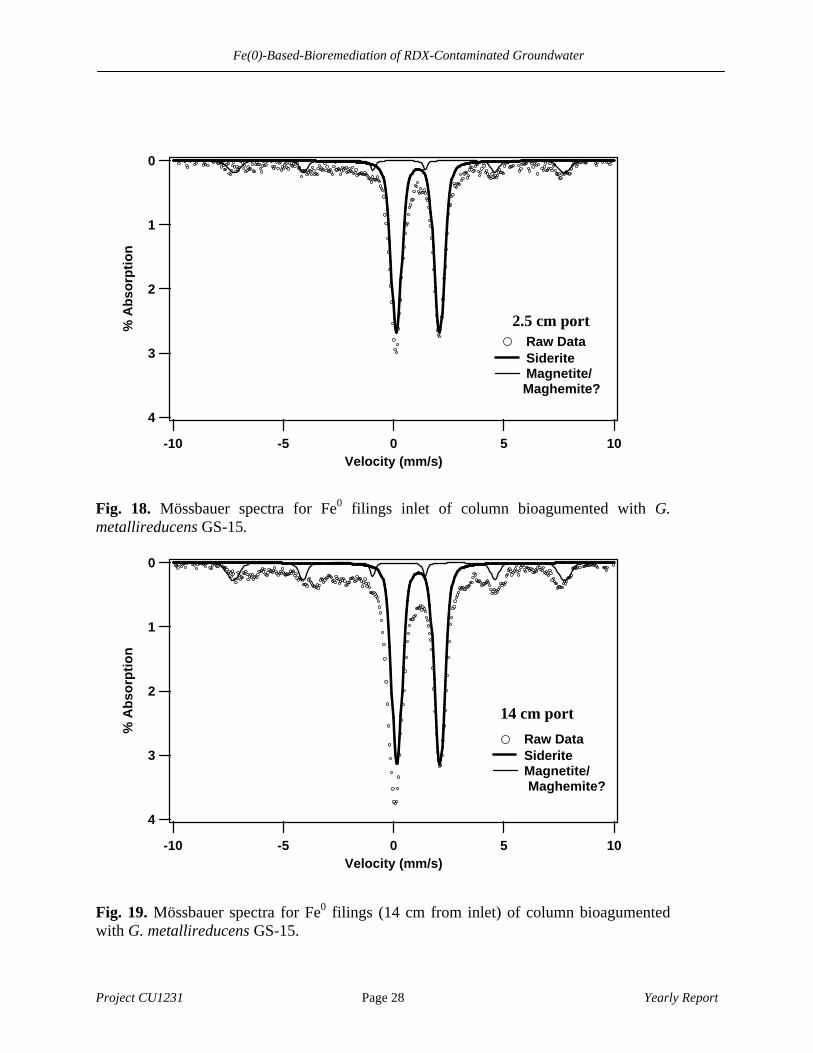
Samples analyzed from three zones within GS-15 bioaugmented column (Figures 17-19)
Fe0 filings inlet, Fe0 filings outlet, downgradient sand) show a decrease in relative abundance of
siderite (from 67% to 26%, Table 8). It is likely that the chemical composition of the column
feed solution partially governs the identity of precipitated iron minerals. High concentrations of
bicarbonate at the Fe0 filings inlet provide favorable conditions for siderite formation, which
diminishes downgradient presumably as more bicarbonate becomes sequestered within
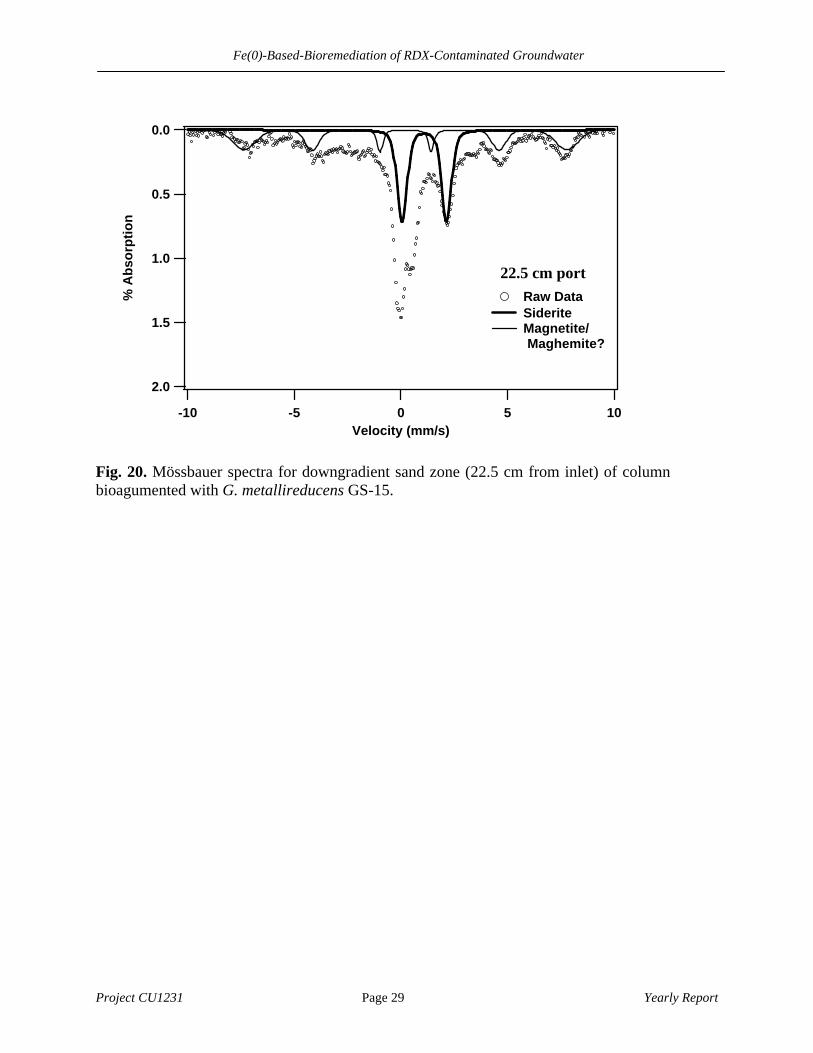
precipitates or consumed by microorganisms. The spectrum of the downgradient sand shows a
small but discernable amount of siderite as well as an unidentified component that resembles a
mixed-valent iron species. A magnetic sextet is also present within the downgradient sand
spectrum.
Fig. 15. Comparison of Mössbauer spectra for solid samples from the inlet of each column.
Ab
sorp
tio
n
-10 -5 0 5 10Velocity (mm/s)
Naturally Colonized
S. Algae BrY
G. metallireducens
Fe(0)-Based-Bioremediation of RDX-Contaminated Groundwater
Project CU1231 Page 27 Yearly Report
Fig. 16. Mössbauer spectra for Fe0 filings inlet of naturally colonized (indigenous) column
Fig. 17. Mössbauer spectra for Fe0 filings inlet of column bioagumented with S. algae BrY.
5
4
3
2
1
0%
Ab
sorp
tio
n
-10 -5 0 5 10Velocity (mm/s)
Raw Data Siderite Magnetite/
Maghemite?
5
4
3
2
1
0
% A
bso
rpti
on
-10 -5 0 5 10Velocity (mm/s)
Raw Data Siderite Magnetite/
Maghemite?
Fe(0)-Based-Bioremediation of RDX-Contaminated Groundwater
Project CU1231 Page 28 Yearly Report
Fig. 18. Mössbauer spectra for Fe0 filings inlet of column bioagumented with G. metallireducens GS-15.
Fig. 19. Mössbauer spectra for Fe0 filings (14 cm from inlet) of column bioagumented with G. metallireducens GS-15.
4
3
2
1
0
% A
bso
rpti
on
-10 -5 0 5 10Velocity (mm/s)
Raw Data Siderite Magnetite/
Maghemite?
4
3
2
1
0
% A
bso
rpti
on
-10 -5 0 5 10Velocity (mm/s)
Raw Data Siderite Magnetite/
Maghemite?
2.5 cm port
14 cm port
Fe(0)-Based-Bioremediation of RDX-Contaminated Groundwater
Project CU1231 Page 29 Yearly Report
Fig. 20. Mössbauer spectra for downgradient sand zone (22.5 cm from inlet) of column bioagumented with G. metallireducens GS-15.
2.0
1.5
1.0
0.5
0.0%
Ab
sorp
tio
n
-10 -5 0 5 10Velocity (mm/s)
Raw Data Siderite Magnetite/
Maghemite?
22.5 cm port
Fe(0)-Based-Bioremediation of RDX-Contaminated Groundwater
Project CU1231 Page 30 Yearly Report
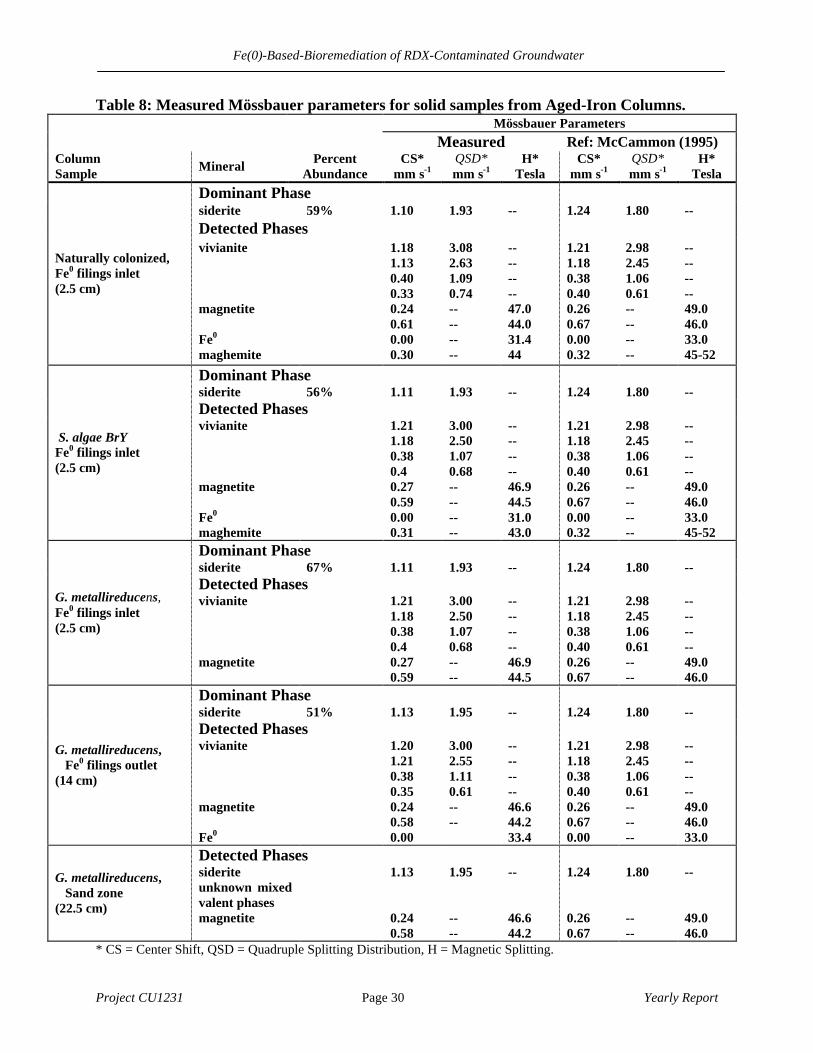
Table 8: Measured Mössbauer parameters for solid samples from Aged-Iron Columns. Mössbauer Parameters Measured Ref: McCammon (1995) Column Sample Mineral Percent
Abundance CS*
mm s-1 QSD* mm s-1
H* Tesla
CS* mm s-1
QSD* mm s-1
H* Tesla
Dominant Phase siderite 59% 1.10 1.93 -- 1.24 1.80 -- Detected Phases
Naturally colonized, Fe0 filings inlet (2.5 cm)
vivianite magnetite Fe0 maghemite
1.18 1.13 0.40 0.33 0.24 0.61 0.00 0.30
3.08 2.63 1.09 0.74 -- -- -- --
-- -- -- -- 47.0 44.0 31.4 44
1.21 1.18 0.38 0.40 0.26 0.67 0.00 0.32
2.98 2.45 1.06 0.61 -- -- -- --
-- -- -- -- 49.0 46.0 33.0 45-52
Dominant Phase siderite 56% 1.11 1.93 -- 1.24 1.80 -- Detected Phases
S. algae BrY Fe0 filings inlet (2.5 cm)
vivianite magnetite Fe0 maghemite
1.21 1.18 0.38 0.4 0.27 0.59 0.00 0.31
3.00 2.50 1.07 0.68 -- -- -- --
-- -- -- -- 46.9 44.5 31.0 43.0
1.21 1.18 0.38 0.40 0.26 0.67 0.00 0.32
2.98 2.45 1.06 0.61 -- -- -- --
-- -- -- -- 49.0 46.0 33.0 45-52
Dominant Phase siderite 67% 1.11 1.93 -- 1.24 1.80 -- Detected Phases
G. metallireducens, Fe0 filings inlet (2.5 cm)
vivianite magnetite
1.21 1.18 0.38 0.4 0.27 0.59
3.00 2.50 1.07 0.68 -- --
-- -- -- -- 46.9 44.5
1.21 1.18 0.38 0.40 0.26 0.67
2.98 2.45 1.06 0.61 -- --
-- -- -- -- 49.0 46.0
Dominant Phase siderite 51% 1.13 1.95 -- 1.24 1.80 -- Detected Phases
G. metallireducens, Fe0 filings outlet (14 cm)
vivianite magnetite Fe0
1.20 1.21 0.38 0.35 0.24 0.58 0.00
3.00 2.55 1.11 0.61 -- --
-- -- -- -- 46.6 44.2 33.4
1.21 1.18 0.38 0.40 0.26 0.67 0.00
2.98 2.45 1.06 0.61 -- -- --
-- -- -- -- 49.0 46.0 33.0
Detected Phases G. metallireducens, Sand zone (22.5 cm)
siderite unknown mixed valent phases magnetite
1.13 0.24 0.58
1.95 -- --
-- 46.6 44.2
1.24 0.26 0.67
1.80 -- --
-- 49.0 46.0
* CS = Center Shift, QSD = Quadruple Splitting Distribution, H = Magnetic Splitting.
Fe(0)-Based-Bioremediation of RDX-Contaminated Groundwater
Project CU1231 Page 31 Yearly Report
Batch Microcosm Studies
Biological Removal of RDX using selected pure cultures of Acetobacterium
Background
In past reports, we showed that iron samples from both the colonized and bioaugmented
columns contained high proportions of Acetobacterium sp. (Oh and Alvarez, 2002), which are
strict anaerobes that use H2 and CO2 for growth and produce acetate:
4H2 + 2CO2 → CH3COO- + H+ + 2H2O (Eq. 1)
Note that H2 could be provided by the anaerobic corrosion of iron with water:
Fe0 + 2H2O → H2 +Fe+2 + 2OH- (Eq. 2)
In theory, such homoacetogens could comensalistically support heterotrophic activity in
Fe0 barriers by coupling Fe0 corrosion (Equation 2) with acetogenesis (Equation 1):
4Fe0 + 2CO2 + 5H2O → CH3COO- + 4Fe+2 + 7OH- (Eq. 3)
These results are supported by previous reports that the homoacetogen, Acetobacterium
woodi, can grow on cathodic hydrogen from iron corrosion (Rajagopal and LeGall, 1989).
Increased availability of an organic substrate (i.e., acetate) is likely to increase heterotrophic
activity, which might be beneficial for RDX biodegradation, especially if RDX is utilized as a
nitrogen source by heterotrophs (Sheremata and Hawari, 2000). Homoacetogens have also been
implicated in RDX degradation by methanogenic sludge (Adrian and Lowder, 1999).
Nevertheless, the ability of homoacetogens to degrade RDX under autotrophic (H2-fed)
conditions that are likely to be encountered in Fe0 barriers has not been demonstrated.
The homoacetogenic bacteria Acetobacterium paludosum (ATCC# 51793) was studied
for its ability to utilize RDX for growth. A. paludosum is a non-pathogenic, Gram-positive, strict
anaerobe capable of growing both autotrophically or chemoorganotrophically with morphology
Fe(0)-Based-Bioremediation of RDX-Contaminated Groundwater
Project CU1231 Page 32 Yearly Report
described as short nonspore-forming rods that are mobile by means of flagella. The optimal
growth temperature for this strain is 20oC. The culture was obtained from American Type
Culture Collection (ATCC, Manassas, VA).
Our hypothesis was that the rate and extent of RDX degradation would be increased when
the bacteria are substrate-challenged. We sought to determine if these bacteria are capable of
using RDX as a carbon or nitrogen source, or if they degrade RDX only by fortuitous
cometabolism. Experiments were conducted where A. paludosum was grown and monitored
under varying nitrogen- and carbon-containing conditions to see if the rate and extent of RDX
biodegradation by these bacteria would be significantly affected by the availability of alternative
substrates. Organic carbon sources, nitrogen sources, or both, were omitted from some
treatments to test our hypothesis that RDX degradation might be faster under nutrient-limited
conditions, which would exert selective pressure for the utilization of RDX as a nitrogen or
carbon source.
Materials and Methods
For these experiments, the culture was grown on ATCC Acetobacterium medium 1019
(Balch and Wolfe, 1976) which contains the following (in grams per liter of distilled water):
yeast extract (1.0); NH4Cl (1.0); MgSO4⋅7H2O (0.1); KH2PO4 (0.4); K2HPO4 (0.4); fructose
(5.0); NaHCO3 (3.0); cysteine HCl⋅H2O (0.5); and Na2S⋅9H2O (0.5). The medium also contained
Wolfe’s Vitamin solution (10 mL), Wolfe’s Mineral solution (10 mL), and resazurin (0.01%) as
a redox potential indicator; the headspace consisted of a H2/CO2 mixture (95/5, v/v). In an effort
to determine RDX biodegradation under different substrate conditions, assays were conducted in
25-mL Balch anaerobic culture tubes (18 × 150 mm) amended with 6 mL of autoclaved ATCC

Fe(0)-Based-Bioremediation of RDX-Contaminated Groundwater
Project CU1231 Page 33 Yearly Report
1019 Acetobacterium medium, 1.5 mL of liquid cell culture, and RDX (approx. 3 mg/L). The
headspace consisted of 20 mL of an H2/CO2 (80/20, v/v) gas mixture. We also investigated the
growth of A. paludosum using RDX as the sole source of nitrogen. These tubes were prepared
with RDX, 1.5 mL of bacteria, 6 mL of ATCC 1019 medium without an organic carbon source,
and a headspace of H2/N2 (CO2 was omitted). Controls without bacteria and controls in which
the bacteria were unfed (no organic carbon or CO2) were also prepared to obtain a baseline for
comparing RDX degradation and acetate production. The tubes were covered in aluminum foil
to prevent photo-interactions, and were rotated continuously on a Roto-Torque Heavy Duty
Rotator (Cole-Palmer) at room temperature (approximately 20 °C). The optical density of each
tube was recorded throughout the experiment to determine the viability of the bacteria. Table 9
shows the setup of the five total sets of treatments. The first four sets of tubes listed in Table 9
(the three biotic sets under different substrate conditions and the abiotic set) were prepared and
started before the fifth control set, in which the only potential carbon source was RDX, was
started a few days later.
Fe(0)-Based-Bioremediation of RDX-Contaminated Groundwater
Project CU1231 Page 34 Yearly Report
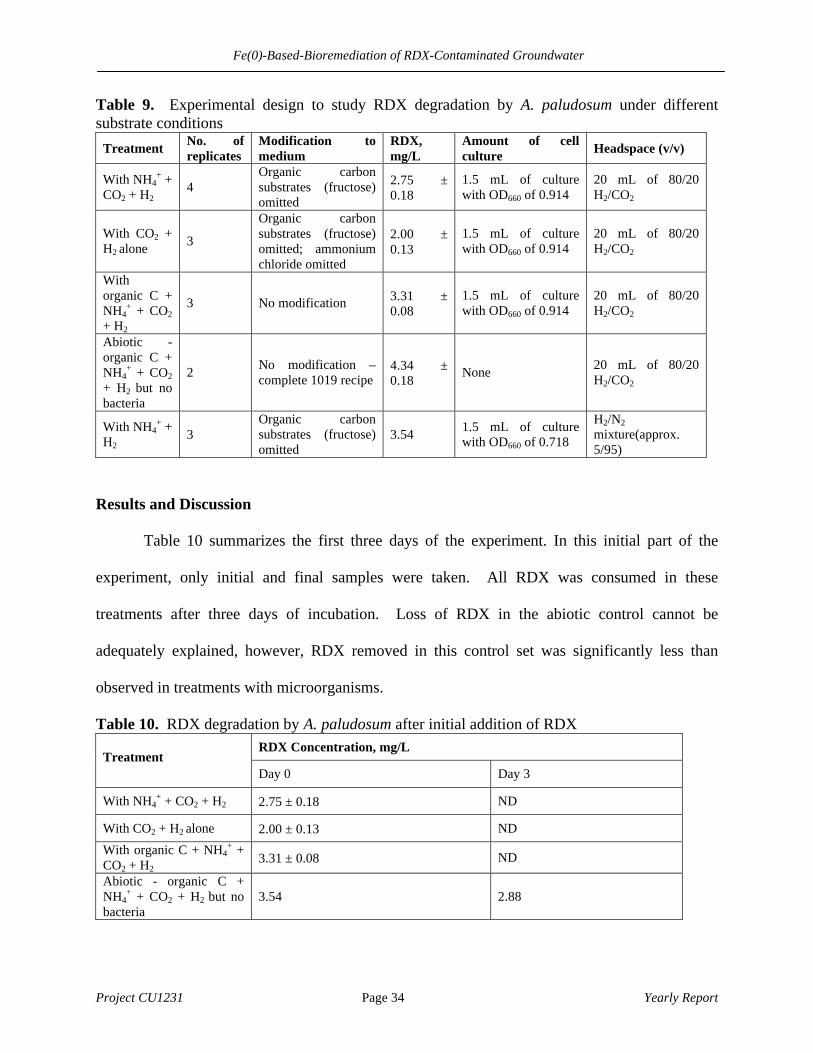
Table 9. Experimental design to study RDX degradation by A. paludosum under different substrate conditions
Treatment No. of replicates
Modification to medium
RDX, mg/L
Amount of cell culture Headspace (v/v)
With NH4+ +
CO2 + H2 4
Organic carbon substrates (fructose) omitted
2.75 ± 0.18
1.5 mL of culture with OD660 of 0.914
20 mL of 80/20 H2/CO2
With CO2 + H2 alone 3
Organic carbon substrates (fructose) omitted; ammonium chloride omitted
2.00 ± 0.13
1.5 mL of culture with OD660 of 0.914
20 mL of 80/20 H2/CO2
With organic C + NH4
+ + CO2 + H2
3 No modification 3.31 ± 0.08
1.5 mL of culture with OD660 of 0.914
20 mL of 80/20 H2/CO2
Abiotic - organic C + NH4
+ + CO2 + H2 but no bacteria
2 No modification – complete 1019 recipe
4.34 ± 0.18
None 20 mL of 80/20 H2/CO2
With NH4+ +
H2 3
Organic carbon substrates (fructose) omitted
3.54 1.5 mL of culture with OD660 of 0.718
H2/N2 mixture(approx. 5/95)
Results and Discussion
Table 10 summarizes the first three days of the experiment. In this initial part of the
experiment, only initial and final samples were taken. All RDX was consumed in these
treatments after three days of incubation. Loss of RDX in the abiotic control cannot be
adequately explained, however, RDX removed in this control set was significantly less than
observed in treatments with microorganisms.
Table 10. RDX degradation by A. paludosum after initial addition of RDX RDX Concentration, mg/L
Treatment Day 0 Day 3
With NH4+ + CO2 + H2 2.75 ± 0.18 ND
With CO2 + H2 alone 2.00 ± 0.13 ND
With organic C + NH4+ +
CO2 + H2 3.31 ± 0.08 ND
Abiotic - organic C + NH4
+ + CO2 + H2 but no bacteria
3.54 2.88
Fe(0)-Based-Bioremediation of RDX-Contaminated Groundwater
Project CU1231 Page 35 Yearly Report
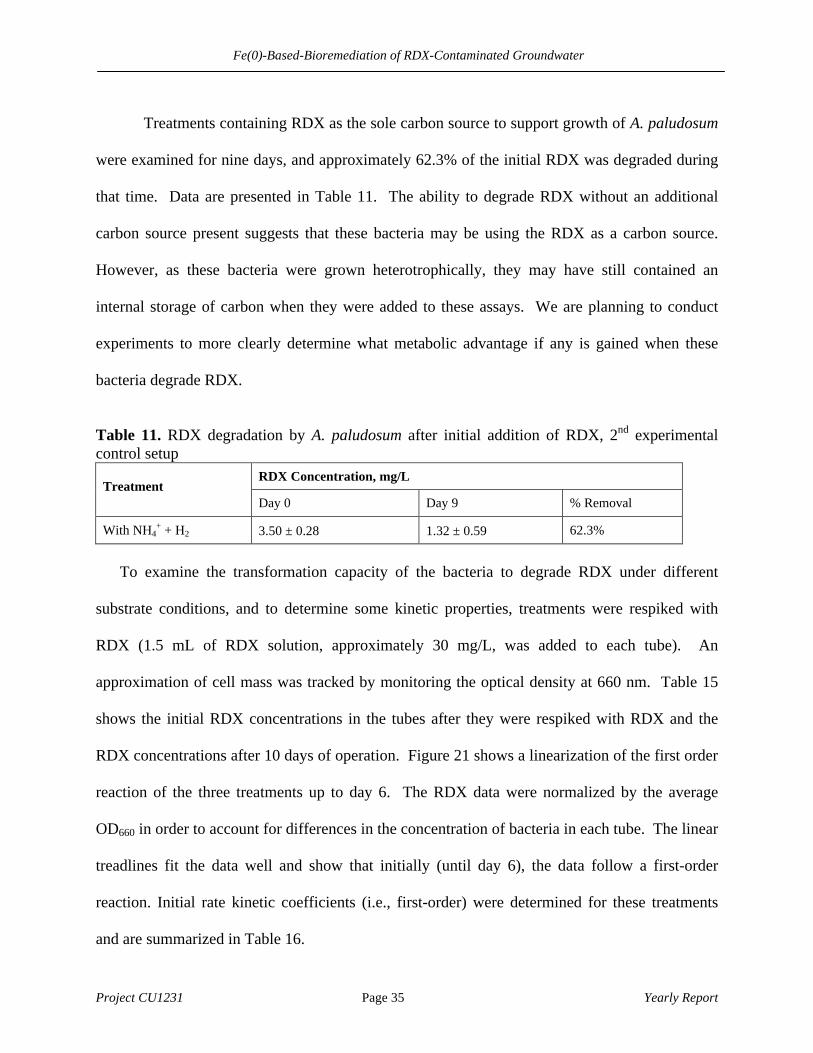
Treatments containing RDX as the sole carbon source to support growth of A. paludosum
were examined for nine days, and approximately 62.3% of the initial RDX was degraded during
that time. Data are presented in Table 11. The ability to degrade RDX without an additional
carbon source present suggests that these bacteria may be using the RDX as a carbon source.
However, as these bacteria were grown heterotrophically, they may have still contained an
internal storage of carbon when they were added to these assays. We are planning to conduct
experiments to more clearly determine what metabolic advantage if any is gained when these
bacteria degrade RDX.
Table 11. RDX degradation by A. paludosum after initial addition of RDX, 2nd experimental control setup
RDX Concentration, mg/L Treatment
Day 0 Day 9 % Removal
With NH4+ + H2 3.50 ± 0.28 1.32 ± 0.59 62.3%
To examine the transformation capacity of the bacteria to degrade RDX under different
substrate conditions, and to determine some kinetic properties, treatments were respiked with
RDX (1.5 mL of RDX solution, approximately 30 mg/L, was added to each tube). An
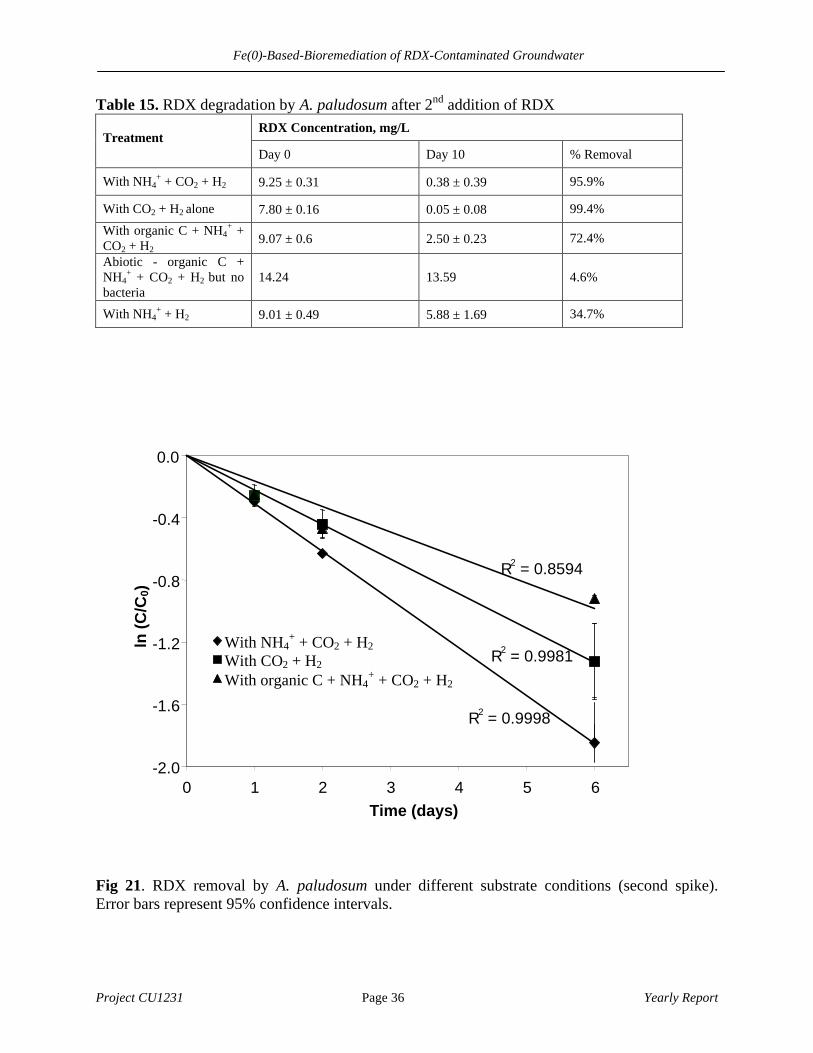
approximation of cell mass was tracked by monitoring the optical density at 660 nm. Table 15
shows the initial RDX concentrations in the tubes after they were respiked with RDX and the
RDX concentrations after 10 days of operation. Figure 21 shows a linearization of the first order
reaction of the three treatments up to day 6. The RDX data were normalized by the average
OD660 in order to account for differences in the concentration of bacteria in each tube. The linear
treadlines fit the data well and show that initially (until day 6), the data follow a first-order
reaction. Initial rate kinetic coefficients (i.e., first-order) were determined for these treatments
and are summarized in Table 16.
Fe(0)-Based-Bioremediation of RDX-Contaminated Groundwater
Project CU1231 Page 36 Yearly Report
Table 15. RDX degradation by A. paludosum after 2nd addition of RDX RDX Concentration, mg/L
Treatment Day 0 Day 10 % Removal
With NH4+ + CO2 + H2 9.25 ± 0.31 0.38 ± 0.39 95.9%
With CO2 + H2 alone 7.80 ± 0.16 0.05 ± 0.08 99.4%
With organic C + NH4+ +
CO2 + H2 9.07 ± 0.6 2.50 ± 0.23 72.4%
Abiotic - organic C + NH4
+ + CO2 + H2 but no bacteria
14.24 13.59 4.6%
With NH4+ + H2 9.01 ± 0.49 5.88 ± 1.69 34.7%
Fig 21. RDX removal by A. paludosum under different substrate conditions (second spike). Error bars represent 95% confidence intervals.
R 2 = 0.9998
R 2 = 0.9981
R 2 = 0.8594
-2.0
-1.6
-1.2
-0.8
-0.4
0.0
0 1 2 3 4 5 6 Time (days)
ln (
C/C
0)
With NH4+ + CO2 + H2
With CO2 + H2 With organic C + NH4
+ + CO2 + H2

Fe(0)-Based-Bioremediation of RDX-Contaminated Groundwater
Project CU1231 Page 37 Yearly Report
Even though the initial concentration of RDX was about 3 times higher than control
treatments, the bacteria in medium with limited substrates (where either organic carbon or
organic carbon and nitrogen sources were omitted) had the highest percentage of RDX
degradation. The bacteria exposed to medium without an organic carbon source had a 95.9%
decrease in RDX concentration in six days compared to a 99.4% decrease tubes containing
medium without an organic carbon source or a nitrogen source (p < 0.05). There was no
significant difference between these two substrate-limiting treatment types. However, they are
statistically different from the controls and the assay amended with medium containing both an
organic carbon source and a nitrogen source. The fact that these bacteria will degrade RDX
faster when there is no nitrogen source other than RDX suggests that the absence of easily
assimilated nitrogen sources, such as NH4+, can exert selective pressure on the bacteria to
degrade RDX.
As seen in Figure 20, the rate of RDX biodegradation in the three treatment sets through
day 6 closely followed first-order kinetics (i.e., C = C0e-kobs*t) and the data can be linearized
according to Equation 4:
ln (C/C0) = -kobs*t (Eq. 4)
where kobs is the observed first order rate coefficient. C0 and C are the initial and time t
concentrations of RDX in solution. These rate coefficients, and their corresponding R2 values,
are summarized in Table 5 (normalized by initial OD660). For this second addition of RDX, the k
values are all significantly different from each other (statistically, by 95% confidence). The
treatment tubes in which there was NH4+, CO2, and H+ degraded RDX the fastest, followed by
Fe(0)-Based-Bioremediation of RDX-Contaminated Groundwater
Project CU1231 Page 38 Yearly Report
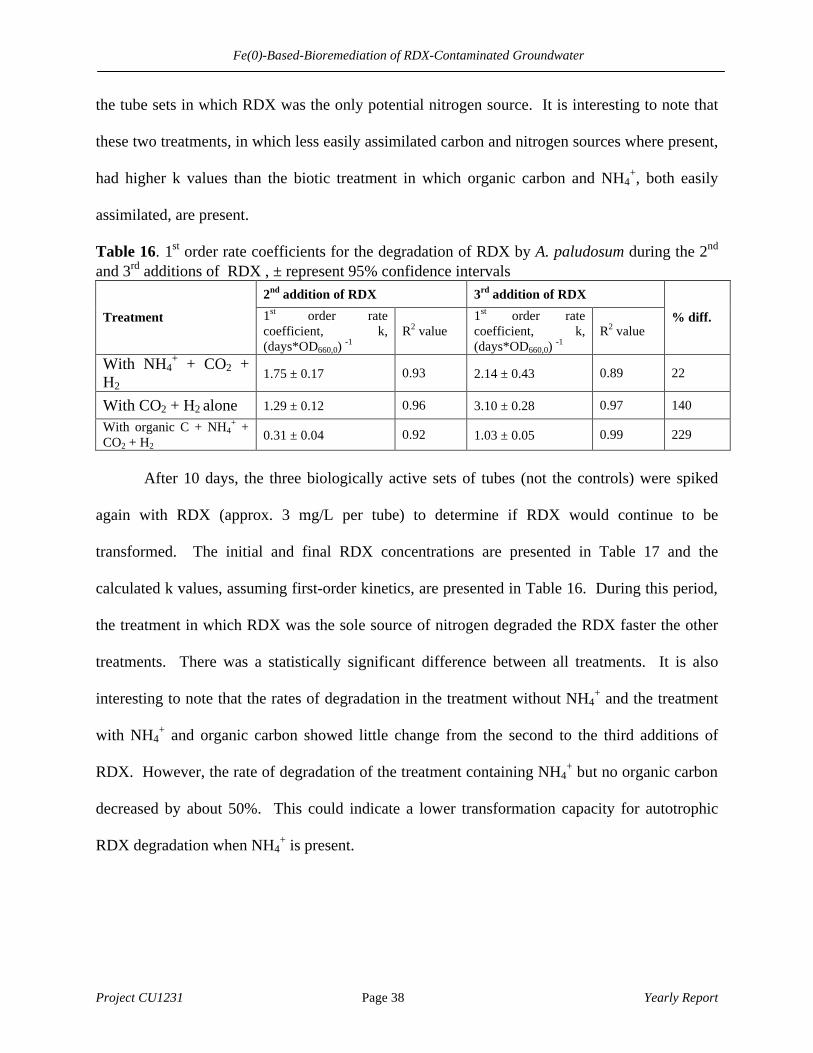
the tube sets in which RDX was the only potential nitrogen source. It is interesting to note that
these two treatments, in which less easily assimilated carbon and nitrogen sources where present,
had higher k values than the biotic treatment in which organic carbon and NH4+, both easily
assimilated, are present.
Table 16. 1st order rate coefficients for the degradation of RDX by A. paludosum during the 2nd and 3rd additions of RDX , ± represent 95% confidence intervals
2nd addition of RDX 3rd addition of RDX
Treatment 1st order rate coefficient, k, (days*OD660,0)
-1 R2 value
1st order rate coefficient, k, (days*OD660,0)
-1 R2 value
% diff.
With NH4+ + CO2 +
H2 1.75 ± 0.17 0.93 2.14 ± 0.43 0.89 22
With CO2 + H2 alone 1.29 ± 0.12 0.96 3.10 ± 0.28 0.97 140
With organic C + NH4+ +
CO2 + H2 0.31 ± 0.04 0.92 1.03 ± 0.05 0.99 229
After 10 days, the three biologically active sets of tubes (not the controls) were spiked
again with RDX (approx. 3 mg/L per tube) to determine if RDX would continue to be
transformed. The initial and final RDX concentrations are presented in Table 17 and the
calculated k values, assuming first-order kinetics, are presented in Table 16. During this period,
the treatment in which RDX was the sole source of nitrogen degraded the RDX faster the other
treatments. There was a statistically significant difference between all treatments. It is also
interesting to note that the rates of degradation in the treatment without NH4+ and the treatment
with NH4+ and organic carbon showed little change from the second to the third additions of
RDX. However, the rate of degradation of the treatment containing NH4+ but no organic carbon
decreased by about 50%. This could indicate a lower transformation capacity for autotrophic
RDX degradation when NH4+ is present.
Fe(0)-Based-Bioremediation of RDX-Contaminated Groundwater
Project CU1231 Page 39 Yearly Report
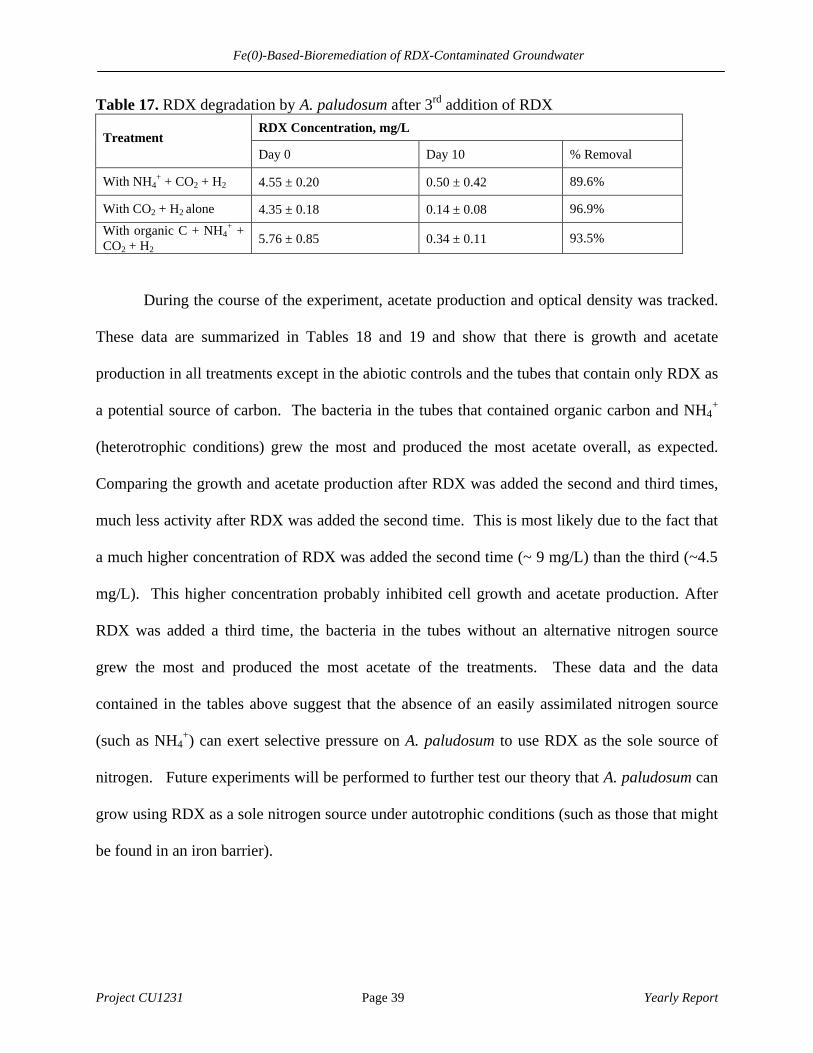
Table 17. RDX degradation by A. paludosum after 3rd addition of RDX RDX Concentration, mg/L
Treatment Day 0 Day 10 % Removal
With NH4+ + CO2 + H2 4.55 ± 0.20 0.50 ± 0.42 89.6%
With CO2 + H2 alone 4.35 ± 0.18 0.14 ± 0.08 96.9%
With organic C + NH4+ +
CO2 + H2 5.76 ± 0.85 0.34 ± 0.11 93.5%
During the course of the experiment, acetate production and optical density was tracked.
These data are summarized in Tables 18 and 19 and show that there is growth and acetate
production in all treatments except in the abiotic controls and the tubes that contain only RDX as
a potential source of carbon. The bacteria in the tubes that contained organic carbon and NH4+
(heterotrophic conditions) grew the most and produced the most acetate overall, as expected.
Comparing the growth and acetate production after RDX was added the second and third times,
much less activity after RDX was added the second time. This is most likely due to the fact that
a much higher concentration of RDX was added the second time (~ 9 mg/L) than the third (~4.5
mg/L). This higher concentration probably inhibited cell growth and acetate production. After
RDX was added a third time, the bacteria in the tubes without an alternative nitrogen source
grew the most and produced the most acetate of the treatments. These data and the data
contained in the tables above suggest that the absence of an easily assimilated nitrogen source
(such as NH4+) can exert selective pressure on A. paludosum to use RDX as the sole source of
nitrogen. Future experiments will be performed to further test our theory that A. paludosum can
grow using RDX as a sole nitrogen source under autotrophic conditions (such as those that might
be found in an iron barrier).

Fe(0)-Based-Bioremediation of RDX-Contaminated Groundwater
Project CU1231 Page 40 1st Quarter Progress Report
Table 18. Optical density (at 660 nm) of tubes containing A. paludosum under different substrate conditions, ± one standard deviation OD660, 1
st addition of RDX OD660, 2nd addition of RDX OD660, 3
rd addition of RDX Treatment Day 0 Day 3 % incr. Day 0 Day 10 % incr. Day 0 Day 21 % incr. With NH4
+ + CO2 + H2 0.19 ± 0.01 0.20 ± 0.02 5.3 0.18 ± 0.00 0.19 ± 0.01 5.6 0.07 ± 0.00 0.14 ± 0.03 100 With CO2 + H2 alone 0.19 ± 0.01 0.20 ± 0.02 5.3 0.17 ± 0.00 0.17 ± 0.01 0 0.07 ± 0.01 0.21 ± 0.02 200 With organic C + NH4
+ + CO2 + H2 0.20 ± 0.01 0.61 ± 0.05 205 0.51 ± 0.04 0.48 ± 0.08 -5.9 0.18 ± 0.04 0.62 ± 0.11 244
With NH4+ + H2 * * * 0.06 ± 0.03 0.04 ± 0.01 -33.3 * * *
Table 19. Acetate production (mmol) in tubes containing A. paludosum under different substrate conditions, ± one standard deviation Acetate (mmol), 1st addition of RDX Acetate (mmol), 2nd addition of RDX Acetate (mmol), 3rd addition of RDX Treatment Day 0 Day 3 % incr. Day 0 Day 10 % incr. Day 0 Day 21 % incr. With NH4
+ + CO2 + H2 ND 5.92 ± 1.43 100 18.89 ± 1.36 25.59 ± 1.78 35.47 9.59 ± 0.75 27.51 ± 5.88 187 With CO2 + H2 alone ND 7.47 ± 0.75 100 18.30 ± 1.14 22.26 ± 0.52 21.64 9.63 ± 0.37 41.85 ± 0.86 335 With organic C + NH4
+ + CO2 + H2 ND 30.49 ± 0.92 100 33.29 ± 5.82 28.39 ± 6.34 -14.72 13.78 ± 2.28 65.61 ± 6.70 376
With NH4+ + H2 * * * ND ND 0 * * *
Abiotic - organic C + NH4
+ + CO2 + H2 but no bacteria
ND ND 0 ND ND 0 * * *
Note: In both Tables 18 and 19, ND = not detected and * = not tested

Fe(0)-Based-Bioremediation of RDX-Contaminated Groundwater
Project CU1231 Page 41 Year End Report
In an effort to understand if A. paludosum was able to use RDX as a source of
nitrogen we investigated whether the presence of an easily assimilated nitrogen source,
such as ammonium, would be inhibitory to RDX degradation. A significant decrease in
RDX degradation in the presence of ammonium as compared to treatments in which
RDX was the only possible nitrogen source would suggest that A. paludosum was using
RDX as a nitrogen source. Nitrogen sources would be used preferentially, in the order of
most biologically available to least. If this were the case, RDX would not be
significantly degraded until the more easily assimilated nitrogen sources were exhausted.
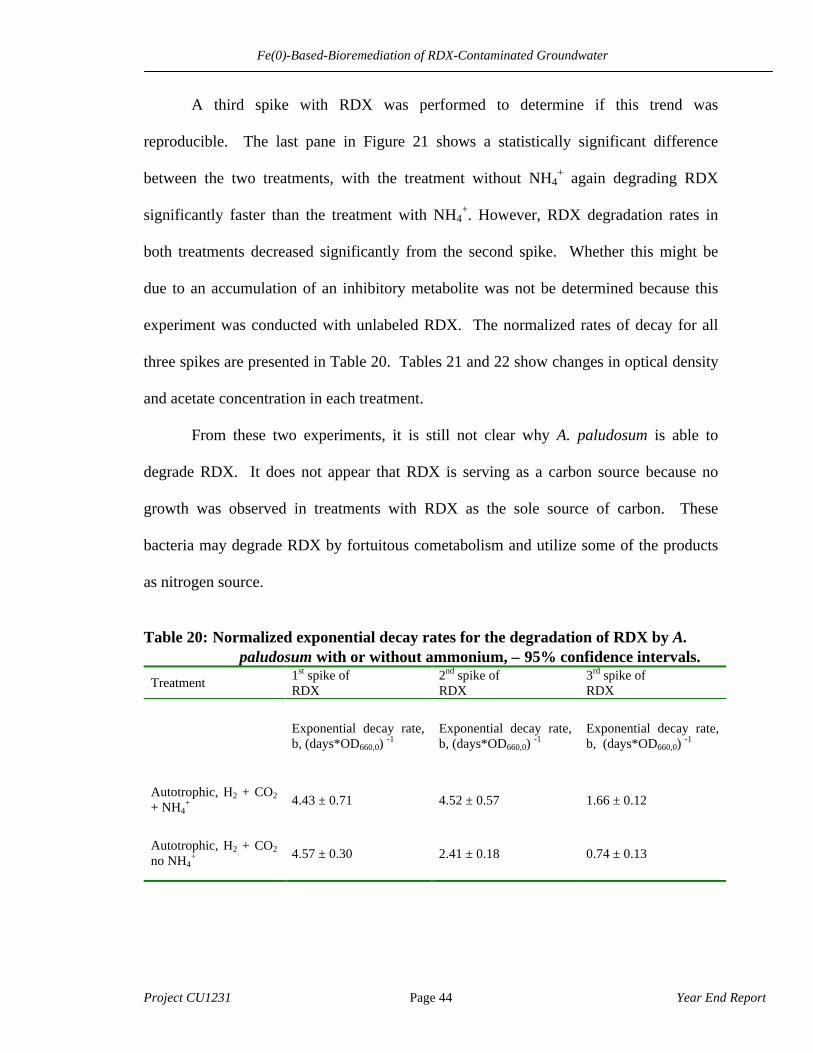
Figure 22 shows the autotrophic degradation of RDX by A. paludosum under two
nitrogen conditions: with and without ammonium (NH4+ added as NH4Cl). The data
were plotted and fitted with an exponential decay regression line. The first time RDX
was spiked (as seen in the first pane of Figure 21) there was no statistically significant
difference between the two treatments. The normalized (by the initial OD660) rate of
decay of the treatment containing NH4+ was 4.43 (day*OD660)-1 while the normalized rate
of decay of the treatment not containing NH4+ was 4.57 (day*OD660)-1. The initial
similarity of rates of decay possibly reflect that the cells contained internally sufficient
reducing power and/or nitrogen sources. A second spike with RDX resulted in greater
difference between the two treatments (Figure 21). The rate of exponential decay of the
treatment without NH4+ increased slightly to 4.52 (day*OD660,0)-1 while that of the
treatment that contained NH4+ decreased by almost half, to 2.41 (day*OD660,0)-1. The
decrease in rate of degradation in the treatment containing a nitrogen source may be
because the bacteria were running out of reducing power. The fact that the rate of
degradation in the treatment without NH4+ remains near constant and still much greater

Fe(0)-Based-Bioremediation of RDX-Contaminated Groundwater
Project CU1231 Page 42 Year End Report
than that of the treatment containing NH4+ suggests that the RDX might have been
serving as a nitrogen source for the bacteria, and that the presence of a more easily
assimilated nitrogen source, such as NH4+ might inhibit RDX degradation.

Fe(0)-Based-Bioremediation of RDX-Contaminated Groundwater
Project CU1231 Page 43 Year End Report
Time, days
6 8 10 12 140 2 4
RD
X, m
g/L
0.0
2.0
4.0
6.0
8.0
10.0
14 16 18 20 22 24 26
Autotrophic, No NH4+
Autotrophic + NH4+
Fig. 22 RDX removal by A. paludosum under utotrophic, anaerobic conditions with and without the presence of ammonium, (first, second, and third spikes of RDX). Error bars represent 95% confidence intervals.
Fe(0)-Based-Bioremediation of RDX-Contaminated Groundwater
Project CU1231 Page 44 Year End Report
A third spike with RDX was performed to determine if this trend was
reproducible. The last pane in Figure 21 shows a statistically significant difference
between the two treatments, with the treatment without NH4+ again degrading RDX
significantly faster than the treatment with NH4+. However, RDX degradation rates in
both treatments decreased significantly from the second spike. Whether this might be
due to an accumulation of an inhibitory metabolite was not be determined because this
experiment was conducted with unlabeled RDX. The normalized rates of decay for all
three spikes are presented in Table 20. Tables 21 and 22 show changes in optical density
and acetate concentration in each treatment.
From these two experiments, it is still not clear why A. paludosum is able to
degrade RDX. It does not appear that RDX is serving as a carbon source because no
growth was observed in treatments with RDX as the sole source of carbon. These
bacteria may degrade RDX by fortuitous cometabolism and utilize some of the products
as nitrogen source.
Table 20: Normalized exponential decay rates for the degradation of RDX by A.
paludosum with or without ammonium, ± 95% confidence intervals.
Treatment 1st spike of RDX
2nd spike of RDX
3rd spike of RDX
Exponential decay rate, b, (days*OD660,0)
-1 Exponential decay rate, b, (days*OD660,0)
-1 Exponential decay rate, b, (days*OD660,0)
-1
Autotrophic, H2 + CO2 + NH4
+ 4.43 ± 0.71 4.52 ± 0.57 1.66 ± 0.12
Autotrophic, H2 + CO2 no NH4
+ 4.57 ± 0.30 2.41 ± 0.18 0.74 ± 0.13

Fe(0)-Based-Bioremediation of RDX-Contaminated Groundwater
Project CU1231 Page 45 Year End Report
Table 21: Optical density (at 660 nm) of tubes containing A. paludosum with or without ammonium, ± one standard deviation.
Treatment OD660, 1st addition of RDX OD660, 2
nd addition of RDX OD660, 3rd addition of RDX
Day 0 Day 5 % incr. Day 0 Day 9 % incr. Day 0 Day 12 %
incr.
Autotrophic, no NH4
+, no RDX 0.077 ± 0.00 0.088 ± 0.00 14.29 0.075 ± 0.00 0.104 ± 0.00 38.00 0.089 ± 0.00 0.095 ± 0.00 6.78
Autotrophic + NH4
+, no RDX 0.075 ± 0.00 0.097 ± 0.00 28.67 0.080 ± 0.00 0.121 ± 0.00 551.57 0.105 ± 0.00 0.125 ± 0.00 19.14
Autotrophic + NH4
+ 0.073 ± 0.003 0.085 ± 0.007 15.46 0.071 ± 0.005 0.111 ± 0.008 57.08 0.097 ± 0.007 0.104 ± 0.013 7.59
Autotrophic, no NH4
+ 0.080 ± 0.009 0.086 ± 0.009 6.88 0.071 ± 0.007 0.101 ± 0.012 39.79 0.087 ± 0.009 0.088 ± 0.012 1.44
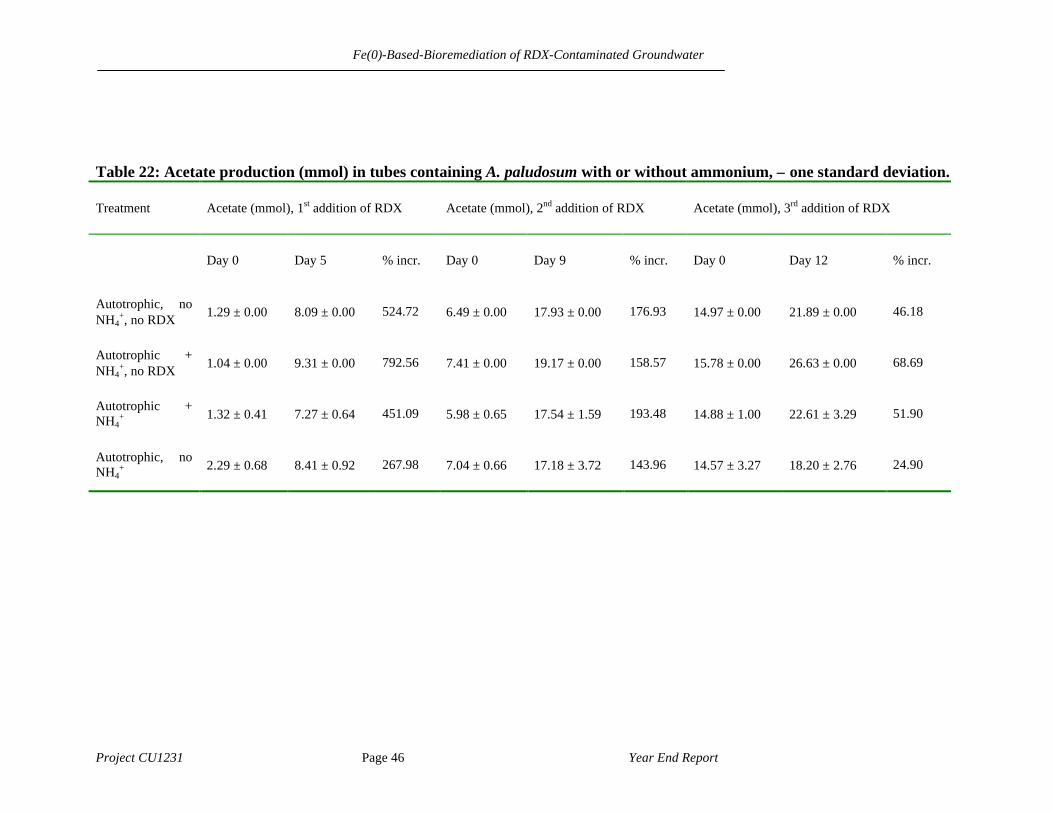
Fe(0)-Based-Bioremediation of RDX-Contaminated Groundwater
Project CU1231 Page 46 Year End Report
Table 22: Acetate production (mmol) in tubes containing A. paludosum with or without ammonium, ± one standard deviation.
Treatment Acetate (mmol), 1st addition of RDX Acetate (mmol), 2nd addition of RDX Acetate (mmol), 3rd addition of RDX
Day 0 Day 5 % incr. Day 0 Day 9 % incr. Day 0 Day 12 % incr.
Autotrophic, no NH4
+, no RDX 1.29 ± 0.00 8.09 ± 0.00 524.72 6.49 ± 0.00 17.93 ± 0.00 176.93 14.97 ± 0.00 21.89 ± 0.00 46.18
Autotrophic + NH4
+, no RDX 1.04 ± 0.00 9.31 ± 0.00 792.56 7.41 ± 0.00 19.17 ± 0.00 158.57 15.78 ± 0.00 26.63 ± 0.00 68.69
Autotrophic + NH4
+ 1.32 ± 0.41 7.27 ± 0.64 451.09 5.98 ± 0.65 17.54 ± 1.59 193.48 14.88 ± 1.00 22.61 ± 3.29 51.90
Autotrophic, no NH4
+ 2.29 ± 0.68 8.41 ± 0.92 267.98 7.04 ± 0.66 17.18 ± 3.72 143.96 14.57 ± 3.27 18.20 ± 2.76 24.90
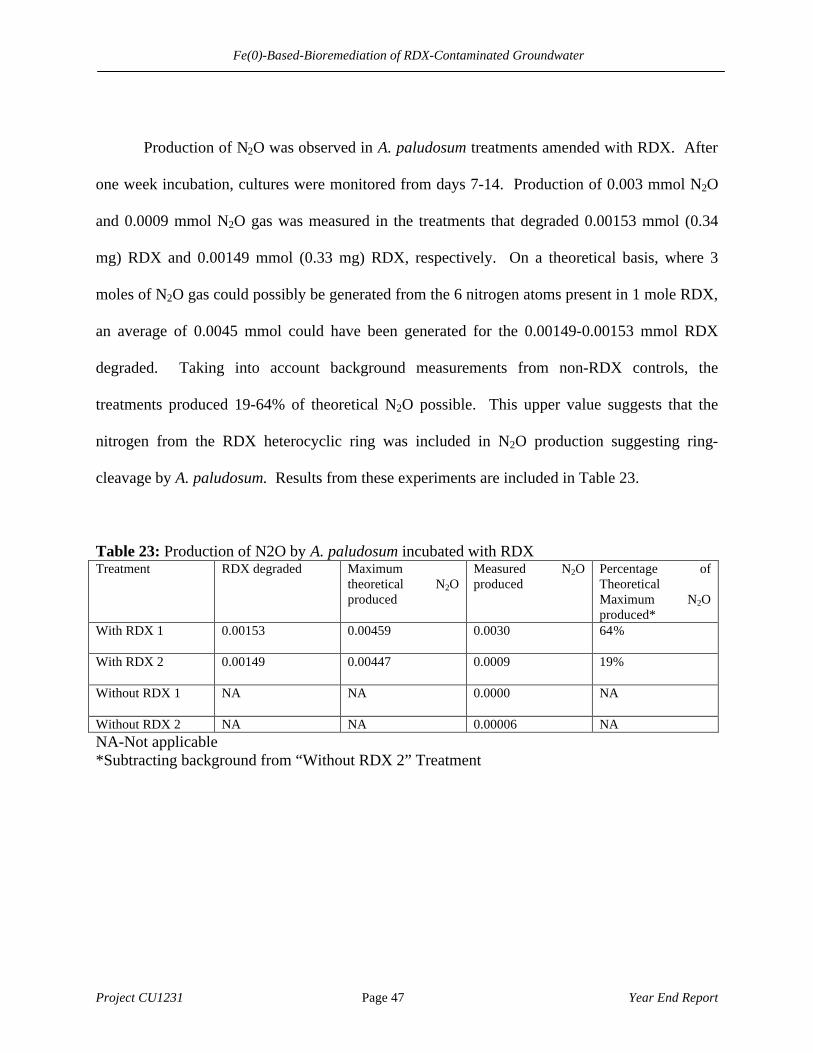
Fe(0)-Based-Bioremediation of RDX-Contaminated Groundwater
Project CU1231 Page 47 Year End Report
Production of N2O was observed in A. paludosum treatments amended with RDX. After
one week incubation, cultures were monitored from days 7-14. Production of 0.003 mmol N2O
and 0.0009 mmol N2O gas was measured in the treatments that degraded 0.00153 mmol (0.34
mg) RDX and 0.00149 mmol (0.33 mg) RDX, respectively. On a theoretical basis, where 3
moles of N2O gas could possibly be generated from the 6 nitrogen atoms present in 1 mole RDX,
an average of 0.0045 mmol could have been generated for the 0.00149-0.00153 mmol RDX
degraded. Taking into account background measurements from non-RDX controls, the
treatments produced 19-64% of theoretical N2O possible. This upper value suggests that the
nitrogen from the RDX heterocyclic ring was included in N2O production suggesting ring-
cleavage by A. paludosum. Results from these experiments are included in Table 23.
Table 23: Production of N2O by A. paludosum incubated with RDX Treatment RDX degraded Maximum
theoretical N2O produced
Measured N2O produced
Percentage of Theoretical Maximum N2O produced*
With RDX 1 0.00153 0.00459 0.0030 64 %
With RDX 2 0.00149 0.00447 0.0009 19%
Without RDX 1 NA NA 0.0000 NA
Without RDX 2 NA NA 0.00006 NA NA-Not applicable *Subtracting background from “Without RDX 2” Treatment
Fe(0)-Based-Bioremediation of RDX-Contaminated Groundwater
Project CU1231 Page 48 Year End Report
RDX Reduction by Iron Oxides
1. Reactivity of Sulfate Green Rust with RDX: Product Distribution Background
The fate of RDX in the presence of sulfate green rust (FeII4FeIII
2(OH)12SO4•yH2O) was
further explored. We previously identified nitrous oxide (N2O), methane (CH4), and ammonium
(NH4+) as preliminary end products. During this reporting period, a new gas-tight reactor was
built to allow concurrent detection of products in the absence of a buffer. The evolution of N2O
and NH4+ was confirmed, the likelihood of CH4 as a potential end product was eliminated, and
the presence of formaldehyde (HCHO) was observed. In addition, 14C-RDX was used to confirm
that the majority of carbon products remain soluble and to better assess the fate of RDX in the
presence of green rust.
Materials and Methods
The experiment and sample preparations were conducted within a glovebox under anoxic
conditions. A batch reaction containing RDX (~370 uM), sulfate green rust (~6.0 g/L), and
K2SO4 (16.7 mM, a background electrolyte) was performed within a gastight glass reactor vessel
connected to a pH-stat and stir plate. Sulfate green rust was synthesized by induced hydrolysis of
a combined FeII/FeIII solution (Williams and Scherer, 2001). A blue-green precipitate was
recovered by vacuum-filtering and immediately added to the 120-ml reactor containing K2SO4.
Freeze-drying the solids was not performed as in previous experiments. Solution pH was
maintained at 7.0 using 0.25 N H2SO4 and 1.0 N KOH. The replacement of PIPES biological
buffer (as was employed in previous experiments) with strong acid and base for pH maintenance
permits the analysis of NH4+ without interference from PIPES.

Fe(0)-Based-Bioremediation of RDX-Contaminated Groundwater
Project CU1231 Page 49 Year End Report
The reactor was spiked with 12C-RDX and approximately 4.0 uCi of uniformly labeled
14C-RDX. Headspace and aqueous phase were sampled periodically. Concentrations of RDX and
its nitroso transformation products were determined using HPLC-UV at 230 nm wavelenth
(40/60 acetonitrile/ 1.0 g/L ammonium acetate mobile phase in a C-18 column) and a high-grade
analytical standard (RDX) or synthesized laboratory standards (products). N2O was measured
using gas chromatography with an electron capture detector. NH4+ was analyzed using ion
chromatography with auto suppression. HCHO was measured by first derivatizing with a 2,4-
dinitrophenolhydrazine reagent (DNPH) in an acetate buffer agitated at 40 degrees C for one
hour. The HCHO-DNPH derivative was analyzed using HPLC-UV at 360 nm (55/45
acetonitrile/ 1.0 g/L ammonium acetate mobile phase).
To assess whether any 14C radioactivity had sorbed to the surface of green rust or its
transformation solids, 14C was extracted from samples containing the aqueous and solid phases
by sonicating for one hour with acetonitrile. Samples containing only the aqueous phase were
combined with acetonitrile and sonicated as well. Aliquots from both (i) the sonicated aqueous
samples and (ii) the sonicated aqueous and solid phases samples were combined with Ultima-
Gold scintillation cocktail and analyzed by liquid scintillation counting (LSC). 14C radioactivity
was also tracked using a radiochem detector connected in series to the HPLC-UV detector to
correlate peaks containing 14C radioactivity with UV-sensitive HPLC peaks.
Results and Discussion
The disappearance of 44 umoles of RDX within one hour in the presence of sulfate green
rust results in the formation of HCHO, N2O, and NH4+, which appear to be end products (Fig.
23). Trace MNX, DNX, and TNX were also detected within the first few minutes (data not
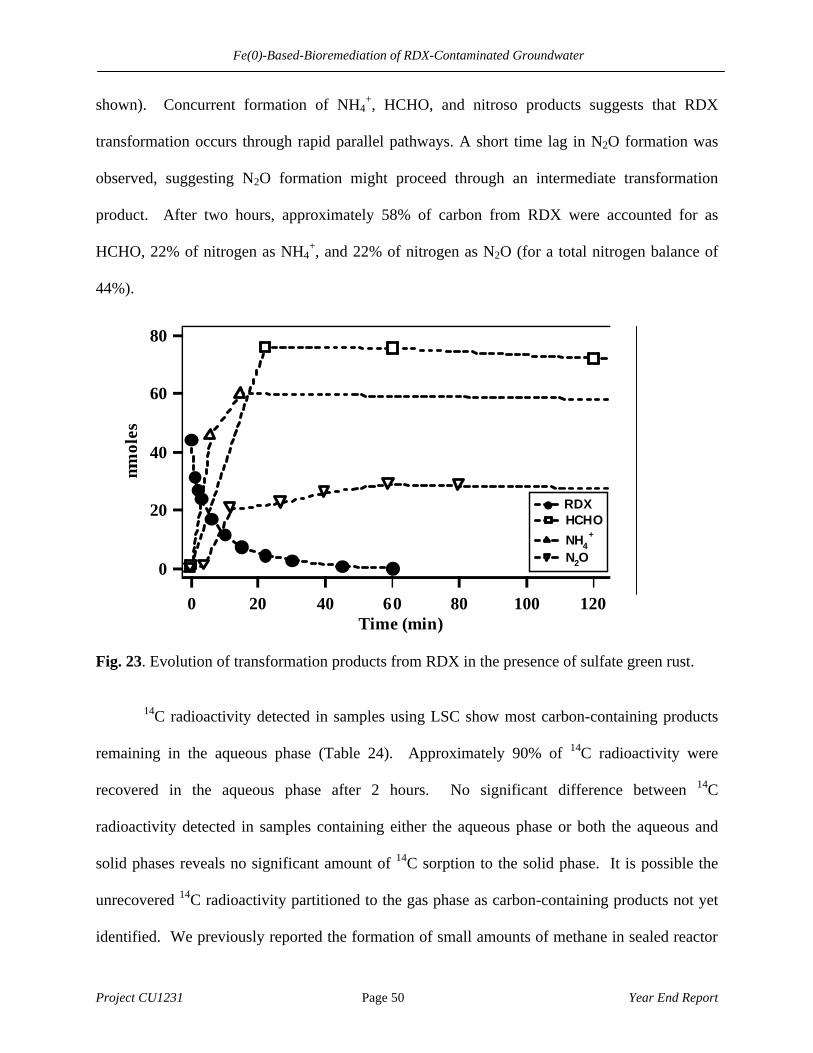
Fe(0)-Based-Bioremediation of RDX-Contaminated Groundwater
Project CU1231 Page 50 Year End Report
shown). Concurrent formation of NH4+, HCHO, and nitroso products suggests that RDX
transformation occurs through rapid parallel pathways. A short time lag in N2O formation was
observed, suggesting N2O formation might proceed through an intermediate transformation
product. After two hours, approximately 58% of carbon from RDX were accounted for as
HCHO, 22% of nitrogen as NH4+, and 22% of nitrogen as N2O (for a total nitrogen balance of
44%).
80
60
40
20
0
µmol
es
120100806040200Time (min)
RDX HCHO
NH4+
N2O
Fig. 23. Evolution of transformation products from RDX in the presence of sulfate green rust.
14C radioactivity detected in samples using LSC show most carbon-containing products
remaining in the aqueous phase (Table 24). Approximately 90% of 14C radioactivity were
recovered in the aqueous phase after 2 hours. No significant difference between 14C
radioactivity detected in samples containing either the aqueous phase or both the aqueous and
solid phases reveals no significant amount of 14C sorption to the solid phase. It is possible the
unrecovered 14C radioactivity partitioned to the gas phase as carbon-containing products not yet
identified. We previously reported the formation of small amounts of methane in sealed reactor
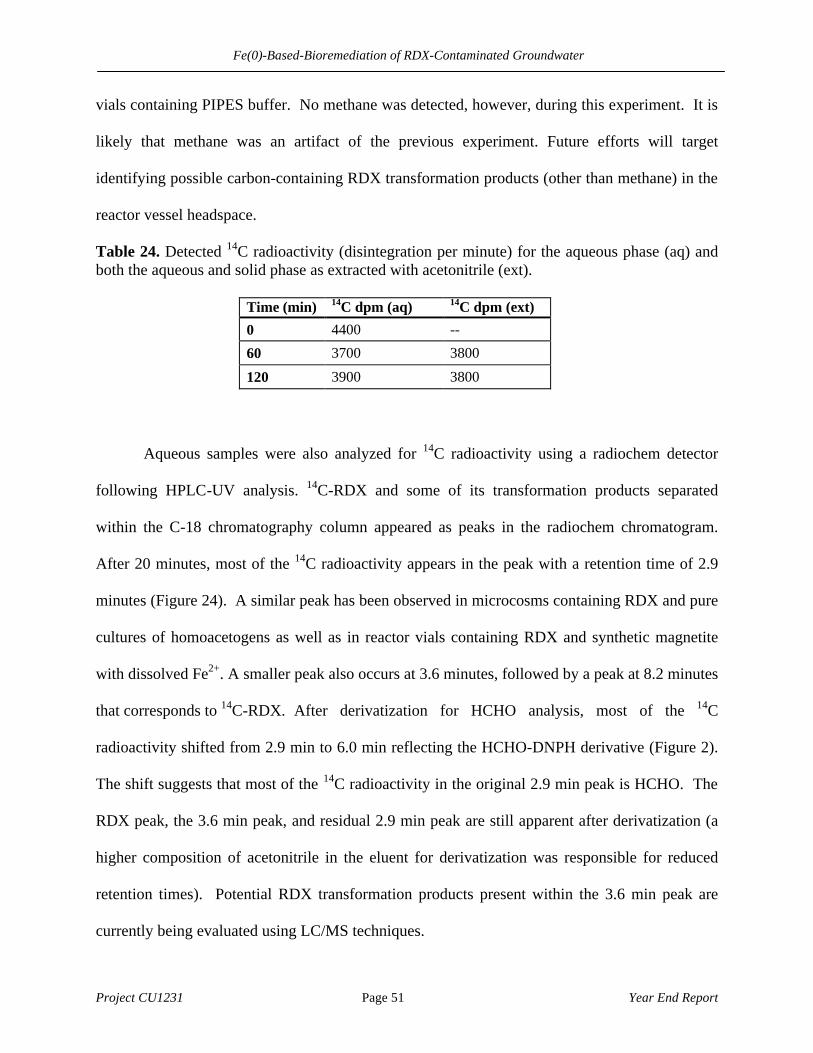
Fe(0)-Based-Bioremediation of RDX-Contaminated Groundwater
Project CU1231 Page 51 Year End Report
vials containing PIPES buffer. No methane was detected, however, during this experiment. It is
likely that methane was an artifact of the previous experiment. Future efforts will target
identifying possible carbon-containing RDX transformation products (other than methane) in the
reactor vessel headspace.
Table 24. Detected 14C radioactivity (disintegration per minute) for the aqueous phase (aq) and both the aqueous and solid phase as extracted with acetonitrile (ext).
Time (min) 14C dpm (aq) 14C dpm (ext)
0 4400 --
60 3700 3800
120 3900 3800
Aqueous samples were also analyzed for 14C radioactivity using a radiochem detector
following HPLC-UV analysis. 14C-RDX and some of its transformation products separated
within the C-18 chromatography column appeared as peaks in the radiochem chromatogram.
After 20 minutes, most of the 14C radioactivity appears in the peak with a retention time of 2.9
minutes (Figure 24). A similar peak has been observed in microcosms containing RDX and pure
cultures of homoacetogens as well as in reactor vials containing RDX and synthetic magnetite
with dissolved Fe2+. A smaller peak also occurs at 3.6 minutes, followed by a peak at 8.2 minutes
that corresponds to 14C-RDX. After derivatization for HCHO analysis, most of the 14C
radioactivity shifted from 2.9 min to 6.0 min reflecting the HCHO-DNPH derivative (Figure 2).
The shift suggests that most of the 14C radioactivity in the original 2.9 min peak is HCHO. The
RDX peak, the 3.6 min peak, and residual 2.9 min peak are still apparent after derivatization (a
higher composition of acetonitrile in the eluent for derivatization was responsible for reduced
retention times). Potential RDX transformation products present within the 3.6 min peak are
currently being evaluated using LC/MS techniques.
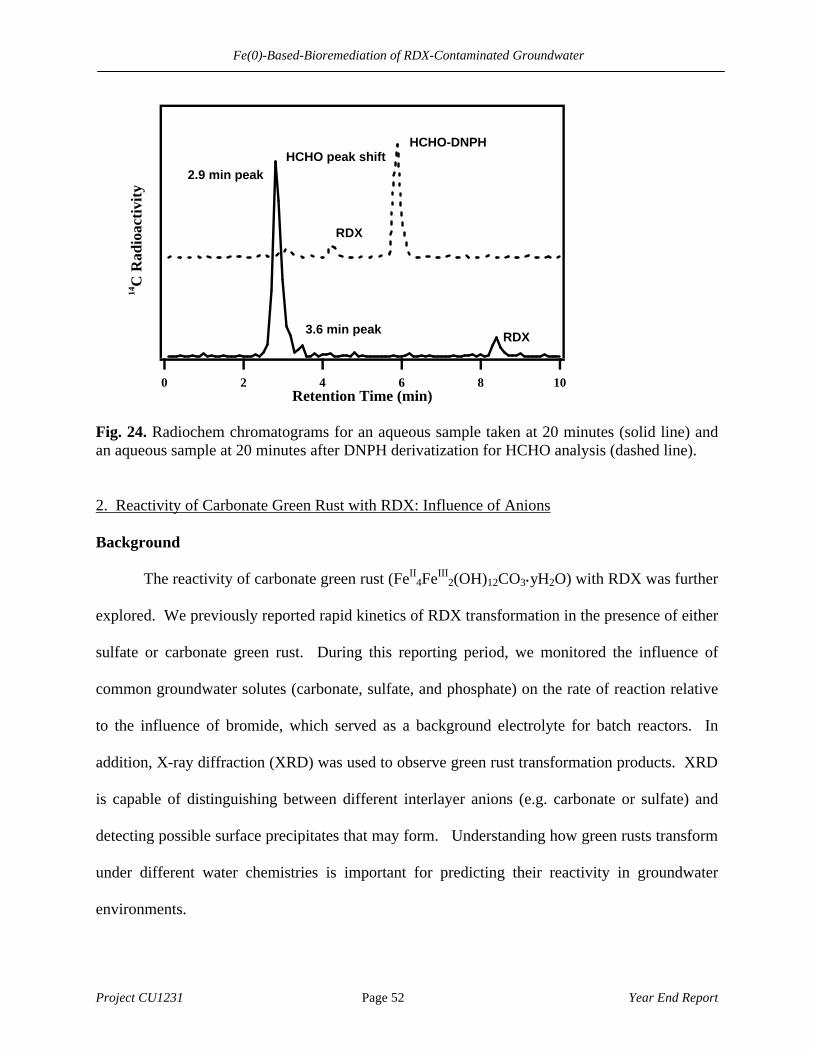
Fe(0)-Based-Bioremediation of RDX-Contaminated Groundwater
Project CU1231 Page 52 Year End Report
14C
Rad
ioac
tivi
ty
1086420Retention Time (min)
2.9 min peak
3.6 min peakRDX
HCHO-DNPHHCHO peak shift
RDX
Fig. 24. Radiochem chromatograms for an aqueous sample taken at 20 minutes (solid line) and an aqueous sample at 20 minutes after DNPH derivatization for HCHO analysis (dashed line).
2. Reactivity of Carbonate Green Rust with RDX: Influence of Anions Background
The reactivity of carbonate green rust (FeII4FeIII
2(OH)12CO3•yH2O) with RDX was further
explored. We previously reported rapid kinetics of RDX transformation in the presence of either
sulfate or carbonate green rust. During this reporting period, we monitored the influence of
common groundwater solutes (carbonate, sulfate, and phosphate) on the rate of reaction relative
to the influence of bromide, which served as a background electrolyte for batch reactors. In
addition, X-ray diffraction (XRD) was used to observe green rust transformation products. XRD
is capable of distinguishing between different interlayer anions (e.g. carbonate or sulfate) and
detecting possible surface precipitates that may form. Understanding how green rusts transform
under different water chemistries is important for predicting their reactivity in groundwater
environments.

Fe(0)-Based-Bioremediation of RDX-Contaminated Groundwater
Project CU1231 Page 53 Year End Report
Materials and Methods
The experiment and sample preparations were conducted within a glovebox under anoxic
conditions. Four batch reactors, each containing RDX (~100 uM), carbonate green rust (4.0
g/L), and a background electrolyte solution with ionic strength of 0.1M were set up to evaluate
the effect of commonly occurring groundwater anions. Bromide was selected as the reference
anion, and the first reactor contained 0.1 M KBr. Subsequent reactors contained 10 mM of either
KHCO3, K2SO4, or KH2PO4 and enough KBr to poise the ionic strength at 0.1M. Carbonate
green rust was synthesized by induced hydrolysis of a combined FeII/FeIII solution (Williams and
Scherer, 2001). A blue-green precipitate was recovered by vacuum-filtering and immediately
freeze-dried. Solution pH was maintained at 7.0 using 1.0 M HBr and 1.0 M KOH.
The aqueous phase was sampled periodically for two hours. Concentrations of RDX
were determined using HPLC-UV at 230 nm wavelenth (40/60 acetonitrile/ 1.0 g/L ammonium
acetate mobile phase in a C-18 column) and a high-grade analytical standard. After two hours,
the solids were filtered and preserved with glycerol for immediate XRD analysis. A sample of
freeze-dried carbonate green rust was also prepared for XRD analysis.
Results and Discussion
In the presence of carbonate green rust, RDX is rapidly removed from solution when
bromide is the sole anion electrolyte (Figure 25). As previously reported, the reaction rate
follows pseudo-first order kinetics. The presence of 10 mM of sulfate or carbonate results in
significantly slower RDX removal. When sulfate or carbonate is present, the reaction kinetics
deviate from pseudo-first order, which suggests an unidentified surface reaction is participating.
Phosphate has a more dramatic effect with no RDX removal observed over a period of 2 hours.
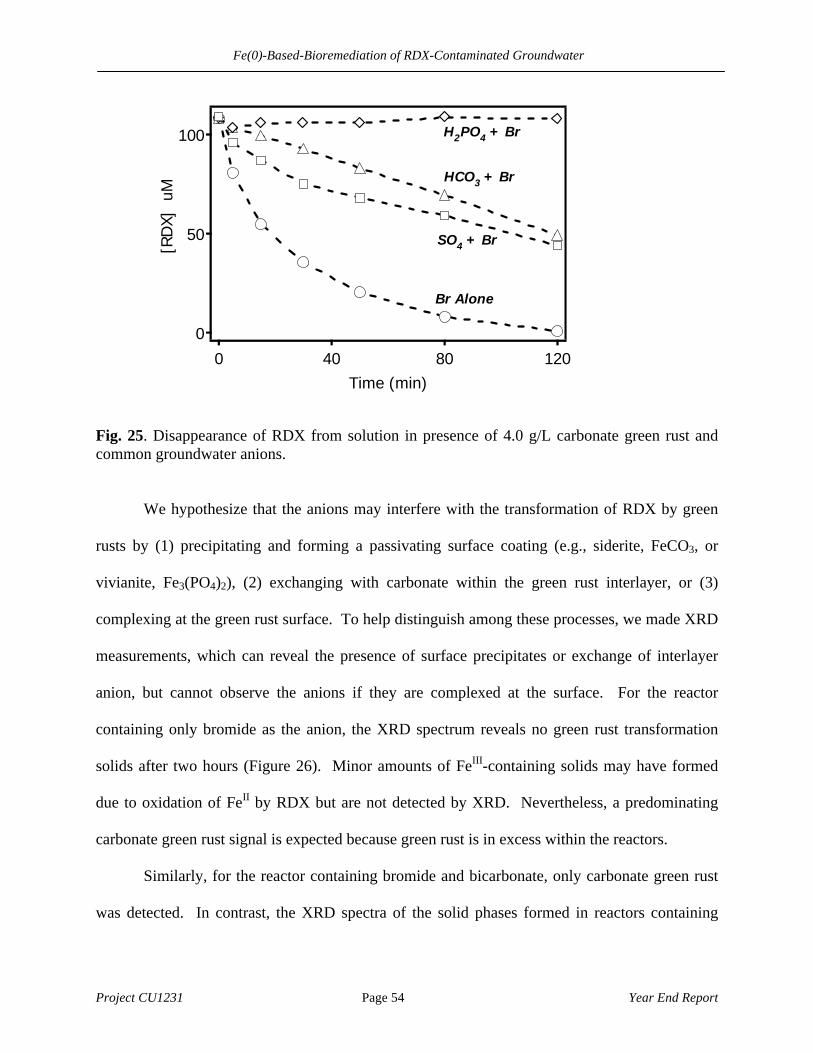
Fe(0)-Based-Bioremediation of RDX-Contaminated Groundwater
Project CU1231 Page 54 Year End Report
100
50
0
[RD
X] uM
12080400Time (min)
H2PO4 + Br
HCO3 + Br
Br Alone
SO4 + Br
Fig. 25. Disappearance of RDX from solution in presence of 4.0 g/L carbonate green rust and common groundwater anions.
We hypothesize that the anions may interfere with the transformation of RDX by green
rusts by (1) precipitating and forming a passivating surface coating (e.g., siderite, FeCO3, or
vivianite, Fe3(PO4)2), (2) exchanging with carbonate within the green rust interlayer, or (3)
complexing at the green rust surface. To help distinguish among these processes, we made XRD
measurements, which can reveal the presence of surface precipitates or exchange of interlayer
anion, but cannot observe the anions if they are complexed at the surface. For the reactor
containing only bromide as the anion, the XRD spectrum reveals no green rust transformation
solids after two hours (Figure 26). Minor amounts of FeIII-containing solids may have formed
due to oxidation of FeII by RDX but are not detected by XRD. Nevertheless, a predominating
carbonate green rust signal is expected because green rust is in excess within the reactors.
Similarly, for the reactor containing bromide and bicarbonate, only carbonate green rust
was detected. In contrast, the XRD spectra of the solid phases formed in reactors containing
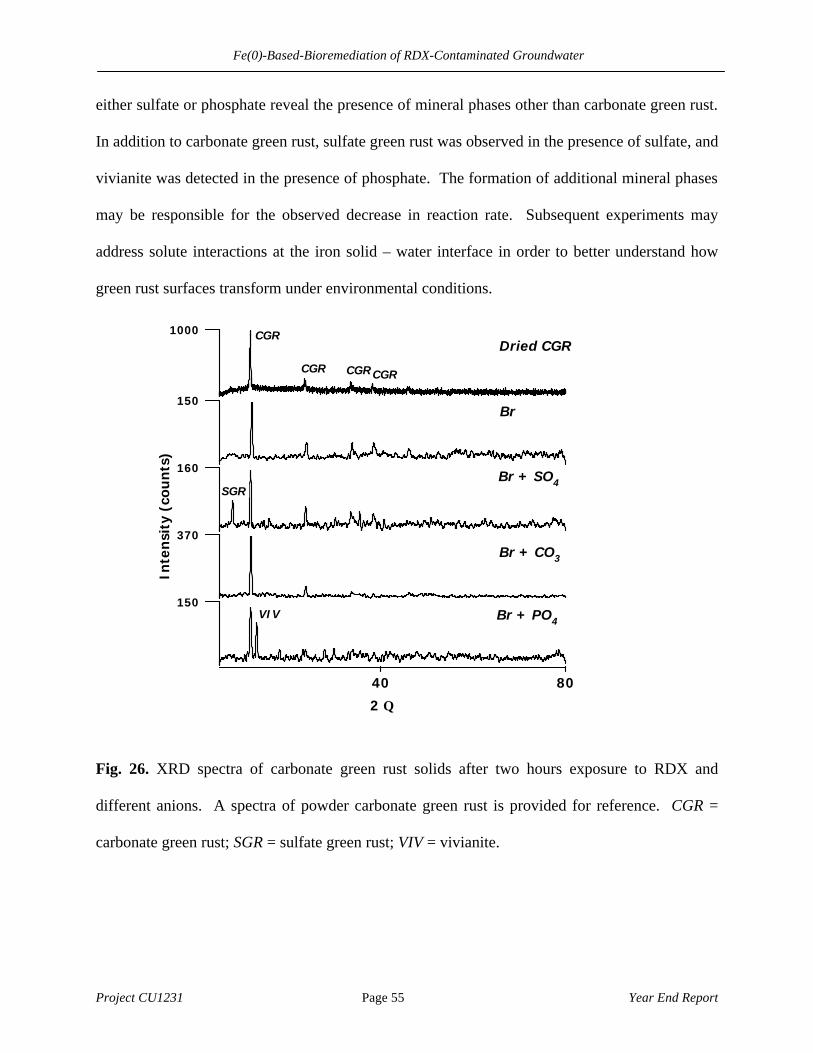
Fe(0)-Based-Bioremediation of RDX-Contaminated Groundwater
Project CU1231 Page 55 Year End Report
either sulfate or phosphate reveal the presence of mineral phases other than carbonate green rust.
In addition to carbonate green rust, sulfate green rust was observed in the presence of sulfate, and
vivianite was detected in the presence of phosphate. The formation of additional mineral phases
may be responsible for the observed decrease in reaction rate. Subsequent experiments may
address solute interactions at the iron solid – water interface in order to better understand how
green rust surfaces transform under environmental conditions.
1000
8040
2 Θ
150
Inte
nsi
ty (
cou
nts
)
160
370
150
Br
Br + SO4
Br + CO3
Br + PO4
CGR
CGR CGR CGR
SGR
VIV
Dried CGR
Fig. 26. XRD spectra of carbonate green rust solids after two hours exposure to RDX and
different anions. A spectra of powder carbonate green rust is provided for reference. CGR =
carbonate green rust; SGR = sulfate green rust; VIV = vivianite.

Fe(0)-Based-Bioremediation of RDX-Contaminated Groundwater
Project CU1231 Page 56 Year End Report
Metabolic Capabilities of Shewanella alga BrY: RDX Utilization N Source
Background
Last year, we reported that the facultative, iron(III)-reducing bacterium Shewanella alga
BrY can degrade RDX, in both the presence and absence of ferric iron. Unlike other genera of
iron reducers (e.g., Geobacter), Shewanella are tolerant to (and respire) oxygen, making them
more adaptable to fluctuating environmental conditions. However, it is important to investigate
how groundwater conditions inhibit or enhance this microbe’s ability to utilize RDX. Since it is
known that BrY cannot mineralize RDX, it is of interest to know just what metabolic niche RDX
fulfills. For instance, if RDX is utilized as a nitrogen source, the presence of a preferential
source like nitrate or ammonia might inhibit the rate at which BrY can degrade RDX.
Materials and Methods
Batch experiments were conducted to determine the ability of BrY to utilize different
nitrogen sources during growth on lactate. Along with a batch containing RDX as the sole
nitrogen source, replicate treatments were amended with either NH4+, NO3
-, or N2(g). The aim
was to determine which nitrogen source best supported BrY growth, and thus which N sources
might be preferentially utilized and inhibit the use of RDX as a nitrogen. A control with BrY
without a nitrogen source was also prepared.
Mineral Medium Preparation. The growth medium contained (in g/L): 0.1 KCl, 0.5
K2HPO4, 10 NaCl, and 7.57 PIPES biological buffer. The pH of the buffered medium was
adjusted to 7.0 with NaOH. Equal amounts of lactate (33 mM), Wolfe’s mineral solution, and
Wolfe’s vitamin solution were added to each batch to fulfill nutrient requirements. Identical
levels of nitrogen were provided in each batch. It was assumed that the three nitrogen atoms
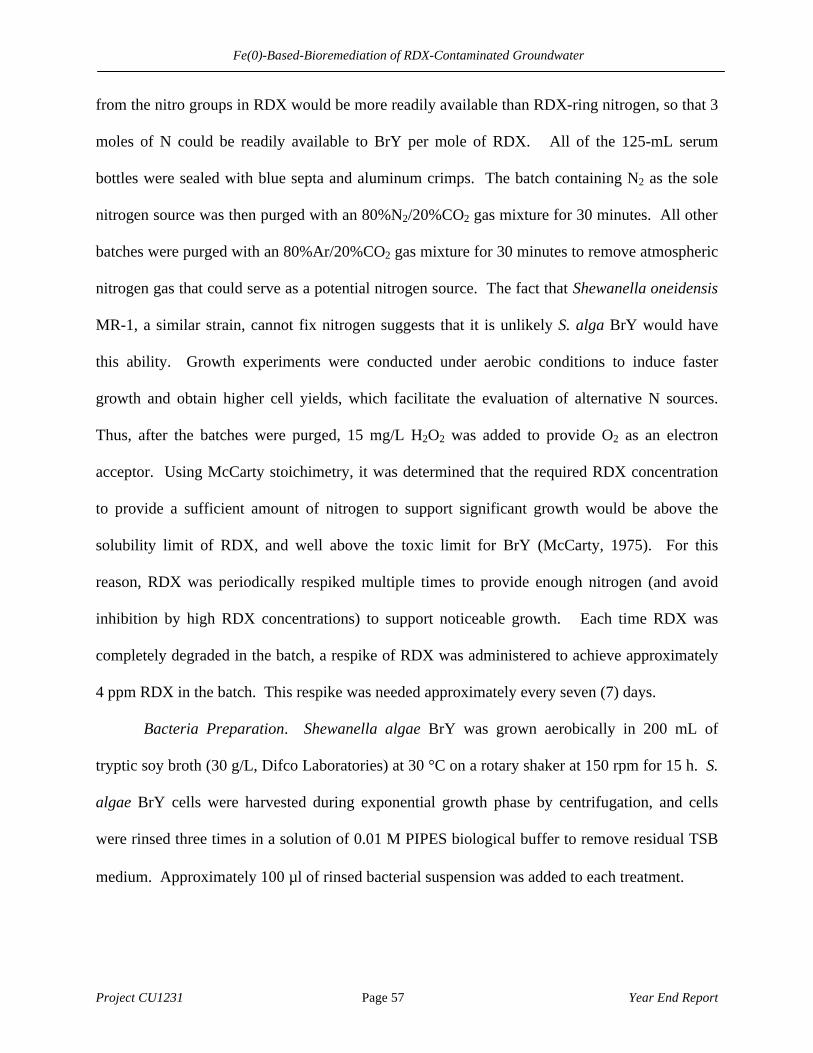
Fe(0)-Based-Bioremediation of RDX-Contaminated Groundwater
Project CU1231 Page 57 Year End Report
from the nitro groups in RDX would be more readily available than RDX-ring nitrogen, so that 3
moles of N could be readily available to BrY per mole of RDX. All of the 125-mL serum
bottles were sealed with blue septa and aluminum crimps. The batch containing N2 as the sole
nitrogen source was then purged with an 80%N2/20%CO2 gas mixture for 30 minutes. All other
batches were purged with an 80%Ar/20%CO2 gas mixture for 30 minutes to remove atmospheric
nitrogen gas that could serve as a potential nitrogen source. The fact that Shewanella oneidensis
MR-1, a similar strain, cannot fix nitrogen suggests that it is unlikely S. alga BrY would have
this ability. Growth experiments were conducted under aerobic conditions to induce faster
growth and obtain higher cell yields, which facilitate the evaluation of alternative N sources.
Thus, after the batches were purged, 15 mg/L H2O2 was added to provide O2 as an electron
acceptor. Using McCarty stoichimetry, it was determined that the required RDX concentration
to provide a sufficient amount of nitrogen to support significant growth would be above the
solubility limit of RDX, and well above the toxic limit for BrY (McCarty, 1975). For this
reason, RDX was periodically respiked multiple times to provide enough nitrogen (and avoid
inhibition by high RDX concentrations) to support noticeable growth. Each time RDX was
completely degraded in the batch, a respike of RDX was administered to achieve approximately
4 ppm RDX in the batch. This respike was needed approximately every seven (7) days.
Bacteria Preparation. Shewanella algae BrY was grown aerobically in 200 mL of
tryptic soy broth (30 g/L, Difco Laboratories) at 30 °C on a rotary shaker at 150 rpm for 15 h. S.
algae BrY cells were harvested during exponential growth phase by centrifugation, and cells
were rinsed three times in a solution of 0.01 M PIPES biological buffer to remove residual TSB
medium. Approximately 100 µl of rinsed bacterial suspension was added to each treatment.

Fe(0)-Based-Bioremediation of RDX-Contaminated Groundwater
Project CU1231 Page 58 Year End Report
Analytical Method. Growth-induced increases in optical density were monitored
spectrophotometrically at a wavelength of 600 nm in a spectrophotometer. Also, as previously
mentioned, RDX levels were monitored in the RDX batch to determine when to respike RDX
without reaching inhibitory levels (ca. 5 mg/L). All reactors were stored at 30 °C on a rotary
shaker at 150 rpm.
Table 25. Description of Microcosms
Treatment Nitrogen Source 1 No nitrogen source provided (control) 2 RDX (C3H6N6O6) 3 Nitrate (NO3
-) 4 Ammonia (NH4
+) 5 Nitrogen gas (N2)
Results and Discussion
Collected data from this experiment did little more than lead to further questions
concerning the metabolic capabilities of S. alga BrY. Statistically significant growth was shown
in all batches. The growth data can be seen below, in figure 27.
Fe(0)-Based-Bioremediation of RDX-Contaminated Groundwater
Project CU1231 Page 59 Year End Report
0
0.02
0.04
0.06
0.08
0.1
0.12
0.14
0.16
0 100 200 300 400 500
Time, hr
OD
NO3- N2 RDX NH4 none
Fig 27. Shewanella alga BrY growth under different nitrogen conditions
These data were counterintuitive because growth occured in controls without nitrogen
salts or RDX (e.g., treatments with N2 in the headspace or no N source added). Apparently, the
PIPES biological buffer (C8H18N2O6S2) served as a nitrogen source. Usually this buffer is used
in biological studies due to the fact that it is considered inert and microbes typically lack the
ability to utilize it as a nutrient source. However, deductive elimination suggests that BrY used it
as N source, which deserves communication to the scientific community. Nevertheless, this
experiment was inconclusive. Due to the slow growth of BrY on RDX, it was not possible to
further evaluate the possible growth of BrY under different nitrogen conditions within the time
constraints of this project.
In addition, N2O(g) levels in batch headspace were monitored by gas chromatography.
This is important to monitor as presence of N2O in the headspace of the RDX batch would

Fe(0)-Based-Bioremediation of RDX-Contaminated Groundwater
Project CU1231 Page 60 Year End Report
suggest RDX ring fision (Hawari et al 2001 ). However, the detection limit for the method used
is approximately 40 µM which is above the expected concentration in the headspace of the batch.
We plan to repeat this experiment with lower headspace volume in relation to the liquid, to
enhance N2O detection. Increasing RDX concentrations to increase N2O production is not a
viable option due to RDX toxicity above 5 ppm.
Integrated Iron PRB with Down Gradient Natural Attenuation
Background
In contaminant remediation, even if active treatment is initially needed, monitored natural
attenuation may be used to complete the cleanup (MacDonald, 2000). Flow-through columns
were started in July 2003 to evaluate the feasibility of an integrated PRB-natural attenuation
approach to intercept and treat RDX plumes. Emphasis was placed on determining the efficacy
of bacteria in soils down gradient of a permeable reactive iron barrier to mineralize byproducts
of RDX that escape the PRB. It would be desirable to show that any byproducts or RDX
reduction by Fe(0) could be completely mineralized by naturally present microbes in the soil, to
demonstrate process robustness and obviate concerns about potential toxicity or recalcitrance of
RDX degradation products that could break through the PRB.
Materials and Methods
Two sets of two columns (15-cm long, 1.0-cm ID) in series each were equipped with inlet
and outlet sampling ports. The first column in each set was packed with a 14-cm layer of
autoclaved sand followed by an 1-cm layer of Master Builder Fe(0) filings (1.0-2.0 mm
diameter sieved) in order to simulate a reactive (thin) iron barrier. The second column in each

Fe(0)-Based-Bioremediation of RDX-Contaminated Groundwater
Project CU1231 Page 61 Year End Report
set was packed with a 15-cm layer of soil collected on the campus of The University of Iowa. A
set of controls was also constructed. The control included two columns (15-cm long, 1.0-cm ID)
connected in series as described above. Both of these columns were packed with inert glass
medium. Flow through the columns was maintained at 1.5 ml/hr, allowing for approximately 40
minutes of contact time in the iron portion of the first column and ten hours of time allowed for
natural attenuation in the soil column. A schematic of the system and its components can be
found in figure 3, below.
èF
low
è
Fig. 28. Flow-through columns used to simulate permeable reactive iron barriers as well
as the natural attenuation of byproducts that takes place downgradient of the PRB.
Iron and Sand Preparation. Iron filings were obtained from Master Builder and sieved
(1.0-2.0 mm diameter) to achieve homogeneity in this portion of the column. In order to pack the
iron/sand column, water was first placed in the column to minimalize air pockets. The sand (14
ml) was then poured into the column and compressed. The iron filings (1 ml) were then added to

Fe(0)-Based-Bioremediation of RDX-Contaminated Groundwater
Project CU1231 Page 62 Year End Report
the top of the column and compressed as much as possible. These compression processes were
included in order to prevent channeling in this first column.
Soil Preparation. Soil for use in these columns was collected from downtown Iowa City,
IA. The soil was allowed to dry for a period of about two (2) days. The soil was then ground
using a mortar and pestal and sieved to provide some homogeneity in the soil column. The soil
was not sterilized to allow naturally occurring microbes to metabolize the RDX byproducts. In
order to pack the soil column, water was first placed in the column to avoid air pockets. The soil
was then poured into the column. The soil was not compressed as this would hinder free flow
through the homogeneous particles.
Groundwater Medium Preparation. The synthetic groundwater medium used in this
study contained (in mg/L): 41.4 NaNO3, 272 K2SO4, 840 NaHCO3, 16.3 NH4Cl, 12.6
MgCL2?6H2O, 0.0087 NaH2PO4?H2O, 0.0100 Ni(NO3)2, 0.0088 ZnSO4? H2O, 0.0081
CoCl2? H2O, 0.0034 MoO3, 0.005 CuSO4. In addition, this medium was amended with
approximately 4 ppm RDX. All columns were allowed two (2) months to acclimate to a
synthetic groundwater medium which was amended with approximately 4 ppm RDX. At this
point, a spike of 14C-RDX (30 µCi in 100 ml of media) was injected to determine the fate of
RDX in the system.
Results and Discussion
The dissolved 14C activity remained unchanged in the control column packed with inert
glass beads (Fig. 4). This suggests that RDX was not transformed in the absence of Fe(0) or
unsterile soil. Both columns containing Fe(0) removed RDX below detectable levels.

Fe(0)-Based-Bioremediation of RDX-Contaminated Groundwater
Project CU1231 Page 63 Year End Report
0
0.2
0.4
0.6
0.8
1
Influent Between Columns Effluent
Port
C/C
0
DIC Fraction RDX Fraction
Unknown Metabolite I Fraction Unknown Metabolite II Fraction
Fig. 29. 14C activity after 3 months operation for control columns packed with inert glass
bead media.
The 14C data shows significant mineralization through the soil column, proving that
natural attenuation down-gradient of a PRB contributes to PRB treatment reliability and
robustness. This corroborates our general hypothesis that RDX can be effectively removed by
iron PRBs and that process performance can be enhanced by the simultaneous of r subsequent
participation of some microorganisms. The contact time through the iron layer was only about
40 minutes, reflecting the high reactivity of Fe(0) towards RDX and suggesting that PRBs that
treat RDX plumes could be thinner than those installed to intercept chlorinated solvents. A
quantitative depiction of these findings is shown below in figure 4.

Fe(0)-Based-Bioremediation of RDX-Contaminated Groundwater
Project CU1231 Page 64 Year End Report
0
0.2
0.4
0.6
0.8
1
Influent Post Fe(0) Col. Post Soil Col.
Port
C/C
0
DIC Fraction RDX Fraction
Unknown Metabolite I Fraction Unknown Metabolite II Fraction
Fig. 30. 14C activity after 3 months operation for experimental columns.
The figure shows how most of the 14C activity is present in an unknown metabolite I after
the iron barrier. This is consistent with data previously reported concerning the reactivity of
RDX and permeable reactive iron barriers. Almost no RDX escape this barrier, and a small
amount of it is mineralized to carbon dioxide in the iron barrier. Most exists as this unknown
metabolite. This metabolite might likely be hydroxylamino-dinitroso-1,3,5-triazine (DNX) or
hydroxylamino-nitroso-1,3,5-triazine (MNX) (Adrian 2001), and this will be determined in the
future.
The 14C activity after the soil column, however, is present mainly as carbon dioxide and a
different unknown metabolite II. This shows that the bacterial population in soil downgradient
of a PRB has the capability to mineralize contaminant byproducts that escape an iron barrier. It
Fe(0)-Based-Bioremediation of RDX-Contaminated Groundwater
Project CU1231 Page 65 Year End Report
is suggested by these data that all escaping compounds might be degraded when allowed
adequate time. This would suggest that in field procedure, monitoring of PRB or RDX need only
show that no RDX escapes the barrier. All byproducts should eventually be naturally attenuated
in the soil downgradient of the PRB.
Furthermore, this study shows that the unknown metabolite produced by from RDX
reduction by Fe(0) is not toxic to microbes in soil, at least not at the levels tested. It should
follow that dilution effects caused by groundwater dispersion should eventually provide a
sufficiently low concentration of this metabolite so that it may be naturally attenuated in soil.
SUMMARY OF MAJOR ACCOMPLISHMENTS
1. Flow-through Fe(0) columns inculated with municipal anaerobic sludge (simulating
bioaugmented permeable reactive barriers) continue to efficiently remove RDX. This
bioaugmented Fe(0) is proving sustainable for treatment of RDX as columns have
now been operation for greater than two years. Analysis of 14C-RDX and soluble 14C
metabolites shows the continued ability of these columns to degrade RDX, and likely
mineralize RDX, after 32 months operation. Investigation of the hydraulic
characteristics of these columns also shows little or no change in the porosity of
biologically active iron columns showing the sustained performance of these
simulated barriers. This provides further evidence of the sustainability of the
combined iron and microbiological community to remain active as an RDX treatment
system.
2. The presence of homoacetogenic bacteria in actively-degrading RDX columns
containing iron has been previously demonstrated. Therefore, the ability of

Fe(0)-Based-Bioremediation of RDX-Contaminated Groundwater
Project CU1231 Page 66 Year End Report
homoacetogenic bacteria to directly utilize RDX was investigated. Experiments
using Acetobacterium paludosum showed that this bacterium was capable of
converting RDX, but was incapable of mineralizing RDX to CO2 and N2O as
previously observed for anaerobic sludge. It has been further proposed that
homoacetogens could conduct primary productivity, converting cathodic hydrogen
and bicarbonate to form acetate. This could be an important role in biological-iron
systems, since acetate could stimulate heterotrophic activity. Batch experiments
show these homoacetogenic bacteria degrade but do not mineralize RDX, and may be
capable of using RDX as a nitrogen source.
3. Batch experiments showed that sulfate green rust, a highly-reactive iron oxide, is
capable of completely degrading RDX. The predominant end-product observed from
these transformations was formaldehyde (HCHO). The recovery of formaldehyde
seems to account for at least one of the previously unidentified RDX soluble
metabolites formed in these RDX-degrading systems. Ammonium (NH4+) and
nitrous oxide (N20) were the predominant nitrogen products recovered in these
experiments.
4. Mineralization assays were conducted with soluble RDX-degradation byproducts
from two different RDX-treatment schemes to assess the potential for natural
attenuation of RDX metabolites that could break through an iron barrier. 14C-labeld
byproducts were obtained from (i) the effluent of a bioaugmented iron column and
(ii) batch reactors with pure cultures of Acetobacterium paludosum. The 14C-labeld
byproducts were mineralized faster and to a greater extent than the 14C-RDX under
both aerobic and anaerobic conditions. Higher extent of mineralization occurred
Fe(0)-Based-Bioremediation of RDX-Contaminated Groundwater
Project CU1231 Page 67 Year End Report
under anaerobic conditions. This is significant as it suggests the potential for
complete mineralization of RDX by an integrated PRB-ZVI with downgradient
natural attenuation scheme.
5. Flow-through columns with bioaugmented Fe(0) (simulating bioaugmented ZVI-
PRB) continue to efficiently remove RDX. Columns containing “aged” iron
(previously reacted with oxidized pollutants other than RDX (Cr(VI), TCE, and
nitrate) were operated for greater than one year. Two columns were bioaugmented
with DIRB Shewanella algae BrY or Geobacter metallireducens GS-15 to investigate
the potential for enhancing the reactivity of aged iron by DIRB through reductive
dissolution of passivating iron oxides or though production of biogenic reactive
minerals. All columns showed complete degradation of RDX that was sustained over
the duration of the experiment and also showed an increase in removal of soluble
RDX-degradation metabolites (likely resulting from mineralization). The greatest
influence of bioaugmentation with DIRB cultures to these columns appears to have
been during the initial months of operation where removal of soluble 14C was
observed more rapidly in bioaugmented columns. Nonetheless, the ability of DIRB to
affect complete mineralization (by generating reactive iron species) in zones
downstream of a permeable reactive iron barrier requires further investigation.
6. Production of nitrous oxide (N2O) was confirmed for the homoacetogen,
Acetobacterium paludosum incubated with RDX, suggesting cleavage of the RDX
ring. A. paludosum was also apparently able to utilize RDX as a nitrogen source, and
RDX degradation was inhibited by NH4+, a more labile N source.

Fe(0)-Based-Bioremediation of RDX-Contaminated Groundwater
Project CU1231 Page 68 Year End Report
7. Batch studies were conducted to determine the ability of BrY to utilize RDX as a
nitrogen source. It was found that BrY can utilize the PIPES biological buffer as a
nitrogen source, which confounded interpretation of the results. The presence of this
buffer in previous experiments might have inhibited the rate of RDX degradation by
BrY.
8. Flow-through columns consisting of a Fe(0) column preceding a column packed with
unsterilized soil were conducted to evaluate the feasibility of an integraded PRB-
natual attenuation approach to intercept and treat RDX plumes. This study showed
that byproducts of RDX reduction by Fe(0) that might escape a PRB can be readily
mineralized by microbes naturally found in soil. This suggests that natural
attenuation of RDX byproducts increases the robustness of PRBs, and that relatively
thin (and less costly) barriers could be installed to transform RDX and promote its
subsequent microbial mineralization.
.
PUBLICATIONS FROM THIS GRANT
Journal Articles
Oh B-T and P.J.J. Alvarez (2003). Removal of explosives using an integrated Fe0-microbial
treatment in flow-through columns. Bulletin of Environmental Contamination and
Toxicology (Submitted)
Ginner J.L., P.J.J. Alvarez, S.L. Smith, and M.M. Scherer (2003). Nitrate and Nitrite reduction
by Fe0: influence of mass transport, temperature, ph, and denitrifying microbes. Environ.
Eng. Sci. (In press).

Fe(0)-Based-Bioremediation of RDX-Contaminated Groundwater
Project CU1231 Page 69 Year End Report
Oh B-T and P.J.J. Alvarez (2002). Hexahydro-1,3,5-Trinitro-1,3,5-Triazine (RDX) degradation
in biologically active iron columns. Water, Air Soil and Soil Pollution 141 (1-4): 325-
335.
Oh, B-T., C.L. Just, and P.J.J. Alvarez (2001). Hexahydro-1,3,5-Trinitro-1,3,5-Triazine (RDX)
mineralization by zero-valent iron and mixed anaerobic cultures. Environ. Sci. Technol.
35(21):4341-4346
Abstracts, Conference Proceedings, and Presentations
Sutton B. and P. J.J. Alvarez (2004). RDX degradation by Shewanella algae BrY and by its
biogenic iron mineral. Proc. In Situ and On-Site Bioremediation: 4th International
Conference of Chlorinated and recalcitrant Compounds, Monterey, CA, May 24-27,
2004.
Shrout J.S., P. Larese-Casanova, M. M. Scherer, and P. J.J. Alvarez (2004). Sustained RDX
degradation in bioaugmented, simulated Fe(0) permeable reactive barriers. Proc. In Situ
and On-Site Bioremediation: 4th International Conference of Chlorinated and recalcitrant
Compounds, Monterey, CA, May 24-27, 2004.
Diels L., L. Bastiaens, S. O’Hannessin, J. L. Cortina, P. J. Alvarez, M. Ebert, and H. Schad
(2003). Permeable Reactive Barriers: a multidisciplinary approach of a new emerging
sustainable groundwater treatment technology. Proc. ConSoil2003. Ghent, Belgium, May
12-16, 2003.
Gregory K.B., A.B. Williams., P.J.J. Alvarez, G.F. Parkin, and M.M. Scherer (2003). RDX
transformation in the presence of ferrihydrite and Geobacter metallireducens GS-15.

Fe(0)-Based-Bioremediation of RDX-Contaminated Groundwater
Project CU1231 Page 70 Year End Report
Proc. In Situ and On-Site Bioremediation: 7th International Symposium, Orlando, FL,
June 2-5, 2003.
Gregory, K. B., B.-T. Oh, P. J. J. Alvarez, M. M. Scherer and G. F. Parkin (2001).
Biogeochemical Removal of RDX Using Iron Oxide and Geobacter metallireducens GS-
15. Proc. In Situ and On Site Bioremediation: 6th International Symposium, San Diego,
CA June 4-7, 2001.
Scherer M.M., P. Larese-Casanova, K.B. Gregory, P.J. Alvarez, and G.F. Parkin (2003). Fate of
RDX in the presence of reduced Fe oxides. “In Preprints Extended Abstracts (Env. Chem.
Division), American Chemical Society, 225th National Meeting, New Orleans, LA

Fe(0)-Based-Bioremediation of RDX-Contaminated Groundwater
Project CU1231 Page 71 Year End Report
2003 MILESTONES Project No. CU1231
Planned Completion Status Task 1: Pathway Analysis—Identification of Unknown Metabolite(s) 1.0 Partitioning Characteristics (Volatility and Kow) 4/2003 Completed 2.0 LC/MS Analysis of Metabolite 12/2003 Completed Task 2: Column Studies—Evaluate Column Efficiency and Sustainability 1.0 Monitor RDX Removal and Mineralization 12/2003 Completed
2.0 Determine Final RDX and Byproduct Concentration Profiles (in Aged Fe(0) Columns) 3/2003 Completed
3.0 Determine Changes in Effective Porosity and Dispersion 12/2003 Completed
4.0 Evaluate Efficacy of Integrated Fe(0) Barrier-Monitored Natural Attenuation to remove RDX byproducts 12/2003 Completed
Task 3: RDX degradation by Iron Oxides 1.0 Degradation of RDX by Reduced Fe Minerals 9/2003 Completed Task 4: Characterization of a Microbial Community in Fe(0) Samples 1.0 Characterize Bacterial Community by DGGE 6/2003 Completed 2.0 Characterize Iron Oxides by Mössbauer 6/2003 Completed 3.0 Investigation of Homoacetogens 7/2003 Completed 4.0 Investigation of Shewanella algae BRY 12/2003 Completed
Fe(0)-Based-Bioremediation of RDX-Contaminated Groundwater
Project CU1231 Page 72 Year End Report
REFERENCES
Adrian, N. R. and T. Chow (2001). Identification of hydroxylamino-dinitroso-1,3,5-triazine as a transient intermediate formed during the anaerobic biodegradation of hexahydro-1,3,5-trinitro-1,3,5-triazine. Environmental Toxicology and Chemistry 20: 1874-1877.
Adrian, N. R. and A. Lowder (1999). Biodegradation of RDX and HMX by a methanogenic enrichment culture. Bioremediation of Nitroaromatic and Haloaromatic Compounds. B. C. Alleman and A. Leeson. Columbus, OH, Battelle Press: 1-6.
Ampleman, G., S. Thiboutot, J. Lavigne, A. Marois, J. Hawari, A. M. Jones and D. Rho (1995). Synthesis of C-14-labeled hexahydro-1,3,5-trinitro-1,3,5-triazine (RDX), 2,4,6-trinitrotoluene (TNT), nitrocellulose (NC) and glycidylazide Polymer (GAP) for use in assessing the biodegradation potential of these energetic compounds. Journal of Labeled Compounds & Radiopharmiceuticals 36: 559-577.
Bhushan, B., A. Halasz, J. Spain, S. Thiboutot and J. Hawari (2002). Biotransformation of hexahydro-1,3,5-trinitro-1,3,5-triazine by a NAD(P)H: Nitrate oxidoreductase from Aspergilus niger. Environmental Science and Technology (in press).
Das, A. and F. Caccavo, Jr. (2000). Dissimilatory Fe(III) oxide reduction by Shewanella alga BrY requires adhesion. Current Microbiology 40: 344-347.
Fredrickson, J. K. and Y. A. Gorby (1996). Environmental process mediated by iron-reducing bacteria. Current Opinion in Biotechnology 7: 287-294.
Good, N. E. and S. Izawa (1968). Hydrogen ion buffers. A. San Pietro. New York, Academic. 24: 53-68.
Gorby, Y. A., and H. Jr., Bolton (1993). Effects of O2 on metal-reductase activity and cytochrome content in a facultative Fe(III)-reducing bacterium. Abstracts of the Annual Meeting of the American Society for Microbiology 37.
Gregory, K. B., B.-T. Oh, M. M. Scherer, G. F. Parkin and P. J. J. Alvarez (2000). Biogeochemical degradation of redox-sensitive compounds using iron oxide and Geobacter metallireducens GS-15. 220th American Chemical Society National Meeting, Washingto D.C., ACS.
Gregory, K. B., M. Von Arb, P. J. J. Alvarez, M. M. Scherer and G. F. Parkin (2001). Biogeochemical removal of RDX using iron oxide and Geobacter metallireducens GS-15. Bioremediation of Energetics, Phenolics, and Polycyclic Aromatic Hydrocarbons. V. S. Magar, G. Johnson, S. K. Ong and A. Leeson. Colombus, OH, Battelle Press: 1-9.
Gu, B.; Phelps, T. J.; Liang, L.; Dickey, M. J.; Roh, Y.; Kinsall, B. L.; Palumbo, A. V.; Jacobs, G. K. 1999. Biogeochemical dynamics in zero-valent iron columns: Implications for permeable reactive barriers. Environ Sci Technol 33:2170-2177.
Halasz, A., J. Spain, L. Paquet, C. Beaulieu and J. Hawari (2002). Insights into the formation and degradation mechanisms of methylenedinitramine during the incubation of RDX with anaerobic sludge. Enironmental Science and Technology 36(4): 633-638.
Hawari, J., A. Halasz, T. W. Sheremata, S. Beaudet, C. Groom, L. Paquet, C. Rhofir, G. Ampleman and S. Thiboutot (2000). Characterization of metabolites during biodegradation of hexahydro-1,3,5-trinitro-1,3,5-triazine (RDX) with municipal anaerobic sludge." Applied and Environemntal Microbiology 66(6): 2652-2657.
Hofstetter, T. B., C. G. Heijman, S. B. Haderlein, C. Holliger and R. P. Schwarzenbach (1999). Complete reduction of TNT and other (poly)nitroaromatic compounds under iron-reducing subsurface conditions. Environmental Science and Technology 33: 1479-1487.
Fe(0)-Based-Bioremediation of RDX-Contaminated Groundwater
Project CU1231 Page 73 Year End Report
Kotsyurbenko, O. R. et al. (1995). New species of psychrophilic acetogens: Acetobacterium bakii sp. nov., A. paludosum sp. nov., A. fimetarium sp. nov. Arch. Microbiol. 163: 29-34.
Lovley, D. R, S. Giovannoni, J. D. White, C. J. Champine, E. J. P. Phillips, Y. A. Gorby and S. Goodwin (1993). Geobacter metallireducens, gen. nov. sp. nov., a microorganism capable of coupling the complete oxidation of organic compounds to the reduction of iron and other metals. Archies of Microbiology 159: 336-344.
Lovley, D. R. and E. J. P. Phillips (1986). Organic matter mineralization with reduction of ferric iron in anaerobic sediments. Applied and Environmental Microbiology 52(4): 682-689.
Lovley, D. R. and E. J. P. Phillips (1986). Availability of Ferric Iron for microbial reduction in bottom sediments of the freshwater Tidal Potomac River. Applied and Environmental Microbiology 52(4):751-757.
McCormick, M. L. and E. J. Bouwer (2002). Carbon tetrachloride transformation in a model iron-reducing culture: Relative kinetics of biotic and abiotic reactions. Environmental Sceience and Technology 36(3): 403-410.
Oh, B. -T., C. L. Just and P. J. J. Alvarez (2001). Hexahydro-1,3,5-trinitro-1,3,5-triazine mineralization by zerovalent iron and mixed anaerobic cultures. Enironmental Science and Technology 35(21): 4341-4346.
Oh, B. –T and P. J. Alvarez (2002). Hexahydro-1,3,5-trinitro-1,3,5-triazine (RDX) degradation in biologically-active iron columns. Water, Air and Soil Pollution 141: (in press).
Rajagopal, B. S. and J. LeGall (1989). Utilization of cathodic hydrogen by hydrogen-oxidizing bacteria. Applied Microbiology and Biotechnology 31: 406-412.
Reardon, E. J. 1995. Anaerobic Corrosion of Granular Iron - Measurement and Interpretation of Hydrogen Evolution RatesEnviron Sci Technol 29 : 2936-2945.
Sheremata, T. W. and J. Hawari (2000). Mineralization of RDX by the white rot fungus Phanerochaete chrysosporium to carbon dioxide and nitrous oxide. Environmental Science and Technology 34: 3384-3388.
Stookey, L. L. (1970). Ferrozine-a new spectrophotometric reagent for iron. Anal. Chem. 42: 779-781.
Taylor, R. M. (1980). Formation and properties of Fe(II)Fe(III) hydroxy-carbonate and its possible significance in soil formation. Clay Minerals 15: 369-382.
Vikesland, P. J. and R. L. Valentine (2000). Reaction pathways involved in the reduction of monochloramine by ferrous iron. Environmental Science and Technology 34(1): 83-90.
von Gunten U. and J. Zobrist (1993). Biogeochemical changes in groundwater-infiltration systems: columns studies. Geochim. Cosmochim. Acta 57: 3895-3906.
Warren, L. A. and G. F. Ferris (1998). Continuum between sorption and precipitation of Fe(III) on microbial surfaces. Environmental Science and Technology 32(15): 2331-2337.
Williams, A. G. B. and M. M. Scherer (2001). Kinetics of Cr(VI) reduction by carbonate green rust. Environmental Science & Technology 35(17): 3488-3494.
Zhao JS, Halasz A, Paquet L, Beaulieu C, Hawari J. 2002. Biodegradation of hexahydro-1,3,5-trinitro-1,3,5-triazine and its mononitroso derivative hexahydro-1-nitroso-3,5-dinitro-1,3,5-triazine by Klebsiella pneumoniae strain SCZ-1 isolated from an anaerobic sludge. Appl Environ Microbiol. 68(11):5336-41.


