
Feasibility study: Ljusdal, Zweden
No. Unit No.
0.0.0 General Information Convert currency to €0.0.1 Country Sweden0.0.2 Startyear 20170.0.3 Date 6-3-2017 13:37 5.7.0 Average social security costs0.0.4 Name Client 15,0% on top of the monthly wage0.0.5 Adress
0.0.6 Postal code 0.0.7 Place 5.7.0 Employee accident insurance
2,5% on top of the monthly wageELECTRICITY GRID POWERED GREENHOUSE
5.7.0 Yearly increase of labour costs3.0.0 Financial structure 5.7.0 Production labour costs 2,0%
3.1.0 Total to finance capital 21.948.800 €3.1.1 Investment costs in Dutch hardware 17.923.800 € 5.8.0 Technology labour costs 2,0%3.1.2 Investment in local infrastructure 2.750.000 € 5.9.0 Organisation labour costs 2,0%3.1.4 Working capital during operation 1.275.000 € 5.10.0 Management labour costs 2,0%
3.2.1 Own contribution 4.800.000 €3.2.2 Long term loan bank (amount of loan) 17.148.800 € 5.11.0 Other production costs Yearly increase 3.3.0 Interest rate per year (bank) 5,0% 5.11.1 Crop control (pesticides) 1,00 €/m^2 2,0%3.4.0 Interest rate per year (own loan) 7,0% Crop control (pesticides) 0,067 €/kg
5.11.2 Fertilisers 1,75 €/m^2 2,0%Fertilisers 0,118 €/kg
4.0.0 Revenues 5.11.3 Polinators and Predators 0,50 €/m^2 2,0%4.0.0 Square meters 75.000 m2 Polinators and Predators 0,034 €/kg
4.3.0 Average sellingpricelevel tomato (excl VAT) 1,786 €/kg 5.11.4 Tomato plants totaal 290.000 € 2,0%Yearly selling price increase 2,0% Tomato plants per kilo 0,052 €/kg
Tomato plants per m^2 3,87 €/m^24.6.0 Average sellingpricelevel electricity 0,000 €/kWh 5.11.5 Dirt cover, ropehooks and rockwool 90.000 € 2,0%
Yearly price increase electricity 0,0% Dirt cover, ropehooks and rockwool 0,016 €/kg4.9.0 Average sellingpricelevel heat 0,000 €/kWh 5.11.6 Leasing land 0 €/m^2 0,0%
Yearly price increase electricity 0,0% Leasing land #DEEL/0! €/kg5.11.7 Small materials 10.000 € 2,0%
Small materials 0,002 €/kg5.2.0 Energy and water Costs 5.11.8 Other costs 0,05 €/kg 2,0%
5.2.1 Gas price 0,000 €/m^35.2.2 Electricity price 0,045 €/kWh5.2.3 Water price 0,000 €/m^3 5.12.0 Selling costs Yearly increase 5.2.4 Sewage water price 0,000 €/m^3 5.12.1 Packing costs 0,020 €/kg 2,0%5.2.5 Heat price 0,020 €/kWh Price packing 0,1 €5.2.6 CO2 0,080 €/kg Capacity packing 5 kg
Yearly increase gas/water/electricity/water 2,0% 5.12.2 Transport costs 0,025 €/kg 2,0%Drive distance transport (km) 250 km
5.12.3 Sales commission 0,00 €/kg 2,0%
Labour costs5.7.0 Production labour 5.13.0 General costs Yearly increase
5.7.1 Labourers in production 2.200 €/month 5.13.1 Administration costs 50.000 €/yr 2,0%5.7.2 Labourers in packing/grading 2.200 €/month 5.13.2 Office expenses 5.000 €/yr 2,0%5.7.3 Internal drivers/sprayers 2.200 €/month 5.13.3 Canteen costs 5.000 €/yr 0,0%5.7.4 Local grower 7.000 €/month 5.13.4 Insurance costs 131.693 €/yr
% of total value 0,6% 2,0%5.8.0 Technology labour 5.13.5 Property tax 165.390 €/yr
5.8.1 Maitenance 2.500 €/month % of total value 0,8% 0,0%5.8.2 Mechanical technician 2.500 €/month 5.13.6 Unforeseen 2,0 % 0,0%5.8.3 Electrical technician 2.500 €/month 5.13.7 Promotion costs 50.000 €/year 2,0%5.8.4 Electronic engineer 2.500 €/month5.8.5 Other 0 €/month
5.14.0 Maintenance Yearly increase 5.9.0 Organisation labour 5.14.1 Maintenance of all assets except CHP 0,6% 5,0%
5.9.1 Salesman 7.000 €/month 5.14.2 CHP maintenance - €/MWh 0%5.9.2 Bookkeeping 2.500 €/month5.9.3 Assitant bookkeeping 2.000 €/month5.9.4 Secretary 1.800 €/month 6.5.0 Profit taxes5.9.5 Cantine/cleaning 2.000 €/month 6.5.1 Profit Tax 22,0 %5.9.6 Driver 0 €/month
6.7.0 Import and Taxes
5.10.0 Management labour 6.7.1 Import duties 0,0 %5.10.1 Management 10.000 €/month 6.7.2 VAT (imported materials) 0,0 %
5.10.2 Experienced grower 0 €/month 6.7.3 VAT (local investments) 0,0 %
0. Parameter page
1
Feasibility study: Ljusdal, Zweden
2017
No. International investments Unit total price per m2
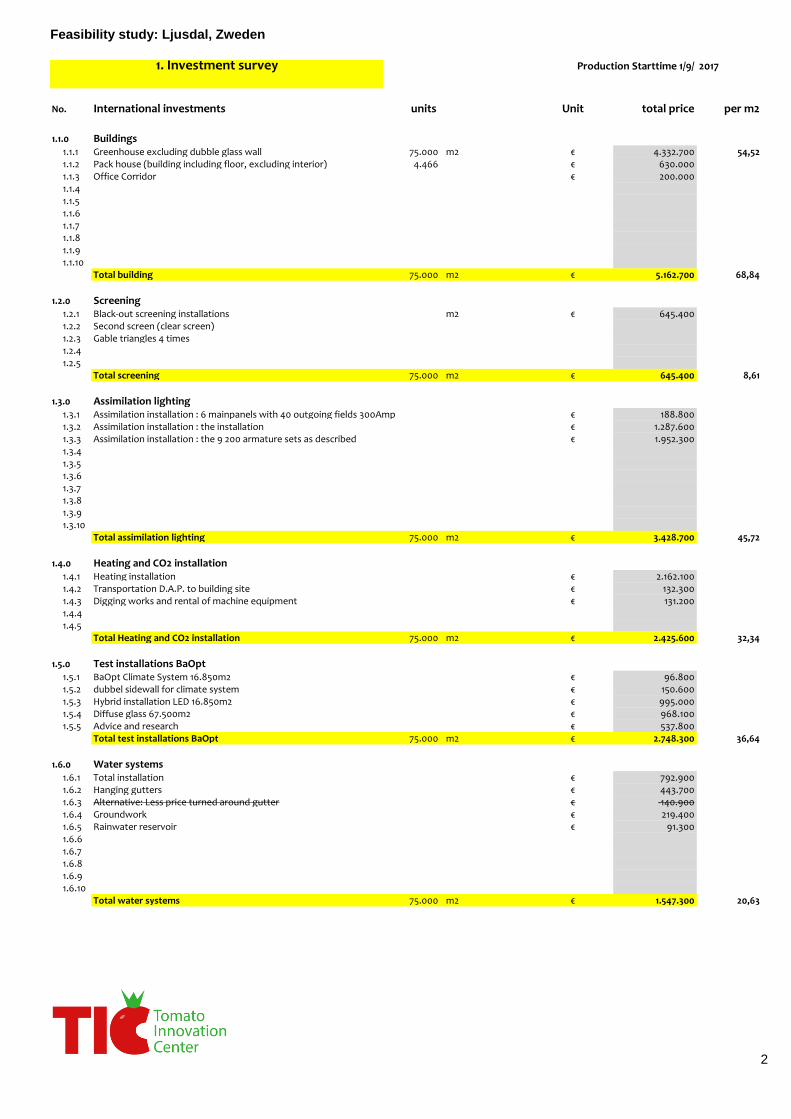
1.1.0 Buildings1.1.1 Greenhouse excluding dubble glass wall 75.000 m2 € 4.332.700 54,521.1.2 Pack house (building including floor, excluding interior) 4.466 € 630.0001.1.3 Office Corridor € 200.0001.1.41.1.51.1.61.1.71.1.81.1.91.1.10
Total building 75.000 m2 € 5.162.700 68,84
1.2.0 Screening1.2.1 Black-out screening installations m2 € 645.4001.2.2 Second screen (clear screen)1.2.3 Gable triangles 4 times1.2.41.2.5
Total screening 75.000 m2 € 645.400 8,61
1.3.0 Assimilation lighting 1.3.1 Assimilation installation : 6 mainpanels with 40 outgoing fields 300Amp € 188.8001.3.2 Assimilation installation : the installation € 1.287.6001.3.3 Assimilation installation : the 9 200 armature sets as described € 1.952.3001.3.41.3.51.3.61.3.71.3.81.3.91.3.10
Total assimilation lighting 75.000 m2 € 3.428.700 45,72
1.4.0 Heating and CO2 installation1.4.1 Heating installation € 2.162.1001.4.2 Transportation D.A.P. to building site € 132.3001.4.3 Digging works and rental of machine equipment € 131.2001.4.41.4.5
Total Heating and CO2 installation 75.000 m2 € 2.425.600 32,34
1.5.0 Test installations BaOpt1.5.1 BaOpt Climate System 16.850m2 € 96.8001.5.2 dubbel sidewall for climate system € 150.6001.5.3 Hybrid installation LED 16.850m2 € 995.0001.5.4 Diffuse glass 67.500m2 € 968.1001.5.5 Advice and research € 537.800
Total test installations BaOpt 75.000 m2 € 2.748.300 36,64
1.6.0 Water systems1.6.1 Total installation € 792.9001.6.2 Hanging gutters € 443.7001.6.3 Alternative: Less price turned around gutter € -140.9001.6.4 Groundwork € 219.4001.6.5 Rainwater reservoir € 91.3001.6.61.6.71.6.81.6.91.6.10
Total water systems 75.000 m2 € 1.547.300 20,63
Production Starttime 1/9/1. Investment survey
units
2
Feasibility study: Ljusdal, Zweden
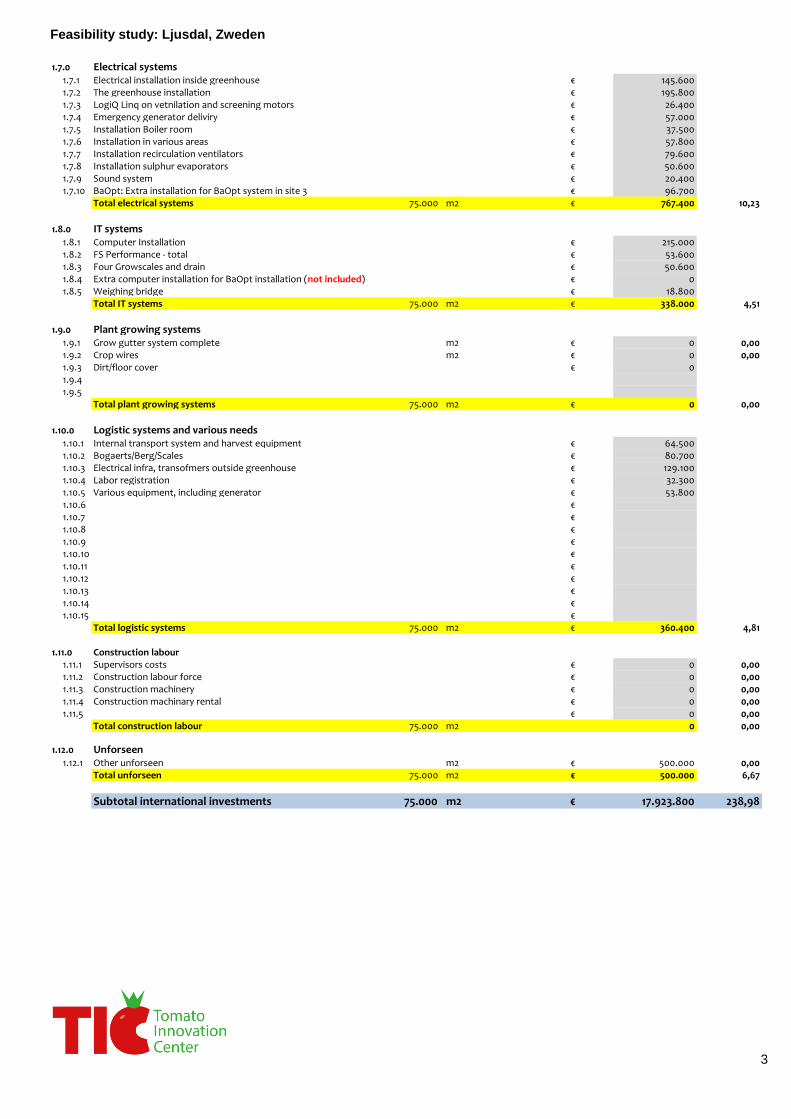
1.7.0 Electrical systems1.7.1 Electrical installation inside greenhouse € 145.6001.7.2 The greenhouse installation € 195.8001.7.3 LogiQ Linq on vetnilation and screening motors € 26.4001.7.4 Emergency generator deliviry € 57.0001.7.5 Installation Boiler room € 37.5001.7.6 Installation in various areas € 57.8001.7.7 Installation recirculation ventilators € 79.6001.7.8 Installation sulphur evaporators € 50.6001.7.9 Sound system € 20.4001.7.10 BaOpt: Extra installation for BaOpt system in site 3 € 96.700
Total electrical systems 75.000 m2 € 767.400 10,23
1.8.0 IT systems1.8.1 Computer Installation € 215.0001.8.2 FS Performance - total € 53.6001.8.3 Four Growscales and drain € 50.6001.8.4 Extra computer installation for BaOpt installation (not included) € 01.8.5 Weighing bridge € 18.800
Total IT systems 75.000 m2 € 338.000 4,51
1.9.0 Plant growing systems 1.9.1 Grow gutter system complete m2 € 0 0,001.9.2 Crop wires m2 € 0 0,001.9.3 Dirt/floor cover € 01.9.41.9.5
Total plant growing systems 75.000 m2 € 0 0,00
1.10.0 Logistic systems and various needs1.10.1 Internal transport system and harvest equipment € 64.5001.10.2 Bogaerts/Berg/Scales € 80.7001.10.3 Electrical infra, transofmers outside greenhouse € 129.1001.10.4 Labor registration € 32.3001.10.5 Various equipment, including generator € 53.8001.10.6 €1.10.7 €1.10.8 €1.10.9 €1.10.10 €1.10.11 €1.10.12 €1.10.13 €1.10.14 €1.10.15 €
Total logistic systems 75.000 m2 € 360.400 4,81
1.11.0 Construction labour1.11.1 Supervisors costs € 0 0,001.11.2 Construction labour force € 0 0,001.11.3 Construction machinery € 0 0,001.11.4 Construction machinary rental € 0 0,001.11.5 € 0 0,00
Total construction labour 75.000 m2 0 0,00
1.12.0 Unforseen1.12.1 Other unforseen m2 € 500.000 0,00
Total unforseen 75.000 m2 € 500.000 6,67
Subtotal international investments 75.000 m2 € 17.923.800 238,98
3

Feasibility study: Ljusdal, Zweden
No. Local investments units total price per m2
1.13.0 Ground works1.13.1 Purchase land € 250.000 0,001.13.2 Excavation work € 80.0001.13.3 Road and parkinglots € 150.0001.13.4 Concrete works (path and floors,loding dock) € 150.0001.13.51.13.61.13.7
Total ground works 75.000 m2 € 630.000 8,40
1.14.0 Connections1.14.1 Infrastructure energy € 200.0001.14.2 Ground (work digging for pipes) € 100.0001.14.31.14.41.14.51.14.61.14.7
Total connections 75.000 m2 € 300.000 4,00
1.15.0 Housing1.15.1 Cooling installation packhouse € 40.0001.15.2 Interior: lunchroom/office/restroom etc € 100.0001.15.3 €1.15.41.15.51.15.61.15.7
Total housing 75.000 m2 € 140.000 1,87
1.16.0 Construction labour1.16.1 Supervisors costs € 01.16.2 Construction labour force € 01.16.3 Construction machinary € 01.16.4 Construction machinery rental € 01.16.51.16.61.16.7
Total contruction labour 75.000 m2 € 0 0,00
1.17.0 Other 1.17.1 Licence € 50.0001.17.2 Advice Wa3rm € 300.0001.17.3 Startup Costs € 800.0001.17.4 Contingency € 400.0001.17.5 CAR insurance € 50.0001.17.6 Supervisor € 80.0001.17.71.17.81.17.9
Total other 75.000 m2 € 1.680.000 22,40
Subtotal local investments € 2.750.000 36,67
1.18.0 Taxes and Duties1.18.1 Import duties € 0 0,001.18.21.18.31.18.41.18.5
Subtotal on taxes and duties 75.000 m2 € 0 0,00
TOTAL INVESTMENTS 75.000 m2 € 20.673.800 275,65
4
Feasibility study: Ljusdal, Zweden
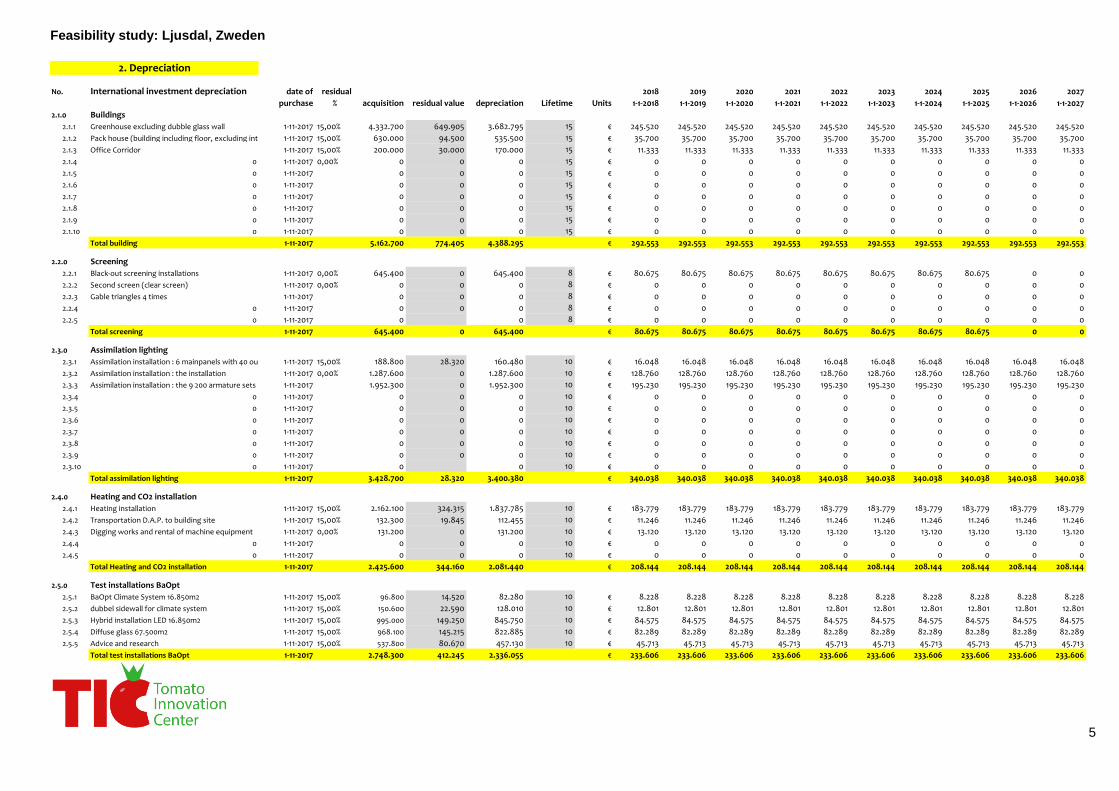
No. International investment depreciation date of residual 2018 2019 2020 2021 2022 2023 2024 2025 2026 2027
purchase % acquisition residual value depreciation Lifetime Units 1-1-2018 1-1-2019 1-1-2020 1-1-2021 1-1-2022 1-1-2023 1-1-2024 1-1-2025 1-1-2026 1-1-2027
2.1.0 Buildings
2.1.1 Greenhouse excluding dubble glass wall 1-11-2017 15,00% 4.332.700 649.905 3.682.795 15 € 245.520 245.520 245.520 245.520 245.520 245.520 245.520 245.520 245.520 245.520
2.1.2 Pack house (building including floor, excluding interior) 1-11-2017 15,00% 630.000 94.500 535.500 15 € 35.700 35.700 35.700 35.700 35.700 35.700 35.700 35.700 35.700 35.700
2.1.3 Office Corridor 1-11-2017 15,00% 200.000 30.000 170.000 15 € 11.333 11.333 11.333 11.333 11.333 11.333 11.333 11.333 11.333 11.333
2.1.4 0 1-11-2017 0,00% 0 0 0 15 € 0 0 0 0 0 0 0 0 0 0
2.1.5 0 1-11-2017 0 0 0 15 € 0 0 0 0 0 0 0 0 0 0
2.1.6 0 1-11-2017 0 0 0 15 € 0 0 0 0 0 0 0 0 0 0
2.1.7 0 1-11-2017 0 0 0 15 € 0 0 0 0 0 0 0 0 0 0
2.1.8 0 1-11-2017 0 0 0 15 € 0 0 0 0 0 0 0 0 0 0
2.1.9 0 1-11-2017 0 0 0 15 € 0 0 0 0 0 0 0 0 0 0
2.1.10 0 1-11-2017 0 0 0 15 € 0 0 0 0 0 0 0 0 0 0
Total building 1-11-2017 5.162.700 774.405 4.388.295 € 292.553 292.553 292.553 292.553 292.553 292.553 292.553 292.553 292.553 292.553
2.2.0 Screening
2.2.1 Black-out screening installations 1-11-2017 0,00% 645.400 0 645.400 8 € 80.675 80.675 80.675 80.675 80.675 80.675 80.675 80.675 0 0
2.2.2 Second screen (clear screen) 1-11-2017 0,00% 0 0 0 8 € 0 0 0 0 0 0 0 0 0 0
2.2.3 Gable triangles 4 times 1-11-2017 0 0 0 8 € 0 0 0 0 0 0 0 0 0 0
2.2.4 0 1-11-2017 0 0 0 8 € 0 0 0 0 0 0 0 0 0 0
2.2.5 0 1-11-2017 0 0 8 € 0 0 0 0 0 0 0 0 0 0
Total screening 1-11-2017 645.400 0 645.400 € 80.675 80.675 80.675 80.675 80.675 80.675 80.675 80.675 0 0
2.3.0 Assimilation lighting
2.3.1 Assimilation installation : 6 mainpanels with 40 outgoing fields 300Amp1-11-2017 15,00% 188.800 28.320 160.480 10 € 16.048 16.048 16.048 16.048 16.048 16.048 16.048 16.048 16.048 16.048
2.3.2 Assimilation installation : the installation 1-11-2017 0,00% 1.287.600 0 1.287.600 10 € 128.760 128.760 128.760 128.760 128.760 128.760 128.760 128.760 128.760 128.760
2.3.3 Assimilation installation : the 9 200 armature sets as described1-11-2017 1.952.300 0 1.952.300 10 € 195.230 195.230 195.230 195.230 195.230 195.230 195.230 195.230 195.230 195.230
2.3.4 0 1-11-2017 0 0 0 10 € 0 0 0 0 0 0 0 0 0 0
2.3.5 0 1-11-2017 0 0 0 10 € 0 0 0 0 0 0 0 0 0 0
2.3.6 0 1-11-2017 0 0 0 10 € 0 0 0 0 0 0 0 0 0 0
2.3.7 0 1-11-2017 0 0 0 10 € 0 0 0 0 0 0 0 0 0 0
2.3.8 0 1-11-2017 0 0 0 10 € 0 0 0 0 0 0 0 0 0 0
2.3.9 0 1-11-2017 0 0 0 10 € 0 0 0 0 0 0 0 0 0 0
2.3.10 0 1-11-2017 0 0 10 € 0 0 0 0 0 0 0 0 0 0
Total assimilation lighting 1-11-2017 3.428.700 28.320 3.400.380 € 340.038 340.038 340.038 340.038 340.038 340.038 340.038 340.038 340.038 340.038
2.4.0 Heating and CO2 installation
2.4.1 Heating installation 1-11-2017 15,00% 2.162.100 324.315 1.837.785 10 € 183.779 183.779 183.779 183.779 183.779 183.779 183.779 183.779 183.779 183.779
2.4.2 Transportation D.A.P. to building site 1-11-2017 15,00% 132.300 19.845 112.455 10 € 11.246 11.246 11.246 11.246 11.246 11.246 11.246 11.246 11.246 11.246
2.4.3 Digging works and rental of machine equipment 1-11-2017 0,00% 131.200 0 131.200 10 € 13.120 13.120 13.120 13.120 13.120 13.120 13.120 13.120 13.120 13.120
2.4.4 0 1-11-2017 0 0 0 10 € 0 0 0 0 0 0 0 0 0 0
2.4.5 0 1-11-2017 0 0 0 10 € 0 0 0 0 0 0 0 0 0 0
Total Heating and CO2 installation 1-11-2017 2.425.600 344.160 2.081.440 € 208.144 208.144 208.144 208.144 208.144 208.144 208.144 208.144 208.144 208.144
2.5.0 Test installations BaOpt
2.5.1 BaOpt Climate System 16.850m2 1-11-2017 15,00% 96.800 14.520 82.280 10 € 8.228 8.228 8.228 8.228 8.228 8.228 8.228 8.228 8.228 8.228
2.5.2 dubbel sidewall for climate system 1-11-2017 15,00% 150.600 22.590 128.010 10 € 12.801 12.801 12.801 12.801 12.801 12.801 12.801 12.801 12.801 12.801
2.5.3 Hybrid installation LED 16.850m2 1-11-2017 15,00% 995.000 149.250 845.750 10 € 84.575 84.575 84.575 84.575 84.575 84.575 84.575 84.575 84.575 84.575
2.5.4 Diffuse glass 67.500m2 1-11-2017 15,00% 968.100 145.215 822.885 10 € 82.289 82.289 82.289 82.289 82.289 82.289 82.289 82.289 82.289 82.289
2.5.5 Advice and research 1-11-2017 15,00% 537.800 80.670 457.130 10 € 45.713 45.713 45.713 45.713 45.713 45.713 45.713 45.713 45.713 45.713
Total test installations BaOpt 1-11-2017 2.748.300 412.245 2.336.055 € 233.606 233.606 233.606 233.606 233.606 233.606 233.606 233.606 233.606 233.606
2. Depreciation
5
Feasibility study: Ljusdal, Zweden
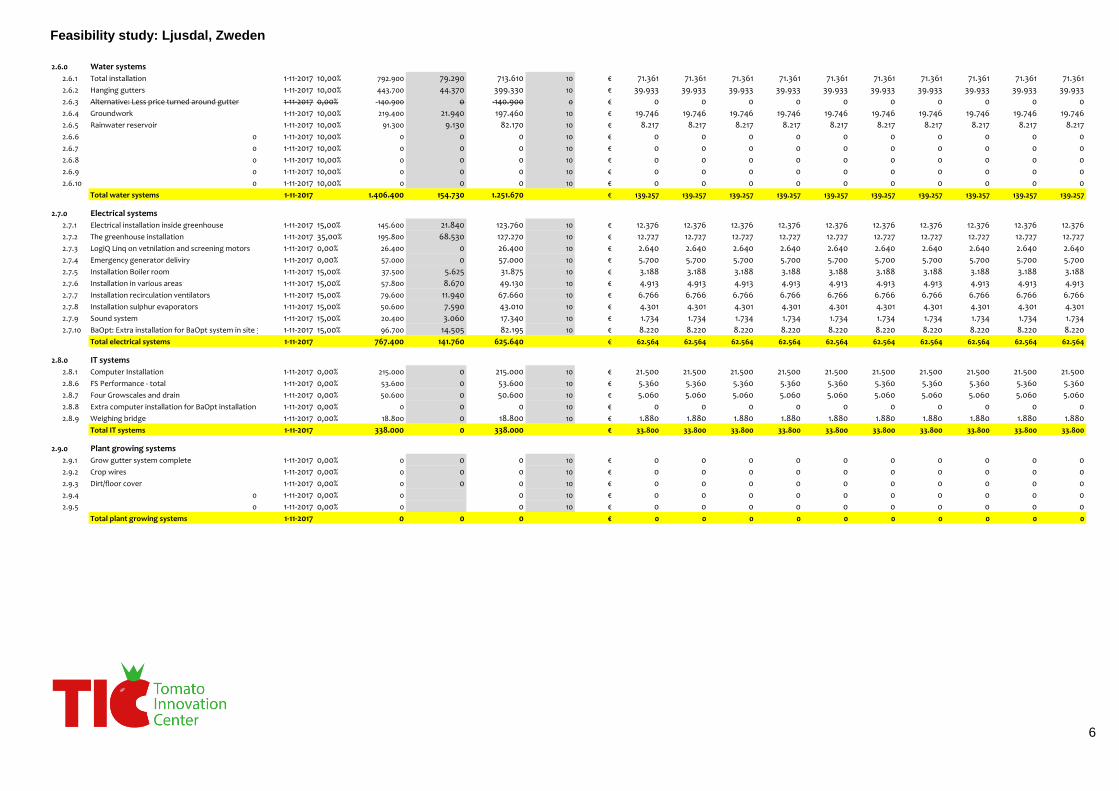
2.6.0 Water systems
2.6.1 Total installation 1-11-2017 10,00% 792.900 79.290 713.610 10 € 71.361 71.361 71.361 71.361 71.361 71.361 71.361 71.361 71.361 71.361
2.6.2 Hanging gutters 1-11-2017 10,00% 443.700 44.370 399.330 10 € 39.933 39.933 39.933 39.933 39.933 39.933 39.933 39.933 39.933 39.933
2.6.3 Alternative: Less price turned around gutter 1-11-2017 0,00% -140.900 0 -140.900 0 € 0 0 0 0 0 0 0 0 0 0
2.6.4 Groundwork 1-11-2017 10,00% 219.400 21.940 197.460 10 € 19.746 19.746 19.746 19.746 19.746 19.746 19.746 19.746 19.746 19.746
2.6.5 Rainwater reservoir 1-11-2017 10,00% 91.300 9.130 82.170 10 € 8.217 8.217 8.217 8.217 8.217 8.217 8.217 8.217 8.217 8.217
2.6.6 0 1-11-2017 10,00% 0 0 0 10 € 0 0 0 0 0 0 0 0 0 0
2.6.7 0 1-11-2017 10,00% 0 0 0 10 € 0 0 0 0 0 0 0 0 0 0
2.6.8 0 1-11-2017 10,00% 0 0 0 10 € 0 0 0 0 0 0 0 0 0 0
2.6.9 0 1-11-2017 10,00% 0 0 0 10 € 0 0 0 0 0 0 0 0 0 0
2.6.10 0 1-11-2017 10,00% 0 0 0 10 € 0 0 0 0 0 0 0 0 0 0
Total water systems 1-11-2017 1.406.400 154.730 1.251.670 € 139.257 139.257 139.257 139.257 139.257 139.257 139.257 139.257 139.257 139.257
2.7.0 Electrical systems
2.7.1 Electrical installation inside greenhouse 1-11-2017 15,00% 145.600 21.840 123.760 10 € 12.376 12.376 12.376 12.376 12.376 12.376 12.376 12.376 12.376 12.376
2.7.2 The greenhouse installation 1-11-2017 35,00% 195.800 68.530 127.270 10 € 12.727 12.727 12.727 12.727 12.727 12.727 12.727 12.727 12.727 12.727
2.7.3 LogiQ Linq on vetnilation and screening motors 1-11-2017 0,00% 26.400 0 26.400 10 € 2.640 2.640 2.640 2.640 2.640 2.640 2.640 2.640 2.640 2.640
2.7.4 Emergency generator deliviry 1-11-2017 0,00% 57.000 0 57.000 10 € 5.700 5.700 5.700 5.700 5.700 5.700 5.700 5.700 5.700 5.700
2.7.5 Installation Boiler room 1-11-2017 15,00% 37.500 5.625 31.875 10 € 3.188 3.188 3.188 3.188 3.188 3.188 3.188 3.188 3.188 3.188
2.7.6 Installation in various areas 1-11-2017 15,00% 57.800 8.670 49.130 10 € 4.913 4.913 4.913 4.913 4.913 4.913 4.913 4.913 4.913 4.913
2.7.7 Installation recirculation ventilators 1-11-2017 15,00% 79.600 11.940 67.660 10 € 6.766 6.766 6.766 6.766 6.766 6.766 6.766 6.766 6.766 6.766
2.7.8 Installation sulphur evaporators 1-11-2017 15,00% 50.600 7.590 43.010 10 € 4.301 4.301 4.301 4.301 4.301 4.301 4.301 4.301 4.301 4.301
2.7.9 Sound system 1-11-2017 15,00% 20.400 3.060 17.340 10 € 1.734 1.734 1.734 1.734 1.734 1.734 1.734 1.734 1.734 1.734
2.7.10 BaOpt: Extra installation for BaOpt system in site 3 1-11-2017 15,00% 96.700 14.505 82.195 10 € 8.220 8.220 8.220 8.220 8.220 8.220 8.220 8.220 8.220 8.220
Total electrical systems 1-11-2017 767.400 141.760 625.640 € 62.564 62.564 62.564 62.564 62.564 62.564 62.564 62.564 62.564 62.564
2.8.0 IT systems
2.8.1 Computer Installation 1-11-2017 0,00% 215.000 0 215.000 10 € 21.500 21.500 21.500 21.500 21.500 21.500 21.500 21.500 21.500 21.500
2.8.6 FS Performance - total 1-11-2017 0,00% 53.600 0 53.600 10 € 5.360 5.360 5.360 5.360 5.360 5.360 5.360 5.360 5.360 5.360
2.8.7 Four Growscales and drain 1-11-2017 0,00% 50.600 0 50.600 10 € 5.060 5.060 5.060 5.060 5.060 5.060 5.060 5.060 5.060 5.060
2.8.8 Extra computer installation for BaOpt installation (not included)1-11-2017 0,00% 0 0 0 10 € 0 0 0 0 0 0 0 0 0 0
2.8.9 Weighing bridge 1-11-2017 0,00% 18.800 0 18.800 10 € 1.880 1.880 1.880 1.880 1.880 1.880 1.880 1.880 1.880 1.880
Total IT systems 1-11-2017 338.000 0 338.000 € 33.800 33.800 33.800 33.800 33.800 33.800 33.800 33.800 33.800 33.800
2.9.0 Plant growing systems
2.9.1 Grow gutter system complete 1-11-2017 0,00% 0 0 0 10 € 0 0 0 0 0 0 0 0 0 0
2.9.2 Crop wires 1-11-2017 0,00% 0 0 0 10 € 0 0 0 0 0 0 0 0 0 0
2.9.3 Dirt/floor cover 1-11-2017 0,00% 0 0 0 10 € 0 0 0 0 0 0 0 0 0 0
2.9.4 0 1-11-2017 0,00% 0 0 10 € 0 0 0 0 0 0 0 0 0 0
2.9.5 0 1-11-2017 0,00% 0 0 10 € 0 0 0 0 0 0 0 0 0 0
Total plant growing systems 1-11-2017 0 0 0 € 0 0 0 0 0 0 0 0 0 0
6

Feasibility study: Ljusdal, Zweden
2.10.0 Logistic systems and various needs
2.10.1 Internal transport system and harvest equipment 1-11-2017 10,00% 64.500 6.450 58.050 10 € 5.805 5.805 5.805 5.805 5.805 5.805 5.805 5.805 5.805 5.805
2.10.2 Bogaerts/Berg/Scales 1-11-2017 10,00% 80.700 8.070 72.630 10 € 7.263 7.263 7.263 7.263 7.263 7.263 7.263 7.263 7.263 7.263
2.10.3 Electrical infra, transofmers outside greenhouse 1-11-2017 10,00% 129.100 12.910 116.190 10 € 11.619 11.619 11.619 11.619 11.619 11.619 11.619 11.619 11.619 11.619
2.10.4 Labor registration 1-11-2017 10,00% 32.300 3.230 29.070 10 € 2.907 2.907 2.907 2.907 2.907 2.907 2.907 2.907 2.907 2.907
2.10.5 Various equipment, including generator 1-11-2017 10,00% 53.800 5.380 48.420 10 € 4.842 4.842 4.842 4.842 4.842 4.842 4.842 4.842 4.842 4.842
2.10.6 0 1-11-2017 10,00% 0 0 0 10 € 0 0 0 0 0 0 0 0 0 0
2.10.7 0 1-11-2017 0 0 0 10 € 0 0 0 0 0 0 0 0 0 0
2.10.8 0 1-11-2017 0 0 0 10 € 0 0 0 0 0 0 0 0 0 0
2.10.9 0 1-11-2017 0 0 0 10 € 0 0 0 0 0 0 0 0 0 0
2.10.10 0 1-11-2017 0 0 0 10 € 0 0 0 0 0 0 0 0 0 0
2.10.11 0 1-11-2017 0 0 0 10 € 0 0 0 0 0 0 0 0 0 0
2.10.12 0 1-11-2017 0 0 0 10 € 0 0 0 0 0 0 0 0 0 0
2.10.13 0 1-11-2017 0 0 0 10 € 0 0 0 0 0 0 0 0 0 0
2.10.14 0 1-11-2017 0 0 0 10 € 0 0 0 0 0 0 0 0 0 0
2.10.15 0 1-11-2017 0 0 0 10 € 0 0 0 0 0 0 0 0 0 0
Total logistic systems 1-11-2017 360.400 36.040 324.360 € 32.436 32.436 32.436 32.436 32.436 32.436 32.436 32.436 32.436 32.436
2.11.0 Construction labour
2.11.1 Supervisors costs 1-11-2017 15,00% 0 0 0 10 € 0 0 0 0 0 0 0 0 0 0
2.11.2 Construction labour force 1-11-2017 15,00% 0 0 0 10 € 0 0 0 0 0 0 0 0 0 0
2.11.3 Construction machinery 1-11-2017 15,00% 0 0 0 10 € 0 0 0 0 0 0 0 0 0 0
2.11.4 Construction machinary rental 1-11-2017 15,00% 0 0 0 10 € 0 0 0 0 0 0 0 0 0 0
2.11.5 0 1-11-2017 0 0 0 10 € 0 0 0 0 0 0 0 0 0 0
Total construction labour 1-11-2017 0 0 0 € 0 0 0 0 0 0 0 0 0 0
2.12.0 Unforseen
2.12.1 Other unforseen 1-11-2017 0,00% 500.000 0 500.000 10 € 50.000 50.000 50.000 50.000 50.000 50.000 50.000 50.000 50.000 50.000
Total unforseen 1-11-2017 500.000 0 500.000 € 50.000 50.000 50.000 50.000 50.000 50.000 50.000 50.000 50.000 50.000
Grant and other government support 1-11-2017 0,00% 0 10 0 0 0 0 0 0 0 0 0 0
Grant and other government support 1-11-2017 0 0 0 0 0 0 0 0 0 0 0 0
Subtotal international investments 17.782.900 1.891.660 15.891.240,00 1.473.073 1.473.073 1.473.073 1.473.073 1.473.073 1.473.073 1.473.073 1.473.073 1.392.398 1.392.398
7
Feasibility study: Ljusdal, Zweden
No. Local investment depreciation date of 2018 2019 2020 2021 2022 2023 2024 2025 2026 2027
purchase acquisition residual value depreciation Lifetime Units 1-1-2018 1-1-2019 1-1-2020 1-1-2021 1-1-2022 1-1-2023 1-1-2024 1-1-2025 1-1-2026 1-1-2027
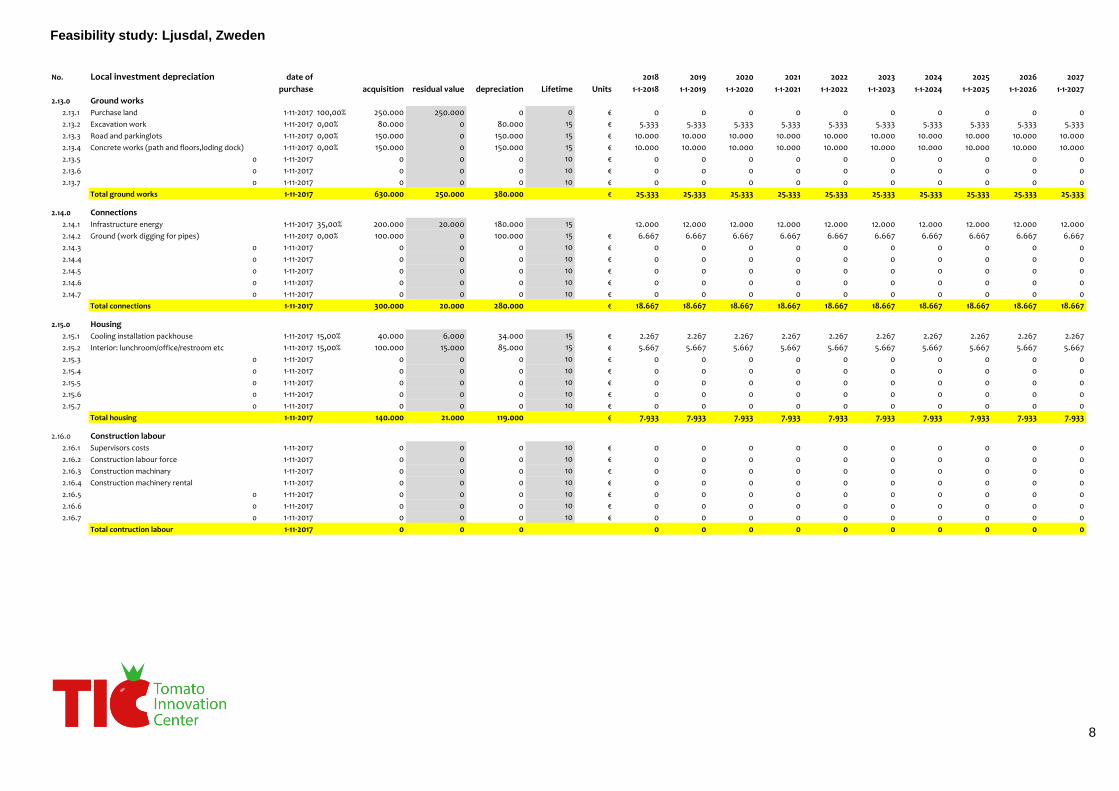
2.13.0 Ground works
2.13.1 Purchase land 1-11-2017 100,00% 250.000 250.000 0 0 € 0 0 0 0 0 0 0 0 0 0
2.13.2 Excavation work 1-11-2017 0,00% 80.000 0 80.000 15 € 5.333 5.333 5.333 5.333 5.333 5.333 5.333 5.333 5.333 5.333
2.13.3 Road and parkinglots 1-11-2017 0,00% 150.000 0 150.000 15 € 10.000 10.000 10.000 10.000 10.000 10.000 10.000 10.000 10.000 10.000
2.13.4 Concrete works (path and floors,loding dock) 1-11-2017 0,00% 150.000 0 150.000 15 € 10.000 10.000 10.000 10.000 10.000 10.000 10.000 10.000 10.000 10.000
2.13.5 0 1-11-2017 0 0 0 10 € 0 0 0 0 0 0 0 0 0 0
2.13.6 0 1-11-2017 0 0 0 10 € 0 0 0 0 0 0 0 0 0 0
2.13.7 0 1-11-2017 0 0 0 10 € 0 0 0 0 0 0 0 0 0 0
Total ground works 1-11-2017 630.000 250.000 380.000 € 25.333 25.333 25.333 25.333 25.333 25.333 25.333 25.333 25.333 25.333
2.14.0 Connections
2.14.1 Infrastructure energy 1-11-2017 35,00% 200.000 20.000 180.000 15 12.000 12.000 12.000 12.000 12.000 12.000 12.000 12.000 12.000 12.000
2.14.2 Ground (work digging for pipes) 1-11-2017 0,00% 100.000 0 100.000 15 € 6.667 6.667 6.667 6.667 6.667 6.667 6.667 6.667 6.667 6.667
2.14.3 0 1-11-2017 0 0 0 10 € 0 0 0 0 0 0 0 0 0 0
2.14.4 0 1-11-2017 0 0 0 10 € 0 0 0 0 0 0 0 0 0 0
2.14.5 0 1-11-2017 0 0 0 10 € 0 0 0 0 0 0 0 0 0 0
2.14.6 0 1-11-2017 0 0 0 10 € 0 0 0 0 0 0 0 0 0 0
2.14.7 0 1-11-2017 0 0 0 10 € 0 0 0 0 0 0 0 0 0 0
Total connections 1-11-2017 300.000 20.000 280.000 € 18.667 18.667 18.667 18.667 18.667 18.667 18.667 18.667 18.667 18.667
2.15.0 Housing
2.15.1 Cooling installation packhouse 1-11-2017 15,00% 40.000 6.000 34.000 15 € 2.267 2.267 2.267 2.267 2.267 2.267 2.267 2.267 2.267 2.267
2.15.2 Interior: lunchroom/office/restroom etc 1-11-2017 15,00% 100.000 15.000 85.000 15 € 5.667 5.667 5.667 5.667 5.667 5.667 5.667 5.667 5.667 5.667
2.15.3 0 1-11-2017 0 0 0 10 € 0 0 0 0 0 0 0 0 0 0
2.15.4 0 1-11-2017 0 0 0 10 € 0 0 0 0 0 0 0 0 0 0
2.15.5 0 1-11-2017 0 0 0 10 € 0 0 0 0 0 0 0 0 0 0
2.15.6 0 1-11-2017 0 0 0 10 € 0 0 0 0 0 0 0 0 0 0
2.15.7 0 1-11-2017 0 0 0 10 € 0 0 0 0 0 0 0 0 0 0
Total housing 1-11-2017 140.000 21.000 119.000 € 7.933 7.933 7.933 7.933 7.933 7.933 7.933 7.933 7.933 7.933
2.16.0 Construction labour
2.16.1 Supervisors costs 1-11-2017 0 0 0 10 € 0 0 0 0 0 0 0 0 0 0
2.16.2 Construction labour force 1-11-2017 0 0 0 10 € 0 0 0 0 0 0 0 0 0 0
2.16.3 Construction machinary 1-11-2017 0 0 0 10 € 0 0 0 0 0 0 0 0 0 0
2.16.4 Construction machinery rental 1-11-2017 0 0 0 10 € 0 0 0 0 0 0 0 0 0 0
2.16.5 0 1-11-2017 0 0 0 10 € 0 0 0 0 0 0 0 0 0 0
2.16.6 0 1-11-2017 0 0 0 10 € 0 0 0 0 0 0 0 0 0 0
2.16.7 0 1-11-2017 0 0 0 10 € 0 0 0 0 0 0 0 0 0 0
Total contruction labour 1-11-2017 0 0 0 0 0 0 0 0 0 0 0 0 0
8
Feasibility study: Ljusdal, Zweden
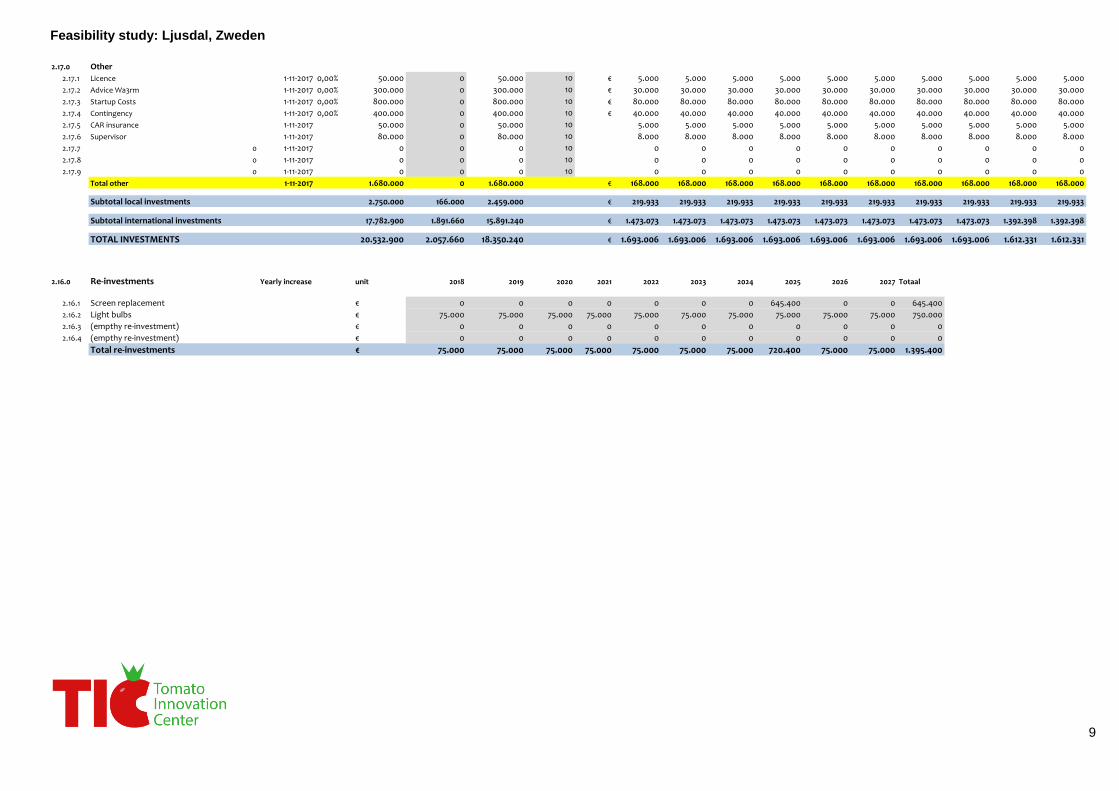
2.17.0 Other
2.17.1 Licence 1-11-2017 0,00% 50.000 0 50.000 10 € 5.000 5.000 5.000 5.000 5.000 5.000 5.000 5.000 5.000 5.000
2.17.2 Advice Wa3rm 1-11-2017 0,00% 300.000 0 300.000 10 € 30.000 30.000 30.000 30.000 30.000 30.000 30.000 30.000 30.000 30.000
2.17.3 Startup Costs 1-11-2017 0,00% 800.000 0 800.000 10 € 80.000 80.000 80.000 80.000 80.000 80.000 80.000 80.000 80.000 80.000
2.17.4 Contingency 1-11-2017 0,00% 400.000 0 400.000 10 € 40.000 40.000 40.000 40.000 40.000 40.000 40.000 40.000 40.000 40.000
2.17.5 CAR insurance 1-11-2017 50.000 0 50.000 10 5.000 5.000 5.000 5.000 5.000 5.000 5.000 5.000 5.000 5.000
2.17.6 Supervisor 1-11-2017 80.000 0 80.000 10 8.000 8.000 8.000 8.000 8.000 8.000 8.000 8.000 8.000 8.000
2.17.7 0 1-11-2017 0 0 0 10 0 0 0 0 0 0 0 0 0 0
2.17.8 0 1-11-2017 0 0 0 10 0 0 0 0 0 0 0 0 0 0
2.17.9 0 1-11-2017 0 0 0 10 0 0 0 0 0 0 0 0 0 0
Total other 1-11-2017 1.680.000 0 1.680.000 € 168.000 168.000 168.000 168.000 168.000 168.000 168.000 168.000 168.000 168.000
Subtotal local investments 2.750.000 166.000 2.459.000 € 219.933 219.933 219.933 219.933 219.933 219.933 219.933 219.933 219.933 219.933
Subtotal international investments 17.782.900 1.891.660 15.891.240 € 1.473.073 1.473.073 1.473.073 1.473.073 1.473.073 1.473.073 1.473.073 1.473.073 1.392.398 1.392.398
TOTAL INVESTMENTS 20.532.900 2.057.660 18.350.240 € 1.693.006 1.693.006 1.693.006 1.693.006 1.693.006 1.693.006 1.693.006 1.693.006 1.612.331 1.612.331
2.16.0 Re-investments Yearly increase unit 2018 2019 2020 2021 2022 2023 2024 2025 2026 2027 Totaal
2.16.1 Screen replacement € 0 0 0 0 0 0 0 645.400 0 0 645.400
2.16.2 Light bulbs € 75.000 75.000 75.000 75.000 75.000 75.000 75.000 75.000 75.000 75.000 750.000
2.16.3 (empthy re-investment) € 0 0 0 0 0 0 0 0 0 0 0
2.16.4 (empthy re-investment) € 0 0 0 0 0 0 0 0 0 0 0
Total re-investments € 75.000 75.000 75.000 75.000 75.000 75.000 75.000 720.400 75.000 75.000 1.395.400
9
Feasibility study: Ljusdal, Zweden
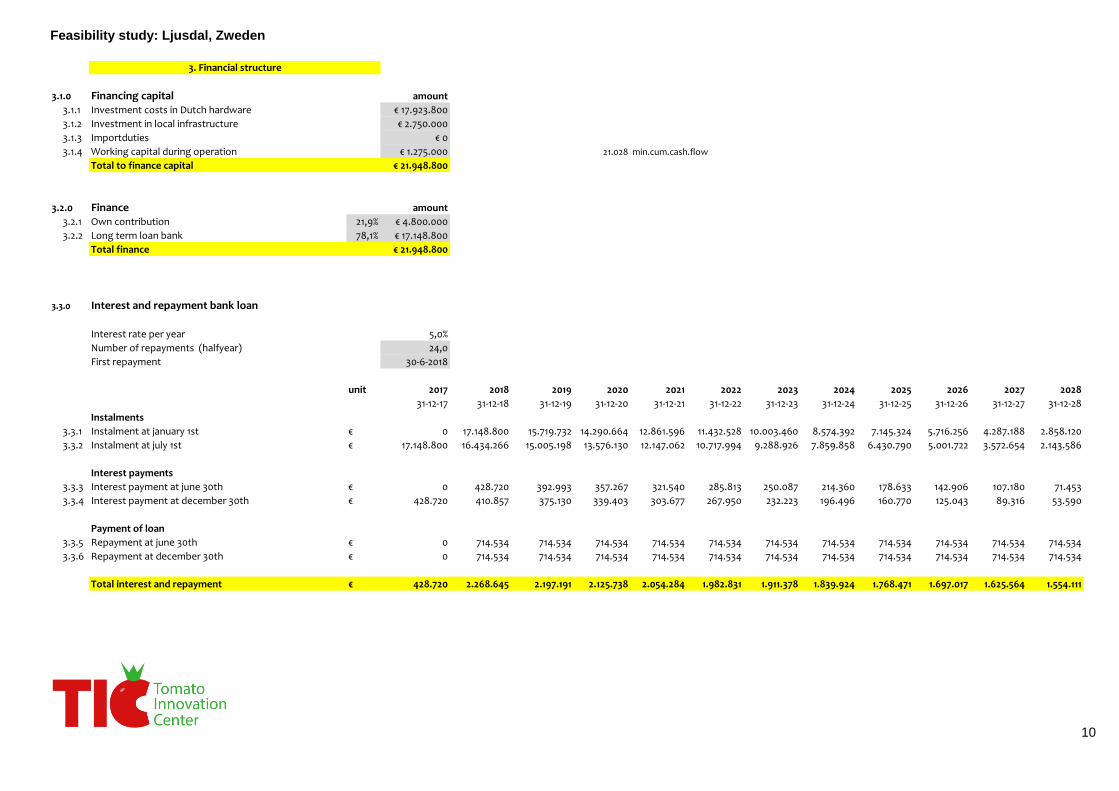
3.1.0 Financing capital amount
3.1.1 Investment costs in Dutch hardware € 17.923.800
3.1.2 Investment in local infrastructure € 2.750.000
3.1.3 Importduties € 0
3.1.4 Working capital during operation € 1.275.000 21.028 min.cum.cash.flow
Total to finance capital € 21.948.800
3.2.0 Finance amount
3.2.1 Own contribution 21,9% € 4.800.000
3.2.2 Long term loan bank 78,1% € 17.148.800
Total finance € 21.948.800
3.3.0 Interest and repayment bank loan
Interest rate per year 5,0%
Number of repayments (halfyear) 24,0
First repayment 30-6-2018
unit 2017 2018 2019 2020 2021 2022 2023 2024 2025 2026 2027 2028
31-12-17 31-12-18 31-12-19 31-12-20 31-12-21 31-12-22 31-12-23 31-12-24 31-12-25 31-12-26 31-12-27 31-12-28
Instalments
3.3.1 Instalment at january 1st € 0 17.148.800 15.719.732 14.290.664 12.861.596 11.432.528 10.003.460 8.574.392 7.145.324 5.716.256 4.287.188 2.858.120
3.3.2 Instalment at july 1st € 17.148.800 16.434.266 15.005.198 13.576.130 12.147.062 10.717.994 9.288.926 7.859.858 6.430.790 5.001.722 3.572.654 2.143.586
Interest payments
3.3.3 Interest payment at june 30th € 0 428.720 392.993 357.267 321.540 285.813 250.087 214.360 178.633 142.906 107.180 71.453
3.3.4 Interest payment at december 30th € 428.720 410.857 375.130 339.403 303.677 267.950 232.223 196.496 160.770 125.043 89.316 53.590
Payment of loan
3.3.5 Repayment at june 30th € 0 714.534 714.534 714.534 714.534 714.534 714.534 714.534 714.534 714.534 714.534 714.534
3.3.6 Repayment at december 30th € 0 714.534 714.534 714.534 714.534 714.534 714.534 714.534 714.534 714.534 714.534 714.534
Total interest and repayment € 428.720 2.268.645 2.197.191 2.125.738 2.054.284 1.982.831 1.911.378 1.839.924 1.768.471 1.697.017 1.625.564 1.554.111
3. Financial structure
10
Feasibility study: Ljusdal, Zweden
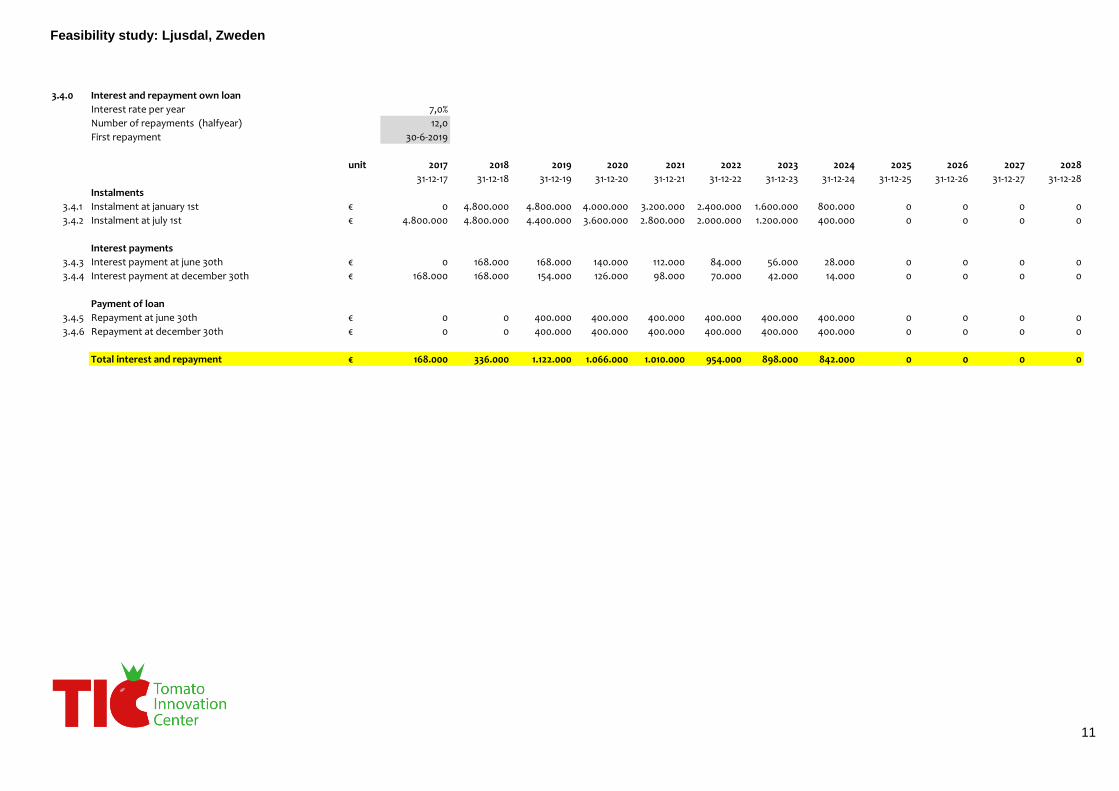
3.4.0 Interest and repayment own loan
Interest rate per year 7,0%
Number of repayments (halfyear) 12,0
First repayment 30-6-2019
unit 2017 2018 2019 2020 2021 2022 2023 2024 2025 2026 2027 2028
31-12-17 31-12-18 31-12-19 31-12-20 31-12-21 31-12-22 31-12-23 31-12-24 31-12-25 31-12-26 31-12-27 31-12-28
Instalments
3.4.1 Instalment at january 1st € 0 4.800.000 4.800.000 4.000.000 3.200.000 2.400.000 1.600.000 800.000 0 0 0 0
3.4.2 Instalment at july 1st € 4.800.000 4.800.000 4.400.000 3.600.000 2.800.000 2.000.000 1.200.000 400.000 0 0 0 0
Interest payments
3.4.3 Interest payment at june 30th € 0 168.000 168.000 140.000 112.000 84.000 56.000 28.000 0 0 0 0
3.4.4 Interest payment at december 30th € 168.000 168.000 154.000 126.000 98.000 70.000 42.000 14.000 0 0 0 0
Payment of loan
3.4.5 Repayment at june 30th € 0 0 400.000 400.000 400.000 400.000 400.000 400.000 0 0 0 0
3.4.6 Repayment at december 30th € 0 0 400.000 400.000 400.000 400.000 400.000 400.000 0 0 0 0
Total interest and repayment € 168.000 336.000 1.122.000 1.066.000 1.010.000 954.000 898.000 842.000 0 0 0 0
11
Feasibility study: Ljusdal, Zweden
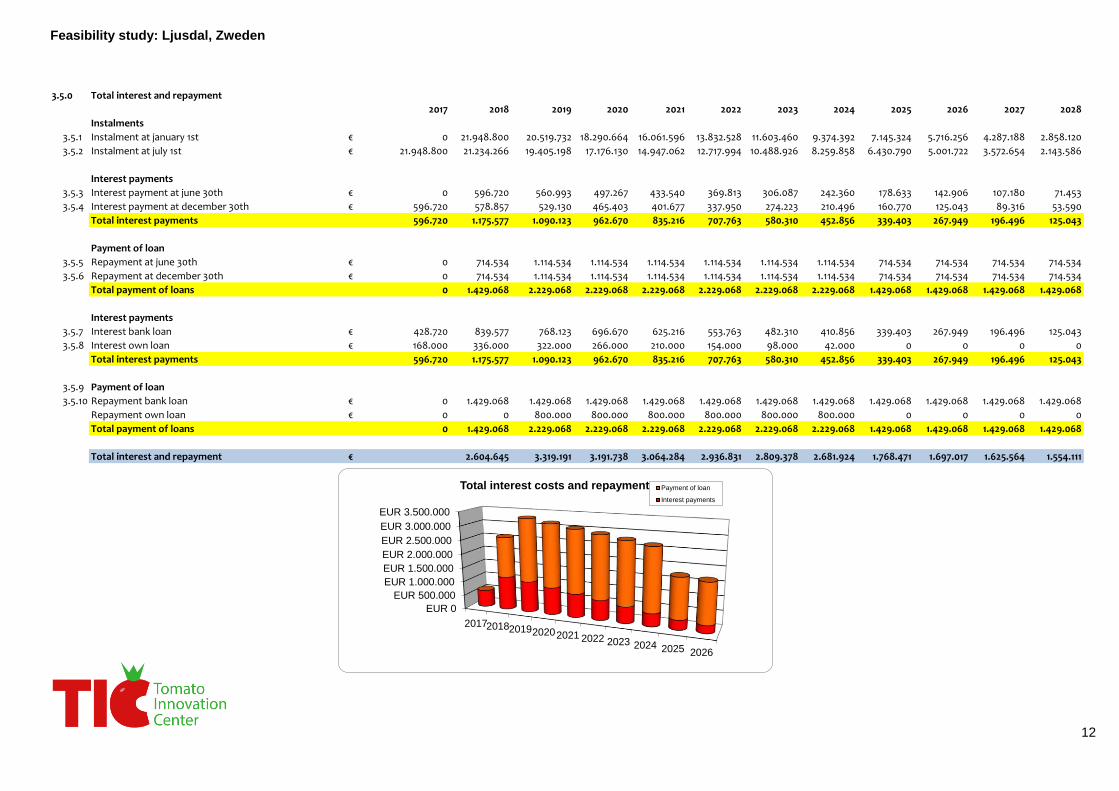
3.5.0 Total interest and repayment
2017 2018 2019 2020 2021 2022 2023 2024 2025 2026 2027 2028
Instalments
3.5.1 Instalment at january 1st € 0 21.948.800 20.519.732 18.290.664 16.061.596 13.832.528 11.603.460 9.374.392 7.145.324 5.716.256 4.287.188 2.858.120
3.5.2 Instalment at july 1st € 21.948.800 21.234.266 19.405.198 17.176.130 14.947.062 12.717.994 10.488.926 8.259.858 6.430.790 5.001.722 3.572.654 2.143.586
Interest payments
3.5.3 Interest payment at june 30th € 0 596.720 560.993 497.267 433.540 369.813 306.087 242.360 178.633 142.906 107.180 71.453
3.5.4 Interest payment at december 30th € 596.720 578.857 529.130 465.403 401.677 337.950 274.223 210.496 160.770 125.043 89.316 53.590
Total interest payments 596.720 1.175.577 1.090.123 962.670 835.216 707.763 580.310 452.856 339.403 267.949 196.496 125.043
Payment of loan
3.5.5 Repayment at june 30th € 0 714.534 1.114.534 1.114.534 1.114.534 1.114.534 1.114.534 1.114.534 714.534 714.534 714.534 714.534
3.5.6 Repayment at december 30th € 0 714.534 1.114.534 1.114.534 1.114.534 1.114.534 1.114.534 1.114.534 714.534 714.534 714.534 714.534
Total payment of loans 0 1.429.068 2.229.068 2.229.068 2.229.068 2.229.068 2.229.068 2.229.068 1.429.068 1.429.068 1.429.068 1.429.068
Interest payments
3.5.7 Interest bank loan € 428.720 839.577 768.123 696.670 625.216 553.763 482.310 410.856 339.403 267.949 196.496 125.043
3.5.8 Interest own loan € 168.000 336.000 322.000 266.000 210.000 154.000 98.000 42.000 0 0 0 0
Total interest payments 596.720 1.175.577 1.090.123 962.670 835.216 707.763 580.310 452.856 339.403 267.949 196.496 125.043
3.5.9 Payment of loan
3.5.10 Repayment bank loan € 0 1.429.068 1.429.068 1.429.068 1.429.068 1.429.068 1.429.068 1.429.068 1.429.068 1.429.068 1.429.068 1.429.068
Repayment own loan € 0 0 800.000 800.000 800.000 800.000 800.000 800.000 0 0 0 0
Total payment of loans 0 1.429.068 2.229.068 2.229.068 2.229.068 2.229.068 2.229.068 2.229.068 1.429.068 1.429.068 1.429.068 1.429.068
Total interest and repayment € 2.604.645 3.319.191 3.191.738 3.064.284 2.936.831 2.809.378 2.681.924 1.768.471 1.697.017 1.625.564 1.554.111
EUR 0
EUR 500.000
EUR 1.000.000
EUR 1.500.000
EUR 2.000.000
EUR 2.500.000
EUR 3.000.000
EUR 3.500.000
20172018201920202021 2022 2023 2024 2025 2026
Total interest costs and repayment Payment of loan
Interest payments
12
Feasibility study: Ljusdal, Zweden
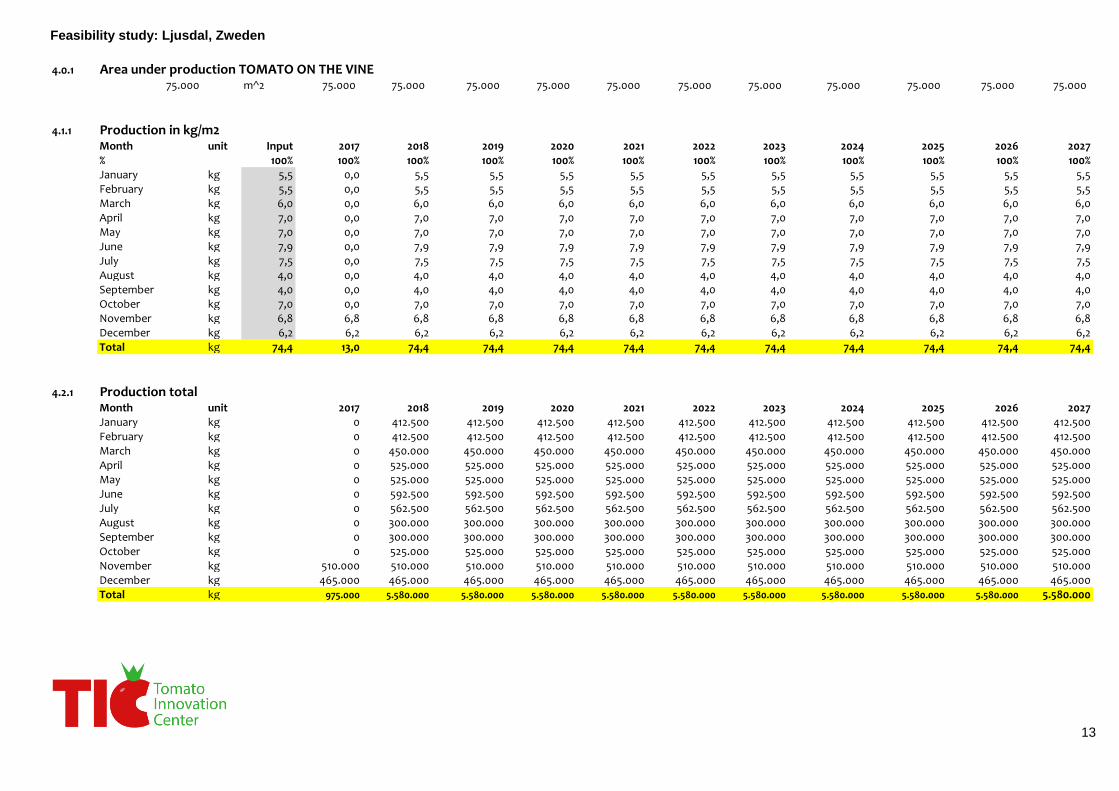
4.0.1 Area under production TOMATO ON THE VINE75.000 m^2 75.000 75.000 75.000 75.000 75.000 75.000 75.000 75.000 75.000 75.000 75.000
4.1.1 Production in kg/m2Month unit Input 2017 2018 2019 2020 2021 2022 2023 2024 2025 2026 2027% 100% 100% 100% 100% 100% 100% 100% 100% 100% 100% 100% 100%January kg 5,5 0,0 5,5 5,5 5,5 5,5 5,5 5,5 5,5 5,5 5,5 5,5February kg 5,5 0,0 5,5 5,5 5,5 5,5 5,5 5,5 5,5 5,5 5,5 5,5March kg 6,0 0,0 6,0 6,0 6,0 6,0 6,0 6,0 6,0 6,0 6,0 6,0April kg 7,0 0,0 7,0 7,0 7,0 7,0 7,0 7,0 7,0 7,0 7,0 7,0May kg 7,0 0,0 7,0 7,0 7,0 7,0 7,0 7,0 7,0 7,0 7,0 7,0June kg 7,9 0,0 7,9 7,9 7,9 7,9 7,9 7,9 7,9 7,9 7,9 7,9July kg 7,5 0,0 7,5 7,5 7,5 7,5 7,5 7,5 7,5 7,5 7,5 7,5August kg 4,0 0,0 4,0 4,0 4,0 4,0 4,0 4,0 4,0 4,0 4,0 4,0September kg 4,0 0,0 4,0 4,0 4,0 4,0 4,0 4,0 4,0 4,0 4,0 4,0October kg 7,0 0,0 7,0 7,0 7,0 7,0 7,0 7,0 7,0 7,0 7,0 7,0November kg 6,8 6,8 6,8 6,8 6,8 6,8 6,8 6,8 6,8 6,8 6,8 6,8December kg 6,2 6,2 6,2 6,2 6,2 6,2 6,2 6,2 6,2 6,2 6,2 6,2Total kg 74,4 13,0 74,4 74,4 74,4 74,4 74,4 74,4 74,4 74,4 74,4 74,4
4.2.1 Production totalMonth unit 2017 2018 2019 2020 2021 2022 2023 2024 2025 2026 2027January kg 0 412.500 412.500 412.500 412.500 412.500 412.500 412.500 412.500 412.500 412.500February kg 0 412.500 412.500 412.500 412.500 412.500 412.500 412.500 412.500 412.500 412.500March kg 0 450.000 450.000 450.000 450.000 450.000 450.000 450.000 450.000 450.000 450.000April kg 0 525.000 525.000 525.000 525.000 525.000 525.000 525.000 525.000 525.000 525.000May kg 0 525.000 525.000 525.000 525.000 525.000 525.000 525.000 525.000 525.000 525.000June kg 0 592.500 592.500 592.500 592.500 592.500 592.500 592.500 592.500 592.500 592.500July kg 0 562.500 562.500 562.500 562.500 562.500 562.500 562.500 562.500 562.500 562.500August kg 0 300.000 300.000 300.000 300.000 300.000 300.000 300.000 300.000 300.000 300.000September kg 0 300.000 300.000 300.000 300.000 300.000 300.000 300.000 300.000 300.000 300.000October kg 0 525.000 525.000 525.000 525.000 525.000 525.000 525.000 525.000 525.000 525.000November kg 510.000 510.000 510.000 510.000 510.000 510.000 510.000 510.000 510.000 510.000 510.000December kg 465.000 465.000 465.000 465.000 465.000 465.000 465.000 465.000 465.000 465.000 465.000Total kg 975.000 5.580.000 5.580.000 5.580.000 5.580.000 5.580.000 5.580.000 5.580.000 5.580.000 5.580.000 5.580.000
13

Feasibility study: Ljusdal, Zweden
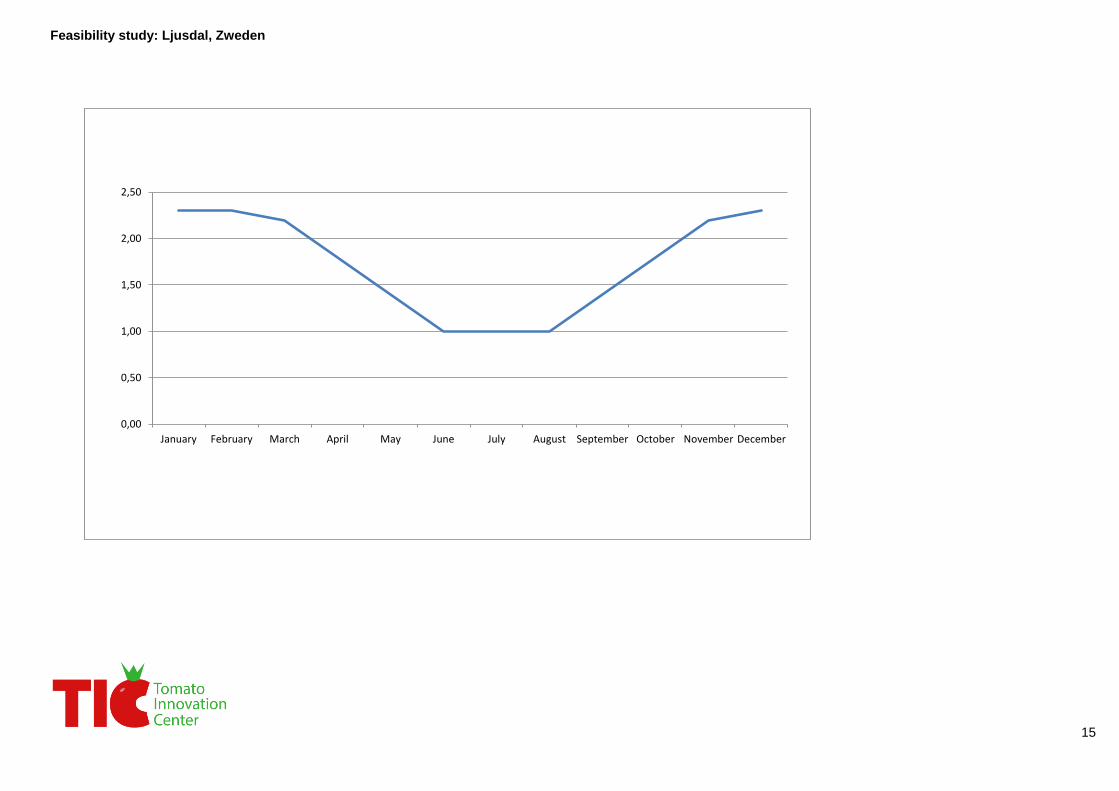
4.3.1 Pricelevel €/kg Input € 1,75 (excl. Value Added Tax) 0,0% Yearly price increase tomato price
Month unit 100% 2017 2018 2019 2020 2021 2022 2023 2024 2025 2026 2027January € 2,30 2,30 2,35 2,39 2,44 2,49 2,54 2,59 2,64 2,69 2,75 2,80February € 2,30 2,30 2,35 2,39 2,44 2,49 2,54 2,59 2,64 2,69 2,75 2,80March € 2,20 2,20 2,24 2,29 2,33 2,38 2,43 2,48 2,53 2,58 2,63 2,68April € 1,80 1,80 1,84 1,87 1,91 1,95 1,99 2,03 2,07 2,11 2,15 2,19May € 1,40 1,40 1,43 1,46 1,49 1,52 1,55 1,58 1,61 1,64 1,67 1,71June € 1,00 1,00 1,02 1,04 1,06 1,08 1,10 1,13 1,15 1,17 1,20 1,22July € 1,00 1,00 1,02 1,04 1,06 1,08 1,10 1,13 1,15 1,17 1,20 1,22August € 1,00 1,00 1,02 1,04 1,06 1,08 1,10 1,13 1,15 1,17 1,20 1,22September € 1,40 1,40 1,43 1,46 1,49 1,52 1,55 1,58 1,61 1,64 1,67 1,71October € 1,80 1,80 1,84 1,87 1,91 1,95 1,99 2,03 2,07 2,11 2,15 2,19November € 2,20 2,20 2,24 2,29 2,33 2,38 2,43 2,48 2,53 2,58 2,63 2,68December € 2,30 2,30 2,35 2,39 2,44 2,49 2,54 2,59 2,64 2,69 2,75 2,80Weighted average € 1,75 2,25 1,75 1,79 1,82 1,86 1,90 1,93 1,97 2,01 2,05 2,09
4.4.1 Turnover (excl. Value Added Tax)
Month unit 2017 2018 2019 2020 2021 2022 2023 2024 2025 2026 2027January € 0 967.725 987.080 1.006.821 1.026.958 1.047.497 1.068.447 1.089.816 1.111.612 1.133.844 1.156.521February € 0 967.725 987.080 1.006.821 1.026.958 1.047.497 1.068.447 1.089.816 1.111.612 1.133.844 1.156.521March € 0 1.009.800 1.029.996 1.050.596 1.071.608 1.093.040 1.114.901 1.137.199 1.159.943 1.183.142 1.206.804April € 0 963.900 983.178 1.002.842 1.022.898 1.043.356 1.064.223 1.085.508 1.107.218 1.129.362 1.151.950May € 0 749.700 764.694 779.988 795.588 811.499 827.729 844.284 861.170 878.393 895.961June € 0 604.350 616.437 628.766 641.341 654.168 667.251 680.596 694.208 708.092 722.254July € 0 573.750 585.225 596.930 608.868 621.045 633.466 646.136 659.058 672.240 685.684August € 0 306.000 312.120 318.362 324.730 331.224 337.849 344.606 351.498 358.528 365.698September € 0 428.400 436.968 445.707 454.622 463.714 472.988 482.448 492.097 501.939 511.978October € 0 963.900 983.178 1.002.842 1.022.898 1.043.356 1.064.223 1.085.508 1.107.218 1.129.362 1.151.950November € 1.122.000 1.144.440 1.167.329 1.190.675 1.214.489 1.238.779 1.263.554 1.288.825 1.314.602 1.340.894 1.367.712December € 1.069.500 1.090.890 1.112.708 1.134.962 1.157.661 1.180.814 1.204.431 1.228.519 1.253.090 1.278.152 1.303.715Total € 2.191.500 9.770.580 9.965.992 10.165.311 10.368.618 10.575.990 10.787.510 11.003.260 11.223.325 11.447.792 11.676.748
Total €/m^2 29 130 133 136 138 141 144 147 150 153 156
14
Feasibility study: Ljusdal, Zweden
0,00
0,50
1,00
1,50
2,00
2,50
January February March April May June July August September October November December
15
Feasibility study: Ljusdal, Zweden
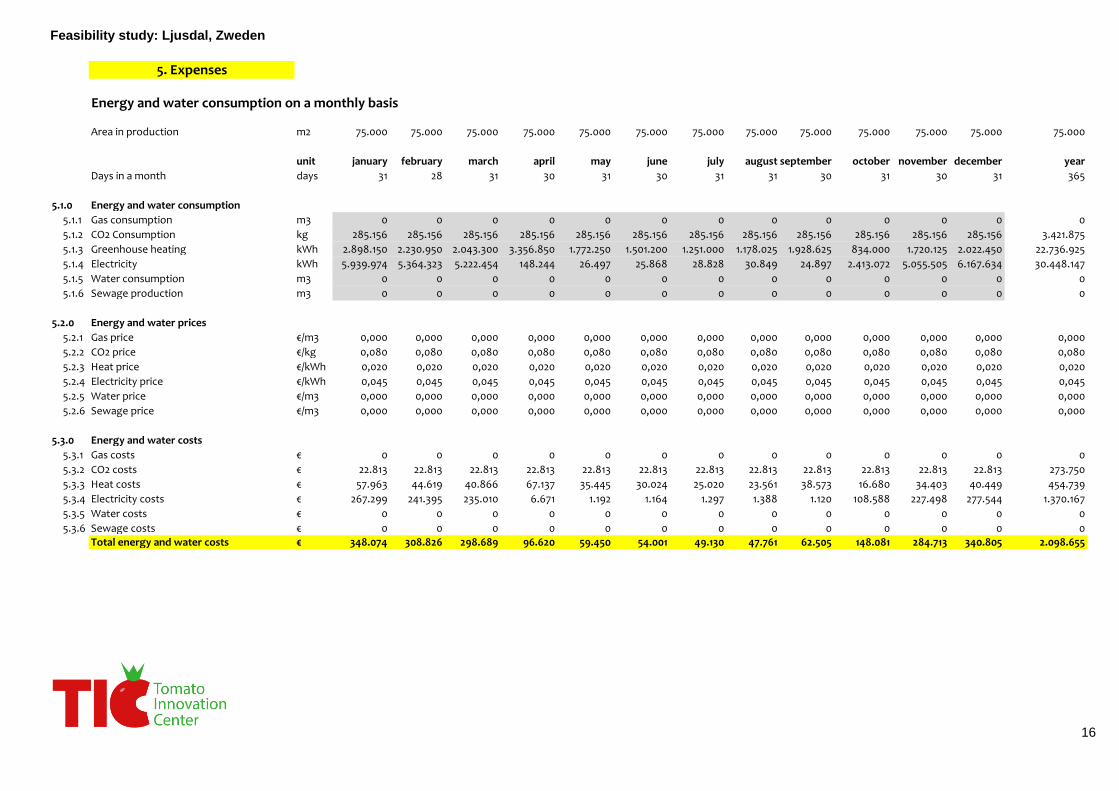
5. Expenses
Energy and water consumption on a monthly basis
Area in production m2 75.000 75.000 75.000 75.000 75.000 75.000 75.000 75.000 75.000 75.000 75.000 75.000 75.000
unit january february march april may june july august september october november december year
Days in a month days 31 28 31 30 31 30 31 31 30 31 30 31 365
5.1.0 Energy and water consumption
5.1.1 Gas consumption m3 0 0 0 0 0 0 0 0 0 0 0 0 0
5.1.2 CO2 Consumption kg 285.156 285.156 285.156 285.156 285.156 285.156 285.156 285.156 285.156 285.156 285.156 285.156 3.421.875
5.1.3 Greenhouse heating kWh 2.898.150 2.230.950 2.043.300 3.356.850 1.772.250 1.501.200 1.251.000 1.178.025 1.928.625 834.000 1.720.125 2.022.450 22.736.925
5.1.4 Electricity kWh 5.939.974 5.364.323 5.222.454 148.244 26.497 25.868 28.828 30.849 24.897 2.413.072 5.055.505 6.167.634 30.448.147
5.1.5 Water consumption m3 0 0 0 0 0 0 0 0 0 0 0 0 0
5.1.6 Sewage production m3 0 0 0 0 0 0 0 0 0 0 0 0 0
5.2.0 Energy and water prices
5.2.1 Gas price €/m3 0,000 0,000 0,000 0,000 0,000 0,000 0,000 0,000 0,000 0,000 0,000 0,000 0,000
5.2.2 CO2 price €/kg 0,080 0,080 0,080 0,080 0,080 0,080 0,080 0,080 0,080 0,080 0,080 0,080 0,080
5.2.3 Heat price €/kWh 0,020 0,020 0,020 0,020 0,020 0,020 0,020 0,020 0,020 0,020 0,020 0,020 0,020
5.2.4 Electricity price €/kWh 0,045 0,045 0,045 0,045 0,045 0,045 0,045 0,045 0,045 0,045 0,045 0,045 0,045
5.2.5 Water price €/m3 0,000 0,000 0,000 0,000 0,000 0,000 0,000 0,000 0,000 0,000 0,000 0,000 0,000
5.2.6 Sewage price €/m3 0,000 0,000 0,000 0,000 0,000 0,000 0,000 0,000 0,000 0,000 0,000 0,000 0,000
5.3.0 Energy and water costs
5.3.1 Gas costs € 0 0 0 0 0 0 0 0 0 0 0 0 0
5.3.2 CO2 costs € 22.813 22.813 22.813 22.813 22.813 22.813 22.813 22.813 22.813 22.813 22.813 22.813 273.750
5.3.3 Heat costs € 57.963 44.619 40.866 67.137 35.445 30.024 25.020 23.561 38.573 16.680 34.403 40.449 454.739
5.3.4 Electricity costs € 267.299 241.395 235.010 6.671 1.192 1.164 1.297 1.388 1.120 108.588 227.498 277.544 1.370.167
5.3.5 Water costs € 0 0 0 0 0 0 0 0 0 0 0 0 0
5.3.6 Sewage costs € 0 0 0 0 0 0 0 0 0 0 0 0 0Total energy and water costs € 348.074 308.826 298.689 96.620 59.450 54.001 49.130 47.761 62.505 148.081 284.713 340.805 2.098.655
16
Feasibility study: Ljusdal, Zweden
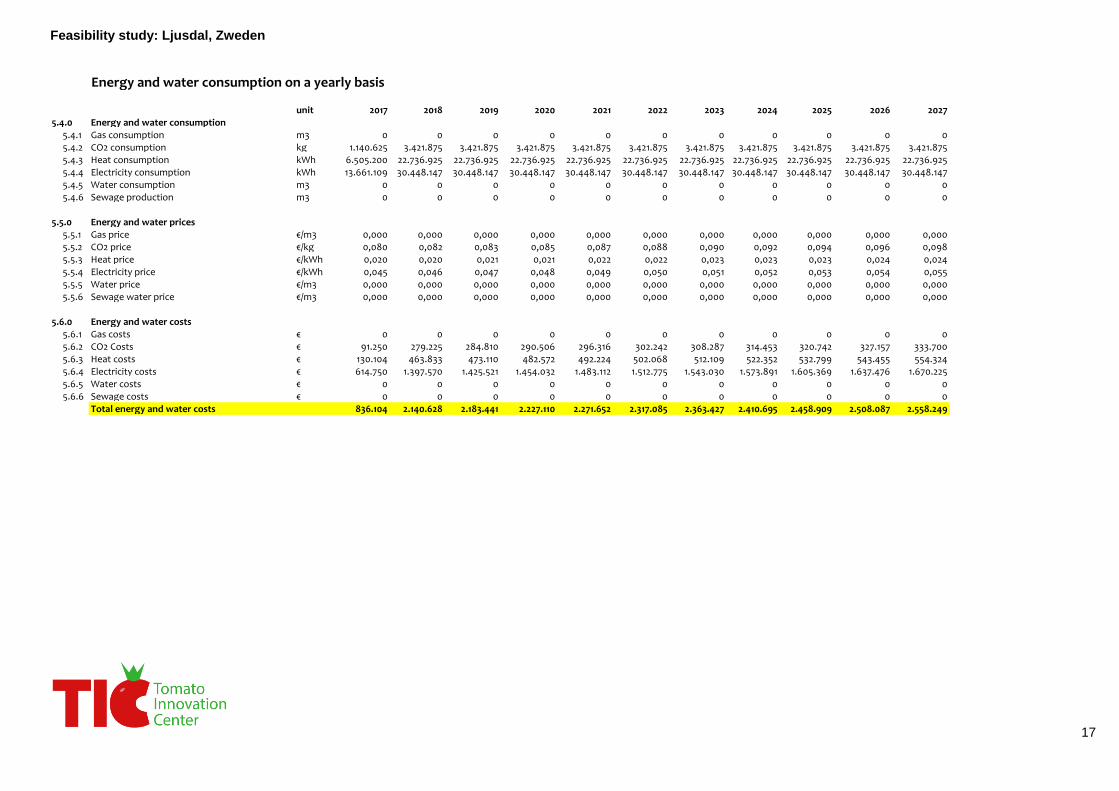
Energy and water consumption on a yearly basis
unit 2017 2018 2019 2020 2021 2022 2023 2024 2025 2026 20275.4.0 Energy and water consumption
5.4.1 Gas consumption m3 0 0 0 0 0 0 0 0 0 0 05.4.2 CO2 consumption kg 1.140.625 3.421.875 3.421.875 3.421.875 3.421.875 3.421.875 3.421.875 3.421.875 3.421.875 3.421.875 3.421.8755.4.3 Heat consumption kWh 6.505.200 22.736.925 22.736.925 22.736.925 22.736.925 22.736.925 22.736.925 22.736.925 22.736.925 22.736.925 22.736.9255.4.4 Electricity consumption kWh 13.661.109 30.448.147 30.448.147 30.448.147 30.448.147 30.448.147 30.448.147 30.448.147 30.448.147 30.448.147 30.448.1475.4.5 Water consumption m3 0 0 0 0 0 0 0 0 0 0 05.4.6 Sewage production m3 0 0 0 0 0 0 0 0 0 0 0
5.5.0 Energy and water prices5.5.1 Gas price €/m3 0,000 0,000 0,000 0,000 0,000 0,000 0,000 0,000 0,000 0,000 0,0005.5.2 CO2 price €/kg 0,080 0,082 0,083 0,085 0,087 0,088 0,090 0,092 0,094 0,096 0,0985.5.3 Heat price €/kWh 0,020 0,020 0,021 0,021 0,022 0,022 0,023 0,023 0,023 0,024 0,0245.5.4 Electricity price €/kWh 0,045 0,046 0,047 0,048 0,049 0,050 0,051 0,052 0,053 0,054 0,0555.5.5 Water price €/m3 0,000 0,000 0,000 0,000 0,000 0,000 0,000 0,000 0,000 0,000 0,0005.5.6 Sewage water price €/m3 0,000 0,000 0,000 0,000 0,000 0,000 0,000 0,000 0,000 0,000 0,000
5.6.0 Energy and water costs5.6.1 Gas costs € 0 0 0 0 0 0 0 0 0 0 05.6.2 CO2 Costs € 91.250 279.225 284.810 290.506 296.316 302.242 308.287 314.453 320.742 327.157 333.7005.6.3 Heat costs € 130.104 463.833 473.110 482.572 492.224 502.068 512.109 522.352 532.799 543.455 554.3245.6.4 Electricity costs € 614.750 1.397.570 1.425.521 1.454.032 1.483.112 1.512.775 1.543.030 1.573.891 1.605.369 1.637.476 1.670.2255.6.5 Water costs € 0 0 0 0 0 0 0 0 0 0 05.6.6 Sewage costs € 0 0 0 0 0 0 0 0 0 0 0
Total energy and water costs 836.104 2.140.628 2.183.441 2.227.110 2.271.652 2.317.085 2.363.427 2.410.695 2.458.909 2.508.087 2.558.249
17
Feasibility study: Ljusdal, Zweden
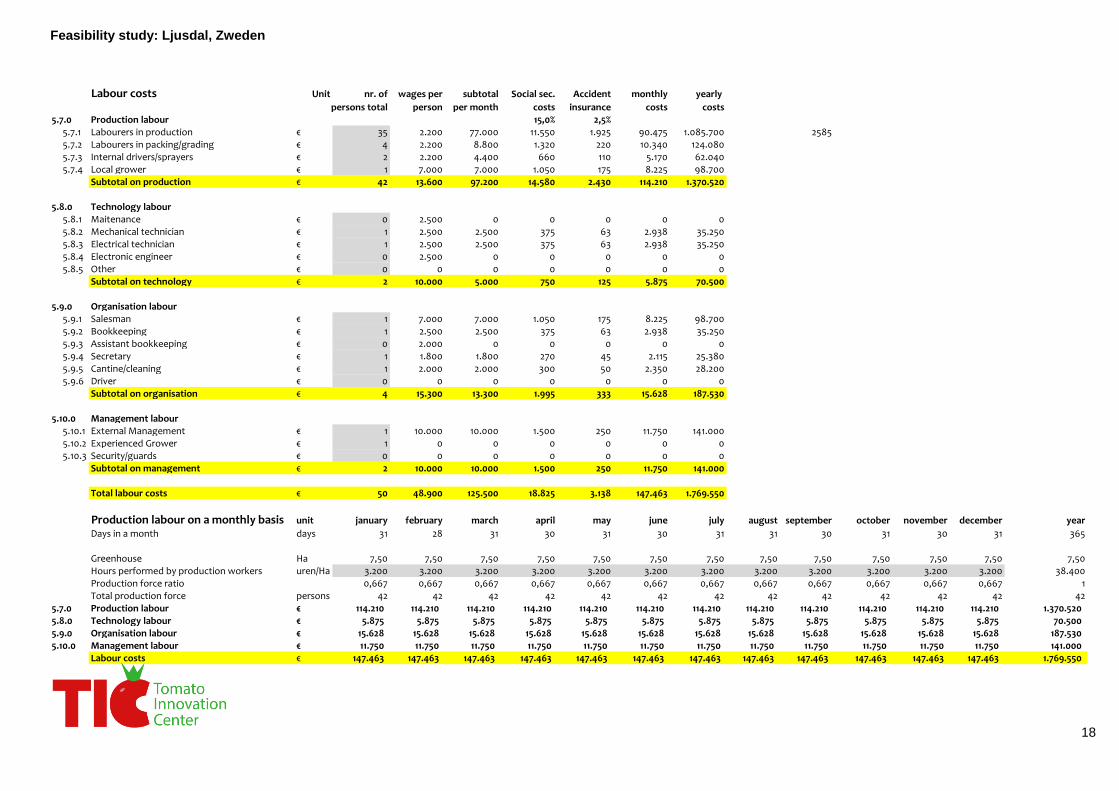
Labour costs Unit nr. of wages per subtotal Social sec. Accident monthly yearly
persons total person per month costs insurance costs costs5.7.0 Production labour 15,0% 2,5%
5.7.1 Labourers in production € 35 2.200 77.000 11.550 1.925 90.475 1.085.700 25855.7.2 Labourers in packing/grading € 4 2.200 8.800 1.320 220 10.340 124.0805.7.3 Internal drivers/sprayers € 2 2.200 4.400 660 110 5.170 62.0405.7.4 Local grower € 1 7.000 7.000 1.050 175 8.225 98.700
Subtotal on production € 42 13.600 97.200 14.580 2.430 114.210 1.370.520
5.8.0 Technology labour5.8.1 Maitenance € 0 2.500 0 0 0 0 05.8.2 Mechanical technician € 1 2.500 2.500 375 63 2.938 35.2505.8.3 Electrical technician € 1 2.500 2.500 375 63 2.938 35.2505.8.4 Electronic engineer € 0 2.500 0 0 0 0 05.8.5 Other € 0 0 0 0 0 0 0
Subtotal on technology € 2 10.000 5.000 750 125 5.875 70.500
5.9.0 Organisation labour5.9.1 Salesman € 1 7.000 7.000 1.050 175 8.225 98.7005.9.2 Bookkeeping € 1 2.500 2.500 375 63 2.938 35.2505.9.3 Assistant bookkeeping € 0 2.000 0 0 0 0 05.9.4 Secretary € 1 1.800 1.800 270 45 2.115 25.3805.9.5 Cantine/cleaning € 1 2.000 2.000 300 50 2.350 28.2005.9.6 Driver € 0 0 0 0 0 0 0
Subtotal on organisation € 4 15.300 13.300 1.995 333 15.628 187.530
5.10.0 Management labour5.10.1 External Management € 1 10.000 10.000 1.500 250 11.750 141.0005.10.2 Experienced Grower € 1 0 0 0 0 0 05.10.3 Security/guards € 0 0 0 0 0 0 0
Subtotal on management € 2 10.000 10.000 1.500 250 11.750 141.000
Total labour costs € 50 48.900 125.500 18.825 3.138 147.463 1.769.550
Production labour on a monthly basis unit january february march april may june july august september october november december year
Days in a month days 31 28 31 30 31 30 31 31 30 31 30 31 365
Greenhouse Ha 7,50 7,50 7,50 7,50 7,50 7,50 7,50 7,50 7,50 7,50 7,50 7,50 7,50Hours performed by production workers uren/Ha 3.200 3.200 3.200 3.200 3.200 3.200 3.200 3.200 3.200 3.200 3.200 3.200 38.400Production force ratio 0,667 0,667 0,667 0,667 0,667 0,667 0,667 0,667 0,667 0,667 0,667 0,667 1Total production force persons 42 42 42 42 42 42 42 42 42 42 42 42 42
5.7.0 Production labour € 114.210 114.210 114.210 114.210 114.210 114.210 114.210 114.210 114.210 114.210 114.210 114.210 1.370.520 5.8.0 Technology labour € 5.875 5.875 5.875 5.875 5.875 5.875 5.875 5.875 5.875 5.875 5.875 5.875 70.500 5.9.0 Organisation labour € 15.628 15.628 15.628 15.628 15.628 15.628 15.628 15.628 15.628 15.628 15.628 15.628 187.530 5.10.0 Management labour € 11.750 11.750 11.750 11.750 11.750 11.750 11.750 11.750 11.750 11.750 11.750 11.750 141.000
Labour costs € 147.463 147.463 147.463 147.463 147.463 147.463 147.463 147.463 147.463 147.463 147.463 147.463 1.769.550
18
Feasibility study: Ljusdal, Zweden
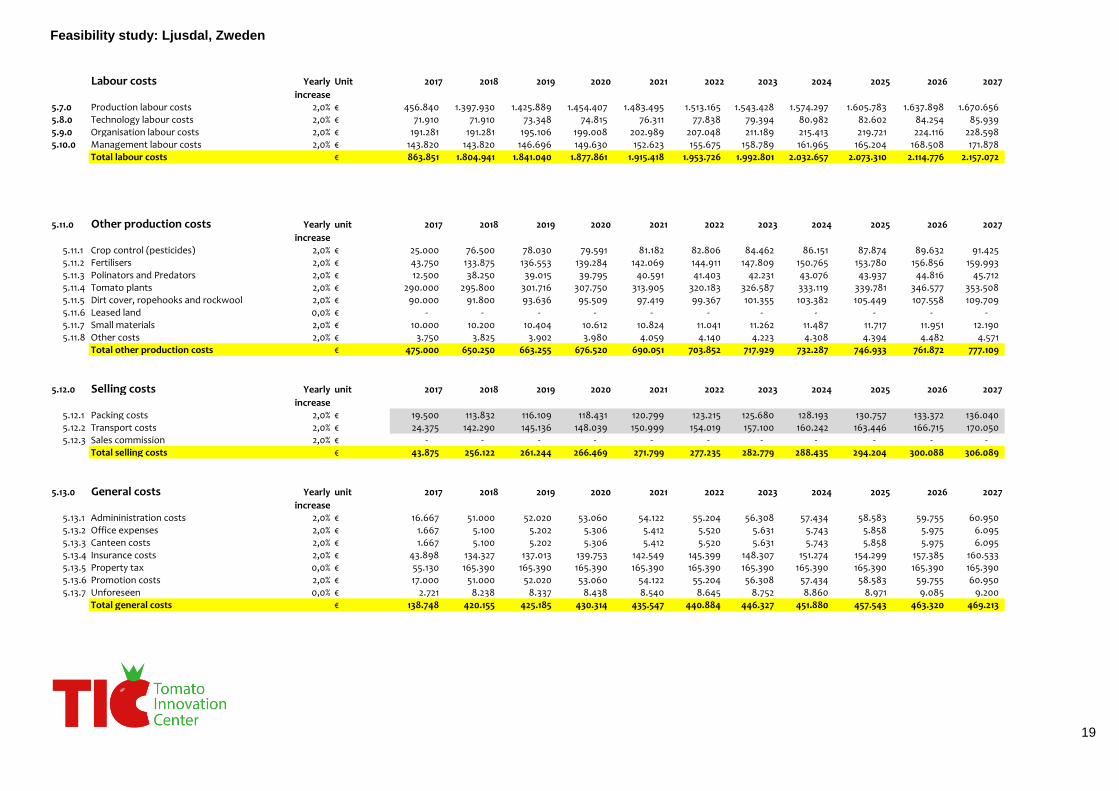
Labour costs Yearly Unit 2017 2018 2019 2020 2021 2022 2023 2024 2025 2026 2027
increase5.7.0 Production labour costs 2,0% € 456.840 1.397.930 1.425.889 1.454.407 1.483.495 1.513.165 1.543.428 1.574.297 1.605.783 1.637.898 1.670.656 5.8.0 Technology labour costs 2,0% € 71.910 71.910 73.348 74.815 76.311 77.838 79.394 80.982 82.602 84.254 85.939 5.9.0 Organisation labour costs 2,0% € 191.281 191.281 195.106 199.008 202.989 207.048 211.189 215.413 219.721 224.116 228.598 5.10.0 Management labour costs 2,0% € 143.820 143.820 146.696 149.630 152.623 155.675 158.789 161.965 165.204 168.508 171.878
Total labour costs € 863.851 1.804.941 1.841.040 1.877.861 1.915.418 1.953.726 1.992.801 2.032.657 2.073.310 2.114.776 2.157.072
5.11.0 Other production costs Yearly unit 2017 2018 2019 2020 2021 2022 2023 2024 2025 2026 2027
increase5.11.1 Crop control (pesticides) 2,0% € 25.000 76.500 78.030 79.591 81.182 82.806 84.462 86.151 87.874 89.632 91.425 5.11.2 Fertilisers 2,0% € 43.750 133.875 136.553 139.284 142.069 144.911 147.809 150.765 153.780 156.856 159.993 5.11.3 Polinators and Predators 2,0% € 12.500 38.250 39.015 39.795 40.591 41.403 42.231 43.076 43.937 44.816 45.712 5.11.4 Tomato plants 2,0% € 290.000 295.800 301.716 307.750 313.905 320.183 326.587 333.119 339.781 346.577 353.508 5.11.5 Dirt cover, ropehooks and rockwool 2,0% € 90.000 91.800 93.636 95.509 97.419 99.367 101.355 103.382 105.449 107.558 109.709 5.11.6 Leased land 0,0% € - - - - - - - - - - - 5.11.7 Small materials 2,0% € 10.000 10.200 10.404 10.612 10.824 11.041 11.262 11.487 11.717 11.951 12.190 5.11.8 Other costs 2,0% € 3.750 3.825 3.902 3.980 4.059 4.140 4.223 4.308 4.394 4.482 4.571
Total other production costs € 475.000 650.250 663.255 676.520 690.051 703.852 717.929 732.287 746.933 761.872 777.109
5.12.0 Selling costs Yearly unit 2017 2018 2019 2020 2021 2022 2023 2024 2025 2026 2027
increase5.12.1 Packing costs 2,0% € 19.500 113.832 116.109 118.431 120.799 123.215 125.680 128.193 130.757 133.372 136.040 5.12.2 Transport costs 2,0% € 24.375 142.290 145.136 148.039 150.999 154.019 157.100 160.242 163.446 166.715 170.050 5.12.3 Sales commission 2,0% € - - - - - - - - - - -
Total selling costs € 43.875 256.122 261.244 266.469 271.799 277.235 282.779 288.435 294.204 300.088 306.089
5.13.0 General costs Yearly unit 2017 2018 2019 2020 2021 2022 2023 2024 2025 2026 2027
increase5.13.1 Admininistration costs 2,0% € 16.667 51.000 52.020 53.060 54.122 55.204 56.308 57.434 58.583 59.755 60.950 5.13.2 Office expenses 2,0% € 1.667 5.100 5.202 5.306 5.412 5.520 5.631 5.743 5.858 5.975 6.095 5.13.3 Canteen costs 2,0% € 1.667 5.100 5.202 5.306 5.412 5.520 5.631 5.743 5.858 5.975 6.095 5.13.4 Insurance costs 2,0% € 43.898 134.327 137.013 139.753 142.549 145.399 148.307 151.274 154.299 157.385 160.533 5.13.5 Property tax 0,0% € 55.130 165.390 165.390 165.390 165.390 165.390 165.390 165.390 165.390 165.390 165.390 5.13.6 Promotion costs 2,0% € 17.000 51.000 52.020 53.060 54.122 55.204 56.308 57.434 58.583 59.755 60.950 5.13.7 Unforeseen 0,0% € 2.721 8.238 8.337 8.438 8.540 8.645 8.752 8.860 8.971 9.085 9.200
Total general costs € 138.748 420.155 425.185 430.314 435.547 440.884 446.327 451.880 457.543 463.320 469.213
19

Feasibility study: Ljusdal, Zweden
5.14.0 Maintenance Yearly 2017 2018 2019 2020 2021 2022 2023 2024 2025 2026 2027
increase5.14.1 Greenhouse maintenance 5,0% 0 124.043 130.245 136.757 143.595 150.775 158.314 166.229 174.541 183.268 192.4315.14.2 CHP maintenance
Maintenance costs per MWh 0% €/MWh 0,00 0,00 0,00 0,00 0,00 0,00 0,00 0,00 0,00 0,00 0,00Total yearly costs € 0,00 0,00 0,00 0,00 0,00 0,00 0,00 0,00 0,00 0,00 0,00
Total maintenance 0 124.043 130.245 136.757 143.595 150.775 158.314 166.229 174.541 183.268 192.431
TOTAL COSTS unit 2017 2018 2019 2020 2021 2022 2023 2024 2025 2026 2027
2.0.0 Depreciation € - 1.693.006 1.693.006 1.693.006 1.693.006 1.693.006 1.693.006 1.693.006 1.693.006 1.612.331 1.612.331 3.3.0 Interest € 596.720 1.175.577 1.090.123 962.670 835.216 707.763 580.310 452.856 339.403 267.949 196.496 5.0.0 All other expenses € 2.357.578 5.396.139 5.504.410 5.615.031 5.728.060 5.843.556 5.961.576 6.082.183 6.205.439 6.331.411 6.460.163
Total costs € 2.954.298 8.264.722 8.287.539 8.270.707 8.256.283 8.244.324 8.234.891 8.228.045 8.237.848 8.211.691 8.268.990
20
Feasibility study: Ljusdal, Zweden
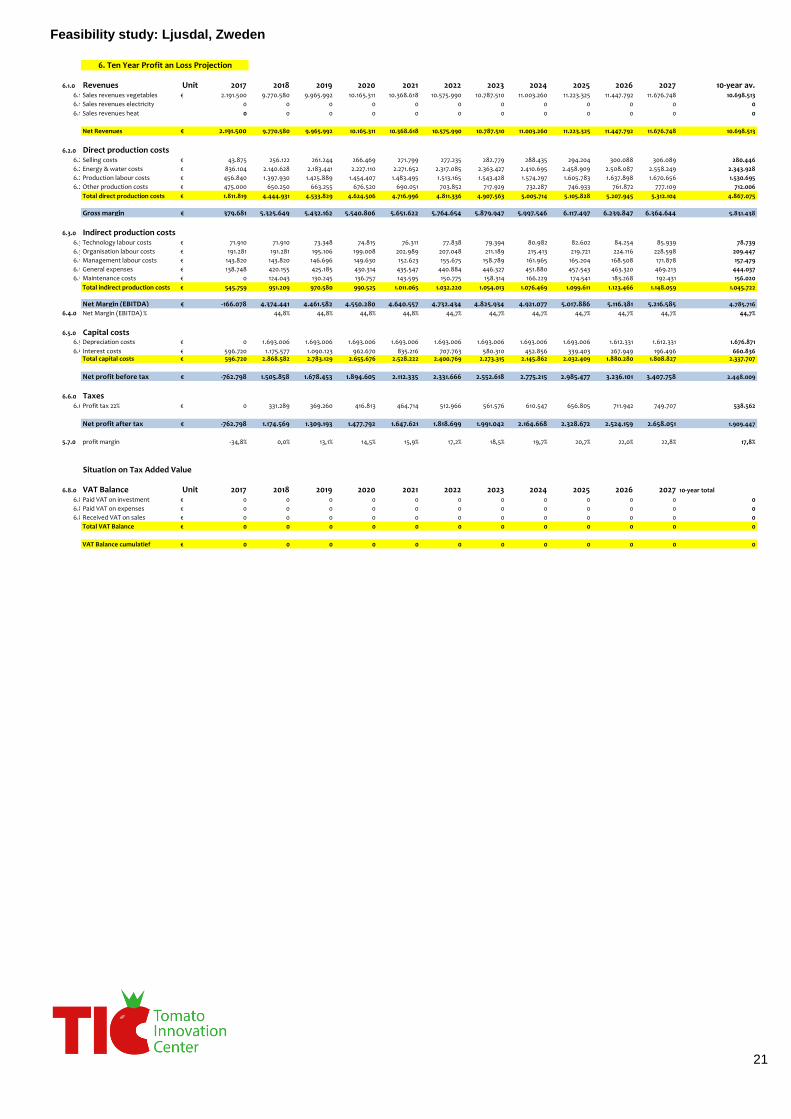
6.1.0 Revenues Unit 2017 2018 2019 2020 2021 2022 2023 2024 2025 2026 2027 10-year av.6.1.1Sales revenues vegetables € 2.191.500 9.770.580 9.965.992 10.165.311 10.368.618 10.575.990 10.787.510 11.003.260 11.223.325 11.447.792 11.676.748 10.698.513
6.1.2Sales revenues electricity 0 0 0 0 0 0 0 0 0 0 0 0
6.1.3Sales revenues heat 0 0 0 0 0 0 0 0 0 0 0 0
Net Revenues € 2.191.500 9.770.580 9.965.992 10.165.311 10.368.618 10.575.990 10.787.510 11.003.260 11.223.325 11.447.792 11.676.748 10.698.513
6.2.0 Direct production costs6.2.1Selling costs € 43.875 256.122 261.244 266.469 271.799 277.235 282.779 288.435 294.204 300.088 306.089 280.446
6.2.2Energy & water costs € 836.104 2.140.628 2.183.441 2.227.110 2.271.652 2.317.085 2.363.427 2.410.695 2.458.909 2.508.087 2.558.249 2.343.928
6.2.3Production labour costs € 456.840 1.397.930 1.425.889 1.454.407 1.483.495 1.513.165 1.543.428 1.574.297 1.605.783 1.637.898 1.670.656 1.530.695
6.2.4Other production costs € 475.000 650.250 663.255 676.520 690.051 703.852 717.929 732.287 746.933 761.872 777.109 712.006
Total direct production costs € 1.811.819 4.444.931 4.533.829 4.624.506 4.716.996 4.811.336 4.907.563 5.005.714 5.105.828 5.207.945 5.312.104 4.867.075
Gross margin € 379.681 5.325.649 5.432.162 5.540.806 5.651.622 5.764.654 5.879.947 5.997.546 6.117.497 6.239.847 6.364.644 5.831.438
6.3.0 Indirect production costs6.3.1Technology labour costs € 71.910 71.910 73.348 74.815 76.311 77.838 79.394 80.982 82.602 84.254 85.939 78.739
6.3.2Organisation labour costs € 191.281 191.281 195.106 199.008 202.989 207.048 211.189 215.413 219.721 224.116 228.598 209.447
6.3.3Management labour costs € 143.820 143.820 146.696 149.630 152.623 155.675 158.789 161.965 165.204 168.508 171.878 157.479
6.3.4General expenses € 138.748 420.155 425.185 430.314 435.547 440.884 446.327 451.880 457.543 463.320 469.213 444.037
6.3.5Maintenance costs € 0 124.043 130.245 136.757 143.595 150.775 158.314 166.229 174.541 183.268 192.431 156.020
Total indirect production costs € 545.759 951.209 970.580 990.525 1.011.065 1.032.220 1.054.013 1.076.469 1.099.611 1.123.466 1.148.059 1.045.722
Net Margin (EBITDA) € -166.078 4.374.441 4.461.582 4.550.280 4.640.557 4.732.434 4.825.934 4.921.077 5.017.886 5.116.381 5.216.585 4.785.716
6.4.0 Net Margin (EBITDA) % 44,8% 44,8% 44,8% 44,8% 44,7% 44,7% 44,7% 44,7% 44,7% 44,7% 44,7%
6.5.0 Capital costs6.5.1Depreciation costs € 0 1.693.006 1.693.006 1.693.006 1.693.006 1.693.006 1.693.006 1.693.006 1.693.006 1.612.331 1.612.331 1.676.871
6.5.2Interest costs € 596.720 1.175.577 1.090.123 962.670 835.216 707.763 580.310 452.856 339.403 267.949 196.496 660.836Total capital costs € 596.720 2.868.582 2.783.129 2.655.676 2.528.222 2.400.769 2.273.315 2.145.862 2.032.409 1.880.280 1.808.827 2.337.707
Net profit before tax € -762.798 1.505.858 1.678.453 1.894.605 2.112.335 2.331.666 2.552.618 2.775.215 2.985.477 3.236.101 3.407.758 2.448.009
6.6.0 Taxes6.6.1Profit tax 22% € 0 331.289 369.260 416.813 464.714 512.966 561.576 610.547 656.805 711.942 749.707 538.562
Net profit after tax € -762.798 1.174.569 1.309.193 1.477.792 1.647.621 1.818.699 1.991.042 2.164.668 2.328.672 2.524.159 2.658.051 1.909.447
5.7.0 profit margin -34,8% 0,0% 13,1% 14,5% 15,9% 17,2% 18,5% 19,7% 20,7% 22,0% 22,8% 17,8%
Situation on Tax Added Value
6.8.0 VAT Balance Unit 2017 2018 2019 2020 2021 2022 2023 2024 2025 2026 2027 10-year total
6.8.1Paid VAT on investment € 0 0 0 0 0 0 0 0 0 0 0 0
6.8.2Paid VAT on expenses € 0 0 0 0 0 0 0 0 0 0 0 0
6.8.3Received VAT on sales € 0 0 0 0 0 0 0 0 0 0 0 0
Total VAT Balance € 0 0 0 0 0 0 0 0 0 0 0 0
VAT Balance cumulatief € 0 0 0 0 0 0 0 0 0 0 0 0
6. Ten Year Profit an Loss Projection
21

Feasibility study: Ljusdal, Zweden
Cost price (€/kg) Unit 2017 2018 2019 2020 2021 2022 2023 2024 2025 2026 2027 10-year av.
Production kg 975.000 5.580.000 5.580.000 5.580.000 5.580.000 5.580.000 5.580.000 5.580.000 5.580.000 5.580.000 5.580.000 0
6.9.0 Direct production costs6.9.1Selling costs € 0,05 0,05 0,05 0,05 0,05 0,05 0,05 0,05 0,05 0,05 0,05 0,05
6.9.2Energy & water costs € 0,86 0,38 0,39 0,40 0,41 0,42 0,42 0,43 0,44 0,45 0,46 0,42
6.9.3Production labour costs € 0,47 0,25 0,26 0,26 0,27 0,27 0,28 0,28 0,29 0,29 0,30 0,27
6.9.4Other production costs € 0,49 0,12 0,12 0,12 0,12 0,13 0,13 0,13 0,13 0,14 0,14 0,13
Direct production costs € 1,86 0,80 0,81 0,83 0,85 0,86 0,88 0,90 0,92 0,93 0,95 0,87
6.10.0 Indirect production costs6.10.1Technology labour costs € 0,00 0,01 0,01 0,01 0,01 0,01 0,01 0,01 0,01 0,02 0,02 0,01
6.10.2Organisation labour costs € 0,00 0,03 0,03 0,04 0,04 0,04 0,04 0,04 0,04 0,04 0,04 0,04
6.10.3Management labour costs € 0,07 0,03 0,03 0,03 0,03 0,03 0,03 0,03 0,03 0,03 0,03 0,03
6.10.4General expenses € 0,20 0,08 0,08 0,08 0,08 0,08 0,08 0,08 0,08 0,08 0,08 0,08
6.10.5Maintenance costs € 0,15 0,02 0,02 0,02 0,03 0,03 0,03 0,03 0,03 0,03 0,03 0,03
Indirect production costs € 0,42 0,17 0,17 0,18 0,18 0,18 0,19 0,19 0,20 0,20 0,21 0,19
6.11.0 Capital costs6.11.1Depreciation costs € 0,00 0,30 0,30 0,30 0,30 0,30 0,30 0,30 0,30 0,29 0,29 0,30
6.11.2Interest costs € 0,61 0,21 0,20 0,17 0,15 0,13 0,10 0,08 0,06 0,05 0,04 0,12
Capital costs € 0,61 0,51 0,50 0,48 0,45 0,43 0,41 0,38 0,36 0,34 0,32 0,42
Total costs € 2,89 1,48 1,49 1,48 1,48 1,48 1,48 1,47 1,48 1,47 1,48 1,48
0,00
0,20
0,40
0,60
0,80
1,00
1,20
1,40
1,60
20182019
20202021
20222023
20242025
20262027
10-yearav.
Cost price (€/kg)Capital costs
Indirect production costs
Direct production costs
22

Feasibility study: Ljusdal, Zweden
Cost price (€/m^2) Unit 2017 2018 2019 2020 2021 2022 2023 2024 2025 2026 2027 10-year av.
Production m^2 75.000 75.000 75.000 75.000 75.000 75.000 75.000 75.000 75.000 75.000 75.000 75.000
6.12.0 Direct production costs6.12.1Selling costs € 0,59 3,41 3,48 3,55 3,62 3,70 3,77 3,85 3,92 4,00 4,08 3,74
6.12.2Energy & water costs € 11,15 28,54 29,11 29,69 30,29 30,89 31,51 32,14 32,79 33,44 34,11 31,25
6.12.3Production labour costs € 6,09 18,64 19,01 19,39 19,78 20,18 20,58 20,99 21,41 21,84 22,28 20,41
6.12.4Other production costs € 6,33 8,67 8,84 9,02 9,20 9,38 9,57 9,76 9,96 10,16 10,36 9,49
Direct production costs € 24,16 59,27 60,45 61,66 62,89 64,15 65,43 66,74 68,08 69,44 70,83 64,89
6.13.0 Indirect production costs6.13.1Technology labour costs € 0,96 0,96 0,98 1,00 1,02 1,04 1,06 1,08 1,10 1,12 1,15 1,05
6.13.2Organisation labour costs € 2,55 2,55 2,60 2,65 2,71 2,76 2,82 2,87 2,93 2,99 3,05 2,79
6.13.3Management labour costs € 1,92 1,92 1,96 2,00 2,03 2,08 2,12 2,16 2,20 2,25 2,29 2,10
6.13.4General expenses € 1,85 5,60 5,67 5,74 5,81 5,88 5,95 6,03 6,10 6,18 6,26 5,92
6.13.5Maintenance costs € 0,00 1,65 1,74 1,82 1,91 2,01 2,11 2,22 2,33 2,44 2,57 2,08
Indirect production costs € 7,28 12,68 12,94 13,21 13,48 13,76 14,05 14,35 14,66 14,98 15,31 13,94
6.14.0 Capital costs6.14.1Depreciation costs € 0,00 22,57 22,57 22,57 22,57 22,57 22,57 22,57 22,57 21,50 21,50 22,36
6.14.2Interest costs € 7,96 15,67 14,53 12,84 11,14 9,44 7,74 6,04 4,53 3,57 2,62 8,81
Capital costs € 7,96 38,25 37,11 35,41 33,71 32,01 30,31 28,61 27,10 25,07 24,12 31,17
Total costs € 39,39 110,20 110,50 110,28 110,08 109,92 109,80 109,71 109,84 109,49 110,25 110,01
0,00
20,00
40,00
60,00
80,00
100,00
120,00
20182019
20202021
20222023
20242025
20262027
10-yearav.
Cost price (€/m^2)Capital costs
Indirect production costs
Direct production costs
23
Feasibility study: Ljusdal, Zweden
No. 1 2 3 4 5 6 7 8 9 10 11 12
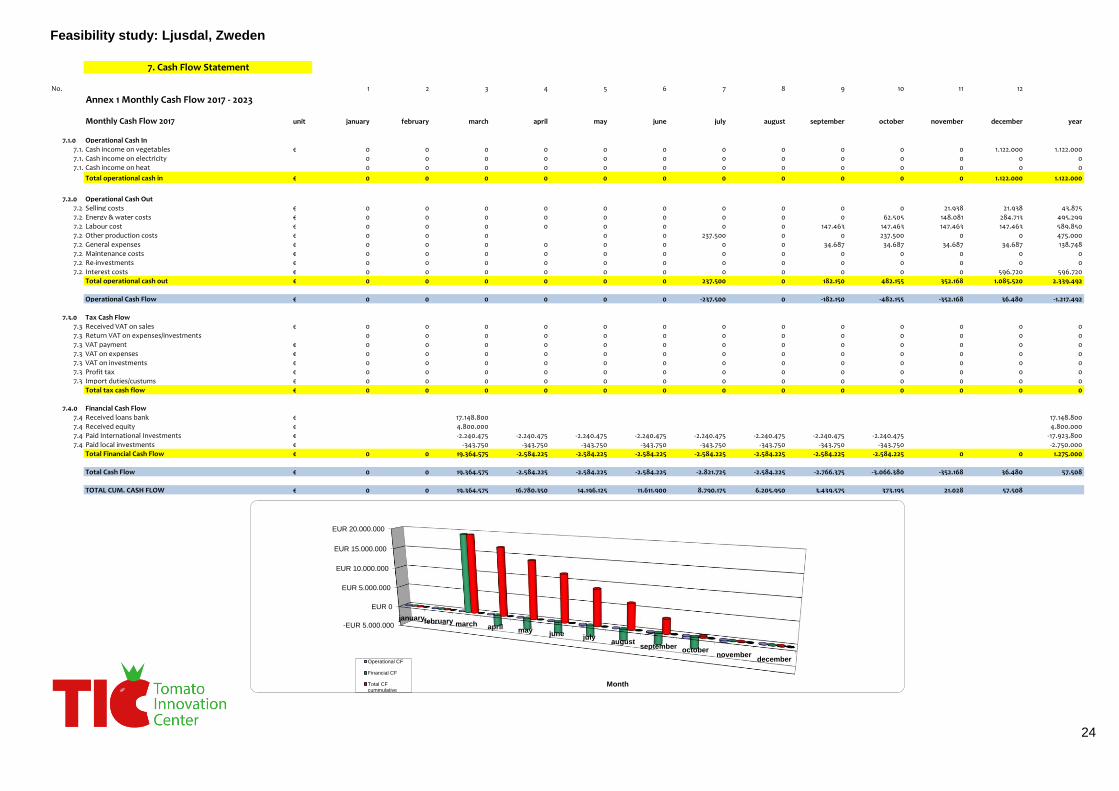
Annex 1 Monthly Cash Flow 2017 - 2023
Monthly Cash Flow 2017 unit january february march april may june july august september october november december year
7.1.0 Operational Cash In7.1.1Cash income on vegetables € 0 0 0 0 0 0 0 0 0 0 0 1.122.000 1.122.0007.1.2Cash income on electricity 0 0 0 0 0 0 0 0 0 0 0 0 07.1.3Cash income on heat 0 0 0 0 0 0 0 0 0 0 0 0 0
Total operational cash in € 0 0 0 0 0 0 0 0 0 0 0 1.122.000 1.122.000
7.2.0 Operational Cash Out7.2.1Selling costs € 0 0 0 0 0 0 0 0 0 0 21.938 21.938 43.8757.2.2Energy & water costs € 0 0 0 0 0 0 0 0 0 62.505 148.081 284.713 495.2997.2.3Labour cost € 0 0 0 0 0 0 0 0 147.463 147.463 147.463 147.463 589.8507.2.4Other production costs € 0 0 0 0 0 237.500 0 0 237.500 0 0 475.0007.2.5General expenses € 0 0 0 0 0 0 0 0 34.687 34.687 34.687 34.687 138.7487.2.6Maintenance costs € 0 0 0 0 0 0 0 0 0 0 0 0 07.2.7Re-investments € 0 0 0 0 0 0 0 0 0 0 0 0 07.2.8Interest costs € 0 0 0 0 0 0 0 0 0 0 0 596.720 596.720
Total operational cash out € 0 0 0 0 0 0 237.500 0 182.150 482.155 352.168 1.085.520 2.339.492
Operational Cash Flow € 0 0 0 0 0 0 -237.500 0 -182.150 -482.155 -352.168 36.480 -1.217.492
7.3.0 Tax Cash Flow7.3.1Received VAT on sales € 0 0 0 0 0 0 0 0 0 0 0 0 07.3.2Return VAT on expenses/investments 0 0 0 0 0 0 0 0 0 0 0 0 07.3.3VAT payment € 0 0 0 0 0 0 0 0 0 0 0 0 07.3.4VAT on expenses € 0 0 0 0 0 0 0 0 0 0 0 0 07.3.5VAT on investments € 0 0 0 0 0 0 0 0 0 0 0 0 07.3.6Profit tax € 0 0 0 0 0 0 0 0 0 0 0 0 07.3.7Import duties/custums € 0 0 0 0 0 0 0 0 0 0 0 0 0
Total tax cash flow € 0 0 0 0 0 0 0 0 0 0 0 0 0
7.4.0 Financial Cash Flow7.4.1Received loans bank € 17.148.800 17.148.8007.4.2Received equity € 4.800.000 4.800.0007.4.3Paid International Investments € -2.240.475 -2.240.475 -2.240.475 -2.240.475 -2.240.475 -2.240.475 -2.240.475 -2.240.475 -17.923.8007.4.4Paid local investments € -343.750 -343.750 -343.750 -343.750 -343.750 -343.750 -343.750 -343.750 -2.750.000
Total Financial Cash Flow € 0 0 19.364.575 -2.584.225 -2.584.225 -2.584.225 -2.584.225 -2.584.225 -2.584.225 -2.584.225 0 0 1.275.000
Total Cash Flow € 0 0 19.364.575 -2.584.225 -2.584.225 -2.584.225 -2.821.725 -2.584.225 -2.766.375 -3.066.380 -352.168 36.480 57.508
TOTAL CUM. CASH FLOW € 0 0 19.364.575 16.780.350 14.196.125 11.611.900 8.790.175 6.205.950 3.439.575 373.195 21.028 57.508
7. Cash Flow Statement
-EUR 5.000.000
EUR 0
EUR 5.000.000
EUR 10.000.000
EUR 15.000.000
EUR 20.000.000
januaryfebruary march april mayjune
julyaugust
septemberoctober
novemberdecember
Month
Operational CF
Financial CF
Total CFcummulative
24
Feasibility study: Ljusdal, Zweden
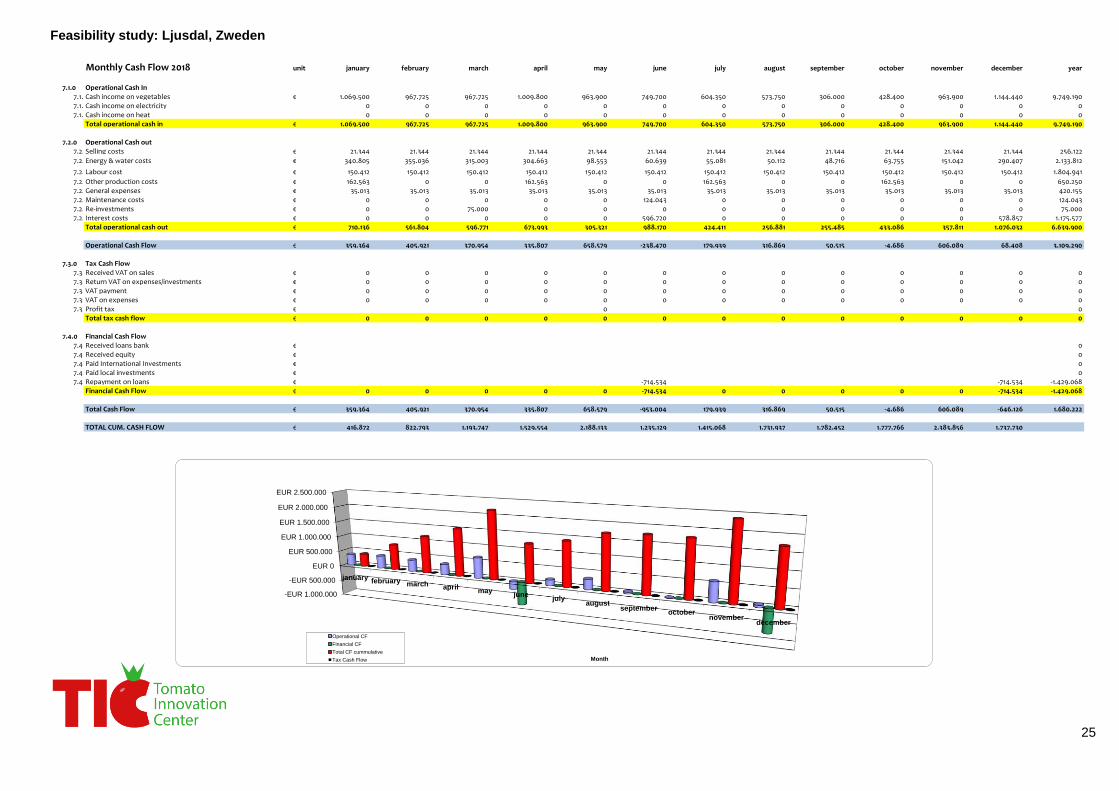
Monthly Cash Flow 2018 unit january february march april may june july august september october november december year
7.1.0 Operational Cash In7.1.1Cash income on vegetables € 1.069.500 967.725 967.725 1.009.800 963.900 749.700 604.350 573.750 306.000 428.400 963.900 1.144.440 9.749.1907.1.2Cash income on electricity 0 0 0 0 0 0 0 0 0 0 0 0 07.1.3Cash income on heat 0 0 0 0 0 0 0 0 0 0 0 0 0
Total operational cash in € 1.069.500 967.725 967.725 1.009.800 963.900 749.700 604.350 573.750 306.000 428.400 963.900 1.144.440 9.749.190
7.2.0 Operational Cash out7.2.1Selling costs € 21.344 21.344 21.344 21.344 21.344 21.344 21.344 21.344 21.344 21.344 21.344 21.344 256.122
7.2.2Energy & water costs € 340.805 355.036 315.003 304.663 98.553 60.639 55.081 50.112 48.716 63.755 151.042 290.407 2.133.812
7.2.3Labour cost € 150.412 150.412 150.412 150.412 150.412 150.412 150.412 150.412 150.412 150.412 150.412 150.412 1.804.941
7.2.4Other production costs € 162.563 0 0 162.563 0 0 162.563 0 0 162.563 0 0 650.2507.2.5General expenses € 35.013 35.013 35.013 35.013 35.013 35.013 35.013 35.013 35.013 35.013 35.013 35.013 420.1557.2.6Maintenance costs € 0 0 0 0 0 124.043 0 0 0 0 0 0 124.0437.2.7Re-investments € 0 0 75.000 0 0 0 0 0 0 0 0 0 75.0007.2.8Interest costs € 0 0 0 0 0 596.720 0 0 0 0 0 578.857 1.175.577
Total operational cash out € 710.136 561.804 596.771 673.993 305.321 988.170 424.411 256.881 255.485 433.086 357.811 1.076.032 6.639.900
Operational Cash Flow € 359.364 405.921 370.954 335.807 658.579 -238.470 179.939 316.869 50.515 -4.686 606.089 68.408 3.109.290
7.3.0 Tax Cash Flow7.3.1Received VAT on sales € 0 0 0 0 0 0 0 0 0 0 0 0 07.3.2Return VAT on expenses/investments € 0 0 0 0 0 0 0 0 0 0 0 0 07.3.3VAT payment € 0 0 0 0 0 0 0 0 0 0 0 0 07.3.4VAT on expenses € 0 0 0 0 0 0 0 0 0 0 0 0 07.3.5Profit tax € 0 0
Total tax cash flow € 0 0 0 0 0 0 0 0 0 0 0 0 0
7.4.0 Financial Cash Flow7.4.1Received loans bank € 07.4.2Received equity € 07.4.3Paid International Investments € 07.4.4Paid local investments € 07.4.5Repayment on loans € -714.534 -714.534 -1.429.068
Financial Cash Flow € 0 0 0 0 0 -714.534 0 0 0 0 0 -714.534 -1.429.068
Total Cash Flow € 359.364 405.921 370.954 335.807 658.579 -953.004 179.939 316.869 50.515 -4.686 606.089 -646.126 1.680.222
TOTAL CUM. CASH FLOW € 416.872 822.793 1.193.747 1.529.554 2.188.133 1.235.129 1.415.068 1.731.937 1.782.452 1.777.766 2.383.856 1.737.730
-EUR 1.000.000
-EUR 500.000
EUR 0
EUR 500.000
EUR 1.000.000
EUR 1.500.000
EUR 2.000.000
EUR 2.500.000
january february march aprilmay
junejuly
augustseptember
octobernovember
december
Month
Operational CF
Financial CF
Total CF cummulative
Tax Cash Flow
25
Feasibility study: Ljusdal, Zweden
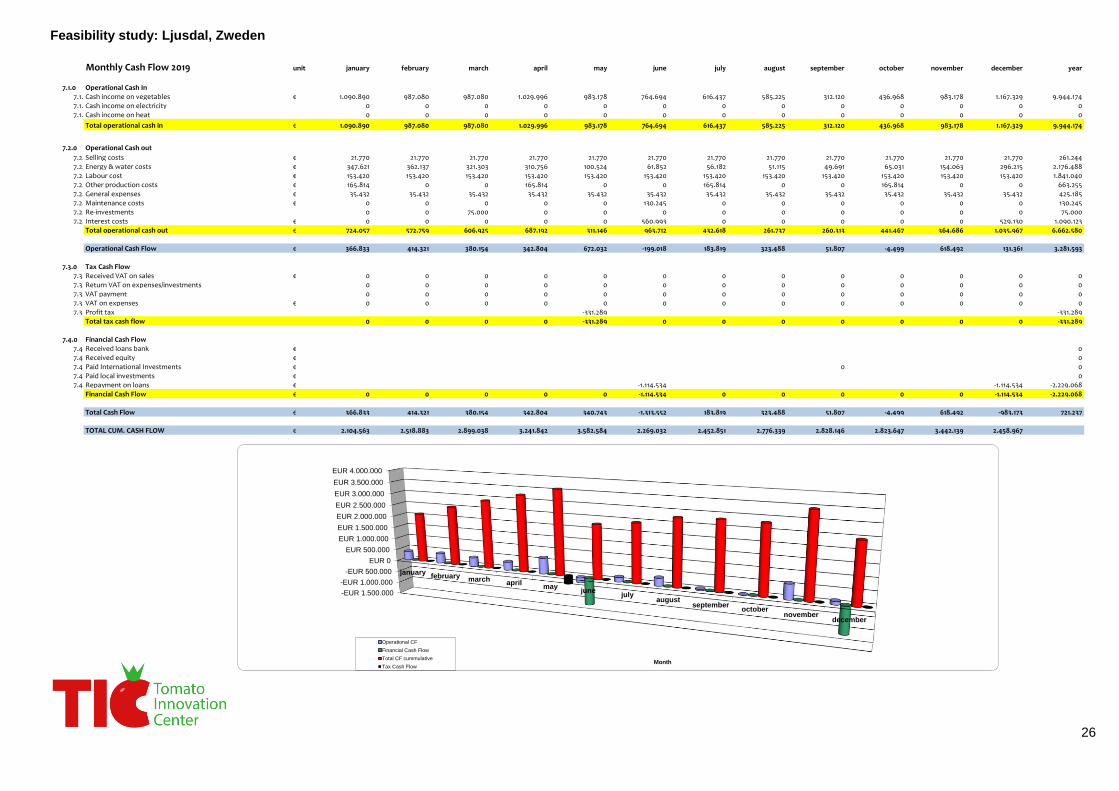
Monthly Cash Flow 2019 unit january february march april may june july august september october november december year
7.1.0 Operational Cash In7.1.1Cash income on vegetables € 1.090.890 987.080 987.080 1.029.996 983.178 764.694 616.437 585.225 312.120 436.968 983.178 1.167.329 9.944.1747.1.2Cash income on electricity 0 0 0 0 0 0 0 0 0 0 0 0 07.1.3Cash income on heat 0 0 0 0 0 0 0 0 0 0 0 0 0
Total operational cash in € 1.090.890 987.080 987.080 1.029.996 983.178 764.694 616.437 585.225 312.120 436.968 983.178 1.167.329 9.944.174
7.2.0 Operational Cash out
7.2.1Selling costs € 21.770 21.770 21.770 21.770 21.770 21.770 21.770 21.770 21.770 21.770 21.770 21.770 261.2447.2.2Energy & water costs € 347.621 362.137 321.303 310.756 100.524 61.852 56.182 51.115 49.691 65.031 154.063 296.215 2.176.4887.2.3Labour cost € 153.420 153.420 153.420 153.420 153.420 153.420 153.420 153.420 153.420 153.420 153.420 153.420 1.841.0407.2.4Other production costs € 165.814 0 0 165.814 0 0 165.814 0 0 165.814 0 0 663.2557.2.5General expenses € 35.432 35.432 35.432 35.432 35.432 35.432 35.432 35.432 35.432 35.432 35.432 35.432 425.1857.2.6Maintenance costs € 0 0 0 0 0 130.245 0 0 0 0 0 0 130.2457.2.7Re-investments 0 0 75.000 0 0 0 0 0 0 0 0 0 75.0007.2.8Interest costs € 0 0 0 0 0 560.993 0 0 0 0 0 529.130 1.090.123
Total operational cash out € 724.057 572.759 606.925 687.192 311.146 963.712 432.618 261.737 260.313 441.467 364.686 1.035.967 6.662.580
Operational Cash Flow € 366.833 414.321 380.154 342.804 672.032 -199.018 183.819 323.488 51.807 -4.499 618.492 131.361 3.281.593
7.3.0 Tax Cash Flow7.3.1Received VAT on sales € 0 0 0 0 0 0 0 0 0 0 0 0 07.3.2Return VAT on expenses/investments 0 0 0 0 0 0 0 0 0 0 0 0 07.3.3VAT payment 0 0 0 0 0 0 0 0 0 0 0 0 07.3.4VAT on expenses € 0 0 0 0 0 0 0 0 0 0 0 0 07.3.5Profit tax -331.289 -331.289
Total tax cash flow 0 0 0 0 -331.289 0 0 0 0 0 0 0 -331.289
7.4.0 Financial Cash Flow7.4.1Received loans bank € 07.4.2Received equity € 07.4.3Paid International Investments € 0 07.4.4Paid local investments € 07.4.5Repayment on loans € -1.114.534 -1.114.534 -2.229.068
Financial Cash Flow € 0 0 0 0 0 -1.114.534 0 0 0 0 0 -1.114.534 -2.229.068
Total Cash Flow € 366.833 414.321 380.154 342.804 340.743 -1.313.552 183.819 323.488 51.807 -4.499 618.492 -983.173 721.237
TOTAL CUM. CASH FLOW € 2.104.563 2.518.883 2.899.038 3.241.842 3.582.584 2.269.032 2.452.851 2.776.339 2.828.146 2.823.647 3.442.139 2.458.967
-EUR 1.500.000
-EUR 1.000.000
-EUR 500.000
EUR 0
EUR 500.000
EUR 1.000.000
EUR 1.500.000
EUR 2.000.000
EUR 2.500.000
EUR 3.000.000
EUR 3.500.000
EUR 4.000.000
januaryfebruary march
aprilmay
junejuly
augustseptember
octobernovember
december
Month
Operational CF
Financial Cash Flow
Total CF cummulative
Tax Cash Flow
26

Feasibility study: Ljusdal, Zweden
Monthly Cash Flow 2020 unit january february march april may june july august september october november december year
7.1.0 Operational Cash In7.1.1Cash income on vegetables € 1.112.708 1.006.821 1.006.821 1.050.596 1.002.842 779.988 628.766 596.930 318.362 445.707 1.002.842 1.190.675 10.143.0577.1.2Cash income on electricity 0 0 0 0 0 0 0 0 0 0 0 0 07.1.3Cash income on heat 0 0 0 0 0 0 0 0 0 0 0 0 0
Total operational cash in € 1.112.708 1.006.821 1.006.821 1.050.596 1.002.842 779.988 628.766 596.930 318.362 445.707 1.002.842 1.190.675 10.143.057
7.2.0 Operational Cash out
7.2.1Selling costs € 22.206 22.206 22.206 22.206 22.206 22.206 22.206 22.206 22.206 22.206 22.206 22.206 266.469
7.2.2Energy & water costs € 354.574 369.379 327.729 316.971 102.534 63.089 57.306 52.137 50.685 66.331 157.144 302.139 2.220.018
7.2.3Labour cost € 156.488 156.488 156.488 156.488 156.488 156.488 156.488 156.488 156.488 156.488 156.488 156.488 1.877.8617.2.4Other production costs € 169.130 0 0 169.130 0 0 169.130 0 0 169.130 0 0 676.5207.2.5General expenses € 35.860 35.860 35.860 35.860 35.860 35.860 35.860 35.860 35.860 35.860 35.860 35.860 430.3147.2.6Maintenance costs € 0 0 0 0 0 136.757 0 0 0 0 0 0 136.7577.2.7Re-investments 0 0 75.000 0 0 0 0 0 0 0 0 0 75.0007.2.8Interest costs € 0 0 0 0 0 497.267 0 0 0 0 0 465.403 962.670
Total operational cash out € 738.257 583.933 617.282 700.655 317.088 911.666 440.990 266.691 265.238 450.015 371.698 982.096 6.645.609
Operational Cash Flow € 374.451 422.888 389.539 349.941 685.753 -131.678 187.776 330.239 53.124 -4.308 631.143 208.579 3.497.448
7.3.0 Tax Cash Flow7.3.1Received VAT on sales € 0 0 0 0 0 0 0 0 0 0 0 0 07.3.2Return VAT on expenses/investments 0 0 0 0 0 0 0 0 0 0 0 0 07.3.3VAT payment € 0 0 0 0 0 0 0 0 0 0 0 0 07.3.4VAT on expenses € 0 0 0 0 0 0 0 0 0 0 0 0 07.3.5Profit tax € -369.260 -369.260
Total tax cash flow 0 0 0 0 -369.260 0 0 0 0 0 0 0 -369.260
7.4.0 Financial Cash Flow7.4.1Received loans bank € 07.4.2Received equity € 07.4.3Paid International Investments € 0 07.4.4Paid local investments € 07.4.5Repayment on loans € -1.114.534 -1.114.534 -2.229.068
Financial Cash Flow € 0 0 0 0 0 -1.114.534 0 0 0 0 0 -1.114.534 -2.229.068
Total Cash Flow € 374.451 422.888 389.539 349.941 316.494 -1.246.212 187.776 330.239 53.124 -4.308 631.143 -905.955 899.120
TOTAL CUM. CASH FLOW € 2.833.417 3.256.305 3.645.844 3.995.785 4.312.279 3.066.067 3.253.843 3.584.082 3.637.206 3.632.898 4.264.042 3.358.087
-EUR 2.000.000
-EUR 1.000.000
EUR 0
EUR 1.000.000
EUR 2.000.000
EUR 3.000.000
EUR 4.000.000
EUR 5.000.000
januaryfebruary march april
mayjune
julyaugust
septemberoctober
novemberdecember
Month
Operational CF
Financial CF
Total CF cummulative
Tax Cash Flow
27

Feasibility study: Ljusdal, Zweden
Monthly Cash Flow 2021 unit january february march april may june july august september october november december year
7.1.0 Operational Cash In7.1.1Cash income on vegetables € 1.134.962 1.026.958 1.026.958 1.071.608 1.022.898 795.588 641.341 608.868 324.730 454.622 1.022.898 1.214.489 10.345.9187.1.2Cash income on electricity 0 0 0 0 0 0 0 0 0 0 0 0 07.1.3Cash income on heat 0 0 0 0 0 0 0 0 0 0 0 0 0
Total operational cash in € 1.134.962 1.026.958 1.026.958 1.071.608 1.022.898 795.588 641.341 608.868 324.730 454.622 1.022.898 1.214.489 10.345.918
7.2.0 Operational Cash out7.2.1Selling costs € 22.650 22.650 22.650 22.650 22.650 22.650 22.650 22.650 22.650 22.650 22.650 22.650 271.799
7.2.2Energy & water costs € 361.665 376.767 334.283 323.311 104.585 64.350 58.452 53.180 51.698 67.658 160.287 308.182 2.264.418
7.2.3Labour cost € 159.618 159.618 159.618 159.618 159.618 159.618 159.618 159.618 159.618 159.618 159.618 159.618 1.915.418
7.2.4Other production costs € 172.513 0 0 172.513 0 0 172.513 0 0 172.513 0 0 690.0517.2.5General expenses € 36.296 36.296 36.296 36.296 36.296 36.296 36.296 36.296 36.296 36.296 36.296 36.296 435.5477.2.6Maintenance costs € 0 0 0 0 0 143.595 0 0 0 0 0 0 143.5957.2.7Re-investments 0 0 75.000 0 0 0 0 0 0 0 0 0 75.0007.2.8Interest costs € 0 0 0 0 0 433.540 0 0 0 0 0 401.677 835.216
Total operational cash out € 752.741 595.330 627.847 714.387 323.149 860.049 449.528 271.743 270.262 458.734 378.851 928.422 6.631.044
Operational Cash Flow € 382.221 431.627 399.111 357.221 699.750 -64.461 191.813 337.125 54.468 -4.113 644.047 286.067 3.714.875
7.3.0 Tax Cash Flow7.3.1Received VAT on sales € 0 0 0 0 0 0 0 0 0 0 0 0 07.3.2Return VAT on expenses/investments € 0 0 0 0 0 0 0 0 0 0 0 0 07.3.3VAT payment € 0 0 0 0 0 0 0 0 0 0 0 0 07.3.4VAT on expenses € 0 0 0 0 0 0 0 0 0 0 0 0 07.3.5Profit tax € -416.813 -416.813
Total tax cash flow € 0 0 0 0 -416.813 0 0 0 0 0 0 0 -416.813
7.4.0 Financial Cash Flow7.4.1Received loans bank € 07.4.2Received equity € 07.4.3Paid International Investments € 07.4.4Paid local investments € 07.4.5Repayment on loans € -1.114.534 -1.114.534 -2.229.068
Financial Cash Flow € 0 0 0 0 0 -1.114.534 0 0 0 0 0 -1.114.534 -2.229.068
Total Cash Flow € 382.221 431.627 399.111 357.221 282.937 -1.178.995 191.813 337.125 54.468 -4.113 644.047 -828.467 1.068.994
TOTAL CUM. CASH FLOW € 3.740.307 4.171.935 4.571.045 4.928.266 5.211.203 4.032.208 4.224.020 4.561.145 4.615.613 4.611.501 5.255.548 4.427.081
-EUR 2.000.000
-EUR 1.000.000
EUR 0
EUR 1.000.000
EUR 2.000.000
EUR 3.000.000
EUR 4.000.000
EUR 5.000.000
EUR 6.000.000
januaryfebruary march april
mayjune
julyaugust
septemberoctober
novemberdecember
Month
Operational CF
Financial CF
Total CF cummulative
Tax Cash Flow
28
Feasibility study: Ljusdal, Zweden
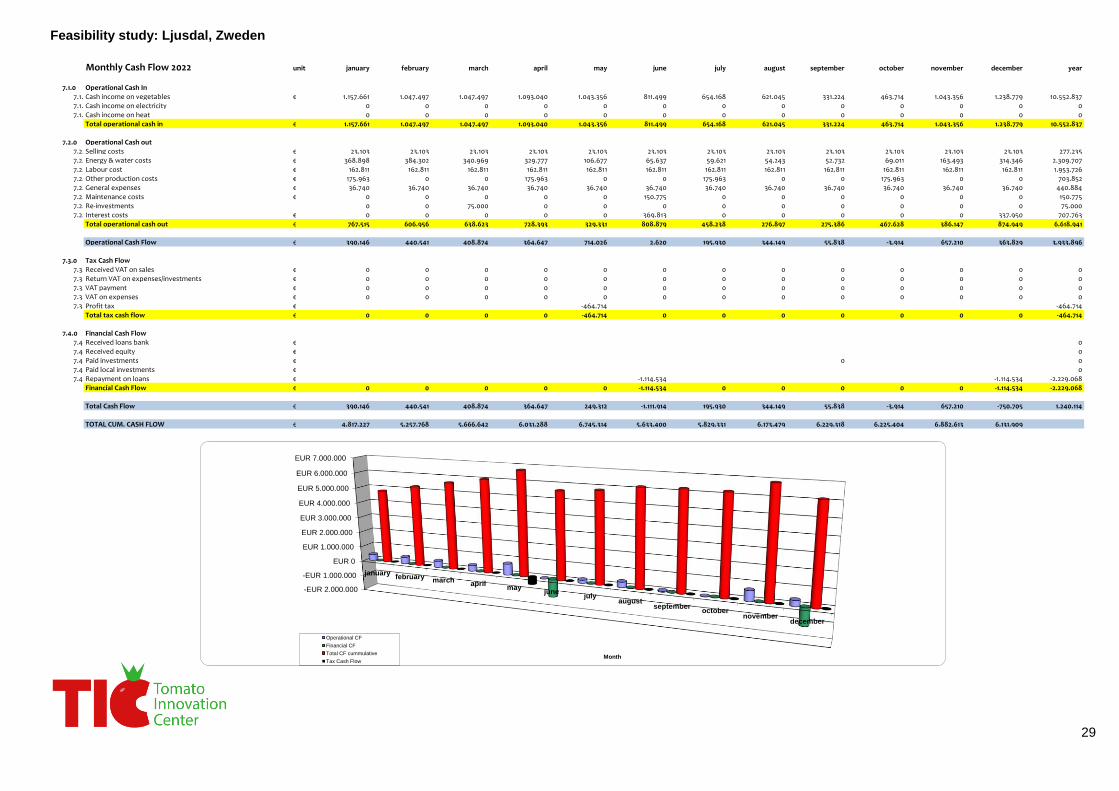
Monthly Cash Flow 2022 unit january february march april may june july august september october november december year
7.1.0 Operational Cash In7.1.1Cash income on vegetables € 1.157.661 1.047.497 1.047.497 1.093.040 1.043.356 811.499 654.168 621.045 331.224 463.714 1.043.356 1.238.779 10.552.8377.1.2Cash income on electricity 0 0 0 0 0 0 0 0 0 0 0 0 07.1.3Cash income on heat 0 0 0 0 0 0 0 0 0 0 0 0 0
Total operational cash in € 1.157.661 1.047.497 1.047.497 1.093.040 1.043.356 811.499 654.168 621.045 331.224 463.714 1.043.356 1.238.779 10.552.837
7.2.0 Operational Cash out7.2.1Selling costs € 23.103 23.103 23.103 23.103 23.103 23.103 23.103 23.103 23.103 23.103 23.103 23.103 277.2357.2.2Energy & water costs € 368.898 384.302 340.969 329.777 106.677 65.637 59.621 54.243 52.732 69.011 163.493 314.346 2.309.7077.2.3Labour cost € 162.811 162.811 162.811 162.811 162.811 162.811 162.811 162.811 162.811 162.811 162.811 162.811 1.953.7267.2.4Other production costs € 175.963 0 0 175.963 0 0 175.963 0 0 175.963 0 0 703.8527.2.5General expenses € 36.740 36.740 36.740 36.740 36.740 36.740 36.740 36.740 36.740 36.740 36.740 36.740 440.8847.2.6Maintenance costs € 0 0 0 0 0 150.775 0 0 0 0 0 0 150.7757.2.7Re-investments 0 0 75.000 0 0 0 0 0 0 0 0 0 75.0007.2.8Interest costs € 0 0 0 0 0 369.813 0 0 0 0 0 337.950 707.763
Total operational cash out € 767.515 606.956 638.623 728.393 329.331 808.879 458.238 276.897 275.386 467.628 386.147 874.949 6.618.941
Operational Cash Flow € 390.146 440.541 408.874 364.647 714.026 2.620 195.930 344.149 55.838 -3.914 657.210 363.829 3.933.896
7.3.0 Tax Cash Flow7.3.1Received VAT on sales € 0 0 0 0 0 0 0 0 0 0 0 0 07.3.2Return VAT on expenses/investments € 0 0 0 0 0 0 0 0 0 0 0 0 07.3.3VAT payment € 0 0 0 0 0 0 0 0 0 0 0 0 07.3.4VAT on expenses € 0 0 0 0 0 0 0 0 0 0 0 0 07.3.5Profit tax € -464.714 -464.714
Total tax cash flow € 0 0 0 0 -464.714 0 0 0 0 0 0 0 -464.714
7.4.0 Financial Cash Flow7.4.1Received loans bank € 07.4.2Received equity € 07.4.3Paid investments € 0 07.4.4Paid local investments € 07.4.5Repayment on loans € -1.114.534 -1.114.534 -2.229.068
Financial Cash Flow € 0 0 0 0 0 -1.114.534 0 0 0 0 0 -1.114.534 -2.229.068
Total Cash Flow € 390.146 440.541 408.874 364.647 249.312 -1.111.914 195.930 344.149 55.838 -3.914 657.210 -750.705 1.240.114
TOTAL CUM. CASH FLOW € 4.817.227 5.257.768 5.666.642 6.031.288 6.745.314 5.633.400 5.829.331 6.173.479 6.229.318 6.225.404 6.882.613 6.131.909
-EUR 2.000.000
-EUR 1.000.000
EUR 0
EUR 1.000.000
EUR 2.000.000
EUR 3.000.000
EUR 4.000.000
EUR 5.000.000
EUR 6.000.000
EUR 7.000.000
januaryfebruary march
aprilmay
junejuly
augustseptember
octobernovember
december
Month
Operational CF
Financial CF
Total CF cummulative
Tax Cash Flow
29

Feasibility study: Ljusdal, Zweden
Monthly Cash Flow 2023 unit january february march april may june july august september october november december year
7.1.0 Operational Cash In7.1.1Cash income on vegetables € 1.180.814 1.068.447 1.068.447 1.114.901 1.064.223 827.729 667.251 633.466 337.849 472.988 1.064.223 1.263.554 10.763.8947.1.2Cash income on electricity 0 0 0 0 0 0 0 0 0 0 0 0 07.1.3Cash income on heat 0 0 0 0 0 0 0 0 0 0 0 0 0
Total operational cash in € 1.180.814 1.068.447 1.068.447 1.114.901 1.064.223 827.729 667.251 633.466 337.849 472.988 1.064.223 1.263.554 10.763.894
7.2.0 Operational Cash out7.2.1Selling costs € 23.565 23.565 23.565 23.565 23.565 23.565 23.565 23.565 23.565 23.565 23.565 23.565 282.7797.2.2Energy & water costs € 376.276 391.988 347.788 336.372 108.810 66.950 60.813 55.328 53.787 70.391 166.763 320.633 2.355.9017.2.3Labour cost € 166.067 166.067 166.067 166.067 166.067 166.067 166.067 166.067 166.067 166.067 166.067 166.067 1.992.8017.2.4Other production costs € 179.482 0 0 179.482 0 0 179.482 0 0 179.482 0 0 717.9297.2.5General expenses € 37.194 37.194 37.194 37.194 37.194 37.194 37.194 37.194 37.194 37.194 37.194 37.194 446.3277.2.6Maintenance costs € 0 0 0 0 0 158.314 0 0 0 0 0 0 158.3147.2.7Re-investments 0 0 75.000 0 0 0 0 0 0 0 0 0 75.0007.2.8Interest costs € 0 0 0 0 0 306.087 0 0 0 0 0 274.223 580.310
Total operational cash out € 782.584 618.814 649.614 742.680 335.636 758.176 467.121 282.154 280.612 476.699 393.589 821.682 6.609.360
Operational Cash Flow € 398.230 449.633 418.833 372.221 728.588 69.554 200.130 351.313 57.236 -3.711 670.635 441.873 4.154.533
7.3.0 Tax Cash Flow7.3.1Received VAT on sales € 0 0 0 0 0 0 0 0 0 0 0 0 07.3.2Return VAT on expenses/investments € 0 0 0 0 0 0 0 0 0 0 0 0 07.3.3VAT payment € 0 0 0 0 0 0 0 0 0 0 0 0 07.3.4VAT on expenses € 0 0 0 0 0 0 0 0 0 0 0 0 07.3.5Profit tax € -512.966 -512.966
Total tax cash flow € 0 0 0 0 -512.966 0 0 0 0 0 0 0 -512.966
7.4.0 Financial Cash Flow7.4.1Received loans bank € 07.4.2Received equity € 07.4.3Paid investments € 07.4.4Paid local investments € 07.4.5Repayment on loans € -1.114.534 -1.114.534 -2.229.068
Financial Cash Flow € 0 0 0 0 0 -1.114.534 0 0 0 0 0 -1.114.534 -2.229.0680
Total Cash Flow € 398.230 449.633 418.833 372.221 215.621 -1.044.980 200.130 351.313 57.236 -3.711 670.635 -672.661 1.412.499
TOTAL CUM. CASH FLOW € 6.530.139 6.979.772 7.398.605 7.770.825 7.986.446 6.941.466 7.141.596 7.492.909 7.550.145 7.546.434 8.217.069 7.544.408
-EUR 2.000.000
-EUR 1.000.000
EUR 0
EUR 1.000.000
EUR 2.000.000
EUR 3.000.000
EUR 4.000.000
EUR 5.000.000
EUR 6.000.000
EUR 7.000.000
EUR 8.000.000
EUR 9.000.000
januaryfebruary
marchapril
mayjune
julyaugust
septemberoctober
novemberdecember
Month
Operational CF
Financial CF
Total CF cummulative
Tax Cash Flow
30
Feasibility study: Ljusdal, Zweden
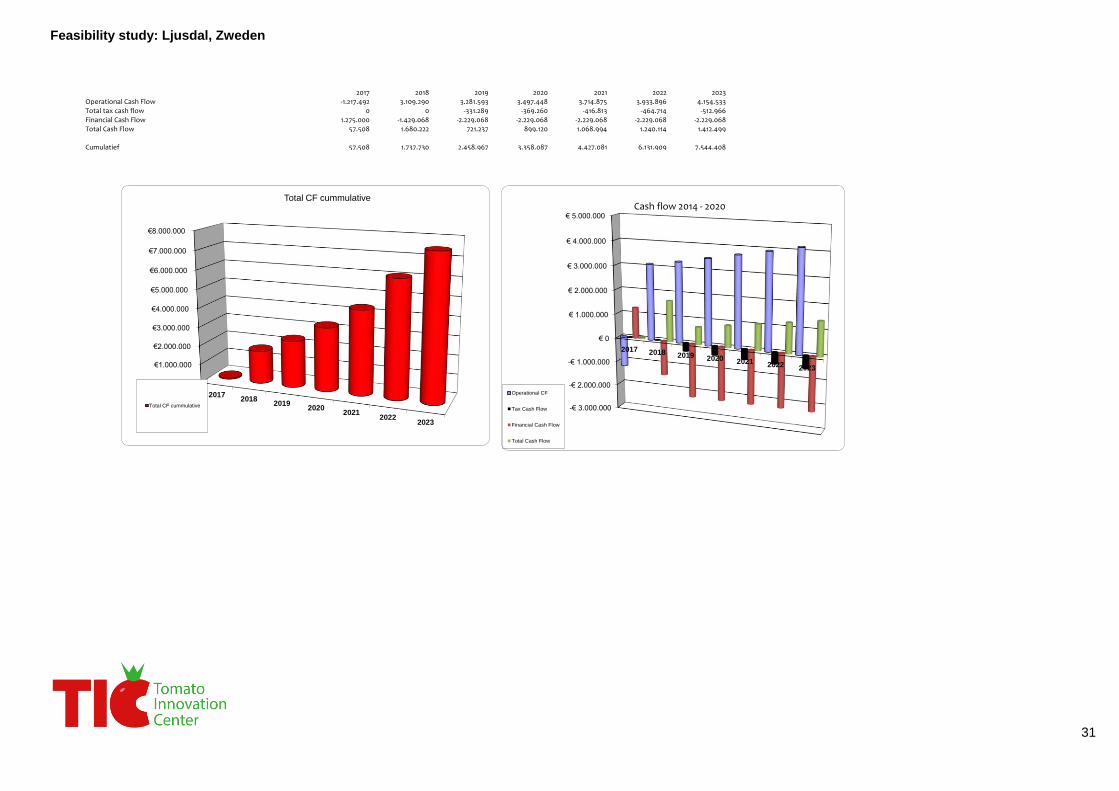
2017 2018 2019 2020 2021 2022 2023Operational Cash Flow -1.217.492 3.109.290 3.281.593 3.497.448 3.714.875 3.933.896 4.154.533Total tax cash flow 0 0 -331.289 -369.260 -416.813 -464.714 -512.966Financial Cash Flow 1.275.000 -1.429.068 -2.229.068 -2.229.068 -2.229.068 -2.229.068 -2.229.068Total Cash Flow 57.508 1.680.222 721.237 899.120 1.068.994 1.240.114 1.412.499
Cumulatief 57.508 1.737.730 2.458.967 3.358.087 4.427.081 6.131.909 7.544.408
-€ 3.000.000
-€ 2.000.000
-€ 1.000.000
€ 0
€ 1.000.000
€ 2.000.000
€ 3.000.000
€ 4.000.000
€ 5.000.000
2017 2018 2019 2020 2021 2022 2023
Operational CF
Tax Cash Flow
Financial Cash Flow
Total Cash Flow
Cash flow 2014 - 2020
€-
€1.000.000
€2.000.000
€3.000.000
€4.000.000
€5.000.000
€6.000.000
€7.000.000
€8.000.000
20172018
20192020
20212022
2023
Total CF cummulative
Total CF cummulative
31
Feasibility study: Ljusdal, Zweden
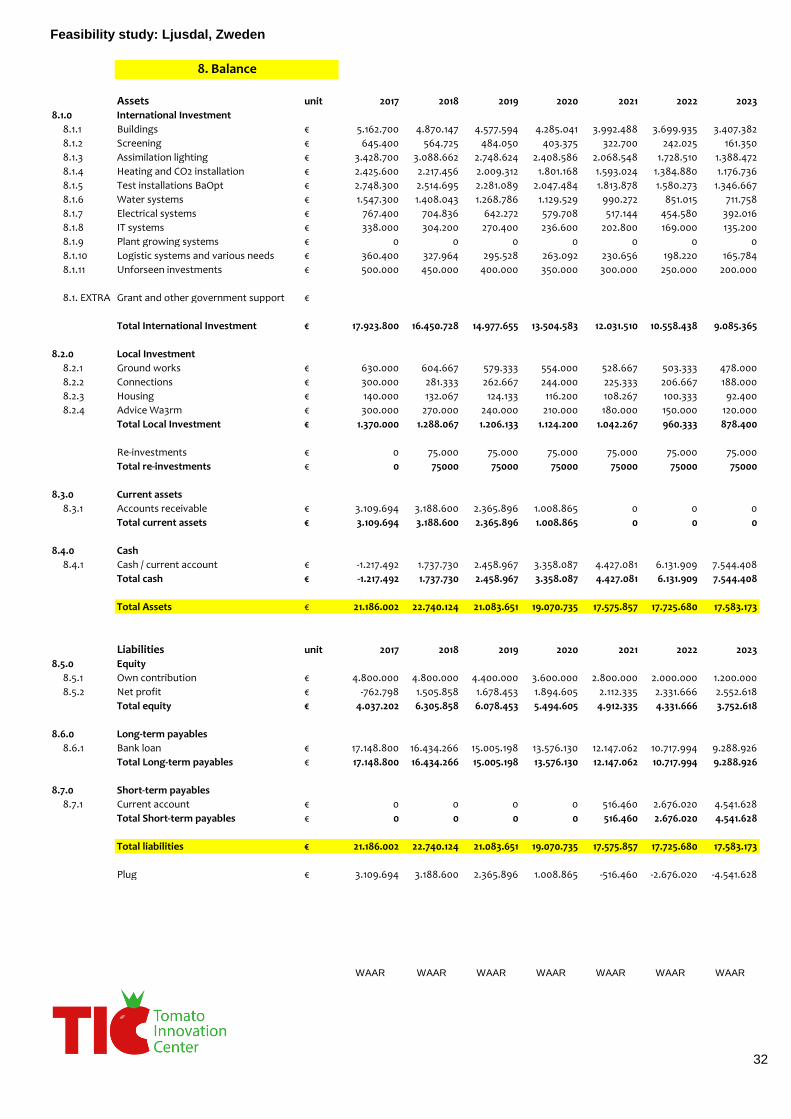
Assets unit 2017 2018 2019 2020 2021 2022 2023
8.1.0 International Investment
8.1.1 Buildings € 5.162.700 4.870.147 4.577.594 4.285.041 3.992.488 3.699.935 3.407.382
8.1.2 Screening € 645.400 564.725 484.050 403.375 322.700 242.025 161.350
8.1.3 Assimilation lighting € 3.428.700 3.088.662 2.748.624 2.408.586 2.068.548 1.728.510 1.388.472
8.1.4 Heating and CO2 installation € 2.425.600 2.217.456 2.009.312 1.801.168 1.593.024 1.384.880 1.176.736
8.1.5 Test installations BaOpt € 2.748.300 2.514.695 2.281.089 2.047.484 1.813.878 1.580.273 1.346.667
8.1.6 Water systems € 1.547.300 1.408.043 1.268.786 1.129.529 990.272 851.015 711.758
8.1.7 Electrical systems € 767.400 704.836 642.272 579.708 517.144 454.580 392.016
8.1.8 IT systems € 338.000 304.200 270.400 236.600 202.800 169.000 135.200
8.1.9 Plant growing systems € 0 0 0 0 0 0 0
8.1.10 Logistic systems and various needs € 360.400 327.964 295.528 263.092 230.656 198.220 165.784
8.1.11 Unforseen investments € 500.000 450.000 400.000 350.000 300.000 250.000 200.000
8.1. EXTRA Grant and other government support €
Total International Investment € 17.923.800 16.450.728 14.977.655 13.504.583 12.031.510 10.558.438 9.085.365
8.2.0 Local Investment
8.2.1 Ground works € 630.000 604.667 579.333 554.000 528.667 503.333 478.000
8.2.2 Connections € 300.000 281.333 262.667 244.000 225.333 206.667 188.000
8.2.3 Housing € 140.000 132.067 124.133 116.200 108.267 100.333 92.400
8.2.4 Advice Wa3rm € 300.000 270.000 240.000 210.000 180.000 150.000 120.000
Total Local Investment € 1.370.000 1.288.067 1.206.133 1.124.200 1.042.267 960.333 878.400
Re-investments € 0 75.000 75.000 75.000 75.000 75.000 75.000
Total re-investments € 0 75000 75000 75000 75000 75000 75000
8.3.0 Current assets
8.3.1 Accounts receivable € 3.109.694 3.188.600 2.365.896 1.008.865 0 0 0
Total current assets € 3.109.694 3.188.600 2.365.896 1.008.865 0 0 0
8.4.0 Cash
8.4.1 Cash / current account € -1.217.492 1.737.730 2.458.967 3.358.087 4.427.081 6.131.909 7.544.408
Total cash € -1.217.492 1.737.730 2.458.967 3.358.087 4.427.081 6.131.909 7.544.408
Total Assets € 21.186.002 22.740.124 21.083.651 19.070.735 17.575.857 17.725.680 17.583.173
Liabilities unit 2017 2018 2019 2020 2021 2022 2023
8.5.0 Equity
8.5.1 Own contribution € 4.800.000 4.800.000 4.400.000 3.600.000 2.800.000 2.000.000 1.200.000
8.5.2 Net profit € -762.798 1.505.858 1.678.453 1.894.605 2.112.335 2.331.666 2.552.618
Total equity € 4.037.202 6.305.858 6.078.453 5.494.605 4.912.335 4.331.666 3.752.618
8.6.0 Long-term payables
8.6.1 Bank loan € 17.148.800 16.434.266 15.005.198 13.576.130 12.147.062 10.717.994 9.288.926
Total Long-term payables € 17.148.800 16.434.266 15.005.198 13.576.130 12.147.062 10.717.994 9.288.926
8.7.0 Short-term payables
8.7.1 Current account € 0 0 0 0 516.460 2.676.020 4.541.628
Total Short-term payables € 0 0 0 0 516.460 2.676.020 4.541.628
Total liabilities € 21.186.002 22.740.124 21.083.651 19.070.735 17.575.857 17.725.680 17.583.173
Plug € 3.109.694 3.188.600 2.365.896 1.008.865 -516.460 -2.676.020 -4.541.628
WAAR WAAR WAAR WAAR WAAR WAAR WAAR
8. Balance
32
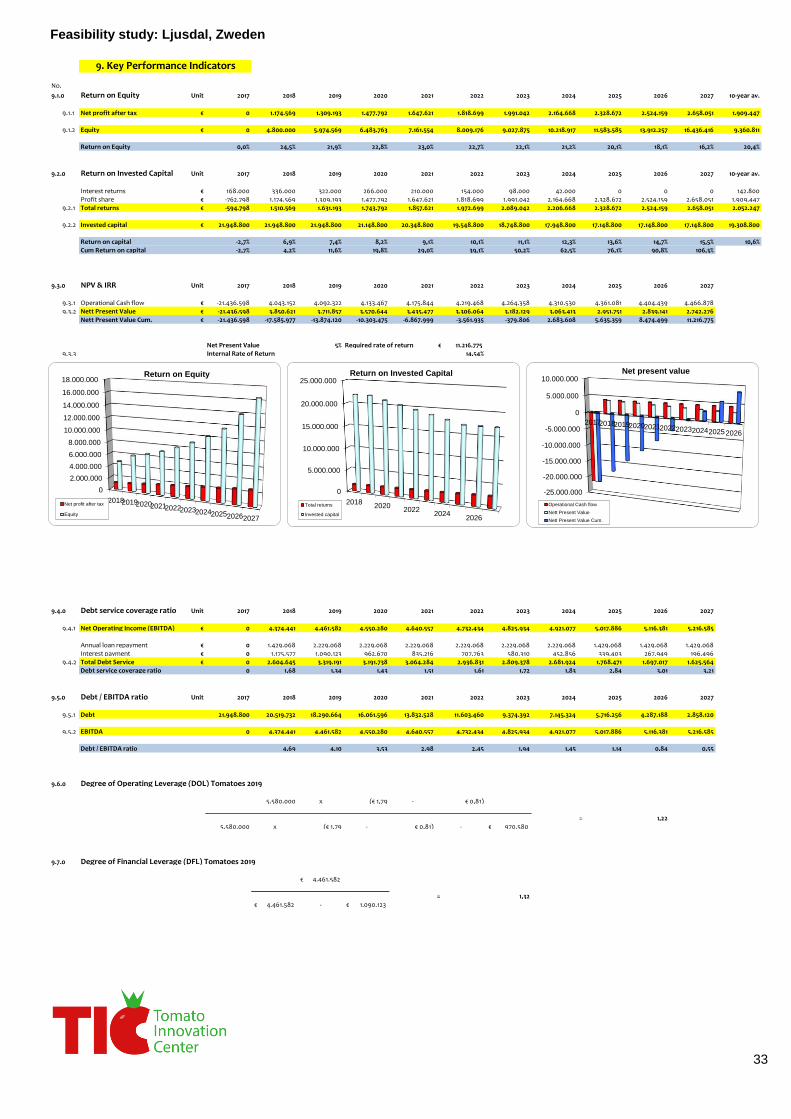
Feasibility study: Ljusdal, Zweden
No.
9.1.0 Return on Equity Unit 2017 2018 2019 2020 2021 2022 2023 2024 2025 2026 2027 10-year av.
9.1.1 Net profit after tax € 0 1.174.569 1.309.193 1.477.792 1.647.621 1.818.699 1.991.042 2.164.668 2.328.672 2.524.159 2.658.051 1.909.447
9.1.2 Equity € 0 4.800.000 5.974.569 6.483.763 7.161.554 8.009.176 9.027.875 10.218.917 11.583.585 13.912.257 16.436.416 9.360.811
Return on Equity 0,0% 24,5% 21,9% 22,8% 23,0% 22,7% 22,1% 21,2% 20,1% 18,1% 16,2% 20,4%
9.2.0 Return on Invested Capital Unit 2017 2018 2019 2020 2021 2022 2023 2024 2025 2026 2027 10-year av.
Interest returns € 168.000 336.000 322.000 266.000 210.000 154.000 98.000 42.000 0 0 0 142.800Profit share € -762.798 1.174.569 1.309.193 1.477.792 1.647.621 1.818.699 1.991.042 2.164.668 2.328.672 2.524.159 2.658.051 1.909.447
9.2.1 Total returns € -594.798 1.510.569 1.631.193 1.743.792 1.857.621 1.972.699 2.089.042 2.206.668 2.328.672 2.524.159 2.658.051 2.052.247
9.2.2 Invested capital € 21.948.800 21.948.800 21.948.800 21.148.800 20.348.800 19.548.800 18.748.800 17.948.800 17.148.800 17.148.800 17.148.800 19.308.800
Return on capital -2,7% 6,9% 7,4% 8,2% 9,1% 10,1% 11,1% 12,3% 13,6% 14,7% 15,5% 10,6%Cum Return on capital -2,7% 4,2% 11,6% 19,8% 29,0% 39,1% 50,2% 62,5% 76,1% 90,8% 106,3%
9.3.0 NPV & IRR Unit 2017 2018 2019 2020 2021 2022 2023 2024 2025 2026 2027
9.3.1 Operational Cash flow € -21.436.598 4.043.152 4.092.322 4.133.467 4.175.844 4.219.468 4.264.358 4.310.530 4.361.081 4.404.439 4.466.8789.3.2 Nett Present Value € -21.436.598 3.850.621 3.711.857 3.570.644 3.435.477 3.306.064 3.182.129 3.063.413 2.951.751 2.839.141 2.742.276
Nett Present Value Cum. € -21.436.598 -17.585.977 -13.874.120 -10.303.475 -6.867.999 -3.561.935 -379.806 2.683.608 5.635.359 8.474.499 11.216.775
Net Present Value 5% Required rate of return 11.216.775€ 9.3.3 Internal Rate of Return 14,54%
9.4.0 Debt service coverage ratio Unit 2017 2018 2019 2020 2021 2022 2023 2024 2025 2026 2027
9.4.1 Net Operating Income (EBITDA) € 0 4.374.441 4.461.582 4.550.280 4.640.557 4.732.434 4.825.934 4.921.077 5.017.886 5.116.381 5.216.585
Annual loan repayment € 0 1.429.068 2.229.068 2.229.068 2.229.068 2.229.068 2.229.068 2.229.068 1.429.068 1.429.068 1.429.068Interest payment € 0 1.175.577 1.090.123 962.670 835.216 707.763 580.310 452.856 339.403 267.949 196.496
9.4.2 Total Debt Service € 0 2.604.645 3.319.191 3.191.738 3.064.284 2.936.831 2.809.378 2.681.924 1.768.471 1.697.017 1.625.564Debt service coverage ratio 0 1,68 1,34 1,43 1,51 1,61 1,72 1,83 2,84 3,01 3,21
9.5.0 Debt / EBITDA ratio Unit 2017 2018 2019 2020 2021 2022 2023 2024 2025 2026 2027
9.5.1 Debt 21.948.800 20.519.732 18.290.664 16.061.596 13.832.528 11.603.460 9.374.392 7.145.324 5.716.256 4.287.188 2.858.120
9.5.2 EBITDA 0 4.374.441 4.461.582 4.550.280 4.640.557 4.732.434 4.825.934 4.921.077 5.017.886 5.116.381 5.216.585
Debt / EBITDA ratio 4,69 4,10 3,53 2,98 2,45 1,94 1,45 1,14 0,84 0,55
9.6.0 Degree of Operating Leverage (DOL) Tomatoes 2019
5.580.000 x (€ 1,79 - € 0,81)
= 1,225.580.000 x (€ 1,79 - € 0,81) - 970.580€
9.7.0 Degree of Financial Leverage (DFL) Tomatoes 2019
4.461.582€
= 1,324.461.582€ - 1.090.123€
9. Key Performance Indicators
0
2.000.000
4.000.000
6.000.000
8.000.000
10.000.000
12.000.000
14.000.000
16.000.000
18.000.000
2018201920202021202220232024202520262027
Return on Equity
Net profit after tax
Equity
0
5.000.000
10.000.000
15.000.000
20.000.000
25.000.000
20182020
20222024
2026
Return on Invested Capital
Total returns
Invested capital
-25.000.000
-20.000.000
-15.000.000
-10.000.000
-5.000.000
0
5.000.000
10.000.000
2017201820192020202120222023202420252026
Net present value
Operational Cash flow
Nett Present Value
Nett Present Value Cum.
33

Feasibility study: Ljusdal, Zweden
Net Profit Sensitivity Analysis 201910.1.0 2019 Unit -30% -15% -10% -5% 0% 5% 10% 15% 30%
10.1.1 Revenu 1 Selling Price 1,79 €/kg 1,25€ 1,52€ 1,61€ 1,70€ 1,79€ 1,88€ 1,96€ 2,05€ 2,32€ 2 Production 5.580.000 kg 3.906.000 4.743.000 5.022.000 5.301.000 5.580.000 5.859.000 6.138.000 6.417.000 7.254.000
10.1.2 Costs 3 Gas costs 0 € 0 0 0 0 0 0 0 0 04 Water costs 0 € 0 0 0 0 0 0 0 0 05 Electricity costs 1.425.521 € 997.865 1.211.693 1.282.969 1.354.245 1.425.521 1.496.797 1.568.073 1.639.350 1.853.1786 Other production costs 663.255 € 464.279 563.767 596.930 630.092 663.255 696.418 729.581 762.743 862.2327 Selling costs 261.244 € 182.871 222.058 235.120 248.182 261.244 274.307 287.369 300.431 339.6188 Indirect production costs 970.580 € 679.406 824.993 873.522 922.051 970.580 1.019.109 1.067.638 1.116.167 1.261.7549 Capital costs 2.783.129 € 1.948.190 2.365.660 2.504.816 2.643.973 2.783.129 2.922.286 3.061.442 3.200.598 3.618.068
1. Variable * (1+ percentage)2. ""3. ""4. ""5. ""6. ""7. ""8. ""9. ""
10.2.0 2018 Unit -30% -15% -10% -5% 0% 5% 10% 15% 30%
(Net Profit before Tax)
10.2.1 Revenu 1 Selling Price 1,79 €/kg -1.311.344€ 183.554€ 681.854€ 1.180.153€ 1.678.453€ 2.176.753€ 2.675.052€ 3.173.352€ 4.668.250€ 2 Production 5.580.000 kg 48.804€ 863.629€ 1.135.237€ 1.406.845€ 1.678.453€ 1.950.061€ 2.221.669€ 2.493.277€ 3.308.102€
10.2.2 Costs 3 Gas costs 0 € 1.678.453€ 1.678.453€ 1.678.453€ 1.678.453€ 1.678.453€ 1.678.453€ 1.678.453€ 1.678.453€ 1.678.453€
4 Water costs 0 € 1.678.453€ 1.678.453€ 1.678.453€ 1.678.453€ 1.678.453€ 1.678.453€ 1.678.453€ 1.678.453€ 1.678.453€ 5 Electricity costs 1.425.521 € 2.106.109€ 1.892.281€ 1.821.005€ 1.749.729€ 1.678.453€ 1.607.177€ 1.535.901€ 1.464.625€ 1.250.797€ 6 Other production costs 663.255 € 1.877.430€ 1.777.941€ 1.744.779€ 1.711.616€ 1.678.453€ 1.645.290€ 1.612.128€ 1.578.965€ 1.479.477€ 7 Selling costs 261.244 € 1.756.826€ 1.717.640€ 1.704.577€ 1.691.515€ 1.678.453€ 1.665.391€ 1.652.329€ 1.639.266€ 1.600.080€ 8 Indirect production costs 970.580 € 1.969.627€ 1.824.040€ 1.775.511€ 1.726.982€ 1.678.453€ 1.629.924€ 1.581.395€ 1.532.866€ 1.387.279€ 9 Capital costs 2.783.129 € 2.513.392€ 2.095.922€ 1.956.766€ 1.817.609€ 1.678.453€ 1.539.297€ 1.400.140€ 1.260.984€ 843.514€
1. Net Profit before Tax + difference in selling price (outcome figure 9.1.0) * production.
2. Net Profit before Tax + difference in production (outcome figure 9.1.0) * (selling price (kg) - direct production costs (kg).
3. Net Profit before Tax + difference in gas costs (outcome figure 9.1.0)
4. Net Profit before Tax + difference in water costs (outcome figure 9.1.0)
5. Net Profit before Tax + difference in electicity costs (outcome figure 9.1.0)
6. Net Profit before Tax + difference in other production costs (outcome figure 9.1.0)
7. Net Profit before Tax + difference in selling costs (outcome figure 9.1.0)
8. Net Profit before Tax + difference in indirect production costs (outcome figure 9.1.0)
9. Net Profit before Tax + difference in capital costs (outcome figure 9.1.0)
10.3.0 2018 Unit -30% -15% -10% -5% 0% 5% 10% 15% 30%
(Net Profit after Tax)
10.3.1 Revenu 1 Selling Price 1,79 €/kg -1.311.344€ 143.172€ 531.846€ 920.520€ 1.309.193€ 1.697.867€ 2.086.541€ 2.475.214€ 3.641.235€
2 Production 5.580.000 kg 38.067€ 673.630€ 885.485€ 1.097.339€ 1.309.193€ 1.521.048€ 1.732.902€ 1.944.756€ 2.580.319€
10.3.2 Costs 3 Gas costs 0 € 1.309.193€ 1.309.193€ 1.309.193€ 1.309.193€ 1.309.193€ 1.309.193€ 1.309.193€ 1.309.193€ 1.309.193€
4 Water costs 0 € 1.309.193€ 1.309.193€ 1.309.193€ 1.309.193€ 1.309.193€ 1.309.193€ 1.309.193€ 1.309.193€ 1.309.193€
5 Electricity costs 1.425.521 € 1.642.765€ 1.475.979€ 1.420.384€ 1.364.789€ 1.309.193€ 1.253.598€ 1.198.003€ 1.142.407€ 975.621€
6 Other production costs 663.255 € 1.464.395€ 1.386.794€ 1.360.927€ 1.335.060€ 1.309.193€ 1.283.326€ 1.257.459€ 1.231.593€ 1.153.992€
7 Selling costs 261.244 € 1.370.325€ 1.339.759€ 1.329.570€ 1.319.382€ 1.309.193€ 1.299.005€ 1.288.816€ 1.278.628€ 1.248.062€
8 Indirect production costs 970.580 € 1.536.309€ 1.422.751€ 1.384.899€ 1.347.046€ 1.309.193€ 1.271.341€ 1.233.488€ 1.195.635€ 1.082.078€
9 Capital costs 2.783.129 € 1.960.446€ 1.634.819€ 1.526.277€ 1.417.735€ 1.309.193€ 1.200.651€ 1.092.109€ 983.567€ 657.941€
10. Project risk
€ -2.000.000
€ -1.000.000
€ -
€ 1.000.000
€ 2.000.000
€ 3.000.000
€ 4.000.000
-30% -15% -10% -5% 0% 5% 10% 15% 30%
Selling Price
Production
Selling costs
Indirect production costs
Capital costs
Gas costs
Water costs
Electricity costs
Other production costs
Net Profitafter Tax
% Difference
34
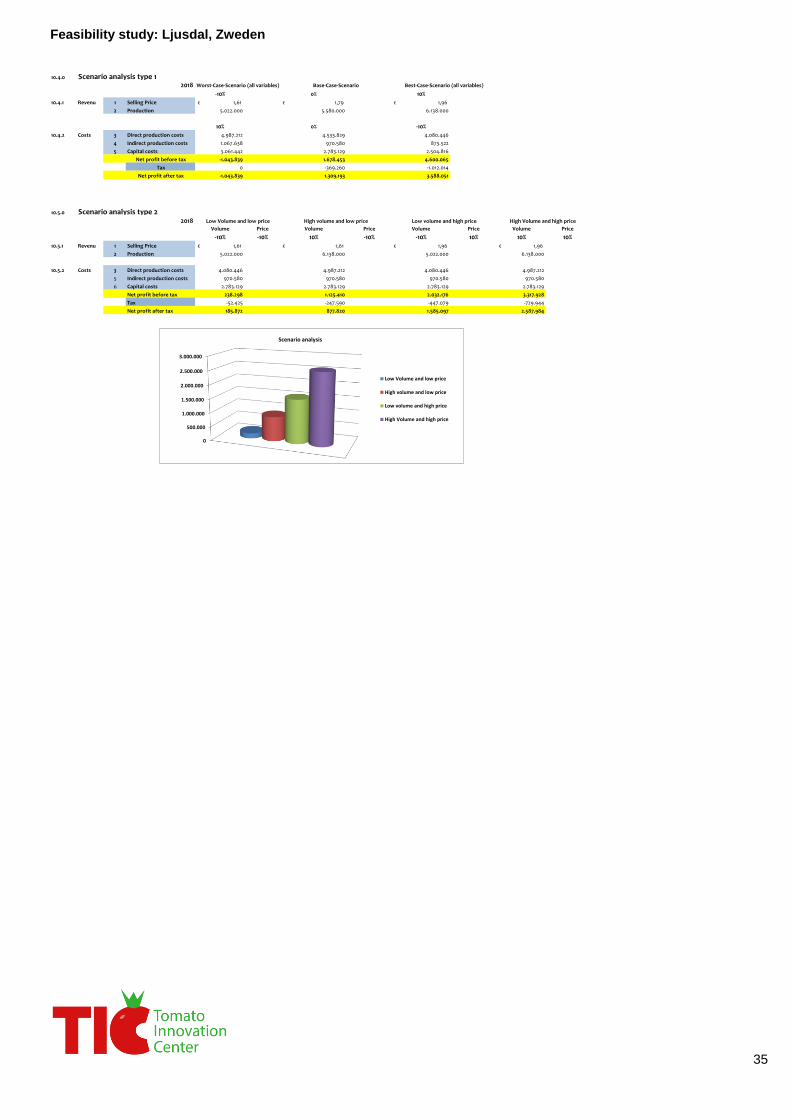
Feasibility study: Ljusdal, Zweden
10.4.0 Scenario analysis type 12018
-10% 0% 10%
10.4.1 Revenu 1 Selling Price 1,61€ 1,79€ 1,96€
2 Production 5.022.000 5.580.000 6.138.000
10% 0% -10%
10.4.2 Costs 3 Direct production costs 4.987.212 4.533.829 4.080.446
4 Indirect production costs 1.067.638 970.580 873.522
5 Capital costs 3.061.442 2.783.129 2.504.816
Net profit before tax -1.043.839 1.678.453 4.600.065
Tax 0 -369.260 -1.012.014
Net profit after tax -1.043.839 1.309.193 3.588.051
10.5.0 Scenario analysis type 22018
Volume Price Volume Price Volume Price Volume Price
-10% -10% 10% -10% -10% 10% 10% 10%
10.5.1 Revenu 1 Selling Price 1,61€ 1,61€ 1,96€ 1,96€
2 Production 5.022.000 6.138.000 5.022.000 6.138.000
10.5.2 Costs 3 Direct production costs 4.080.446 4.987.212 4.080.446 4.987.212
5 Indirect production costs 970.580 970.580 970.580 970.580
6 Capital costs 2.783.129 2.783.129 2.783.129 2.783.129
Net profit before tax 238.298 1.125.410 2.032.176 3.317.928
Tax -52.425 -247.590 -447.079 -729.944
Net profit after tax 185.872 877.820 1.585.097 2.587.984
Low volume and high price High Volume and high price
Worst-Case-Scenario (all variables) Base-Case-Scenario Best-Case-Scenario (all variables)
Low Volume and low price High volume and low price
0
500.000
1.000.000
1.500.000
2.000.000
2.500.000
3.000.000
Low Volume and low price
High volume and low price
Low volume and high price
High Volume and high price
Scenario analysis
35
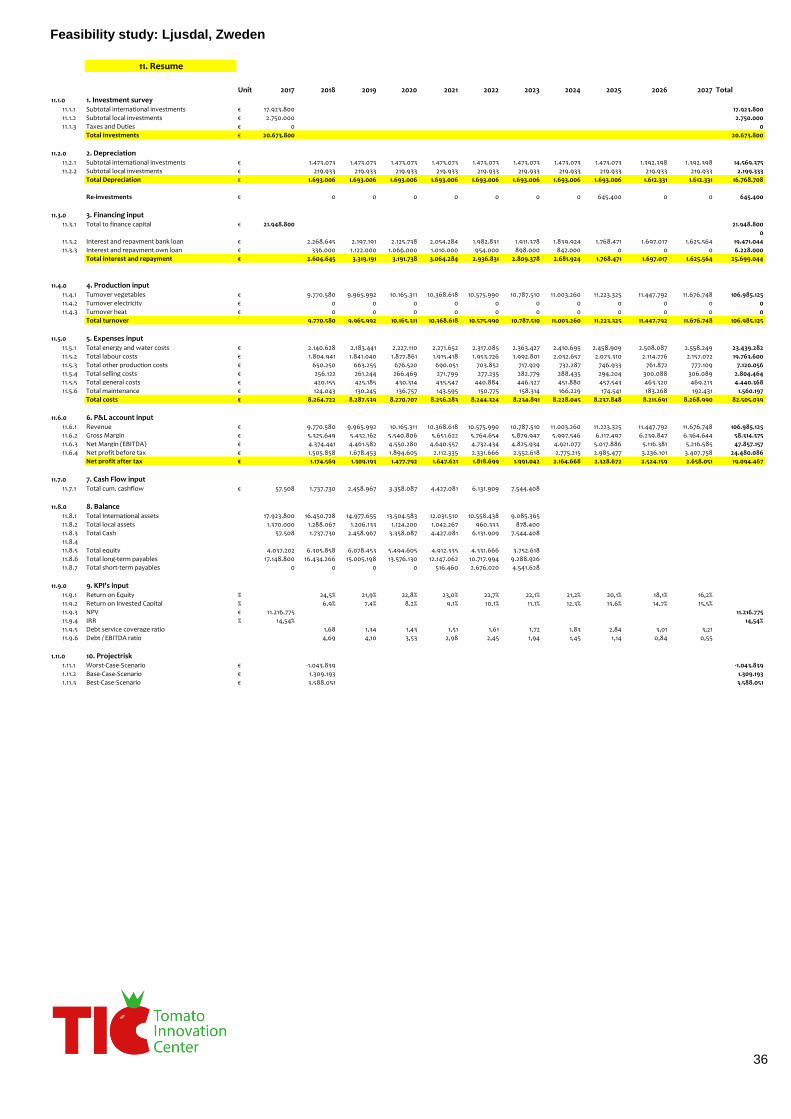
Feasibility study: Ljusdal, Zweden
11. Resume
Unit 2017 2018 2019 2020 2021 2022 2023 2024 2025 2026 2027 Total
11.1.0 1. Investment survey11.1.1 Subtotal international investments € 17.923.800 17.923.800
11.1.2 Subtotal local investments € 2.750.000 2.750.000
11.1.3 Taxes and Duties € 0 0
Total investments € 20.673.800 20.673.800
11.2.0 2. Depreciation11.2.1 Subtotal international investments € 1.473.073 1.473.073 1.473.073 1.473.073 1.473.073 1.473.073 1.473.073 1.473.073 1.392.398 1.392.398 14.569.375
11.2.2 Subtotal local investments € 219.933 219.933 219.933 219.933 219.933 219.933 219.933 219.933 219.933 219.933 2.199.333
Total Depreciation € 1.693.006 1.693.006 1.693.006 1.693.006 1.693.006 1.693.006 1.693.006 1.693.006 1.612.331 1.612.331 16.768.708
Re-investments € 0 0 0 0 0 0 0 645.400 0 0 645.400
11.3.0 3. Financing input11.3.1 Total to finance capital € 21.948.800 21.948.800
0
11.3.2 Interest and repayment bank loan € 2.268.645 2.197.191 2.125.738 2.054.284 1.982.831 1.911.378 1.839.924 1.768.471 1.697.017 1.625.564 19.471.044
11.3.3 Interest and repayment own loan € 336.000 1.122.000 1.066.000 1.010.000 954.000 898.000 842.000 0 0 0 6.228.000
Total interest and repayment € 2.604.645 3.319.191 3.191.738 3.064.284 2.936.831 2.809.378 2.681.924 1.768.471 1.697.017 1.625.564 25.699.044
11.4.0 4. Production input11.4.1 Turnover vegetables € 9.770.580 9.965.992 10.165.311 10.368.618 10.575.990 10.787.510 11.003.260 11.223.325 11.447.792 11.676.748 106.985.125
11.4.2 Turnover electricity € 0 0 0 0 0 0 0 0 0 0 0
11.4.3 Turnover heat € 0 0 0 0 0 0 0 0 0 0 0
Total turnover 9.770.580 9.965.992 10.165.311 10.368.618 10.575.990 10.787.510 11.003.260 11.223.325 11.447.792 11.676.748 106.985.125
11.5.0 5. Expenses input11.5.1 Total energy and water costs € 2.140.628 2.183.441 2.227.110 2.271.652 2.317.085 2.363.427 2.410.695 2.458.909 2.508.087 2.558.249 23.439.282
11.5.2 Total labour costs € 1.804.941 1.841.040 1.877.861 1.915.418 1.953.726 1.992.801 2.032.657 2.073.310 2.114.776 2.157.072 19.763.600
11.5.3 Total other production costs € 650.250 663.255 676.520 690.051 703.852 717.929 732.287 746.933 761.872 777.109 7.120.056
11.5.4 Total selling costs € 256.122 261.244 266.469 271.799 277.235 282.779 288.435 294.204 300.088 306.089 2.804.464
11.5.5 Total general costs € 420.155 425.185 430.314 435.547 440.884 446.327 451.880 457.543 463.320 469.213 4.440.368
11.5.6 Total maintenance € 124.043 130.245 136.757 143.595 150.775 158.314 166.229 174.541 183.268 192.431 1.560.197
Total costs € 8.264.722 8.287.539 8.270.707 8.256.283 8.244.324 8.234.891 8.228.045 8.237.848 8.211.691 8.268.990 82.505.039
11.6.0 6. P&L account input11.6.1 Revenue € 9.770.580 9.965.992 10.165.311 10.368.618 10.575.990 10.787.510 11.003.260 11.223.325 11.447.792 11.676.748 106.985.125
11.6.2 Gross Margin € 5.325.649 5.432.162 5.540.806 5.651.622 5.764.654 5.879.947 5.997.546 6.117.497 6.239.847 6.364.644 58.314.375
11.6.3 Net Margin (EBITDA) € 4.374.441 4.461.582 4.550.280 4.640.557 4.732.434 4.825.934 4.921.077 5.017.886 5.116.381 5.216.585 47.857.157
11.6.4 Net profit before tax € 1.505.858 1.678.453 1.894.605 2.112.335 2.331.666 2.552.618 2.775.215 2.985.477 3.236.101 3.407.758 24.480.086
Net profit after tax € 1.174.569 1.309.193 1.477.792 1.647.621 1.818.699 1.991.042 2.164.668 2.328.672 2.524.159 2.658.051 19.094.467
11.7.0 7. Cash Flow input11.7.1 Total cum. cashflow € 57.508 1.737.730 2.458.967 3.358.087 4.427.081 6.131.909 7.544.408
11.8.0 8. Balance11.8.1 Total International assets 17.923.800 16.450.728 14.977.655 13.504.583 12.031.510 10.558.438 9.085.365
11.8.2 Total local assets 1.370.000 1.288.067 1.206.133 1.124.200 1.042.267 960.333 878.400
11.8.3 Total Cash 57.508 1.737.730 2.458.967 3.358.087 4.427.081 6.131.909 7.544.408
11.8.4
11.8.5 Total equity 4.037.202 6.305.858 6.078.453 5.494.605 4.912.335 4.331.666 3.752.618
11.8.6 Total long-term payables 17.148.800 16.434.266 15.005.198 13.576.130 12.147.062 10.717.994 9.288.926
11.8.7 Total short-term payables 0 0 0 0 516.460 2.676.020 4.541.628
11.9.0 9. KPI's input11.9.1 Return on Equity % 24,5% 21,9% 22,8% 23,0% 22,7% 22,1% 21,2% 20,1% 18,1% 16,2%
11.9.2 Return on Invested Capital % 6,9% 7,4% 8,2% 9,1% 10,1% 11,1% 12,3% 13,6% 14,7% 15,5%
11.9.3 NPV € 11.216.775 11.216.775
11.9.4 IRR % 14,54% 14,54%
11.9.5 Debt service coverage ratio 1,68 1,34 1,43 1,51 1,61 1,72 1,83 2,84 3,01 3,21
11.9.6 Debt / EBITDA ratio 4,69 4,10 3,53 2,98 2,45 1,94 1,45 1,14 0,84 0,55
1.11.0 10. Projectrisk1.11.1 Worst-Case-Scenario € -1.043.839 -1.043.839
1.11.2 Base-Case-Scenario € 1.309.193 1.309.193
1.11.3 Best-Case-Scenario € 3.588.051 3.588.051
36
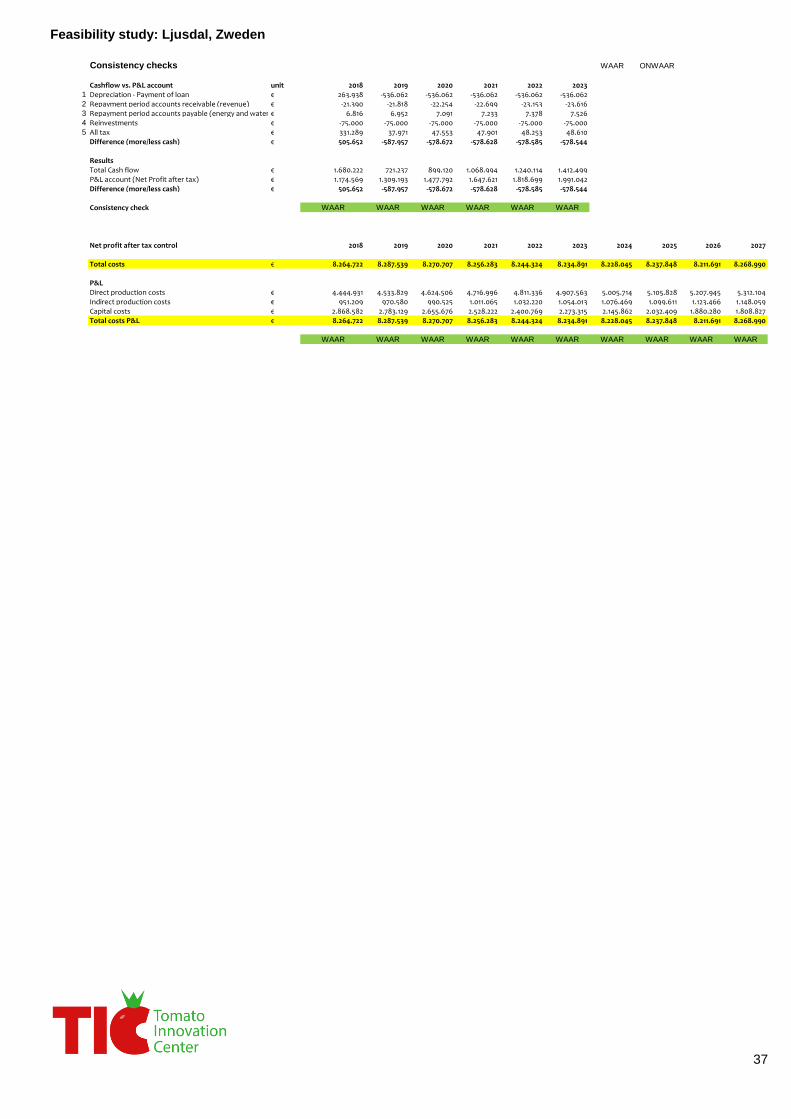
Feasibility study: Ljusdal, Zweden
Consistency checks WAAR ONWAAR
Cashflow vs. P&L account unit 2018 2019 2020 2021 2022 20231 Depreciation - Payment of loan € 263.938 -536.062 -536.062 -536.062 -536.062 -536.0622 Repayment period accounts receivable (revenue) € -21.390 -21.818 -22.254 -22.699 -23.153 -23.6163 Repayment period accounts payable (energy and water)€ 6.816 6.952 7.091 7.233 7.378 7.5264 Reinvestments € -75.000 -75.000 -75.000 -75.000 -75.000 -75.0005 All tax € 331.289 37.971 47.553 47.901 48.253 48.610
Difference (more/less cash) € 505.652 -587.957 -578.672 -578.628 -578.585 -578.544
ResultsTotal Cash flow € 1.680.222 721.237 899.120 1.068.994 1.240.114 1.412.499P&L account (Net Profit after tax) € 1.174.569 1.309.193 1.477.792 1.647.621 1.818.699 1.991.042Difference (more/less cash) € 505.652 -587.957 -578.672 -578.628 -578.585 -578.544
Consistency check WAAR WAAR WAAR WAAR WAAR WAAR
Net profit after tax control 2018 2019 2020 2021 2022 2023 2024 2025 2026 2027
Total costs € 8.264.722 8.287.539 8.270.707 8.256.283 8.244.324 8.234.891 8.228.045 8.237.848 8.211.691 8.268.990
P&LDirect production costs € 4.444.931 4.533.829 4.624.506 4.716.996 4.811.336 4.907.563 5.005.714 5.105.828 5.207.945 5.312.104Indirect production costs € 951.209 970.580 990.525 1.011.065 1.032.220 1.054.013 1.076.469 1.099.611 1.123.466 1.148.059Capital costs € 2.868.582 2.783.129 2.655.676 2.528.222 2.400.769 2.273.315 2.145.862 2.032.409 1.880.280 1.808.827Total costs P&L € 8.264.722 8.287.539 8.270.707 8.256.283 8.244.324 8.234.891 8.228.045 8.237.848 8.211.691 8.268.990
WAAR WAAR WAAR WAAR WAAR WAAR WAAR WAAR WAAR WAAR
37

Feasibility study: Ljusdal, Zweden
9. Key Performance Indicators
9.1.0
9.1.1
9.2.0
9.2.1
9.2.2
9.3.0
9.3.2
9.3.3
9.4.0
9.4.2
9.5.0
9.5.1
10. Project Risk
10.1.0
10.2.0
10.3.0
10.5.0
10.6.0 Scenario analysis type 2 contains 4 different scenarios. A low volume and low price scenario, a high volume and low price scenario, a
low volume and high price scenario and a high volume and high price scenario. Those scenarios are based on changes in selling price,
production and direct production costs.
Debt / EBITDA ratio calculates ratio of debt compared with de EBITDA. It is calculated as: debt / EBITDA.
Debt contains the loan – repayments.
This figure shows the changes of 9 variables in the model. The values of the variables are linked with the percentage at het top of the
figure. The figure calculates the input value (expected value) * (1+percentage).
This figure shows the Net Profit after Tax. It used the outcomes of figure 9.2.0, but subtracts the new calculated profit tax. The
calculation is: Outcome figure 9.2.0 * ( 1 – percentage profit tax ).
Scenario analysis type 1 contains a Worst-case-Scenario, Base-case-scenario and a Best-case scenario. In the worst case the selling
price and production decreases with -10%. In this case all costs are increasing with 10%. In the base case the outcomes are the same
as the input in the model. In de best case the selling price and production increases with 10% and the costs are decreasing with -10%.
The outcome of the figure is the net profit after tax.
Return on Invested Capital calculates the total returns compared with the invested capital. The calculation is: Total returns / Invested
capital.
Invested capital is calculated as: Total financing – repayments own loan
Total returns are the interests own loan + the net profit after tax.
This figure shows the Net Profit before Tax, when a variable changes in the model calculation. For this calculation the values in figure
9.1.0 are used. For example the calculation for the selling price is: Net Profit before Tax + difference in selling price (input model and
outcome figure 9.1.0) * production.
Explanations
The net present value calculated the expected profit or loss of a project. All the expected future cash flows are discounted to a certain
point in time, using a required rate of return.
The operational cash flows are discounted with the required rate of return. It is calculated as: - Investment + operational cash flow / (1+
required rate of return) + operational cash flow / (1+ required rate of return)^2 + operational cash flow / (1+ required rate of return)^3+
etc..
The Internal rate of return calculates the percentage return on the investment.
The Debt Service Coverage Ratio is a debt ratio and is used by lenders to determine if the loan recipient has sufficient resources to
meet its debt in the future. It is calculated as: Net operating income (EBITDA) / total debt service.
The total debt service contains the repayments of bank + repayments of own loan + interest payment bank + interest payments own
loan.
Return on Equity calculates the percentage of net profit after tax compared with the equity of the business. The calculation is: Net Profit
after Tax / Equity
The calculated equity in the first year is the instalment own loan. In the coming years it is calculated as: equity last year + net profit after
tax last year – repayments own loan.
38


