Solar Penetration Study
RPG MeetingFebruary 16, 2016
1

Background
As of December 2015, 8601 MW of solar projects are going through
the generation interconnection process in ERCOT.
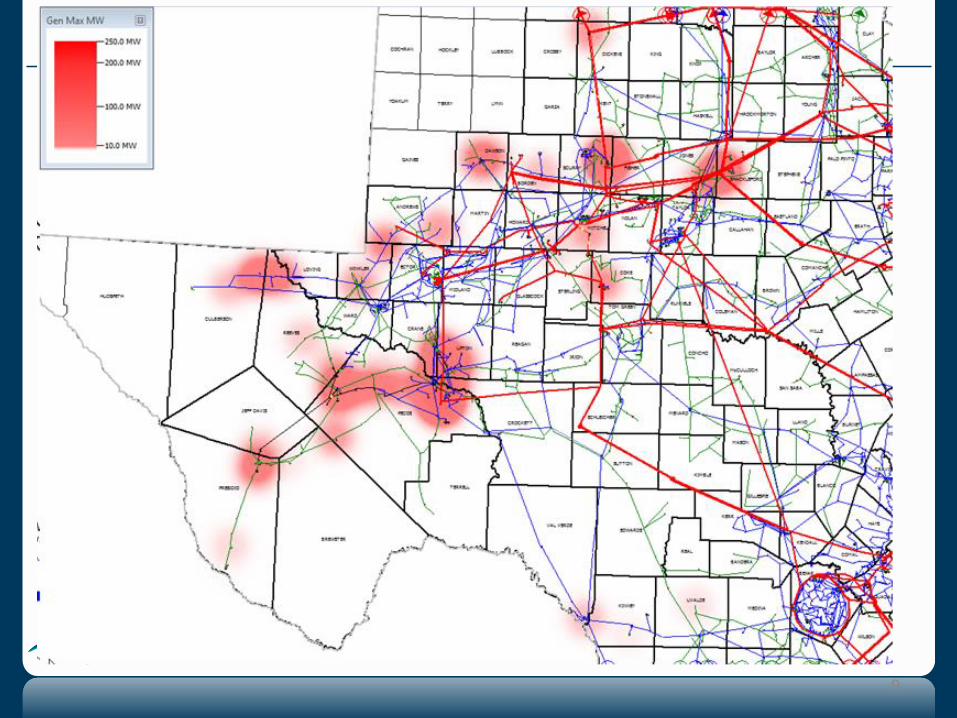
The majority of the projects are concentrated in the West and Far
West weather zones where the transmission system is relatively
weak.
2014 LTSA identified potential for over 16 GW of solar generation in
ERCOT by 2029.
The objective of the solar penetration study is to assess the impacts
of the solar projects on ERCOT’s current transmission system and
get a high level understanding of the needed transmission upgrades
to accommodate the solar projects should they come online as
planned.
2
Solar Projects by Weather Zone and Commercial
Operation Date (COD)
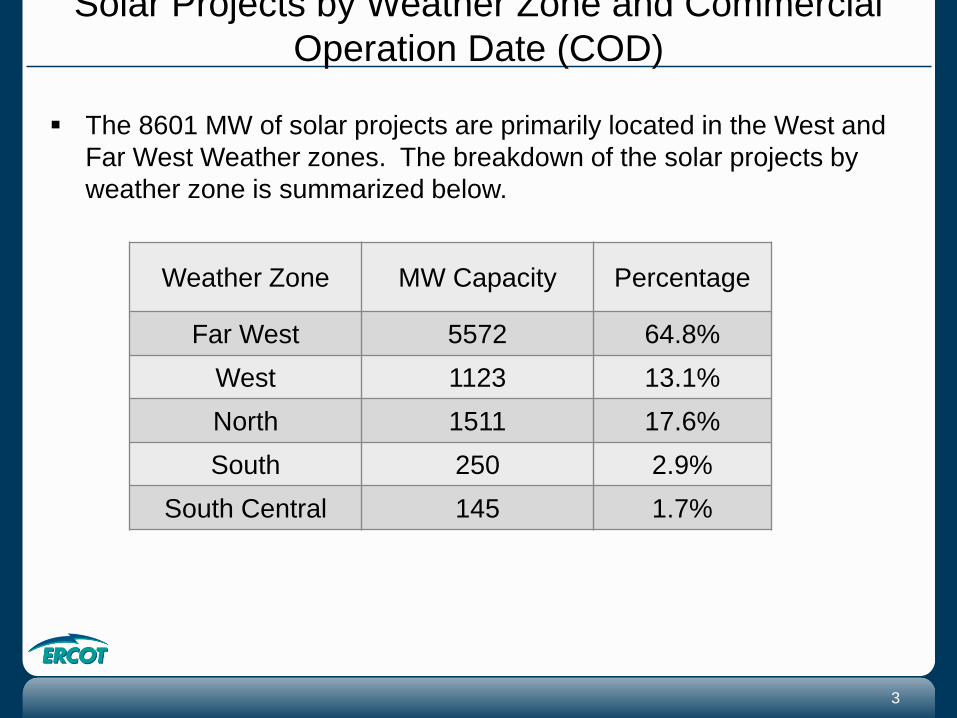
The 8601 MW of solar projects are primarily located in the West and
Far West Weather zones. The breakdown of the solar projects by
weather zone is summarized below.
3
Weather Zone MW Capacity Percentage
Far West 5572 64.8%
West 1123 13.1%
North 1511 17.6%
South 250 2.9%
South Central 145 1.7%
Development of Study Cases
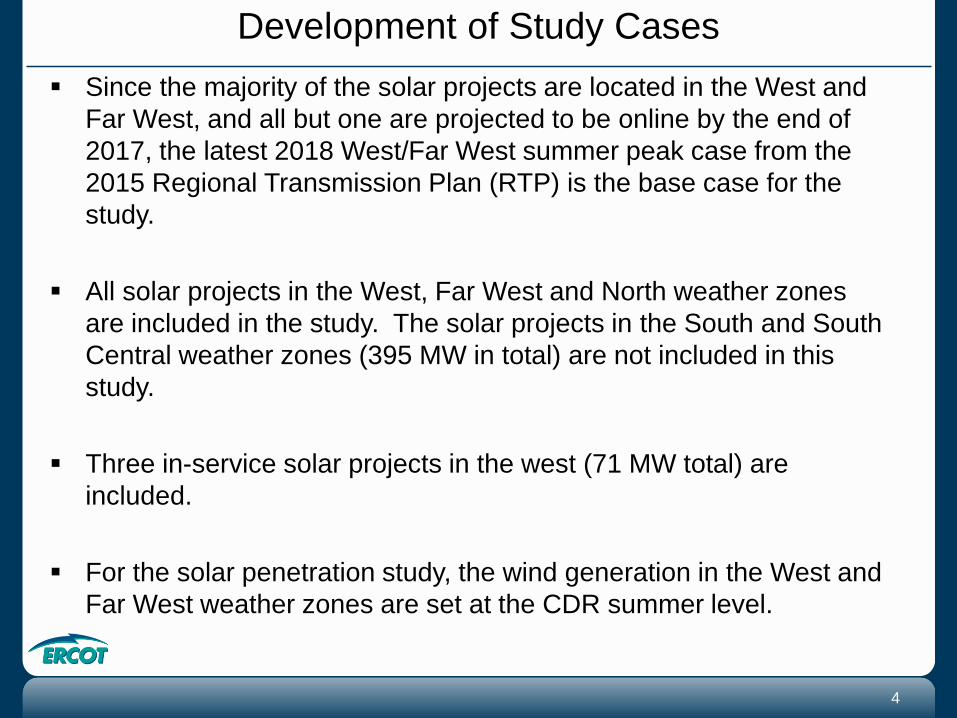
Since the majority of the solar projects are located in the West and
Far West, and all but one are projected to be online by the end of
2017, the latest 2018 West/Far West summer peak case from the
2015 Regional Transmission Plan (RTP) is the base case for the
study.
All solar projects in the West, Far West and North weather zones
are included in the study. The solar projects in the South and South
Central weather zones (395 MW in total) are not included in this
study.
Three in-service solar projects in the west (71 MW total) are
included.
For the solar penetration study, the wind generation in the West and
Far West weather zones are set at the CDR summer level.
4

Development of Study Cases
Three solar projects were identified as duplicates and excluded from
the study. The total capacity is 157 MW.
The remaining solar generators and projects total 8120 MW. These
are grouped into three study stages based on the project status.
Projects in stage1 will be studied first. After that projects in stage 2
will be studied and finally the projects in stage 3 will be studied.
5
MW Stage 1 Stage 2 Stage 3
In Service 71 Yes Yes Yes
IA Signed 1860 Yes Yes Yes
No IA but FIS Complete 250 Yes Yes Yes
No IA and FIS
Incomplete
5940 No 50%
capacity
Yes
Total MW in Stage 2181 5151 8121

Development of Study Cases
In-Service West & Far West Solar Generators, 71 MW
10 MW Acacia + 23 MW Hovey + 38 MW Eclipse
Signed-IA Solar Projects in West & Far West, 1860 MW
6
INR Project MW County
12INR0059b Barilla 1B 7 Pecos
12INR0059c Barilla 2 21 Pecos
15INR0036 Downie Ranch 95 Uvalde
15INR0045 Riggins 150 Pecos
15INR0059 Pecos I 108 Pecos
15INR0061 SolaireHolman 1 50 Brewster
15INR0070_1 West Texas 110 Pecos
15INR0070_1b Pearl 50 Pecos
16INR0019 Capricorn Ridge 100 Coke
16INR0023 BNB Lamesa 200 Dawson
16INR0048 RE Roserock 158 Pecos
16INR0049 Nazareth 201 Castro
16INR0052 Solara 110 Haskell
16INR0065 SP-TX-12 180 Upton
16INR0065B SP-TX-12-Phase B 120 Upton
16INR0073 East Pecos 100 Pecos
16INR0114 Upton 100 Upton
Development of Study Cases
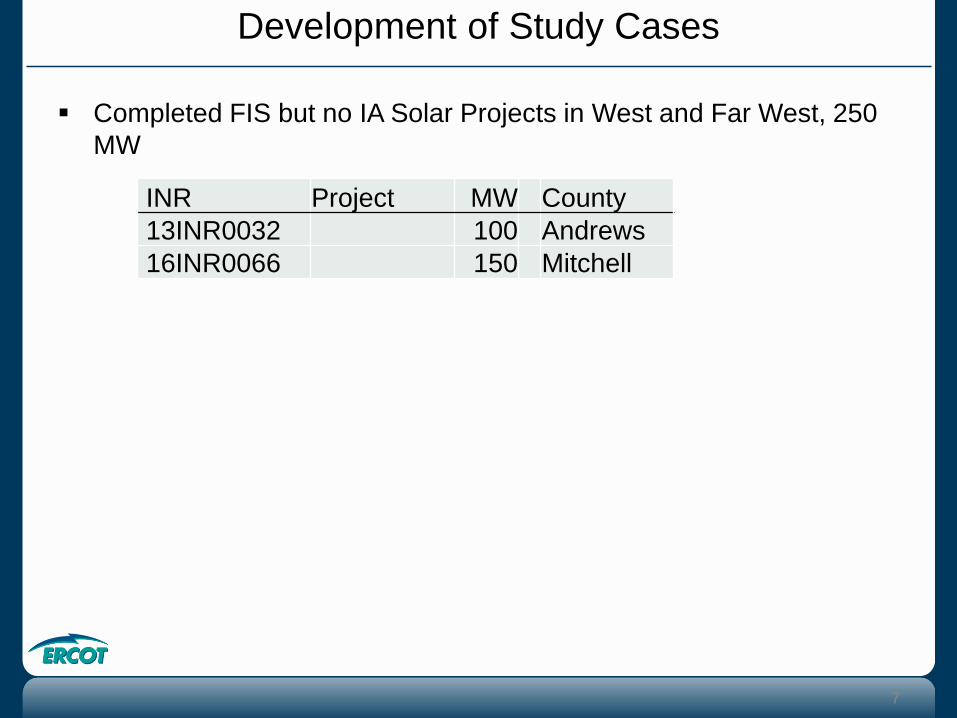
Completed FIS but no IA Solar Projects in West and Far West, 250
MW
7
INR Project MW County
13INR0032 100 Andrews
16INR0066 150 Mitchell
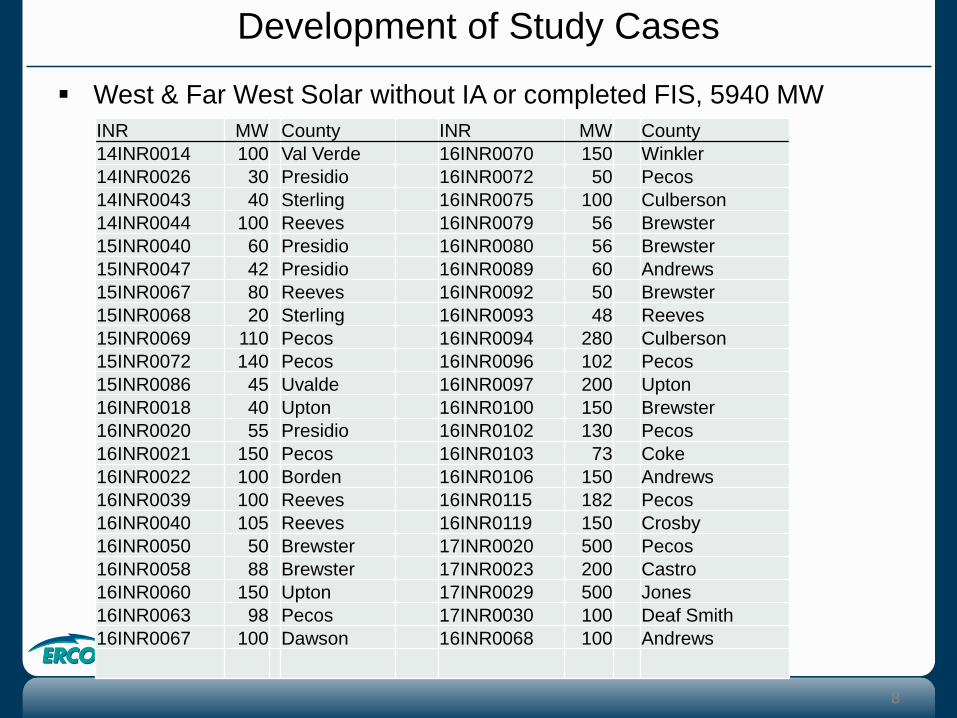
Development of Study Cases
West & Far West Solar without IA or completed FIS, 5940 MW
8
INR MW County INR MW County
14INR0014 100 Val Verde 16INR0070 150 Winkler
14INR0026 30 Presidio 16INR0072 50 Pecos
14INR0043 40 Sterling 16INR0075 100 Culberson
14INR0044 100 Reeves 16INR0079 56 Brewster
15INR0040 60 Presidio 16INR0080 56 Brewster
15INR0047 42 Presidio 16INR0089 60 Andrews
15INR0067 80 Reeves 16INR0092 50 Brewster
15INR0068 20 Sterling 16INR0093 48 Reeves
15INR0069 110 Pecos 16INR0094 280 Culberson
15INR0072 140 Pecos 16INR0096 102 Pecos
15INR0086 45 Uvalde 16INR0097 200 Upton
16INR0018 40 Upton 16INR0100 150 Brewster
16INR0020 55 Presidio 16INR0102 130 Pecos
16INR0021 150 Pecos 16INR0103 73 Coke
16INR0022 100 Borden 16INR0106 150 Andrews
16INR0039 100 Reeves 16INR0115 182 Pecos
16INR0040 105 Reeves 16INR0119 150 Crosby
16INR0050 50 Brewster 17INR0020 500 Pecos
16INR0058 88 Brewster 17INR0023 200 Castro
16INR0060 150 Upton 17INR0029 500 Jones
16INR0063 98 Pecos 17INR0030 100 Deaf Smith
16INR0067 100 Dawson 16INR0068 100 Andrews
9
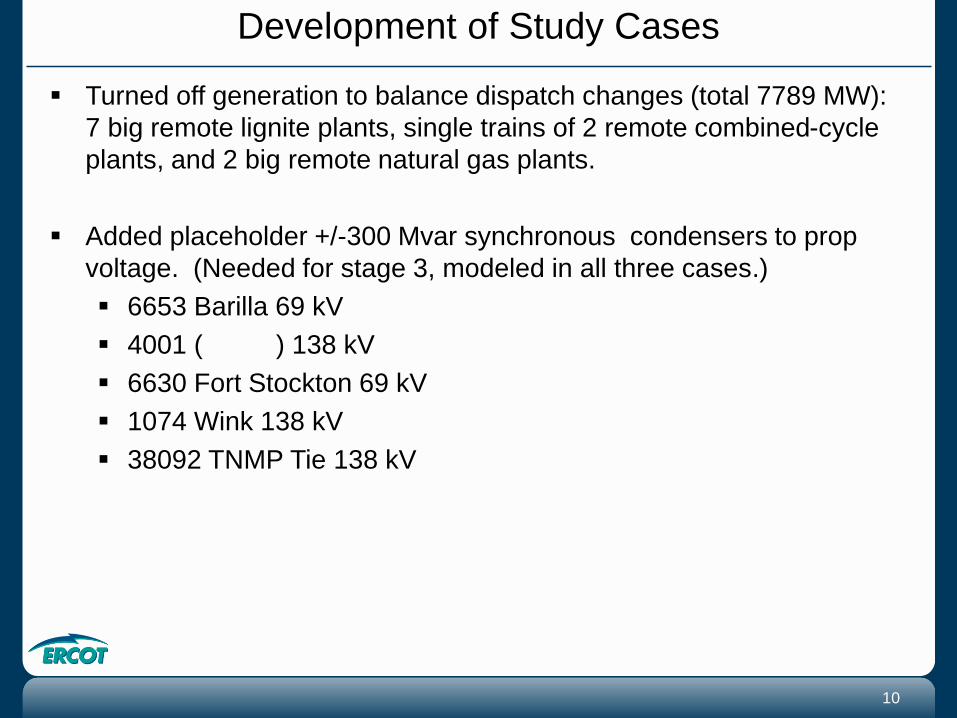
Development of Study Cases
Turned off generation to balance dispatch changes (total 7789 MW):
7 big remote lignite plants, single trains of 2 remote combined-cycle
plants, and 2 big remote natural gas plants.
Added placeholder +/-300 Mvar synchronous condensers to prop
voltage. (Needed for stage 3, modeled in all three cases.)
6653 Barilla 69 kV
4001 ( ) 138 kV
6630 Fort Stockton 69 kV
1074 Wink 138 kV
38092 TNMP Tie 138 kV
10
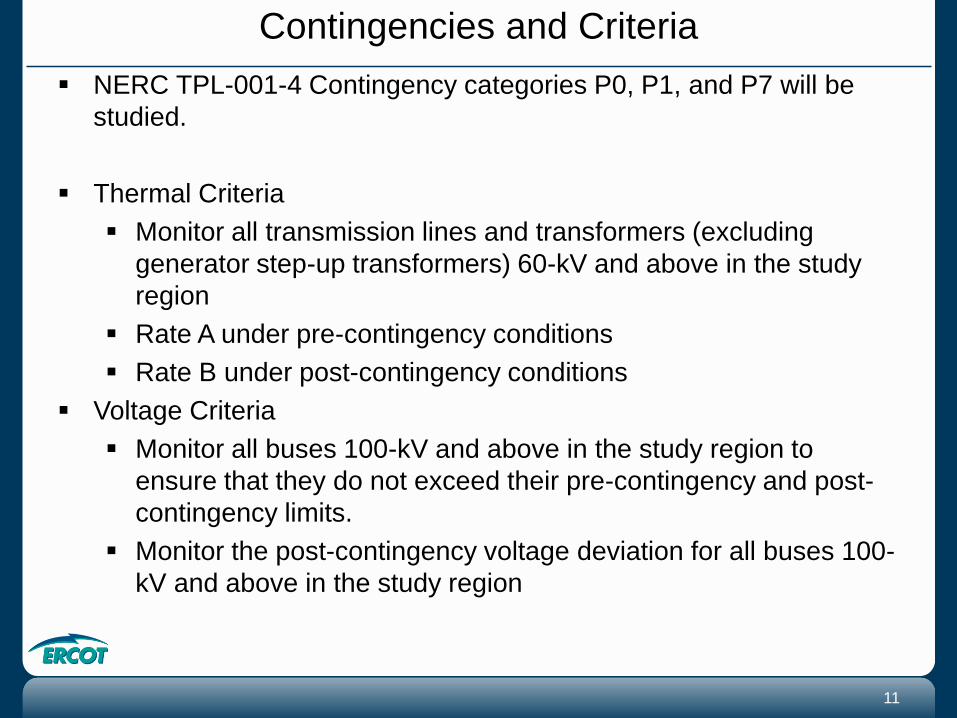
Contingencies and Criteria
NERC TPL-001-4 Contingency categories P0, P1, and P7 will be
studied.
Thermal Criteria
Monitor all transmission lines and transformers (excluding
generator step-up transformers) 60-kV and above in the study
region
Rate A under pre-contingency conditions
Rate B under post-contingency conditions
Voltage Criteria
Monitor all buses 100-kV and above in the study region to
ensure that they do not exceed their pre-contingency and post-
contingency limits.
Monitor the post-contingency voltage deviation for all buses 100-
kV and above in the study region
11

Preliminary Results
Stage 1 Stage 2 Stage 3
Contingency Failed to Converge 0 0 19
Number of Unique Circuits Overloaded in Base Case
138 kV 1 16 26
69 kV 0 7 15
138-69 kV autotransformers 0 3 5
Number of Unique Circuits that Overload for Contingencies
345 kV 0 0 1
138 kV 5 20 62
69 kV 4 21 39
138-69 kV autotransformers 3 8 10
12

Stage 1 Worst Overloads
Base Case Overload
138 kV 153 MVA radial from 6584 Indian – 6601 Rio Pecos 102%
Contingency Overloads
138 kV 6630 Ft Stockton - 38340 TN Airport, 143 MVA 118%
(one contingency)
69 kV 6575 Iraan - 60372 Dinny, 35 MVA 145%
(one contingency)
38040 TN IH20 – 38090 TN Pecos 130%
(11 different contingencies)
138-69 kV 76013-6556 West Yates, 55 MVA 121%
(one contingency)
Average o/l = 110% Sum(o/l line lengths) = 69 miles
13
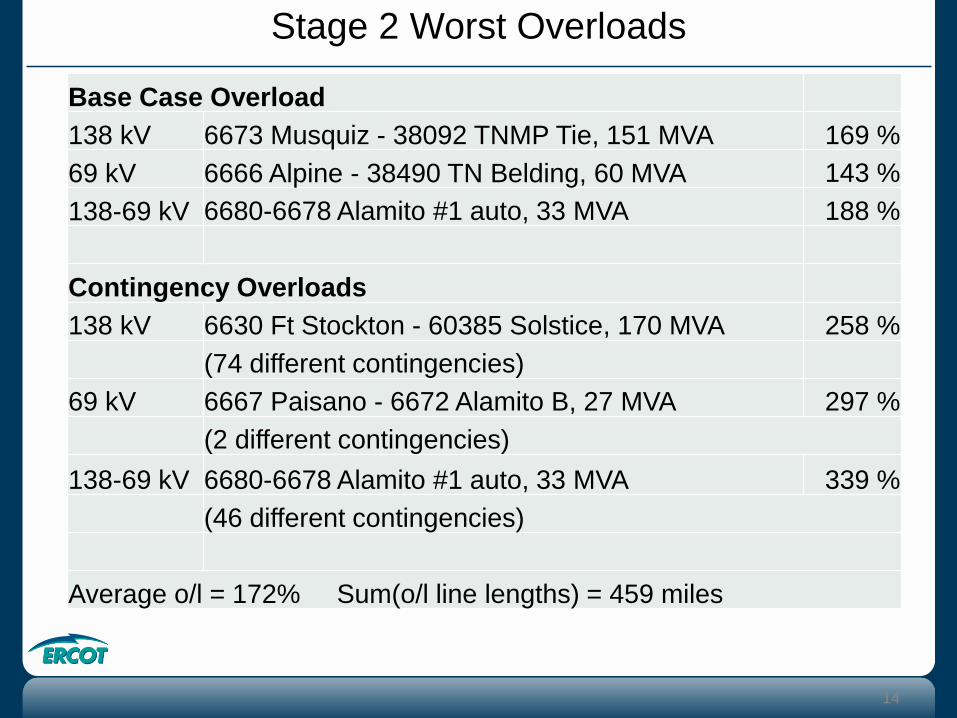
Stage 2 Worst Overloads
Base Case Overload
138 kV 6673 Musquiz - 38092 TNMP Tie, 151 MVA 169 %
69 kV 6666 Alpine - 38490 TN Belding, 60 MVA 143 %
138-69 kV 6680-6678 Alamito #1 auto, 33 MVA 188 %
Contingency Overloads
138 kV 6630 Ft Stockton - 60385 Solstice, 170 MVA 258 %
(74 different contingencies)
69 kV 6667 Paisano - 6672 Alamito B, 27 MVA 297 %
(2 different contingencies)
138-69 kV 6680-6678 Alamito #1 auto, 33 MVA 339 %
(46 different contingencies)
Average o/l = 172% Sum(o/l line lengths) = 459 miles
14
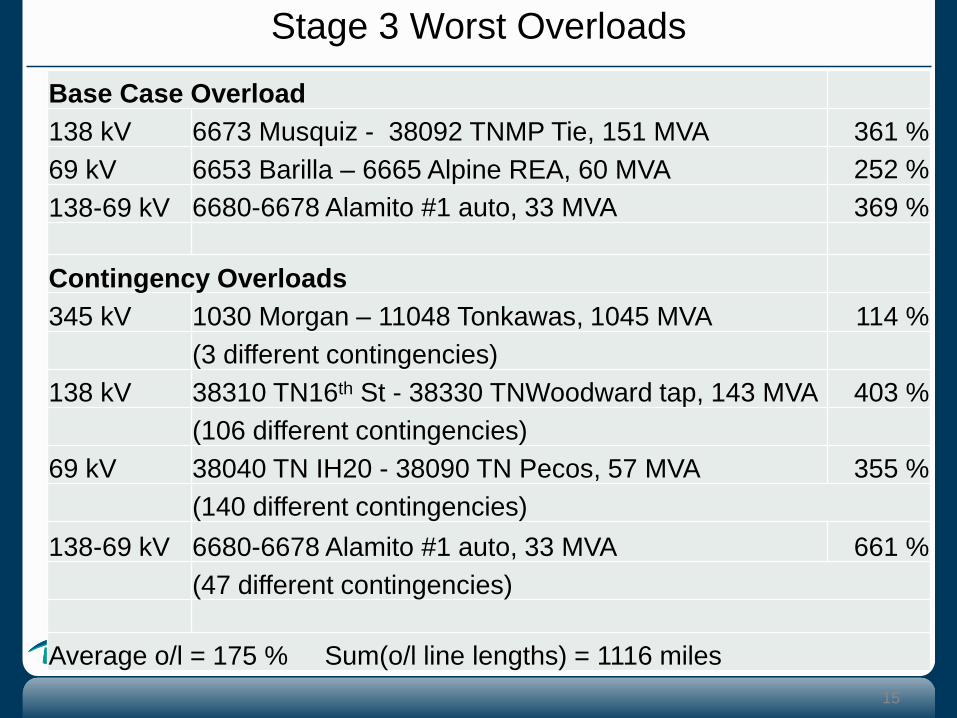
Stage 3 Worst Overloads
Base Case Overload
138 kV 6673 Musquiz - 38092 TNMP Tie, 151 MVA 361 %
69 kV 6653 Barilla – 6665 Alpine REA, 60 MVA 252 %
138-69 kV 6680-6678 Alamito #1 auto, 33 MVA 369 %
Contingency Overloads
345 kV 1030 Morgan – 11048 Tonkawas, 1045 MVA 114 %
(3 different contingencies)
138 kV 38310 TN16th St - 38330 TNWoodward tap, 143 MVA 403 %
(106 different contingencies)
69 kV 38040 TN IH20 - 38090 TN Pecos, 57 MVA 355 %
(140 different contingencies)
138-69 kV 6680-6678 Alamito #1 auto, 33 MVA 661 %
(47 different contingencies)
Average o/l = 175 % Sum(o/l line lengths) = 1116 miles
15

Especially Difficult Contingencies
16
North part of the Culberson County 138 kV Loop
Total length of these sections is more than 50 miles.
The rest of the loop out to Culberson and back around to
Permian is another 101 miles.
Smaller 138-69 kV Alamito autotransformer
138 kV Solstice lines (Ft Stockton, or TNMP Tie8, or Alamito)
69 kV Ft Stockton – Alpine
69 kV Alpine REA lines (Barilla or Alpine)

Next Steps
Model TSP-proposed transmission projects
LCRA Camp Wood – Leakey rebuild
Brazos Salt Creek area project
AEP and Oncor Barilla area improvements
Oncor Andrews County – N Andrews – Holt project
Oncor Riverton – Sand Lake new 138kV line
Re-run stage 1, stage 2, and stage 3 case calculations
Test alternative additional transmission and/or voltage support
projects
Draft report for RPG
Based on stakeholder feedback and time constraints ERCOT may
perform system strength calculations, economic analysis, and
further voltage analysis.
17

Questions?
18


