February 8, 2002
Overview of Older MissouriansOverview of Older Missouriansby
Dr. Daryl J. Hobbs
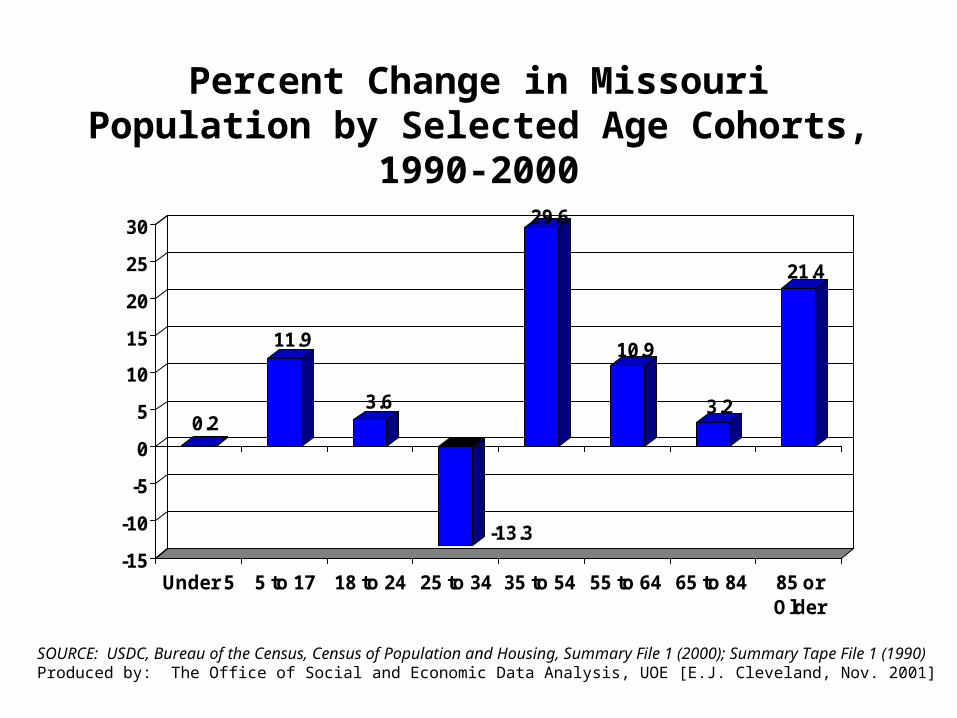
Percent Change in Missouri Population by Selected Age Cohorts, 1990-2000
0.2
11.9
3.6
-13.3
29.6
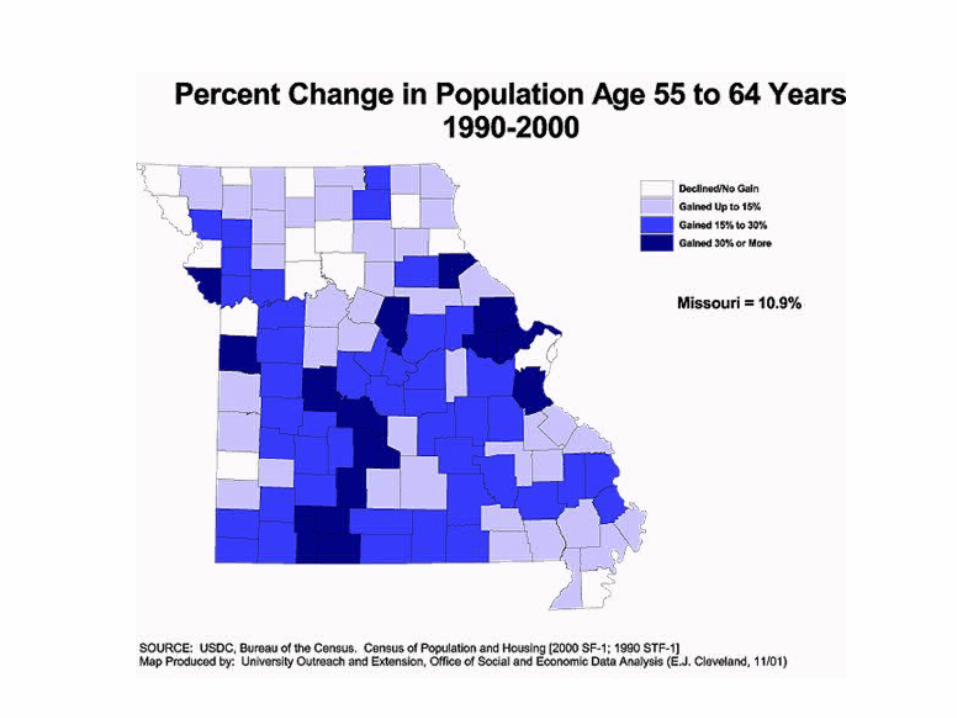
10.9
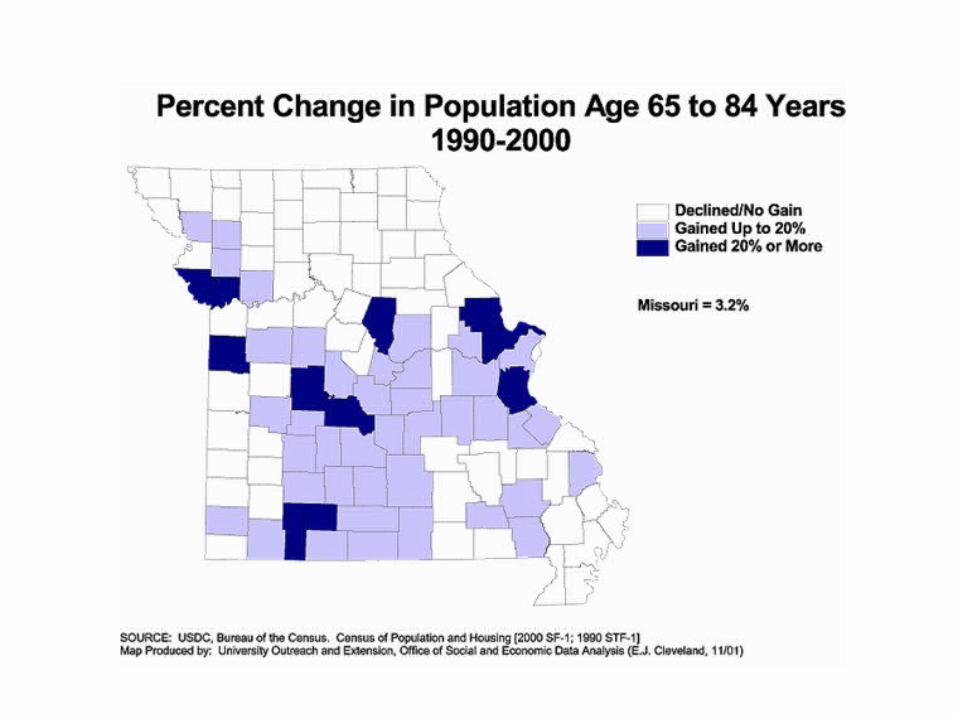
3.2
21.4
-15
-10
-5
0
5
10
15
20
25
30
Under 5 5 to 17 18 to 24 25 to 34 35 to 54 55 to 64 65 to 84 85 orOlder
SOURCE: USDC, Bureau of the Census, Census of Population and Housing, Summary File 1 (2000); Summary Tape File 1 (1990)Produced by: The Office of Social and Economic Data Analysis, UOE [E.J. Cleveland, Nov. 2001]
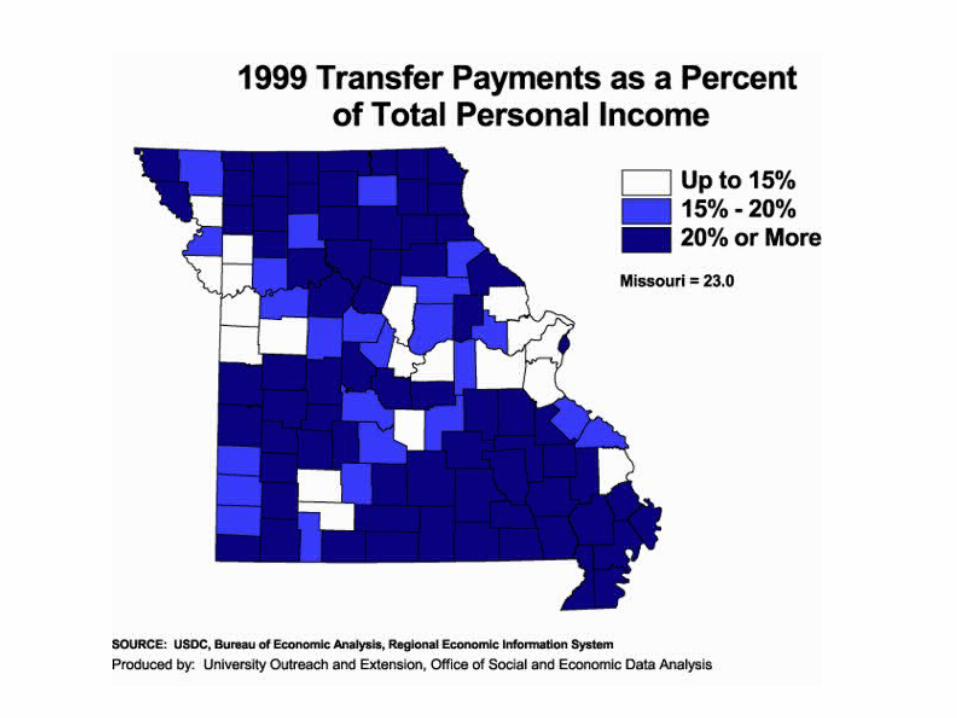

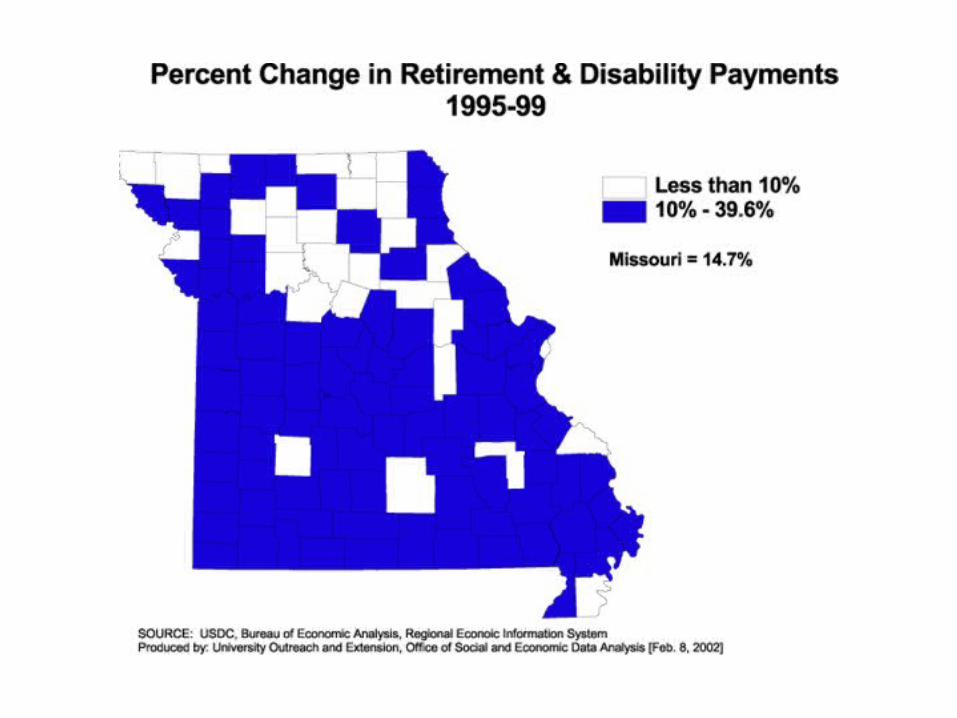
Missouri Transfer Payments, 1999 ($000)Missouri Transfer Payments, 1999 ($000)
Source: USDC, Bureau of Economic Analysis, Regional Economic Information System
1999Pct. Of
Total
Total Transfer Payments 20,965,085
Retirement & Disability Insurance Benefit Payments 8,773,930 41.9Social Security 8,424,338 40.2Other 349,592 1.7Medical Payments 8,402,601 40.1Medicare Payments 4,615,910 22.0Public Assistance Medical Care 3,752,158 17.9Military Medical Insurance Payments 34,533 0.2Income Maintenance Benefit Payments 1,765,870 8.4Supplemental Security Income (SSI) Payments 489,243 2.3Family Assistance 234,759 1.1Food Stamps 350,967 1.7Other Income Maintenance 690,901 3.3Unemployment Insurance Benefits Payments 298,001 1.4State Unemployment Insurance Compensation 289,968 1.4Other Unemployment Compensation 122 0.0Veterans Benefit Payments 493,154 2.4Fed Ed. & Train. Assist. Payments (excl. vets) 213,183 1.0Other Payments To Individuals 12,948 0.1Payments To Nonprofit Institutions 590,840 2.8Federal Government Payments 145,778 0.7State and Local Government Payments 262,794 1.3Buisness Payments 182,868 0.9Buisness Payments To Individuals 414,558 2.0