
This is an electronic reprint of the original article.This reprint may differ from the original in pagination and typographic detail.
Powered by TCPDF (www.tcpdf.org)
This material is protected by copyright and other intellectual property rights, and duplication or sale of all or part of any of the repository collections is not permitted, except that material may be duplicated by you for your research use or educational purposes in electronic or print form. You must obtain permission for any other use. Electronic or print copies may not be offered, whether for sale or otherwise to anyone who is not an authorised user.
Feinauer, Christoph; Skwark, Marcin J.; Pagnani, Andrea; Aurell, Erik
Improving Contact Prediction along Three Dimensions
Published in:PLOS COMPUTATIONAL BIOLOGY
DOI:10.1371/journal.pcbi.1003847
Published: 01/01/2014
Document VersionPublisher's PDF, also known as Version of record
Please cite the original version:Feinauer, C., Skwark, M. J., Pagnani, A., & Aurell, E. (2014). Improving Contact Prediction along ThreeDimensions. PLOS COMPUTATIONAL BIOLOGY, 10(10), 1-13. [e1003847]. DOI: 10.1371/journal.pcbi.1003847

Improving Contact Prediction along Three DimensionsChristoph Feinauer1., Marcin J. Skwark2,3., Andrea Pagnani1,4, Erik Aurell2,3,5*
1 DISAT and Center for Computational Sciences, Politecnico Torino, Torino, Italy, 2 Department of Information and Computer Science, Aalto University, Aalto, Finland,
3 Aalto Science Institute (AScI), Aalto University, Aalto, Finland, 4 Human Genetics Foundation-Torino, Molecular Biotechnology Center, Torino, Italy, 5 Department of
Computational Biology, Royal Institute of Technology, AlbaNova University Centre, Stockholm, Sweden
Abstract
Correlation patterns in multiple sequence alignments of homologous proteins can be exploited to infer information on thethree-dimensional structure of their members. The typical pipeline to address this task, which we in this paper refer to as thethree dimensions of contact prediction, is to (i) filter and align the raw sequence data representing the evolutionarily relatedproteins; (ii) choose a predictive model to describe a sequence alignment; (iii) infer the model parameters and interpretthem in terms of structural properties, such as an accurate contact map. We show here that all three dimensions areimportant for overall prediction success. In particular, we show that it is possible to improve significantly along the seconddimension by going beyond the pair-wise Potts models from statistical physics, which have hitherto been the focus of thefield. These (simple) extensions are motivated by multiple sequence alignments often containing long stretches of gapswhich, as a data feature, would be rather untypical for independent samples drawn from a Potts model. Using a large testset of proteins we show that the combined improvements along the three dimensions are as large as any reported to date.
Citation: Feinauer C, Skwark MJ, Pagnani A, Aurell E (2014) Improving Contact Prediction along Three Dimensions. PLoS Comput Biol 10(10): e1003847. doi:10.1371/journal.pcbi.1003847
Editor: Roland L. Dunbrack Jr., Fox Chase Cancer Center, United States of America
Received February 28, 2014; Accepted August 7, 2014; Published October 9, 2014
Copyright: � 2014 Feinauer et al. This is an open-access article distributed under the terms of the Creative Commons Attribution License, which permitsunrestricted use, distribution, and reproduction in any medium, provided the original author and source are credited.
Funding: CF has been supported by the People Programme (Marie Curie Actions) of the European Union’s Seventh Framework Programme FP7/2007-2013/under REA grant agreement n. 290038. MJS and EA have been supported by the Academy of Finland through the Academy of Finland Center of Excellence inComputational Inference Research (COIN). We acknowledge the computational resources provided by Aalto Science-IT project. The funders had no role in studydesign, data collection and analysis, decision to publish, or preparation of the manuscript.
Competing Interests: The authors have declared that no competing interests exist.
* Email: [email protected]
. These authors contributed equally to this work.
Introduction
The large majority of cellular mechanisms are executed and
controlled by the coordinated action of thousands of proteins,
whose biological function is strongly connected to their three-
dimensional (3D) arrangement. As shown by Anfinsen almost 40
years ago [1], the native three-dimensional structure and function
of any given protein is unambiguously encoded by its amino acid
sequence. Despite many years of intensive work in the field, and
many partial successes, the problem of predicting structural
properties of a protein from sequence information alone is still
to be considered as an open problem.
Recent years have seen a staggering increase in the amount of
available protein sequence data, which can be attributed to the
developments in the sequencing technologies. Currently, sequenc-
es of more than 80 million proteins are known, which is a figure
that continues growing by over 50% yearly [2]. This, coupled with
advances in sequence homology detection methods [3–5], allows
for construction of accurate multiple sequence alignments (MSA),
capable of capturing the evolutionary history of proteins of
interest. As a result of the trade-off between the evolutionary drift
and the constraint imposed by biological function, proteins
comprising such a multiple sequence alignment are generally
characterized by: (i) a considerable sequence variation, (ii) a
striking similarity between their 3D structures. In particular, the
evolutionary pressure to conserve structure suggests that residues
in spatial proximity should exhibit patterns of correlated amino
acid substitutions in these multiple sequence alignments.
The approach of using co-evolutionary information encoded in
the MSA of homologous proteins to predict structural features of
its members was proposed long ago [6–11] (see also [12,13] for
recent reviews on the subject). The last five years have witnessed a
renewed interest in the problem: after a first wave of works
inspired by statistical physics based on Bayesian methods [14,15],
or on different mean-field approximations to a maximum-entropy
model [16,17], a burst of scientific activity produced new and
increasingly accurate global inference methods [18–24]. Apart
from inferring structural properties for single protein domains, co-
evolutionary methods provide reliable predictions for: (i) inter-
chain structural organization [17], (ii) specificity and partner
identification in protein-protein interaction in bacterial signal
transduction system [15,25], (iii) essential residue-residue contacts
to determine native 3D structures [26–28].
The basis of all these computational methods is the idea of
global statistical inference. The global approach has the advantage
that it is able to disentangle direct from indirect couplings between
residues. By modeling the whole data set at once, and not only
pairs of residues independently, it is, for example, possible to
identify a case in which high correlation between two residues is
the indirect consequence of both being directly correlated to a
third variable.
Methods that address this problem are collected under the
umbrella term of Direct Coupling Analysis (DCA). Some methods
used so far are (i) the message passing based DCA (mpDCA) [16]
and the mean-field DCA (mfDCA) [17], (ii) sparse inverse
covariance methods (PSICOV) [20], (iii) pseudo-likelihood based
PLOS Computational Biology | www.ploscompbiol.org 1 October 2014 | Volume 10 | Issue 10 | e1003847

optimization [18,22,23]. The techniques proposed in (iii), and in
particular the plmDCA algorithm [22,24], seem to achieve the
most accurate predictions so far, when validated against experi-
mentally determined protein structures. Nonetheless, plmDCA
shows systematic errors that can be traced back to certain intrinsic
characteristics of MSAs, such as the existence of repeated gap
stretches in specific parts of the alignment. This phenomenon
reflects the tendency of homologous proteins to include large-scale
modular gene rearrangements in their phylogenetic evolution, as
well as point insertions/deletions. As an empirical way to describe
such complex rearrangements, sequence alignment methods
typically use a form of substitution matrix to assign scores to
amino acid matches and a gap penalty for matching an amino acid
in one sequence and a gap in the other. In either case, the most
widely utilized gap-penalty schemes assign a large cost to open a
gap and a smaller one to extend a gap, so that the overall penalty
Q of creating a stretch of gaps of length l is Q(l) = a+b(l21), where
typically a,210 and b,22 [29]. This introduces an intrinsic
asymmetry between gaps and amino acids, where subsequences
consisting only of the gap variable are much more likely to occur
in an MSA than subsequences of one and the same amino acid.
In this work we highlight that contact prediction can be
improved in three different ways, or dimensions, all important for
overall success and accuracy. The first dimension is Data; it
matters which MSA one uses as input to a DCA scheme.
Continuing recent work of one of us [30] we show that in a large
test data set MSAs built on HHblits alignments give more useful
information than MSAs derived from the Pfam protein families
database. This conclusion is perhaps not surprising, as the Pfam
database was not constructed with potential applications to DCA
in mind, but is practically important if DCA is to reach its full
potential. The second dimension is Model; it matters which
global model one tries to learn from an MSA, and it is possible to
systematically improve upon the pairwise interaction models, or
Potts models, which have hitherto been the focus of the field. This
we show starting from the empirical observation that several DCA
methods typically produce high-ranking false positives in parts of
an alignment rich in gaps, and the simple fact that any
subsequence of one of the same variable has low sequence
entropy, and is thus unlikely to occur in random samples drawn
from a Potts model, unless its model parameters take special
values, i.e. unless at least some of them are quite large. We
therefore enhance the Potts model by including terms depending
on gaps of any length, much in the spirit of a simplified model for
protein folding proposed long ago [31]. In this way we are able to
effectively reduce the false positive rate in gap-rich regions of the
MSA over a large test data set of diverse proteins. The third
dimension is Method. It is well known that DCA by learning a
Potts model describing an MSA by exactly maximizing a
likelihood function is computationally unfeasible for realistic
protein sizes. Most DCA methods can therefore be seen as
circumventing this fact, either by approximating the likelihood
function, or by using a different (weaker) learning criterion. Here,
we show that pseudo-likelihood based optimization methods,
which have demonstrated the best performance among standalone
methods, have the additional advantage of being flexible and easily
adaptable to learning other models. This we show by including
terms depending on gaps of any length in the score function
optimized in the recently developed asymmetric version of the
plmDCA algorithm [22,24] resulting in a method we denote
gplmDCA. We show as well, that improvement achieved by
introduction of gap terms can be attained also by a modification to
the scoring of inferred matrices (plmDCA20).
Important recent developments, not touched upon in the
present work, are combining two or more DCA methods and/or
incorporating supplementary information in a prediction process,
as done in [30] and [23]. One motivation is that it is theoretically
interesting by itself to see how much useful information can be
learned by simply starting from the data, proposing a model, and
then learning the model more or less well from the data; a second
motivation is computational speed, as a stand-alone method is
(typically) much faster than meta-predictors. A pragmatic motiva-
tion for this choice is that any meta-predictor is based on
combining stand-alone methods. Hence, improving stand-alone
methods gives scope for further improvements of the meta-
predictors. Indeed, we believe that the method developed here
should allow for further improvements to the methods of [30] and
[23]; this we leave however for future work.
Results
We have developed a new, fast DCA method byextending the Potts model with gap parameters
The new method gap-enhanced pseudo maximum-likelihooddirect contact analysis (gplmDCA) uses as underlying inference
engine the recent asymmetric pseudo maximum-likelihood [24]
augmented by gap parameters, as described in Methods. The
added gap parameters have the same status as the other
parameters of the model, and the inference task posed by
gplmDCA is therefore formally the same as in plmDCA. The
number of additional parameters is less than N2
2, with N being the
length of a alignment, a small fraction of the number of
parameters in Potts model based DCA. We have found that the
computing time our new method gplmDCA is almost indistin-
guishable from the asymmetric version of plmDCA [24].
This introduction of gap parameters significantly alleviates a
well-known negative trait of plmDCA – the presence of gap-
induced artifacts in many contact maps. The reduction of strong,
but spurious couplings in the inference process allows for the
detection of other couplings, improving prediction qualitatively.
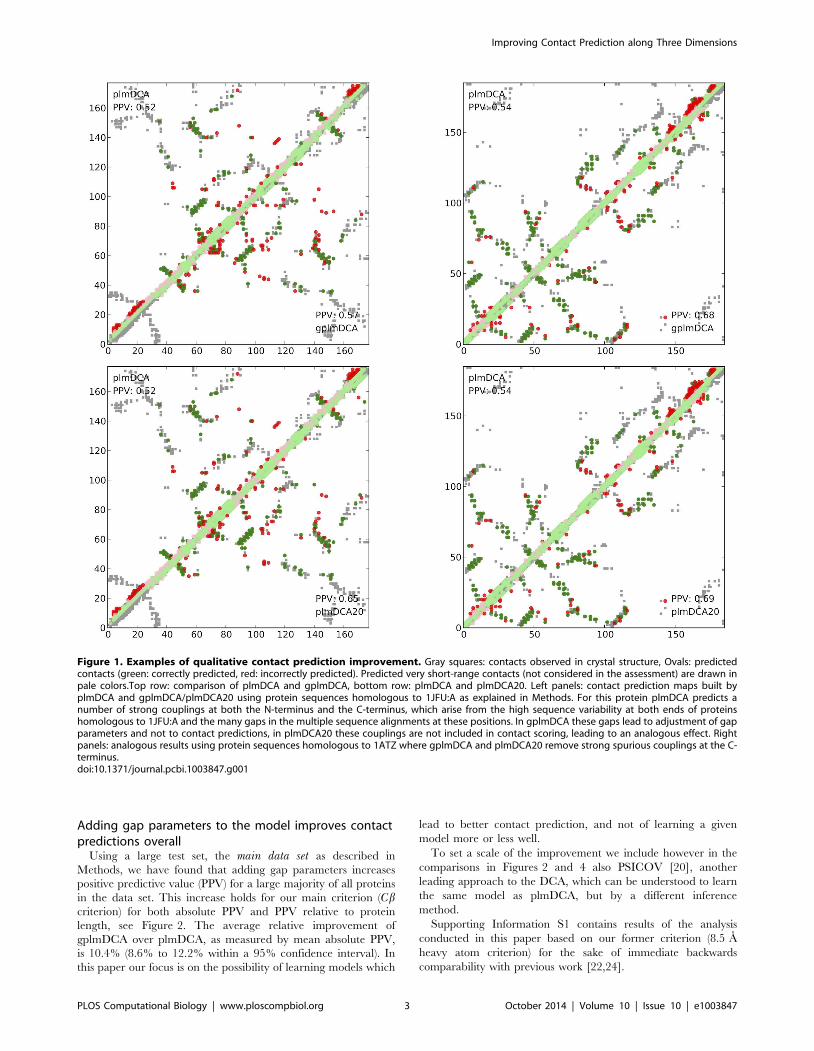
Figure 1 shows two examples where conspicuous incorrect
predictions at the N-terminus and the C-terminus are removed.
Author Summary
Proteins are large molecules that living cells make bystringing together building blocks called amino acids orpeptides, following their blue-prints in the DNA. Freshlymade proteins are typically long, structure-less chains ofpeptides, but shortly afterwards most of them fold intocharacteristic structures. Proteins execute many functionsin the cell, for which they need to have the right structure,which is therefore very important in determining what theproteins can do. The structure of a protein can bedetermined by X-ray diffraction and other experimentalapproaches which are all, to this day, somewhat labor-intensive and difficult. On the other hand, the order of thepeptides in a protein can be read off from the DNA blue-print, and such protein sequences are today routinelyproduced in large numbers. In this paper we show thatmany similar protein sequences can be used to findinformation about the structure. The basic approach is toconstruct a probabilistic model for sequence variability,and then to use the parameters of that model to predictstructure in three-dimensional space. The main technicalnovelty compared to previous contributions in the samegeneral direction is that we use models more directlymatched to the data.
Improving Contact Prediction along Three Dimensions
PLOS Computational Biology | www.ploscompbiol.org 2 October 2014 | Volume 10 | Issue 10 | e1003847
Adding gap parameters to the model improves contactpredictions overall
Using a large test set, the main data set as described in
Methods, we have found that adding gap parameters increases
positive predictive value (PPV) for a large majority of all proteins
in the data set. This increase holds for our main criterion (Cbcriterion) for both absolute PPV and PPV relative to protein
length, see Figure 2. The average relative improvement of
gplmDCA over plmDCA, as measured by mean absolute PPV,
is 10.4% (8.6% to 12.2% within a 95% confidence interval). In
this paper our focus is on the possibility of learning models which
lead to better contact prediction, and not of learning a given
model more or less well.
To set a scale of the improvement we include however in the
comparisons in Figures 2 and 4 also PSICOV [20], another
leading approach to the DCA, which can be understood to learn
the same model as plmDCA, but by a different inference
method.
Supporting Information S1 contains results of the analysis
conducted in this paper based on our former criterion (8.5 A
heavy atom criterion) for the sake of immediate backwards
comparability with previous work [22,24].
Figure 1. Examples of qualitative contact prediction improvement. Gray squares: contacts observed in crystal structure, Ovals: predictedcontacts (green: correctly predicted, red: incorrectly predicted). Predicted very short-range contacts (not considered in the assessment) are drawn inpale colors.Top row: comparison of plmDCA and gplmDCA, bottom row: plmDCA and plmDCA20. Left panels: contact prediction maps built byplmDCA and gplmDCA/plmDCA20 using protein sequences homologous to 1JFU:A as explained in Methods. For this protein plmDCA predicts anumber of strong couplings at both the N-terminus and the C-terminus, which arise from the high sequence variability at both ends of proteinshomologous to 1JFU:A and the many gaps in the multiple sequence alignments at these positions. In gplmDCA these gaps lead to adjustment of gapparameters and not to contact predictions, in plmDCA20 these couplings are not included in contact scoring, leading to an analogous effect. Rightpanels: analogous results using protein sequences homologous to 1ATZ where gplmDCA and plmDCA20 remove strong spurious couplings at the C-terminus.doi:10.1371/journal.pcbi.1003847.g001
Improving Contact Prediction along Three Dimensions
PLOS Computational Biology | www.ploscompbiol.org 3 October 2014 | Volume 10 | Issue 10 | e1003847

Adding gap parameters to the model improvesindividual contact predictions
A regression analysis of prediction accuracy, as measured by
absolute PPV, reveals clear systematic differences between
plmDCA and gplmDCA. As shown in Figure 3 the overall
advantage of gplmDCA primarily arises from proteins where PPV
is relatively high, i.e. where prediction by plmDCA itself is
accurate.
Quantitative statistics of this effect are summarized in Table 1.
Including all 729 proteins in the main test set we find that in 82%
of the cases gplmDCA does at least as well as plmDCA, but if we
include only the 608 instances where the PPV from both plmDCA
and gplmDCA are larger than a relatively low cut-off of 0.1 this
fraction rises to 86%, eventually reaching 91%.
It is evident that the expected utility of DCA-like contact
prediction is heavily dependent on the information content in the
input alignment. The information content is closely correlated to
the number of unique protein sequences in the alignment. Until
recently, it has been a rule of thumb that one needs at least 10
times as many sufficiently diverse proteins in the alignment as
there are amino acids in the protein in question. That meant that
contact prediction with alignments of fewer than 1000 sequences
was considered unfeasible.
Adding gap parameters to the model leads to improvedpredictions when there are few sequences
As shown in Figure 4 the improvement in prediction perfor-
mance by using gplmDCA depends on how many sequences there
Figure 2. Prediction precision (PPV), average over all proteins in the main test data set. The curves show for PSICOV, plmDCA, gplmDCAand plmDCA20 the average of the number of correct predictions in the n highest scoring pairs divided by n. Left panel: PPV for absolute contactindex; the horizontal axis shows n. gplmDCA and plmDCA20 yield higher absolute PPV than plmDCA for all n. PSICOV is more often right thanplmDCA in its prediction of the few first (strongest) contacts (n = 1), but is inferior to both plmDCA20 and gplmDCA for this test set. Right panel: PPVfor relative contact index (fraction of protein length). the horizontal axis shows (n/N).doi:10.1371/journal.pcbi.1003847.g002
Figure 3. Contact prediction accuracy (mean absolute PPV) for proteins in the main test set by plmDCA (abscissa) vs gplmDCA(ordinate) in left plot and plmDCA vs plmDCA20 in the right plot. Most of the points fall above the diagonal indicating that gplmDCA ismore accurate than plmDCA for most of proteins in the test set. Data points can be fitted a straight line by Ordinary Least Squares regression, withslope 1.076460.005 (R2 = 0.987) indicating that gplmDCA is generally relatively more accurate than plmDCA the more accurate is plmDCA itself. Theslope of OLS regression line for plmDCA20 is 1.10660.004 (R2 = 0.992).doi:10.1371/journal.pcbi.1003847.g003
Improving Contact Prediction along Three Dimensions
PLOS Computational Biology | www.ploscompbiol.org 4 October 2014 | Volume 10 | Issue 10 | e1003847

are in an alignment. When considering the top ranked 110:L
contacts per protein, where L is protein length, the improvement is
centered in an interesting intermediate range of approximately
90–2500 sequences with at most 90% sequence similarity, while
gplmDCA and plmDCA are similar in performance when the
number of sequences is less than 90 (where it is poor) or more than
2500 (where it has saturated at a PPV around 65%). Even with as
few as 300 unique sequences in alignment, gplmDCA is able to
achieve 40% positive prediction rate for these highest ranked
contacts. As more contacts are considered, the range where
gplmDCA holds an advantage moves successively to proteins with
more sequences. A proposed explanation of these observations is
that the less information (sequences) are available, the more
prominent the confounding factor of the gaps becomes for
plmDCA. Introducing gap parameters alleviates this phenome-
non, increasing the prediction precision for top ranked contacts for
information-poor alignments and improving the amount of correct
contacts predicted for the information-rich alignments.
Discarding the couplings involving gaps in scoring leadsto analogous effect as introduction of gap parameter
An alternative method of accounting for gap stretches in the
inference is to not include the inferred couplings involving gap
variable in the final scoring of coupling matrices J. This approach
we subsequently denote as plmDCA20. While ignoring gap
observations in their entirety, leads to diminished prediction
precision [24], discarding the contributions from the gap state in
computing the average product corrected Frobenius norm, does
indeed improve the prediction precision on a level exceeding the
improvements achieved by gplmDCA. The average relative
improvement of plmDCA20 over plmDCA, as measured by mean
absolute PPV, is 13.1% (11.5% to 14.7% within a 95% confidence
interval). On the data set used in this paper, plmDCA20 is notably
more precise than gplmDCA, with the relative improvement of
3.9% (95% confidence interval 2.5% to 5.1%). It is important to
note, that inferred couplings involving gaps are discarded only
after gauge fixing, which means that gap observations are included
in the inference process and consequently contribute to scoring,
although in an indirect way.
Discussion
While the set of proteins reported in this work is significantly
more ‘‘difficult’’ than the proteins reported in recent work on the
subject, it is evident that extending the model with a gap term or
discounting couplings involving gaps upon scoring, significantly
increase the accuracy of prediction. This improvement can be
attributed to incremental developments in three aspects, which we
call the three dimensions of contact prediction: data, model and
method. While each of these aspects has been shown to have a
non-negligible impact on the accuracy of contact prediction on its
own, this work suggests they should not be considered separately,
but rather in unison.
The dataThe extensive benchmark performed for the purposes of the
paper has validated our previous claim that proper input
alignment matters for accurate contact prediction [30]. To
compare HHblits and Pfam alignments we have from our main
data set constructed a reduced data set of 384 proteins. As shown
in Figure 5 and Table 2, gplmDCA and plmDCA20 have a larger
advantage over plmDCA on HHblits alignments than on Pfam
alignments. Note that plmDCA on HHblits alignments has
comparable prediction performance to either gplmDCA or
plmDCA20 on Pfam alignments, confirming again the importance
of the data dimension in contact prediction.
On the level of single proteins, both with Pfam alignments and
HHblits alignments, gplmDCA has a clear advantage over
plmDCA in terms of the prediction precision, see top row of
Figure 6. The difference is more pronounced for HHblits
alignments, which can be quantified by the slope of OLS
regression line, that is 1.03460.005 in case of HHblits alignments,
but only 1.02360.003 for Pfam alignments. In the other
dimension of the same test, gplmDCA gains more from use of
HHblits over Pfam than plmDCA (bottom row of Figure 6), with
the regression line slopes of 1.04760.13 for gplmDCA and
1.03360.013 for plmDCA.
For plmDCA20, the same effect is also observable (see middle
row of Figure 6), with a comparable slopes of regression lines, that
is 1.05360.004 for HHblits alignments and 1.02560.003 for Pfam
alignments in the dimension of the alignment. In the dimension of
the inference method, plmDCA20 benefits from HHblits align-
ments slightly more than gplmDCA, with a slope of OLS
regression line equal to 1.07260.013 (bottom row of Figure 6).
The modelContact prediction in DCA has hitherto been considered in
terms of a pairwise interaction model, typically motivated by
Table 1. Numbers and fraction of proteins where gplmDCA performs better than plmDCA.
gplmDCA plmDCA20
Cutoff Proteins Better Better or equal Better Better or equal
0.5 128 109 (0.85) 116 (0.91) 117 (0.91) 122 (0.95)
0.4 227 194 (0.85) 205 (0.90) 206 (0.91) 215 (0.95)
0.3 322 277 (0.86) 290 (0.90) 294 (0.91) 304 (0.94)
0.2 441 371 (0.84) 395 (0.90) 400 (0.91) 417 (0.95)
0.1 608 475 (0.78) 524 (0.86) 521 (0.86) 561 (0.92)
ALL 729 522 (0.72) 597 (0.82) 579 (0.79) 639 (0.88)
In each row all proteins in the data set are included for which the PPV from both plmDCA and gplmDCA is larger than the cutoff value given in the first column. The fulldata set (last row) consists of 729 proteins for 522 (72%) of which gplmDCA performs better than plmDCA. In the most stringent selection (first row) there are 128proteins where both plmDCA, plmDCA20 and gplmDCA have a PPV of at least 0.5. In this set gplmDCA performs better on 109 (85%) of the instances. By the samecriteria, plmDCA20 performs slightly better than gplmDCA, outperforming plmDCA for 579 proteins (79% of all) and performing better in 117 cases (91%) out of 128proteins highly amenable to contact prediction by these methods.doi:10.1371/journal.pcbi.1003847.t001
Improving Contact Prediction along Three Dimensions
PLOS Computational Biology | www.ploscompbiol.org 5 October 2014 | Volume 10 | Issue 10 | e1003847

maxentropy arguments cf [27]. In a context where one tries to
learn from all of the data and not from a reduced set of observables
such as e.g. pair-wise correlation functions, maxentropy arguments
do not apply, and there is a vast array of possible models that
could describe the biological reality more accurately. We have
shown here that the addition of what is arguably the simplest and
most obvious non-pairwise term, the gap term, does make a
significant difference to the quality of resulting contact predictions,
although the beneficial effect is not always consistent and similar
improvement may be achieved by correcting the scoring method.
Therefore we posit that the pairwise interaction term is not the endof the story, but rather a prelude, and that there remains a lot that
can still be done in respect to constructing data models that more
accurately reflect the evolutionary relationships in proteins.
InferenceAs previously shown by some of us [22,24,30], pseudo-
likelihood maximization tends to outperform mean-field DCA
(mfDCA) [17] and sparse inverse covariance methods (PSICOV)
[20] in terms of the prediction precision. Recently, a decimation
strategy for improving the inference of the topology of an Ising
model has been proposed in the context of pseudo-likelihood
inference [32]. The idea is to run the inference several times,
setting a fraction of the weakest couplings to zero after each run
and constraining them to remain zero in consecutive runs. In
order to test whether this additional step improves protein contact
prediction, we adapted the method for the asymmetric inference of
the Potts Model used in the present work. The implementation
details can be found in the Supporting Information S2.
We have benchmarked our implementation of gplmDCA with
decimation (decgplmDCA) basing on the reduced test set used for
comparison between Pfam and HHblits. According to our results,
inference with decimation does not produce on average signifi-
cantly different results in comparison to inference without
decimation, when run on Pfam alignments. For HHblits align-
ments, decimation-aided inference performs roughly equally well
to the regular one, until roughly 50% of couplings are set to 0.
From this point on, the average prediction performance starts
decreasing, as can be seen in Supporting Information S2.
Since the matrix of coupling strengths resultant from the
inference should be sparse, as there are significantly more non-
contacting amino acid pairs than contacting ones, decimation is
expected to be beneficial in a general case. We believe, that the
fact that we observed no such effect indicates that more work is
needed on designing the decimation-aided inference method in
unison with the data model and data itself.
Figure 4. Contact prediction accuracy for proteins in the test set by plmDCA20, gplmDCA and plmDCA vs number of homologyreduced sequences in the alignment (maximum 90% sequence identity), when considering top 10%, 25% (top row), 50% and 100%(bottom row) contacts, 100% being the same number of contacts as the number of amino acids in the protein. The advantage ofgplmDCA and plmDCA20 is particularly interesting in ranges highlighted by vertical dotted lines. For the top 10% and top 25% (top row) theseranges are approximately 60–2500 and 250–23000 sequences, while for the top 50% and top 100% (bottom row) they extend from about 250sequences in the alignment and upwards. PSICOV outperforms both plmDCA and gplmDCA when there are less than about 100 sequences in thealignment.doi:10.1371/journal.pcbi.1003847.g004
Improving Contact Prediction along Three Dimensions
PLOS Computational Biology | www.ploscompbiol.org 6 October 2014 | Volume 10 | Issue 10 | e1003847

Figure 5. Prediction performance as assessed by relative PPV and Cb criterion for gplmDCA, plmDCA20 and plmDCA run on Pfamand HHblits alignments in the reduced test data set. The reduced test data set comprises the proteins in the main test data set where acomparison can be made to Pfam alignments, as described in Methods.doi:10.1371/journal.pcbi.1003847.g005
Table 2. Comparison of the effect of different inference methods and alignment sources on precision of contact prediction, basedon the reduced data set of 384 proteins.
Method HHblits Pfam
L/5 L/2 L L/5 L/2 L
plmDCA 0.54 0.44 0.34 0.51 0.42 0.33
gplmDCA 0.58 0.47 0.37 0.52 0.43 0.34
plmDCA20 0.59 0.48 0.37 0.52 0.43 0.34
decgplmDCA (1) 0.57 0.47 0.36 0.52 0.43 0.34
decgplmDCA (4) 0.56 0.46 0.36 0.52 0.43 0.34
decgplmDCA (9) 0.52 0.43 0.33 0.51 0.43 0.33
PSICOV 0.49 0.38 0.29 0.42 0.33 0.25
L/5, L/2 and L denote the precisions at respective amounts of contacts considered for evaluation, where L is the length of protein. Runs of gplmDCA with decimation aredenoted as decgplmDCA (N), where N indicates the amount of decimation rounds. Difference betwwen individual methods is significantly more perceptible whenconsidering HHblits alignments than Pfam alignments. On this set plmDCA and gplmDCA perform comparably, with plmDCA20 showing slightly higher positivepredictive value for the top ranked contacts (0.59 vs 0.58).doi:10.1371/journal.pcbi.1003847.t002
Improving Contact Prediction along Three Dimensions
PLOS Computational Biology | www.ploscompbiol.org 7 October 2014 | Volume 10 | Issue 10 | e1003847

More accurate contact mapsThe improvement in terms of the average PPV over the whole
protein set, as well as the fraction of proteins for which gplmDCA
and plmDCA20 produce more accurate predictions, cannot be be
underestimated, but is not the only distinguishing feature of these
methods. Eliminating strong couplings induced by gaps in the
alignments allows for detection of relatively weaker ones, which
may be important for the future applications of the method, such
as contact-assisted protein folding.
One example of such contacts being predicted, shown in
Figure 7, is the contacts between N-terminal helices (marked in
blue) and the b-sheet of the sensor domain of histidine kinase DcuS
(deposited in PDB as 3BY8:A). This structure is classified in CATH
[33] as a two-layer a/b sandwich and while plmDCA is able to
position strands of the b-sheet in a correct order, it fails at predicting
contacts between the a-helices of the sandwich and the b-sheet. As
can be seen in central panel Figure 7, gplmDCA in addition to the
already predicted contact between residues 34 and 113 (green dot
next to the blue region) predicts also contacts between residues 34
and 121, as well as 21 and 126. This in theory should allow for
proper positioning of helices in case of structure prediction. For this
protein plmDCA20 also predicts these additional contacts and while
plmDCA20 predictions are not identical to gplmDCA ones, both
methods achieve the same prediction precision.
Wrong predictionsThe addition of a gap term, while beneficial for vast fraction of
proteins, occasionally results in lower prediction accuracy in
Figure 6. Scatter plots of prediction by absolute PPV and Cb criterion for individual proteins in the reduced test data set. Top rowshows, analogously to Figure 3 (in Results, for the main data set), gplmDCA vs plmDCA for Pfam alignments (left panel) and for HHblits alignments(right panel). Center row shows analogous data, but for plmDCA vs plmDCA20 comparison. Bottom row shows prediction for HHblits alignments vsPfam alignments using plmDCA (left panel), gplmDCA (central panel) and plmDCA20 (right panel).doi:10.1371/journal.pcbi.1003847.g006
Improving Contact Prediction along Three Dimensions
PLOS Computational Biology | www.ploscompbiol.org 8 October 2014 | Volume 10 | Issue 10 | e1003847

comparison to the inference performed on a model without gap
term (plmDCA).
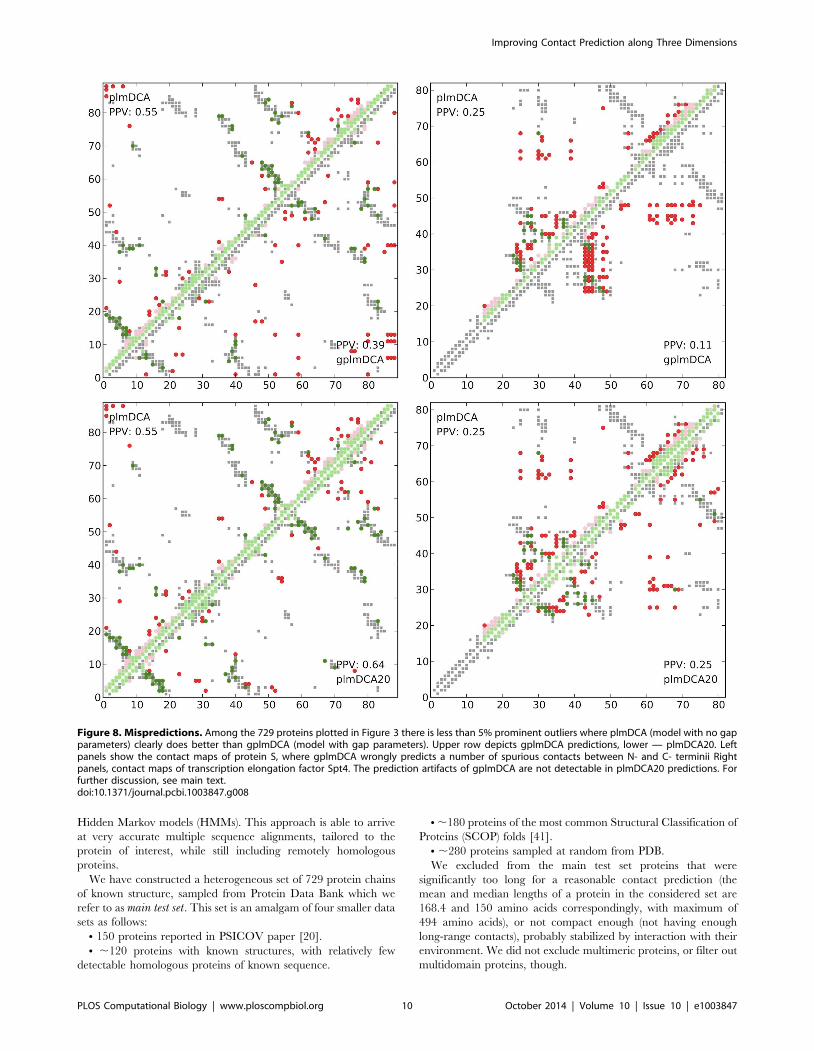
One of the most striking examples (see Figure 8) is protein S, a
member of the beta gamma-crystallin superfamily, from Myxo-coccus xanthus (deposited in PDB as 1NPS:A), which is one of the
most prominent outliers in Figure 3. For this protein plmDCA
predicts contacts allowing theoretically for proper assembly of
protein, with most of the false positives concentrating in the areas
immediately close to diagonal (with sequence separation #10). On
the the hand gplmDCA predicts here significantly fewer such false
contacts, but at the same time neglects to predict nearly all close
range contacts. Another example depicted in panel (B) of the same
figure is transcription elongation factor Spt4 from Pyroccocusfuriosus (deposited in PDB as 3P8B:A). In this case, all the contacts
predicted by gplmDCA concentrate in rectangular regions
between residues 24–49, 53–56, 59–75, which we believe could
be due to the high percentage of sequences with identical gap
distribution in the alignment, either (case 1) 1–23, 50–52, 56–59,
77–81 (31.7% of sequences) or (case 2) 1–23, 50–52, 56–59, 64–
65, 74–81 (28.4% of sequences).
We believe that the sub-par prediction accuracy for these and
most of the other outliers is due to the way input multiple sequence
alignment has been constructed. HHblits (the method used for
constructing input multiple sequence alignments) tends to result in
multiple sequences in the alignment containing identical distribu-
tions of gaps, which causes gplmDCA to assign lower coupling
strengths to the gap-rich regions. Alignments of similar size
produced by different methods (i.e. jackhmmer, data not shown),
do not seem to exhibit such a behavior. Despite this shortcoming,
we have found that HHblits alignments are highly suitable for
contact inference (cf. the data section).
In contrast to gplmDCA, we did not find any proteins for which
plmDCA20 performs significantly inferior to the original plmDCA
(as demonstrated by Figure 3). In particular, for proteins discussed
above plmDCA20 provides predictions on par or better than
plmDCA. With an exception of approximately 5% proteins,
prediction performance of plmDCA20 and gplmDCA is compa-
rable for our test set.
FoldingElimination of artifacts in predicted contact maps, as well as
increased sensitivity (predicting correct contacts between more
secondary elements) in comparison to plmDCA, coupled with
increased prediction precision, strongly suggest that gplmDCA
and plmDCA20 should provide valuable input for the future ab-initio protein structure prediction attempts. The previous incar-
nation of pseudo-likelihood maximization for direct coupling
analysis (plmDCA) has been successfully used for protein structure
prediction endeavors (c.f. [12]) as it objectively provides higher
prediction accuracy than other methods (as demonstrated, for
example in [30]). As both methods presented in this paper are at
the same time faster and more accurate than the version used in
reported structure prediction work, we strongly recommend them
for future use.
ConclusionsContact prediction has advanced greatly in the last five years,
reaching a level of accuracy which was previously believed to be
unattainable. We have shown here that the three dimensions of
data, model and method are all important for overall prediction
success, and we have shown that one can can significantly improve
prediction along the second dimension by going beyond pairwise
maxentropy models mainly used in the field up to now. Finally, we
have shown that the gap correction behavior can be achieved by
alternative method of scoring the resultant coupling matrices. We
believe that these are only the first steps in a rational approach to
incrementally improve contact prediction, and that with the
ongoing explosion in the number of available protein sequences
much further progress should be possible on these issues.
Methods
The Direct Contact Analysis (DCA) as introduced in [34] and
[16] is a family of methods to predict contact between amino acid
pairs from a multiple sequence alignment (MSA) [17,18,20–
22,26,27,30,35–38]. Learning predictive models of amino acid
contacts depends on which sequences are used to build the
alignment and by which methods they are aligned (Input data),
which model one tries to learn from the data (Model) and how a
model is learned from the data (Inference method). We describe
below our approach along these three dimensions in turn. The
perceived quality of prediction then depends on how the model is
used and how it is benchmarked, as we describe below (Prediction
and benchmarking metrics).
Input dataIn a substantial fraction of the contributions to the development
of DCA contact predictions have been based on MSAs obtained
from the Pfam protein families database: [3,39]. However, as
recently shown by one of us in [30], and as also shown here (see
Discussion), these alignments are not the optimal input for DCA
and DCA-like methods.
Instead of PfamA alignments, we use a state-of-art homology
detection method HHblits [40], based on iterative comparison of
Figure 7. Difference in contact prediction between plmDCA and gplmDCA for sensor domain of histidine kinase DcuS from E.coli(pdbid:3BY8:A). Left figure: protein structure, with some of contacts uniquely predicted by gplmDCA marked by dashed lines. Center and right:contact maps, with the region of interest marked in faint blue. Predictions by both plmDCA20 and gplmDCA differ slightly, but maintain the sameaccuracy and uncover additional contacts, important for protein structure prediction.doi:10.1371/journal.pcbi.1003847.g007
Improving Contact Prediction along Three Dimensions
PLOS Computational Biology | www.ploscompbiol.org 9 October 2014 | Volume 10 | Issue 10 | e1003847
Hidden Markov models (HMMs). This approach is able to arrive
at very accurate multiple sequence alignments, tailored to the
protein of interest, while still including remotely homologous
proteins.
We have constructed a heterogeneous set of 729 protein chains
of known structure, sampled from Protein Data Bank which we
refer to as main test set. This set is an amalgam of four smaller data
sets as follows:
N 150 proteins reported in PSICOV paper [20].
N ,120 proteins with known structures, with relatively few
detectable homologous proteins of known sequence.
N ,180 proteins of the most common Structural Classification of
Proteins (SCOP) folds [41].
N ,280 proteins sampled at random from PDB.
We excluded from the main test set proteins that were
significantly too long for a reasonable contact prediction (the
mean and median lengths of a protein in the considered set are
168.4 and 150 amino acids correspondingly, with maximum of
494 amino acids), or not compact enough (not having enough
long-range contacts), probably stabilized by interaction with their
environment. We did not exclude multimeric proteins, or filter out
multidomain proteins, though.
Figure 8. Mispredictions. Among the 729 proteins plotted in Figure 3 there is less than 5% prominent outliers where plmDCA (model with no gapparameters) clearly does better than gplmDCA (model with gap parameters). Upper row depicts gplmDCA predictions, lower — plmDCA20. Leftpanels show the contact maps of protein S, where gplmDCA wrongly predicts a number of spurious contacts between N- and C- terminii Rightpanels, contact maps of transcription elongation factor Spt4. The prediction artifacts of gplmDCA are not detectable in plmDCA20 predictions. Forfurther discussion, see main text.doi:10.1371/journal.pcbi.1003847.g008
Improving Contact Prediction along Three Dimensions
PLOS Computational Biology | www.ploscompbiol.org 10 October 2014 | Volume 10 | Issue 10 | e1003847

The alignments in the main test set have been constructed using
HHblits, as contained in HHsuite 2.0.16 with a bundled
uniprot20_2013_03 database. We have run five iterations of
search, with a E-value cutoff of 1, allowing for inclusion of
distantly homologous protein in the alignment. The search was
conducted without filtering the result MSA (-all parameter),
without limiting the amount of sequences allowed to pass the
second prefilter and allowing for realigning all the hits, hence
obtaining the most information-rich and accurate alignment at
cost of increased running time.
To compare Pfam and HHblits-based predictions we have from
the main test set also constructed a reduced test set by the following
procedure. For each of the proteins in the main test set we
searched for its PDB identifier against an official Pfam-PDB
mapping, to identify the longest Pfam family corresponding to this
protein (in case of potential multiple Pfam hits per PDB identifier).
This resulted in alignments for 481 proteins, reflecting inter aliathe fact that not all proteins in the main test set have an official
Pfam-PDB mapping. Then we identified the sequence in the
appropriate Pfam alignment which is closest to the sequence of
protein in question by Smith-Waterman algorithm using BLO-
SUM100 matrix. From this set we reject alignments where we the
number of residues in both sequences aligned to gaps is more than
50% of length shorter of sequences plus length difference between
sequences, and subsequently we trim the Pfam alignment to only
the columns aligned to protein in question. Finally, the reduced
test set contains 384 proteins with both Pfam and HHblits MSAs
which form the input for plmDCA, plmDCA20 and gplmDCA in
the comparisons presented in Discussion and Figures 5 and 6. The
comparison is there done by filtering down the predictions to
include only the columns present in the Pfam alignments.
Protein sequences present in sequence database (and hence used
for alignments in this work) are biased towards sequences from
genomes of organisms that are of special interest to humans. Many
such sequences are closely similar, and following [16] sequences
that are more similar than some threshold are reweighted before
being used in a DCA. We here use the reweighting recently
described in [24], with threshold 0.1, that is, by reweighting
sequences that are more than 90% identical.
ModelA multiple sequence alignment can be considered as samples
from an unknown probability distribution. Each row, correspond-
ing to one protein in the alignment, is then one of the qN possible
realizations of a random variable which at each of the N positions
along the row can take q = 21 different values (the amino acid or
the gap symbol at that position). The (unknown) probability
distribution is, in principle, the result of the complete evolutionary
history of all forms of life, and is therefore a very complicated
object. However, it is not necessary to know the probability
distribution exactly to extract useful information.
The Direct-Coupling Analysis (DCA), as introduced in [34] and
[16], assumes that the probability distribution is the Potts Model of
statistical physics [42]:
PPotts(a)~e{HPotts(a)
Z HPotts(a)~{X
ivj
Jij(ai,aj){X
i
hi(ai): ð1Þ
The use of the Potts model in the DCA has often been
motivated by maxentropy arguments cf [27]. As we base our
approach an inference method which uses all the data (see below),
we cannot refer to maxentropy principles. Instead, one may
observe that it has been found in many branches of science and
engineering, that probability distributions over a collection of a
large number of similar objects often obey a large deviation
principle [43]. The full distribution P can then be written as
P(a)<exp(2L(a)), where the function L in the exponent is
‘‘simple’’, a classical example being the Gibbs-Boltzmann distri-
bution of equilibrium statistical mechanics. An unknown proba-
bility distribution can then be expanded in a series
{log P(a)~L(a)~ConstantzS1(a)zS2(a)z . . . ð2Þ
where the first order contribution S1 (linear) contains terms only
depending on one component of a, the second order contribution
S2 (bi-linear) contains terms depending on two components of a,
and so on. If L in fact is simple, then a low order truncation should
give a useful approximation to P, and the Potts model of (1) is
nothing but the truncation of (2) after the second order terms. We
note that hierarchies of exponential probability distributions have
non-obvious properties, and may for instance be taken as a basis of
an invariant decomposition of the entropy [44].
Any multiple sequence alignment procedure typically produces
stretches of gaps, a fact which is obvious by visual inspection. It is
therefore an immediate observation that a real MSA data cannot
be a set of independent realizations of the rather simple model in
(1), since such stretches of one and the same variable (the gap
variable) are very unlikely to occur in a random variable drawn
from the distribution (1). In a DCA based on (1) we manifestly
learn from data a model which does not generate the same data.
We therefore hypothesized that by learning a model which
describes the data better, we might also better predict amino acid
contacts.
To investigate this we introduced additional gap parameters
and try to learn
PGap{Potts(a)~e{HPotts(a){HGap(a)
Z HGap(a)~{XL
l~1
XN{lz1
i~1
jli I
li (a), ð3Þ
where the jli are new parameters describing the propensity of a site
i to be the beginning of a gap of length l, I li (a) is an indicator
function which takes the value 1 if there is a gap of length lbeginning at site i, and otherwise zero, and L is a meta-parameter,
the largest gap length included in the gap parameters. We set L to
the largest gap length found in a given alignment. The number of
additional parameters to be learned is thus not larger than NL, to
be compared to the number of parameters already used in (1),
which is about 12
q2N2.
Inference methodThe benchmark of learning a model from data is maximum
likelihood where one chooses the probability distribution in a class
which minimizes a negative-log-likelihood function L. The main
problem in learning (1) from data by maximum likelihood is that
the normalizing constant (Z) cannot be evaluated exactly and
efficiently in large systems, and that therefore maximum likelihood
learning can only be done approximately e.g. by variational
methods [45]. Therefore, we instead use the weaker learning
criterion of pseudo-likelihood maximization [46], first applied in
the DCA setting by one of us in [22]. A further issue is that the
number of parameters in a Potts model based DCA is (typically)
larger than the number of observations (number of sequences in an
MSA), and regularization is therefore necessary. We here base our
work on the recently developed asymmetric pseudo-likelihood
Improving Contact Prediction along Three Dimensions
PLOS Computational Biology | www.ploscompbiol.org 11 October 2014 | Volume 10 | Issue 10 | e1003847

maximization [24], which is considerably faster than the version
presented in [22] while showing essential identical performance as
a predictor of amino acid contacts.
Learning the new model including (3) is especially convenient
using the pseudo-likelihood maximization approach. We have
developed a new code gplmDCA based on the asymmetric version
of plmDCA of [24].
Prediction and benchmarking metricsThe outcome of learning a model of the Potts type is a set of
pairwise interaction coefficients Jij (ai, aj). For each pair (i, j) (each
pair of positions) this is a matrix in two other variables (ai and aj)
and how an inferred interaction is scored depends on which matrix
norm one uses. We here use the Frobenius norm augmented by
the Average Product Correction (APC), as introduced in the
context of DCA by one of us in [22], and order the pairs (i, j), for
each multiple sequence alignment, by the value of this score.
An alternative method of handling the gaps in the alignment
(plmDCA20) is to change the scoring function, such that the
Frobenius norm is computed only on the 20620 sub-matrix which
does not involve the gap variables. The procedure is to ignore the
gap couplings after computing the coupling matrix J, which is
manifestly not the same as ignoring data on the gap variables
altogether. Since L2 penalty in plmDCA enforces the Ising gauge
for the couplings, the gap observations are used in the inference
and consequently contribute to the result, although in a non-trivial
way. In our experience (Aurell & Hartonen, unpublished results),
ignoring the data on gap variables in the inference does not result
in any improvement in the prediction precision.
To benchmark the predictions of the DCA one compares
against known crystal structures. In this work we use as the main
benchmark criterion, that two amino acids are in contact, if their
Cb atoms are at most 8 A apart in the crystal structure. This we
denote as Cb criterion and use predominantly throughout this
article. In order to facilitate comparison to previously published
work on the DCA we present also an alternate metric that
considers the amino acids to be in contact if any of their heavy
(non-hydrogen) atoms are at most 8.5 A apart. This metric is
denoted as 8.5 A heavy atom criterion We strongly believe that this
metric tends to label unduly high fraction of short-range contacts
(i.e. contact separated by less than 8 positions in sequence space) as
positive. At the same time original plmDCA predicts significantly
more short-range contacts in comparison to the background
distribution in native protein structures. Both observations in
conjunction cause the improvements to the prediction precision to
be less perceptible. We demonstrate this effect in Supporting
Information S1.
In this article we use the terms precision and PPV (positive
predictive value) interchangeably, with metric denoting the ratio of
true positives to all predictions (within a certain count threshold).
In line with previously published work on contact prediction, we
consider only the contacts with sequence separation greater or
equal to 5 amino acids (we do not consider very short range
contacts, that is contacts between amino acids i and j when
Di{jDv5).
By the term weighted moving average with window w, authors
understand a weighted arithmetic mean of a value at a given
position and w values on either side of the center position, thus
resulting in 2w+1 values to be averaged. The central position is
scaled with weight w, whereas the weights decrease in arithmetic
progression while moving away from the center (i.e positions 21
and +1 are scaled with weight w21, whereas positions 22 and 2
with weight w22 etc.).
AvailabilityThe code of gplmDCA is freely available at http://gplmdca.
aurell.org. This website contains also a link to all the data the
benchmark is based on, that is: multiple sequence alignments,
predicted couplings (both plmDCA and gplmDCA), protein
structures and contacts derived from them.
Supporting Information
Supporting Information S1 Metrics of contact prediction
correctness and results with heavy atom distance threshold of
8.5 A.
(PDF)
Supporting Information S2 Decimation. Implementation
details and effect on prediction precision.
(PDF)
Acknowledgments
CF, MS and EA thank Magnus Ekeberg and Tuomo Hartonen for
valuable discussions.
Author Contributions
Conceived and designed the experiments: EA MJS. Performed the
experiments: MJS. Analyzed the data: MJS. Contributed reagents/
materials/analysis tools: MJS CF. Wrote the paper: MJS CF AP EA.
Developed the methods used in the paper: CF MJS.
References
1. Anfinsen CB (1973) Principles that Govern the Folding of Protein Chains.
Science 181: 223–230.
2. UniProt Consortium, et al. (2013) Update on activities at the universal protein
resource (UniProt) in 2013. Nucleic Acids Research 41: D43–D47.
3. Punta M, Coggill PC, Eberhardt RY, Mistry J, Tate J, et al. (2012) The Pfam
protein families database. Nucleic Acids Research 40: D290–D301.
4. Finn RD, Clements J, Eddy SR (2011) HMMER web server: interactive
sequence similarity searching. Nucleic Acids Research 39: W29–W37.
5. Remmert M, Biegert A, Hauser A, Soding J (2011) HHblits: lightning-fast
iterative protein sequence searching by hmm-hmm alignment. Nature methods
9: 173–175.
6. Altschuh D, Lesk A, Bloomer A, Klug A (1987) Correlation of co-ordinated
amino acid substitutions with function in viruses related to tobacco mosaic virus.
Journal of Molecular Biology 193: 693–707.
7. Gobel U, Sander C, Schneider R, Valencia A (1994) Correlated mutations and
residue contacts in proteins. Proteins 18: 309–317.
8. Neher E (1994) How frequent are correlated changes in families of protein
sequences? Proceedings of the National Academy of Sciences 91: 98–102.
9. Shindyalov I, Kolchanov N, Sander C (1994) Can three-dimensional contacts in
protein structures be predicted by analysis of correlated mutations? Protein
Engineering 7: 349–358.
10. Lockless SW, Ranganathan R (1999) Evolutionarily conserved pathways of
energetic connectivity in protein families. Science 286: 295–299.
11. Fodor AA, Adlrich RW (2004) Influence of conservation on calculations of
amino acid covariance in multiple sequence alignments. Proteins: Structure,
Function, and Bioinformatics 56: 211–221.
12. Marks DS, Hopf TA, Sander C (2012) Protein structure prediction from
sequence variation. Nature biotechnology 30: 1072–1080.
13. de Juan D, Pazos F, Valencia A (2013) Emerging methods in protein co-
evolution. Nature Reviews Genetics 14: 249–61.
14. Burger L, van Nimwegen E (2008) Accurate prediction of protein–protein
interactions from sequence alignments using a Bayesian method. Molecular
Systems Biology 4: 165.
15. Burger L, van Nimwegen E (2010) Disentangling direct from indirect co-
evolution of residues in protein alignments. PLoS Computational Biology 6:
e1000633.
Improving Contact Prediction along Three Dimensions
PLOS Computational Biology | www.ploscompbiol.org 12 October 2014 | Volume 10 | Issue 10 | e1003847

16. Weigt M, White RA, Szurmant H, Hoch JA, Hwa T (2009) Identification of
direct residue contacts in protein-protein interaction by message passing.Proceedings of the National Academy of Sciences 106: 6772.
17. Morcos F, Pagnani A, Lunt B, Bertolino A, Marks DS, et al. (2011) Direct-
coupling analysis of residue coevolution captures native contacts across manyprotein families. Proceedings of the National Academy of Sciences 108:
E1293E1301.18. Balakrishnan S, Kamisetty H, Carbonell JG, Lee SI, Langmead CJ (2011)
Learning generative models for protein fold families. Proteins: Struct, Funct,
Bioinf 79: 1061.19. Sreekumar J, ter Braak C, van Ham R, van Dijk A (2011) Correlated mutations
via regularized multinomial regression. BMC Bioinformatics 12: 444.20. Jones DT, Buchan DWA, Cozzetto D, Pontil M (2012) PSICOV: precise
structural contact prediction using sparse inverse covariance estimation on largemultiple sequence alignments. Bioinformatics 28: 184.
21. Cocco S, Monasson R, Weigt M (2013) From principal component to direct
coupling analysis of coevolution in proteins: Low-eigenvalue modes are neededfor structure prediction. PLoS Computational Biology 9: e1003176.
22. Ekeberg M, Lovkvist C, Lan Y, Weigt M, Aurell E (2013) Improved contactprediction in proteins: Using pseudolikelihoods to infer potts models. Physical
Review E 87: 012707.
23. Kamisetty H, Ovchinnikov S, Baker D (2013) Assessing the utility ofcoevolution-based residue-residue contact predictions in a sequence- and
structure-rich era. Proceedings of the National Academy of Sciences 110:15674–15679.
24. Ekeberg M, Hartonen T, Aurell E (2014) Fast pseudolikelihood maximizationfor direct-coupling analysis of protein structure from many homologous amino-
acid sequences. Journal of Computational Physics 276: 341–356.
25. Procaccini A, Lunt B, Szurmant H, Hwa T, Weigt M (2011) Dissecting theSpecificity of Protein-Protein Interaction in Bacterial Two-Component Signal-
ing: Orphans and Crosstalks. PLoS ONE 6: e19729+.26. Marks DS, Colwell LJ, Sheridan R, Hopf TA, Pagnani A, et al. (2011) Protein
3D structure computed from evolutionary sequence variation. PLoS ONE 6:
e28766.27. Hopf TA, Colwell LJ, Sheridan R, Rost B, Sander C, et al. (2012) Three-
dimensional structures of membrane proteins from genomic sequencing. Cell149: 1607–1621.
28. Sulkowska JI, Morcos F, Weigt M, Hwa T, Onuchic JN (2012) Genomics-aidedstructure prediction. Proceedings of the National Academy of Sciences 109:
10340–5.
29. Durbin R, Eddy SR, Krogh A, Mitchison G (1998) Biological SequenceAnalysis: Probabilistic Models of Proteins and Nucleic Acids. Cambridge
University Press.
30. Skwark MJ, Abdel-Rehim A, Elofsson A (2013) PconsC: combination of direct
information methods and alignments improves contact prediction. Bioinfor-
matics 29: 1815–1816.
31. Wako H, Saito N (1978) Statistical mechanical theory of the protein
conformation. i. general considerations and the application to homopolymers.
Journal of the Physical Society of Japan 44: 1931–1938.
32. Decelle A, Ricci-Tersenghi F (2014) Pseudolikelihood decimation algorithm
improving the inference of the interaction network in a general class of ising
models. Physical review letters 112: 070603.
33. Orengo CA, Michie A, Jones S, Jones DT, Swindells M, et al. (1997) CATH–a
hierarchic classification of protein domain structures. Structure 5: 1093–1109.
34. Lapedes AS, Giraud BG, Liu L, Stormo GD (1999) Correlated mutations in
models of protein sequences: phylogenetic and structural effects. Lecture Notes-
Monograph Series: 236256.
35. Burkoff NS, Vrnai C, Wild DL (2013) Predicting protein b-sheet contacts using a
maximum entropy-based correlated mutation measure. Bioinformatics 29: 580–
587.
36. Lui S, Tiana G (2013) The network of stabilizing contacts in proteins studied by
coevolutionary data. J Chem Phys 139: 155103.
37. Rivoire O (2013) Elements of coevolution in biological sequences. Phys Rev Lett
110: 178102.
38. Andreatta M, Laplagne S, Li SC, Smale S (2013) Prediction of residue-residue
contacts from protein families using similarity kernels and least squares
regularization. ArXiv e-prints.
39. Protein families-database. http://pfam.sanger.ac.uk/. Accessed: 2013-10-24.
40. Remmert M, Biegert A, Hauser A, Soding J (2011) HHblits: lightning-fast
iterative protein sequence searching by HMM-HMM alignment. Nat Methods
9: 173–175.
41. Murzin AG, Brenner SE, Hubbard T, Chothia C (1995) SCOP: a structural
classification of proteins database for the investigation of sequences and
structures. J Mol Biol 247: 536–540.
42. Wu FY (1982) The potts model. Reviews of modern physics 54: 235.
43. Varadhan SR (1984) Large Deviations and Applications. Society for Industrial
and Applied Mathematics (SIAM). doi:10.1137/1.9781611970241.bm.
44. Amari S (2001) Information geometry on hierarchy of probability distributions.
IEEE Transactions on Information Theory 47: 1701–1710.
45. Wainwright MJ, Jordan MI (2008) Graphical models, exponential families, and
variational inference. Foundations and Trends in Machine Learning 1: 1–305.
46. Besag J (1975) Statistical analysis of non-lattice data. The statistician 24: 179–
195.
Improving Contact Prediction along Three Dimensions
PLOS Computational Biology | www.ploscompbiol.org 13 October 2014 | Volume 10 | Issue 10 | e1003847


