Chapter 5
FELODIPINE FORMULATIONS AND EVALUATION
5.1. PREPARATION, CHARACTERIZATION AND EVALUATION OF
FELODIPINE LOADED EUDRAGIT® RS100 NANOPARTICLES
5.1.1. Preparation of felodipine nanoparticles
Introduction
The bioavailability enhancement of poorly water soluble drugs is one of the main
targets of drug development during the last decades. Several techniques like particle
size reduction, solubilization, salt formation and preparation of solid dispersion
systems are frequently used for improving the bioavailability of these drugs.
Nevertheless, there are several disadvantages and limitations in the use of these
techniques. An effective way to address the bioavailability issues of the poorly soluble
drug is by making the polymeric nanoparticles. The embedded drug inside the suitable
polymer can prevent the crystal growth and particle aggregation, producing the
amorphous system (Sarkari et al., 2002) that can be stable for long period of time. The
polymeric nanoparticulate systems are also the promising carriers for oral sustained
drug delivery ( Vauthier et al., 2003; Amaral et al., 2007), that will be beneficial to the
patients for the long term treatment.
Felodipine is a calcium channel blocker used to treat systemic arterial hypertension.
Being BCS class II (Biopharmaceutics Classification System) drug, it has very low
water solubility and high permeability (Kim et al., 2006). The oral bioavailability of
this drug is limited and, thus, the enhancement of its bioavailability would be a useful
achievement. The incorporation of felodipine in polymeric nanoparticles can be used
for improving the bioavailability and for reducing the dosing frequency, which can
also improve the patient compliance.
Eudragit®
RS100, the co-polymer of poly (ethylacrylate, methyl-methacrylate and
chlorotrimethyl-ammoniumethyl methacrylate) is commonly used polymer for
developing the controlled release dosage forms (Pignatello et al., 2001). It is insoluble
in physiological pH and capable of swelling, which represents the good material for
the drug dispersion (Perumal et al., 1999). This characteristic may maximize the
cellular uptake of drug-polymer complex. Eudragit®
RS100 has been previously used
for delivery of anti-inflammatory and antihypertensive drugs (Pignatello et al., 2002;
Adibkia et al., 2007; Jana et al., 2014). In the present study felodipine-Eudragit®
RS100 nanoparticles were prepared, characterized and evaluated with the aim to
achieve the prolonged and effective delivery felodipine.
Materials
Felodipine was a kind gift from Cadila Healthcare Limited (Ahmedabad, India).
Eudragit®
RS100 (Evonik Industries AG, Germany) was obtained from Sandoz Ltd.
Mumbai. Lutrol®
F-68 (Poloxamer 188) was obtained from Sigma, Mumbai.
Distilled- deionized water was prepared with Milli-Q plus System (Elix 10, Millipore
corp. India). All other chemicals used were of the highest available grade.
Method of preparation
The felodipine loaded Eudragit®
RS100 nanoparticles were prepared using the
solvent evaporation technique with slight modification (Jain, 2000). Different ratios of
felodipine and Eudragit®
RS100 were dissolved in acetone at room temperature as
described in table 5.1.1. The resultant primary solution was added with a constant
flow rate (0.5 ml/min) into separately prepared aqueous phase containing poloxamer-
188. The mixture was then homogenized at various agitation speeds in an ice bath.
The resultant oil-in-water (O/W) emulsion was kept at room temperature for 24 h
under gentle stirring to evaporate the organic solvents. The obtained nanoparticle
formulations were centrifuged at 40,000 rpm, 4oC for 20 min (Sorvall Ultracentrifuge,
USA). The un-entrapped drug was removed by washing the pellets with double
distilled water. The recovered nanoparticulate suspension was then freeze dried to get
powdered sample and kept at freeze for further use.
The impact of various formulation and process variables on entrapment efficiency
were studied to optimize the nanoparticle formulation to obtain maximum drug
entrapment in the nanoparticles.
• The agitation speed was varied from 5000, 10,000, 15,000 and 17,000 rpm
while keeping the other parameters constant ( for further experiment the agitation
speed which produced the lowest particle size with highest entrapment efficiency will
be chosen);

• The various weight ratios of drug and polymer were taken for the nanoparticle
formulation keeping the agitation speed, organic phase to the aqueous phase ratio
constant.
Table 5.1.1. Formulation of felodipine loaded Eudragit® RS100 nanoparticles
Sl.
No. Formulation
Drug:
Polymer
Ratio
Wt. of
Drug
(mg)
Wt. of
Polymer
(mg)
Vol. of
OP (ml)
Vol. of
AP (ml)
Agitation
(rpm)
1 FEN1 1:2 20 40 10 20 15,000
2 FEN2 1:3 20 60 10 30 15,000
3 FEN3 1:4 20 80 10 20 15,000
4 FEN4 1:5 20 100 10 30 15,000
5 FEN5 1:4 20 80 10 20 17,000
6 FEN6 1:4 20 80 10 30 10,000
7 FEN7 1:4 20 80 10 50 5,000
Note: FEN indicates felodipine loaded Eudragit® RS100 nanoparticle; OP: organic phase; AP:
aqueous phase.
5.1.2. Characterization of nanoparticles
Determination of particle size and Zeta potential
Particle size analysis was performed by Photon Correlation Spectroscopy (PCS) with
Zetasizer 3000 (Malvern Instruments). The freeze dried powdered samples were
suspended in Milli-Q water (1mg/ml) at room temperature (25 °C) and sonicated for
30 sec in an ice bath before measurement to prevent clumping. The mean particle
diameter and size distribution of the suspension were assessed. Analysis was carried
out for three times for each batch of sample under identical conditions and mean
values were reported. The Zeta potential was also measured using the same suspension
and same equipment.
Determination of entrapment efficiency and drug loading
The entrapment efficiency (EE) was estimated by reverse phase High Performance
Liquid Chromatography (RP-HPLC) method (Mohanty et al., 2010). The drug loaded
nanoparticle solution of 1 mg/ml was prepared in methanol and 20 µL of the sample

was injected manually to HPLC equipped with Shimadzu LC-20AD PLC pump and
SPD-M20A PDA detector. The chromatographic separation was achieved by using
Phenomenex C18 (150×4.6 mm, 5µ) analytical column. The mobile phase used
consisting of methanol and water (80:20 v/v) was passed through 0.45 µm membrane
filter and degassed by ultrasonication. The flow rate was maintained at 1.0 ml/min and
the measurements were made at 240 nm. The column was maintained in ambient
condition using thermostat. The amount of the felodipine in the sample was
determined from the peak area correlated with the standard curve. The standard curve
was prepared under the same identical condition. The drug entrapment efficiency (EE)
and drug loading (DL) were calculated using following formula:
Weight of the drug in nanoparticles
EE (% w/w) = ×100
Weight of the drug added
Weight of the drug in nanoparticle
DL (% w/w) = ×100
Weight of the polymer and drug added
Scanning electron microscopy (SEM)
The particle shape and surface morphology of felodipine nanoparticles were
examined by scanning electron microscopy (SEM) (JEOL JSM-5610LV). Moisture
free lyophilized samples were consigned on aluminium stubs using adhesive tapes and
coated with gold using sputter coater (JEOL auto fine coater, Japan) and observed for
morphology at an acceleration voltage of 20 kV at high vacuum.
Atomic force microscopy (AFM)
The surface morphology of prepared nanoparticles was carried out using
atomic force microscopy (AFM). The nanoparticle suspension was prepared with
milliQ water and dried overnight in air on a clean glass surface and observation was
performed with AFM consisting of silicon probes with pyramidal cantilever having
force constant of 0.2 N/m. To avoid damage of the sample surface, the tip to sample
distance was kept constant. The scan speed of 2 Hz and 312 kHz resonant frequency
was used for displaying amplitude, signal of the cantilever in the trace direction and to
obtained images (Trapani et al., 2009).

Transmission electron microscopy (TEM)
Morphology of the particles was also examined using transmission electron
microscope. A sample of particle suspension was diluted with 3% w/v
phosphotungstic acid adjusted to pH 7.5 with potassium hydroxide corresponding to a
1:1 ratio before examination. One drop of sample was placed for 1 minute on a copper
grid coated with a formvar carbon film. The excess of sample was wicked away with
the aid of filter paper. The sample was then ready for analysis by TEM.
Fourier transforms infrared spectroscopy (FTIR)
The possible chemical interaction between the drug, polymer and prepared
nanoparticles was determined by FTIR analysis. Samples were mixed separately with
potassium bromide (200 - 400mg) and compressed by applying pressure of 200
kg/cm2 for 2 min in hydraulic press to prepare the pellets. The pellets of the
felodipine, polymer and the drug loaded nanoparticles were scanned with resolution of
2 cm-1
in the range of 4000–400 cm-1
.
Differential scanning calorimetry (DSC)
The physical status of the drug inside the nanoparticles was ascertained by the DSC
analysis (DSC-60, Shimadzu, Japan). Approximately, weighed 2 mg of native drug,
polymer and nanoparticles were placed separately into the different sealed standard
aluminium pan and were scanned between 25 ºC to 300
ºC with heating rate of 10 ºC/
minute under nitrogen atmosphere. An empty aluminium pan served as reference.
5.1.3. Evaluation of nanoparticles
5.1.3.1. In vitro evaluation
5.1.3.1.1. Drug release study
The in vitro drug release study of felodipine nanoparticles was carried out by
using bottle method (Devarajan and Sonavane, 2007; Jain and Saraf, 2009). The
nanoparticles and pure felodipine (each containing 5 mg felodipine) were suspended
in glass bottles containing 100 ml of phosphate buffer pH 6.8 (simulated intestinal
fluid). Glass bottles were placed in beaker and kept in incubator shaker throughout the
study (37 oC, 50 rpm). The in vitro release study was also carried out for marketed
tablet formulation (each containing 5 mg of felodipine) of felodipine. At specified
time intervals (1, 2, 4, 6, 8, 12, 18, 24, 48, 72 and 96 h) 10 ml
samples were collected and centrifuged. The supernatants were collected for analysis

and the precipitate resuspended in 10 ml of fresh phosphate buffer. The analysis was
carried out by RP-HPLC at 240 nm. All the measurements were carried out in
triplicate.
Analysis of drug release data: The in vitro drug release data were analyzed by various
mathematical models to determine the kinetics and the drug release mechanism from
the developed nanoparticle formulation. The drug release data were fitted with
mathematical models including zero order kinetic [Eq. (1)], first order kinetic [Eq.
(2)], Higuchi kinetic [Eq. (3)] and Korsmeyer-Peppas model [Eq. (4)].
Qt = K0t (1)
ln Qt = ln Qt – K1t (2)
Qt = Kh t1/2
(3)
Mt / M = Kp tn (4)
The plots were made: Qt vs. t (zero order kinetic), ln (Q0 - Qt) vs. t (first order kinetic)
and Qt vs. t1/2
(Higuchi model), where Qt is the percentage of drug release at time t, Q0
is the initial amount of drug present in the formulation and K0, Kt and Kh are the
constants of the equations and calculated from the slope of the line. The first 60%
drug release was fitted in Korsmeyer-Peppas model, Where Mt / M are the fraction of
drug release at time t, Kp is the rate constant and “n” is the release exponent. The value
of “n” is calculated from the slop of the plot of log of fraction of drug released (Mt /
M ) vs. log of time to characterize the different release mechanism (Shoaib et al.,
2006; Aydin and Pulat, 2012).
According to Korsmeyer- Peppas law value of release exponent, n, is
indication of mechanism of drug release from spherical particles. When the value of
‘n’ is 0.43, it indicates that the mechanism of drug release follows fickian diffusion;
when ‘n’ > 0.43 and < 1.00, drug release follows non- fickian (anomalous) diffusion.
A value of n=1 means that the drug release is independent of time, regardless of
geometry and follows zero order.
5.1.3.1.2. Permeation study across the intestine
The everted intestinal sac model was used to study the permeability of the
nanoparticles across the intestine following the reported procedure with slight
modifications (Schilling and Mitra, 1990; Agarwal and Khan, 2001). The isolated

intestinal segment from the albino rat was carefully everted using the glass rod and
rinsed with saline solution. Then the segment was cut and secured to the tip of a 1 ml
disposable syringe barrel. Modified Kreb’s Ringer bicarbonate (MKRB) solution of
pH 7.4 was filled within the intestinal sac as serosal fluid and placed in a bath
containing 50 ml of nanoparticle suspension (1 mg/ml) in MKRB solution on mucosal
side. The fluid was continuously bubbled with carbogen gas (mixture of 5% CO2 and
95% O2 gas). The temperature of the organ bath was maintained at 37 ± 0.5 oC. The
amount of felodipine was analyzed spectrophotometrically at 240 nm using standard
curve obtained from serial dilution of felodipine in phosphate buffer pH 7.4.
5.1.3.1.3. Stability study
Stability study ensures the safety and efficacy and possible storage condition
for the pharmaceutical formulations. Decomposition or degradation of the
pharmaceutical formulations may develop due to environmental factors like
temperature, humidity, radiation, light, air etc. and due to interaction with other
chemical constituents/excipients in formulation or due to the nature of container used
for packing. Hence, it is necessary to perform stability testing for assuring safety and
efficacy and acceptability of the pharmaceutical formulations.
The lyophilized felodipine nanoparticle formulation was kept in glass vials and
stability study was carried out in three different storage conditions [ICH Q1A (R2)]
viz. long term study (25 ± 2 °C / 60% RH ± 5% RH) for one year, intermediate study
(30 ± 2 °C / 65% RH ± 5% RH) for six months and accelerated study (40 ± 2 °C / 75%
RH ± 5% RH) for six months.
The nanoparticles were evaluated at intervals of 0, 3, 6 and 12 months for long
term study and 0, 3 and 6 months for intermediate study and accelerated study. During
stability testing samples were evaluated for physical appearance, particle size, Zeta
potential and drug content.
5.1.3.2. In vivo evaluation
Wistar albino mice, Wistar albino rats were selected for the in vivo evaluation
of prepared nanoparticle and procured from Central Animal House, RMMCH,
Annamalai University and housed in the Institutional animal house under standard
environmental conditions (22 ± 30 C, 55 ± 5% humidity and 12h/12h dark/light cycle)

and maintained with free access to standard diet and water ad libitum. All
experimentations were approved by IAEC, (Proposal No.967).
5.1.3.2.1. Toxicity study
The acute toxicity study was carried out in Wistar albino mice. The healthy female
albino mice were divided into five groups for single dose oral acute toxicity study
(OECD 423) and following treatment regimen was followed:
Acute toxicity was measured by mortality and survival time and also by clinical
picture of intoxication and behavioral reactions. Animals on study were observed for
any adverse reaction, like changes of body weight, condition of eye and nose, motor
activity and also examined for internal abnormalities viz. size and appearance of heart,
lungs, liver, spleen and kidney at necropsy (Gelperina et al., 2002). Mice were bled
via the retro orbital plexus before sacrificing.
Biochemical assay: The blood samples were collected at 14th day and centrifuged at
4000 rpm for 5 min. The serum was kept at – 20 oC until analyzed. The levels of
serum glutamate oxaloacetic transaminase (SGOT), serum glutamic pyruvic
transaminase (SGPT), serum creatinine, serum bilirubin and proteins were analyzed
with automatic analytical instrument (Hitachi, Japan) (Lam et. al., 2004; Oberdorster
and Oberdorster, 2005).

5.1.3.2.2. Bioavailability study
The plasma drug concentration-time profile of the developed nanoparticle
formulation in Wistar albino rats was constructed to calculate the bioavailability.
Adult albino rats of either sex weighing 150 to 180 gm were divided into two groups
of six animals each and fasted overnight before commencing the experiment with free
access to water. The felodipine suspension and prepared nanoparticle formulation
were administered in a dose of 20 mg/kg body weight orally with the help of cannula
after anaesthetizing for a very short period of time with diethyl ether. After
administration of dose 0.5 ml blood samples were collected from the retro-orbital
plexus into the heparinized tubes at preset time points of 0.5, 1, 2, 4, 8, 12, 24, 48, 72
and 96 h. The blood samples were centrifuged at 4000 rpm for 10 minutes and the
separated plasma samples were stored at – 20 oC until analysis.
Estimation of felodipine in plasma sample by RP-HPLC analysis: The
plasma sample of 0.3 ml and 50 L of chlorzoxazone (50 ng/ml) was added in a
centrifuge tube and volume made to 2 ml with acetonitrile to precipitate the protein.
Then the sample was centrifuged at 4000 rpm for 25 min and the supernatant was
collected. The supernatant was dried under nitrogen air. The residue was dissolved in
200 L of mobile phase and a volume of 20 L was injected into HPLC system. The
plasma samples were analyzed using Phenomenex C18 (150×4.6 mm, 5µ) analytical
column. The mobile phase used consisting of methanol and water (80:20 v/v) was
passed through 0.45 µm membrane filter and degassed by ultrasonication. The flow
rate was maintained at 1.0 ml/min and the measurements were made at 240 nm. The
amount of the felodipine in the sample was determined from the peak area ratio
correlated with the standard curve prepared under the same identical condition.
Pharmacokinetic analysis: The pharmacokinetic parameters were determined from
plasma concentration data by non-compartmental model. The parameters such as area
under the plasma concentration-time curve (AUC 0 - t), maximum plasma
concentration (Cmax) and the time taken to reach the maximum plasma concentration
(Tmax) were calculated directly from the plasma concentration time curve. The relative
bioavailability (Fr) of felodipine was calculated using the following equation:

5.1.3.2.3. Antihypertensive study
Blood pressure and heart rate measurement: Systolic blood pressure (SBP)
and heart rate (HR) were measured using tail cuff method (Oh et al., 2007). Rat tails
were occluded with size tubular tail cuff (7/16 inch, 12 mm) connected to the
photoplethysmograph (IITC Life Sci., CA, USA) and pulses were detected as the cuff
pressure become lowered. For measuring the SBP, rats were pre-warmed at 32 0C for
5-10 min in a restraining cage in a warming box. This procedure was followed at least
2 weeks before experiments to habituate the rats.
Measurement of blood pressure and heart rate in L-NAME induced
hypertensive rats: The SBP and HR were measured after oral administration of
nanoparticles in L-NAME (N-nitro-L-arginine methyl ester) induced hypertensive rats
using the tail cuff method. L-NAME (40 mg/kg) was dissolved in drinking water and
given orally to rats at an interval of 24 hrs for 4 weeks. The hypertensive rats with
SBP of more than 170 mmHg were used in this study. To evaluate the
antihypertensive effect of the nano formulation 24 healthy male rats (weighing 200-
250g) were divided into four groups (6 each group). First group was treated with
normal saline (normal control) and second group treated with L-NAME (disease
control). Third and fourth groups (pre-treated with L-NAME) received orally native
felodipine (20m/kg), and felodipine nanoparticles respectively, in a dose equivalent to
20 mg of felodipine. All the measurements were performed three times.
Statistical analysis
For statistical analysis the experimental data was tested by one-way analysis of
variance (ANOVA) and Student’s t-test. Data represented as mean values ± SD
(standard deviation). The values of p < 0.05 (*) were indicative of significant
difference, very significant difference if p < 0.01 (**) and highly significant difference
if p < 0.001 (***).
5.1.4. Results and discussion
Preparation of nanoparticles
The felodipine nanoparticles were prepared by solvent evaporation technique using
different ratios of drug and polymer, various agitation speed and different organic

phase and aqueous phase ratios (Tab. 5.1.1). This method is comparatively easy to
prepare the nanoparticles than the other technique due to high drug entrapment
efficiency for poorly water soluble drug, narrow particle size distribution and high
batch to batch reproducibility. The solution of polymer and drug in methanol-acetone
mixture forms the organic phase. This organic phase was poured into an aqueous
phase containing stabilizer (poloxamer 188). The organic solvent rapidly partitioned
into the external aqueous phase and the polymer precipitated around the drug particles.
The evaporation of entrapped solvents led to the formation of polymeric nanoparticles.
The various optimized parameters were studied in the formation of desired
nanoparticle formulation and characterized.
Particle size and Zeta potential measurement
The particle size is an important parameter as it has direct effect on the stability,
cellular uptake, drug release and biodistribution. The mean particle sizes of the
prepared nanoparticles as measured by the Photon Correlation Spectroscopy (PCS)
were in size range of 492 to 738 nm and the size distributions were monodispersed
(0.214 to 0.517) in all the formulations (Tab. 5.1.2). There were no noticeable
differences between the sizes of nanoparticles obtained with different ratio of drug and
polymer. The results were consistent with the previous report described for the
nanoparticles of anti-inflammatory drugs with Eudragit®
RS100 (Pignatello et al.,
2002). In the present study, the decrease in size of the particles has been reported.
Table 5.1.2. Particle size, Zeta potential, polydispersity index, entrapment
efficiency and drug loading of felodipine loaded Eudragit® RS100 nanoparticles
Formulation
Particle
size
(nm)*
Zeta
potential
(mV)*
Polydispersity
index*
Entrapment
efficiency
(%w/w)*
Drug
loading
(%w/w)*
FEN1 492 ± 3.12 +14.1 ± 0.47 0.483 ± 0.053 57.78 ± 0.480 16.35 ± 0.19
FEN2 517 ± 6.36 +17.6 ± 0.56 0.356 ± 0.078 69.89 ± 0.861 14.26 ± 0.23
FEN3 526 ± 3.47 +19.8 ± 0.81 0.214 ± 0.007 75.87 ± 0.242 11.54 ± 0.61
FEN4 738 ± 3.91 +21.5 ± 1.04 0.352 ± 0.068 74.65 ± 0.621 11.09 ± 0.27
FEN5 597 ± 5.23 +18.7 ± 0.91 0.517 ± 0.029 54.39 ± 0.457 16.73 ± 0.96
FEN6 583 ± 4.26 +19.1 ± 0.58 0.319 ± 0.012 69.25 ± 0.293 13.59 ± 0.04
FEN7 607 ± 4.18 +20.3 ± 1.16 0.243 ± 0.006 64.47 ± 0.531 13.23 ± 0.12
* The values are expressed as mean ± SD for n=3

The Zeta potential is one of the important characteristics of the nanoparticles, as it
determines the physical stability and in vivo distribution of nanoparticles. The Zeta
potential values were measured in water and exhibited positive values of 14.1 to 21.5
mV (Tab. 5.1.2). This positive charge can facilitate for the effective adhesion of the
nanoparticles with the negatively charged mucus of the gastro-intestinal tract,
prolonging the effective residence time of the formulations.
Drug entrapment efficiency and drug loading
The entrapment efficiency and drug loading has direct impact on the drug release
profile from the formulations. Both EE and DL depend on the characteristics of
polymer, drug, surfactant and process variables. The high entrapment efficiency
results from the high affinity of both drug and polymer to the same solvent. In present
study the EE and DL were affected by the drug and polymer ratio in the formulation.
There were no noticeable changes found in the entrapment efficiency and drug loading
with the increase of agitation speed from 5000 rpm to 17,000 rpm (Tab. 5.1.1)
keeping drug-polymer ratio constant. But keeping the agitation speed constant, the
improved entrapment efficiency was observed with the increasing proportion of
polymer in the formulation from FEN1 to FEN4. The results were consistent with the
previous findings of Dongming et al and Adibkia et al (Dongming et al., 2007;
Adibkia et al., 2011). The greater proportion of polymer with respect to the amount of
drug improved entrapment efficiency. Since the drug is hydrophobic in nature, there
was no chance of diffusion of drug away from the polymer. The percentage of
felodipine entrapment in the formulation was found to be good. The increased drug
loading enhances the drug leakage in the organic phase lead to drug loss due to the
formation of channels in the polymer structure through which drug can easily escape
to the outer phase.
The formulation FEN1 showed high drug content and small particle size than other
formulations. But this formulation was not selected for further studies for its low drug
entrapment (57.78%). The nanoparticle formulation (FEN3) with drug-polymer ratio
of 1:4 with the agitation speed of 15,000 rpm shows the good entrapment efficiency
(75.87%), smaller particle size of 526 nm and Zeta potential value of +19.8 (Tab.
5.1.2, Fig. 5.1.1 & 5.1.2). Based on the particle size and entrapment efficiency the
formulation FEN3 was selected and validated for the further studies.

Figure 5.1.1. Particle size distribution of felodipine loaded nanoparticle
formulation (FEN3) prepared with drug-polymer ratio (1:4).
Figure 5.1.2. Zeta potential of felodipine loaded nanoparticle formulation (FEN3)
prepared with drug-polymer ratio (1:4).
Validation of nanoparticle formulation FEN3
Three batches of FEN3 prepared using the drug to polymer ratio (1:4),
agitation speed (15,000 rpm), organic phase to aqueous phase ratio (1:2) and stabilizer
concentration (1% w/v) confirmed the reproducibility of the formulations. The particle
size, polydispersity index and entrapment efficiency (Tab. 5.1.3) of three batches of
formulations show no noticeable differences among the batches.

Table 5.1.3. Particle size, polydispersity index and drug entrapment efficiency of
reproducible batches of FEN3
Note: The values are expressed as mean ± SD for n=3
Surface morphological properties of felodipine nanoparticles (FEN3)
The surface morphology of felodipine loaded nanoparticles was measured using
scanning electron microscopy. The SEM image of nanoparticles showed the spherical
shape with smooth surface (Fig. 5.1.3).
The AFM investigations revealed the disc like shape of the particles surrounded by
soft layer (Fig. 5.1.4). The particle sizes obtained by SEM were relatively smaller
compared with the particle sizes obtained by Zetasizer. The Zetasizer measures the
particles surrounded by hydrodynamic layer whereas the scanning electron
microscope measures only size of the particle.
Figure 5.1.3. SEM image of the felodipine nanoparticle formulation (FEN3)
Formulation Particle size
(nm)
Polydispersity
index
Entrapment
efficiency (%w/w)
FEN3a 531 ± 2.09 0.230 ± 0.048 76.81 ± 0.480
FEN3b 529 ± 2.16 0.216 ± 0.082 75.69 ± 0.752
FEN3c 532 ± 3.11 0.272 ± 0.091 76.15 ± 0.541

Fi
sm
Ze
po
Figure 5.1
igure 5.1.5.
The T
mooth surfac
etasizer. M
olymer (Fig.
1.4. AFM im
TEM imag
Transmission
ce. The resu
Magnification
. 5.1.5).
mage of the f
e of the felo
n electron m
ult was in co
n of single p
felodipine n
odipine nano
microscope r
onformity w
particle show
nanoparticle
oparticle fo
revealed the
with the data
wed the inte
e formulatio
rmulation (
e spherical p
obtained fr
ernal core dr
on (FEN3)
(FEN3)
particles wit
rom SEM an
rug inside th
th
nd
he
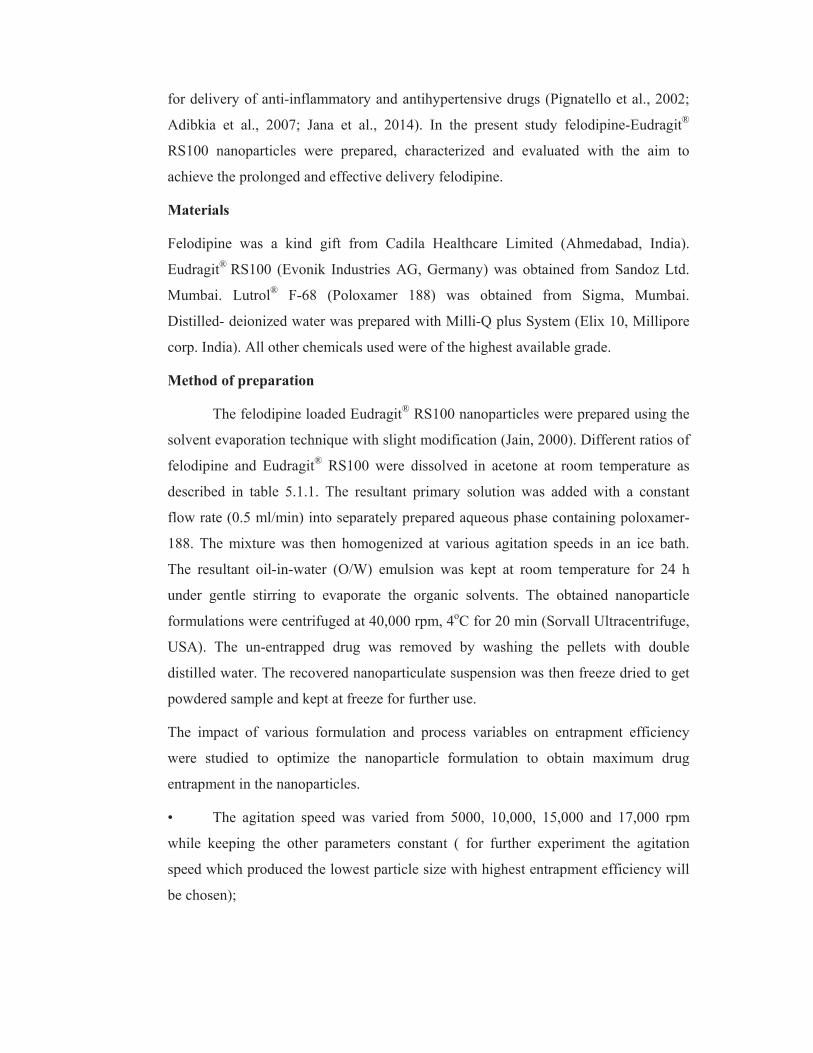
Fourier transform infrared spectroscopy (FTIR)
The FTIR spectral analysis is useful in determining the compatibility of drug
and excipients. The preformulation study sometimes showed no interaction among the
drug and polymer. But there may be possibility of changes in drug even after
manufacturing process. Hence, to confirm further, whether there is any change in the
drug molecule in the nanoparticle, FTIR spectroscopy done. FTIR study of pure
felodipine, polymer and felodipine loaded Eudragit®
RS100 nanoparticles was carried
out for the interaction study between the drug and polymer (Fig. 5.1.6).
Figure 5.1.6. FTIR spectra of (a) native felodipine, (b) Eudragit® RS100 and (c)
felodipine - Eudragit® RS100 nanoparticles (FEN3)
The spectroscopy showed no distinctive changes in the peak confirming no
interaction among the components. This is in consistent with the compatibility results
showed in chapter 3. Thus FTIR spectroscopy further validated the compatibility
between felodipine and Eudragit® RS100 in nanoparticles.

Differential scanning calorimetry (DSC)
Differential scanning calorimetry was used to analyze the physiochemical
interaction of the drug encapsulated and the polymer. The analysis was performed for
the pure felodipine, polymer and felodipine-Eudragit®
RS100 nanoparticles (Fig.
5.1.7). The prominent and sharp endothermic peak at 147 ºC in the thermogram of
native felodipine represents its melting point. This sharp endothermic peak indicated
that the pure felodipine was in crystalline anhydrous state (Mura et al., 2001). No
distinctive peak was observed in the DSC profile of the felodipine loaded nanoparticle
confirming the decreased crystallinity of felodipine.
Figure 5.1.7. DSC thermogram of (a) Eudragit® RS100, (b) native felodipine and
(c) felodipine - Eudragit® RS100 nanoparticles (FEN3)
In vitro drug release study
The goal of in vitro drug release study (dissolution testing) is to provide a
possible prediction of or correlation with the product’s in vivo bioavailability. The in
vitro drug release rate was influenced by the drug-polymer composition. However, a
complex phenomenon may occur between the drug and polymer, including entrapment
of the drug in the polymer and the adsorption of drug on the surface of the polymer
matrix as a result of electrostatic adhesion (Douglas et al., 1987).

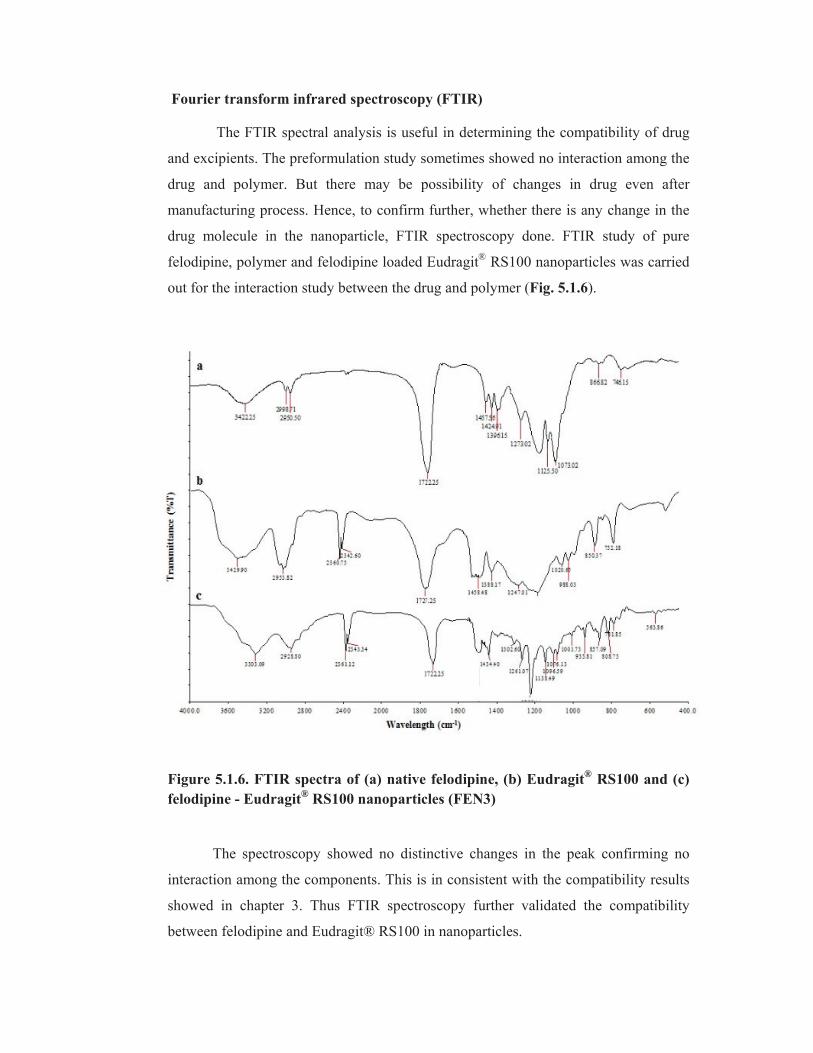
Drug release profile from drug powder, prepared nanoparticles and marketed
formulation are shown in (Tab. 5.1.4 & Fig. 5.1.8). The felodipine loaded Eudragit®
RS100 nanoparticles show slower drug release in comparison with drug powder and
marketed formulation. The drug release from the marketed formulation was observed
~91 % within 10 h. Within the first hour a release of about 41 % was observed for
felodipine powder. The initial burst release was reduced to 18 % and a slow release
was observed for felodipine loaded Eudragit®
RS100 nanoparticles at least 96 h due to
the formation of wall around the drug by the polymer. It signifies that they possess
sustained release properties. The initial burst release from the nanoparticles is
expected as a result of surface adsorbed drug (Kim and Martin, 2006).
Table 5.1.4. In vitro drug release profile of native felodipine, felodipine loaded
Eudragit® RS100 nanoparticles (FEN3) and marketed formulation in phosphate
buffer pH 6.8
Time
(h)
Native
felodipine FEN3
Marketed
formulation
0 0 0 0
1 39.73 ± 0.69 17.8 ± 0.56 45.97 ± 0.83
2 48.58 ± 0.97 20.3 ± 0.93 59.49 ± 0.63
4 56.75 ± 0.63 24.8 ± 0.49 73.91 ± 0.82
6 63.24 ± 0.48 27.1 ± 1.02 87.14 ± 1.26
8 66.17 ± 1.02 42.4 ± 0.68 89.54 ± 0.98
10 69.97 ± 0.92 47.6 ± 1.13 90.72 ± 0.84
12 74.06 ± 1.28 54.6 ± 1.17 -
18 79.54 ± 0.81 58.3 ± 0.93 -
24 86.84 ± 0.73 64.6 ± 2.31 -
48 87.54 ± 1.05 68.1 ± 1.07 -
72 87.98 ± 0.82 71.4 ± 2.05 -
96 89.61 ± 0.65 74.6 ± 0.73 -
T50 3.0 ± 0.49 11.4 ± 0.49 1.5 ± 0.71
The values are represented as Mean ± SD; n=3
After 6 h the rapid drug release was identified and this could be as a result of
polymer erosion in the surface of nanoparticles and consequent release of drug which
has been loaded near the surface of nanoparticles (Adibkia et al., 2011). It suggests
that the combination of dissolution, diffusion and erosion are the possible mechanism
for drug release from the nanoparticles.
Figure 5.1.8. In vitro drug release profile of marketed formulation, native
felodipine and felodipine loaded Eudragit® RS100 nanoparticles (FEN3) in
phosphate buffer pH 6.8
Drug release kinetics: The drug release data are plotted in various kinetic models, viz.
zero order, first order, Higuchi and Korsmeyer-Peppas. Derived data and
corresponding plots with respect to various models are furnished in tables and figures
as follows:
Zero order : Tab. 5.1.5 and Fig. 5.1.9.
First order : Tab. 5.1.6 and Fig. 5.1.10.
Higuchi : Tab. 5.1.5 and Fig. 5.1.11.
Korsmeyer-Peppas : Tab. 5.1.7 and Fig. 5.1.12.

Table 5.1.5. Data for Zero order plot (Cumulative % drug release vs. Time) and
Higuchi plot (Cumulative % drug release vs. Sq. root of time) obtained from in
vitro drug release profile of felodipine nanoparticles (FEN3)
Table 5.1.6. Data for first order plot (Log cumulative % drug remaining vs.
Time) obtained from in vitro drug release profile of felodipine loaded Eudragit®
RS100 nanoparticles (FEN3)
Time (h) Sq. root of time (h) Cumulative % drug release
0 0.000 0
1 1.000 17.8
2 1.414 20.3
4 2.000 24.8
6 2.449 27.1
8 2.828 42.4
10 3.162 47.6
12 3.464 54.6
18 4.243 58.3
24 4.899 64.6
48 6.928 68.1
72 8.485 71.4
96 9.798 74.6
Time (h)
Log (% drug remaining)
0 -
1 1.9191
2 1.9031
4 1.8808
6 1.8633
8 1.7634
10 1.7243
12 1.6628
18 1.6232
24 1.5563
48 1.5051
72 1.4624
96 1.4150
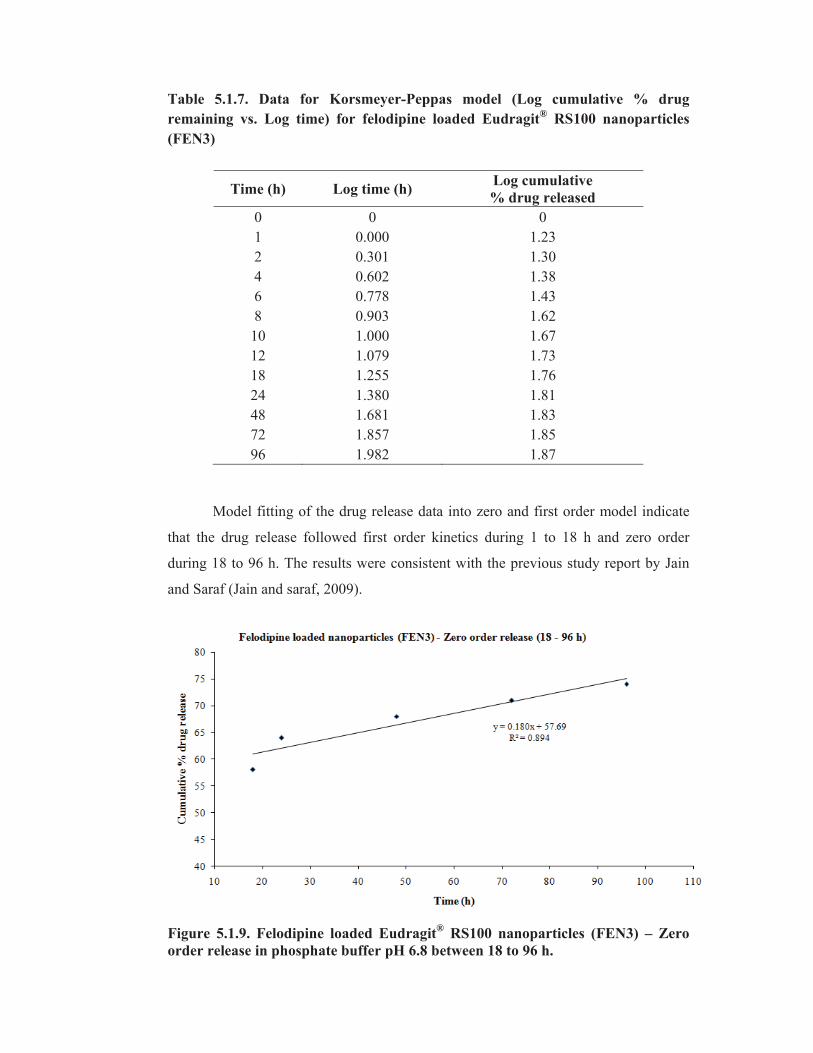
Table 5.1.7. Data for Korsmeyer-Peppas model (Log cumulative % drug
remaining vs. Log time) for felodipine loaded Eudragit® RS100 nanoparticles
(FEN3)
Model fitting of the drug release data into zero and first order model indicate
that the drug release followed first order kinetics during 1 to 18 h and zero order
during 18 to 96 h. The results were consistent with the previous study report by Jain
and Saraf (Jain and saraf, 2009).
Figure 5.1.9. Felodipine loaded Eudragit® RS100 nanoparticles (FEN3) – Zero
order release in phosphate buffer pH 6.8 between 18 to 96 h.
Time (h) Log time (h) Log cumulative
% drug released
0 0 0
1 0.000 1.23
2 0.301 1.30
4 0.602 1.38
6 0.778 1.43
8 0.903 1.62
10 1.000 1.67
12 1.079 1.73
18 1.255 1.76
24 1.380 1.81
48 1.681 1.83
72 1.857 1.85
96 1.982 1.87

Figure 5.1.10. Felodipine loaded Eudragit® RS100 nanoparticles (FEN3) - First
order release in phosphate buffer pH 6.8between 1 to 18 h.
Figure 5.1.11. Drug release from felodipine loaded Eudragit® RS100
nanoparticles (FEN3) in phosphate buffer pH 6.8 – Higuchi kinetic.

Figure 5.1.12. Drug release from felodipine loaded Eudragit® RS100
nanoparticles (FEN3) in phosphate buffer pH 6.8 – Peppas model.
Drug release from the nanoparticles also obeyed Higuchi as well as Peppas
models, indicating that the drug release was by diffusion mechanism. The release
exponent ‘n’ value (0.359 ) was calculated from the slope of the Peppas model and is
less than 0.5, indicating the release mechanism from the nanoparticles was diffusion
controlled (Tab. 5.1.8). As the r2 values are closed it is difficult to find the suitable
release mechanism of the felodipine from the nanoparticles. Although the values are
close proximity the possible drug release from the nanoparticles well suited with
Higuchi kinetic followed by diffusion and erosion mechanism.
Table 5.1.8. Régression coefficient (r2) values plots of drug release data obtained
from the felodipine Eudragit® RS100 nanoparticles (FEN3)
Formulation Zero order 1st order Higuchi
Korsmeyer-
Peppas Peppas ‘n’
Period (18- 96h) (1-18h) (1-96h) (1-96h) -
FEN3 0.894 0.936 0.956 0.903 0.359
In vitro permeation across the intestine
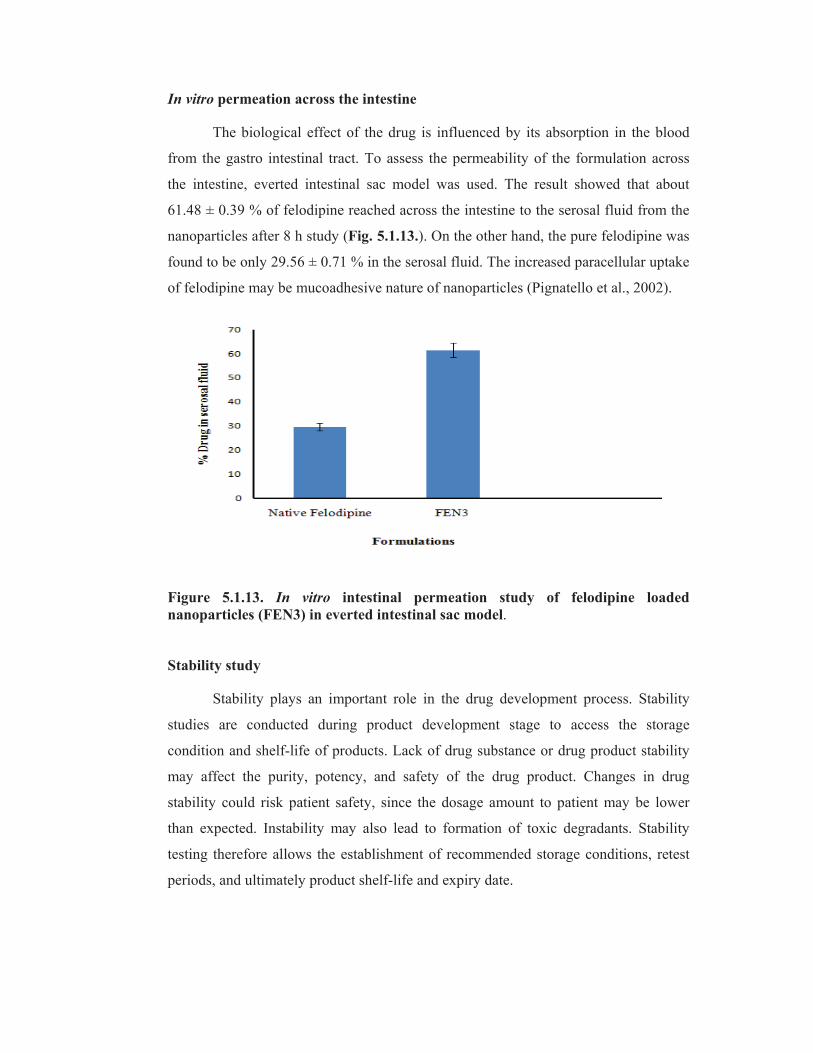
The biological effect of the drug is influenced by its absorption in the blood
from the gastro intestinal tract. To assess the permeability of the formulation across
the intestine, everted intestinal sac model was used. The result showed that about
61.48 ± 0.39 % of felodipine reached across the intestine to the serosal fluid from the
nanoparticles after 8 h study (Fig. 5.1.13.). On the other hand, the pure felodipine was
found to be only 29.56 ± 0.71 % in the serosal fluid. The increased paracellular uptake
of felodipine may be mucoadhesive nature of nanoparticles (Pignatello et al., 2002).
Figure 5.1.13. In vitro intestinal permeation study of felodipine loaded
nanoparticles (FEN3) in everted intestinal sac model.
Stability study
Stability plays an important role in the drug development process. Stability
studies are conducted during product development stage to access the storage
condition and shelf-life of products. Lack of drug substance or drug product stability
may affect the purity, potency, and safety of the drug product. Changes in drug
stability could risk patient safety, since the dosage amount to patient may be lower
than expected. Instability may also lead to formation of toxic degradants. Stability
testing therefore allows the establishment of recommended storage conditions, retest
periods, and ultimately product shelf-life and expiry date.
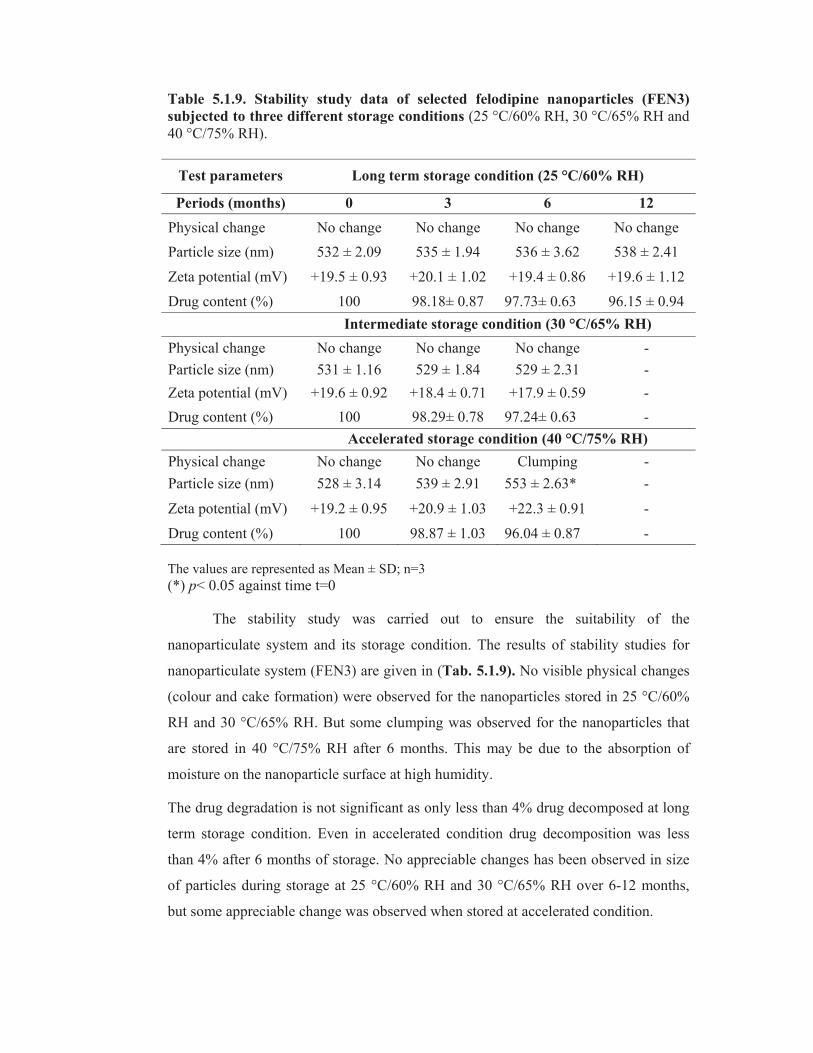
Table 5.1.9. Stability study data of selected felodipine nanoparticles (FEN3)
subjected to three different storage conditions (25 °C/60% RH, 30 °C/65% RH and
40 °C/75% RH).
Test parameters Long term storage condition (25 °C/60% RH)
Periods (months) 0 3 6 12
Physical change No change No change No change No change
Particle size (nm) 532 ± 2.09 535 ± 1.94 536 ± 3.62 538 ± 2.41
Zeta potential (mV) +19.5 ± 0.93 +20.1 ± 1.02 +19.4 ± 0.86 +19.6 ± 1.12
Drug content (%) 100 98.18± 0.87 97.73± 0.63 96.15 ± 0.94
Intermediate storage condition (30 °C/65% RH)
Physical change No change No change No change -
Particle size (nm) 531 ± 1.16 529 ± 1.84 529 ± 2.31 -
Zeta potential (mV) +19.6 ± 0.92 +18.4 ± 0.71 +17.9 ± 0.59 -
Drug content (%) 100 98.29± 0.78 97.24± 0.63 -
Accelerated storage condition (40 °C/75% RH)
Physical change No change No change Clumping -
Particle size (nm) 528 ± 3.14 539 ± 2.91 553 ± 2.63* -
Zeta potential (mV) +19.2 ± 0.95 +20.9 ± 1.03 +22.3 ± 0.91 -
Drug content (%) 100 98.87 ± 1.03 96.04 ± 0.87 -
The values are represented as Mean ± SD; n=3
(*) p< 0.05 against time t=0
The stability study was carried out to ensure the suitability of the
nanoparticulate system and its storage condition. The results of stability studies for
nanoparticulate system (FEN3) are given in (Tab. 5.1.9). No visible physical changes
(colour and cake formation) were observed for the nanoparticles stored in 25 °C/60%
RH and 30 °C/65% RH. But some clumping was observed for the nanoparticles that
are stored in 40 °C/75% RH after 6 months. This may be due to the absorption of
moisture on the nanoparticle surface at high humidity.
The drug degradation is not significant as only less than 4% drug decomposed at long
term storage condition. Even in accelerated condition drug decomposition was less
than 4% after 6 months of storage. No appreciable changes has been observed in size
of particles during storage at 25 °C/60% RH and 30 °C/65% RH over 6-12 months,
but some appreciable change was observed when stored at accelerated condition.

Toxicity evaluation
Preliminary toxicity (safety) evaluation of drug/drug products are essential before
proceeding further in developmental process. The in vivo acute toxicity study of the
felodipine nanoparticle formulation (FEN3) was performed using female albino mice.
The smaller particles exhibit interaction with local tissues and provoke the dysfunction
of the organs. Hence, the toxicity study was carried to observe the dysfunction of the
organs.
The acute toxicity studies performed in female albino mice showed no mortality or
behavioral changes up to dose level of 240 mg/kg body weight. However, complete
mortality was observed at dose level of 480 mg/kg body weight. Serum biochemical
parameters (Tab. 5.1.10 and Fig.5.1.14) also showed no noticeable changes between
the test group (60, 120 and 240 mg/kg body weight) and the control group. It confirms
that the product has no influence on liver function parameters. The study also
confirms that the nanoparticle formulation does not influence the serum sodium,
chloride and potassium.
Table 5.1.10. Serum biochemical reports of control and treated mice.
Parameter
Referenc
e
value
Control
(Normal
saline)
60mg/kg 120mg/kg 240mg/kg
Serum creatinine
(mg/dL) 0.2 - 0.9 0.2 ± 0.08 0.17±0.07 0.22±0.01 0.26±0.02
Total bilirubin
(mg/dL) 0 - 0.9 0.6 ± 0.02 0.79±0.04 0.69±0.08 0.64±0.04
Total proteins
(g/dL) 3.5 - 7.2 4.8 ± 1.2 5.5±1.4 5.1±1.2 4.9±1.0
ALT (SGPT) U/L 17 - 77 24.1 ± 2.4 24.6±2.6 24.8±2.6 24.1±3.0
AST (SGOT)
U/L 54 - 298 61.2 ± 2.8 61.1±3.2 61.7±2.6 62.2±2.2
Sodium (mEq/L) 140 - 160 148.2 ± 4.8 147.3±5.2 146.1±4.6 144.2±3.2
Chloride (mEq/L) 88 - 110 102.4 ± 2.8 102.2±3.4 102.1±3.8 102.6±2.2
Potassium
(mEq/L) 5 - 7.5 4.81 ± 1.2 4.89±1.4 4.78±1.6 4.82±1.8
The values are represented as Mean ± SD; n=3

Ser
um cre
atinine
Total b
iliru
bin
Total p
roteins
ALT (SGPT)
AST (SGOT)
Sodium
Chloride
Potass
ium
0
50
100
150
200Control
60mg/kg
120mg/kg
240mg/kg
Biochemical parameters
Figure 5.1.14. Effect of felodipine-Eudragit® RS100 nanoparticles (FEN3) on
serum biochemical parameters in control and treated mice of acute toxicity
studies.
Bioavailability study
The availability of the drug to the biologic system is integral to the goals of dosage
form design and paramount to the effectiveness of the medication. To achieve the
antihypertensive effect it is necessary to reach the drug in the blood from the dosage
form.
Figure 5.1.15. Plasma concentration-time profiles of felodipine in rats after oral
administration of free felodipine suspension and felodipine loaded Eudragit®
RS100 nanoparticles (20 mg/kg). Each data was given as mean ± S.D. (n=4).

The plasma drug concentration- time profile of rat after single dose (20 mg/kg) oral
administration of pure felodipine suspension and felodipine loaded nanoparticles is
illustrated in (Fig. 5.1.15) and the pharmacokinetic parameters are summarized in
(Tab. 5.1.11). The experimental results showed a significant difference between the
pharmacokinetic profiles of felodipine loaded nanoparticles and free felodipine
suspension (Fig. 5.1.15). At each time points, the plasma concentration of felodipine
from the nanoparticles was higher than that of free felodipine suspension.
The peak concentration (Cmax) of felodipine in rats treated with nanoparticles was
1098 ± 41 ng/ml, which was significantly improved (*p< 0.05) compared with that of
free felodipine suspension (821 ± 28 ng/ml). It was also observed that AUC0-72 value
of felodipine in rats treated with FEN3 was enhanced than that of pure drug
suspension. This enhanced AUC of felodipine nanoparticles may be due to the uptake
of FEN3 in the intestine and the sustained release of the felodipine from the
nanoparticle formulation. The improved permeability of the FEN3 may also be the
reason for improved AUC.
Table 5.1.11. Pharmacokinetic parameters of felodipine after oral administration
of free drug and nanoparticle formulation (FEN3) (20 mg/kg) in rats ( n=4).
The values are represented as Mean ± SD (n = 4). *p< 0.05
The Tmax value was observed 2 h to achieve the Cmax after oral administration of
felodipine suspension, but shortened to 1.5 h after administration of nanoparticle
formulation (FEN3). The rapid absorption could attribute to the nanometric size of the
felodipine nanoparticles.
Antihypertensive activity study
The spontaneous or experimentally induced hypertensive rats are widely used for
screenings of antihypertensive compounds. The indirect tail cuff method is used to
determine the systolic blood pressure which is analogous to sphygmomanometry in
human and can also be applied in dogs and small primates.
Parameters Pure drug
suspension
Nanoparticles
(FEN3)
Tmax(h) 2 ± 0.12 1.5 ± 0.18
Cmax(ng/ml) 821 ± 28 1098 ± 41*
AUC 0-72(ng.h/ml) 16,033 ± 189 19,493± 240*
Relative bioavailability (%) - 121.58

Tab
le 5
.1.1
2. E
ffec
t of
felo
dip
ine
nan
op
art
icle
s (F
EN
3)
on
SB
P, D
BP
an
d H
R i
n L
-NA
ME
in
du
ced
hyp
erte
nsi
ve
rats
.
Para
met
ers
Gro
up
s P
re-t
reatm
ent
Po
st-a
dm
inis
tra
tio
n (
ho
urs
)
6
24
48
72
SB
P
(mm
/Hg
)
Neg
ativ
e co
ntr
ol
(No
rmal
sal
ine)
1
25 ±
5.2
1
24 ±
4.3
12
5 ±
6.1
1
26 ±
4.5
1
23
± 7
.1
Po
siti
ve
con
tro
l (
L-N
AM
E 4
0 m
g/k
g /
day
) 1
85 ±
4.3
18
8 ±
5.1
a**
*
19
2 ±
3.4
a**
*
19
4 ±
4.2
a**
*
193 ±
4.5
a**
*
L-N
AM
E 4
0 m
g/k
g /
day
&
FE
N3 (
20 m
g/k
g)
18
3 ±
2.5
15
1 ±
4.6
b**
*
15
4 ±
2.3
b**
*
161 ±
3.1
b*
**
165 ±
2.9
b**
*
L-N
AM
E 4
0 m
g/k
g /
day
& P
ure
Dru
g (
20 m
g/k
g)
18
6 ±
2.7
160 ±
4.3
c***
17
1 ±
3.6
c**
17
8 ±
2.9
182 ±
3.3
DB
P
(mm
/Hg
)
Neg
ativ
e co
ntr
ol
(No
rmal
sal
ine)
84 ±
4.4
86 ±
2.1
84 ±
2.5
83 ±
2.4
85 ±
3.1
Po
siti
ve
con
tro
l (L
-NA
ME
40
mg/k
g /
day
) 1
10 ±
2.3
10
6 ±
3.4
a**
*
11
1 ±
2.2
a**
*
11
5 ±
3.5
a**
*
113 ±
2.3
a**
*
L-N
AM
E 4
0 m
g/k
g /
day
&
FE
N3 (
20 m
g/k
g)
11
6 ±
2.1
86 ±
3.5
b*
**
87 ±
2.1
b***
89 ±
2.7
b***d
***
93 ±
3.4
b***d
***
L-N
AM
E 4
0 m
g/k
g /
day
& P
ure
Dru
g (
20 m
g/k
g)
11
0 ±
2.8
81 ±
1.6
c**
*
93 ±
2.4
c**
*
10
4 ±
3.3
c**
108 ±
1.9
HR
(Bea
ts/m
in)
Neg
ativ
e co
ntr
ol
(No
rmal
sal
ine)
3
56
± 1
0.4
3
54 ±
8.1
35
2 ±
8.3
3
58 ±
6.2
3
56
± 7
.1
Po
siti
ve
con
tro
l (
L-N
AM
E 4
0 m
g/k
g /
day
) 3
65 ±
5.3
3
67 ±
3.1
36
9 ±
4.5
3
70 ±
5.3
3
68
± 4
.4
L-N
AM
E 4
0 m
g/k
g /
day
&
FE
N3 (
20 m
g/k
g)
35
1 ±
3.8
32
2 ±
3.1
b**
*
32
4 ±
2.9
b**
*
33
3 ±
3.6
b**
*d
**
337 ±
2.8
b**
*d
**
L-N
AM
E 4
0 m
g/k
g /
day
& P
ure
Dru
g (
20 m
g/k
g)
36
8 ±
3.7
317 ±
2.4
c***
339 ±
3.2
c***
35
5 ±
4.1
361 ±
3.1
Val
ues
rep
rese
nte
d a
s m
ean ±
S.E
.M (
n=
6)
On
e w
ay A
NO
VA
bet
wee
n n
egat
ive
and
posi
tiv
e co
ntr
ol
gro
up a
nd
the
trea
ted
gro
ups
foll
ow
ed b
y D
un
net
t’s
test
.
a P
osi
tiv
e co
ntr
ol
gro
up v
s. N
egat
ive
con
tro
l g
rou
p,
b F
orm
ula
tio
n t
reat
ed g
rou
p v
s. P
osi
tive
contr
ol
gro
up,
c P
ure
dru
g t
reat
ed g
rou
p v
s. P
osi
tive
con
tro
l g
rou
p,
d P
ure
dru
g t
reat
ed g
rou
p v
s. F
orm
ula
tio
n t
reat
ed g
rou
p.
p v
alu
es *
*<
0.0
1,
**
*<
0.0
01

The indirect tail cuff method is used to evaluate the influence of antihypertensive
drugs in experimentally induced hypertensive rats. The antihypertensive activity of
felodipine loaded Eudragit®
RS100 nanoparticles was evaluated by measuring SBP,
DBP and HR in L-NAME induced hypertensive rats. The results are tabulated in
(Tab. 5.1.12). The antihypertensive effect of FEN3 and pure drug with positive
control rats are depicted in Fig. 5.1.16, Fig. 5.1.17 and Fig. 5.1.18.
hth
6hth
24 hth
48 hnd
72
0
50
100
150
200
250Negative control
Positive control
Formulation treated
Pure drug treated
Time (h)
SB
P (
mm
Hg)
Figure 5.1.16. Effect of felodipine loaded nanoparticles (FEN3) and native drug
suspension on SBP in hypertensive rats.
hth
6hth
24 hth
48 hnd
72
0
50
100
150Negative control
Positive control
Formulation treated
Pure drug treated
Time (h)
DB
P (
mm
Hg)
Figure 5.1.17. Effect of felodipine loaded nanoparticles (FEN3) and native drug
suspension on DBP in hypertensive rats.

hth
6 hth
24 hth
48h
nd
72
0
100
200
300
400Negative control
Positive control
Formulation treated
Pure drug treated
Time (h)
Heart
rate
(b
eats
/min
)
Figure 5.1.18. Effect of felodipine loaded nanoparticles (FEN3) and native drug
suspension on HR in hypertensive rats.
The SBP was notably reduced after oral administration of FEN3 (20 mg/kg) as
compared with positive control group. While treating with pure felodipine suspension,
the SBP, DBP and HR were significantly reduced (**p< 0.01) within 6h as compared
with positive control group and again increased within 24h, but after treating with
felodipine nanoparticle formulation (FEN3) the SBP, DBP and HR were significantly
decreased (***p< 0.001) as compared with pure felodipine treated group and the
activity remained up to 48h. The DBP at 48h and 72h of the felodipine nanoparticles
formulation (FEN3) treated group was significantly decreased (***p< 0.001) as
compared to the pure felodipine suspension treated groups. Similarly, the heart rate of
the felodipine nanoparticle formulation (FEN3) treated group was decreased (***p<
0.001) as compared to the pure felodipine suspension treated groups. Hence, the
prepared nanoparticle formulation showed improved antihypertensive activity as
compared with pure felodipine.
5.2. PREPARATION, CHARACTERIZATION AND IN VITRO EVALUATION
OF FELODIPINE LOADED POLY (D, L-LACTIC-CO-GLYCOLIC ACID) OR
(PLGA) NANOPARTICLES
5.2.1. Preparation of felodipine nanoparticle
Introduction
Felodipine, a calcium channel blocker is widely used for the treatment of high blood
pressure and other cardiovascular complications. Being poor soluble in nature the oral
administration of felodipine exhibits irregular absorption in the gastrointestinal tract
and poor bioavailability. The desired bioavailability and constant plasma drug
concentration can be achieved by multiple daily dosing, which leads to poor patient
compliance.
Out of many ways to increase the oral bioavailability, the decrease in the particle size
of the native drug has received much interest. An effective way to address the issues
of the drug is by making the polymeric nanoparticles. By encapsulating the native
drug in the polymeric material the crystallinity can be prevented. This polymeric
nanoparticulate system have been considered as promising carriers (Vauthier et al.,
2003; Amaral et al., 2007) for oral sustained drug delivery, which will be beneficial to
the patients for the long term treatment. The intracellular uptake of drug and stability
can be improved by nanoparticulate formulation (Ourique et al., 2008).
Poly (D, L-lactic-co-glycolic acid) or PLGA is one of the most popular biodegradable
and non toxic polymers used for preparing microparticles and nanoparticles (Zimmer
and Kreuter, 1995; Bala et al., 2004). PLGA is randomly hydrolyzed into their
biocompatible metabolite, lactic acid and glycolic acid and eliminated from the body
as carbon dioxide and water (Crotts and Park, 1998; Fulzelv, 2003). PLGA is widely
used for the manufacture of implants, internal sutures and also used for controlled and
targeted drug delivery systems (Uhrich et al., 1999; Cheng et al., 2007). The changes
in tissue distribution and pharmacokinetic profile were observed, when the drug was
incorporated into PLGA nanoparticulate system (Mainardes and Evangelista, 2005;
Dillen et al., 2006). As the particle sizes of the nanoparticles are small enough they are
expected to reach angiogenetic area and circulate through the capillaries (Jin et al.,
2008). These may lead to improve therapeutic efficacy and patient compliance.

In the present study felodipine nanoparticles were developed using biodegradable
carrier PLGA with the aim to get more prolonged and effective delivery of felodipine.
So, felodipine loaded nanoparticles were prepared, characterized and evaluated for in
vitro drug release study.
Materials
Felodipine was a kind gift from Cadila Healthcare Limited (Ahmedabad, India). Poly
(D, L-lactic-co-glycolic acid) or (PLGA 50:50) (Mw = 18,000) and Lutrol®
F-68
(Poloxamer 188) was obtained from Sigma, Mumbai. Distilled- deionized water was
prepared with Milli-Q plus System (Elix 10, Millipore corp. India). All other
chemicals used were of the highest available grade.
Method of preparation
The felodipine loaded nanoparticles were prepared with the different ratios of
drug and PLGA polymer using solvent evaporation technique (Jain, 2000) as
described in table 5.2.1. The polymeric solution of PLGA 50:50 was prepared in
acetone at room temperature and felodipine was dissolved in it. The resultant solution
was then added into water containing poloxamer-188 (aqueous phase) with a constant
rate (0.5 ml/min). The mixture was then homogenized using a probe homogenizer
(VIRTIS, Cyclone IQ, USA), at various agitation speeds in an ice bath. The formed
oil-in-water (O/W) emulsion was kept at room temperature for 24 h under gentle
stirring to evaporate the organic solvent.
The prepared nanosuspensions were centrifuged at 40,000 rpm at 4oC for 20
min (Sorvall Ultracentrifuge, USA). The pellets were collected and washed with
double distilled water to remove un-entrapped drugs. The recovered nanosuspension
was freeze dried kept at freeze for further use. The impact of formulation and process
variables on particle sizes and entrapment efficiency was studied in an attempt to
optimize formulation with less particle size and maximum entrapment of the drug in
the nanoparticles as described in section 5.1.1, Chapter 5.

Table 5.2.1. Formulation of felodipine loaded PLGA nanoparticles
S.
No Formulation
Drug:
Polymer
Ratio
Wt. of
Drug
(mg)
Wt. of
Polymer
(mg)
Vol. of
OP
(ml)
Vol. of
AP (ml)
Agitation
(rpm)
1 FP1 1:1 20 20 10 20 5000
2 FP2 1:2 20 40 10 20 10,000
3 FP3 1:3 20 60 10 50 15,000
4 FP4 1:2 20 40 10 40 15,000
5 FP5 1:2 20 40 10 30 17,000
6 FP6 1:4 20 80 10 20 15,000
7 FP7 1:3 20 60 10 20 15,000
Note: FP indicates felodipine loaded PLGA nanoparticle; OP: organic phase; AP: aqueous
phase.
5.2.2. Characterization of nanoparticles
Determination of particle size and Zeta potential
Particle size analysis was performed by Photon Correlation Spectroscopy
(PCS) with Zetasizer 3000 (Malvern Instruments, Malvern, UK) as described in
section 4.1.2, Chapter 4. The freeze dried powdered samples were suspended in Milli-
Q water (1mg/ml) at 25 °C and sonicated for 30 sec in an ice bath to prevent the
clumping. The mean particle diameter and size distribution of the suspension were
assessed with a fixed angle of 90o. The Zeta potential also measured using the same
sample. Analysis was carried out for three times for each batch of sample under
identical conditions.
Determination of entrapment efficiency and drug loading
The entrapment efficiency (EE) was estimated by reverse phase High
Performance Liquid Chromatography (RP-HPLC) method (Mohanty et al., 2010). The
drug loaded nanoparticle solution of 1 mg/ml was prepared in methanol and 20 µL of
the sample was injected manually to HPLC equipped with Shimadzu LC-20AD PLC
pump and SPD-M20A PDA detector. The chromatographic separation was achieved
by using Phenomenex C18 (150×4.6 mm, 5µ) analytical column. The mobile phase
used consisting of methanol and water (80:20 v/v) was passed through 0.45 µm

membrane filter and degassed by ultrasonication. The flow rate was maintained at 1.0
ml/min and the measurements were made at 240 nm. The amount of the felodipine in
the sample was determined from the peak area correlated with the standard curve. The
drug entrapment efficiency (EE) and drug loading (DL) were calculated using
following formula:
Weight of the drug in nanoparticles
EE (% w/w) = ×100
Weight of the drug added
Weight of the drug in nanoparticle
DL (% w/w) = ×100
Weight of the polymer and drug added
Scanning electron microscopy (SEM)
The particle shape and surface morphology of felodipine nanoparticles were
examined by scanning electron microscopy (SEM) (JEOL JSM-5610LV). Lyophilized
and completely moisture free samples were consigned on aluminium stubs using
adhesive tapes and coated with gold using sputter coater (JEOL auto fine coater,
Japan) and observed for morphology at an acceleration voltage of 20 kV at high
vacuum.
Atomic force microscopy (AFM)
Atomic force microscopy (AFM) studies were carried out to characterize the
surface morphology of prepared drug loaded nanoparticles. The nanoparticle
suspension was prepared with milliQ water and dried overnight in air on a clean glass
surface and observation was performed with AFM as describe in section 4.1.2.6,
Chapter 4. The scan speed of 2 Hz and 312 kHz resonant frequency was used for
displaying amplitude, signal of the cantilever in the trace direction and to obtained
images (Trapani et al., 2009).
Transmission electron microscopy (TEM)
Transmission electron microscopy was used to examine the morphology of the
particles. A sample of particle suspension was diluted with 3% w/v phosphotungstic
acid adjusted to pH 7.5 with potassium hydroxide corresponding to a 1:1 ratio before
examination. One drop of sample was placed for 1 minute on a copper grid coated

with a formvar carbon film. The excess of sample was wicked away with the aid of
filter paper. The sample was then ready for analysis by TEM.
Fourier transform infrared spectroscopy (FTIR)
The FTIR analysis was performed to know the chemical integrity and possible
chemical interaction between the drug and polymer inside the prepared nanoparticles
as described in section 4.1.2, Chapter 4. FTIR analysis was carried out using FT-IR
Spectrometer. Samples were made into pellets separately for drug, polymer and
nanoparticles with potassium bromide and scanned with resolution of 2 cm-1
in the
range of 4000–400 cm-1
.
Differential scanning calorimetry (DSC) analysis
The physical status of the native drug inside the nanoparticles was ascertained
by the DSC analysis (DSC-60, Shimadzu, Japan). Approximately, weighed 2 mg of
native drug, polymer and nanoparticles were placed separately into the different sealed
standard aluminium pan and were scanned between 25 ºC to 300
ºC with heating rate
of 10 ºC/ minute under nitrogen atmosphere. An empty aluminium pan served as
reference.
5.2.3. Evaluation of nanoparticles
5.2.3.1. In vitro drug release study
5.2.3.1.1. Drug release study
The in vitro drug release study of felodipine nanoparticles was carried out by
using bottle method (Devarajan and Sonavane, 2007; Jain and Saraf, 2009) in
phosphate buffer pH 6.8. The prepared nanoparticles, pure felodipine and marketed
tablet formulation (each containing 5 mg felodipine) were suspended in glass bottles
containing 100 ml of phosphate buffer pH 6.8. Glass bottles were placed in beaker and
kept in incubator shaker throughout the study (37 oC, 50 rpm). At specified time
intervals (as described in Chapter 4) 10 ml samples were collected and centrifuged at
13,800 rpm for 30 min. The supernatants were collected for analysis and the
precipitate resuspended in 10 ml of fresh phosphate buffer. The analysis was carried
out by RP-HPLC at 240 nm. All the measurements were carried out in triplicate.
Analysis of drug release data: The in vitro drug release data were analyzed by various
mathematical models to determine the kinetics and the drug release mechanism from

the developed nanoparticle formulation. The drug release data were fitted with
mathematical models including zero order kinetic, first order kinetic, Higuchi kinetic
and Korsmeyer-Peppas model as described in section 5.1.3.1.1, Chapter 5. The plots
were made from the in vitro drug release data: time vs. cumulative % drug release
(zero order kinetic), time vs. log cumulative % drug remaining (first order kinetic),
square root of time vs. cumulative % drug release (Higuchi model) and log time vs.
log cumulative % drug release (Peppas model) respectively. The first 60% drug
release was fitted in Korsmeyer-Peppas model and release exponent “n” was
calculated from the slop of the plot to characterize the different release mechanism
(Aydin and Pulat, 2012; Bagre et al., 2013).
5.2.3.1.2. In vitro permeation study across the intestine
The everted intestinal sac model was used to assess the permeability of the
nanoparticles across the intestine (Schilling and Mitra, 1990; Agarwal and Khan,
2001) with some modification as described in section 5.2.3.1.3, Chapter 5. The
isolated intestinal segment from the albino rat was carefully everted using the glass
rod and rinsed with saline solution. Modified Kreb’s Ringer bicarbonate (MKRB)
solution of pH 7.4 was filled within the intestinal sac as serosal fluid and placed in a
bath containing 50 ml of nanoparticle suspension (1 mg/ml) in MKRB solution on
mucosal side. The fluid was continuously bubbled with carbogen gas (mixture of 5%
CO2 and 95% O2 gas). The temperature of the organ bath was maintained at 37 ± 0.5
oC. The amount of felodipine was analyzed spectrophotometrically at 240 nm.
5.2.3.1.3. Stability study
Stability study was carried out according the procedure described in section
5.1.3.1.3, Chapter 5. The lyophilized felodipine PLGA nanoparticle was kept in glass
vials and stability study was carried out in three different storage conditions viz. long
term study (25 ± 2 °C / 60% RH ± 5% RH) for one year, intermediate study (30 ± 2 °C
/ 65% RH ± 5% RH) for six months and accelerated study (40 ± 2 °C / 75% RH ± 5%
RH) for six months. The nanoparticles were evaluated at intervals of 0, 3, 6 and 12
months for long term study and 0, 3 and 6 months for intermediate study and
accelerated study. Physical appearance, particle size, Zeta potential and drug content
were evaluated at predetermined time intervals.

5.2.3.2. In vivo evaluation
Wistar albino mice, Wistar albino rats were selected for the in vivo evaluation
of prepared nanoparticle and procured from Central Animal House, RMMCH,
Annamalai University and housed in the Institutional animal house under standard
environmental conditions (22 ± 30 C, 55 ± 5% humidity and 12h/12h dark/light cycle)
and maintained with free access to standard diet and water ad libitum. All
experimentations were approved by IAEC, (Proposal No.967).
5.2.3.2.1. Toxicity study
The acute toxicity study was carried in Wistar albino mice according the
protocol discussed in section 5.1.3.2.1, Chapter 5. The healthy female mice were
divided into five groups for the study. The toxicity was measured by mortality,
survival time, clinical picture of intoxication and behavioral reactions. Animals on
study were observed for any adverse reaction, like changes of body weight, condition
of eye and nose and motor activity. The internal abnormalities viz. size and
appearance of heart, lungs, liver, spleen and kidney were also examined (Gelperina et
al., 2002). Mice were bled via the retro orbital plexus before sacrificing.
Biochemical assay: The blood samples were collected at 14th day and centrifuged at
4000 rpm for 5 min. The serum was kept at – 20 oC until analyzed. The levels of
serum glutamate oxaloacetic transaminase (SGOT), serum glutamic pyruvic
transaminase (SGPT), serum creatinine, serum bilirubin and proteins were analyzed
with automatic analytical instrument (Hitachi, Japan) (Lam et. al., 2004; Oberdorster
and Oberdorster, 2005).
5.2.3.2.2. Bioavailability study
Bioavailability study was conducted in adult albino rats of either sex weighing
150 to 180 gm. The animals were divided into two groups of six animals each and
fasted overnight before commencing the experiment with free access to water. The
felodipine suspension and prepared nanoparticle formulation were administered orally
in a dose of 20 mg/kg body weight with the help of cannula after anaesthetizing for a
very short period of time with diethyl ether. After administration 0.5 ml blood samples
were collected from the retro-orbital plexus into the heparinized tubes at preset time
points of 0.5, 1, 2, 4, 8, 12, 24, 48, 72 and 96 h. The blood samples were centrifuged at

4000 rpm for 10 minutes and the separated plasma samples were stored at – 20 oC
until analysis.
Estimation of felodipine in plasma sample by RP-HPLC analysis: To 0.3 ml
of plasma 50 L of internal standard chlorzoxazone (50 ng/ml) was added in a micro
centrifuge tube and volume made to 2 ml with acetonitrile to precipitate the protein.
Then the sample was centrifuged at 4000 rpm for 25 min and the supernatant was
collected and transferred into an eppendorf tube. The supernatant was dried under
nitrogen air. The residue was dissolved in 200 L of mobile phase and analysis was
carried out by RP-HPLC method as discussed in section 5.1.3.2.2, Chapter 5. The flow
rate was maintained at 1.0 ml/min and the measurements were made at 240 nm. The
amount of the felodipine in the sample was determined from the peak area ratio
correlated with the standard curve prepared under the same identical condition.
Pharmacokinetic analysis: The pharmacokinetic parameters were determined from
plasma concentration data by non-compartmental model. The parameters such as area
under the plasma concentration-time curve (AUC0-t), maximum plasma concentration
(Cmax) and the time taken to reach the maximum plasma concentration (Tmax) were
calculated directly from the plasma concentration time curve. The relative
bioavailability (Fr) of felodipine was calculated using the following equation:
5.2.3.2.3. Antihypertensive study
Blood pressure and heart rate measurement: Systolic blood pressure (SBP)
and heart rate (HR) were measured using tail cuff method as describe in the section
5.1.3.2.3, Chapter 5.(Oh et al., 2007). For measuring the SBP, rats were pre-warmed at
32 0C for 5-10 min in a restraining cage in a warming box. This procedure was
followed at least 2 weeks before experiments to habituate the rats.
Measurement of blood pressure and heart rate in L-NAME induced
hypertensive rats: The Systolic blood pressure (SBP) and heart rate (HR) were
measured after oral administration of nanoparticles in L-NAME (N-nitro-L-arginine
methyl ester) induced hypertensive rats using the tail cuff method. L-NAME (40
mg/kg) was dissolved in drinking water and given orally to rats at an interval of 24 hrs

for 4 weeks. The hypertensive rats with SBP of more than 170 mmHg were used in
this study. To evaluate the BP 24 healthy male rats (weighing 200-250g) were divided
into four groups (6 each group). First group was treated with normal saline (normal
control) and second group treated with L-NAME (disease control). Third and fourth
groups (pre-treated with L-NAME) received orally native felodipine (20m/kg), and
felodipine-PLGA nanoparticles in a dose equivalent to 20 mg of felodipine
respectively. All the measurements were performed three times.
Statistical analysis
Experimental results were tested by one-way analysis of variance (ANOVA)
and Student’s t-test. Data represented as mean values ± SD (standard deviation). The
values of p < 0.05 (*) were indicative of significant difference, very significant
difference if p < 0.01 (**) and highly significant difference if p < 0.001 (***).
5.2.4. Results and discussion
Preparation of nanoparticles
Felodipine loaded PLGA nanoparticles were prepared with solvent evaporation
technique. The various parameters like drug polymer ratios, speed of agitation and
organic phase to aqueous phase ratio were studied to get desired particle size with
good entrapment efficiency. The polymer PLGA was selected because of its good
sustained release property and long circulation time in plasma.
Particle size and Zeta potential measurement
The mean particle sizes of the prepared nanoparticles as measured by the
Photon Correlation Spectroscopy (PCS) were in size range of 210 to 312 nm and the
size distributions were monodispersed (0.216 to 0.442) in all the formulations (Tab.
5.2.2). The particle size was slightly increased with the increase of polymer amount.
In the present study, the effect of agitation speed and organic phase to the aqueous
phase ratio on the particle size was studied and no noticeable changes were observed.
The Zeta potential value measured in water, exhibited negative values of 13.8 to 19.8
mV (Tab. 5.2.2). This negative charge of the nanoparticles is due to the end
carboxylic acid group present in the PLGA polymer which effectively allows the
particles to cross the lipophilic membrane of the intestine and improve the circulation
time in the plasma (Jin et al., 2008). The higher zeta potential values can also
provide more stability of the nano particles by preventing Ostwald ripening.

Drug entrapment efficiency and drug loading
The entrapment efficiency is influenced by the characteristics of the polymer,
drug, surfactant etc. The higher entrapment efficiency was observed with increasing
proportion of polymer in the formulation, which is in consistent with the previous
study by Dongming (Dongming et al., 2007). The nanoparticles formulation FP7
prepared with drug-polymer ratio of 1:3 with stabilizer concentration 1% (w/v) and
agitation speed of 15,000 rpm shows the entrapment efficiency of 85.28%, drug
loading of 9.93% and particle size of 226 nm with Zeta potential value -19.8 mV
(Tab. 5.2.2, Fig. 5.2.1 & Fig. 5.2.2).
Smaller particle size also observed with formulation FP2, but showed low
encapsulation efficiency as compared with FP7. Hence the formulation FP2 was not
selected for further study. The drug loading of formulation FP7 was less than that of
formulation FP1 and FP2. The higher drug loading forms the porous structure and
hollow channels in the polymer structure through which drug can escape to the outer
phase. Based on the particle size and entrapment efficiency the formulation FP7 was
selected, and validated for further studies.
Table 5.2.2. Particle size, Zeta potential, polydispersity index, entrapment
efficiency and drug loading of felodipine loaded PLGA nanoparticles
Formulation Particle size
(nm)*
Zeta
potential
(mV)*
Polydispersity
index*
Entrapment
efficiency
(%w/w)*
Drug loading
(%w/w)*
FP1 295 ± 2.23 -15.6 ± 0.57 0.315 ± 0.07 73.78 ± 0.38 14.55 ± 0.91
FP2 210 ± 3.51 -17.6 ± 0.72 0.293 ± 0.05 78.89 ± 0.32 13.35 ± 0.69
FP3 312 ± 5.24 -18.5 ± 0.75 0.371 ± 0.08 75.87 ± 0.87 13.04 ± 0.71
FP4 307 ± 4.51 -13.8 ± 0.38 0.442 ± 0.89 82.45 ± 0.86 10.43 ± 0.89
FP5 286 ± 5.19 -15.4 ± 1.04 0.216 ± 0.14 76.21 ± 0.47 12.41 ± 1.02
FP6 273 ± 6.28 -18.7 ± 0.54 0.254 ± 0.04 77.23 ± 0.36 12.08 ± 0.72
FP7 226 ± 5.39 -19.8 ± 0.62 0.216 ± 0.09 85.28 ± 0.32 9.93 ± 0.76
* The values are expressed as mean ± SD for n=3

Figure 5.2.1. Particle size distribution of felodipine loaded PLGA nanoparticle
formulation (FP7) prepared with drug-polymer ratio (1:3)
Figure 5.2.2. Zeta potential of felodipine loaded PLGA nanoparticle formulation
(FP7) prepared with drug-polymer ratio (1:3).

Validation of nanoparticle formulation FP7
Three batches of FP7 prepared using the drug to polymer ratio (1:3), agitation
speed (15,000 rpm), organic phase to aqueous phase ratio (1:2) and stabilizer
concentration (1% w/v) showed the reproducibility of batches. The particle size,
polydispersity index and entrapment efficiency of reproducible formulations are given
in (Tab. 5.2.3), which show there is no noticeable differences among the batches.
Table 5.2.3. Particle size, polydispersity index and drug entrapment efficiency of
reproducible batches of FP7
* The values are expressed as mean ± SD for n=3
Surface morphological properties of felodipine nanoparticles (FP7)
The scanning electron microscopy was used to examine the surface
morphology of the nanoparticles. The SEM image of FP7 formulation showed
spherical shape with smooth surface particles (Fig. 5.2.3).
Figure 5.2.3. SEM image of the felodipine nanoparticle formulation (FP7)
Formulation Particle size
(nm)
Polydispersity
index*
Entrapment
efficiency (%w/w)*
FP7a 225 ± 2.03 0.227 ± 0.094 86.14 ± 0.771
FP7b 229 ± 3.63 0.219 ± 0.038 84.69 ± 0.412
FP7c 227 ± 2.91 0.215 ± 0.079 85.74 ± 0.834

Th
lit
Fi
Th
Ze
he AFM im
ttle agglome
Figure 5.
igure 5.2.5.
he particle
etasizer. The
mage also rev
eration. This
.2.4. AFM im
TEM imag
size measu
e SEM only
vealed that t
is because o
mage of the
ge of the felo
ured by SEM
y measures t
the particles
of freeze drie
e felodipine
odipine nano
M was sma
the particle s
are disc lik
ed product.
nanoparticl
oparticle fo
aller than pa
size, wherea
ke shape (Fig
le formulati
rmulation (
article size
as Zetasizer
g. 5.2.4) wit
ion (FP7)
(FP7)
measured b
measures th
th
by
he

particle surrounded by hydrodynamic layer. The TEM image also revealed the core
drug entrapment inside the polymer and spherical particles with smooth surface (Fig.
5.2.5).
Fourier transform infrared spectroscopy (FTIR)
The FTIR study of pure felodipine, polymer and felodipine loaded PLGA
50:50 nanoparticles was carried out for the interaction study between the drug and
polymer (Fig. 5.2.6). There were no distinctive changes in the FTIR spectrum of
felodipine and drug loaded nanoparticles indicating on intermolecular interaction.
However, the intensity of the peak at 1261 cm-1
, 1434 cm-1
and 2928 cm-1
were
slightly decreased due to the intermolecular hydrogen bonding indicating the chemical
stability of the nanoparticles.
Figure 5.2.6. FTIR spectra of (a) native felodipine, (b) PLGA 50 :50 and (c)
felodipine loaded PLGA nanoparticle formulation (FP7)
Differential scanning calorimetry (DSC)
Differential scanning calorimetry was performed for the pure felodipine,
PLGA 50:50 and felodipine nanoparticles to analyze the physiochemical interaction
between the drug and polymer inside the nanoparticles (Fig. 5.2.7). The sharp
endothermic peak at 192 ºC in the thermogram represents melting point of felodipine
indicating crystalline nature of the drug (Mura et al., 2001). No distinctive peak was

observed in the thermogram of the felodipine owing to the decreased crystallinity in
the formulation. This is because of drug solvation in the amorphous carrier as well as
solid state interaction induced by heating.
Figure 5.2.7. DSC thermogram of (a) PLGA 50 :50, (b) native felodipine and (c)
felodipine - PLGA nanoparticles (FP7)
In vitro drug release study
Drug release from the nanoparticles is usually a biphasic phenomenon
although on some occasion a triphasic profile is also seen. There is an initial rapid
removal of the drug from the nanoparticles possibly related to loss of drug associated
loosely on the surface of the nanoparticles. This initial release is rapid and
uncontrolled and is termed as burst release. Most of the particles reported in the
literature show this initial release. After the surface adsorbed drug release is complete,
slower release is observed from the nanoparticles (Kreuter, 1994; Juan and Wang,
2002). Drug release profile of drug powder, prepared nanoparticles (FP7) and
marketed formulation in phosphate buffer pH 6.8 are shown in Tab. 5.2.4 & Fig.
5.2.8. The felodipine nanoparticles show slower drug release in comparison with pure
drug powder and marketed formulation.

Table 5.2.4. In vitro drug release profile of marketed formulation, native
felodipine and felodipine loaded PLGA nanoparticles (FP7) in phosphate buffer
pH 6.8
Time (h) Native felodipine FP7 Marketed formulation
0 0 0 0
1 39.73 ± 0.69 16.1 ± 0.63 45.97 ± 0.83
2 48.58 ± 0.97 18.7 ± 0.83 59.49 ± 0.63
4 56.75 ± 0.63 22.3 ± 0.89 73.91 ± 0.82
6 63.24 ± 0.48 24.1 ± 1.16 87.14 ± 1.26
8 66.17 ± 1.02 25.5 ± 0.92 89.54 ± 0.98
10 69.97 ± 0.92 27.8 ± 1.04 90.72 ± 0.84
12 74.06 ± 1.28 37.9 ± 1.10 -
18 79.54 ± 0.81 43.7 ± 0.94 -
24 86.84 ± 0.73 51.2 ± 1.36 -
48 87.54 ± 1.05 58.3 ± 1.17 -
72 87.98 ± 0.82 61.9 ± 1.05 -
96 89.61 ± 0.65 68.3 ± 0.57 -
T50 5.0 ± 0.67 21.6 ± 0.81 1.5 ± 0.71
The values are represented as Mean ± SD; n=3
Figure 5.2.8. In vitro drug release profile of marketed formulation, native
felodipine and felodipine loaded PLGA nanoparticles (FP7) in phosphate buffer
pH 6.8
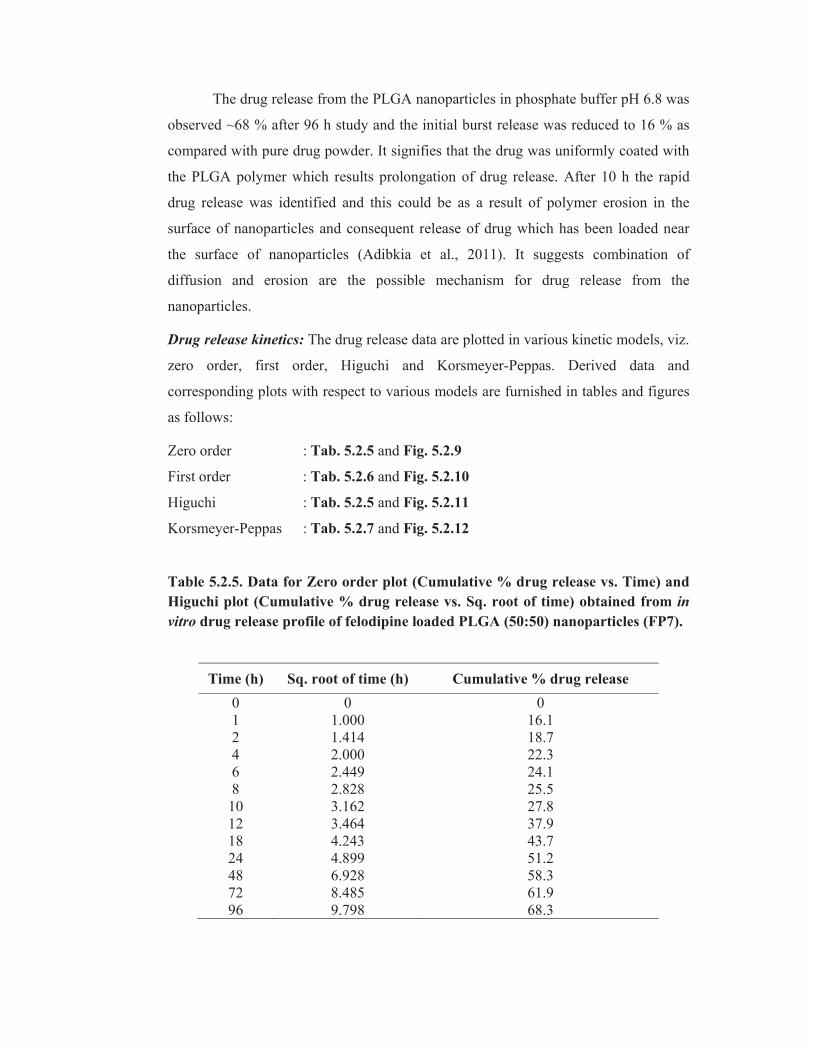
The drug release from the PLGA nanoparticles in phosphate buffer pH 6.8 was
observed ~68 % after 96 h study and the initial burst release was reduced to 16 % as
compared with pure drug powder. It signifies that the drug was uniformly coated with
the PLGA polymer which results prolongation of drug release. After 10 h the rapid
drug release was identified and this could be as a result of polymer erosion in the
surface of nanoparticles and consequent release of drug which has been loaded near
the surface of nanoparticles (Adibkia et al., 2011). It suggests combination of
diffusion and erosion are the possible mechanism for drug release from the
nanoparticles.
Drug release kinetics: The drug release data are plotted in various kinetic models, viz.
zero order, first order, Higuchi and Korsmeyer-Peppas. Derived data and
corresponding plots with respect to various models are furnished in tables and figures
as follows:
Zero order : Tab. 5.2.5 and Fig. 5.2.9
First order : Tab. 5.2.6 and Fig. 5.2.10
Higuchi : Tab. 5.2.5 and Fig. 5.2.11
Korsmeyer-Peppas : Tab. 5.2.7 and Fig. 5.2.12
Table 5.2.5. Data for Zero order plot (Cumulative % drug release vs. Time) and
Higuchi plot (Cumulative % drug release vs. Sq. root of time) obtained from in
vitro drug release profile of felodipine loaded PLGA (50:50) nanoparticles (FP7).
Time (h) Sq. root of time (h) Cumulative % drug release
0 0 0
1 1.000 16.1
2 1.414 18.7
4 2.000 22.3
6 2.449 24.1
8 2.828 25.5
10 3.162 27.8
12 3.464 37.9
18 4.243 43.7
24 4.899 51.2
48 6.928 58.3
72 8.485 61.9
96 9.798 68.3

Table 5.2.6. Data for first order plot (Log cumulative % drug remaining vs.
Time) obtained from in vitro drug release profile of felodipine loaded PLGA
nanoparticles (FP7).
Table 5.2.7. Data for Korsmeyer-Peppas model (Log cumulative % drug
remaining vs. Log time) for felodipine loaded PLGA nanoparticles (FP7)
Time (h) Log (% drug remaining)
0 -
1 1.924
2 1.914
4 1.892
6 1.881
8 1.875
10 1.857
12 1.792
18 1.748
24 1.690
48 1.623
72 1.580
96 1.505
Time (h) Log time (h) Log cumulative
% drug released
0 0 0
1 0.000 1.20
2 0.301 1.26
4 0.602 1.34
6 0.778 1.38
8 0.903 1.40
10 1.000 1.45
12 1.079 1.58
18 1.255 1.64
24 1.380 1.71
48 1.681 1.76
72 1.857 1.79
96 1.982 1.83

Figure 5.2.9. Felodipine loaded PLGA nanoparticles (FP7) - Zero order release in
phosphate buffer pH 6.8 between 18 to 96 h.
Figure 5.2.10. Felodipine loaded PLGA nanoparticles (FP7) - First order release
in phosphate buffer pH 6.8 between 1 to 18 h.
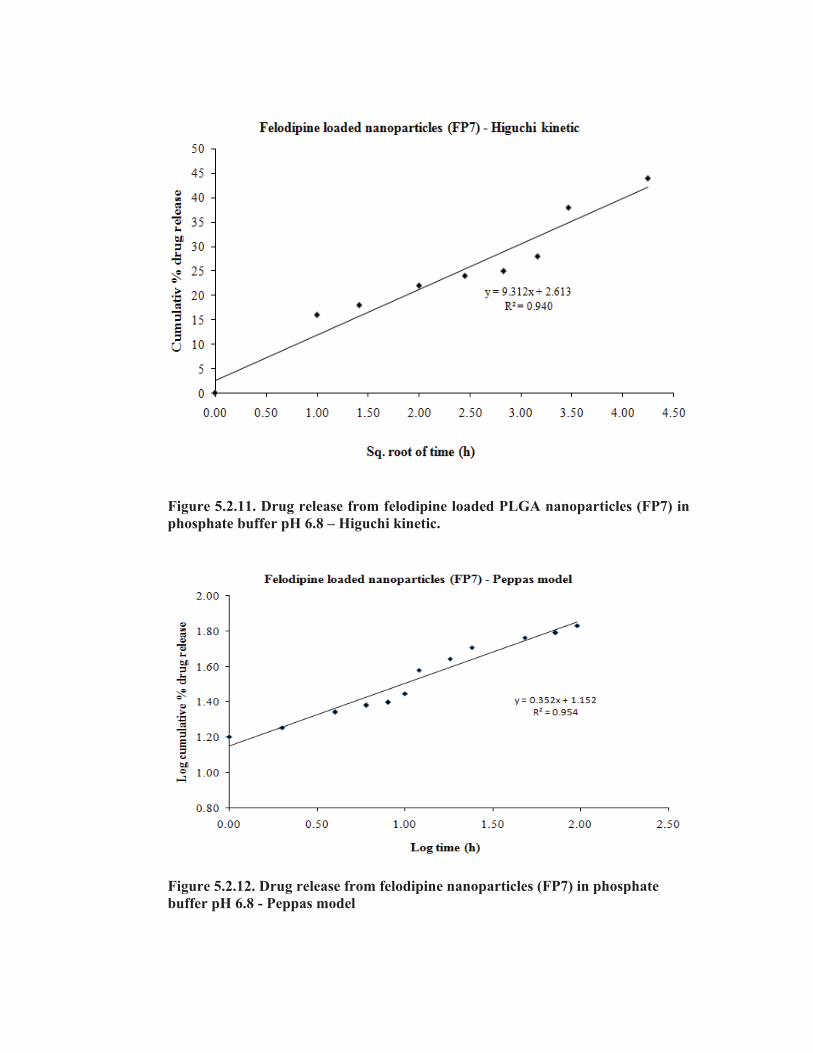
Figure 5.2.11. Drug release from felodipine loaded PLGA nanoparticles (FP7) in
phosphate buffer pH 6.8 – Higuchi kinetic.
Figure 5.2.12. Drug release from felodipine nanoparticles (FP7) in phosphate
buffer pH 6.8 - Peppas model

Table 5.2.8. Régression coefficient (r2) values plots of drug release data obtained
from the felodipine PLGA nanoparticles (FP7)
Formulation 1st order Zero order Higuchi
Korsmeyer-
Peppas Peppas ‘n’
Period (1- 18h) (18-96h) (1-96h) (1-96h) -
FP7 0.938 0.944 0.940 0.954 0.352
Model fitting of the drug release data showed that the r2 values (Tab. 5.2.8) are
almost identical and difficult to distinguish. The drug release followed first order
kinetics during 1 to 18 h and zero order during 18 to 96 h. Drug release from the
nanoparticles also obeyed Higuchi as well as Peppas models, indicating that the drug
release was by diffusion mechanism. The release exponent ‘n’ value (0.352) was
calculated from the slope of the Peppas model and is less than 0.5, indicating the
release mechanism from the nanoparticles was diffusion controlled. The felodipine
release from the nanoparticles follows the mixed order kinetics.
In vitro permeation across the intestine
To assess the permeability of the formulation across the intestine, everted
intestinal sac model was used. The result showed that about 72.47 ± 1.03 % of
felodipine reached across the intestine to the serosal fluid from the nanoparticles after
8 h study (Fig. 5.2.13.).
Figure 5.2.13. In vitro intestinal permeation study of felodipine loaded
nanoparticles (FP7) in everted intestinal sac model.
The UV-spectroscopy analysis of the serosal fluid confirmed that the felodipine-
PLGA nanoparticles were absorbed as such across the intestine. On the other hand, the

pure felodipine was found to be only 29.56 ± 0.71 % in the serosal fluid. The
increased paracellular uptake of felodipine nanoparticles contributes increased
permeability.
Stability study
The stability study was carried out to establish the suitable storage condition
and the suitability of the formulation. The results of stability studies for the developed
nanoparticles (FP7) are furnished in Tab. 5.2.9. No visible physical changes (colour
and cake formation) were observed for the nanoparticles stored in 25 °C/60% RH and
30 °C/65% RH. But particle aggregation was observed among the nanoparticles stored
in 40 °C/75% RH at 6 months. This may be due to the absorption of moisture on the
nanoparticle surface. No significant drug decomposition was found for particles stored
in long term and accelerated conditions. But some appreciable increase in particle size
was observed when stored in accelerated storage condition. Hence, after exposure in
various environmental conditions the nanoparticulate systems shows no remarkable
changes indicating the stability of the systems.
Table 5.2.9. Stability study data of selected felodipine nanoparticles (FP7)
subjected to three different storage conditions (25 °C/60% RH, 30 °C/65% RH and
40 °C/75% RH)
Test parameters Long term storage condition (25 °C/60% RH)
Periods (months) 0 3 6 12
Physical change No change No change No change No change
Particle size (nm) 227 ± 1.73 228 ± 2.05 228 ± 2.16 231 ± 3.03
Zeta potential (mV) -20.1 ± 1.26 -19.7 ± 1.03 -22.3 ± 0.91 -20.8 ± 1.05
Drug content (%) 100 98.17 ± 0.69 98.02 ± 1.01 97.33 ± 0.94
Intermediate storage condition (30 °C/65% RH)
Physical change No change No change No change -
Particle size (nm) 229 ± 2.26 231 ± 2.08 236 ± 3.11 -
Zeta potential (mV) -19.9 ± 0.82 -20.3 ± 1.07 -20.1 ± 0.76 -
Drug content (%) 100 98.73 ± 0.82 97.02 ± 1.06 -
Accelerated storage condition (40 °C/75% RH)
Physical change No change No change Aggregation -
Particle size (nm) 227 ± 3.14 249 ± 2.92* 264 ± 2.05* -
Zeta potential (mV) -19.8 ± 0.83 -20.6 ± 0.91 -18.5 ± 0.75 -
Drug content (%) 100 97.39 ± 0.96 95.81 ± 1.12 -
The values are represented as Mean ± SD; n=3
(*) p< 0.05 against time t=0

Toxicity evaluation
The in vivo toxicity study of the felodipine loaded PLGA nanoparticulate
systems (FP7) was performed using female albino mice. The toxicity study was
carried out to observe the mortality and dysfunction of the organs. No mortality or
behavioral changes were observed after single dose oral administration of the
felodipine nanoparticle formulation (FP7) up to the dose level of 240 mg/kg body
weight. But complete mortality was observed at dose level of 480 mg/kg body weight.
Serum biochemical parameters also confirmed that there were no noticeable changes
between the test group and control group (Tab. 5.2.10 and Fig.5.2.14). The study
confirms that the nanoparticle formulation does not influence the liver function
parameters and the serum sodium, chloride and potassium.
Table 5.2.10. Serum biochemical reports of control and treated mice
Parameter Reference
value
Control
(Normal
saline)
60mg/kg 120mg/kg 240mg/kg
Serum creatinine
(mg/dL) 0.2 - 0.9 0.20 ± 0.08 0.18 ± 0.04 0.21 ± 0.04 0.22 ± 0.06
Total bilirubin
(mg/dL) 0 - 0.9 0.62 ± 0.06 0.64 ± 0.04 0.68 ± 0.02 0.62 ± 0.04
Total proteins
(g/dL) 3.5 - 7.2 5.2 ± 1.2 5.1 ± 1.4 4.9 ± 1.8 5.2 ± 1.3
ALT (SGPT) U/L 17 - 77 23.8 ± 2.2 22.6 ± 3.4 23.2 ± 2.2 23.4 ± 2.8
AST (SGOT) U/L 54 - 298 65.4 ± 2.2 64.9 ± 2.6 66.4 ± 3.2 66.2 ± 2.4
Sodium (mEq/L) 140 - 160 144.2 ± 3.6 145.3 ± 4.2 144.6 ± 3.6 143.2 ± 4.8
Chloride (mEq/L) 88 - 110 100.6 ± 2.4 99.2 ± 2.0 101.1 ± 3.2 102.1 ± 1.6
Potassium (mEq/L) 5 - 7.5 4.71 ± 1.8 4.70 ± 1.6 4.82 ± 1.2 4.76 ± 1.4
The values are represented as Mean ± SD; n=3

Serum
crea
tinine
Total b
iliru
bin
Total p
rotien
s
ALT (SGPT)
AST (SGOT)
Sodium
Chloride
Potass
ium
0
50
100
150
200Control
60mg/kg
120mg/kg
240mg/kg
Biochemical parameters
Figure 5.2.14. Effect of felodipine-PLGA nanoparticles (FP7) on serum
biochemical parameters in control and treated mice of acute toxicity studies.
Bioavailability study
The availability of the drug to the biologic system and its therapeutic
effectiveness is the goal of dosage form design. The plasma drug concentration-time
profile of felodipine was constructed following the oral administration of pure
felodipine suspension and felodipine PLGA nanoparticles at a dose of 20 mg/kg to
rats. The plasma concentration-time profile is illustrated in Fig. 5.2.15 and the
pharmacokinetic parameters are listed in Tab. 5.2.11.
Figure 5.2.15. Plasma concentration-time profiles of felodipine in rats after oral
administration of free felodipine suspension and felodipine loaded PLGA 50 :50
nanoparticles (20 mg/kg). Each data was given as mean ± S.D. (n=4).
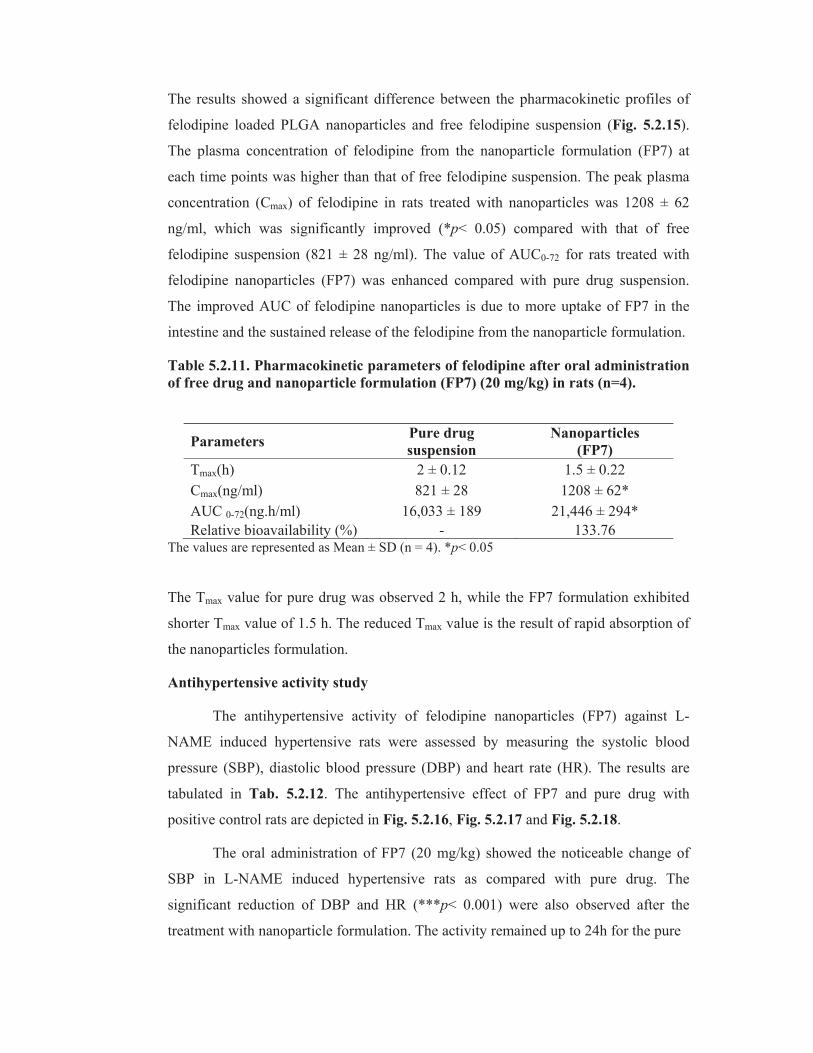
The results showed a significant difference between the pharmacokinetic profiles of
felodipine loaded PLGA nanoparticles and free felodipine suspension (Fig. 5.2.15).
The plasma concentration of felodipine from the nanoparticle formulation (FP7) at
each time points was higher than that of free felodipine suspension. The peak plasma
concentration (Cmax) of felodipine in rats treated with nanoparticles was 1208 ± 62
ng/ml, which was significantly improved (*p< 0.05) compared with that of free
felodipine suspension (821 ± 28 ng/ml). The value of AUC0-72 for rats treated with
felodipine nanoparticles (FP7) was enhanced compared with pure drug suspension.
The improved AUC of felodipine nanoparticles is due to more uptake of FP7 in the
intestine and the sustained release of the felodipine from the nanoparticle formulation.
Table 5.2.11. Pharmacokinetic parameters of felodipine after oral administration
of free drug and nanoparticle formulation (FP7) (20 mg/kg) in rats (n=4).
Parameters Pure drug
suspension
Nanoparticles
(FP7)
Tmax(h) 2 ± 0.12 1.5 ± 0.22
Cmax(ng/ml) 821 ± 28 1208 ± 62*
AUC 0-72(ng.h/ml) 16,033 ± 189 21,446 ± 294*
Relative bioavailability (%) - 133.76 The values are represented as Mean ± SD (n = 4). *p< 0.05
The Tmax value for pure drug was observed 2 h, while the FP7 formulation exhibited
shorter Tmax value of 1.5 h. The reduced Tmax value is the result of rapid absorption of
the nanoparticles formulation.
Antihypertensive activity study
The antihypertensive activity of felodipine nanoparticles (FP7) against L-
NAME induced hypertensive rats were assessed by measuring the systolic blood
pressure (SBP), diastolic blood pressure (DBP) and heart rate (HR). The results are
tabulated in Tab. 5.2.12. The antihypertensive effect of FP7 and pure drug with
positive control rats are depicted in Fig. 5.2.16, Fig. 5.2.17 and Fig. 5.2.18.
The oral administration of FP7 (20 mg/kg) showed the noticeable change of
SBP in L-NAME induced hypertensive rats as compared with pure drug. The
significant reduction of DBP and HR (***p< 0.001) were also observed after the
treatment with nanoparticle formulation. The activity remained up to 24h for the pure

Tab
le
5.2
.12.
Eff
ect
of
felo
dip
ine
nan
op
art
icle
s (F
P7)
on
S
BP
, D
BP
a
nd
H
R
in
L-N
AM
E
ind
uce
d
hy
per
ten
siv
e ra
ts.
Para
met
ers
Gro
up
s P
re-t
reatm
ent
Po
st-a
dm
inis
tra
tio
n (
ho
urs
)
6
24
48
72
SB
P
(mm
/Hg
)
Neg
ativ
e co
ntr
ol
(No
rmal
sal
ine)
1
25 ±
5.2
1
24 ±
4.3
12
5 ±
6.1
1
26 ±
4.5
1
23
± 7
.1
Po
siti
ve
con
tro
l (
L-N
AM
E 4
0 m
g/k
g /
day
) 1
85 ±
4.3
18
8 ±
5.1
a**
*
19
2 ±
3.4
a**
*
19
4 ±
4.2
a**
*
193 ±
4.5
a**
*
L-N
AM
E 4
0 m
g/k
g /
day
&
FP
7 (
20 m
g/k
g)
18
6 ±
4.1
15
9 ±
3.4
b**
*
16
2 ±
4.4
b**
*
16
7 ±
6.1
b**
*
17
4 ±
4.8
b**
L-N
AM
E 4
0 m
g/k
g /
day
& P
ure
Dru
g (
20 m
g/k
g)
18
8 ±
3.7
150 ±
3.9
c***
171 ±
4.2
c***
17
9 ±
3.2
183 ±
2.8
DB
P
(mm
/Hg
)
Neg
ativ
e co
ntr
ol
(No
rmal
sal
ine)
84 ±
4.4
86 ±
2.1
84 ±
2.5
83 ±
2.4
85 ±
3.1
Po
siti
ve
con
tro
l (L
-NA
ME
40
mg/k
g /
day
) 1
10 ±
2.3
10
6 ±
3.4
a**
*
11
1 ±
2.2
a**
*
11
5 ±
3.5
a**
*
113 ±
2.3
a**
*
L-N
AM
E 4
0 m
g/k
g /
day
&
FP
7 (
20 m
g/k
g)
11
2 ±
2.2
88 ±
3.6
b*
**
89 ±
2.4
b***
91 ±
3.9
b*
**
93 ±
3.1
b*
**
L-N
AM
E 4
0 m
g/k
g /
day
& P
ure
Dru
g (
20 m
g/k
g)
11
0 ±
3.7
84 ±
2.9
c**
*
96 ±
4.1
c**
*
10
2 ±
3.5
104 ±
2.2
HR
(Bea
ts/m
in)
Neg
ativ
e co
ntr
ol
(No
rmal
sal
ine)
3
56
± 1
0.4
3
54 ±
8.1
35
2 ±
8.3
3
58 ±
6.2
3
56
± 7
.1
Po
siti
ve
con
tro
l (
L-N
AM
E 4
0 m
g/k
g /
day
) 3
65 ±
5.3
3
67 ±
3.1
36
9 ±
4.5
370 ±
5.3
a*
**
36
8 ±
4.4
a*
L-N
AM
E 4
0 m
g/k
g /
day
&
FP
7 (
20 m
g/k
g)
35
5 ±
2.1
32
0 ±
2.6
b**
*
32
5 ±
3.4
b**
*
33
4 ±
2.2
b**
*d
**
340 ±
3.1
b**
*d
**
L-N
AM
E 4
0 m
g/k
g /
day
& P
ure
Dru
g (
20 m
g/k
g)
36
3 ±
3.1
316 ±
2.9
c***
334 ±
3.7
c***
35
4 ±
3.4
359 ±
2.6
Val
ues
rep
rese
nte
d a
s m
ean ±
S.E
.M (
n=
6)
On
e w
ay A
NO
VA
bet
wee
n n
egat
ive
and
posi
tiv
e co
ntr
ol
gro
up a
nd
the
trea
ted
gro
ups
foll
ow
ed b
y D
un
net
t’s
test
.
a P
osi
tiv
e co
ntr
ol
gro
up v
s. N
egat
ive
con
tro
l g
rou
p,
b F
orm
ula
tio
n t
reat
ed g
rou
p v
s. P
osi
tive
contr
ol
gro
up,
c P
ure
dru
g t
reat
ed g
rou
p v
s. P
osi
tive
con
tro
l g
roup,
d P
ure
dru
g t
reat
ed g
rou
p v
s. F
orm
ula
tio
n t
reat
ed g
rou
p.
p v
alu
es *
*<
0.0
1,
**
*<
0.0
01
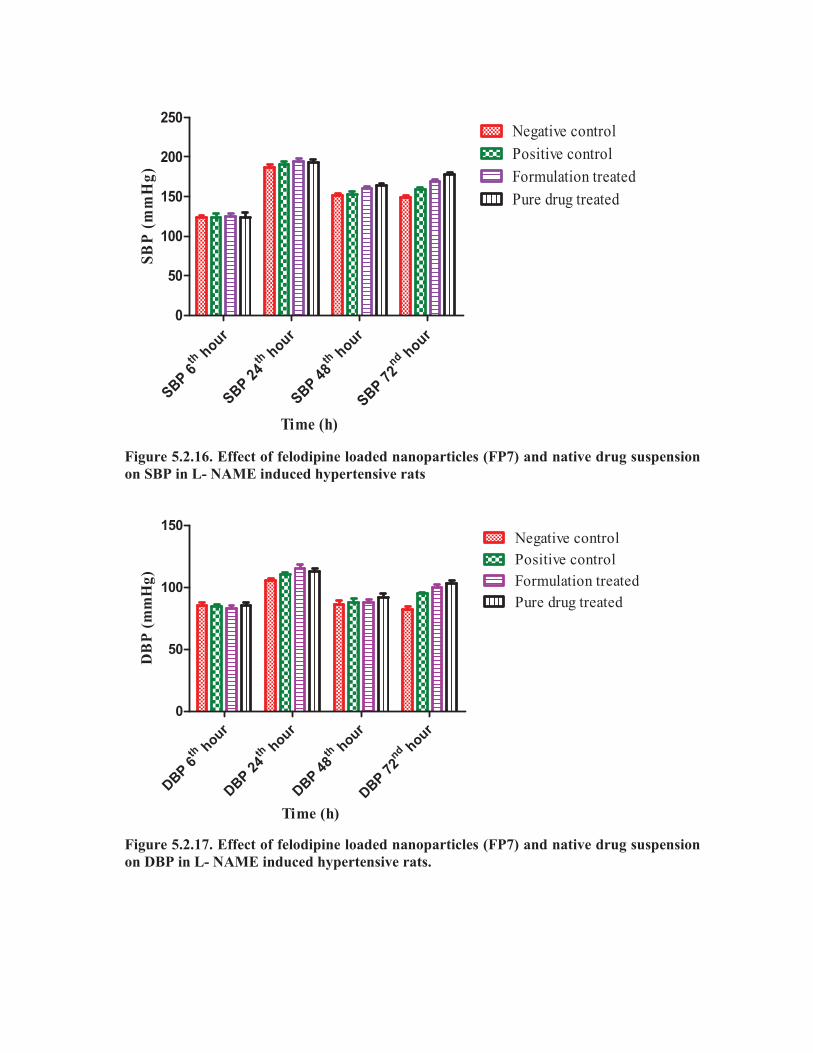
hour
th
SBP 6
hour
th
SBP 2
4 h
our
th
SBP 4
8 h
our
nd
SBP 7
2
0
50
100
150
200
250Negative control
Positive control
Formulation treated
Pure drug treated
Time (h)
SB
P (
mm
Hg
)
Figure 5.2.16. Effect of felodipine loaded nanoparticles (FP7) and native drug suspension
on SBP in L- NAME induced hypertensive rats
hour
th
DBP 6
hour
th
DBP 2
4 h
our
th
DBP
48hour
nd
DBP 7
2
0
50
100
150Negative control
Positive control
Formulation treated
Pure drug treated
Time (h)
DB
P (
mm
Hg
)
Figure 5.2.17. Effect of felodipine loaded nanoparticles (FP7) and native drug suspension
on DBP in L- NAME induced hypertensive rats.

hour
th
HR
6 h
our
th
HR 2
4hou
r
th
HR 4
8 h
our
nd
HR 7
2
0
100
200
300
400Negative control
Positive control
Formulation treated
pure drug treated
Time (h)
Heart
rate
(beats
/min
)
Figure 5.2.18. Effect of felodipine loaded nanoparticles (FP7) and native drug suspension
on HR in L- NAME induced hypertensive rats.
-drug treated group, while FP7 formulation showed its activity up to 48h. The SBP of the FP7
formulation treated group and the pure felodipine suspension treated group at different time
interval of post administration was found to be nearly equal to each other. Similarly, the DBP
and the heart rate of the both the group of animal was nearly equal to each other.


