Download - FEN 24 Nov 2014 Intro to NBA 2011

2014/11/27
1
Introduction to the
National Biodiversity Assessment 2011
Mandy Driver & Jeanne Nel
Freshwater Ecosystem Network: Introductory Workshop
24 November 2014
Overview
• What is the National Biodiversity Assessment?
• Selected highlights from the NBA 2011
• Relationship between NFEPA and NBA 2011
• Key concepts and foundations for the NBA

2014/11/27
2
35
National Spatial Biodiversity Assessment 2004
1st asmt of ecosystems across terrestrial, river, estuarine & marine environments
What is the National Biodiversity Assessment?
• Every 5 to 7 years
• Part of SANBI’s mandate to monitor and report on the state of biodiversity
NBA 2011: Added wetlands & invasives, more focus on indigenous species
& climate change
More than 200 scientists & practitioners from over 30 organisations contributed, 3 year process
and many more…

2014/11/27
3
Agricultural Research Council (ARC) Anchor Environmental Consultants
BirdLife South Africa CapeNature CapFish Diatom and
Environmental Management (DEM) Endangered Wildlife Trust (EWT)
International Ocean Institute (IOI) Southern Africa, University of the
Western Cape (UWC) African Rhino Specialist Group of the International
Union for Conservation of Nature (IUCN) Species Survival Commission
iSimangaliso Wetland Park Authority KwaZulu-Natal Sharks Board
Marine and Estuarine Research (MER) Mpumalanga Tourism and Parks
Authority (MTPA) National Center for Ecological Analysis and Synthesis,
University of California, USA Oceanographic Research Institute (ORI)
South African Shark Conservancy (SASC) Stellenbosch University
University of Cape Town (UCT) University of Queensland, Australia
University of Zululand
Top highlights of NBA 2011…
• 12 highlights – top 3 are freshwater highlights
• For more:
NBA 2011 Synthesis Report
• http://bgis.sanbi.org

2014/11/27
4
1. Wetlands are the most threatened of all South Africa’s ecosystems
• 48% of wetland ecosystem types critically endangered
• Wetlands make up only 2.4% of the country’s area
• Wetlands crucial for purifying water and regulating flow – high value ecological infrastructure
0% 20% 40% 60% 80% 100%
Offshore
Coastal & inshore
Estuaries
Wetlands
Rivers
Terrestrial
% of ecosystem types
CR
EN
VU
LT
Ecosystem threat statusCritically endangeredEndangered
Least threatenedVulnerable
2. High water yield areas* are SA’s water factories, and make up less than 4% of the country’s area
• Currently only 18% of high water yield areas have any form of formal protection
• Strategic importance for water security
• Explore options for extending and strengthening protection
High water yield areas
* Now called Strategic Water Source Areas

2014/11/27
5
3. Tributaries are generally in better condition and less threatened than main rivers
• Healthy tributaries play critical role in keeping hard working main rivers functioning, supporting water quality & quantity
46
16
3
36
0
10
20
30
40
50
CR EN VU LT
% river ecosystem types
(b)
Main rivers:46% critically endangered
26
19
13
43
0
10
20
30
40
50
CR EN VU LT
% river ecosystem types
(a)
Main rivers & tribs:25% critically endangered
• 24% of coastal and inshore ecosystems are critically endangered, compared with 12% of offshore ecosystems
• 17% of SA’s coast has some form of development within 100m of the shoreline
• Nearly a quarter of South Africa’s population lives within 30km of the coast
• A national coastal biodiversity plan to identify coastal ecosystem priority areas is an urgent priority 0% 20% 40% 60% 80% 100%
Offshore
Coastal & inshore
% habitat types
CR
EN
VU
LT
4. Coastal and inshore ecosystems are more threatened than offshore ecosystems

2014/11/27
6
5. St Lucia, SA’s flagship estuary, has been in a poor state –unable to fulfil its role as the most important nursery for marine fish on the south-east African coast
• St Lucia Lake system makes up more than half of SA’s estuarine area, and is part of a World Heritage Site
• Reduced freshwater flow to St Lucia, due to diversion of the uMfoloziRiver since 1950s and other factors estuary closed to the sea for much of the last decade
• BUT link between uMfolozi and St Lucia restored in July 2012! iSimangaliso Wetland Park Authority continues to prioritise restoration
6. Offshore marine ecosystems are the most poorly protected of all SA’s ecosystems, with only 4% of offshore ecosystem types well protected.
• Offshore Marine Protected Area project has identified focus areas for offshore protection
• Establishing offshore MPAs is a priority
0% 20% 40% 60% 80% 100%
Offshore
Coastal & inshore
Estuaries
Wetlands
Rivers
Terrestrial
% of ecosystem types
Not protected
Poorly protected
Moderately protected
Well protected
Dark green = well protectedEcosystem protection level

2014/11/27
7
10 focus areas for offshore protection
For protecting marine biodiversity, contributing to fisheries sustainability, and supporting management of by-catch
7. Biodiversity stewardship programmes are a major success story – making a significant contribution to meeting protected area targets, at low cost to the state
• Contracts with private or communal landowners to protect land of high biodiversity importance
• In 2004 biodiversity stewardship was a new and unfamiliar term, one pilot project underway
• Just 7 years later…
– 6 provinces have biodiversity stewardship programmes
• 24 contract nature reserves and protected environments declared
• Over 100 more awaiting proclamation or in negotiation
– If all of these are successfully proclaimed, around 430 000 ha will have been added to the protected area network – contributing 16% of the 2013 national protected area expansion target

2014/11/27
8
• Low cost to the state – biodiversity stewardship contracts cost a fraction (less than one tenth) of land acquisition
7. Biodiversity stewardship programmes are a major success story – making a significant contribution to protecting ecosystems, at low cost to the state
• Modest extra resources for provincial conservation authorities could expand contribution of biodiversity stewardship, including to river & wetland ecosystems
8. The NBA 2011 provides a new national map of areas that are important for climate change resilience
Importance for climate change resilience
• Areas of natural habitat that support functional, stable landscapes in the long term, supporting continued provision of ecosystem services
• Further analysis needed to determine which of the areas are most important for ecosystem-based adaptation

2014/11/27
9
Corridors
Gradients Diversity
Endemism
Refuge sites
Priority unfragmented
1994 2000 2005 2008
9. Rates of loss of natural habitat are high in parts of the country
• Loss of natural habitat (e.g. cultivation, plantations, mining, urban sprawl) = biggest pressure on terrestrial ecosystems
• In North West, KZN and Gauteng: if current rates of conversion of natural vegetation to other land uses continue almost no natural habitat left outside protected areas by about 2050
Use maps of Critical Biodiversity Areas to guide decisions about where best to locate development

2014/11/27
10
Timber plantations and invasive alien plants
Irrigated croplands
Peri-urban sprawl
Mining
10.SA has over 2000 medicinal plant species. 656 are traded, and of those, 56 are threatened.
• Urgent action required for threatened medicinal plants
• Research and monitoring required to ensure that harvesting patterns are sustainable for those currently not threatened
Distribution of medicinal plant species
Highest concentrations in grassland, savanna & forest biomes
2062 plant species used in traditional
medicine
656 (a third) traded in medicinal markets
56 threatened, including 7 Critically Endangered

2014/11/27
11
Traditional medicine trade is a large industry –worth nearly R3 billion a year (2007),
employs over 130 000 people
(Mander et al 2007)
11. Total area infested by invasive alien plants increased dramatically between mid-1990s & 2007 (approx 10 million to 20 million ha)
• At least R6.5 billion worth of ecosystem services (e.g. water, grazing) lost every year as a result of invasive plants
• Huge scope to scale up natural resource management programmes such as Working for Water, with coupled job creation and ecosystem service benefits
National Invasive Alien Plant Survey

2014/11/27
12
12. Huge progress in mapping and classifying ecosystems
• Provides the foundation for ecosystem-level assessment, monitoring, planning and management
– The ecosystem equivalent of taxonomy
• Long history of mapping vegetation types in SA –terrestrial environment
• Now we also have:
– Marine and coastal habitat types
– River ecosystem types
– Wetland ecosystem types
– Estuary ecosystem types
Vegetation map of South Africa 2006~440 vegetation types
Terrestrial ecosystem types

2014/11/27
13
16 offshore pelagic habitat types (water
column)
New: 136 coastal, inshore & offshore habitat types
58 coastal & inshore habitat types62 offshore benthic (seabed) habitat types
223 river ecosystem types
based on– 31 ecoregions
– 2 flow regime categories– 4 longitudinal zones

2014/11/27
14
New: wetlands (~300 000) 792 types
Based on hydro-geomorphic classes & wetland vegetation groups
46 estuary ecosystem types (not easy to show on a national map)
New: 1st ever map of estuarine functional zone for all 291 estuaries
!( Estuaries
Rivers
Coastline
Amatole District
Floodplain
Open water
Now: actual mapping of open water area and floodplainPreviously: dots along the coastline

2014/11/27
15
National Ecosystem Classification System
Vegetation types
River ecosystem
types
Wetland ecosystem
types
Estuary ecosystem
types
Coastal & inshore
habitat types
Offshore benthic
habitat types
Offshore pelagic
habitat types
terrestrial freshwater estuarine marine & coastal
Relationship between NFEPA and NBA 2011
Good timing
• NFEPA: 2008-2011
• NBA: 2009-2012
NFEPA underpinned freshwater component of NBA 2011

2014/11/27
16
Sub-catchments River typesWetlands
Wetland clustersFish sanctuaries
Free-flowing rivers
River condition
Wetland condition
Groundwater recharge
Water yield (MAR)
Wetland types
Landforms
Estuaries
Input data Nel et al. 2009 Biological Conservation
Co-production of knowledgeCollective experience of almost 1000 years!
Collaboration between scientists & managers

2014/11/27
17
Criteria for FEPAs• Represent river, wetland and
estuary ecosystem types
• Represent free-flowing rivers
• Identify connected systems
• Represent NB migration routes – Wetland clusters
– Fish corridors
• Maintain water supply areas– High water yield areas
– High groundwater recharge areas
• Represent threatened fish
• Represent estuary species
Ecosystems
Ecological processes
Ecosystem services
Species
• Which rivers, wetlands and estuaries should remain in good ecological condition
• A nationally consistent information source
A FEPA map for every catchment

2014/11/27
18
Widespread dissemination, training and ongoing support for users
http://bgis.sanbi.org Data DVD
• FEPA maps and underpinning data
• Implementation Manual
• Ecosystem management guidelines
Diversity of uses:national & local

2014/11/27
19
Key concepts and foundationsfor the NBA
• National ecosystem indicators
• Foundational data sets
National ecosystem indicators
Ecosystem threat status
• Four categories:
– Critically endangered (CR)
– Endangered (EN)
– Vulnerable (VU)
– Least threatened (LT)
Ecosystem protection level
• Four categories:
– Unprotected
– Poorly protected
– Moderately protected
– Well protected
Threatened ecosystem types
Under-protectedecosystem types
Both indicators can be assessed in terrestrial and aquatic environments
2014/11/27
20
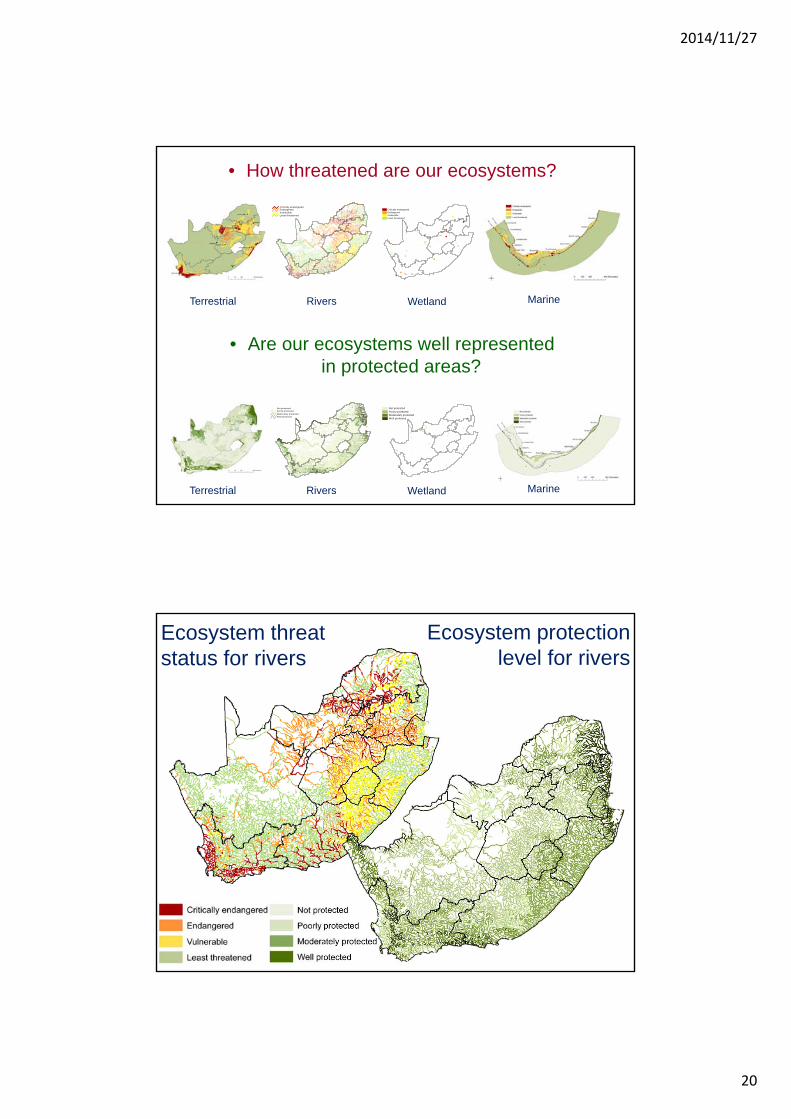
• Are our ecosystems well represented in protected areas?
Critically endangeredEndangered
Least threatenedVulnerable
Critically endangeredEndangered
Least threatenedVulnerable
Poorly protectedModerately protectedW ell protected
Not protected Not protectedPoorly protectedModerately protectedWell protected
• How threatened are our ecosystems?
Terrestrial Rivers Wetland Marine
Terrestrial Rivers Wetland Marine
Ecosystem threat status for rivers
Ecosystem protection level for rivers
2014/11/27
21
0% 20% 40% 60% 80% 100%
Offshore
Coastal & inshore
Estuaries
Wetlands
Rivers
Terrestrial
% of ecosystem types
CR
EN
VU
LT
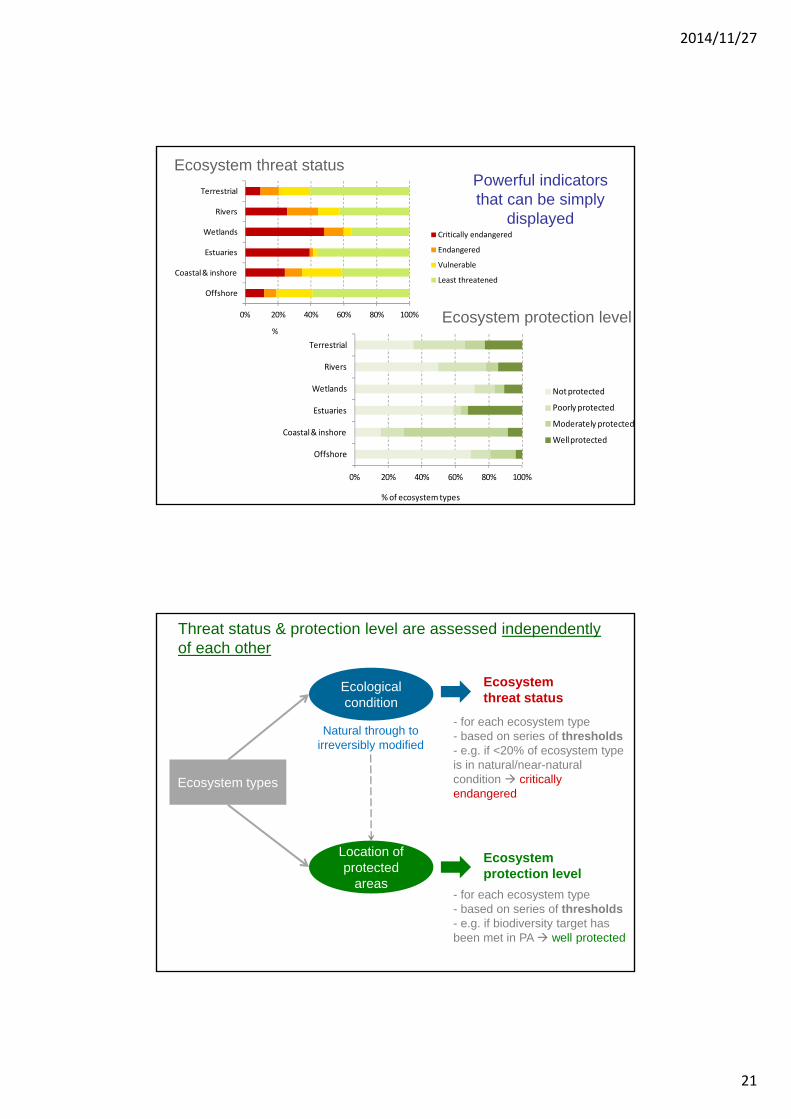
Ecosystem threat status
0% 20% 40% 60% 80% 100%
Offshore
Coastal & inshore
Estuaries
Wetlands
Rivers
Terrestrial
% of ecosystem types
Not protected
Poorly protected
Moderately protected
Well protected
Ecosystem protection level
Critically endangered
Endangered
Vulnerable
Least threatened
Powerful indicators that can be simply
displayed
Ecosystem types
Ecosystemthreat status
Ecosystemprotection level
- for each ecosystem type- based on series of thresholds- e.g. if <20% of ecosystem type is in natural/near-natural condition critically endangered
- for each ecosystem type- based on series of thresholds- e.g. if biodiversity target has been met in PA well protected
Ecological condition
Natural through to irreversibly modified
Location of protected
areas
Threat status & protection level are assessed independentlyof each other
2014/11/27
22
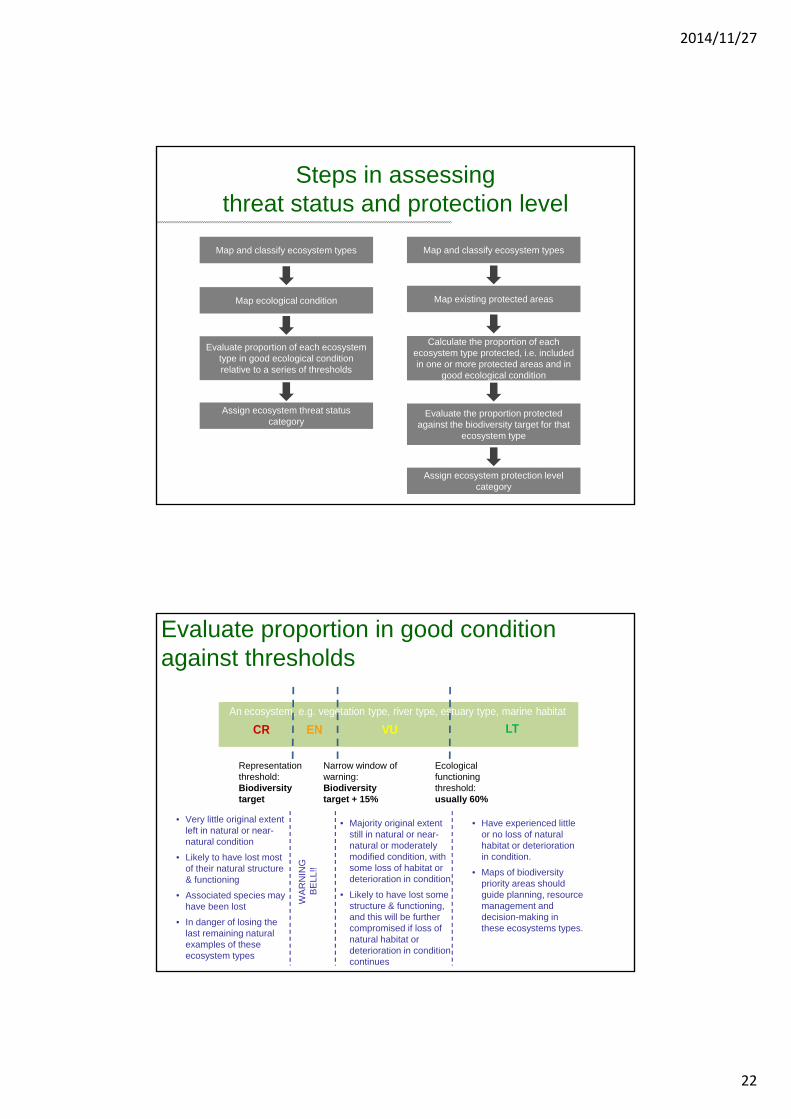
Map and classify ecosystem types
Map existing protected areas
Calculate the proportion of each ecosystem type protected, i.e. included in one or more protected areas and in
good ecological condition
Evaluate the proportion protected against the biodiversity target for that
ecosystem type
Assign ecosystem protection level category
Map and classify ecosystem types
Map ecological condition
Evaluate proportion of each ecosystem type in good ecological condition relative to a series of thresholds
Assign ecosystem threat status category
Steps in assessing threat status and protection level
Evaluate proportion in good condition against thresholds
• Very little original extent left in natural or near-natural condition
• Likely to have lost most of their natural structure & functioning
• Associated species may have been lost
• In danger of losing the last remaining natural examples of these ecosystem types
An ecosystem, e.g. vegetation type, river type, estuary type, marine habitat
CR EN VU LT
Representation threshold:Biodiversity target
Narrow window of warning:Biodiversity target + 15%
Ecological functioning threshold: usually 60%
WA
RN
ING
B
ELL
!!
• Majority original extent still in natural or near-natural or moderately modified condition, with some loss of habitat or deterioration in condition
• Likely to have lost some structure & functioning, and this will be further compromised if loss of natural habitat or deterioration in condition continues
• Have experienced little or no loss of natural habitat or deterioration in condition.
• Maps of biodiversity priority areas should guide planning, resource management and decision-making in these ecosystems types.

2014/11/27
23
How do threat status and protection level relate to FEPAs?
National ecosystem indicators snapshot of the state of ecosystems
Ecosystem threat status
• Four categories:
– Critically endangered (CR)
– Endangered (EN)
– Vulnerable (VU)
– Least threatened (LT)
Ecosystem protection level
• Four categories:
– Unprotected
– Poorly protected
– Moderately protected
– Well protected
Threatened ecosystems Under-protectedecosystems
Ecosystem priority areas what to do, where to prioritise action

2014/11/27
24
Ecosystem priority areas
• Uses systematic biodiversity planning approach to identify priority areas
• Based on biodiversity target
– Ecosystem threat status and ecosystem protection levels therefore integrated into identification of priority areas
Same foundations needed for both
1. Ecosystem types
2. Biodiversity targets
3. Ecological condition
4. Protected areas

2014/11/27
25
Essential data inputs
Map of protected areas – land-based & marine
Classification & mapping of ecosystem types
e.g. vegetation types
e.g. marine & coastal habitat types
Maps of ecological condition
terrestrial
rivers marine
wetlands
Biodiversity targets for ecosystem types
1. Mapping ecosystem types

2014/11/27
26
River ecosystem types
• 223 ecosystem types
– 31 level 1 ecoregions
– 2 flow variability categories
– 4 geomorphic zones
Kleynhans et al. 2005
Surveys and MappingDWA 1:500K rivers
Rowntree & Wadeson 1999; Moolman et al. 2002
Finer-scale sub-national data• KZN• CAPE fine-scale plans• Kamieskroon• Niewoudville• Overberg
“Artificial” = artificial and/or transformed
Mapping wetland locations

2014/11/27
27
• Fringe vegetation or natural?• Left as is, but calculated whether “majority natural” or
“majority artificial”
Combining these data results in sliver polygons which were not cleaned
+ =
Accuracy assessment of wetland map
• 22% delineation accuracy
• 75% wetlands not captured
• 11% incorrectly classified as wetland
NBA 2011 map New map

2014/11/27
28
• 6 hierarchical levels
1.Systems: Marine, Estuarine, Inland
2.Regional context: Bioregions, Biogeographic Zones and Ecoregions
3.[grouping of landscape settings]4.Landform, hydrological
characteristics5.Hydroperiod6.Site characteristics: geology, veg,
substratum, salinity, pH, naturalness
1. Seep2. Valley-head seep3. Channelled valley-bottom4. Unchannelled valley-bottom5. Floodplain6. Depression7. Flat
Wetland ecosystem types: Level 4 of SANBI framework
NATIONAL WETLAND TYPING FRAMEWORK (SANBI 2010)
43% classification accuracyVan Deventer et al. 2014. SA Journal Geography
Wetland types: regional context
• Used national vegetation map• Grouped into 133 “wetland vegetation groups”• Each wetland assigned its majority “wetland vegetation group”• 792 wetland types
National vegetation types (Mucina & Rutherford 2006)
Resulting “wetland vegetation groups”

2014/11/27
29
2. Biodiversity targets
• For ecosystem types
• The proportion of each ecosystem type that should:
– Be maintained in good ecological condition
– Ideally be protected in the long term
• Based on species area curves if suitable data available
– Higher target for ecosystem types that are more species rich
• Otherwise flat 20% target per ecosystem type
100% of area
100%of species
75%
targete.g. 20%
Biodiversity targets for ecosystem types
• species area curve
2014/11/27
30
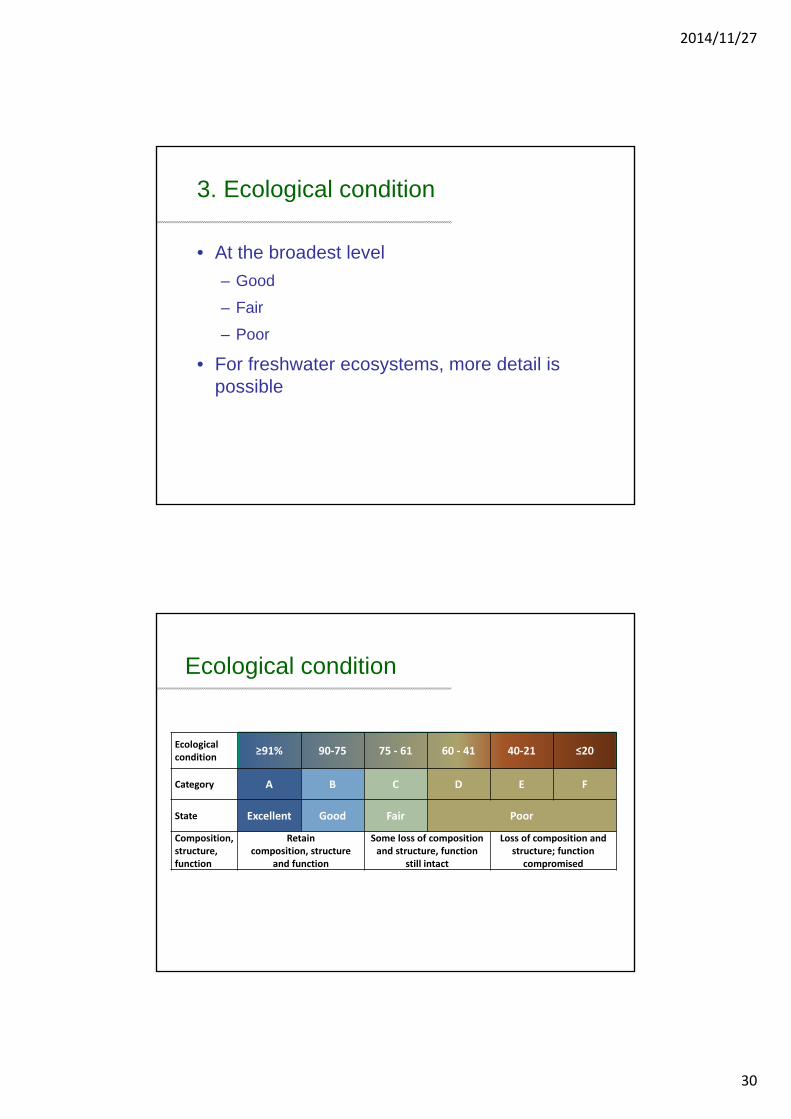
3. Ecological condition
• At the broadest level
– Good
– Fair
– Poor
• For freshwater ecosystems, more detail is possible
Ecological condition
Ecologicalcondition
≥91% 90‐75 75 ‐ 61 60 ‐ 41 40‐21 ≤20
Category A B C D E F
State Excellent Good Fair Poor
Composition,structure, function
Retain composition, structure
and function
Some loss of composition and structure, function
still intact
Loss of composition and structure; function
compromised

2014/11/27
31
DWS’s Present Ecological StatusLevel of modification to 6 indicators:• Instream habitat continuity• Riparian/wetland zone continuity• Potential instream habitat • Riparian-wetland zone• Potential flow • Potential physico-chemical
Ecological category
Description
A Unmodified, natural
B Largely natural, few modifications
C Moderately‐modified
D Largely‐modified
E Seriously‐modified
F Critically/Extremely‐modified
Assessed for two time periods:• 1999• 2011
Descriptions of ecological condition categories
Ecolcondition
Description
A Unmodified, natural
B Largely natural, with few modifications. A small change in natural habitats & biota may have taken place but the ecosystems functions are essentially unchanged
C Moderately modified. A loss and change of natural habitat & biota have occurred but the basic ecosystem functions are still predominantly unchanged
D Largely modified. A large loss of natural habitat, biota & basic ecosystems functions has occurred
E Seriously modified. The loss of natural habitat, biota & basic ecosystems functions is extensive
F Extremely modified. Modifications have reached a critical level & the system has been modified completely with an almost complete loss of natural habitat & biota. Worst instances: the basic ecosystem functions have been destroyed & the changes are irreversible

2014/11/27
32
Based on 6 attributes / drivers of condition
• Attributes:
– Flow (e.g. quantity, timing, velocity)
– Inundation (dams, weirs, other obstructions in the channel)
– Water quality
– Stream bed condition
– Introduced instream biota
– Riparian or stream bank condition
• For each attribute:
– Extent of modification from natural is assessed
– Based on data and expert input, with a confidence rating
Mapping ecological condition

2014/11/27
33
River condition assessed for mainstems & tributaries
• Quaternaries: ~1900 in SAAverage size ~650 km2
• Sub‐quaternaries: ~9 400 in SAAverage size ~135 km2
1999 Present Ecological State assessed for quaternary mainstems
Tributary condition modelled based on national land cover
Quaternary mainstem
River condition
CA or B
ED
Z
COMBINED:– DWA Present
Ecological State data (1999)
– DWA PES updates in certain regions
– River Health Programme data
– Reserve data
– Modelled land cover data
– Expert opinion
<25% natural land cover
2014/11/27
34
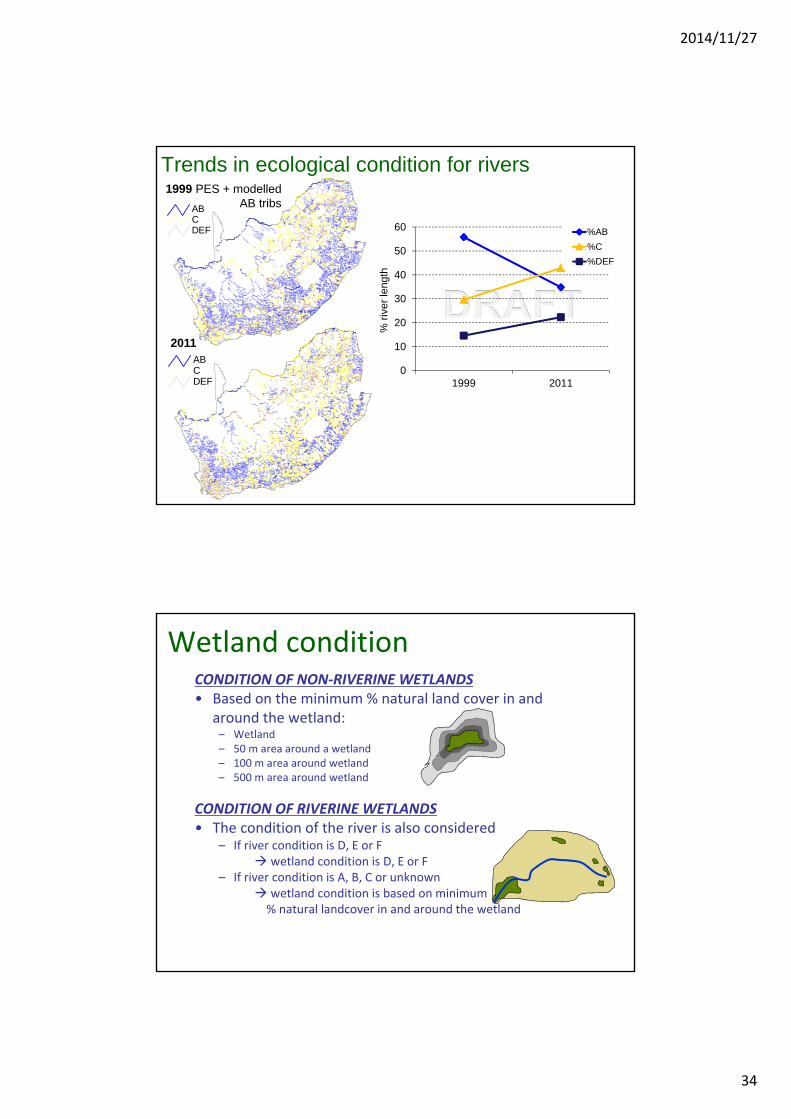
0
10
20
30
40
50
60
1999 2011%
riv
er le
ngth
%AB
%C
%DEF
ABCDEF
ABCDEF
1999 PES + modelled AB tribs
2011
Trends in ecological condition for rivers
Wetland conditionCONDITION OF NON‐RIVERINE WETLANDS• Based on the minimum % natural land cover in and
around the wetland:– Wetland– 50 m area around a wetland– 100 m area around wetland– 500 m area around wetland
CONDITION OF RIVERINE WETLANDS• The condition of the river is also considered
– If river condition is D, E or F wetland condition is D, E or F
– If river condition is A, B, C or unknown wetland condition is based on minimum% natural landcover in and around the wetland

2014/11/27
35
AB – intact wetland
Z3 - “Artificial” from CDSM
Z2 – majority of wetland unit “Artificial”
Z1 – not intact and based on % natural land cover
DEF – riverine wetland with associated D, E or F river
C – riverine wetland with associated C river
Wetland condition
Maps of ecological conditionTerrestrial
(based on land cover)Rivers
Wetlands
Marine & coastal
2014/11/27
36
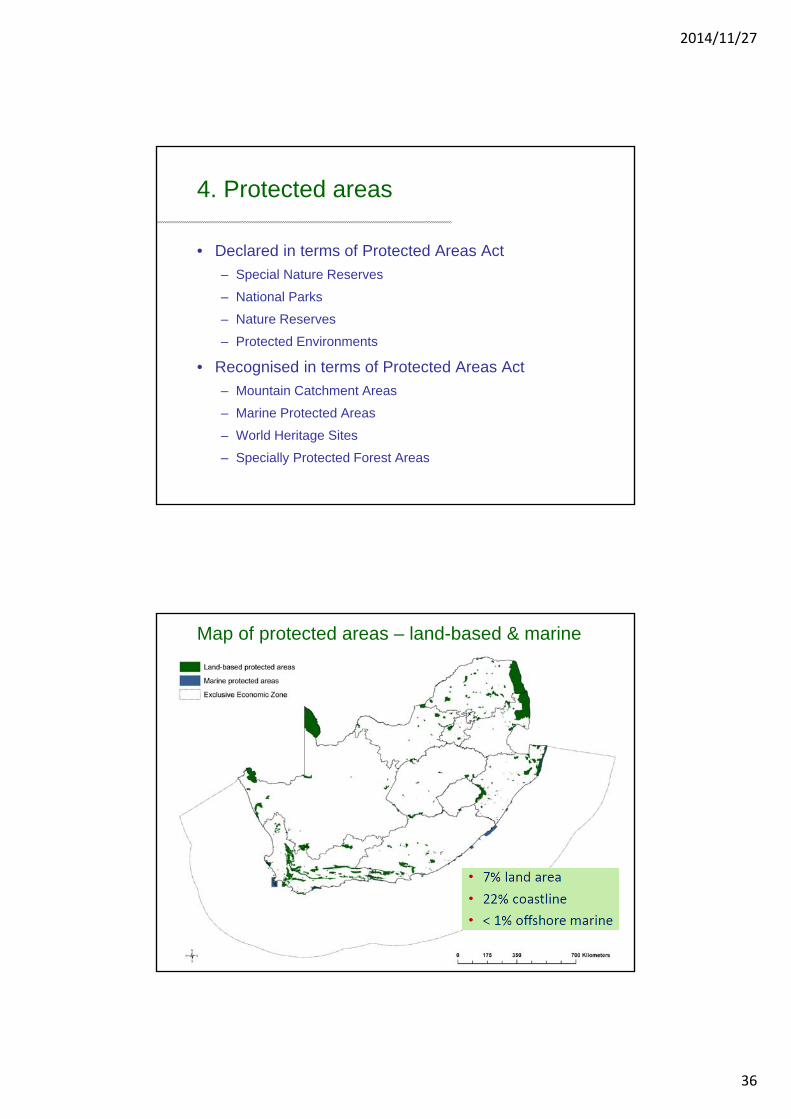
4. Protected areas
• Declared in terms of Protected Areas Act
– Special Nature Reserves
– National Parks
– Nature Reserves
– Protected Environments
• Recognised in terms of Protected Areas Act
– Mountain Catchment Areas
– Marine Protected Areas
– World Heritage Sites
– Specially Protected Forest Areas
Map of protected areas – land-based & marine


