
FINAL REPORT Defluoridation of Drinking Water in Small Communities
2 5 7
8 5 D E
NATIONAL SANITATION FOUNDATION ASSESSMENT SERVICES 25?-S5te-zM_

DEFLOORIDATION OF DRINKING WATER IN SMALL COMMUNITIES
by
Gordon Bellen, Marc Anderson, Randy Gottler National Sanitation Foundation
PO Box 1468 Ann Arbor, MI 48106
Cooperative Agreement No. R809248010
Project Officer
Steven Hathaway Drinking Water Research Division
Water Engineering Research Laboratory Cincinnati, OH 45268
;;,,;. Q£A^^ -2-2^/
[LC: ^ 7 <s^>e
WATER ENGINEERING RESEARCH LABORATORY OFFICE OF RESEARCH AND DEVELOPMENT U.S. ENVIRONMENTAL PROTECTION AGENCY
CINCINNATI, OHIO 45268

DISCLAIMER
The information in this document has been funded wholly or in part by the United States Environmental Protection Agency under Contract No. R809248010 to the National Sanitation Foundation. It has been subject to the Agency's peer and administrative review, and it has been approved for publication as an EPA document. Mention of trade names or commercial products does not constitute endorsement or recommendation for use.
i

FOREWORD
The U.S. Environmental Protection Agency is charged by Congress with protecting the Nation's land, air, and water systems. Under a mandate of national environmental laws, the agency strives to formulate and implement actions leading to a compatible balance between human activities and the ability of natural systems to support and nurture life. The Clean Water Act, the Safe Drinking Water Act, and the Toxics Substances Control Act are three of the major congressional laws that provide the framework for restoring and maintaining the integrity of our Nation's water, for preserving and enhancing the water we drink, and for protecting the environment from toxic substances. These laws direct the EPA to perform research to define our environmental problems, measure the impacts, and search for solutions.
The Water Engineering Research Laboratory is that component of EPA's Research and Development program concerned with preventing, treating, and managing municipal wastewater discharges; establishing practices to control and remove contaminants from drinking water and to prevent its deterioration during storage and distribution; and assessing the nature and controllability of releases of toxic substances to the air, water, and land from manufacturing processes and subsequent product uses. This publication is one of the products of that research and provides a vital communication link between the researcher and the user community.
When fluoride is present in groundwater supplies in excess of the Maximum Contaminant Level (MCL) specified in the National Interim Primary Drinking Water Regulations (NIPDWRs) it may be reduced to an acceptable level with treatment. Treatment in small communities has been accomplished by two approaches - central treatment, and treatment at the point-of-use. This publication presents results obtained from a project investigating the efficacy and costs of these two approaches to fluoride reduction in small communities.
Francis T. Mayo, Director Water Engineering Research Laboratory
ii

ABSTRACT
This report discusses the results of a study of defluoridation of drinking water in small communities using central or point-of-use (POU) treatment. All sites used for project data collection had natural fluoride in their groundwater supplies in excess of the Maximum Contaminant Levels (MCLs) established in the National Interim Primary Drinking Water Regulations (NIPDWRs). Treatment methods used were exchange/adsorption with activated alumina (AA), or reverse osmosis (RO). Either central or POU treatment was used.
Central treatment sites included operating AA plants at Gila Bend and Palo Verde, Arizona. Several treatment runs from the AA central plants were evaluated with collection and analysis of water samples and review of plant records. Fluoride exchange capacities ranged between 1840 and 2600 grains/ft3
(see page xiv) for an English to metric conversion table) for Gila Bend and 2260 to 3450 grains/ft3 for Palo Verde.
Most attrition of media appeared to occur during regeneration. Average attrition rates per regeneration were L.2 percent of bed volume for Gila Bend and 2.8 percent for Palo Verde.
Although exchange capacities were higher at Palo Verde, operating costs were also higher than at Gila Bend. Higher chemical consumption rates (i.e. stronger regenerant) and very low production contributed to increasing the treament cost per 1000 gallons. The use of part-time inexperienced operators at Palo Verde also resulted in inefficient operation, and at times, posed safety problems at the plant.
At North Myrtle Beach, South Carolina, a pilot demonstration was performed to develop a cost estimate for construction and operation of central treatment facilities. Because North Myrtle Beach's water supply consists of 10 wells in dispersed locations, the proposed system was a group of 10 small central plants. The pilot demonstration report and cost estimate appear as Appendix A.
POU AA sites included two subdivisions, an elementary school, and a trailer park in Arizona, and two communities in Illinois. A pilot demonstration with POU AA was performed in a third Illinois community. The POU treatment configuration used was line-bypass; e.g. a separate treated water tap for drinking and cooking.
POU AA devices at Arizona and Illinois sites demonstrated variable fluoride removal efficacy, attributable to a wide range of raw water quality (e.g. fluoride concentrations of 2.5-16 mg/L, alkalinities of 40-1000 mg/L as CaC03,
iii

dissolved silica and arsenic). Volume to breakthrough for new devices installed in Illinois communities ranged between 100 and 350 bed volumes (375 to 1310 gallons).
Bacteriological samples collected at AA POU sites indicated microbial colonization of the media bed, though not as great as with other types of media (e.g. granular activated carbon). There was no evidence of coliform colonization of the AA media bed, except in one instance, where poor source water quality in an unchlorinated supply resulted in positive coliform results from both predevice and postdevice samples.
Although activated alumina POU devices demonstrated highly variable efficacy, the range of average customer costs was small, between $4.25 and $6.23 per month for home installations.
Central treatment costs (amortized capital costs plus operating costs) per 1000 gallons were $0.45 for Gila Bend, $5.42 for Palo Verde, and an estimated $0.57 for North Myrtle Beach. The town of Gila Bend obtained a construction grant for capital cost of the treatment system making their actual costs less. Cost amortization was performed for all systems studied for comparative purposes.
In terms of average costs per service connection, POU treatment with activated alumina appears to be cost competitive with central treatment for communities having 330 to 710 service connections. Raw water quality and treated water use rate determine the operational life of the POU AA device, and have significant impact on the average customer costs.
Results of a field demonstration involving installation and monitoring of low-pressure POU RO devices in the village of Emington, Illinois for reduction of fluoride and dissolved solids are presented. A wide range of flouride rejection percentage was observed. After one year of use, the devices are still in operation. One operational problem noted was fouling of prefilters with iron deposits from the well and distribution system, which resulted in a loss of feed water pressure, reducing treated water production rates.
Results of bacteriological sampling for POU RO devices indicate an increase in standard plate counts of one to two orders of magnitude through the RO system. Coliforms were detected at four sites for predevice samples and 11 sites for postdevice samples. One operating unit required disinfection before resamples were clear; coliforms were not detected in resamples for the other devices.
A design and cost estimate for a central reverse osmosis treatment system in Emington were developed by Basic Technologies, Inc. Customer costs for central and POU RO treatment are compared; average monthly costs per customer for POU RO treatment in Emington are $12.48, and estimated monthly central treatment costs are $28.80 per customer (63 service connections).
This report was submitted in fulfillment of Contract No. R809248010 by the National Sanitation Foundation under the sponsorship of the U. S. Environmental Protection Agency. This report covers the period September 1981 through March 1985.
iv

TABLE OF CONTENTS
PAGE
FOREWORD ii ABSTRACT iii CONTENTS v FIGURES viii TABLES x ACKNOWLEDGMENTS xii ENGLISH TO METRIC CONVERSION TABLE xiv 1. INTRODUCTION 1
FLUORIDE REGULATION ' 1 FLUORIDE SOURCES AND LOCATIONS WITHIN THE UNITED STATES . . 1 FLUORIDE REDUCTION 3 ACTIVATED ALUMINA PROCESS 3
2. OBSERVATIONS AND CONCLUSIONS 8 3. PROJECT OBJECTIVE 10
EFFICACY OF TREATMENT ALTERNATIVES 10 COST OF TREATMENT ALTERNATIVES 11
4. PROCEDURES 12 SITE SELECTIONS AND DESCRIPTIONS 12 Arizona Sites 12 Arizona Central Treatment Sites 13
Gila Bend 13 Palo Verde 13
Arizona Point-of-Use Sites 14 Thunderbird Farms 15 Papago Butte 15 Ruth Fisher School 16 You and I Trailer Park 16
Illinois Sites 17 Parkersburg 17 Bureau Junction 17 Emington 18
DATA COLLECTION PROCEDURES 19 WATER ANALYSES PERFORMED 19
5. EFFICACY OF CENTRAL TREATMENT 21 GILA BEND, ARIZONA 21 Process Description 21 Process Control 22 Efficacy 24 Media Attrition 33 Regeneration Wastewater Analyses 40
v

PALO VERDE, ARIZONA 53 Process Description 53 Efficacy 55 Media Attrition 59 Regeneration Wastewater Analyses 60
6. COSTS OF CENTRAL TREATMENT 64 GILA BEND, ARIZONA 64 Capital Costs 64 Capital Cost Amortization 68 Operating Cost Summary 68 Operating Cost Discussion 69 Customer Costs 72
PALO VERDE, ARIZONA 72 Capital Costs 72 Operating Costs 73
NORTH MYRTLE BEACH, SOUTH CAROLINA 78 Capital Costs 78 Capital Cost Amortization 81 Operating Costs 81 Customer Costs 82
7. EFFICACY OF POINT-OF-USE TREATMENT 83 ARIZONA COMMUNITIES 83 Thunderbird Farms 83 Papago Butte 87 Ruth Fisher School 88 You and I Trailer Park 90
ILLINOIS COMMUNITIES 91 Activated Alumina 91 Reverse Osmosis 101
BACTERIOLOGICAL SAMPLING RESULTS 106 Illinois Communities (AA) 106
Bureau Junction 106 Parkersburg 107
Emington (RO) 108 Arizona Communities (AA) 110
8. COSTS OF POINT-OF-USE TREATMENT 113 ARIZONA COMMUNITIES 113 Thunderbird Farms 113 Papago Butte 117 Ruth Fisher School 120 You and I Trailer Park 121
ILLINOIS COMMUNITIES 121 Activated Alumina 122
Equipment Costs 122 Installation Costs 122 Replacement Costs 122 Customer Costs 123
Reverse Osmosis 124 Installation Costs 124 Equipment Costs 124 Service Costs 125 Customer Costs 125
vi

ADMINISTRATIVE AND MONITORING COSTS 126 9. CENTRAL AND POINT-OF-USE TREATMENT COST COMPARISON . . . . 127
Activated Alumina 127 Reverse Osmosis 131
REFERENCES 133 APPENDIX A. Report on Fluoride Removal Pilot Plant Project at
North Myrtle Beach, SC, Rubel & Hager, Inc. APPENDIX B. Raw and Treated Water Analyses
vil

FIGURES
NUMBER PAGE 1. Naturally fluoridated public water supplies in the US . . . . 2 2. Mechanism of fluoride removal by activated alumina 4 3. Activated alumina granules (80 micron per inch) 6 4. Activated alumina granules (8 microns per inch) 7 5. Flow schematic, Gila Bend treatment plant 23 6. Product water fluoride versus volume treated,
Gila Bend, vessel 1 (2 pages) 26 7. Product water fluoride versus volume treated,
Gila Bend, vessel 2 28 8. Treatment run volume versus media volume, Gila Bend 31 9. Exchange capacity versus number of runs since media
addition, Gila Bend 31 10. Regeneration costs versus treatment run volume,
Gila Bend 34 11. Regeneration costs versus exchange capacity,
Gila Bend 34 12. Regeneration costs versus estimated media volume,
Gila Bend 35 13. Aluminum versus backwash volume, Gila Bend 36 14. Aluminum versus upflow rinse volume, Gila Bend 36 15. Aluminum versus volume, new media backwash,
Gila Bend 37 16. Aluminum and bed pH versus neutralization volume,
Gila Bend 37 17. Product water aluminum versus volume treated,
Gila Bend 39 18. Estimated media volume versus cumulative volume
treated, Gila Bend, vessel 1 41 19. Estimated media volume versus cumulative volume
treated, Gila Bend, vessel 2 41 20. Fluoride versus backwash volume, Gila Bend 44 21. Arsenic versus backwash volume, Gila Bend 44 22. Chromium versus backwash volume, Gila Bend 45 23. Silicon versus backwash volume, Gila Bend 45 24. Iron versus backwash volume, Gila Bend 46 25. Upflow rinse fluoride versus volume, Gila Bend 46 26. Upflow rinse arsenic versus volume, Gila Bend 48 27. Upflow rinse silicon versus volume, Gila Bend 48 28. Upflow rinse chromium versus volume, Gila Bend .# 49 29. Arsenic versus volume, new media backwash, Gila Bend 49 30. Neutralization fluoride versus volume, Gila Bend 51 31. Neutralization arsenic versus volume, Gila Bend 51
viii

Flow schematic, Palo Verde treatment plant 55 Product water fluoride versus volume treated, Palo Verde . . . 58 Product water aluminum versus volume treated, Palo Verde . . . 61 Process electric power consumption, Gila Bend 70 Process electric power consumption, Palo Verde 77 Product water fluoride versus volume treated, Ruth Fisher School 89 Activated alumina efficacy - Illinois communities 93 Product water fluoride versus volume treated, Parkersburg . . . 95 Product water aluminum versus volume treated, Parkersburg . . . 96 Product water sulfate versus volume treated, Parkersburg . . . 97 Product water fluoride versus volume treated, Bureau Junction 98 Product water aluminum versus volume treated, Bureau Junction 99 Product water sulfate versus volume treated, Bureau Junction 100 Point-of-use reverse osmosis flow schematic 102 Central and point-of-use treatment costs for activated alumina 130
ix

TABLES
PAGE
FLUORIDE MCL 1 PROPERTIES OF F-l ACTIVATED ALUMINA 4 LABORATORY ANALYSES AND METHODS USED 20 TREATMENT RUN VOLUMES - GILA BEND 25 MONITORED TREATMENT RUN CHRONOLOGY - GILA BEND 25 TREATMENT EFFICACY SUMMARY - GILA BEND 29 ESTIMATED MEDIA VOLUMES - GILA BEND 30 CHEMICAL USE SUMMARY - GILA BEND 32 CHEMICAL EFFICIENCY SUMMARY - GILA BEND 33 ESTIMATED ALUMINA LOSSES IN REGENERATION - GILA BEND 38 MEDIA REPLACEMENT SUMMARY - GILA BEND 40 REGENERATION SUMMARY, GILA BEND, NOVEMBER 17, 1983 42 BACKWASH, UPFLOW REGENERATION, AND RINSE A COMPOSITE SAMPLE RESULTS - GILA BEND, NOVEMBER 17, 1983 43 RINSE B GRAB SAMPLE RESULTS - GILA BEND 47 DOWNFLOW REGENERATION COMPOSITE AND NEUTRALIZATION GRAB SAMPLE RESULTS - GILA BEND 50 NEUTRALIZATION GRAB SAMPLE RESULTS - GILA BEND, DECEMBER 8, 1983 , 52 EVAPORATION POND WASTEWATER ANALYSES - GILA BEND 53 MONITORED TREATMENT RUNS - PALO VERDE 56 OPERATIONAL PARAMETERS - PALO VERDE 57 EFFICACY SUMMARY -\pALO VERDE 57 CAUSTIC SODA CONSUMPTION - PALO VERDE 59 ESTIMATED MEDIA LOSSES DURING REGENERATION - PALO VERDE 60 REGENERATION WASTEWATER - PALO VERDE, MARCH 31, 1982 62 REGENERATION WASTEWATER - PALO VERDE, MARCH 31, 1983 62 REGENERATION WASTEWATERV pALO VERDE, MAY 19, 1983 63 REGENERATION WASTEWATER -PALO VERDE, JULY 11, 1983 63 REMOVAL AND RECOVERY OF FLUORIDE - PALO VERDE 63 GILA BEND CAPITAL COSTS 65 PRODUCER PRICE INDICES - GILA BEND 67 EVAPORATION POND LINER COSTS - GILA BEND 67 AMORTIZED CAPITAL COSTS - GILA BEND 68 GILA BEND OPERATING COSTS, 1981-1983 68 CHEMICAL PURCHASES - GILA BEND 69 ALUMINA PURCHASES - GILA BEND 70 PARTS REPAIR AND REPLACEMENT COSTS - GILA BEND 71 MISCELLANEOUS COSTS - GILA BEND 71 TOTAL COSTS - GILA BEND 71 CUSTOMER COSTS - GILA BEND 72

39. PALO VERDE CAPITAL COSTS 74 40. AMORTIZED CAPITAL COSTS - PALO VERDE 75 41. PALO VERDE OPERATING COSTS 75 42. PARTS REPAIR AND REPLACEMENT COSTS - PALO VERDE 77 43. TOTAL COSTS - PALO VERDE 77 44. CAPITAL COST ESTIMATE, INDIVIDUAL TREATMENT SYSTEM -
N. MYRTLE BEACH, SC 79 45. CAPITAL COST ESTIMATE, CHEMICAL RAIL TERMINAL - N. MYRTLE BEACH . . 80 46. ESTIMATED 1983 CAPITAL COSTS - N. MYRTLE BEACH 80 47. TOTAL CAPITAL COST ESTIMATE - N. MYRTLE BEACH 81 48. AMORTIZED CAPITAL COSTS - N. MYRTLE BEACH 81 49. ESTIMATED LABOR COSTS - N. MYRTLE BEACH 81 50. ESTIMATED CUSTOMER COSTS - N. MYRTLE BEACH 82 51. WATER USE RATES - THUNDERBIRD FARMS 84 52. FILTER EFFICACY - THUNDERBIRD FARMS 85 53. EXTENDED USE DATA - THUNDERBIRD FARMS 86 54. ALUMINUM RESULTS - THUNDERBIRD FARMS 87 55. TREATED WATER ANALYTES - PAPAGO BUTTE 88 56. TREATED WATER ANALYTES - RUTH FISHER SCHOOL 90 57. TREATED WATER ANALYTES - YOU AND I TRAILER PARK 91 58. TREATED WATER USE RATES - ILLINOIS COMMUNITIES 92 59. PRODUCT WATER FLUORIDE CONCENTRATIONS - ILLINOIS COMMUNITIES . . . 94 60. RO EQUIPMENT MANUFACTURERS' SUMMARY 103 61. USE RATES - EMINGTON RO DEVICES 104 62. EMINGTON RAW WATER QUALITY 104 63. EMINGTON PRODUCT WATER QUALITY 104 64. AVERAGE PERCENT REJECTION - EMINGTON RO DEVICES 104 65. FLOW RATES AND CONTAMINANT REJECTION - EMINGTON RO DEVICES . . . . 105 66. STANDARD PLATE COUNTS - BUREAU JUNCTION 107 67. STANDARD PLATE COUNTS - PARKERSBURG 108 68. STANDARD PLATE COUNTS - EMINGTON 102 69. STANDARD PLATE COUNTS THROUGH RO SYSTEM 109 70. STANDARD PLATE COUNTS - THUNDERBIRD FARMS 110 71. STANDARD PLATE COUNTS - PAPAGO BUTTE Ill 72. STANDARD PLATE COUNTS - RUTH FISHER SCHOOL Ill 73. STANDARD PLATE COUNTS - YOU & I TRAILER PARK 112 74. AS-BID COSTS FOR THUNDERBIRD FARMS POTABLE WATER SYSTEM 114 75. THUNDERBIRD FARMS IMPROVEMENT DISTRICT BUDGET -
1983-84 FISCAL YEAR X. . 115 76. CAPITAL COSTS, INDIVIDUAL TREATMENT SYSTEM - THUNDERBIRD FARMS . . 116 77. AMORTIZED CAPITAL COSTS - THUNDERBIRD FARMS 116 78. CUSTOMER COSTS - THUNDERBIRD FARMS 117 79. AS-BID COSTS FOR PAPAGO BUTTE POTABLE WATER SYSTEM 118 80. PAPAGO BUTTE DOMESTIC WATER IMPROVEMENT DISTRICT -
1983-84 BUDGET 119 81. CUSTOMER COSTS- PAPAGO BUTTE 120 82. CAPITAL COSTS - RUTH FISHER SCHOOL 120 83. TOTAL COSTS - RUTH FISHER SCHOOL 120 84. TOTAL COSTS - YOU AND I TRAILER PARK 121 85. POU AA EQUIPMENT COSTS - ILLINOIS COMMUNITIES 122 86. POU AA INSTALLATION COSTS - ILLINOIS COMMUNITIES 122 87. POU AA REPLACEMENT COSTS - ILLINOIS COMMUNITIES 123
xi

POU AA CUSTOMER COSTS - ILLINOIS COMMUNITIES 123 INSTALLATION COSTS, EMINGTON RO SYSTEMS 124 COSTS FOR POU RO TREATMENT AT EMINGTON 125 CUSTOMER COSTS - EMINGTON RO SYSTEMS 125 AA CENTRAL TREATMENT COSTS 127 AA POU TREATMENT COSTS 128 AA CENTRAL TREATMENT COSTS BASED ON DESIGN FLOWS 129 AA POU SERVICE COSTS 131 ESTIMATED COSTS FOR CENTRAL RO TREATMENT AT EMINGTON 132 CUSTOMER COSTS FOR CENTRAL AND POU RO TREATMENT AT EMINGTON . . . . 132
xii

ACKNOWLEDGMENTS
The authors wish to express their appreciation and recognize the efforts of the following individuals who contributed to project data collection, and enhanced the overall quality of this endeavor.
Larry Anderson, Anderson Water Specialists, Morris, IL
John Craig, Illinois Department of Public Health, Marion, IL
William Dean, Parkersburg, IL
Ann Donithan, Thunderbird Farms Improvement District, Maricopa, AZ
Dawn Galik, Emington, IL
Richard Huddleston, USEPA Region V, Chicago, IL
Jonas Kazlauskas, Gila Bend treatment plant, Gila Bend, AZ
Marion Kuhne, Hennepin Public Water District, Hennepin,IL
Robert Lake, Water Treatment Engineers, Scottsdale, AZ
Paul Lenhausen, Bureau Junction, IL
Madelon Lusk, Papago Butte Improvement District, Chandler, AZ
Ira Markwood, Illinois EPA, Springfield IL
Lanning Nlcoloff, Bureau Junction, IL
William Nowman, Palo Verde Inn and Trailer Park, Tonopah, AZ
Ross Priddy, Carbondale, IL
Walter Purcell, Illinois EPA, Rockford, IL
Frederick Rubel, Rubel & Hager, Inc., Tuscon, AZ
Dennis Stover, Illinois EPA, Marion, IL
Cecil Van Etten, Illinois EPA, Champaign, IL
Terry Velasquez and staff, Gila Bend Town Office, Gila Bend, AZ
Claude Weirman, Mayor, Emington, IL
The townspeople of Parkersburg, Bureau Junction, and Emington, Illinois
xiii

ENGLISH TO METRIC CONVERSION TABLE
To Convert From
Acres Cubic Feet Cubic Feet Dollars/Gallon Feet Gallons (U.S. Liquid) Gallons (U.S. Liquid) Grains/Cubic Foot Inches Miles Pounds Pounds/Square Inch
To
Square Meters Cubic Meters Liters Dollars/Liter Meters Cubic Meters Liters Grams/Cubic Meter Centimeters Kilometers Grams Grams/Square Centimeter
Multiply By
4047 0.0283 28.3162 0.264 0.3048 0.0038 3.7853 2.2883 2.54 1.609
453.6 70.307
xiv
SECTION 1.
INTRODUCTION
FLUORIDE REGULATION
The Safe Drinking Water Act (PL-523) was passed in 1974 to assure provision of safe drinking water to the public. Pursuant to the Act, the National Interim Primary Drinking Water Regulations (NIPDWRs) were promulgated in 1975. The regulations apply to public water supplies. The NIPDWRs established maximum contaminant levels (MCLs) for drinking water constituents having known health effects; these include 10 inorganic contaminants, turbidity, coliform bacteria, pesticides, herbicides, total trihalomethanes, and radionuclides. The inorganics include arsenic, barium, cadmium, chromium, fluoride, lead, mercury, nitrate, selenium, and silver.
Fluoride has been documented to have physiological properties of importance to human health. Research has indicated that fluoride, in relatively small doses, is a strong inhibitor of dental caries, while in higher doses may result in permanent tooth fluorosis, kidney damage, and skeletal aberrations ranging from stiffness to crippling rigidity (1-6). In 1962 the US Public Health Service (USPHS) set a range of recommended concentrations for fluoride in drinking water. These levels vary as a function of the annual average maximum daily air temperature for the location of the water supply to compensate for increased water consumption in warmer climates (7). These criteria were also used when the fluoride MCL was established. The current fluoride MCL appears in Table 1.
TABLE 1. FLUORIDE MCL
Average Annual Maximum Daily Air Temperature (°F) Fluoride MCL (mg/L)
53.7 and below 2.4 53.8 - 58.3 2.2 58.4 - 63.8 2.0 63.9 - 70.6 1.8 70.7 - 79.2 1.6 79.2 - 90.5 1.4
FLUORIDE SOURCES AND LOCATIONS WITHIN THE UNITED STATES
The association of groundwater with fluoride-bearing minerals accounts for the
1

occurrence of natural fluoride in water supplies of the United States. These minerals are often present in igneous, plutonic, or raetamorphic rock. Fluorite (CaF2), the most common fluoride-bearing mineral, may be present in sandstone, limestone, dolomite, and granite. The fluorite crystal is characterized by octahedral cleavage, and may appear white, yellow, purple, or green. Other fluoride-bearing minerals include rhyolite, a volcanic rock, and hornblende. The fluoride ion has a radius similar to the hydroxyl ion, and may attach itself to the crystal structures of mica, tourmaline, topaz, and clays (8,9).
Silicon tetrafluoride gas is released during the raining of phosphate rock and may account for the greatest discharge of fluoride into the environment (10).
A survey of naturally fluoridated water supplies in the United States, conducted for the USPHS by state health agencies in 1956-57, reported 1900 communities with at least one drinking water source containing 0.7 milligrams per liter (mg/L) or more naturally occurring fluoride. Figure 1 depicts the distribution of these communities, which include 15 cities with populations of over 50,000 (11).
Reprinted from Natural Fluoride Content of Communal Water Supplies in the United States, US Government Printing Office
Figure 1. Naturally fluoridated water supplies with concentrations of 0.7 mg/L or greater.
2

A more recent survey, conducted by the Water Quality Division Inorganic Contaminants Committee of the American Water Works Association (AWWA), resulted in responses from 39 states reporting 835 water systems with fluoride concentrations between 1.5 and 15.0 mg/L. When these data were combined with USEPA data from the 11 states not responding, 907 water systems had fluoride concentrations in excess of the local MCL. Texas accounted for 328 of these systems, Virginia for 10A systems, and the states of South Carolina, Iowa, New Mexico, Illinois, North Dakota, and Arizona each accounted for 36 to 61 systems exceeding the fluoride MCL (12).
FLUORIDE REDUCTION
Treatment techniques which have proven effective or have reported potential for fluoride reduction include coagulation/flocculation, ion-exchange, reverse osmosis, electrodialysis, and reversible sorption onto activated alumina. Many of these techniques provide for the removal of other contaminants and may effectively remove fluoride without substantial design or operational changes (i.e., coagulation/flocculation), thus minimizing capital expenditures but increasing operating costs.
Many groundwater supplies with fluoride in excess of the MCL require no other treatment than fluoride reduction and precautionary disinfection. For these supplies, the removal technique which has proven to be most effective is reversible sorption using activated alumina (13). Currently two approaches, central and point-of-use (POU) treatment with activated alumina, are being used effectively for fluoride reduction.
ACTIVATED ALUMINA PROCESS
Activated alumina is currently considered the most cost effective treatment media for fluoride removal for most high fluoride waters (10,13-17). Activated alumina is hydrated alumina (A1203) which has been heat treated to approximately 750°F.
To produce alumina, bauxite (aluminum ore) is digested with caustic soda to form sodium aluminate. This solution is clarified, filtered, and seeded with aluminum hydroxide crystals, which eventually settle out of solution. The crystals are calcined at over 1800°F to produce alumina, a white powder (18).
Alcoa F-l Type activated alumina is currently the most common alumina media used for fluoride reduction. Some physical characteristics of Alcoa F-l Type activated alumina are listed in Table 2 (19,20).
The mechanism for fluoride removal by activated alumina is an exchange/ adsorption process, one of three adsorption mechanisms. The other two adsorption mechanisms are physical adsorption (resulting from van der Waals forces) and chemical adsorption (21). The driving force of exchange/ adsorption is the electrostatic attraction between the solute and the adsorption media. Activated alumina's capacity for fluoride increases with increasing influent fluoride challenge (15,16).
3

TABLE 2. PROPERTIES OF F-l ACTIVATED ALUMINA
Chemical formula A1203'H20 Form Granular Mesh size 28/48 Nominal diameter .30 - .60 mm Loose bulk density .83 g/cm3
Packed bulk density .85 g/cm3
Contact surface area 210 - 250 m2/g Specific gravity 3.3 Total porosity 56.3%
The exchange/adsorption mechanism of fluoride removal can be modeled in the sequence depicted in Figure 2 (22).
Acidification, or acid pretreatment: Alumina-H20 + H2S0i, — Alumina -H2S0i, + H20
Ion Exchange, or removal of fluoride ions from solution: Alumina- R SOi, + NaF — Alumina'HF + Na2S04
Regeneration with caustic soda: Alumina-HF + NaOH — Alumina-NaOH + NaF + H20
Neutralization with sulfuric acid:
Aluraina-NaOH + H 2S0 4— Alumina-H2S04 + Na2S04 + H20
(equations not stoichiometrically balanced for simplification)
Figure 2. Mechanism of fluoride removal by activated alumina.
jActivated alumina has been reported to adsorb the following anions, listed in order of decreasing preference: OH", POSJ, F~ , SO^2, [Fe(CN)6]~h, Cr04~2, S04
2, [Fe(CNy-3 , N02", Br", CI", NO"*, MnO,,", C10,,", CH3C00~ (22). Of the 'first three anions listed, phosphate is the least likely to be present in ground water. Consequently, by decreasing pH, hence the concentration of OH , fluoride can be made the preferred anion for adsorption.
Several investigators have established that the optimum pH interval for fluoride removal with activated alumina is between pH 5 and 6.(10,14-16). At this pH interval the concentration of OH" is 10~9 to 10~8 molar. In addition, the surface potential of the alumina is more positive, or more amenable to anion exchange (16).
The surface characteristics of the activated alumina play an important role in adsorptive properties of the alumina. Photographs taken with an electron microscope show the granular and porous nature of the alumina. Figure 3 (80 microns to the inch) shows the irregular shape of the granules. Figure 4 (8
4

microns to the inch) shows the porous nature of the alumina. As with other porous adsorbents, the majority of the surface area for fluoride removal is in the internal pore area.
As aqueous fluoride passes through a bed of activated alumina, the transfer of fluoride from the bulk liquid to the surface of the activated alumina can be described as a four step process; mass transfer (diffusion) from the bulk liquid to the alumina, film diffusion at the outer surface of the alumina, diffusion through the alumina pores, and sorption onto the surface. In the case of exchange/adsorption, sorption onto the surface is relatively instantaneous so long as electroneutrality is maintained in the immediate area of the sorption reaction. Film diffusion and diffusion through the bulk liquid can be controlled to a certain extent by varying hydraulic loading rates. The rate limiting step becomes pore diffusion after the outer surface is initially covered.
The rate limiting pore diffusion step can affect performance. Consider an activated alumina bed operating at continuous high hydraulic loading rates. Under these circumstances, the mass loading rate of fluoride through the bed exceeds the overall sorption rate because pore diffusion is limited. Some fluoride will break through giving the appearance that the bed capacity is being approached. If all flow is stopped, diffusion of fluoride along the surface of the media and into the pores will continue. After a quiescent period, effluent fluoride concentration from the bed, operated at the same hydraulic loading rate, will be lower. Diffusion along the media surface during the quiescent period makes more exchange sites immediately available when flow is restarted.
Intermittent flow and low flow rate may increase activated alumina fluoride removal capacity. However, this does not mean that the operation will be more cost effective.
The mechanism for regeneration with base and then neutralization with acid is the same as for fluoride sorption. The same limiting steps apply. Consequently, the more fluoride reduction capacity used, the more difficult the regeneration and neutralization will be. The additional chemical and labor costs required to achieve higher removal capacity may not be justified.
5

Figure 3. Activated alunina granules (80 microns per inch).
6

^
i
Figure 4. Activated alumina granules (8 microns per inch).
7

SECTION 2.
OBSERVATIONS AND CONCLUSIONS
1. Data accumulated under this study indicate that both central and point-of-use activated alumina treatment were effective in reducing fluoride levels in otherwise potable water.
2. The Gila Bend plant is an example of a well-controlled and documented small central treatment system.
3. For very small central systems such as Palo Verde, operator time is minimized by using higher than design flow rates and increased chemical strengths. High operator turnover rates underscore the problem of maintaining adequately trained or experienced operators on a part-time basis. These factors, combined with very low flow rates, contributed to increased production costs.
A. Activated alumina treatment, both central and point-of-use, increased aluminum levels in treated water.
5. Process control for central activated alumina treatment systems should be performed with equipment not subject to interferences from aluminum.
6. Point-of-use treatment for fluoride reduction offers a cost effective treatment alternative for small communities; the size of community for which point-of-use treatment may be cost effective depends on the source water quality and water consumption.
7. Monitoring of point-of-use devices, including sampling, field analysis, and/or meter reading, should be conducted by a management district at a frequency which assures that all devices are providing water in compliance with the fluoride MCL. When fluoride begins to appear in the treated water, the monitoring frequency should be increased, or the media exchanged.
8. Point-of-use activated alumina treatment also reduced arsenic and silicon levels.
9. Bacteriological quality of product water from point-of-use activated alumina devices was associated with the quality of the source water.
10. Variation of sampling techniques for collecting bacteriological samples from point-of-use devices significantly affected results. Sampling techniques should be consistently followed.
8

11. Flushing the tap before collecting a bacteriological sample from a point-of-use activated alumina device resulted in lower standard plate counts. The difference between flushed and unflushed results was more pronounced when chlorine was present in the influent.
12. Low-pressure point-of-use reverse osmosis treatment was effective in reduction of fluoride and total dissolved solids from a brackish groundwater supply.
13. Pressure loss through a low-pressure reverse osmosis prefilter assembly reduced permeate flux, resulting in a poorer quality product water.
14. Timely replacement of prefilters was necessary to assure efficient operation of the low-pressure point-of-use RO system.
15. Higher bacterial densities were observed in postdevice samples from the point-of-use reverse osmosis systems than the activated alumina devices.
16. Most standard plate count bacteria present in RO product water appeared to be associated with the final granular activated carbon polisher.
17. Point-of-use RO treatment is more economical than projected central treatment costs for a community of Emington's size.
9

SECTION 3.
PROJECT OBJECTIVE
The purpose of this study was to provide basic data and observations of two treatment approaches to fluoride reduction in drinking water supplies: central treatment and treatment of smaller volumes of water at the homeowner's tap (point-of-use treatment). The efficacy, costs, and relative advantages of each approach were compared in efforts to more clearly define the conditions (e.g. community size, raw water quality) where a community may choose one treatment approach over the other.
EFFICACY OF TREATMENT ALTERNATIVES
Central treatment has the advantage of control and optimization of unit processes. For example, pH adjustment may improve fluoride reduction capacity and reduce interferences from competing anions, but the extent to which pH adjustment should be used may be influenced by costs of necessary chemicals. For poor source water quality, some type of pretreatment may be necessary for activated alumina to be an acceptable fluoride reduction technique. In these cases, central treatment may be the only choice.
Point-of-use (POU) treatment has the advantages of relatively small capital investment, and the need to only treat that portion of water intended for drinking, potentially reducing treatment costs. The treatment scheme usually includes the installation of a third water tap at the kitchen sink, thereby treating only a fraction of the water used by a family.
Fluoride exchange capacity of the activated alumina will probably be less for POU treatment than for central treatment, as no provision for pH adjustment is normally employed on POU devices. The optimum pH for fluoride reduction is 5.5, but most natural waters are above pH 7. At a pH above seven, other anions (e.g. OH-) compete more effectively for adsorption sites on the alumina.
Onsite blending of treated water is generally not practiced in POU treatment, but is feasible. Without blending, optimum concentrations of fluoride in POU treated water are not always provided. The alumina must be regenerated when effluent fluoride concentration has reached the local MCL. Central treatment plants may use two or more activated alumina beds to treat the water. Treated water from the beds can be blended in proportions, yielding optimum concentrations of fluoride in the finished water and extending the useful capacity of each alumina bed.
10

POU treatment also has the disadvantage of being susceptible to bacterial contamination. If bacterially contaminated water passes through a treatment device, the activated alumina may provide a surface on which bacteria may grow. An isolated incidence of bacterial contamination might become a continuous bacterial contamination.
COST OP TREATMENT ALTERNATIVES
Central treatment capital costs are sensitive to prevailing interest rates when amortizing large capital investments. Chemical costs for pH adjustment and media regeneration may contribute significantly to operating costs, depending on source water quality and local prices.
The significance of labor costs depends on the portion of time labor must be dedicated to fluoride reduction. If fluoride reduction is essentially the only treatment necessary, the operating costs associated with fluoride reduction increase.
Central treatment has the advantage of optimizing the balance between treatment efficacy and treatment cost. Economy of scale provides a significant advantage for central treatment of large water supplies.
POU treatment costs are influenced by local regulations and codes regarding installation, servicing, and product water quality testing. Source water quality will influence the frequency and extent of water sampling and unit service. For communities in which several POU devices are used, costs may also be affected by selection and availability of management alternatives.
Because of the relatively small initial investment, costs for POU treatment are not affected significantly by interest rates in capital recovery analysis, unless a large quantity of devices is purchased under a credit plan. For central plants built under construction grants, interest rates are not a factor (except when performing capital recovery analysis for comparative purposes).
This study focused on fluoride reduction of drinking water in small communities. Communities in Arizona currently using activated alumina treatment at either a central plant or at the point-of-use were studied to obtain data on treatment efficiency and to compare costs. POU equipment and treatment management were provided for three small communities in Illinois, including one community which used POU reverse osmosis (RO) devices. Treatment efficiency and costs were monitored.
11

SECTION 4.
PROCEDURES
SITE SELECTION AND DESCRIPTIONS
Ten communities were selected as sites for project data collection, including two Arizona communities with operating central treatment plants, seven point-of-use sites in Arizona and Illinois, and a South Carolina community. Selection of sites was based on community interest, quality of source water, logistics for water sampling, and the approach to treatment (if any).
The central treatment plants, located at Gila Bend and Palo Verde, Arizona, provide a basis for comparison of two small but different size central facilities. The Gila Bend plant, designed by Frederick Rubel, Jr. Consulting Engineers (now Rubel & Hager, Inc.), has been on line since May 1978. The Palo Verde plant, designed by Water Treatment Engineers, has been operating since December 1979.
Selection of Arizona POU sites was coordinated through Water Treatment Engineers. Sites included the neighboring subdivisions of Thunderbird Farms and Papago Butte in Maricopa, the Ruth Fisher School near Tonopah, and the You and I Trailer Park near Wintersburg. These sites provide a comparison of single-family and institutional POU treatment applications.
The USEPA Region V office assisted in selection of point-of-use sites in Illinois, which included the villages of Parkersburg, Bureau Junction, and Emington. New equipment was installed and monitored in all three communities during the project. Data collected from these sites are results from the first applications of POU fluoride reduction on a community level in Illinois.
The community of North Myrtle Beach, South Carolina, was the site of a pilot demonstration, performed by Rubel & Hager, Inc., to estimate the costs of central treatment in this community. A site description of this community is included in the report by Rubel & Hager which appears as Appendix A.
Raw and treated water analyses are included as Appendix B.
Arizona Sites
Arizona sites include Gila Bend and Palo Verde (central treatment) and Thunderbird Farms, Papago Butte, the Ruth Fisher School, and the You and I Trailer Park (point-of-use treatment). These sites lie within a 75 mile radius of Phoenix; this area is a part of the Basin and Range Lowlands Province of the lower Colorado River region. The Basin and Range Lowlands
12

Province is characterized by isolated mountain ranges separated by broad alluvial basins. The mountains are composed of granite, gneiss, schist, quartzite, and volcanic rocks. Deposits from the neighboring mountain ranges and from volcanic activity were transported by streams to form the alluvial basins.
The ground water in the lower Colorado River region often contains naturally-occuring fluoride, often associated with volcanic rocks (e.g., rhyolite) and conglomerate of middle Tertiary age, and Precambrian schist. In Southern Arizona, large ground water fluoride concentrations appear to be associated with conglomerate (cemented, water-worn rock fragments), fanglomerate (coarse rock fragments only slightly worn), and silt, all from the middle Tertiary Age (approximately 35 million years ago) (9,23).
The MCL for fluoride, established by the USEPA in the NIPDWRs, is 1.4 mg/L for all Arizona sites.
Arizona Central Treatment Sites
Gila Bend
The Town of Gila Bend, located 65 miles southwest of Phoenix, served as an overland stage route in the late 1800's, and was eventually incorporated in 1962. Agriculture is the town's primary economic activity, and includes cotton, sugar beets, alfalfa, grain, melons, citrus fruits, and potatoes. Other activities include cattle, manufacturing, and lodging and food service. The town's population in 1978 was approximately 2400 (24).
The Town's public water system consists of a well (No. 4), storage tank, treatment plant and lined evaporation pond, and pressurization and distribution systems. The water temperature from Well No. 4 is approximately 108°F. The water is characterized by high dissolved solids (1250 mg/L) and high fluoride (5 mg/L). The well, which was drilled in 1976, is 1550 feet deep and is equipped with a steel casing. The well's discharge, measured in 1977, was 1007 gallons per minute at a total pumping lift of 186 feet. A 510 horsepower diesel motor supplies power to a line shaft turbine pump. The Town also has two standby wells, Numbers 1 and 3 (25,26).
The treatment system was designed by Frederick Rubel, Jr. Consulting Engineers, an engineering firm in Tucson experienced in central treatment technology for fluoride removal. Raw water is pumped through two 380 ft activated alumina treatment vessels. The effluent from both vessels is blended as it enters a ground level storage tank. The plant routinely treats 500,000 gallons per day (gpd); peak capacity is 1.3 million gallons per day (mgd).
The distribution system includes approximately 450 residential, 90 commercial, and 14 municipal service connections.
Palo Verde
The Palo Verde Inn and Trailer Park, located eight miles from Tonopah, Arizona, was built to accommodate workers at the Palo Verde nuclear power
13

plant construction site. The Inn has accommodations for 600 people, including a central office-recreational facility. The trailer park has lots for 103 mobile homes and 84 recreational vehicles.
The water system includes a ground water supply from two wells and dual pressurization and distribution systems. One well, drilled in 1978, is 535 feet deep and is equipped with an 8-inch casing and submersible pump. The second well is a converted 16" irrigation well that was redrilled to a depth of 500 feet and lined with an 8-inch casing (27). As with Gila Bend, the water is warm (105°F). Fluoride concentration averages 6.7 mg/L, and arsenic is present at an average concentration of 0.03 mg/L.
The dual water system includes a raw water storage tank which supplies both the treatment plant and the raw water pressurization system, a treated water storage tank and pressurization system, and a dual distribution system. Raw and treated water lines were installed simultaneously at the facility; a breakdown of relative costs of installing the two water lines can only be estimated.
Approximately six to nine percent of all water used at Palo Verde is treated, depending on the population distribution in the community. Treated water is supplied to the inn for kitchen cold water, drinking fountains, ice machines, and beverage vending machines. Mobile homes are supplied with both treated and raw water lines; recreational vehicles use treated water only. Population in the community normally ranges from 500 to 1000, although the recent population has dropped below 100.
The small central facility was designed by Robert Lake of Water Treatment Engineers, an engineering firm in Scottsdale experienced in small fluoride reduction systems, including P0U treatment devices. The Palo Verde treatment system uses three fiberglass-reinforced vinylester cylindrical vessels operated in parallel. Each vessel contains approximately 18 cubic feet of activated alumina. Three vessels are provided for flexibility of operation necessitated by a highly variable demand for water and minimal available operator hours. Sizing was also a factor in the selection of three vessels, as a larger vessel would have had to be constructed of steel, resulting in a higher capital cost.
Design flow for the plant was 30,000 gpd at a rate of 40 gallons per minute (gpm). Daily flow has averaged approximately 7000 gpd, although flow rates have been higher than 40 gpm to minimize required operator time.
Arizona Polnt-of-Oae Treatment Sites
The general raw water quality of the four Arizona point-of-use sites may be characterized as moderately mineralized (300-850 mg/L total dissolved solids). Dissolved silica and arsenic are present in each raw water. Arsenic is known to be adsorbed by activated alumina (28), and silica (Si02) is favorably adsorbed at a slightly alkaline pH (22), characteristic of many natural waters. Fluoride concentrations in the raw waters range from 2 to 16 mg/L.
14

Thunderbird Farms
The Thunderbird Farms subdivision is a community of approximately 600 people located in Maricopa, Arizona. The subdivision is served by one domestic water well and six irrigation wells. The domestic water well, completed in February 1981, is located within Township 5 South, Range 2 East, Section 24, NW 1/4 of the NW 1/4 of the SE 1/4 in Pinal County. Well depth is 750 feet; the depth to water was 622 feet when measured in 1981. The well has a 16 inch seamless steel casing for its entire depth (29).
The domestic water system includes the well, a 250,000 gallon storage tank, well and pressurization pumps, a 5000 gallon pressure tank, and a distribution system of PVC pipe.
In 1983 there were 235 lots at Thunderbird Farms with domestic water service hook-ups; each homeowner with an active water service has a POU defluoridation device. A typical home installation consists of a 1/2 cubic foot activated alumina cartridge, which is installed underground, at the property line, in a plastic meter box. Related appurtenances include inlet and outlet fittings, shut-off valve, sampling tap, potable water piping from the device to the house, and a separate drinking water tap for treated water. Installation of underground piping from the cartridge to the drinking water tap is the responsibility of the property owner. The Thunderbird Domestic Water Board provides installation, maintenance, and water sampling.
Three types of water are simultaneously distributed at Thunderbird Farms: irrigation water, domestic water, and treated (drinking) water. This particular application of POU treatment may be thought of as a "water service bypass" installation, because a separate line for drinking water is run from the service connection to the home.
Raw water fluoride concentration at Thunderbird Farms averages 2.6 mg/L. Eight POU cartridges were monitored during the project; product water meters were installed on treated water lines to measure treated water volume.
Papago Butte
The Papago Butte Ranches subdivision, a neighbor to Thunderbird Farms, is located approximately 8 miles southwest of Maricopa, Arizona. The community is served by two wells, which provide water for both domestic and irrigation use. The wells, completed in 1964, are each approximately 900 feet deep with a 20 inch steel casing running the entire depth. Maximum pump capacity at each well is 1800 gpm, and the depth to water is approximately 680 feet below ground surface. The wells are located within Township 5 South, Range 2 East, Section 24, SW 1/4 of the SW 1/4 of the NE 1/4 and Township 5 South, Range 3 East, Section 19, SW 1/4 of the SW 1/4 of the SW 1/4, both in Pinal County. The two wells together irrigate approximately 600 acres (30).
A group of eight "mini-systems", or laterals, provides domestic water to the homes in the subdivision, which are often separated by large distances. Lateral components include a pump and motor, pressurized storage tank, water meter, and a group of one cubic foot activated alumina devices connected in a
15

manifold assembly and housed in a small shed. Irrigation water is tapped and pressurized for a domestic water supply. A portion of the domestic water is bypassed, treated with activated alumina, and distributed to the property lines. Homeowners are responsible for hook-ups from the property line to the home.
There are approximately 40 families currently residing at Papago Butte. Eight laterals have been constructed to serve the 180 lots making up the subdivision.
Raw water fluoride concentration at Papago Butte averages 2.6 rag/L. A water meter was installed at Lateral 8 in the subdivision, and only one activated alumina cartridge (1 cu. ft.) was used at the lateral during the study period.
Ruth Fisher School
The Ruth Fisher School, an elementary school of approximately 200 students, is located near Tonopah, Arizona. A large, new building was recently constructed at the School, and approximately half of the students now attend the new facility. The old school, in which children up through fourth grade now attend, has been served by a well which was drilled in 1964. An eight inch steel casing extends to 450 feet below ground surface; the well is open for an additional 50 feet. Depth from ground to water surface is 180 feet, and the maximum pump capacity is 65 gpra. The well is located in Township 2 North, Range 6 West, Section 28, NW 1/4 of the NE 1/4 of the NE 1/4 in Maricopa County (31). The well yields water containing fluoride at an average concentration of 4.4 mg/L. All testing at Ruth Fisher School was done on POU devices in use at the old school.
Two activated alumina cartridges serve four drinking fountains at the old school; one cartridge is a standard 1/2 cu. ft. home size, and the other is slightly smaller. Each cartridge serves two drinking fountains, which are heavily used for brief, intermittant periods of time. A water meter was placed on the product water line from the 1/2 cu. ft. cartridge for the project.
Two new wells were constructed at the school in 1981, and provide water to the new, larger facility. Three one-cubic foot activated alumina cartridges installed in parallel provide treated water to the new facility.
Tou and I Trailer Park.
The You and I Trailer Park, located approximately one mile south of Wintersburg, Arizona, has spaces for 19 mobile homes. A 400 foot well, supported by a six inch casing inside an eight inch casing, uses a submersible pump to provide water for the park (27). The raw water fluoride concentration is extremely high, approximately 16 mg/L. Arsenic is also present in excess of the MCL at an average concentration of 0.086 mg/L.
A one cubic foot activated alumina device was installed at the park in March 1983 and equipped with a product water meter. Sixteen people resided at the trailer park during the study period.
16

Illinois Sites
All three Illinois communities studied during the project were POU treatment sites; these include Parkersburg, Bureau Junction, and Emington. Activated alumina devices were installed and monitored in Parkersburg and Bureau Junction. An accelerated demonstration of POU activated alumina efficacy was performed in Emington, but no additional activated alumina devices were installed. Point-of-use reverse osmosis devices .were installed in Emington at a later date. Equipment purchase, installation, and monitoring were paid for by the EPA.
The groundwater in these Illinois communities may be characterized as extremely mineralized (1600-2500 mg/L total dissolved solids) with high sodium and chloride, highly buffered (500-1000 mg/L alkalinity as CaC03), and soft, with some dissolved trace metals.
The geologic formations at all three communities include bedrock from the Pennsylvania age (280-320 million years ago), which contains one to two percent coal in its upper deposits. Pennsylvanian rock may include sandstone, limestone, dolomite (harder limestone with more magnesium), and shale. The groundwater is generally more brackish as wells must penetrate deeper into bedrock (32).
Parkersburg
The community of Parkersburg, located in Richland County, is a village of about 300 people. The village is served by two wells, drilled in 1956, which are rated at 40 gpm each. The location of Well No. 1 is 250 feet east, 1700 feet north of the southwest corner of Section 24, Township 2 North, Range 10 East in Richland County. Well No. 2 is 143 feet northeast of Well No. 1; both wells are located near the Parkersburg Town Hall. The wells are approximately 300 feet deep and lined with seven inch casings. Depth to water surface during production tests in 1956 was approximately 60 feet (33).
The water system includes a 40,000 gallon elevated storage tank and a distribution system of 105 service connections. Gas chlorination is provided.
The fluoride MCL for Parkersburg is 1.8 mg/L. Raw water fluoride concentration averages 6.6 mg/L. Because of the brackish taste of the village water, many residents haul their drinking water or draw water from a shallow dug well. The village water is high in alkalinity (1000 rag/L as CaC03), soft (8 mg/L hardness as CaC03) and brackish (650 mg/L sodium). Trihaloraethanes, most notably bromoform, have been detected in the village water at trace levels (34). The community is located in an area where many small oil wells are operating.
Ten activated alumina defluoridation devices were installed in Parkersburg and monitored under the project.
Bureau Junction
The Village of Bureau Junction is located in Bureau County and has a
17

population of approximately 450. The village's public water supply was installed in 1899. Only one well, Well No. 4, is currently in use. The well, completed in 1946, is a flowing artesian well, and produced 134 to 230 gpm when production was tested shortly after completion. The well is located approximately 750 feet south and 1100 feet east of the northwest corner of Section 17, Township 15 North, Range 10 East in Bureau County. Well depth is 336 feet; the first 115 feet is composed of Pleistocene Series till, gravel, sand, and clay, followed by 134 feet of Pennsylvanian shale, siltstone, sandstone, and coal deposits, and ending with 87 feet of Niagaran dolomite of the Silurian System (35). The well is lined with a 13 inch pipe from ground surface to a depth of 155 feet and an 8 inch pipe, cemented inside the larger pipe, from ground surface to 254 feet.
The water system includes a 80 gpm booster pump which discharges into the distribution system and a small pressure storage tank with a 80 gpm booster pump for the higher elevations. The distribution system services 147 connections, approximately half of which are metered. Average pumpage is approximately 46,000 gpd. The water was not chlorinated during the study period.
Bureau Junction was recently awarded a Housing and Urban Development grant for water system improvements, as water losses were high. The grant included funds for installation of new water mains, well pump, 320,000 gallon stand-pipe, hydrants, water meters and conservation devices, and some housing improvements.
The raw water in Bureau is lower in alkalinity (540 mg/L as CaCOs) than Parkersburg's, but total dissolved solids is higher (2200 mg/L). Hardness is approximately 50 mg/L as CaC03, and the water is brackish (770 mg/L sodium). Trace metals include iron (0.23 mg/L), aluminum (0.11 mg/L), and zinc (0.03 mg/L). Approximately 3 mg/L of silicon are present. Raw water fluoride concentration has ranged from 5.2 to 6.6 mg/L during the study period.
Forty activated alumina devices were installed and monitored in Bureau Junction during the project.
Emington
The Village of Emington is served by one well which provides water to 120 residents through 63 service connections. The well is located approximately 1760 feet North and 545 feet West of the Southeast corner of Section 24, Township 29 North, Range 7 East in Livingston county. The well was completed in July 1971 to a depth of 550 feet; yellow and gray clay were encountered to a depth of 175 feet, followed by gray and black shale (to 300 feet), brown sandstone (to 328 feet), coal (to 332 feet), gray shale (to 390 feet), light to dark gray limestone (to 544 feet), red shale with limestone (to 546 feet), and water-bearing gray limestone (to 550 feet). The well is cased with an 8-inch pipe to 396 feet.
A well production test was conducted on July 9, 1971; drawdown was 70 feet from the original depth to water surface (176 feet) after three hours of pumping at 30 gpm. Full recovery was observed within two minutes after pumping was stopped. Estimated production was 43,200 gpd (30 gpm) based on these data (36).
18

Water system components include a 10-Hp electric motor and a 4-inch submersible pump rated at 30 gpm and placed at 396 feet, with a 4-inch pipe providing water to the surface. A 12,000 gallon pressurized storage tank supplies water to the distribution system. In 1982 the average and maximum pumping rates were 7,000 and 11,000 gpd, respectively. Disinfection is provided with hypochlorite solution.
The village does not have a sanitary sewer system; residents use individual septic tanks and drain fields.
Emington's well water averages 4.5 mg/1 fluoride. The well water is extremely mineralized (2530 mg/L TDS), highly buffered (875 mg/L alkalinity as CaC03) and brackish (930 mg/L sodium, 860 mg/L chloride).
A pilot demonstration using Emington water was performed with a 1/2 ft3 P0U activated alumina device in December 1981; results are included in the text. Community residents elected not to participate in the activated alumina demonstration, mainly because the devices did not impart an improvement in the water's taste. In October 1983 point-of-use reverse osmosis devices were installed in 47 homes in Emington for a demonstration of fluoride removal efficacy.
DATA COLLECTION PROCEDURES
Sample collectors were selected and trained by NSF staff. Water samples were collected in 16 ounce, linear polyethylene bottles and shipped to the National Sanitation Foundation via United Parcel Service. Bottles were shipped in individual styrefoam mailers or insulated cartons with freezer packs. Sample types included grab samples of raw, treated, and blended water and grab and composite samples of regeneration wastewater from the central plants. Sampling and preservation procedures were in accordance with Methods for Chemical Analysis of Water and Wastes, USEPA-600/4-79-020, March 1979.
Water samples for bacteriological analysis were collected and transported to local independent laboratories by the sample collector. Laboratories selected were certified for drinking water analysis. Samples were analyzed for total coliform and standard plate count. Standard bacteriological samples were collected and transported in accordance with Standard Methods for Examination of Water and Wastewater, 15th edition, 1980. Special bacteriological samples included collection from unflushed, undisinfected taps.
Cost data for the Gila Bend plant were obtained from Town records. Water Treatment Engineers, Scottsdale, Arizona, supplied cost data for the Palo Verde plant and for Arizona POU communities. Costs for POU treatment in the Illinois communities were actual costs during the project. When specific costs were unavailable, estimates were derived from assumptions which are presented in the text.
HATER ANALYSES PERFORMED
All analytical methods used were in accordance with Methods for Chemical Analysis of Water and Wastes, USEPA-600/4-79-020, March 1979, or Standard
19
Methods for the Examination of Water and Wastewater, 15th edition, 1980, with the exception of one silicon method, which follows the procedures outlined in Analytical Methods for Atomic Absorption Spectrophotometry, Perkin-Elmer, Inc., 1982.
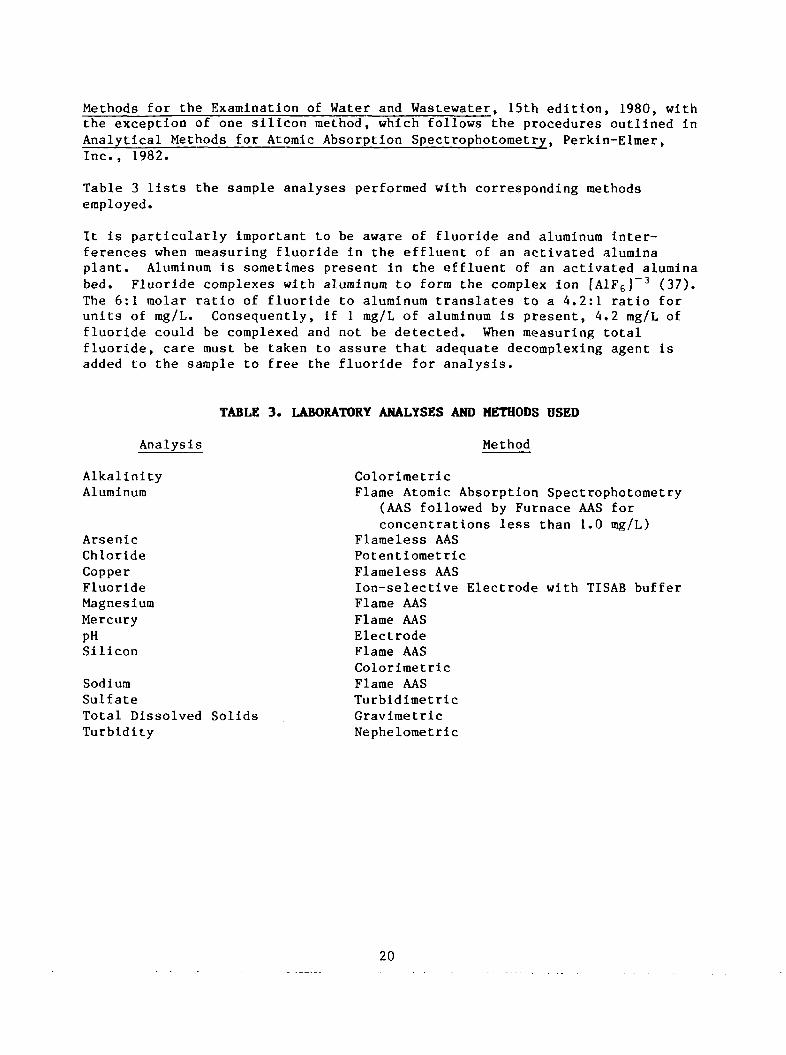
Table 3 lists the sample analyses performed with corresponding methods employed.
It is particularly important ferences when measuring fluo plant. Aluminum is sometime bed. Fluoride complexes wit The 6:1 molar ratio of fluor units of rag/L. Consequently fluoride could be complexed fluoride, care must be taken added to the sample to free
to be aware of ride in the effl s present in the h aluminum to fo ide to aluminum , if 1 mg/L of a and not be detec to assure that the fluoride for
fluoride and aluminum inter-uent of an activated alumina effluent of an activated alumina rm the complex ion [A1F6]
-3 (37). translates to a 4.2:1 ratio for luminum is present, 4.2 mg/L of ted. When measuring total adequate decomplexing agent is analysis.
TABLE 3. LABORATORY ANALYSES AND METHODS USED
Analysis
Alkalinity Aluminum
Arsenic Chloride Copper Fluoride Magnesium Mercury PH Silicon
Sodium Sulfate Total Dissolved Solids Turbidity
Method
Colorimetric Flame Atomic Absorption Spectrophotometry
(AAS followed by Furnace AAS for concentrations less than 1.0 mg/L)
Flaraeless AAS Potentioraetric Flameless AAS Ion-selective Electrode with TISAB buffer Flame AAS Flame AAS Electrode Flame AAS Colorimetric Flame AAS Turbidimetric Gravimetric Nephelometric
20

SECTION 5.
EFFICACY OF CENTRAL TREATMENT
GILA BEND, ARIZONA
Fluoride removal for the municipal water system of Gila Bend, Arizona is accomplished with a central treatment system capable of treating up to 1.3 million gallons per day (mgd). Several treatment runs were evaluated during the study period with grab sampling and analysis of product water and evaluation of operator's records. A treatment efficacy summary, a section on media attrition, and results of wastewater analyses follow the process description and control sections.
Raw water fluoride concentration was 5.0 mg/L; arsenic concentration was 0.015 mg/L, and silicon concentration was 13 mg/L. More complete data summaries are presented in Appendix B.
Process Description
The Gila Bend plant removes excess raw water fluoride with two treatment vessels containing F-l activated alumina, 28-48 mesh. The vessels, which operate in parallel, are rubber-lined steel tanks, each containing approximately 380 ft when full. The principal removal process is exchange/ adsorption.
Raw water is pumped from the well and pretreated with sulfuric acid (66° Baume) to lower pH to 5.5. Water is then pumped through the tanks in a downflow mode at rates up to 450 gpra (5.7 gpm/ft2), for a total maximum plant capacity of 1.3 mgd. (Average flow rate during the study period was 464,000 gpd.) Treated water pH is increased to a level suitable for drinking by injection of sodium hydroxide solution.
Treatment runs last approximately 3.5 million gallons (1230 bed volumes). When fluoride breaks through the bed, the media is chemically regenerated. Media regenerations for the two vessels are staggered so that when one bed is approaching breakthrough, the other is beginning a treatment run. In this way product water form both vessels can be blended to provide an optimal fluoride level in finished water, while extending the treatment cycle.
The regeneration process begins with draining the bed before backwash. As the tank fills with backwash water, the media is surged to break up any channels or lumps formed during treatment. Backwash lasts for 30 to 45 minutes at 400-500 gpm (5.1-6.4 gpm/ft2), and washes (suspended) alumina fines and iron deposits from the bed.
21

Upflow regeneration with 50 percent (by weight) liquid caustic solution is then performed for 33 minutes. Caustic solution is routinely pumped at 1.9 gpm and diluted in-line with raw water before contacting the media. The raw water pumping rate determines the actual caustic solution concentration, which usually ranges between 0.8 and 1.0 percent by weight. Approximately 398 pounds of sodium hydroxide (dry weight) contact the media during each upflow regeneration.
A series of two upflow raw water rinses follows. Rinse A (200 gpm, 2.5 gpm/ft ) is designed to remove caustic solution from the bed. Rinse B (400 gpm, 5.1 gpm/ft ) washes desorbed ions, such as fluoride and sulfate, from the bed. Upflow rinse B, which lasts approximately 90 minutes, accounts for the largest mass of dissolved aluminum in regeneration wastewater.
The tank, is drained before downflow regeneration, which is performed in the same sequence as upflow regeneration, excepting the direction of flow.
Bed neutralization is carried out with 66° Baume sulfuric acid. Raw water pH is lowered to 2.5 and passed through the bed at about 370 gpm (4.7 gpm/ft2) for several hours. When effluent pH falls to approximately 9.6, the next treatment run begins as bed effluent (now product water) is pumped to storage. Effluent pH usually levels off at 5.8 during the treatment cycle, while raw (influent) water pH is increased in steps from 2.5 to 5.5.
Total water used in a regeneration cycle is approximately 165,000 gallons (58 bed volumes). Regeneration wastewater, including backwash water, is discharged to a lined evaporation pond.
Chemical storage and feed systems and a pH control system are necessary for safe, efficient operation. Sulfuric acid and caustic solution are stored behind the plant building in 6000 gallon steel tanks, which gravity-feed respective 100 gallon tanks inside. A diaphragm pump feeds acid to the influent pipe of each vessel, supplying acid for both raw water pH adjustment and media neutralization. The caustic tank supplies two pumps; a smaller pump feeds caustic to the effluent main for treated water pH adjustment. A larger pump propels caustic to the influent pipe of either vessel for media regeneration. Three pH probes and analyzers are used to control system pH. Two probes are used in conjunction with a sampling manifold to determine pH of either vessel's influent or effluent. The third probe analyzes the pH of final (pH adjusted) effluent. If product water pH falls below 6.5 or rises above 9.0, an alarm sounds and power to the well pump is shut off (25).
A schematic of the treatment process appears in Figure 5.
Process Control
Run length is determined by the plant operator, who regenerates the media when treated water fluoride levels (before blending) reach approximately 2.3 mg/L. Fluoride analysis is performed onsite with an ion-selective electrode in conjunction with a specific ion meter. This equipment was installed during the study (October 1982), after discrepancies were noted between onsite and laboratory fluoride results. The operator had been using the colorimetric
22

Vent
8E
«_L 1 1 Treated Water To
pH [ f~* Indicator A Alarm NSORi J -.AUTOMATIC
-i Future Conn.
AUTOMATIC, - VENT
• Backwaen W u t t w i l i r Raganaratlon Waatawatar
7 LINED EVAPORATION POND
Reprinted from "Design Manual: Removal of Fluoride from Drinking Water Supplies by Activated Alumina"; EPA-600/2-84-134,
Figure 5. Flow schematic, Gila Bend treatment plant.
23

SPADNS method for fluoride analysis. The colorimetric method is subject to several interferences, including aluminum, which forms complexes with fluoride ions. Complexed fluoride is generally not detected in a colorimetric analysis without sample distillation. Consequently, more fluoride was present in product water than the operator was aware of. Addition of TISAB solution in the electrode method decomplexes fluoride in aluminum concentrations up to 3 rag/L. (A previous investigation has concluded that the aluminum-fluoride complex is more readily incorporated into tooth enamel than the free fluoride form (37)).
Treatment runs have been shorter since fluoride electrode use began, although more consistent in length. Table 4 summarizes treatment run lengths before and after the electrode and ion meter were put in use. Shorter treatment cycles increase the frequency of media regeneration, resulting in increased operating costs. However, shorter, more consistent run lengths do not carry the media past exhaustion, which may reduce media degradation from increased chemical exposure during longer regeneration and neutralization cycles.
Efficacy
Fluoride reduction at the Gila Bend plant is performed efficiently with a well-controlled and documented operation. Ten treatment runs were monitored during the study period with grab sampling and laboratory analysis of product water. Table 5 presents a chronological summary of monitored runs, including plant run numbers, dates, and average daily flows. Fluoride breakthrough curves for these runs are depicted in Figure 6 (vessel 1) and Figure 7 (vessel 2). Treatment run volumes ranged between 2.6 and 3.9 million gallons.
Indicators of treatment efficacy include run length, average effluent fluoride concentration, media fluoride exchange capacity, average fluoride removal, and efficiency of chemical use. Generally, the longer treatment runs are more efficient because more mass of fluoride is removed for the same cost of regeneration. For routine operations, the quantity of caustic used for regeneration is fixed in excess of stoichiometric requirements. Consequently, the regeneration costs are not directly proportional to mass of fluoride removed. The average effluent fluoride concentration indicates the product water quality, hence the degree of treatment effectiveness. Exchange capacity combines the cumulative volume and effluent fluoride concentration to give mass of fluoride removed per volume of media, but is subject to some uncertainty because media volumes are not recorded for every treatment run. Average fluoride removal is the mass removed per volume of treated water. These indicators of treatment efficacy were compared for the monitored runs.
Fluoride reduction is a unique situation in water treatment, because an optimal fluoride concentration is desired in product water. Better economics may be realized with a lower average fluoride removal and longer treatment run. This may be effected by higher hydraulic loading rates.
24

TABLE 4. TREATMENT RON VOLUMES - GILA BEND
Cumulative Volume (million gallons)
Standard Percent Average Deviation Maximum Waste1
Vessel 1 Runs 1-95 (before electrode) 3.78 0.86 5.50 4.6%
Runs 96-125 (after electrode) 3.42 0.39 4.30 4.9%
Vessel 2 Runs 1-91 (before electrode) 3.90 0.61 5.33 4.6%
Runs 92-121 (after electrode) 3.32 0.46 4.19 5.1%
Percent waste = Regeneration volume ,__ — x 100
Regeneration + treated volume
TABLE 5. MONITORED TREATMENT RON CHRONOLOGY - GILA BEND
Average Flow Duration
Vessel 1
Vessel 2
Run Number*
83 89 116 117 122 123 124 125
79 118
Date
April 15-27 (1982) July 7-20 Aug. 25-Sept. 6 (1983) Sept. 6-19 Nov. 22-Dec. 15 Dec. 15-Jan. 5 (1984) Jan. 5-26 Jan. 26-Feb. 14
April 8-20 (1982) Nov. 17-Dec. 8 (1983)
(1000 gpd)
236 310 272 226 155 163 158 205
215 135
(days)
12 13 12 13 23 21 21 19
12 21
*Taken from plant records.
25

• Fluoride
* p H
E
o
2 -
1 -
Run 8 3
* # * * * *
-10
. 8
• 6
4
V CO
c a> E m
I a
o 3
3-
2 -
1 -
Run 8 9
10
6 _ o
4 £
Cumulative Volume (million gallons) Cumulative Volume (million gallons)
B
6 3
3-
2 -
1 -
Bun 1 1 6
-10
- 4
c 0)
E
6 L o I
E
•o
o 3
3-
2 -
Run 1 1 7
•
T 1
•
•
* •
• 1 2
•
•
*
i 3
« •
• i
4
: 10
8
b
4
Tre
atm
en
t B
ed
"o X a
Cumulative Volume (million gallons) Cumulative Volume (million gallons)
Figure 6. Product water fluoride versus volume treated, Gila Bend, vessel 1.

E
•o O 3
Run 1 2 2
3 -
2 -
1 -
Cumulative Volume (million gallons)
-10
- 4
T3 0)
m «-» c <D
E
6 L o x a.
©
5 3
2 -
1 -
Run 12 3
Cumulative Volume (million gallons)
HO
8
6
h 4
•o 0)
CO
c
E
o I a
K3
O)
E. o
O 3
2 -
1 -
Run 1 24
Cumulative Volume (million gallons)
- 1 0
. 8
• 6
- 4
•o
CD
0) E
en E a>
T3
o _2
X Q.
1-
Run 1 2 5
Cumulative Volume (million gallons)
Figure 6. (continued). Product water fluoride versus volume treated, Gila Bend, vessel 1.
-10
8
6
- 4
•a
GO *-» c 0)
E
X a.

• Fluor ide
* p H
Run 7 9
0)
O 3
• 10
. 8
• 6
4
"O IS
CO
c
E (D 0)
I Q .
CD
E o
o
2 -
1 -
Cumulative Volume (million gallons)
Run 1 1 8
10
•o a>
m c
E <S 0)
6 I*. o
4 x
Cumulative Volume (million gallons)
Figure 7. Product water fluoride versus volume treated,
Gila Bend, vessel 2.
28

Table 6 presents a summary of monitored treatment run efficacy; included are the total volume treated, flow rate, average effluent fluoride concentration, exchange capacity, and average fluoride removal. Runs are presented in chronological order for each vessel, using plant run numbers. The average effluent fluoride concentration represents the area under the breakthrough curve divided by the total run volume. Exchange capacities ranged between 1840-2600 grains/ft . Capacities were calculated by estimating media volumes.
TABLE 6. TREATMENT EFFICACY SUMMARY - GILA BEND
Vessel 1
Vessel 2
Run Number
83 89 116 117 122 123 124 125
79 118
Total Volume (106 gal)
2.83 3.91 3.27 3.46 3.57 3.42 3.32 3.69
2.58 3.23
Average Flow Rate (gpm)
320 365 270 310 320 290 280 330
290 295
Average Effluent Fluoride (mg/L)
1.41 1. 11 1.11 1.16 0.96 1.10 1.00 1.14
1.21 0.65
Exchange Capacity
(grains/ft3)
1840 2600 2090 2230 2250 2120 2140 2340
2000 2170
Average Fluoride Removal
(gm/1000 gal)
13.59 14.72 14.72 14.53 15.29 14.76 15.14 14.61
14.35 16.46
Some of the variables which affect include influent pH, media volume The first runs monitored from each (vessel 2), demonstrated the lowes Prior to these runs, the beds had respectively, the longest sequence cycles performed without media rep 83 and 79 were 322 ft3 and 286 ft3
performed before treatment was con this time media was replaced infre treatment run volumes sometimes ex
run length and product water quality and age, and the regeneration procedure. vessel, run 83 (vessel 1) and run 79 t exchange capacities of monitored runs, been regenerated 18 and 17 times, s of consecutive treatment-regeneration lacement. Estimated media volumes for runs , respectively. These two runs were trolled with the fluoride electrode. During quently and operator records showed ceeded five million gallons.
Table 7 presents media volume estimates for monitored runs. Media volume is calculated from bed depth measurements performed once every several treatment runs. An average attrition rate per volume treated was calculated, based on total volume treated between depth measurements. Included in Table 7 are the consecutive number of regenerations performed since replacement alumina was last added, and the flow rate per cubic foot of media. Data collected indicated a trend to higher exchange capacity with increasing hydraulic loading in the narrow range observed (0.76 - 1.07 gpm/ft3), but were not sufficient to be conclusive.
29

TABLE 7. ESTIMATED MEDIA VOLUMES - GILA BEND
Vessel 1
Vessel 2
RUN
83 89* 116 117 122 123 124 125
79 118
ESTIMATED MEDIA VOL. (ft3)
321 343 355 348 374 367 362 357
286 378
NUMBER OF REGENERATIONS SINCE ADDITION
18 5 4 5 1 2 3 4
17 0
HYDRAULIC LOADING (gpm/ft3)
0.99 1.07 0.76 0.89 0.86 0.79 0.77 0.93
1.01 0.78
EXCHANGE CAPCITY
(grains/ft3)
1840 2600 2090 2230 2250 2120 2140 2340
2000 2170
*Highest exchange capacity
Media volume and age effects are illustrated in Figures 8 and 9. Figure 8 presents cumulative run volume versus media volume. Figure 9 shows exchange capacity plotted against the number of regenerations performed since an addition of replacement media. (Points representing monitored, consecutive treatment runs are connected in Figure 9.) It appears that fresh media performs more effectively after several regenerations than when first added, but the benefit is lost as media volume is depleted.
The plant operator keeps logs of each treatment run; records include meter readings and times for all regeneration phases, product water fluoride levels and meter readings, effluent pH, and feed water pH. These records were reviewed to obtain caustic solution concentrations for regeneration, sulfuric acid consumption for neutralization and raw water pH adjustment, and hours spent for each regeneration preceeding monitored runs. Chemical use data for monitored treatment runs appear in Table 8; included is the cumulative volume treated before effluent pH dropped to 5.8.
During operation, neutralization is considered complete when effluent pH drops to 9.6 and water is routed to storage. However, effective bed neutralization is not complete until effluent pH stabilizes at 5.8. At this pH, influent and effluent pH are essentially equal.
30

0)
E _3 o >
<r 0)
E o
3-
— I —
10
Estimated Media Volume (m3)
Figure 8 . Treatment run volume versus media volume, Gila Bend.
6000
E 1/5 E CO
-C
5000
4000 1 , , ,
5 10 15 20
Number of regenerations since media addition
Figure 9. Exchange capacity versus number of runs since media addition, Gila Bend.
31

TABLE 8. CHEMICAL USE SUMMARY - GILA BEND
Vessel 1
Vessel 2
Average
Run Number
83 89 116 117 122 123 124 125
79 118
Regeneration Caustic
Upflow
0.88 0.84 0.92 0.92 0.84 0.88 0.88 0.81
1.02 0.99
(% wt)
Downflow
1.02 1.06 0.92 0.92 0.85 0.88 0.92 0.90
1.08 0.97
Sulfurii Consumptii
Neutralization
158 170 160 166 165 132 156 145
154 128
c Acid an (lbs)*
pH Adjust
224 241 184 161 138 122 182 136
193 212
Volume to Attain pH 5.8
(106 gal)
1.25 1.81 1.28 1.47 0.98 0.95 1.12 1.07
1.35 1.52
0.90 0.95 153 179 1.28
*Pounds of 100% acid
Efficiency in terms of chemical consumption is summarized in Table 9, where caustic and acid use are presented as pounds consumed per million gallons of treated water. Runs with higher exchange capacities generally demonstrated more efficient chemical use, as records show the mass of regenerant used per run to be constant. Runs 83 and 79, the least effective runs, consumed the most chemicals per volume treated.
Data from Table 9, together with records of regeneration labor, were used to estimate regeneration costs for monitored runs. These average costs include sodium hydroxide for regeneration ($0,166 per pound dry weight), sulfuric acid for neutralization and pH adjustment ($0,012 per pound), and operator labor spent on regenerating the beds ($8.02 per hour, including fringe). Chemical costs represent average unit prices. Hourly labor costs were based on half-time status of the operator, but only included time spent during regeneration (actual hours spent on routine daily treatment were unavailable). Chemical and regeneration labor costs were divided by total run volume to give an average regeneration cost per 1000 gallons treated. These costs are presented against total run volume, exchange capacity, and estimated media volume in Figures 10 through 12, respectively. The first runs monitored, runs 83 and in 79, appear as outlying points in all three figures. As expected, the more efficient runs, which generally treated the largest cumulative volumes, were also more economical.
32
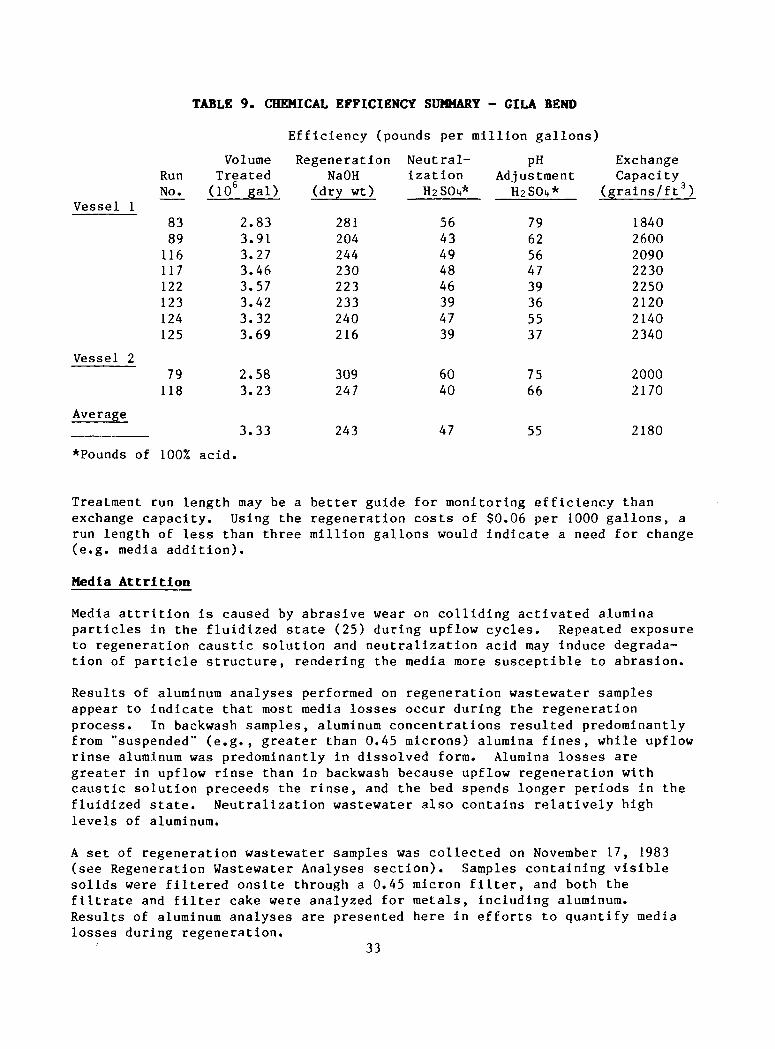
TABLE 9. CHEMICAL EFFICIENCY SUMMARY - GILA BEND
Efficiency (pounds per million gallons)
Vessel 1
Vessel 2
Average
Run No.
83 89 116 117 122 123 124 125
79 118
Volume Treated (106 gal)
2.83 3.91 3.27 3.46 3.57 3.42 3.32 3.69
2.58 3.23
3.33
Regeneration NaOH
(dry wt)
281 204 244 230 223 233 240 216
309 247
243
Neutralization
H2SO14*
56 43 49 48 46 39 47 39
60 40
47
Adj H
pH ustment 2SO4*
79 62 56 47 39 36 55 37
75 66
55
Exchange Capacity
(grains/ft3)
1840 2600 2090 2230 2250 2120 2140 2340
2000 2170
2180
*Pounds of 100% acid.
Treatment run length may be a better guide for monitoring efficiency than exchange capacity. Using the regeneration costs of $0.06 per 1000 gallons, a run length of less than three million gallons would indicate a need for change (e.g. media addition).
Media Attrition
Media attrition is caused by abrasive wear on colliding activated alumina particles in the fluidized state (25) during upflow cycles. Repeated exposure to regeneration caustic solution and neutralization acid may induce degradation of particle structure, rendering the media more susceptible to abrasion.
Results of aluminum analyses performed on regeneration wastewater samples appear to indicate that most media losses occur during the regeneration process. In backwash samples, aluminum concentrations resulted predominantly from "suspended" (e.g., greater than 0.45 microns) alumina fines, while upflow rinse aluminum was predominantly in dissolved form. Alumina losses are greater in upflow rinse than in backwash because upflow regeneration with caustic solution preceeds the rinse, and the bed spends longer periods in the fluidized state. Neutralization wastewater also contains relatively high levels of aluminum.
A set of regeneration wastewater samples was collected on November 17, 1983 (see Regeneration Wastewater Analyses section). Samples containing visible solids were filtered onsite through a 0.45 micron filter, and both the filtrate and filter cake were analyzed for metals, including aluminum. Results of aluminum analyses are presented here in efforts to quantify media losses during regeneration.
33

I . I 5 o o c o
c V en 0}
Cumulative Volume Treated (million gallons)
Figure 10. Regeneration costs versus treatment run volume, Gila Bend.
I § 5 o u c o
c 0) 0)
Exchange Capacity (grams/m3)
Figure 11. Regeneration cos t s versus exchange capacity , Gila Bend.
34

o o o
o c_> c o
0)
c 01 O)
cc • •
a 10
Estimated Media Vo lume (m3)
Figure 12. Regeneration costs versus media volume, Gila Bend.
Aluminum results from backwash and upflow rinse samples are depicted in Figures 13 and 14, respectively. As can be seen from the figures, aluminum in backwash water was almost entirely alumina fines, while upflow rinse samples contained mostly dissolved aluminum.
Replacement media (2700 pounds) was added to the vessel (No. 2) during the November 17 regeneration after downflow regeneration and before neutralization. After media addition, the bed was backwashed for approximately 90 minutes to remove alumina fines from the new media. Results of aluminum analyses from the new media backwash appear in Figure 15, and indicate that aluminum was predominantly in dissolved form. Aluminum concentrations were more than two times greater than during backwash of the old media. The high concentration of dissolved aluminum in the new media backwash was probably caused by regenerant which was also flushed from the bed. Media depth measurements made before and after backwashing indicated that approximately 300 pounds of alumina were washed out of the bed, representing 11 percent of the added media.
Neutralization wastewater typically contains high aluminum levels. On November 17, neutralization feed water pH was higher than routine (pH 3.2 as opposed to pH 2.5) to save wear on the new alumina. Effluent pH did not rise
35

180
160-
140-
120-1
O) 100" £
E C
£ 80-|
< 60
4 0 -
2 0 -
o Total Al • Dissolved Al
10
Cumulative Volume (1000 gallons)
Figure 13. Aluminum versus backwash volume,
Gila Bend.
!
Alu
min
um
600-
500
400-
300-
200-
100-
IUt_
o
•
o
•
o
•
I
o
•
0
• 0
•
o
• s
T
o Total Al • Dissolved Al
' ' . r- i
5 10 15 20 25
Cumulative Volume (1000 gallons)
Figure 14. Aluminum versus upflow rinse volume,
Gila Bend.
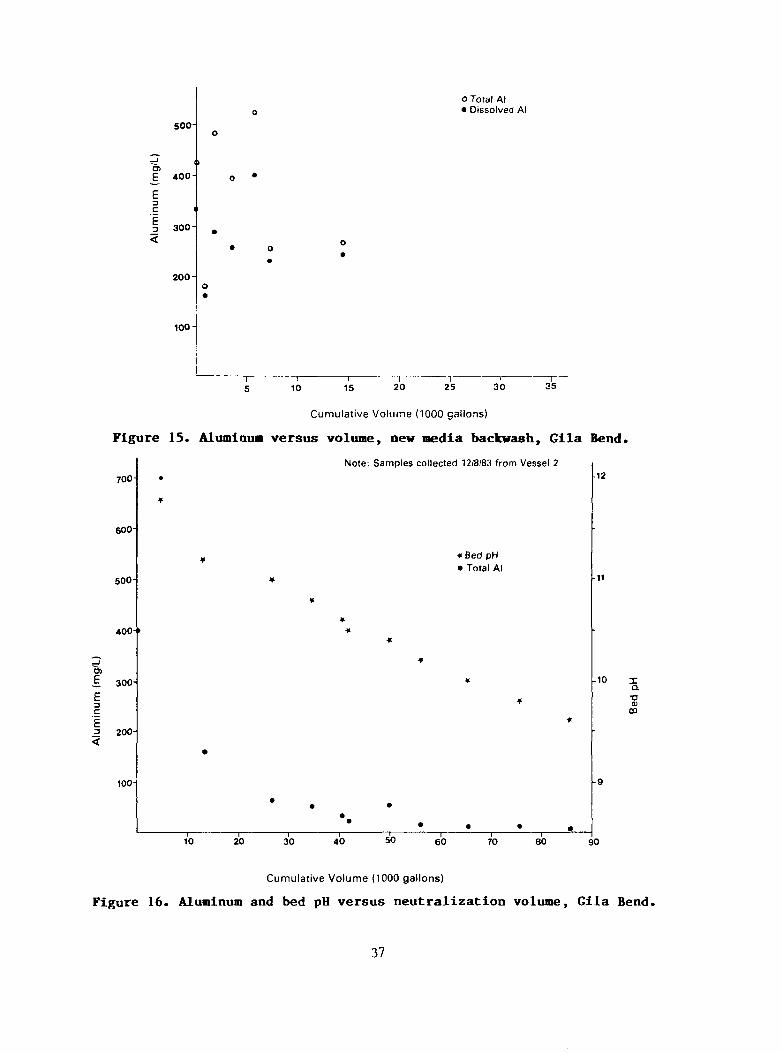
soo-
O)
_£ 400
£ 3 C
J 300 <
200
100
o Total Al • Dissolved Al
— I — 2 0 25 —r~
35 10 15 20 25 30
Cumulative Volume (1000 gallons)
Figure 15. Alumimia v e r s u s volume, new media backwash, G i l a Bend.
Note: Samples collected 12/8/83 from Vessel 2
700
600
500-
400->
S 300-E 3 C
E 2 200 <
100
* Bed pH • Total Al
10 20 30 40 50 — I — 60
12
-10 X a -o a> CO
70 80 90
Cumulative Volume (1000 gallons)
Figure 16. Aluminum and bed pH v e r s u s n e u t r a l i z a t i o n volume, G i l a Bend.
37

above 10.1 during neutralization, as much of the caustic (from downflow regeneration) was removed from the bed during the new media backwash. Aluminum levels were relatively low, and did not represent a significant media loss; results are not presented here, but appear in the Regeneration Wastewater Analyses section.
A set of routine neutralization samples was collected from the same vessel (No. 2) on December 8, 1983. Feed water pH was 2.5, and effluent pH rose to 11.8 during the process. The operator collected a grab sample whenever the plant pH meter registered at slight drop in effluent pH. Results are presented graphically (for aluminum and pH) in Figure 16, and show aluminum concentrations decreasing with decreasing pH. As with other analytes, the highest aluminum concentrations corresponded to the highest effluent pH.
Table 10 presents estimated alumina losses (Al expressed as A1203) for each regeneration phase calculated by numerically integrating aluminum mass over the sampling interval. Estimated alumina losses for a routine backwash, upflow and downflow regeneration, rinse A and B, and routine neutralization total approximately 230 pounds. This corresponds to an attrition rate of 1.25 cubic feet per million gallons for a 3.5 million gallon run, or 4.4 cubic feet per regeneration, representing a 1.2 percent loss.
TABLE 10. ESTIMATED ALUMINA LOSSES IN REGENERATION - GILA BEND.
Phase Estimated Aluminum (pounds as AI2O3)
Backwash Upflow Regeneration Rinse A Rinse B Downflow Regeneration Neutralization (pH 3.2) Neutralization (pH 2.5)
9 1
<1 68 <1 23 150
In addition to fluoride analysis, product water samples were also analyzed for aluminum levels. Results from all treatment runs are presented graphically in Figure 17. The highest aluminum levels were detected at the beginning of the run. Aluminum concentrations generally fell below 0.25 mg/L during treatment, but increased slightly near the end of the treatment cycle. Raw water aluminum concentration is approximately 0.03 rag/L. Although some alumina is lost during treatment, most appears to be lost during regeneration.
The operator's manual suggests adding replacement alumina when the media level falls more than eight inches. Media levels are checked with a graduated rod, and distances are measured from the manhole to the media surface. To replenish the bed, the operator adds 100-pound sacks of alumina through a manhole at the top of the vessel.
38

• Vessel 1 = Vessel 2
° • . . " • • o * », • ° .
_1 , 1 °«° • 2-5 * " »» »^ »« t» S»m» L?_.n tal ,
Cumulative Volume Treated (million gallons)
Figure 17. Aluminum concentration versus cumulative volume treated, Gila Bend.
39

Operator's records include measured distances to the media surface, the weight of alumina added (if any) with a new measured distance, and the date. Assuming a distance of 48 inches to the media surface represents a full vessel of 380 ft3 and each inch of depth represents 300 pounds (dry weight), average attrition rates were calculated for intervals between depth measurements. A loose bulk density of 52.6 lbs/ft3 was used to convert weight to volume; this correlated well with operator's depth measurements immediately before and after media additions. Using the number of regenerations between depth measurements (instead of cumulative volume treated) to calculate attrition rates produced no significant difference in estimated media volumes.
Estimated media volume versus volume treated is depicted graphically in Figures 18 and 19 (Vessels 1 and 2, respectively). In figures 18 and 19, the cumulative 300 million gallon point marks the beginning of process control with the fluoride electrode. Although estimates of media volume are rough, it is evident that media levels have been more closely maintained since electrode operation began. The rate of media attrition is greater after this point because regenerations are more frequent. Media is added when run length decreases. When run length was controlled with the colorimetric fluoride analysis, treatment runs were continued well beyond fluoride breakthrough without the operator's knowledge. Consequently, treatment vessels gave the appearance of containing more media than was present.
Table 11 summarizes media replacement and losses for both treatment vessels; average attrition rates are 1.3 and 1.1 cubic feet per million gallons for vessels 1 and 2, respectively. Average annual percent loss, including fines washed away during backwash of new alumina, is 28 percent for vessel 1 and 23 percent for vessel 2.
The average attrition losses correlate well with the average loss of 1.25 cubic feet per million gallons obtained from measuring aluminum concentrations in regeneration waste. This supports the premise that attrition results from the regeneration process, not cumulative flow.
TABLE 11. MEDIA REPLACEMENT SUMMARY - GILA BEND
May 1978 - April 1984
Vessel 1 Vessel 2
Media Added (lbs) Volume Treated (106gal) Attrition Rate (ft3/106 gal) Annual Loss (%)
33,200 492 1.3 28%
27,300 482 1.1 23%
Regeneration Wastewater Analyses
On November 17,1983, NSF staff collected a comprehensive set of grab and composite samples from a Vessel 2 regeneration. To determine the relative concentrations of dissolved and suspended analytes, a portion of all samples
40
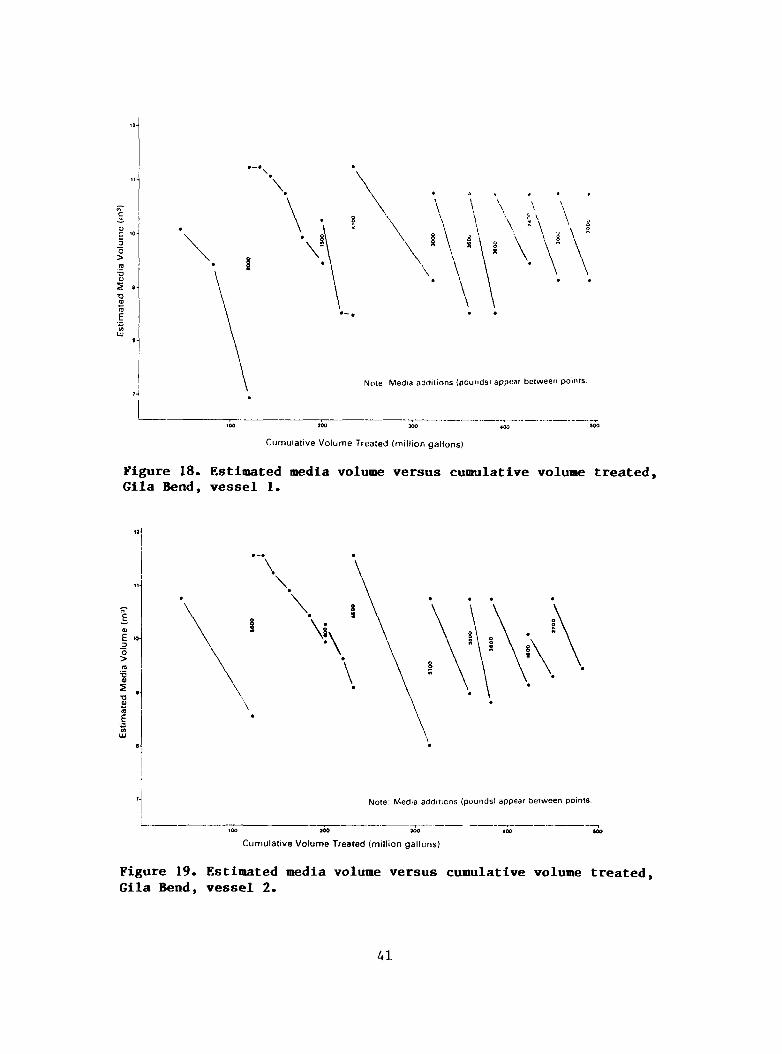
Note: Media additions (pounds) appear between points
Cumula t ive Vo lume Treated (mi l l ion gal lons)
Figure 18. Estimated media volume versus cumulative volume treated, Gila Bend, vessel 1.
o >
Note; Media additions (pounds) appear between points.
Cumula t ive Volume Treated (mi l l ion gal lons)
Figure 19. Estimated media volume versus cumulative volume treated, Gila Bend, vessel 2.
41
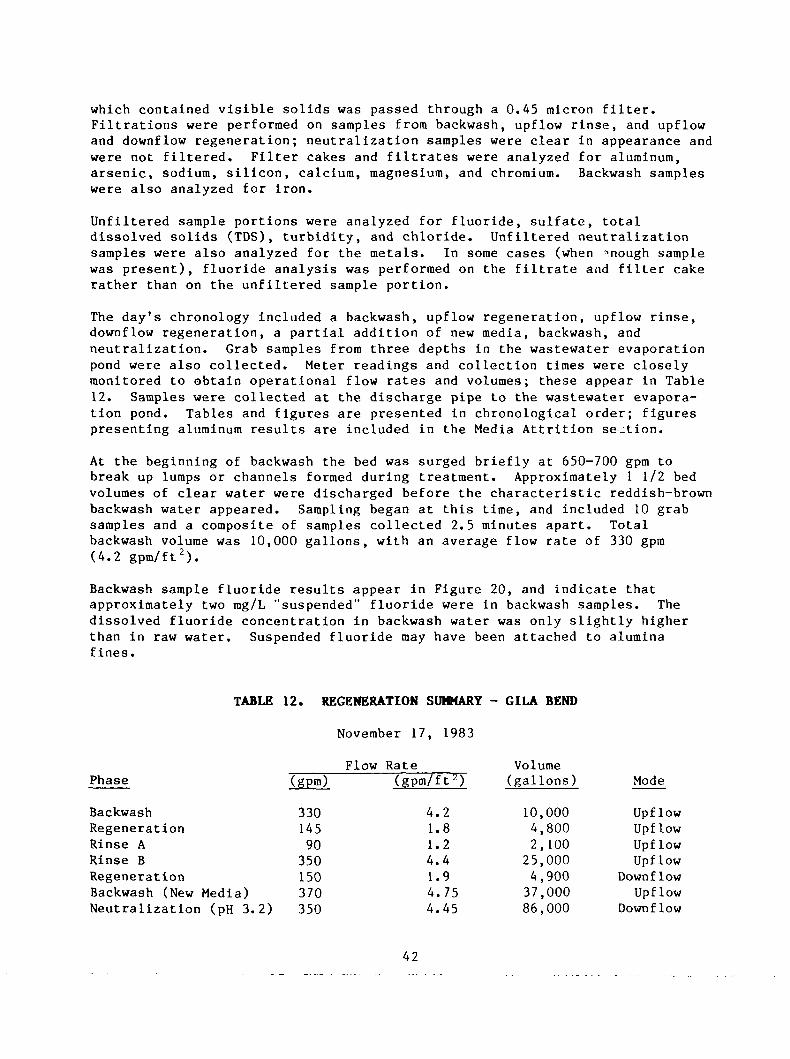
which contained visible solids was passed through a 0.45 micron filter. Filtrations were performed on samples from backwash, upflow rinse, and upflow and downflow regeneration; neutralization samples were clear in appearance and were not filtered. Filter cakes and filtrates were analyzed for aluminum, arsenic, sodium, silicon, calcium, magnesium, and chromium. Backwash samples were also analyzed for iron.
Unfiltered sample portions were analyzed for fluoride, sulfate, total dissolved solids (TDS), turbidity, and chloride. Unfiltered neutralization samples were also analyzed for the metals. In some cases (when enough sample was present), fluoride analysis was performed on the filtrate and filter cake rather than on the unfiltered sample portion.
The day's chronology included a backwash, upflow regeneration, upflow rinse, downflow regeneration, a partial addition of new media, backwash, and neutralization. Grab samples from three depths in the wastewater evaporation pond were also collected. Meter readings and collection times were closely monitored to obtain operational flow rates and volumes; these appear in Table 12. Samples were collected at the discharge pipe to the wastewater evaporation pond. Tables and figures are presented in chronological order; figures presenting aluminum results are included in the Media Attrition section.
At the beginning of backwash the bed was surged briefly at 650-700 gpm to break up lumps or channels formed during treatment. Approximately 1 1/2 bed volumes of clear water were discharged before the characteristic reddish-brown backwash water appeared. Sampling began at this time, and included 10 grab samples and a composite of samples collected 2.5 minutes apart. Total backwash volume was 10,000 gallons, with an average flow rate of 330 gpm (4.2 gpm/ft2).
Backwash sample fluoride results appear in Figure 20, and indicate that approximately two mg/L "suspended" fluoride were in backwash samples. The dissolved fluoride concentration in backwash water was only slightly higher than in raw water. Suspended fluoride may have been attached to alumina fines.
TABLE 12. REGENERATION SUMMARY - GILA BEND
November 17, 1983
Phase
Backwash Regeneration Rinse A Rinse B Regeneration Backwash (New Media) Neutralization (pH 3. 2)
(gpm)
330 145 90 350 150 370 350
Flow Rate (gpm/ftz)
4.2 1.8 1.2 4.4 1.9 4.75 4.45
Volume (gallons)
10,000 4,800 2,100
25,000 4,900 37,000 86,000
Mode
Upflow Upflow Upflow Upflow
Downflow Upflow
Downflow
42

Backwash arsenic and chromium, appearing in Figures 21 and 22, respectively, were also predominantly in suspended form, and were present at higher concentrations than in the raw water. These analytes may also have been adsorbed by alumina fines which were washed out of the bed. Backwash silicon concentrations, appearing in both dissolved and suspended forms, appear in Figure 23.
Backwash iron concentration, most of which was dissolved, is presented in Figure 24. Suspended iron present in backwash samples may have been precipitated on the media during treatment. Turbidity was highest during backwash, primarily because of suspended matter.
Upflow regeneration followed backwash; 50 percent liquid caustic solution (1.9 gpm) was diluted with raw water (145 gpra), resulting in a 0.98 percent by weight sodium hydroxide concentration. Approximately 398 pounds of sodium hydroxide contacted the media, a typical weight for either upflow or downflow regeneration. A composite of 12 grab samples was collected at three minute intervals.
A series of two upflow rinses followed upflow regeneration. Rinse A (140 gpm) was conducted for 2100 gallons, or approximately 0.85 bed volumes. This step is intended to remove caustic solution from the bed. A composite of six grab samples from rinse A was collected at three minute intervals. Arsenic, sulfate, sodium, chloride, and TDS levels were greater in rinse A than in upflow regeneration composites, while turbidity was lower.
Fluoride and aluminum concentrations were relatively constant through upflow regeneration and rinse A.
Results of analyses performed on composite samples from backwash, upflow regeneration, and upflow rinse A appear in Table 13.
TABLE 13. BACKWASH, UPFLOW REGENERATION, AND RINSE A COMPOSITE SAMPLE RESULTS - GILA BEND
November 17, 1983
All units are mg/L except Turbidity (NTU)
Analyte
I Al As SCK Na_ TDS_ Cl Mg_ Tur. jU Ca Cr Fe
Backwash 5.4 42 0.12 220 440 1300 590 0.4 300 14 33 0.25 18 Upflow Regeneration 5.1 14 0.04 210 440 1300 590 0.8 140 10 35 0.16 Rinse A 6. 1 8 0.08 740 740 2300 700 0.3 45 13 37 0.03
43

o Total F • Dissolved F
12-
i o
cs
• D
o 3
u. 6-
2 -
• •
" I 1 1 1 J— 2 4 6 8 10
Cumulative Volume (1000 gallons)
Figure 20. Fluoride versus backwash volume,
Gila Bend.
300-
250-
200-
o Total As • Dissolved As
a a.
S 15° <
100
5 0 -
8 10
Cumulative Volume (1000 gallons)
Figure 21. Arsenic versus backwash volume,
Gila Bend.

• Dissolved Cr o Total Cr
D3
E
E o
.C 0.3
u
2 4 6 8 10
Cumulative Volume (1000 gallons)
Figure 22. Chromium versus backwash volume,
Gila Bend.
• Dissolved Si
c. Total Si
2 4 6
Cumulative Volume (1000 gallons)
Figure 23. Silicon versus backwash volume,
Gila Bend.

45-
40
35
30
25-
E - 20
15
10
5 -
o Total Fe • Dissolved Fe
7o"
Cumulative Volume (1000 gallons)
Figure 24. Iron versus backwash volume,
Gila Bend.
g
o 3
800-
700-
600-
500 -
400
300-
200-
100-
10 15 — I — 20
— I —
25
Cumulative Volume (1000 aallons)
Figure 25. Upflow r inse f luoride versus volume, Gila Bend.
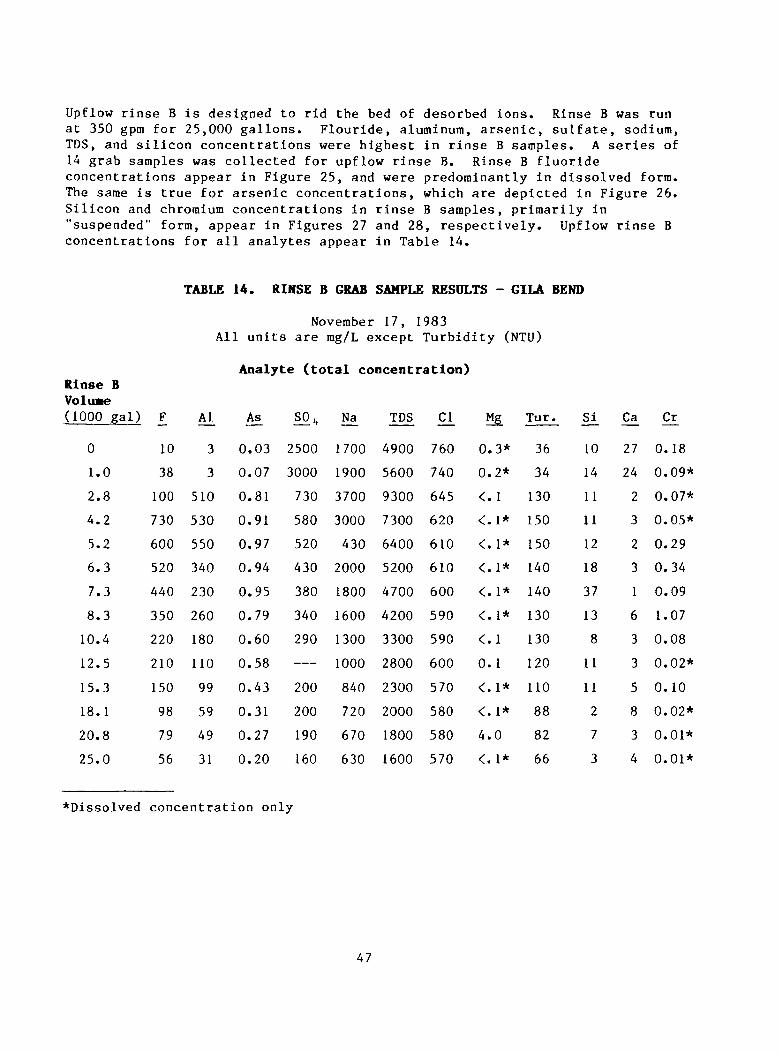
Upflow rinse B is designed to rid the bed of desorbed ions. Rinse B was run at 350 gpm for 25,000 gallons. Flouride, aluminum, arsenic, sulfate, sodium, TDS, and silicon concentrations were highest in rinse B samples. A series of 14 grab samples was collected for upflow rinse B. Rinse B fluoride concentrations appear in Figure 25, and were predominantly in dissolved form. The same is true for arsenic concentrations, which are depicted in Figure 26. Silicon and chromium concentrations in rinse B samples, primarily in "suspended" form, appear in Figures 27 and 28, respectively. Upflow rinse B concentrations for all analytes appear in Table 14.
TABLE 14. RINSE B GRAB SAMPLE RESULTS - GILA BEND
November 17, 1983 All units are mg/L except Turbidity (NTU)
Analyte (total concentration) Rinse B Voluae (1000 gal)
0
1.0
2.8
4.2
5.2
6.3
7.3
8.3
10.4
12.5
15.3
18.1
20.8
25.0
_F
10
38
100
730
600
520
440
350
220
210
150
98
79
56
Al
3
3
510
530
550
340
230
260
180
110
99
59
49
31
As_
0.03
0.07
0.81
0.91
0.97
0.94
0.95
0.79
0.60
0.58
0.43
0.31
0.27
0.20
S0„
2500
3000
730
580
520
430
380
340
290
200
200
190
160
Na
1700
1900
3700
3000
430
2000
1800
1600
1300
1000
840
720
670
630
TDS
4900
5600
9300
7300
6400
5200
4700
4200
3300
2800
2300
2000
1800
1600
£!
760
740
645
620
610
610
600
590
590
600
570
580
580
570
Mg_
0.3*
0.2*
<.l
<.l*
<.l*
<.l*
<.l*
<.l*
<.l
0.1
<.l*
<.l*
4.0
<.l*
Tur.
36
34
130
150
150
140
140
130
130
120
110
88
82
66
Si_
10
14
11
11
12
18
37
13
8
11
11
2
7
3
Ca
27
24
2
3
2
3
1
6
3
3
5
8
3
4
9L
0.18
0.09*
0.07*
0.05*
0.29
0.34
0.09
1.07
0.08
0.02*
0.10
0.02*
0.01*
0.01*
*Dissolved concentration only
47
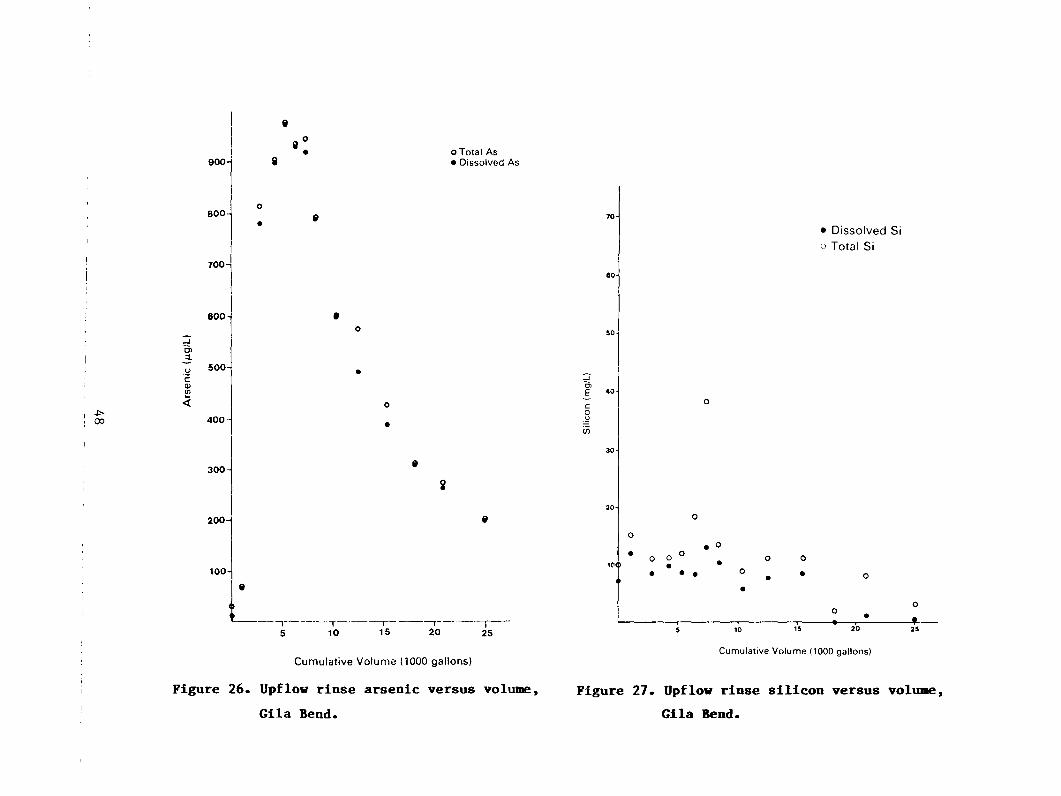
oo
en
c 0)
900-
800
700-
600-
500
4 0 0 -
300 -
200
100-
O Total As • Dissolved As
10 15 — ' T - "
20 25
Cumulative Volume (1000 gallons)
Figure 26. Upflow rinse arsenic versus volume,
Gila Bend.
£ «»
o o
• •
• Dissolved Si
o Total Si
o
10 15 20
Cumulative Volume (1000 gallons)
Figure 27. Upflow rinse silicon versus volume,
Gila Bend.

• Dissolved Cr
o Total Cr
Oi
E
"E o i_ .c CJ
Cumulative Volume (1000 gallons)
Figure 28. Dpflow r inse chromium versus volume, Gila Bend.
1000-
800H
a
o 'c 0) 0)
600-
400-
200-
—r~ 10
—T— 15
— I — 20
o Total As • Dissolved As
25 — T -
30 - I — 35
Cumulative Volume (1000 gallons)
Figure 29. Arsenic versus volume, new media backwash, Gila Bend.
49

The tank was drained after rinse B, and downflow regeneration commenced. Raw water flow rate was 148 gpm, yielding a 0.96 percent weight caustic solution. Results from a composite of samples collected 2.5 minutes apart appear in Table 15.
After the operator added 2700 pounds of fresh alumina, the bed was backwashed for almost four times the volume of the first (routine) backwash. New media is flushed for longer periods to remove alumina fines. Arsenic concentrations during the new media backwash appear as Figure 29; high dissolved arsenic concentrations may have resulted from ions displaced by downflow regeneration. (Aluminum concentrations are presented in Figure 17, in the section on media attrition.)
Neutralization followed the new media backwash. Feed water pH was 3.2, rather than the customary 2.5, to save wear on new media. In a routine neutralization (without media addition), effluent pH typically rises to 12 before dropping to a level suitable for potable discharge. During this neutralization, however, effluent pH did not rise past 10.1, as much of the caustic solution was flushed out during the new media backwash. Results from fluoride and arsenic analyses performed on neutralization samples appear in Figures 30 and 31, respectively. Table 15 presents results from neutralization grab samples, as well as from the downflow regeneration composite sample.
TABLE 15. DOWNFLOW REGENERATION COMPOSITE AND
NEUTRALIZATION GRAB SAMPLES - GILA BEND
November 17, 1983 All units are mg/L except Turbidity (NTU)
Downflow Regeneration Composite 33
Neutralization* Volume (gallons)
Al As S0M
Analyte (total concentration)
Na TDS CJ_ Mg_ Tur. i_
0.05 190 530 1500 570 1.0
Ca
*pH 3.2 feed water
Cr
0.02
0 2,800 16,000 21,300 42,700 64,000 85,700
12 10 12 8.4 3.7 2.7 2.0
4 13 27 30 20 11 8
0.02 0.03 0.06 0.07 0.07 0.05 0.01
170 170 170 160 160 160 160
400 500 530 530 320 490 470
1300 1400 1500 1500 1400 1300 1300
570 570 570 570 570 570 570
0. 1 <.l <.l <.l <.l <.l <.l
2.5 0.7 0.6 0.4 0.3 0.2 0.2
3 3 2 5 1 4 5
17 7 1 0.5 0.3 0.3 0.5
0.02 0.02 0.01 0.01 0.01 0.01 0.01
50

14-
E »-
1
20 30 40 $0 60 70
Cumulative Volume (1000 gallons)
SO - ~ I —
SO
Figure 30. Neutralization fluoride versus volume, Gila Bend.
80
CT 4 0
a
.._T-_ 60
— r -
90
Cumulative Volume (1000 gallons)
Figure 31. Neutralization arsenic versus volume, Gila Bend.
51

On December 8, 1983, a set of routine neutralization samples was collected during regeneration of vessel 2. Analytical results appear in Table 16;
aluminum results are graphed in Figure 18, appearing in the Media Attrition section.
Fluoride and arsenic regeneration sample results were used to estimate relative amounts recovered from sampling. For the run (No. 117) preceeding the November 17 regeneration, approximately 49.6 Kg of fluoride and 191 gm of arsenic were removed (assuming no arsenic breakthrough). Approximate masses in regeneration wastewater, after correcting for background concentration in the regeneration water, were 23.8 Kg for fluoride and 121 gm for arsenic. Estimated recoveries are 48 percent for fluoride and 63 percent for arsenic. Actual percent recoveries are higher than these quantities; recovery estimates are subject to uncertainty from sampling and analytical difficulties in recovering fluoride and arsenic in waste streams.
Three samples were collected from the lined wastewater evaporation pond on November 17, 1983. Attempts were made to collect samples from the surface and two different depths. Results are presented in Table 17.
TABLE 16. NEUTRALIZATION GRAB SAMPLES - GILA BEND
December 8, 1983 All units are rag/L except pH (units)
Neutralization* Volume Analyte
(gallons)
0 4,700 13,300 26,600 34,600 40,400 41,800 50,000 56,100 65,400 75,800 85,800
*pH 2.5 feed water.
pH
11.5 11.8 11.2 11.0 10.8 10.6 10.5 10.4 10.2 10.0 9.8 9.6
£
15 17 10 9.6 7.6 6.3 5.4 4.6 4.2 3.5 2.9 2.4
As_
0.85 2.6 0.72 0.48 0.26 0.18 0.13 0.10 0.10 0.09 0.07 0.06
Al
400 700 160 74 54 32 26 52 17 12 11 9
Si_
27 75 48 25 25 18 14 10 6 5 3 3
Na
4100 3800 1300 640 660 600 560 530 520 500 490 490
TDS
8300 9900 3200 2200 1900 1600 1500 1500 1400 1400 1300 1300
52

TABLE 17. EVAPORATION POND WASTEWATER ANALYSES - GILA BEND
November 17, 1983 All units are mg/L except Turbidity (NTU)
Analyte F Al As Ca CI Cr Fe Mg Na Si SCK
Tur. TDS
Surface 180 47 0.60 2.4
1800 <0.01 1.1
<0.1 2300
6 710 28
6100
2.5 Feet 180 43 0.52 3.2
2300 0.01
— <0.1
2400 7
740 110
6300
6 Feet 170 360 0.53 5.0
1900 <0.01 3.5
<0.1 2500
3 740 26
6300
Sediment 1.4*
120 0.62 2.0
— 0.09 0.2* 0.1* 1.7*
33 — — —
•"Suspended" concentration only.
PALO VERDE, ARIZONA
Process Description
The central plant at Palo Verde provides treated water to an inn and trailer park, both built to accomodate workers from the Palo Verde nuclear power plant construction site. This small central system was designed by Robert Lake of Water Treatment Engineers, Scottsdale, Arizona. Design flow was 30,000 gpd, although overall average use has been 7200 gpd. Approximately 6 to 9 percent of total water used at Palo Verde is defluoridated by the plant.
The plant uses three fiberglass-reinforced vinylester pressure vessels operated in parallel. Each vessel is cylindrical, with a diameter of three feet and a height of six feet. Three vessels are provided for flexibility of operation necessitated by a highly variable demand for water and minimal available operator hours. Each vessel houses approximately 18 ft of F-l activated alumina, 28-48 mesh. Raw water from a 10,000 gallon storage tank is pumped through treatment vessels; product water is discharged to a 28,000 gallon potable water tank, which supplies a 2,000 gallon pressure tank. Regeneration water is supplied from a raw water pressure tank, which also provides non-defluoridated water to the inn. This is done to maintain regeneration water at a constant pressure.
As with Gila Bend, raw water pH is lowered with sulfuric acid to the 5-6 range prior to treatment. Acid is fed from a 13 gallon commercial carboy to an injection nozzle with a metering pump. Dilute sulfuric acid (40 percent) solution is used for pH adjustment to permit more accurate adjustment of the raw water pH. (With concentrated acid, the metering pump had to operate with the minimum pump stroke, and was very difficult to adjust accurately.)
53

Design flow is 30,000 gpd at 40 gpm. This is identical to Gila Bend's flow rate per square foot of surface (5.7 gpm/ft2), but higher in terms of flow rate per media volume (1.9 gpm/ft3). Although daily production (7200 gpd) has been much lower than design, flow rates have been high, ranging between 60-70 gpm. The plant is operated at these higher flow rates to minimize required operator time. Treatment runs last approximately 120,000 gallons (890 bed volumes).
Water is not blended after treatment until the end of a treatment run. When effluent fluoride reaches approximately 1.5 mg/L, product water is blended with water from a "fresh" vessel for about two days. The former vessel is then regenerated, while the second vessel continues the run. Treatment cycles last from 14 to 21 days, depending on demand for water and media volume.
Media regeneration is performed in batch processes. Backwash is performed for about 10 minutes at 10 gpm/ft2 (five bed volumes).
Caustic solution, used for product water pH adjustment and media regeneration, is manually prepared in a polypropylene tank. A 50 pound bag of soda bead and 300 gallons of water are mixed in the tank, which contains some caustic solution left over from the previous run. Approximate caustic solution concentration in the tank is 2.0 percent by weight. An entire 50 pound bag of soda bead is used for regeneration and pH adjustment for each treatment run. This may be more than required, but is safer for the operator, since no open bags of soda bead are present in the building. Upflow and downflow regeneration are each performed for approximately 1.1 bed volumes.
Media neutralization is performed with 66° Baume sulfuric acid. Raw water pH is lowered to 1.5 to 2.0 and passed through the bed for 7 to 18 bed volumes. When effluent pH begins to drop, feed water is adjusted to pH 4, and then to pH 5.5.
Low pH water for media neutralization has been necessary to keep wastewater discharged to the evaporation pond within pond capacity. Conservation of water wasted to the evaporation pond results in slightly more acid consumption and required operator time. The original plant design was for an upflow system to increase capacity and reduce regeneration wastewater volume (27). However, a fine silt in the raw water was reported to have fouled the alumina during upflow operation. For a downflow system, the top portion of the alumina bed also acts as a filter for the remainder of the bed, and particulates retained are removed in backwashing. The Palo Verde plant was converted to a downflow mode to solve the problem of fouling. Consequently, reducing wastewater volume became more important, as the evaporation pond was sized for the upflow process.
The plant is run by a part-time operator, who spends approximately 45 hours per month onsite. Automatic pumping of acid and caustic may be used in the operator's absence. The automatic system is not used routinely.
During the study period, a pH control system with an alarm was installed at the plant. This was done after the caustic pump was inadvertantly left in the manual mode overnight, introducing a continuous flow of sodium hydroxide
54

solution without regard to water passing through the system. The pH of water in the distribution system was greater than 11.
Fluoride analysis is performed onsite with SPADNS reagent and a colorimeter.
A simplified schematic of the treatment process appears in Figure 32.
Efficacy
Six treatment runs were monitored at Palo Verde during the study period. During runs 1 and 2, raw water fluoride concentration was 7.0 mg/L; for the remaining runs, raw water fluoride was 6.7 mg/L. Raw water arsenic concentrations fluctuated between 0.028 and 0.038 mg/1 during the sampling period.
A chronological account from tank 2, were conduc after run 1 (March 31, 1 dropped to 4.2. (At Gil drops to 9.6.) Because water (1.5-2.0) at Palo during media neutralizat neutralization contained media. The subsequent t fluoride reduction; over exchange capacity exceed
of monitored runs appears in Table 18. Runs 1 and 2, ted in March-April, 1982. During the regeneration 982), the bed was "overneutralized", as effluent pH a Bend, a treatment run commences when effluent pH of the smaller media volumes and more acidic feed Verde, it is difficult to control the "endpoint" ion. A grab sample collected at the beginning of 2000 mg/L of aluminum, indicating dissolution of some
reatment run (No. 2) demonstrated the most effective 200,000 gallons were treated, resulting in an ing 3500 grains/ft3.
Raw water from well f
H2SO4
Regeneration Wastewater (to pond)
NaOH Treated water to storage M ) » •
Figure 32. Simplified flow schematic, Palo Verde treatment plant.
55

Runs 3, 5, and 6, conducted from April through July, 1983, were consecutive runs from Tank 3. Regenerations before all three runs were also sampled. During these regenerations, composite samples were collected by continuously diverting a portion of the wastewater flow into a large tank. Wastewater from each phase was collected in this manner, and was well mixed before a representative sample was taken for shipment and analysis. Results of analyses performed on wastewater samples appear in the Regeneration Wastewater Analyses section.
Replacement alumina was added to the tanks before run 2 (200 pounds) and run 3 (500 pounds).
A summary of flow rates and feed water pH for monitored runs appears in Table 19. Feed water pH ranged between 5.2 and 6.3 during treatment, and fluctuated day to day. Pumping rates also fluctuated daily, and ranged between 50 and 78 gpm. Hydraulic loading was much higher than at Gila Bend, with rates between 2.8 and 4.4 gpm/ft3 of media.
Treatment runs are presented graphically in Figure 33. Treated water volumes ranged between 113,000 and 205,000 gallons, and fluoride breakthrough occurred at various stages in the run, as can be seen from Figure 33. The breakthrough curves are not as smooth as Gila Bend's, most likely because of the
TABLE 18. MONITORED TREATMENT RUNS - PALO VERDE
Duration Flow Run Tank Date (days) (gpd) Comments
1 2 March 17-31 (1982) 14 8700 Regeneration sampled 3/31.
2 2 April 1-28 27 7580 200 lbs. media added before run.
3 3 April 1-May 6 (1983) 35 3720 Regeneration sampled 3/31. 500 lbs. media added before run. Regeneration sampled 5/19.
4 1 May 6-27 21 5400
5 3 June 3-July 11 38 4740 Regeneration sampled 7/11.
3 July 11-August 1 21 6210
56

TABLE 19. OPERATIONAL PARAMETERS - PALO VERDE TREATMENT RUNS
Run
1 2 3 4 5 6
Tank
2 2 3 1 3 3
Flow (gpm)
68-70 62-70 50-78 60-74 68-72 70-74
Rates (gpm/ft3)
3.8 - 3.9 3.0 - 3.3 2.8 - 4.3 3.6 - 4.4 3.9 - 4.1 4.1 - 4.4
Feed Water pH Maximum Minimum
5.8 5.5
fluctuating flow rates and feed water pH. Run 2 had non-detectable fluoride levels after 110,000 gallons (700 bed volumes); other monitored runs had reached breakthrough by this point. An efficacy summary is presented in Table 20. Included are total volume treated, average effluent fluoride concentration, the average fluoride removal, estimated media volume, and exchange capacity.
Media volume estimates were rough, as plant data concerning media measurements were very sketchy. To make measurements, the operator must remove the vessel top and climb above the tank to measure depth to the media surface. This process is difficult and time-consuming, and is not routinely performed by the part-time operators. Before run 3 (Tank 3), depth measurements were made during a site visit. Water Treatment Engineers provided field data for runs 1 and 2. Estimates of media volume for the runs 4,5, and 6 were obtained from the average attrition rate of 4.6 ft3 per million gallons treated.
TABLE 20. EFFICACY SUMMARY - PALO VERDE
Run
1 2 3 4 5 6
Tank
2 2 3 1 3 3
Total Volume Treated
(1000 gal)
122 205 130 113 180 130
Averge Effluent Fluoride (mg/L)
1.05 0.79 0.49 0.96 1.23 0.48
Average Fluoride Removal
(gm/1000 gal)
22.5 23.5 23.5 21.7 20.7 23.5
Estimated Media Volume (ft3)
18.0 21.0 18.0 16.8 17.4 16.9
Exchange Capacity
(grains/ft3)
2350 3540 2630 2260 3310 2800
Exchange capacities of monitored runs ranged between 2260-3540 grains/ft3. Capacity and average fluoride removal are higher than at Gila Bend. This may be caused by a higher fluoride challenge at Palo Verde. Also, the use of a stronger regenerant (two percent by weight NaOH) at Palo Verde increases run length and exchange capacity.
57

!
Run 1, Tank 2
so too tso 200
Cumulative Volume Treated (1000 gallons)
Run 3, Tank 3
I fOO 190 200
Cumulative Volume Treated OOOO gallons)
Run 5, Tank 3
<0 100 150 200
Cumulative VoJume Treated (1000 gallons;
• • • » • • • e • Run 2, Tank 2
—, , , T— SO 100 150 200
Cumulative Volume Treated (1000 gallons)
• • • « Run 4, Tank 1
•0 100 150 200
Cumulative Volume Treated (1000 gallons)
4 E
Run 6, Tank 3 0 too 180 200
Cumulative Volume Treated (1000 gallons)
Figure 33. Product water f luoride versus volume treated , Palo Verde.
58

Calculation of chemical efficiency for treatment runs is complicated by incomplete plant records. Also, two tanks may be operating simultaneously, while using acid and caustic from the same reservoirs. Sulfuric acid for raw water pH adjustment is more dilute (40 percent) than neutralization acid (93 percent). Breakdowns of relative acid strength consumption are incomplete. The lower initial pH at Palo Verde would require less acid pretreatment than at Gila Bend, but this is offset by a slightly higher alkalinity, giving the water more buffering capacity. During regeneration, approximately two gallons of 66° Baume sulfuric acid are consumed, but actual quantities are not recorded.
Caustic soda consumption is easier to estimate, however, because 50 pounds of soda bead are used for each regeneration and subsequent treatment run. Table 21 presents soda bead consumption for monitored runs as pounds per million gallons treated. Also included is the cost per 1000 gallons, based on an average unit cost of $0.33 per pound. This unit cost is approximately twice that of Gila Bend.
TABLE 21. CADSTIC SODA CONSUMPTION - PALO VERDE
Run
1 2 3 4 5 6
NaOH Consum; (pounds/mi11ion
410 244 385 422 278 385
ption gallons)
Cost ($/1000 gallons)
$ 0.14 0.08 0. 13 0.14 0.09 0.13
Media Attrition
The overall attrition rate of activated alumina at Palo Verde is 4.6 ft per million gallons treated. As with Gila Bend, iron oxides from the well have necessitated more extensive backwashing. Attrition is higher at Palo Verde because backwashing rates are higher (10 gpm/ft ), and because stronger acid and caustic concentrations are routinely used. Also, the media is regenerated 5 to 10 times per million gallons. The average attrition rate was calculated from entries of media additions totaling 2220 pounds, during which 9.19 million gallons were treated. This rate corresponds to a loss of approximately 0.5 ft3 per media regeneration, or 2.8 percent of a full bed.
Results of aluminum analyses from composite wastewater samples were used to estimate media losses during regeneration. These estimated losses appear in Table 22 for regenerations preceeding runs 3,5, and 6 (tank 3). Results demonstrated large fluctuations in regeneration wastewater aluminum content and imply that greater media losses must occur to maintain an overall average of 0.5 ft3 per regeneration. The unit price for the smaller quantities of activated alumina purchased for Palo Verde (includes freight) is $0.80 per pound.
59

TABLE 22. ESTIMATED MEDIA LOSSES DURING REGENERATION - PALO VERDE
Regeneration Wastewater Aluminum* Average Attrition
Run (pounds as AI2O3) (ft3) (ft Vmillion gallons)
3 7.7 0.15 1.15 5 13.0 0.25 1.4 6 28.3 0.54 4.15
•Estimates obtained from results of aluminum analyses performed on regeneration samples.
Treated water was also analyzed for aluminum; results appear in Figure 34 for each monitored run.
Regeneration Wastewater Analyses
Results of analyses performed on regeneration samples appear in Tables 23 through 26. The regeneration preceeding run 2, performed March 31, 1982, is represented in Table 23. Note the high concentrations of all analytes in the beginning of neutralization sample; this was the occasion when effluent pH dropped to 4.2.
Results of composite sampling of regeneration water, performed on March 31, May 19, and July 11, 1983 (from tank 3) appear in Tables 24 through 26, respectively. Cumulative volumes for each phase are included in the tables. On the May 19 regeneration (Table 25), downflow regeneration and neutralization were performed in a continuous process. Estimated mass of fluoride removed during runs 3 and 5 and recovered in analyses of regeneration samples appear in Table 27.
60

1 E
D
3
Run I.Tank 2
SO 100 1»0 200
Cumulative Volume Treated OOOO aellons)
r
* e e« 4 Run 2, Tank 2
100 180 200
Cumuletlve Volumo Treated (1000 gellone)
Run 3, Tank 3 e . »
o too e<Io joo
Cumulative Volume Treeted {1000 gaNonil
Run 4, Tank 1
u too tao >oo
Cumulative Volume Treated 11000 gellone)
» . »» • Run 5, Tank 3
SO 100 150 200
Cumuletive Volume Treated 11000 gallona)
E >
3
Run 6, Tank 3
5 100 160 200
Cumulative Volume Treated (1000 gallons!
Figure 34. Product water aluminum versus volume treated, Palo Verde.
61

TABLE 23. REGENERATION WASTEWATER - PALO VERDE, MARCH 31, 1982 TANK 2
All units are mg/L except Turbidity (NTU)
Grab Sample As Al Si TDS Tur.
Backwash: Begin End
Upflow Regeneration: Begin End
Upflow Rinse: Begin
Downflow Regeneration: Begin End
Neutralization: Begin End
4.6 4.2
4.6 160
740
75 4.5
250 0.2
0.24 0.02
0.01 0.08
0.04
0.04 0.04
5.7 <.01
110 4.0
1.0 80
1.0
12 20
2000 0.1
63 9
10 <4
<4
<4 <4
47 4
2160 830
1360 1480
9040
1500 1290
17,500 830
19 6.4
6.4 6.0
36
0.9 5.8
1.7 0.6
TABLE 24. REGENERATION WASTEWATER - PALO VERDE, MARCH 31, 1983 TANK 3
All units are mg/L except Turbidity (NTU) and pH
Composite Sample F As
Backwash (760 gal)
Upflow Regeneration (150 gal)
Upflow Rinse (1150 gal)
Al Si ^0 4 TDS_ pH Tur.
1.8 0.21 230 27 220 880 5.8 17
3.2 0.02 13 180 1340 11.2 6.3
250 0.14 150 <1 640 2630 10.0 20
Downflow Regeneration (150 gal) 23.5 0.03 11 <1 160 1260 11.2 1.0
Neutralization (930 gal) 8.4 0.47 150 30 580 2880 11.6 18
62

TABLE 25. REGENERATION WASTEWATER - PALO VERDE, MAY 19, 1983 TANK 3
All units are mg/L except Turbidity (NTU) and pH
Composite Sample
Backwash (640 gal)
Upflow Regeneration (150 gal)
Upflow Rinse (1210 gal)
Downflow Regeneration & Neutralization (2580 gal)
Al Si
7.1 125
9.7 12
6.6 60
<1
<1
45 260
SO i, TDS pH Tur.
210 760 6.9 78
700 5700 12.8 60
135 1680 13.0 7.1
385 10,200 13.0 11
TABLE 26. REGENERATION WASTEWATER - PALO VERDE, JOLY 11, 1983 TANK 3
All units are mg/L except Turbidity (NTU) and pH Composite Sample F_ As_ Al_ C_£ SJ34 TDS pH Tur.
Backwash (870 gal)
Upflow Regeneration (150 gal)
Upflow Rinse (3030 gal)
Downflow Regeneration & Rinse (1440 gal)
Neutralization (1470 gal)
5.2 0.29 275 0.45 380 770 5.8 230
680 0.15 32 0.04 3600 8200 12.0 13
185 0.29 410 0.06 220 2400 10.9 40
8.0 0.32 200 0.01 155 3580 - 3.1
6.4 0.10 17 0.02 255 1080 11.0 0.7
TABLE 27. REMOVAL AND RECOVERY OF FLUORIDE, PALO VERDE
Estimated Fluoride (grams) Removed Recovered
Run 3 Run 5
3060 3730
490 2600
63

SECTION 6.
COSTS OF CENTRAL TREATMENT
GILA BEND, ARIZONA
Capital Costs
The Town of Gila Bend received a Community Development Block Grant of $188,000 to finance construction of a central treatment system during the period 1977-78. Capital costs (1977) for the treatment plant and building, reported in the Town's Statement of Program Costs, were $199,000 (38). The balance was covered by local pubic works and water utility funds.
To construct a lined evaporation pond for regeneration wastewater, the Town obtained a Farmer's Home Administration (FHA) grant of $45,000, which was 50 percent of the estimated $90,000 cost. The Four Corners Regional Commission (FCRC) provided its maximum allowable Supplemental Grant, which could not bring the total federal contribution above 80 percent of project costs. Since the FHA was contributing 50 percent, the FCRC was able to contribute an additional 30 percent, or $27,000, bringing the total funding to $72,000. The pond was constructed for approximately $78,000; the Town contributed the balance in labor and equipment.
Capital costs for the treatment plant, building, and lined evaporation pond appear in Table 28. The 1977 costs of $277,000 are adjusted to 1983 dollars using Bureau of Labor Statistics (BLS) Producer Price Indices and Engineering News-Record (ENR) Construction, Building, and Labor Cost Indices. The method uses cost indices applied to specific items in the capital cost breakdown. Estimated 1983 costs for the treatment system are $424,000.
The BLS Producer Price Indices are currently under revision and new, more specific indices are being developed, many with differing base years. Table 29 presents the code numbers and base years for the BLS cost indices used in updating Gila Bend capital costs.
64

TABLE 28. GILA BEND CAPITAL COSTS
Annual Index Avg. Est. Item
Mobilization
Site Work
Concrete
Steel Building
Mechanical
Tanks and Platform
Chemical Pumps ,
1977 Cost
$3,000
1,000
17,500
10,500
17,700
44,193
3,425
Index Used
ENR Skilled Labor Wage Rate (1967)
ii >t
BLS Concrete Ingredients
ENR Building Cost Index (1967)
BLS General Purpose Machinery & Equipment
•• ••
..
1977
227
227
198.8
228.61
201.7
201.7
201.7
1983
360
360
314.0
352.89
308.2
308.2
308.2
1983 Cost
$4,758
1,586
27,641
16,208
27,046
67,527
5,233 Day Tanks, Steel Stands
Flow Meters and Totalizers
Plumbing
Electrical
Immersion Heater
Treatment Process Plas Lined Pipe
Internal Tank Piping
Butterfly Valves
tic
1,093
10,000
10,000
3,515
19,727
4,530
2,385
" '*
BLS Plumbing Fixtures
BLS Electrical Machinery & Equipment
..
BLS Fabricated Pipe & Fittings
..
BLS Valves & Fittings
201.7
186.6
154.1
154.1
67.8
67.8
65.9
308.2 1,670
289.1 15,493
242.5 15,737
242.5 5,531
105.5 30,696
105.5 7,049
100.2 3,626
65

TABLE 28. GILA BEND CAPITAL COSTS (continued)
Item
6" Check
Valve
42,000 lbs. F-l Activated Alumina
Chain Link Fencing
Misc.
1977 Cost
1,258
12,561
10,329
2,292
Index Used
BLS Valves & Fittings
BLS Primary Aluminum
BLS Chain Link Fencing
BLS Producer
Annual Index Avg. Est. 1977 1983 1983 Cost
Engineering 24,161 and Research
Evaporation 48,960 Pond Materials
Evaporation 20,935 Pond Labor, Subcontracted
Evaporation 7,730 Pond Labor, Town Employees
TOTAL 1977 COST $276,794
65.9
70.7
204.9
152.1 Price Index, Durable Goods
ENR Skilled 227 Labor Wage Rate (1967)
ENR Common 246 Labor Wage Rate (1967)
100.2
360
395
1,913
110.2 19,579
294.7 14,856
233.1 3,513
37,525
BLS Rubber & 167.5 243.4 71,145 Plastic Products (1967)
33,201
12,412
TOTAL ESTIMATED 1983 COST $423,945
1983 Engineering cost estimate based on 1977 percentage of project costs (9.56%).
66
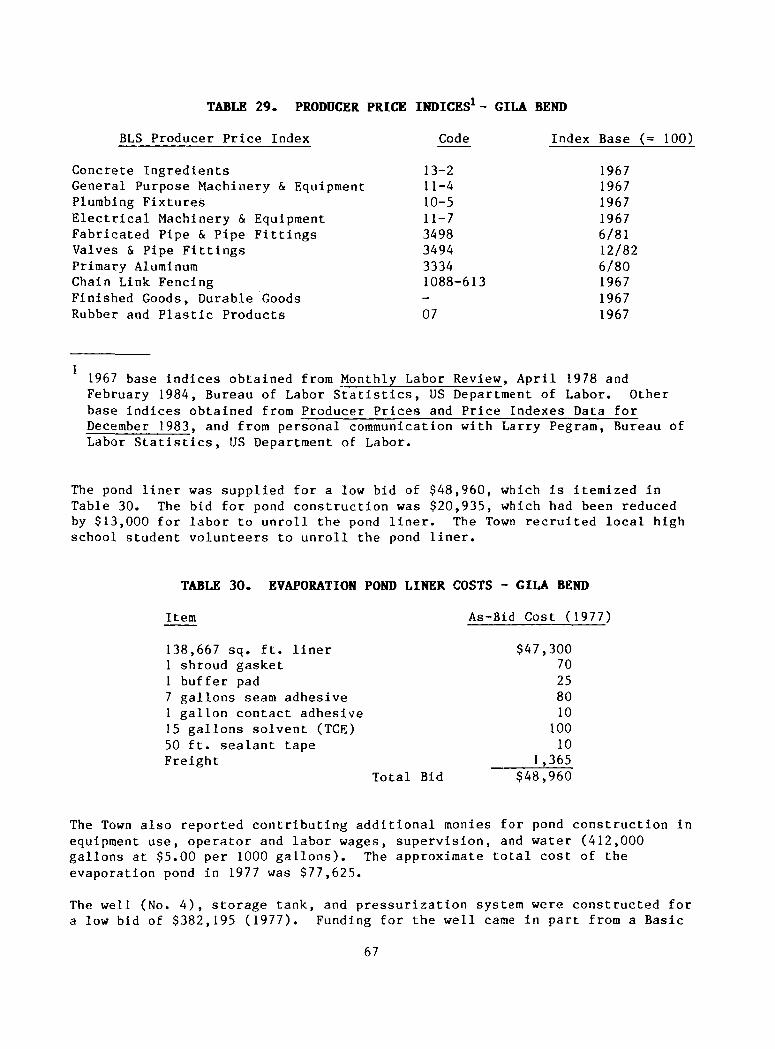
TABLE 29. PRODUCER PRICE INDICES1- GILA BEND
BLS Producer Price Index Cocte Index Base (= 100)
Concrete Ingredients General Purpose Machinery & Equipment Plumbing Fixtures Electrical Machinery & Equipment Fabricated Pipe & Pipe Fittings Valves & Pipe Fittings Primary Aluminum Chain Link Fencing Finished Goods, Durable Goods Rubber and Plastic Products
13-2 11-4 10-5 11-7 3498 3494 3334 1088-613 -07
1967 1967 1967 1967 6/81 12/82 6/80 1967 1967 1967
1967 base indices obtained from Monthly Labor Review, April 1978 and February 1984, Bureau of Labor Statistics, US Department of Labor. Other base indices obtained from Producer Prices and Price Indexes Data for December 1983, and from personal communication with Larry Pegram, Bureau of Labor Statistics, US Department of Labor.
The pond liner was supplied for a low bid of $48,960, which is itemized in Table 30. The bid for pond construction was $20,935, which had been reduced by $13,000 for labor to unroll the pond liner. The Town recruited local high school student volunteers to unroll the pond liner.
TABLE 30. EVAPORATION POND LINER COSTS - GILA BEND
Item As-Bid Cost (1977)
138,667 sq. ft. liner $47,300 1 shroud gasket 70 1 buffer pad 25 7 gallons seam adhesive 80 1 gallon contact adhesive 10 15 gallons solvent (TCE) 100 50 ft. sealant tape 10 Freight 1,365
Total Bid $48,960
The Town also reported contributing additional monies for pond construction in equipment use, operator and labor wages, supervision, and water (412,000 gallons at $5.00 per 1000 gallons). The approximate total cost of the evaporation pond in 1977 was $77,625.
The well (No. 4), storage tank, and pressurization system were constructed for a low bid of $382,195 (1977). Funding for the well came in part from a Basic
67
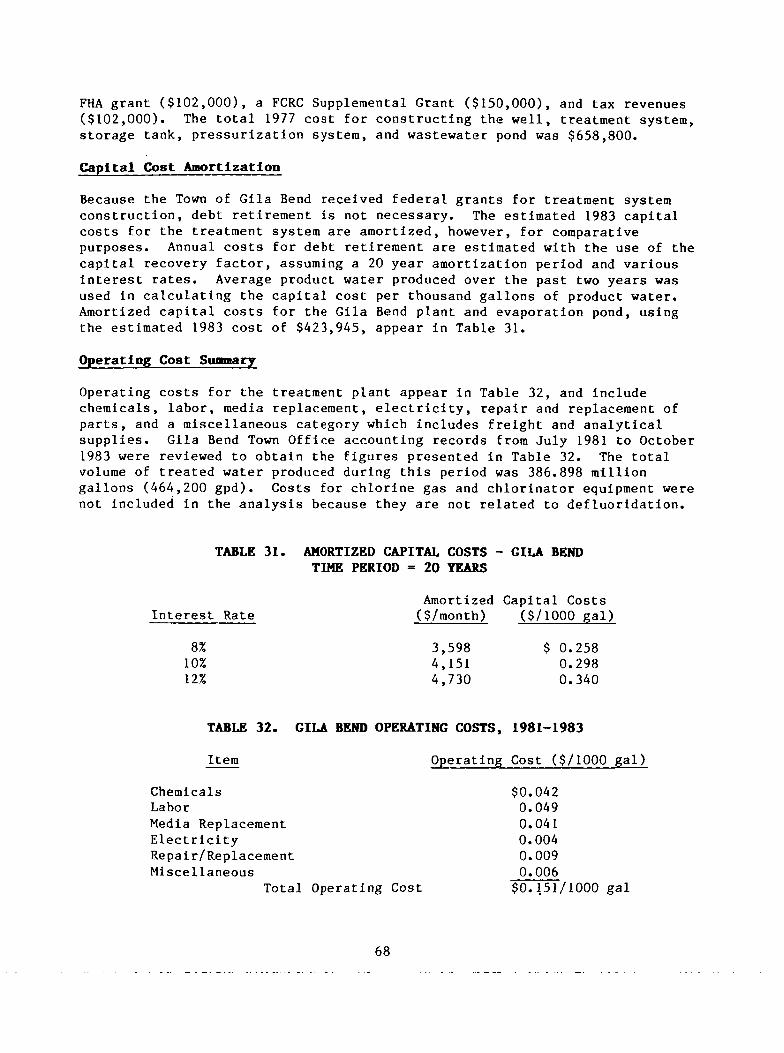
FHA grant ($102,000), a FCRC Supplemental Grant ($150,000), and tax revenues ($102,000). The total 1977 cost for constructing the well, treatment system, storage tank, pressurization system, and wastewater pond was $658,800.
Capital Cost Amortization
Because the Town of Gila Bend received federal grants for treatment system construction, debt retirement is not necessary. The estimated 1983 capital costs for the treatment system are amortized, however, for comparative purposes. Annual costs for debt retirement are estimated with the use of the capital recovery factor, assuming a 20 year amortization period and various interest rates. Average product water produced over the past two years was used in calculating the capital cost per thousand gallons of product water. Amortized capital costs for the Gila Bend plant and evaporation pond, using the estimated 1983 cost of $423,945, appear in Table 31.
Operating Cost Summary
Operating costs for the treatment plant appear in Table 32, and include chemicals, labor, media replacement, electricity, repair and replacement of parts, and a miscellaneous category which includes freight and analytical supplies. Gila Bend Town Office accounting records from July 1981 to October 1983 were reviewed to obtain the figures presented in Table 32. The total volume of treated water produced during this period was 386.898 million gallons (464,200 gpd). Costs for chlorine gas and chlorinator equipment were not included in the analysis because they are not related to defluoridation.
TABLE 31. AMORTIZED CAPITAL COSTS - GILA BEND TIME PERIOD = 20 YEARS
Amortized Capital Costs Interest Rate ($/month) ($/1000 gal)
8% 10% 12%
TABLE 32. GILA BEND OPERATING COSTS, 1981-1983
Item Operating Cost ($/1000 gal)
3. 4, 4.
,598 ,151 ,730
$ 0. 0. 0.
258 298 .340
Chemicals Labor Media Replacement Electricity Repair/Replacement Miscellaneous
Total Operating Cost
$0,042 0.049 0.041 0.004 0.009 0.006 $0,151/1000 gal
68

Operating Cost Discussion
Evaluation of operating costs is complicated by the fact that purchases made in one year (e.g. , chemicals and media) may not be used until the subsequent year. For this reason costs were reviewed over the 27 month period July 1981 to October 1983, during which 386.898 million gallons were treated. A summary of Town records and assumptions used in the analysis appears for each category presented in Table 32.
Chemicals
A summary of sulfuric acid and caustic solution purchases, obtained from Town Office accounting records, is itemized in Table 33. Caustic is sold on a dry weight basis.
TABLE 33. CHEMICAL PURCHASES - GILA BEND
Cost Unit Cost
$2,345 $0.198/lb 4,566 0.176/lb
564 0.012/lb 4,290 0. 167/lb 3,770 0.142/lb
620 0.013/lb
Total Chemical Cost = $16,155
Date
10/81 3/82 3/82 9/82 5/83 7/83
50% 50% 66° 50% 50% 66°
Item
NaOH NaOH Baume H2S04
NaOH NaOH Baume H2S04
Quantity
11,840 lbs 25,940 lbs 48,680 lbs 26,300 lbs 26,100 lbs 46,130 lbs
$16,155/386,898,000 gal = $0,042/1000 gal
Labor
Labor cost was estimated by obtaining operator salary and benefit records for 1983 and prorating this annual cost over the period from July 1981 to October 1983. The Town Office divides the operator's salary between water and sewer categories; 50 percent of his salary was used in estimating labor costs. The operator reported spending time at the plant for which he did not receive compensation, such as overtime hours spent during regeneration and media addition.
Annual salary and benefits (@ 16%) = $16,690 $16,690(.50) = $8,345 per year for operating the plant
The annual labor cost of $8,345 per year translates to $0,049 per 1000 gallons treated.
Media Replacement
Activated alumina purchased to replace that lost by attrition may not be added to treatment vessels for some time after purchase. The Town's alumina purchases made from July 1981 to October 1983 appear in Table 34.
69

TABLE 34. ALUMINA PURCHASES - GILA BEND
Date Amount Purchased Cost Unit Cost
5/82 40 Drums Wet Alumina $2,970
2/83 12,000 lbs 7,130 $0.594/lb 10/83 13,250 lbs 7,710 0.582/lb
Total Replacement Media Cost = $17,810
To account for media not used during this period, operator's records of media additions and dates were reviewed to quantify actual volumes replaced; records indicate that 26,900 pounds of alumina were added to the vessels to replace attrition losses during the specified period. (See "Media Attrition" in the Efficacy section.) Using the 1983 average bulk price for media ($0.588/lb) gives an approximate value of $15,810 for lost media (26,900 lb), yielding a cost per 1000 gallons of $0,041. This correlates well with the 1.2 percent media loss per regeneration detailed in the Media Attrition section:
(.012X380 ft3)(52.6 lbs/f t3)($. 588/lb)/3,500,000 gal = $0,040/1000 gal
Electricity
Only electricity required to pump water from ground level through the treatment system was considered in calculating the electric cost. This was estimated by assuming a head loss through the treatment system of 7 psi. The average 1983 electric cost at Gila Bend was approximately $0.06 per kilowatt-hour (Kw-hr). Calculations appear in Figure 35.
7 psi x 2.31 = 16.17 feet average head loss Pumping rate = 900 gpm Average daily flow = 464,200 gal Pump efficiency (assumed) = 0.8 Motor efficiency (assumed) =0.9
900 gal x 16.17 ft x 8.34 lbs x HP x 1 = 5.1 HP min gal 33,000 ft-lb/min (.8)(.9)
464,200 gal x min x hr = 8.60 hrs/day day 900 gal 60 min
5.1 HP x 8.60 hrs x 0.746 Kw = 32.7 Kw-hr/day day HP
32.7 Kw-hr x $0.06 x day = $0.0042/1000 gal day Kw-hr 464,200 gal
Figure 35. Process electric power consumption, Gila Bend.
70

Parts Repair and Replacement
Cost for repair and replacement of parts from July 1981 through October 1983 are itemized in Table 35.
Table 35. PARTS REPAIR AND REPLACEMENT COSTS - GILA BEND
Item Cost
Acid and caustic pumps Regeneration caustic pump Miscellaneous pump, generator, and valve repair Pressure meters
Total Repair and Replacement = $3,370
$ 1 922 ,688 670 90
$3,370/386,898,000 gal = $0,009/1000 gal
Miscellaneous
The miscellaneous category includes costs for freight, laboratory reagents, independent laboratory analyses, analytical equipment, and other miscellaneous costs, including petty cash. These costs are itemized in Table 36.
The combined capital and operating costs for defluoridation treatment at Gila Bend appear in Table 37.
TABLE 36. MISCELLANEOUS COSTS - GILA BEND
Item Cost
Freight $1,300 pH meter and probes 340 Fluoride and chlorine reagents 160 Outside laboratory services 215 Other miscellaneous 150
Total Miscellaneous = $2,165
$2,165/386,898,000 gal = $0,006/1000 gal
TABLE 37. TOTAL COSTS - GILA BEND
Interest Rate
8% 10% 12%
Capital ($/1000
$ 0. 0. 0.
Cost gal)
258 298 340
Operating Cost ($/1000 gal)
$ 0.151 0.151 0.151
Total Cost ($/1000 gal)
$ 0.409 0.449 0.491
71

Customer Costs Cost per residential customer was estimated by using the total cost per 1000 gallons treated and assuming a residential use rate of 8000 gallons per month. Total estimated customer costs appear in Table 38.
TABLE 38. CUSTOMER COSTS - GILA BEND
Capital Cost Operating Cost Total Customer Cost Interest Rate ($/month) ($/month) ($/month)
8% $2.06 $1.21 $3.27 10% 2.38 1.21 3.59 12% 2.72 1.21 3.93
The Town of Gila Bend has a public water distribution system with service connections for approximately 450 residential, 90 commercial, and 14 municipal users. The rate structure is the same for all users: $12.50 for the first 2000 gallons used per month and $1.00 for each additional 1000 gallons, plus 6 percent sales tax. The water charge includes the cost of pumping, treatment, chlorination, storage, distribution, and fire protection.
For a customer use rate of 8000 gallons per month, the costs associated with fluoride reduction at Gila Bend make up from 17 to 20 percent of the total water bill, for interest rates of 8 to 12 percent, respectively.
PALO VERDE, ARIZONA
Capital Costs
Capital costs for the treatment plant, building, and lined evaporation pond appear in Table 39. The 1980 costs of $42,450 are adjusted to 1983 dollars using the same method as employed in the Gila Bend analysis, giving an estimated 1983 value of $50,131 for the treatment system. Most of the BLS and ENR cost indices used in the Palo Verde analysis appear in Table 29; exceptions include BLS Alkalies and Chlorine (Code 2812, 12/80=100) and BLS Plastic Pipes and Fittings (Code 3079, 12/82=100).
Since only a portion of water used at Palo Verde is treated, two distribution systems are used. Estimated costs of installing treated water lines to the inn and trailer park include $1,000 for 2" PVC pipe (800 lineal feet 9 $1.25) and $400 for plumbing connections at the inn. This brings the total estimated capital cost for the treatment system to $51,531.
The expense of building the treatment system was borne by the Palo Verde Inn and Trailer Park. To effectively compare this expense with the costs of other treatment systems, estimated 1983 capital costs are amortized over a 20 year period with various interest rates; the amortized capital costs appear in Table 40.
72

Production rates have dropped considerably at Palo Verde over the past year, almost 40 percent below the flow rates used in cost analysis reported earlier (39). Average daily production from October 1980 through March 1984 is 7200 gpd (9,192,000 gallons total); this figure was used in estimating the capital cost per 1000 gallons treated. (Monthly operational records have been kept since October 1980.) If the average production over the past year (4340 gpd) was used in the analysis, the capital cost per 1000 gallons would increase by approximately 65 percent.
Operating Costs
Calculation of operating costs at Palo Verde is difficult, as treatment-related expenses are not always separated from other expenses at the facility, and records, if they exist, are often incomplete. Operator's records of total chemical consumption have been kept for the period March 1, 1983 to March 31, 1984. Production during this period was 1.7201 million gallons (4340 gpd); this figure was used in calculating the chemical cost per 1000 gallons.
Labor costs are somewhat artificial. Records over the past year show an average of 45 hours per month of operator's time spent at the plant when production was 4340 gpd. The monthly labor requirement (45 hours) was also reported by the facility manager when production was over 7000 gpd. For this reason, labor costs per 1000 gallons were calculated assuming 45 hours per month of operator time and using the average production rate from October 1980 through March 1984 (7200 gpd).
Costs for media replacement were obtained by summation of media additions to all vessels, using the total production of 10.64 million gallons; this includes water used in 1979 to develop operating criteria for the plant. Costs for repair and replacement of parts were calculated in the same manner.
A breakdown of operating costs at Palo Verde appears in Table 41, followed by a brief discussion of each category listed in Table 41. ("Miscellaneous" costs were not available.)
73

TABLE 39. PALO VERDE CAPITAL COSTS
Item
Plastic Valves
Plastic Fittings
PVC Pipe
Chemical Metering Pumps
1980 Cost
$871
771
112
612
Index Used
BLS Plastic Pipe & Fittings
.,
..
BLS General Purpose Machinery
Annual 1980
110.0
110.0
110.0
264.3
Index Avg. 1983
113.5
113.5
113.5
308.2
Estimated 1983 Cost
899
796
116
714
& Equipment
Magnetic Drive Pump 297
Regeneration Caustic Pump
367
Chemical Mixer 89
Paddle Wheel Sensor 125
3 Vinylester 3,341 Tanks, 36" x 72"
BLS Producer Price Index, Durable Goods
264.3
264.3
264.3
264.3
204.9
308.2
308.2
308.2
308.2
233.1
346
428
104
146
3,801
2 Fiberglass Tanks
2 Water Meters
pH Meter and Probes
Freight and Storage
Fencing
Miscellaneous
2800 lbs. F-l Activated Alumina
Chlorine Disinfectant
923
761
434
500
650
577
1,609
85
..
..
..
..
..
BLS Primary Aluminum
BLS Alkalies & Chlorine
204.9
204.9
204.9
204.9
204.9
204.9
102.6
94.4
233.1
233.1
233.1
233.1
233.1
233.1
110.2
109.6
1,050
866
494
569
739
656
1,728
99
Engineering & 9,265 Assembly, Subcontracted
Design, Overhead, 9,261 & Profit
10.9411
10.9371
74

TABLE 39. PALO VERDE CAPITAL COSTS (continued)
Building
Evaporation Pond
4,000
7,800
TOTAL 1980 COST $42,450
ENR Building 287.73 352.89 4,906 Cost Index (1967)
ENR Construction 301.44 378.56 9,796 Cost Index (1967)
TOTAL ESTIMATED 1983 COST $50,131
1 1983 engineering cost estimates based on 1980 percentage of project costs (27.9%).
TABLE 40. AMORTIZED CAPITAL COSTS - PALO VERDE TIME PERIOD = 20 YEARS
Interest Rate
8% 10% 12%
Amortized Capital Costs ($/month) ($/1000 gal
$438 505 575
$2.03 2.34 2.66
TABLE 41. PALO VERDE OPERATING COSTS
Item Operating Cost ($/1000 gal
Chemicals Labor Media Replacement Electricity Repair/Replacement
$0,252 2.546 0.146 0.003 0.085
Total Operating Cost = $3,032/1000 gal
Chemicals
The most recent plant operator has kept the best records to date on chemical consumption. Records for the period March I, 1983 to March 31, 1984 were reviewed to give a total consumption of 765 pounds of caustic soda bead and 91 gallons of sulfuric acid. During this period, 1.7201 million gallons were treated (4340 gpd).
In May 1983 the operator began using 40 percent sulfuric acid for raw water pH adjustment in place of the more concentrated 66° Baume sulfuric acid (93 percent). The switch was made to permit more accurate adjustment of the metering pump used for acid. 66° Baume acid is still used for media neutralization after regeneration. Relative amounts of each grade of sulfuric acid used were not available; the unit cost for 66° Baume acid was used in calculations.
Sulfuric Acid - 95 gal. @ $1.90/gal. = $180.50 ($0,105/1000 gal) Caustic Soda Bead - 765 lbs. @ $0.33/lb. = $252.45 ($0,147/1000 gal) Total Chemical Cost = $0,252/1000 gal
75

This reflects a decrease in chemical costs from those reported earlier (39), because of more efficient chemical handling and decreased chemical costs. Unit cost for regenerant is approximately twice the cost of regenerant at Gila Bend, and unit acid costs are almost ten times those at Gila Bend because of smaller volume purchase.
Labor
Operating the treatment system is just one of the duties assigned to the operator at the Palo Verde facility. The plant is operated at higher than designed flow rates to minimize required operator time. Flow rates during the study period averaged between 65 and 70 gpm. At a daily flow of 4340 gpd (1983-84) this would mean that slightly more than one hour per day would be required to produce water to meet the low demand at the site. Media regenerations take four to seven hours to perform. The operator reportedly spends approximately 45 hours per month at the plant, regardless of average daily production. Labor costs were calculated using the historical average daily production (7200 gpd). If 1983-84 production rates were used, the labor cost would be $4.21/1000 gallons (a cost which does not represent the labor requirements of the plant).
45 hrs/month @ $10.50/hr. (+ 16% fringe) = $548.10/month ($2,546/1000 gal)
Labor costs demonstrate the most dramatic effect on increased operational costs as net production decreases.
Media Replacement
Review of plant records indicates that 2220 pounds of replacement alumina have been added to the three vessels since plant start-up. Approximately 10.64 million gallons have been treated during this period, giving an average media attrition rate of 208.6 pounds per million gallons treated. Water Treatment Engineers reported a price of $0.70 per pound for activated alumina, yielding an average media replacement cost of $0,146 per thousand gallons.
Electricity
Electrical costs for pumping water through the treatment system were approximated by calculating the power output required to overcome the head loss (assumed) resulting from pumping water through the treatment system. Assuming a 4 psi head loss (9.24 feet) gives a value roughly proportional to that of the Gila Bend plant, with respect to the static head resulting from vessel height. Calculations appear in Figure 36.
Parts Repair and Replacement
Costs for repair and replacement of parts from October 1980 through March 1984 are itemized below; costs for new equipment purchases are not included. Since plant start-up, the facility has spent $610 on a pH alarm system and $440 on a standby caustic pump. Costs are itemized in Table 42.
76

4 psi x 2.31 = 9.24 feet average head loss Pumping rate = 65 gpm Average daily flow (1980-84) = 7200 gpd Pump efficiency (assumed) =0.7 Motor efficiency (assumed) = 0.8
65 gal x 9.24 ft x 8.34 lbs x HP x 1 = 0.27 HP min gal 33,000 ft-lb/min (.7)(.8)
7200 gal x min x hr = 1.8 hrs/day day 65 gal 60 min
0.27 HP x 1.8 hrs x 0.746 Kw = 0.36 Kw-hr/day day HP
0.36 Kw-hr x $0.06 x day = $0,003/1000 gal day Kw-hr 7200 gal
Figure 36. Process electric power consumption, Palo Verde.
TABLE 42. PARTS REPAIR AND REPLACEMENT COSTS - PALO VERDE
Date Item Cost
3/84 Caustic pump repair $104 3/84 Repair pulsor and valve 77 3/84 Replace pump diaphragm 13 11/83 Repair pH meter 239 8/83 Replace paddle wheel flow sensor 160 3/83 Repair 3-way valves (2) 54 8/81 Replace pH probes 133
Total Repair and Replacement = $780 ($0,085/1000 gal)
The total costs for central treatment at Palo Verde appear in Table 43.
TABLE 43. TOTAL COSTS - PALO VERDE
Capital Cost Operating Cost Total Cost Interest Rate ($/1000 gal) ($/1000 gal) ($/1000 gal)
8% $ 2.03 $ 3.03 $ 5.06 10% 2.34 3.03 5.37 12% 2.66 3.03 5.69
77

NORTH MYRTLE BEACH, SOUTH CAROLINA
The City of North Myrtle Beach was the site of a pilot demonstration performed by Rubel and Hager, Inc., for the purpose of estimating costs for central treatment of the City's water supply, which contains more than 5 mg/L fluoride. The project consisted of four treatment runs of raw water (from Well No. 3) through a column containing one ft3 of F-l activated alumina. Treatment runs were conducted at various influent pH levels: 5.5/5.7, 5.7, 6.1, and 6.3. The pH during the first treatment run was raised from 5.5 to 5.7 when it became apparent that local acid costs and high raw water alkalinity prohibited cost effective operation at pH 5.5. The optimum pH for fluoride removal under these circumstances was determined by Rubel and Hager to be 6.3. The complete text of the Rubel and Hager report is contained in Appendix A.
High acid costs are not the only factor which makes treatment for fluoride reduction expensive and difficult. The City does not have one central water supply; it is supplied by ten individual wells. The wells are spaced so as to make one fluoride reduction plant an impractical solution. Also, evaporation ponds for regeneration waste in South Carolina are not feasible because of climate. Waste storage tanks would need to be constructed. Waste from these tanks would be bled into the sewerage system at a rate which would control loading on the sewage treatment plant.
Capital Costs
Rubel and Hager's estimated capital costs for central treatment at North Myrtle Beach are $1,900,000 (1982). This figure includes construction of ten individual 500 gpm treatment systems ($151,000 each), construction of a chemical rail terminal for bulk delivery of caustic soda and sulfuric acid ($170,000), purchase of two chemical tank trucks ($25,000 each), contingencies ($75,000), and engineering, including design, supervision, and startup ($95,000). An allowance of $5,000 per site is included for extensions of the City's sewer system to dispose of regeneration wastewater.
Although the estimated 1982 cost adjustment to 1983 dollars accounts for an increase of less than two percent, it is presented to conform with capital costs analyses used for the Arizona central plants. The individual treatment system capital cost breakdown and adjustment appear in Table 44, the chemical rail terminal costs are presented in Table 45, and the total estimated 1983 capital costs of $1,925,000 are itemized in Table 46.
The City Engineer's Office of North Myrtle Beach provided additional cost estimates for wastewater disposal, auxiliary chemical feed equipment (required under South Carolina State Primary Drinking Water Regulations), plumbing alterations, and land acquisition. Excepting land acquisition, these estimated costs are itemized in Table 47, bringing the total estimated central treatment costs to $2,127,000. Estimated land acquisition costs, including $14,000 for well site expansion and $21,000 for construction of a rail spur, were omitted because land costs were not included in the Gila Bend and Palo Verde cost discussions. This issue would need consideration, however, if the City were to have central treatment facilities constructed.
78

TABLE 44. CAPITAL COST ESTIMATE - INDIVIDUAL TREATMENT SYSTEM, N. MYRTLE BEACH
Estimated Item 1982 Cost Index Used
Treatment Vessels $22,000 BLS Carbon Steel & Platform Tanks & Vessels
Process Piping 10,000 BLS Fabricated & Accessories Pipe & Fittings
Treatment Media 10,000 BLS Primary Aluminum
Chemical Storage Tanks
Chemical Pumps, Piping & Accessori
Forced Draft Aerator & Blower
es
12,000
7,000
12,000
12,000 BLS General Purpose Machinery & Equip.
Annual 1982
122.5
105.9
106.8
304.0
304.0
304.0
304.0
-
-
-
304.0
Index Avg. 1983
120.7
105.5
110.2
308.2
308.2
308.2
308.2
-
-
-
308.2
Estimated 1983 Cost
$21,670
9,960
10,320
12,170
7,100
12,170
5,070
18,120
5,020
2,040
25,340
Pressurization Pump 5,000
Mechanical Instl. 18,000 ((? 23.1% of above)
Electrical Instl. 5,000 (@ 6.4% of above)
Painting 2,000 (@ 2.6% of above)
Wastewater Surge 25,000 BLS General Purpose 304.0
Tank Machinery & Equipment
Slabs, Founda- 12,000 ENR Construction 355.26 378.56 12,790 tions, Earthwork, Cost Index (1967) Site Work & Fence
Building 3,000 ENR Building Cost 330.10 352.89 3,210
Index (1967)
Freight & Taxes 8,000 (@ 5.6% of above) - - 8,120
ESTIMATED 1982
COST $151,000 ESTIMATED 1983 COST $153,100
79
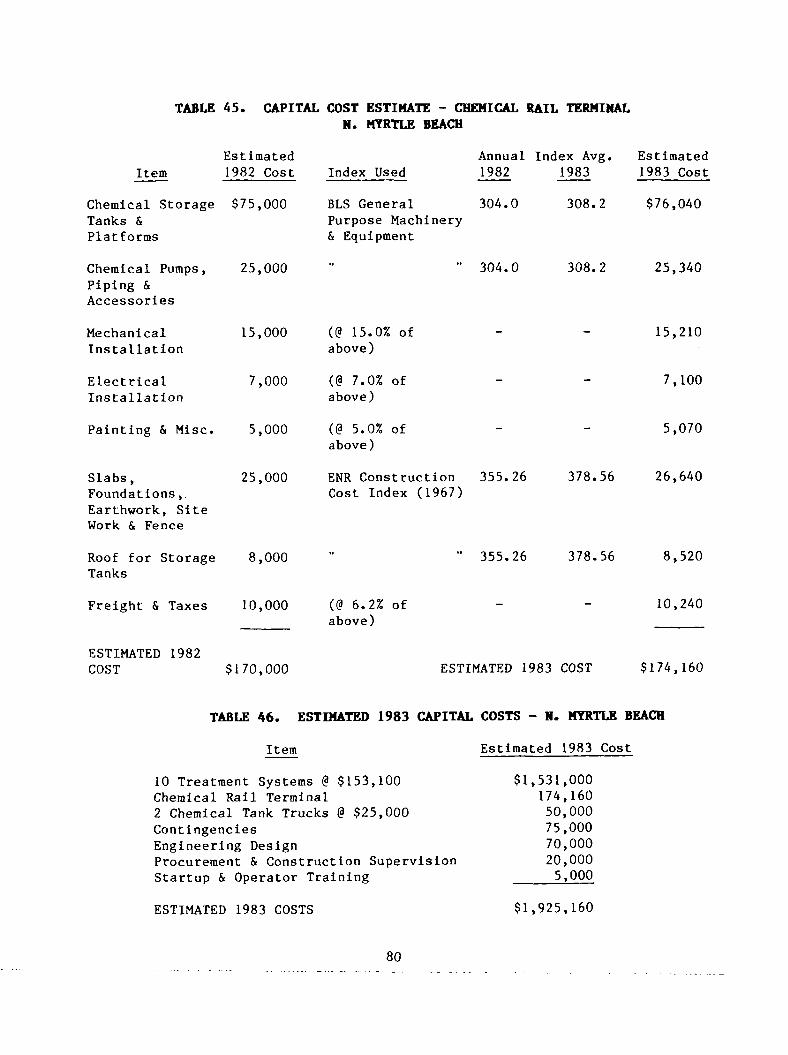
TABLE 45. CAPITAL COST ESTIMATE - CHEMICAL RAIL TERMINAL N. MYRTLE BEACH
Item Estimated 1982 Cost Index Used
Annual Index Avg. 1982 1983
Chemical Storage $75,000 Tanks & Platforms
Chemical Pumps, 25,000 Piping & Accessories
Mechanical 15,000 Installation
Electrical 7,000 Installation
Painting & Misc. 5,000
Slabs, 25,000 Foundations,. Earthwork, Site Work & Fence
Roof for Storage 8,000 Tanks
Freight & Taxes 10,000
BLS General 304.0 308.2 Purpose Machinery & Equipment
M 304.0 308.2
(@ 15.0% of above)
(@ 7.0% of above)
(@ 5.0% of above)
ENR Construction 355.26 378.56 Cost Index (1967)
355.26 378.56
«? 6.2% of above)
Estimated 1983 Cost
$76,040
25,340
15,210
7,100
5,070
26,640
8,520
10,240
ESTIMATED 1982 COST $170,000 ESTIMATED 1983 COST $174,160
TABLE 46. ESTIMATED 1983 CAPITAL COSTS - H. MYRTLE BEACH
Item
10 Treatment Systems @ $153,100 Chemical Rail Terminal 2 Chemical Tank Trucks @ $25,000 Contingencies Engineering Design Procurement & Construction Supervision Startup & Operator Training
Estimated 1983 Cost
$1,531,000 174,160 50,000 75,000 70,000 20,000 5,000
ESTIMATED 1983 COSTS $1,925,160
80

TABLE 47. TOTAL CAPITAL COST ESTIMATE - N. MYRTLE BEACH
Item Estimated Cost
Disposal costs, including three new pumping systems $191,000 Auxiliary chemical feed equipment @ $1,000 per site 10,000 Chlorinator replumbing @ $100 per site 1,000 Adjusted Rubel & Hager estimate $1,925,160
TOTAL ESTIMATED CAPITAL COSTS $2,127,160
Capital Cost Amortization
Estimated 1983 capital costs were amortized for 20 years at various interest rates, and appear in Table 48. The cost per 1000 gallons was based on an average flow of two mgd.
TABLE 48. AMORTIZED CAPITAL COSTS - N. MYRTLE BEACH TIME PERIOD = 20 YEARS
Amortized Capital Costs Interest Rate ($/month) ($/1000 gallons)
8% $18,055 $0,301 10% 20,821 0.347 12% 23,732 0.395
Operating Costs
Rubel and Hager's estimated operating costs (see Appendix B), based on an average two mgd operation, are $0,196/1000 gallons of treated water, and include chemical, labor, and energy costs. Estimated chemical costs account for $0,123/1000 gallons at pH 6.3. The estimated labor costs of $.04/1000 gallons are based on a figure of $30,000 per year for operating labor. The City Engineer's Office provided a labor cost estimate of $49,500 per year, which is itemized in Table 49.
TABLE 49. ESTIMATED LABOR COSTS - N. MYRTLE BEACH
Estimated Annual Labor (Including 30% Fringe)
One Class A Operator $26,000 One Maintenance Person 19,500 Vehicle Support @ $2,000/person 4,000
TOTAL ESTIMATED LABOR COST $49,500
At an average flow of two mgd, this estimated labor cost accounts for $0,068/1000 gallons, bringing the total estimated operating costs to $0,224/1000 gallons.
81

Customer Costs
There are 4953 3/4" service connections in the community with an individual average use of 8000 gallons per month (1.32 mgd). These service connections are for residential customers except for a few small businesses. Residential water use accounts for approximately 90 percent of total use (one to two mgd) from mid-September to mid-May. During the summer months the community uses approximately four mgd, 60 percent of which is used by commercial water customers. Customer costs are based on an individual average residential use of 8000 gallons per month and a total community flow of two mgd on the average. Customer cost estimates appear in Table 50.
TABLE 50. ESTIMATED CUSTOMER COSTS - N. MYRTLE BEACH
Capital Cost Operating Cost Total Customer Cost Interest Rate ($/month) ($/month) ($/month)
8% $2.41 $1.79 $4.20 10% 2.78 1.79 4.57 12% 3.16 1.79 4.95
The existing water rate in North Myrtle Beach is the same for all water users: $5.00 for the first 3000 gallons and $1.00 per each additional 1000 gallons. For an average residential use of 8000 gallons per month, the monthly water bill is $10.00. To accommodate the operating costs of central treatment for fluoride reduction, the rates would need to be increased by approximately 18 percent. Rate increases of approximately 46 percent would be necessary to cover both capital and operating costs for central treatment.
82
SECTION 7.
EFFICACY OF POINT-OF-OSE TREATMENT
Point-of-use (POU) treatment devices were monitored in Arizona and Illinois communities for use rates, effectiveness of fluoride reduction, and bacteriological quality. Six communities used activated alumina (AA) POU devices, and one community used POU reverse osmosis (RO) treatment. Monitoring was accomplished with water sample collection and analysis and the reading of water meters installed on treated water lines.
The Arizona communities were already treating their water supplies with POU AA devices when project monitoring began. They include the subdivisions of Thunderbird Farms and Papago Butte, the Ruth Fisher School, and the You & I Trailer Park. In the Illinois communities of Parkersburg and Bureau Junction, fluoride reduction was not practiced until AA devices were installed for project data collection. A demonstration of POU RO efficacy was conducted at Emington, Illinois.
The following section includes brief summaries of each community's POU treatment approach and results of analyses performed on water samples.
ARIZONA COMMUNITIES
Because of the remote locations of Arizona POU sites, sample collection and shipment were sometimes difficult to perform. Attempts were made to collect water samples on as regular a basis as possible.
Thunderbird Paras
The community of Thunderbird Farms is an operating water quality district located southwest of Phoenix in Maricopa County. Water meters were placed on several existing AA installations at Thunderbird Farms to measure treated water use and to monitor performance. Raw water fluoride concentration averaged 2.6 mg/L during the study. The water contains dissolved silica (Si02) and trace amounts of arsenic. Raw water alkalinity is 200 mg/L as CaC0 3.
Each lot with an active water service is equipped with a device containing 1/2 cubic foot of activated alumina. Devices are installed in the public right-of-way to provide easy access for monitoring and maintenance. Each unit is housed underground at the property line in a plastic sleeve and covered with a plastic meter box. Raw (domestic) water is supplied to the device from the household's water service.
83

Since freezing is not a problem in Arizona, shallow underground piping is used. Installation of piping on private property is the homeowner's responsibility; this includes making a connection from the POU device to a drinking water tap in the home, usually installed at the kitchen sink. This approach has led to some problems. Two devices equipped with product water meters were exhausted prematurely because homeowners had routed the entire home's water supply through the cartridges. Another problem associated with installing AA devices outside is cementing of media fines, which is enhanced in a hot, arid climate. Cementing can occur when the device is allowed to stand for several months in the heat without any flow through the bed.
Consumption of treated water averaged less than 0.5 percent of the whole household's water use. Water use data collected over the two year study period appear in Table 51. Treated water use averaged 1.4 gpd per household for standard line bypass installations, and 0.4 gpd per person.
TABLE 51. WATER USE RATES - THUNDERBIRD FARMS
Site
30 122 11 116 160 334 92
224*
Average Treated
0.1 3.2 2.0 0.7 1.8 1.9 0.4 4.1
Water Use (gpd) Entire House
330 350 260 430 580 200 730 90
Percentage of Entire
For House Used Drinking
<0.1% 0.8% 0.8% 0.2% 0.3% 0.9%
<0. 1% 4.6%
Average 1.4 - 0.5%
*Device connected to entire kitchen cold water supply; not used in calculation of average.
Results of analyses performed on treated water samples indicate that the devices reduce fluoride effectively, and in several cases have done so for more than two years. Of eight units monitored, five were already in service for several months before sampling began. Cumulative volume treated by these devices, prior to sampling, may be greater than that projected from measured use rates. (Some families reportedly watered their lawns with treated water when installations were new.) A fluoride removal efficacy summary for monitored units appears in Table 52. Included are the measured gallons treated, average effluent fluoride concentration, fluoride concentration in the latest product water sample, total service life, and the unmonitored period before project sampling began.
84

TABLE 52. POD AA EFFICACY - THUNDERBIRD FARMS
Site
11 160 334 122 116 209 224 92
Measured Volume Treated (gallons)
1540 1380 1370 500 410 670 1290 110
Average Effluent Fluoride (mg/L)
<0.2 <0.2 0.2 0.9 0.8 -0.2 0.2
Latest Effluent Fluoride (mg/L)
<0.2 0.3 0.5 1.7 1.7 1.9 0.2 0.2
Service Life1
(months)
30+ 29+ 32+ 9 26 13 12+ 12+
Unmonitored Period2
(months)
5 4 7 4 7 --—
Time in service until effluent flouride reached MCL of 1.4 mg/L. Sites 11, 160, 334, 224, and 92 were still in service at this writing.
2 Time from device installation to product water meter installation.
Results from sites 11, 160, and 334 demonstrate that devices are capable of reducing fluoride to acceptable levels, with normal use patterns, for periods exceeding two years. The device at site 11, which was in use for 5 months before sampling began, was still producing virtually fluoride-free water after treating 1540 measured gallons (410 bed volumes). If this cumulative volume were divided by the average use rate of 1.4 gpd, an average device would be expected to last 3.0 years at Thunderbird Farms. The device at site 224 was producing water with fluoride levels at or below 0.2 mg/L at this writing, after 1290 total gallons. This device was equipped with a product water meter when first installed.
The device at site 122 had only a nine month service life. Monitoring began four months after installation. During this study, the device processed 500 gallons with an average fluoride concentration of 0.9 mg/L. The quantity treated before meter installation is uncertain, and may have been substantially greater than an average measured use rate would indicate.
This is also the case with site 116, where the unit was in service for seven months before sample collection. Only 410 gallons were measured before effluent fluoride concentrations exceeded the MCL. A low use rate may have led to partial cementing of media and resultant short-circuiting. The unit had a cemented tank, when replaced.
At site 209, where occupants were away for several months after putting the device in service, it had to be replaced because it was cemented. (A sample collected after the family returned home indicated that fluoride and silicon had broken thorough the media, after 670 total gallons.)
85
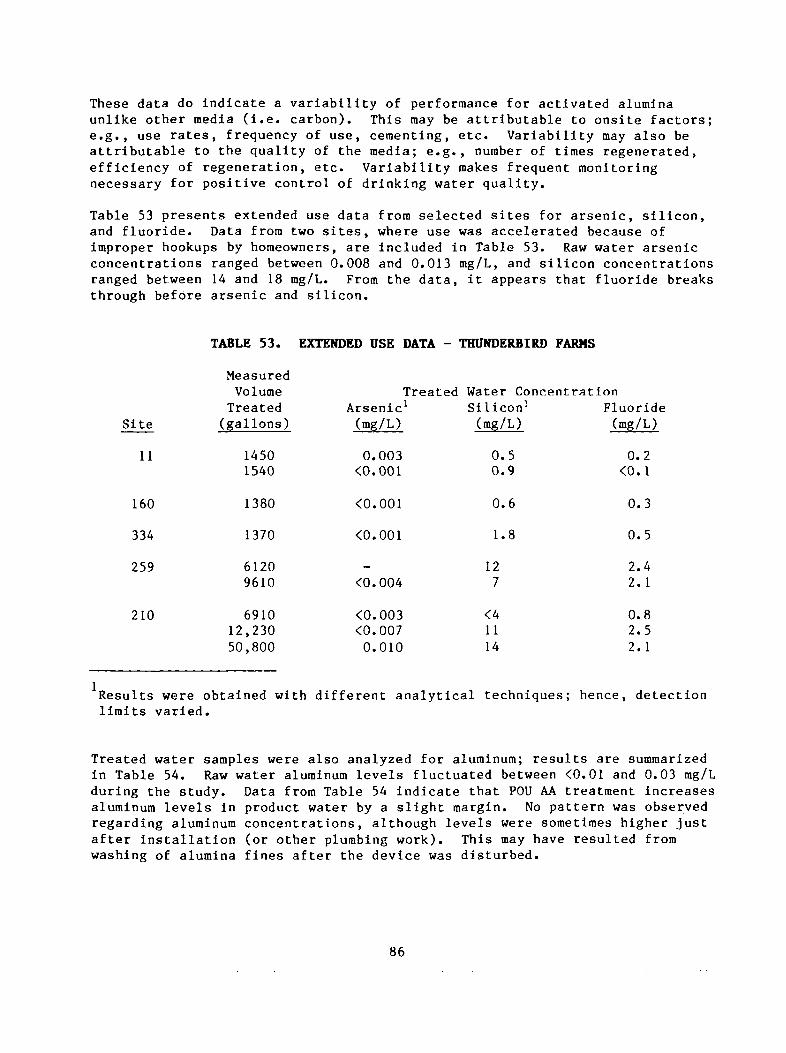
These data do indicate a variability of performance for activated alumina unlike other media (i.e. carbon). This may be attributable to onsite factors; e.g., use rates, frequency of use, cementing, etc. Variability may also be attributable to the quality of the media; e.g., number of times regenerated, efficiency of regeneration, etc. Variability makes frequent monitoring necessary for positive control of drinking water quality.
Table 53 presents extended use data from selected sites for arsenic, silicon, and fluoride. Data from two sites, where use was accelerated because of improper hookups by homeowners, are included in Table 53. Raw water arsenic concentrations ranged between 0.008 and 0.013 mg/L, and silicon concentrations ranged between 14 and 18 mg/L. From the data, it appears that fluoride breaks through before arsenic and silicon.
TABLE 53. EXTENDED DSE DATA - THUNDERBIRD FARMS
Fluoride (mg/L)
0.2 <0.1
0.3
0.5
2.4 2.1
0.8 2.5 2.1
Results were obtained with different analytical techniques; hence, detection limits varied.
Treated water samples were also analyzed for aluminum; results are summarized in Table 54. Raw water aluminum levels fluctuated between <0.01 and 0.03 mg/L during the study. Data from Table 54 indicate that POU AA treatment increases aluminum levels in product water by a slight margin. No pattern was observed regarding aluminum concentrations, although levels were sometimes higher just after installation (or other plumbing work). This may have resulted from washing of alumina fines after the device was disturbed.
Site
11
160
334
259
210
Measured Volume Treated (gallons)
1450 1540
1380
1370
6120 9610
6910 12,230 50,800
Treated Arsenic1
(mg/L)
0.003 <0.001
<0.001
<0.001
—
<0.004
<0.003 <0.007 0.010
Water C( Silicon (mg/L)
0.5 0.9
0.6
1.8
12 7
<4 11 14
86

TABLE 54. ALUMINUM RESULTS - THUNDERBIRD FARMS
No. of Samples
9 14 12 14 10 6 8 3 6 5 6
Mean
0.10 0.10 0.07 0.06 0.32 0.18 0.16 0.15 0.66 0.02 0.02
Aluminum (mg/L)
0.06 0.03 0.015 0.04 0.02 0.14 0.11 0.08 0.10 0.02 0.02
.03 -<.01 -<.01 -.02 -.01 -.02 -.04 -.07 -.02 -
<.01 -.01 -
.32 1.00 .51 .29 3.00 .40 .35 .30 2.80 .05 .02
Site Samples Mean Median Range
122 11 116 160 334 92 224 210 209 30 259
All Sites 93 0.15 0.04 <.01 - 3.00
Papago Butte
The subdivision of Papago Butte Ranches is a water quality district which lies adjacent to Thunderbird Farms. Fluoride reduction is accomplished with 1 ft3
AA devices connected in a manifold assembly and housed in a small outbuilding. Each outbuilding serves a small mini-system, or lateral, consisting of a pressure tank and water meter. Irrigation water is pressurized for a domestic supply; a portion of this water is bypassed and treated with activated alumina. Treated water is piped to the property line; homeowners are required to make the connection to the kitchen sink. Eight laterals serve the growing community.
Raw water fluoride concentration fluctuated between 2.2 and 2.7 mg/L during sample collection. As with Thunderbird Farms, dissolved silica and trace amounts of arsenic are present. Alkalinity is 210 mg/L as CaC03.
Monitoring was performed at Lateral 8, where only one device was in service during project data collection. The device was used at an average rate of 18.3 gpd by three families, and processed over 9500 gallons (1270 bed volumes) with effluent within the fluoride MCL. Product water fluoride concentrations appear in Table 55. With comparable challenges at Thunderbird Farms and Papago Butte, it appears that the 1 ft unit performed more effectively. The larger media volume of the unit used at Papago Butte allows more contact time, resulting in more efficient performance.
Product water was occasionally analyzed for aluminum, silicon, and arsenic; results appear in Table 55. Raw water concentration ranges were <0.01-0.04 mg/L for aluminum, 14-17 mg/L for silicon, and 0.008-0.013 mg/L for arsenic. Except for one instance, aluminum concentrations did not increase significantly during treatment.
87

TABLE 55. TREATED WATER ANALYTES - PAPAGO BUTTE (1 ft3 Device)
Volume Treated Aluminum Silicon Arsenic Fluoride (gallons) (mg/L) (mg/L) (mg/L) (mg/L)
0 0.04 - - <0.1 2410 0.01 - - 0.1 3460 - - 0.3 4600 0.03 <1 <0.005 1.0 5500 0.01 <1 - 0.7 6250 2.20 - - 0.8 7540 0.08 - <0.001 1.0 8920 0.04 - <0.001 1.2 9090 0.03 - <0.001 1.1 9220 0.11 - <0.001 1.2 9350 0.05 1.5 0.005 1.3 9510 0.02 1.5 <0.001 1.3
Ruth Fisher School
Fluoride reduction at the Ruth Fisher School is performed with two AA devices, serving four drinking fountains. Raw water fluoride ranged between 4.1 and 4.7 mg/L during sample collection. Alkalinity is 80 mg/L as CaC03.
A standard 1/2 ft unit, installed in August 1981 with virgin media, was regenerated and put in service three times during the sample collection period. Treated water use rates averaged between 7.4 and 9.5 gpd. Fluoride results appear in Table 56 and are presented graphically in Figure 37. Sample collection at this site was sporadic. Limited data indicate variations in efficacy after the regeneration process. Performance appeared most effective after the second of three regenerations.
The regeneration process for P0U devices is basically the same as in central treatment; upflow backwash, upflow regeneration with 1.5 percent NaOH to pH 12.5, upflow rinse, downflow regeneration, and downflow neutralization. For media neutralization, raw water adjusted to the pH 2-2.5 range is passed through the bed. Effluent pH is approximately 12 at first, then drops as the bed neutralizes. When effluent pH drops to the 4-4.5 range, the acid feed is cut off. Effluent pH slowly rises to the 8-10 range, when acid feed is reintroduced. This cycle is continued until the effluent pH stops rising above 6; this is usually accomplished in two or three cycles.
Results of aluminum, silicon, and arsenic analyses also appear in Table 56. Raw water concentration ranges were 0.01-0.02 mg/L for aluminum, 7-8 mg/L for silicon, and 0.008-0.012 mg/L for arsenic.
88

00
• • • " " " o - • • •
+
•
°
• After 1st regeneration o After 2nd regeneration • After 3rd regeneration
——-""
o
-•— Raw water
Treated water
o
Cumulative Volume Treated (gallons)
Figure 37. Product water fluoride versus volume treated, Ruth Fisher School.

TABLE 56. TREATED WATER ANALYTES - RUTH FISHER SCHOOL (1/2 ft3 Device)
Regeneration 1:
Regeneration 2:
Regeneration 3:
Volume Treated (gallons)
310 1000
485 925 1530
730 1000 1100 1330
Aluminum (mg/L)
0.04 0.05
0.01 0.01 0.03
0.08 -
0.25 0.85
Silicon (mg/L)
<5 <3
<1 <1 -
1.4 --1.5
Arsenic (mg/L)
<0.004
<0.005 -
<0.001
<0.001 -
<0.001 0.004
Fluoride (mg/L)
0.1 1.2
<0.2 <0.1 1.0
0.9 1.7 2.4 2.85
You and I Trailer Park
Groundwater at the You and I Trailer Park is treated with a 1 ft3 AA device located near the park entrance. The device was installed in March 1983 and has been used at a rate of 5.5 gpd. Approximately 16 people resided at the park during the sampling period. Fluoride and arsenic are present in excess of the MCLs; fluoride concentrations have ranged between 15.0 and 16.1 mg/L, and arsenic has ranged between 0.071 and 0.093 mg/L. Raw water alkalinity is 40 mg/L as CaC03.
Approximately 2500 gallons (330 bed volumes) were treated with effluent fluoride levels at or below detection limits. The high fluoride challenge resulted in an exchange capacity of almost 2300 grains/ft3, a figure typical of that obtained in central treatment systems. Breakthrough occurred between 2490 and 2860 cumulative gallons, where effluent fluoride increased from <0.1 to 4.9 rag/L.
It appears that arsenic is still favorably adsorbed after breakthrough of fluoride. Table 57 presents treated water analytes, including aluminum and silicon. Raw water aluminum concentrations, generally higher than in treated water, have ranged between 0.01 and 0.09 mg/L. Silicon concentrations in raw water have been between 8.8 and 10.6 mg/L.
90

TABLE
Volume Treated (gallons)
230 450 590 975 1410 1750 2490 2860
57. TREATED WATER ANALYTES - YOD
Aluminum (mg/L)
0.76 0.07
<0.01 <0.01 0.20 0.01 --
(1 ft Device)
Silicon (mg/L)
---0.5 -0.25 0.2 -
AND I TRAILER
Arsenic (mg/L)
— 0.045
<0.001 <0.001 0.002 0.003
<0.001 <0.001
PARK
Fluoride (mg/L)
<0.1 -
<0. 1 <0.1 0.1
<0. 1 0.1 4.9
ILLINOIS COMMUNITIES
Activated Alumina
POU AA devices were put in service and monitored in two small Illinois communities, Bureau Junction and Parkersburg. Equipment was installed in participants' homes by local plumbing contractors, and sample collectors were selected and trained by NSF staff. Seventeen devices were originally installed in Bureau, and ten in Parkersburg. When Bureau residents noticed an apparent improvement in the water's taste after treatment, interest in participation grew, and another 23 devices were put in service, bringing the total participants to 40. Homeowners claimed that the devices removed some of the water's sulfide taste. Most units in Parkersburg were installed under the kitchen sink; in Bureau, most units were installed in basements.
In Bureau Junction, raw water fluoride concentration ranged between 5.2 and 6.6 mg/L, and in Parkersburg, fluoride levels ranged between 6.4 and 7.2 mg/L. The fluoride MCL for Bureau Junction is 2.0 mg/L, and for Parkersburg it is 1.8 mg/L. Alkalinity of the raw water is 540 mg/L as CaC03 in Bureau and 1000 mg/L in Parkersburg. The groundwater in both communities is brackish; Bureau water averages 770 mg/L sodium, and Parkersburg water averages 670 mg/L sodium.
To provide optimal fluoride levels in treated water, a bypass assembly was installed with the devices. The cold water line was tapped to provide an influent supply. This was split into two lines, one line going into a water meter and then directly into the device. The other line contained a 3/8 inch plug valve, which was adjusted to blend enough raw water into the final product to give fluoride levels between 0.9 and 1.2 mg/L. Bypass valves were adjusted by the sample collector, who used a colorimetric field kit to monitor product fluoride levels.
Treated water use rates were lower in these communities than in Arizona communities. Average use rates are summarized in Table 58 for Parkersburg and Bureau Junction. Because of the bypass assembly, these rates represent only
91

the water going directly through the device. Total water used for drinking depends on the volume bypassed, which was approximately 15 percent greater than that metered. The average measured use rate per person was 0.2 gpd in Bureau Junction and 0.15 gpd in Parkersburg.
TABLE 58. TREATED WATER USE RATES - ILLINOIS COMMUNITIES
Treated Water Consumption (gallons per day)
Average Median Range
Parkersburg 0.6 0.65 0.15 - 1.6
Bureau Junction 0.8* 0.65 0.3 - 1.8
*Does not include school installation (3.8 gpd) and home installation connected to bathroom cold water supply (5.9 gpd).
Because product water samples were blended water, it was difficult to determine the point where fluoride began to break through the media. Breakthrough curves were obtained from both communities, however, from sites with accelerated use. These included two Parkersburg homes (1.6 and 1.0 gpd), and in Bureau Junction, a home where the device treated the entire bathroom cold water supply (5.9 gpd), and an elementary school (3.8 gpd). Bypass valves were shut off when treated water fluoride levels began to increase. These curves appear in Figure 38. The effect of higher alkalinity at Parkersburg caused breakthrough at a lower cumulative volume than at Bureau Junction. If service life is defined as the period in service until treated water fluoride levels reach the local MCL, a device used at an average measured rate would be expected to last 22 months in Parkersburg and over four years in Bureau Junction.
For a process which requires blending of treated and untreated water, the accuracy of onsite analyses can affect the quality of the product water and the service life of the device. The effectiveness of sample collectors in setting bypass valves is summarized in Table 59. The high ionic strength of both waters interferes with colorimetric fluoride analysis used in the field. Product water samples were analyzed in the laboratory to verify accuracy of the field test. In Bureau Junction, two sample collectors were used at different periods. (The village water commissioner took over monitoring near the end of the study period.) From Table 59 it is apparent that sampler 2 was more effective in maintaining fluoride levels in the desired range. The average discrepancy (absolute value) between field and laboratory analyses was 0.20 mg/L in Parkersburg and in Bureau, 0.44 mg/L (sampler 1) and 0.23 mg/L (sampler 2).
92

5.0-
4 0 -
Bureau Junction
| 3 H
2.0-
1.0-
1 400 200 6 0 0 800 1000 1200 1400 1600 1800
Cumulative Flow (gallons)
Figure 38. Activated alumina efficacy - Illinois communities.

TABLE 59. PRODUCT WATER FLUORIDE CONCENTRATIONS - ILLINOIS COMMUNITIES
Actual Product Water Fluoride (mg/L)
Parkersburg:
Bureau Junction: Sampler 1
Sampler 2
No. of Samples
45
54
39
Average
0.90
0.92
0.94
Median
0.95
0.8
1.0
Range
.3 - 1.4
<.l - 2.4
<.l - 1.6
Standard Deviation
0.25
0.55
0.36
Product water samples were also analyzed for aluminum, and in some cases, for sulfate content. Results of fluoride, aluminum, and sulfate analyses appear in Figures 39 through 41 for Parkersburg and Figures 42 through 44 for Bureau Junction. The figures for fluoride show that levels were generally maintained within the desired range. Aluminum and sulfate concentrations were highest in new devices, and generally dropped to background levels after approximately 50 gallons (13 bed volumes) of use.
A pilot study was performed in the village of Emington, Illinois to evaluate treatment efficacy with POU AA devices. Raw well water, containing 4.5 mg/L fluoride and 850 mg/L alkalinity as CaC03, was passed through a 1/2 ft device to breakthrough. Average flow rate was 370 gpd, with quiescent periods between days.
Fluoride first began to appear in the effluent after 325 gallons, and reached the local MCL of 2.0 mg/L after approximately 700 gallons. At a use rate of 0.8 gpd typical of the Illinois communities, an average device would be expected to last approximately 29 months in Emington.
Emington residents elected not to participate in the study, mainly because the device did not impart an improvement in the water's taste, which many residents found objectionable. In October 1983, POU reverse osmosis (RO) devices were installed in Emington homes and monitored for several months. This type of treatment was likely to improve the taste of the raw water.
94

7-
E 4
1 - . .
r
100 200 — I — 300
• Blended water from adjusted bypass valve a Bypass valve closed
— I — 400 —!
500 —I 600
~I 700
Cumulative Volume Treated (gallons)
Figure 39. Product water fluoride versus volume treated, Parkersburg.
95

B) 6 _E
E C
<
4-
3 -
I u V t f , ft ,i '*««» « • • •• 1 0 0 200 300 400 500 600
Cumulative Volume Treated (gallons)
— r 700
Figure 40. Product water aluminum versus volume treated, Parkersburg.
96
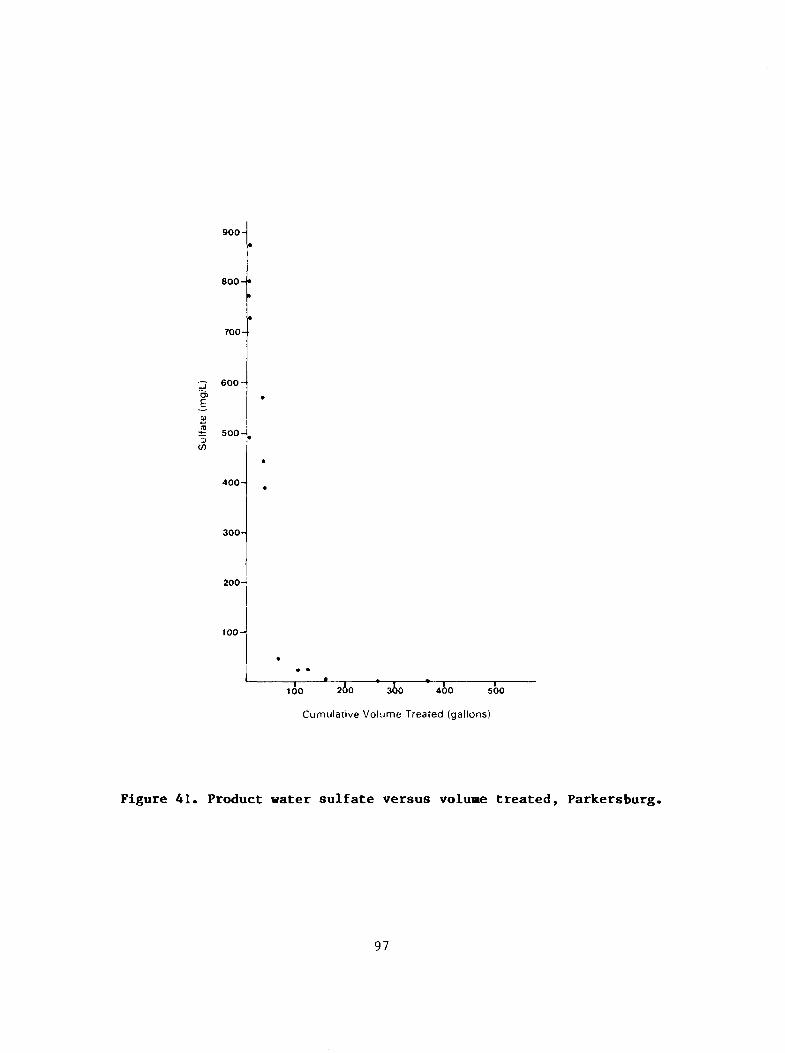
900-
8 0 0 - •
700-
6 0 0 -
5 500-J. 3 i
400 -
300-
2 0 0 -
100 -
100 200 300 4 0 0 5 0 0
Cumulative Volume Treated (gallons)
Figure 41. Product water sulfate versus volume treated, Parkersburg.
97

E — 4'
2-1
• Blended water from adjusted bypass valve u Bypass valve closed
I...... » .. 1 • -
200 400
; 0
6 0 0
•
1 8 0 0 1C
T -
1200
Cumulative Volume Treated (gallons
— t — 1400 1600 1800
Figure 42. Product water fluoride versus volume treated, Bureau Junction.
98

20
4-1
2 + «
EX '•./;...•••• ; L 100
— I — 400 200 300 400 500 600 V 800
Cumulative Volume Treated (gallons)
Figure 43. Product water aluminum versus volume treated, Bureau Junction.
99

800
700
6O0-p*
01 E a> 3> 500 "5 to
400
3 0 0 -
1 0 0 - — I — 100 200 300 400 ^00 600
Cumulative Volume Treated (gallons)
— I — 700
1 8 0 0
1 — 900 —r
1000
Figure 44. Product water sulfate versus volume treated, Bureau Junction.
100

Reverse Osaosis
The Village of Emlngton, located in Livingston County, is served by one well which provides water to 120 residents through 63 service connections. Water system components include a 30 gpm submersible pump and a 12,000 gallon pressure storage tank. Disinfection is provided with hypochlorite solution. Emington's water is similar to Bureau Junctions's with high dissolved solids (2530 mg/L), sodium (930 mg/L), and chloride (860 mg/L). Raw water fluoride is approximately 4.5 mg/L. In October 1983 POU RO devices were installed at 47 sites in Emlngton for a demonstration of contaminant removal efficacy.
Several manufacturers of POU R0 devices submitted specifications and equipment prices for the demonstration. A summary of information appears in Table 60. Equipment prices were based on purchase of 50 devices. A wide variety of membranes and treatment processes reflective of the industry is apparent from Table 60.
Device A, a low-pressure device, was selected for the demonstration. The device employs a spiral-wound polyamide RO membrane, and is designed for low-pressure applications. Reduction of fluoride and other contaminants occurs across the membrane. Pretreatment includes granular activated carbon (GAC) followed by a five micron prefilter. Product water is accumulated in a two gallon pressurized storage tank. Reject water is bled through a capillary tube to the home drain line. The average daily reject water volume was 28 gallons; this volume was estimated to not be detrimental to the onsite wastewater treatment systems. Air gaps are provided in the product water tap and drain connection. Water meters, capable of flow measurements to 1/8 gpm, were installed on the product water lines after the storage tank. Pressurizing pumps were not used. A schematic of the treatment process appears in Figure 45.
A summary of treated water use rates appears in Table 61. Average treated water use rate in Emington was approximately 0.8 gpd, or 0.35 gpd per person. This is less than the generally accepted average per capita drinking water consumption of 2.0 liters per day (0.53 gpd). Some Emington residents mentioned that the devices occasionally did not produce enough water to meet their demand. Low-pressure systems produce less water than systems employing a booster pump. Only device A was used in the demonstration.
Raw water quality was monitored for several key analytes, including fluoride, total dissolved solids (TDS), sodium, chloride, sulfate, and alkalinity. A summary of results from several analyses performed on raw water samples appears in Table 62. Raw water samples were collected in the home, usually at the kitchen cold water tap.
Approximately 100 product water samples were analyzed for fluoride and TDS. Relatively large ranges of analyte concentrations were detected in product water samples. Table 63 presents results of analyses performed on product water samples. Average percent rejection and range for each analyte are presented in Table 63. Fluoride rejection averaged 86 percent, and ranged between 56 and 98 percent. Fluoride concentration did not exceed the MCL for any samples measured. The mean fluoride concentration was close to an optimum
101

concentration. TDS rejection was slightly less than fluoride rejection, averaging 79 percent and ranging between 45 and 93 percent. Percent rejection was calculated using the average raw water concentration for each analyte.
drinking water lap
,<j\: connection
L-L.
Figure 45. Poiot-of-use reverse osmosis flow schematic.
102

TABLE 60. BO EQ0IPMEHT MAH0FACTDSESS' SUItlAJlY
A
B
C
Membrane Type
Spiral-wound polyamlde
Composite
Thin film composite
Pre & Post Filters
5 micron pre, GAC pre & post
5 micron pre, GAC pre 4 post
5 micron pre, GAC post
Maximum Production (gpd)
3
6-8
3 w/o pump 10 w/pump
Estimated Membrane Life (gal)
20000 2.75 gpd
2,000-4,000
3000 w/o 5000 w/pump
Estimated TDS
Rejection (Z)
85-90Z
80-902
90-94Z w/pump
Comments
No pump; replace GAC prefllter yearly.
No pump; replace GAC prefllter every 6 months.
Storage tank, not pressurized, system shuts down
Unit Cost
$229
$360
$233 ($447 w/ pump)
Thin film Pre and post Composite filter
20
Micro film 1 micron pre, 55 composite GAC pre
Cellulose 5 micron pre, 3-5 acetate GAC post
Cast-In- GAC post 3-4 place triacetate
21,900
20,000
1095-1875 @60 psi, 70"F
1,400
when tank, is full.
95-98Z 2 storage tanks; unit mounted on aluminum chassis.
90-95Z
70-90Z
80-90Z
Supply need not be chlorinated.
Installed on main line, no prefllter or drain connection; gravity storage tank..
$570
$393
$425
$376
1 1983 costs based on purchase of 50 units
Represents dealer cost, not bulk unit costs
103

TABLE 61. USE RATES - EMINGTON RO DEVICES
Use Rate (gallons per day) Per Device Per Person
Mean Median Standard Deviation Range
0.77 0.76 0.39 0.13 -1.54
0.35 0.29 0.23 0.13 -1.28
TABLE 62. EMINGTON RAW WATER QUALITY
F (mg/L) TDS (mg/L) Na (mg/L) CI (mg/L) SO (mg/L) Alkalinity (mg/L as CaC03)
Number of Samples
10 9 4 5 4 3
Mean
4, 2529 930 856 93 875
53
Range
4.1 - 4.8 2460 - 2569 885 - 1000 840 - 864 88 - 98 855 - 887
TABLE 63. EMINGTON PRODUCT WATER QUALITY
F (mg/L) TDS (mg/L) Na (mg/L) CI (mg/L) S04 (mg/L) Alkalinity (mg/L as CaC03)
Number of Samples
106 98 70 38 6
K) 4
Mean
0. 521 208 209 5
157
63
Standard Deviation
0.37 253 99 81 7
141
Range
<0.1-2.0 179-1400 71-524 99-430 <l-20 63-367
TABLE 64. AVERAGE PERCENT REJECTION - EMINGTON RO DEVICES
Rejection Percent (%)
F TDS Na CI so Alkalinity
Mean
86 79 78 76 95 82
Range
56-98 45-93 44-92 50-88 78-99 58-93
104

During an Emington si several homes. This disconnected the fitt reject water to fill this manner represent pressure to the modul pressure would be con increases as product pressure (30 psi) is
te visit, product and reject flow rates were measured at was accomplished with the help of the local dealer, who ings and measured the time required for either product or a graduated cylinder. Product flow rates measured in the maximum flow rate possible, given the influent water
e. In an actual use condition, at least 5 psi back tributed by the storage tank. This back pressure water is accumulated in the tank, until a pre-set reached, which triggers a pressure relief valve.
Wide ranges for both product and reject flow rates were observed. Product flow rates ranged between 4.4 gpd and 1.3 gpd, and averaged 2.9 gpd. Reject flows ranged between 16.1 gpd and 27.8 gpd. Average percent waste, defined as the reject flow divided by the sum of product and reject flow, was 89 percent.
Water temperatures and pressures were measured at each home, but did not correlate with production rates. Temperatures ranged between 48 and 60°F, and pressures ranged between 43 and 56 psi. Pressures were measured at convenient taps, such as an outdoor hose connection; the actual influent pressure to the module, after the prefilters, could not be determined. Table 65 presents the flow rates measured during the site visit; included are results from fluoride and TDS analyses performed on product water samples.
TABLE 65. FLOW RATES AND CONTAMINANT REJECTION - EMINGTON RO DEVICES
Site
I 2 3 4 5 6 6'
1
Product Flow (gpd)
4.4 2.9 2.9 3.5 2.5 1.3 1.7
Reject Flow (gpd)
19.8 27.8 23.3 20.7 27.1 16.1 16. 1
Rej
Percent Waste1
(%)
82 91 89 86 92 93 90
ect Flow
Product F
(mg/L)
0.27 0.45 0.53
<0.1 0.80 0.85 0.33
•»• i nr\
F Rejection
(%)
94 90 88 >98 81 80 92
Product TDS (mg/L)
245 313 416 253 561 790 300
TDS Rejection
(%)
90 88 84 90 78 69 88
Product + Reject Flow
"After backflushing GAC.
During the site visit it became apparent that iron deposits had fouled some of the GAC cartridges in the prefilter assembly; several tubing connections to and from the GAC were discolored with a dark orange color characteristic of iron oxides. At site number 6 (Table 65), the resident complained that the unit was not producing water. One contributing factor was the head loss across the prefilter assembly caused by iron fouling. The dealer removed the
105

GAC cartridge which was fouled with iron deposits. The cartridge was back-flushed and reinstalled, resulting in a 33 percent increase in production rate. Reoults of TDS analyses performed on product water samples before and after backflushing the cartridge indicated a 28 percent increase in TDS rejection after backflushing, demonstrating that the flux of solids across the membrane was relatively constant. More water was produced for essentially the same amount of solids, resulting in a better quality water. Results from site number 6 are included in Table 65.
BACTERIOLOGICAL SAMPLING RESULTS
Illinois Connuolties (AA)
Samples of product (blended) water were analyzed for bacteriological quality with standard plate count and total coliform analysis. For comparative purposes, samples were collected from both unflushed and flushed taps; this was done to simulate actual use conditions in the home, where water may be drawn from the first flush from a tap. To a lesser extent, samples were collected from taps which were flushed for approximately one liter. This was done in attempts to collect a sample representative of conditions in the media bed, not in the piping between the bed and tap. Samples were delivered to local laboratories for analysis. Results of standard plate counts are summarized for each community by presenting the geometric mean, median, and range for matched sample pairs (predevice vs. postdevice or unflushed vs. flushed). Coliform results are discussed for each community after the standard plate count summaries.
The two Illinois communities provide an interesting comparison of a chlorinated and unchlorinated water supply. Although chlorination was required, it was not practiced in Bureau Junction during the sampling period. Postdevice standard plate counts were highest in Bureau when devices were first placed in operation, and decreased with the first 100 gallons of treatment. In Parkers-burg, plate counts appeared to be predominantly influenced by influent chlorine residual, which fluctuated between nondetectable concentrations and 3.0 mg/L. Postdevice plate counts were highest when no chlorine residual was detected. Unflushed postdevice samples contained less chlorine residual than flushed samples. The AA device removed residual chlorine during quiescent periods; when water was flushed through the system, some chlorine passed through.
Bureau Junction
Two sample collectors were used in Bureau Junction. Sampler I collected samples from unflushed, undisinfected taps and from flushed disinfected taps, but results showed no significant difference between sampling techniques. Sampler 2, who provided monitoring after the second set of devices was installed, collected samples from disinfected taps after a one liter flush and after full flushing. Table 66 presents standard plate count results from the two sample collectors separately. Data from sampler 2 indicate that fully flushing the taps reduces plate counts by an order of magnitude from a one liter flush. These results correlate well with other POU studies (40). Interestingly, flushed postdevice samples collected by sampler 2 had slightly lower plate counts than flushed predevice samples.
106

Out of 153 samples analyzed for total coliform, coliforms were detected in nine predevice samples and four postdevice samples. Fecal coliforms were detected in four predevice samples and two postdevice samples. With one exception, positive coliform results did not occur simultaneously in predevice and postdevice samples. Except for one instance, postdevice resamples had no coliforms; one unit maintained consistent positive coliform results and was removed from service. No coliforms were detected in 70 postdevice samples collected by sampler 2.
TABLE 66. STANDARD PLATE COUNTS - BUREAU JUNCTION
(NOTE: Means are geometric means)
Type of Comparison
Standard No. of Plate Count Samples (///mL) Predevice Postdevice
SAMPLER 1:
Predevice
vs. Postdevice
46 Mean Median Range
Unflushed 114 190
<1-2100
Unflushed 955 510
45-79,000
Unflushed Flushed Unflushed 18 Mean 83 157 vs. Median 147 223 Flushed Range <1-1900 <l-32,000
Unflushed Flushed 1340 1270 825 592
46-79,000 55-70,000
SAMPLER 2:
1 liter Flush vs Flushed
35 Mean Median Range
Flushed 118 72
2-10,800
1 Liter Flushed
322 295
2-12,600
Flushed 66 50
8-1600
Parkersburg
In Parkersburg, samples were collected from disinfected taps which were unflushed, flushed, and flushed for one liter. Standard plate count summaries appear in Table 67. Postdevice results indicate an increase in plate counts of two orders of magnitude for flushed samples, and three orders of magnitude for unflushed samples. Flushing taps decreased postdevice plate counts by an order of magnitude. Postdevice plate counts were slightly lower in flushed samples than in samples collected after a one liter flush.
A reduction in chlorine residual through the devices was noted. This effect was greatest when devices were initially put in service; percent removal of chlorine decreased with the first 200 gallons treated. Flushing the bed allowed more chlorine to pass through, suggesting that media capacity for chlorine was limited. Although flushed samples had lower plate counts than
107

unflushed samples, this was not related to the increase in residual chlorine after flushing. Flushing the bed removes an initial slough of colonizing bacteria via hydraulic shear. Also, any chlorine present in a bacteriological sample is immediately neutralized with thiosulfate. Postdevice disinfection may be possible after breakthrough of chlorine through the bed, assuming that the water supply is regularly chlorinated.
TABLE 67. STANDARD PLATE COURTS - PARKERSBURG
(NOTE: Means are geometric means)
Type of Comparison
Predevice vs.
Postdevice
Unflushed vs. Flushed
1 liter Flush vs Flushed
No. of Samples
53
19
5
Standard Plate Count (#/mL)
Mean Median Range
Mean Median Range
Mean Median Range
Predevice
Flushed 4 <1
<1-11,700
Unflushed Fl 17 <1
<l-9700 <1-
Flushed 1
<1 <1 - 5
ushed 3
<1 11,700
Postd evice
Flushed 235 330
<l-83,800
Unflushed 3020 3360
232-15,500
1 Liter Flushed
2740 1390
930-28,300
Flushed 194 580
<l-83,800
Flushed 570 1030
67-2390
No coliforras were detected in 80 postdevice samples analyzed for total coliforra, although non-coliform growth was observed in 23 samples. Of 75 predevice samples collected, two samples verified positive for coliform.
Ellington (RO)
Results of standard plate count analyses on samples collected before and after the device appear in Table 68 and reflect an increase of one to two orders of magnitude through the RO device. Samples were collected from unflushed, undisinfected taps until January 10, 1984, when all taps were disinfected prior to sampling. After January 10, predevice samples were collected from flushed taps. Postdevice samples were not flushed because of the volume limitations imposed by the two gallon storage tank.
108

TABLE 68. STANDARD PLATE COUNTS - EMINGTON
STANDARD PLATE COUNT (Organ!sms/mL) (Pre = Predevice, Post = Postdevice)
Date
10/25/83 11/1/83 11/8/83 11/15/83 11/22/83 12/7/83 12/13/83 1/10/84 1/24/84 2/7/84 3/13/84
No. of Samples
8 8 10 11 14 10 8 6 7 8 5
Geometric Mean Pre
81 72 489 28 650 716 338 590 11 64 10
Post
15,200 4820 4810 6640 6060 4580 6490 7980 7500 2050 5180
Mei
Pre
291 93
1030 37
1080 878 315 588 11 113 21
dian Post
15,500 5400
10,125 6540 5415 6550 5660 7050 6900 4500 4860
Range Pre
2-890 4-3600 <l-2700 <l-244 36-5400 230-1480 175-820 482-727 <1-173 <l-6300 1-48
Post
6300-36,000 900-12,000 17-16,200 1610-16,200 1260-45,900 475-11,400 1810-21,600 5400-18,200 3300-12,600 95-12,000 2700-13,500
Special sampling taps were installed on one R0 unit to allow sample collection from various points in the system. Standard plate count results of an initial sampling from these taps appear in Table 69, and indicate that most standard plate count bacteria were accumulating in the GAC polisher, which is installed between the storage tank and the tap.
Of 92 predevice and postdevice samples analyzed filter technique), four predevice and 11 postde the presence of the organisms. Nine of the 11 in postdevice samples were clear after resampli twice before postdevice samples were clear, and disinfection of the RO system two times (by the clear. Fecal coliforms were detected at this 1 postdevice resample; this was the only observed in any bacteriological samples collected in Erai observed in 34 predevice samples and 70 postdev chlorination was erratic during the sampling pe
for total coliforms (membrane vice samples were confirmed for sites with positive coliforms ng; one site was resampled the other site required dealer) before samples were atter site from the first incidence of fecal coliforms
ngton. Non-coliform growth was ice samples. Central system riod.
Location
TABLE 69. STANDARD PLATE COUNTS THROUGH RO SYSTEM
Standard Plate Count (Organisms/mL)
Predevice (kitchen cold water) After module, before tank After tank, before GAC postftlter After GAC postfilter, at tap
29 810
2,580 13,500
1 Results of one sample
109

Arizona Communities (AA)
At the Arizona POU communities, slight increases in plate counts after treatment were observed, and flushing taps appeared to lower plate counts by a small margin. Plate counts from samples collected at Thunderbird Farms, Papago Butte, Ruth Fisher School, and You and I Trailer Park appear in Tables 70 through 73, respectively. Only matched pairs were included in calculating mean and median plate counts.
Chlorination was not practiced regularly at the Arizona POU sites. No coliforms were detected in any Arizona postdevice samples; this includes 47 Thunderbird Farms samples, 13 from Papago Butte, 10 from Ruth Fisher School, and 7 from You and I Trailer Park. The only observed incidences of total coliforms occurred in two predevice samples collected at Thunderbird Farms.
TABLE 70. STANDARD PLATE COUNTS - THUNDERBIRD FARMS
Type of Comparison
Predevice vs. Postdevice
Predevice vs. Postdevice
Unflushed vs Flushed
Unflushed vs. Flushed
No. of Samples
14
13
14
4
Standard Plate Count (#/mL)
Mean Median Range
Mean Median Range
Mean Median Range
Mean Median Range
Unflushed Samples Predevice Postdevice
85 170 63 37
23-12,400 3-91,200 Flushed Samples
Predevice 25 33
1-940
Unflushed 161 76
-91,200
Unflushed 74 68
28-243
Postdevice 39 26
1-1050 Postdevice Samples
Predevice
Flushed 36 31
1-1050 Samples
Flushed 57 49
35-137
110
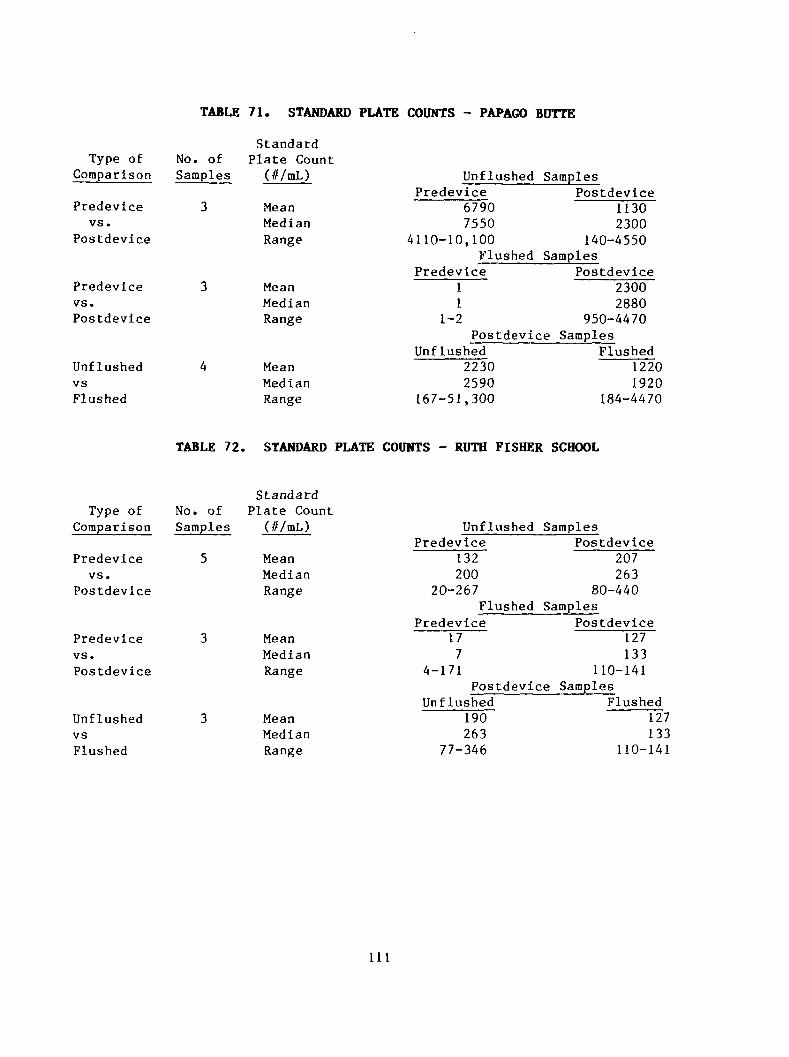
TABLE 71. STANDARD PLATE COUNTS - PAPAGO BOTTE
Type of Comparison
Predevice vs.
Postdevice
Predevice vs. Postdevice
Unflushed vs Flushed
No. of Samples
3
3
4
Standard Plate Count (#/mL)
Mean Median Range
Mean Median Range
Mean Median Range
Unflushed Samples Predevice Postdevice
6790 1130 7550 2300
4110-10,100 140-4550 Flushed Samples
Predevice Postdevice 1 2300 1 2880
1-2 950-4470 Postdevice Samples
Unflushed Flushed 2230 2590
167-51,300
1220 1920
184-4470
TABLE 72. STANDARD PLATE COUNTS - RUTH FISHER SCHOOL
Type of Comparison
Predevice vs.
Postdevice
Predevice vs. Postdevice
Unflushed vs Flushed
No Sa . of mples
5
3
3
Standard Plate Count (#/mL)
Mean Median Range
Mean Median Range
Mean Median Range
Unflushed Samples Predevice Postdevice
132 207 200 263
20-267 80-440 Flushed Samples
Predevice Postdevice 17 127 7 133
4-171 110-141 Postdevice Samples
Unflushed Flushed 190 263
77-346
127 133
110-141
111

STANDARD PLATE CODNTS - YOO & I TRAILER PARK
Standard Plate Count (#/mL) Unflushed Samples
Predevlce Postdevlce Mean 23 21 Median 20 41 Range 15-42 1-246
Flushed Samples Predevlce Postdevlce
Mean 35 61 Median 21 85 Range 18-119 13-209
Postdevlce Samples Unflushed Flushed
Mean 169 61 Median 246 85 Range 41-490 13-209
112

SECTION 8.
COSTS OF POINT-OF-USE TREATMENT
ARIZONA COMMUNITIES
Thunderbird Faras
The Thunderbird Farms Improvement District was originally formed to develop a potable water supply for the community, which had been served solely from irrigation water. Three community volunteers formed a Domestic Water Board to manage the Improvement District, which by state mandate was to be a non-profit entity. There were no zoning requirements in forming the District, as the water was to be for residential use only. The Water Board obtained a $20,000 loan from a local developer to pay for initial legal fees, an engineering study, and to begin a small contingency reserve. The District then obtained a $1.5 million loan from the Farmer's Home Administration (FHA) to finance construction of a new main well, pressure tank, storage tank, and distribution system, which included water mains fronting all 643 lots. The loan also financed the purchase and installation of 180 water meters and defluoridation devices. The as-bid prices and quantities (1980) for the new system appear in Table 74.
Debt retirement on the 30-year, five percent FHA loan is accomplished through semi-annual payments from property owners. The amount paid by each homeowner was determined on a property assessment basis. Each December, a principal plus interest payment of approximately $130.00 is due, and each June an interest payment of approximately $50.00 is due. The actual amounts vary with the assessed value of the property. A five percent penalty is added to late payments.
In 1983 there were 235 lots at Thunderbird Farms with active water service hookups and defluoridation devices; the remaining 408 lots did not have water service hookups at that time. A copy of the District's budget for fiscal 1983-84 appears in Table 75. Each fiscal year's budget is subject to the approval of the Pinal County Board of Supervisors. Income from water charges makes up almost 80 percent of the 1983-84 budget; water is sold at a fixed rate of $1.50 per 1000 gallons.
The Manager's wages, shown in Table 75, are based on approximately 50 to 70 hours per month; duties include quarterly fluoride field testing at each POU device, collecting one monthly bacteriological sample, performing cartridge exchanges and water service cut-offs and reconnects, repair of minor leaks, meter readings at the well, weed control at meter boxes, and record keeping. The Manager has an operator's license; the District is required to have a licensed operator on staff.
113

TABLE 74. AS-BID COSTS FOR THUNDERBIRD FARMS POTABLE WATER SYSTEM
Item No. Description
1 Drill, case, and test pump 16" well to 750' depth.
Bid Quantities Unit Price Lump Sum Total
750 LF $ 100.00 $ 75,000.00 (lineal feet)
2 Provide and install complete well pump w/ controls, valves fittings, and all appurtenances.
LS (lump sum) 25,000.00
3 250,000 gallon water storage LS tank, including site excavation.
4 5,000 gallon ASME surge tank, LS complete w/ air compressor, valves, fittings, and all appurtenances.
5 Booster pump station, complete LS w/ pumps, automatic controls, valves, headers, fittings, and all appurtenances, including standby power.
6 Water lines, complete w/ all fittings and appurtenances, as follows:
a. 8" PVC pipe b. 6" PVC pipe c. 4" PVC pipe d. 1" services
(double, w/o boxes) e. 1" service
(single w/o boxes) f. 1" water meters
(w/ boxes) g. F removal
units (w/boxes)
7 Refurbish existing east well-complete w/ revised electrical controls
63,400.00
14,600.00
25,000.00
63,400.00
14,600.00
104,700.00
29,966 135,146 26,847 325 ea.
13 ea.
180 ea.
180 ea.
LS
LF LF LF
5.77 4.59 3.89
180.00
158.00
70.00
197.00
8,000.00
172,903.82 620,320.14 104,434.83 58,500.00
2,054.00
12,600.00
35,460.00
8,000.00
8 Project sign
TOTAL LUMP SUM $1,296,972.79
450.00
114

TABLE 75. THUHDERBIRD FARMS IMPROVEMENT DISTRICT BUDGET FOR FISCAL YEAR 1983-84
Operational Expenses (Water Charge) Manager's wages $6,000 Laborer and meter reader 1,000 Clerk 8,000 Engineering and attorney 7,000 Secondary water-District #3 1,000 Repair and equipment rental 1,000 Power 15,000 Office and mailing 1,200 Transportation/mileage 600 Parts and supplies 3,000 Contract repairs 1,500 Advertising 80 Telephone 75 Water testing 250 Contingency reserve 1,000
SUBTOTAL $46,705 Delinquency adjustment (+15%) 7,005
TOTAL $53,710
Income Water charges $42,300 Meter installation 3,513 Carry-over 7,897
TOTAL $53,710
Average Monthly Charge for Water = $15.00
(235 families @ 10,000 gallons/month @ $1.50/1000 gallons = $42,300/year)
The Clerk works approximately 200 hours per month on billing, correspondence, and record keeping for over 1500 water, assessment, and maintenance accounts in the community, which totals 643 lots. Water accounts (235) make up the District's 1983-84 budget, assessment accounts (643) are for debt retirement on the FHA loan, and maintenance accounts (643) are from last year's budget. The maintenance accounts were formed in 1982-83 to build a $31,000 system contingency reserve. Each property owner was to make a single payment of $48.00 to build the reserve. The County Board of Supervisors made the maintenance assessment on a property value basis, however, resulting in unequal payments between property owners. The District is attempting to collect the balance from property owners who paid less than the $48.00, and is refunding those who paid more. The Clerk estimates that the District will receive approximately $21,000 for the reserve fund.
New residents pay a $180 water hook-up charge, which includes a defluoridation device ($140), installation ($20), and parts and supplies ($20). Regenerated cartridges are supplied by Water Treatment Engineers at a cost of $45.
115

Typical capital costs for a defluoridation device and appurtenances are itemized in Table 76. Costs include the homeowner's installation of underground piping. The State of Arizona's policy on POU defluoridation requires that devices be installed in the right-of-way or public utility easement, with responsibility for hook-up from the easement to a drinking water tap delegated to the homeowner. Also included are parts costs not covered in the hook-up charge. Because the monitoring program currently used at Thunderbird Farms assures at least quarterly testing of each device, the cost of a product water meter was not included in Table 76.
With a 20 year service life, capital costs are amortized according to the schedule in Table 77.
TABLE 76. CAPITAL COSTS - THUNDERBIRD FARMS
Item Cost
3 Standard 0.5 ft alumina cartridge $140.00 Plastic meter box 10.60 Collar (2 ft. of 10" PVC pipe) 6.00 Inlet & outlet tank fittings 1.40 Shut-off valve 2.00 Tee section & indoor piping 6.00 Faucet 12.00 3/8" saddle valve for sampling 2.00 50 ft. underground 1/2" PVC pipe, installed 25.00 @ $0.50/ft.
Unit installation 20.00
Total Capital Costs = $225.00
TABLE 77. AMORTIZED CAPITAL COSTS - THUWDERBIRD FARMS
Interest Rate Capital Cost ($/month)
8% $1.91
10% 2.20 12% 2.51
The amortization schedule is listed for comparison with capital costs of other treatment systems; in actuality, the capital cost is an up-front cost to the customer.
Service and maintenance requirements include a fluoride test, performed in the field once per quarter, and cartridge exchanges. Since the system went online in September 1981 (initial 180 devices), 71 cartridges have required exchanges. In 1982, 11 cartridges were exchanged because of improper installations by homeowners (i.e., hooking the entire home's water supply to the device) and media cementing. Forty-two cartridges were exchanged in 1983, and 18 more were exchanged in the first quarter of 1984. The actual period these
116

devices were in service is not known, as homeowners performed hookups at different times. Devices monitored during the project that required cartridge exchanges lasted an average of two years, with use rates ranging from 0.1 to 3.2 gpd. Using the maximum measured volume treated (1540 gallons) and the average use rate (1.4 gpd) gives an expected life of 3.0 years, which translates to $1.24 per month for the exchange cost of $45.00.
Monitoring costs include labor and analytical reagents. A typical colorimetric fluoride test, required once per quarter from every device, costs approximately $0.25 for reagents. Using the Manager's average hourly wage of $8.33 per hour ($6,000 per work year of 720 hours) and allowing 20 minutes for performing the test and recording results, an average cost per sample would be $3.00, or $1.00 per month per device.
Both exchange and monitoring costs are incorporated into the fixed water rate of $1.50 per 1000 gallons. Average costs are derived, however, for comparative purposes. The average cost per customer for fluoride reduction at Thunderbird Farms appears in Table 78.
TABLE 78. CUSTOMER COSTS - THUNDERBIRD FARMS
Capital Cost Service Costs Total Cost Interest Rate ($/month) ($/month) ($/month)
8% $1.91 $2.24 $4.15 10% 2.20 2.24 4.44 12% 2.51 2.24 4.75
Total domestic water use for the community averaged 78,500 gpd (July 1982-83), or approximately 10,000 gallons per month per household (235 connections). At $1.50 per thousand gallons, the average water bill per customer is $15.00 per month; cartridge exchanges and monitoring expenses make up approximately 17 percent of the average monthly water bill. Premature media exhaustion from improper hookups by homeowners and problems resulting from media cementing will increase these average monthly service costs.
Papago Butte
The Papago Butte Domestic Water Improvement District was established by the Pinal County Board of Supervisors in September 1978 in response to property owner petitions to form an improvement district and to incur operation and administration expenses. Three property owners were initially appointed to a Board of Directors; board members are now elected when a vacancy arises. The Clerk of the Pinal County Board of Supervisors is the Clerk for the Improvement District, and the County Treasurer is also the Improvement District Treasurer.
After its formation, the District employed a consulting engineering firm to design and supervise the construction of a domestic water system. The Board of Directors resolved that costs for this project would be paid from the sale
117
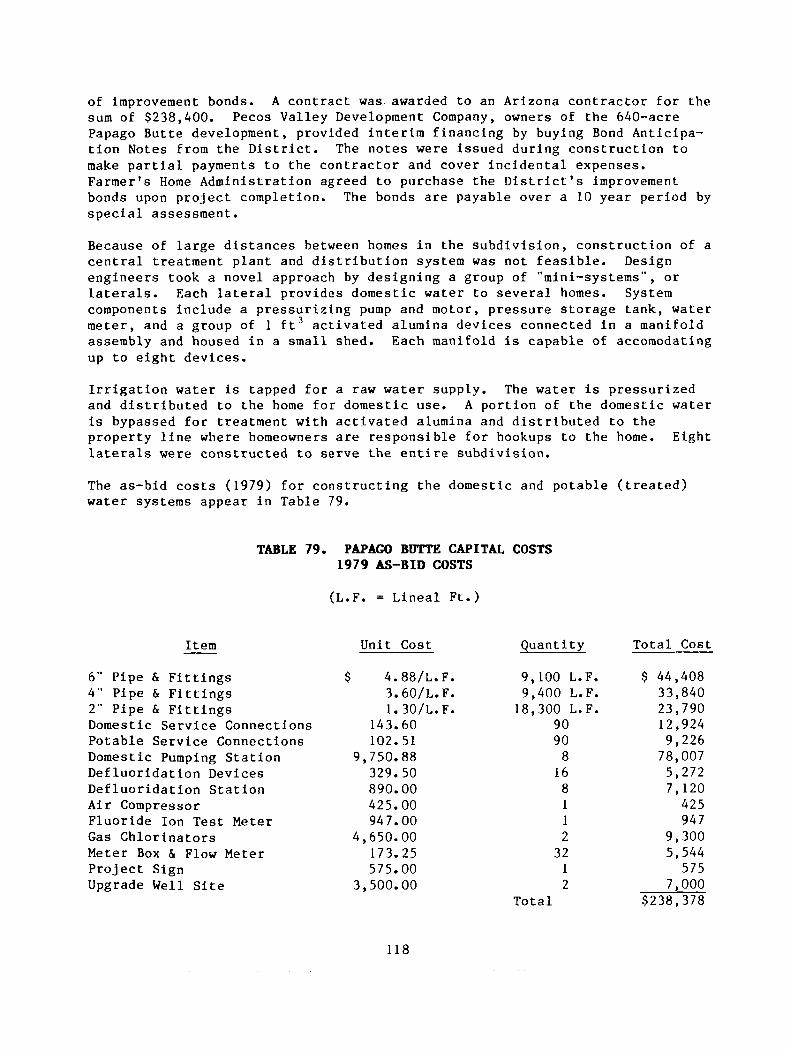
of improvement bonds. A contract was awarded to an Arizona contractor for the sum of $238,400. Pecos Valley Development Company, owners of the 640-acre Papago Butte development, provided interim financing by buying Bond Anticipation Notes from the District. The notes were issued during construction to make partial payments to the contractor and cover incidental expenses. Farmer's Home Administration agreed to purchase the District's improvement bonds upon project completion. The bonds are payable over a 10 year period by special assessment.
Because of large distances between homes in the subdivision, construction of a central treatment plant and distribution system was not feasible. Design engineers took a novel approach by designing a group of "mini-systems", or laterals. Each lateral provides domestic water to several homes. System components include a pressurizing pump and motor, pressure storage tank, water meter, and a group of 1 ft3 activated alumina devices connected in a manifold assembly and housed in a small shed. Each manifold is capable of accomodating up to eight devices.
Irrigation water is tapped for a raw water supply. The water is pressurized and distributed to the home for domestic use. A portion of the domestic water is bypassed for treatment with activated alumina and distributed to the property line where homeowners are responsible for hookups to the home. Eight laterals were constructed to serve the entire subdivision.
The as-bid costs (1979) for constructing the domestic and potable (treated) water systems appear in Table 79.
TABLE 79. PAPAGO BUTTE CAPITAL COSTS 1979 AS-BID COSTS
(L.F. = Lineal Ft.)
Item
6" Pipe & Fittings 4" Pipe & Fittings 2" Pipe & Fittings Domestic Service Connections Potable Service Connections Domestic Pumping Station Defluoridation Devices Defluoridation Station Air Compressor Fluoride Ion Test Meter Gas Chlorinators Meter Box & Flow Meter Project Sign Upgrade Well Site
Unit Cost
$ 4, 3 1
143 102
9,750 329 890 425 947
4,650 173 575
3,500
88/L.F. ,60/L.F. . 30/L.F. ,60 51 88 50 ,00 00 ,00 00 ,25 .00 ,00
Quantity
9,100 L.F. 9,400 L.F. 18,300 L.F.
90 90 8 16 8 1 1 2 32 1 2
Total
Total Cost
$ 44,408 33,840 23,790 12,924 9,226 78,007 5,272 7,120 425 947
9,300 5,544 575
7,000 $238,378
118

A copy of the Domestic District's 1983-84 budget appears in Table 80. Over 80 percent of the District's estimated 1983-84 expenses are to be paid with revenue from water service charges. The Domestic District pays the Papago Butte Irrigation Water Delivery District for minor repairs, chemicals, and personnel, which includes administrative services and a full time "water master" who reads meters and performs distribution system maintenance. The Domestic District also purchases some water for the Irrigation District at a cost of $0.30 per 1000 gallons.
Water service charges are $10 per month per connection for the first 4,000 gallons and $0.40 for each additional 1000 gallons. New hookups are $300; the fee includes installation of a 1 ft3 defluoridation device. Cartridge exchanges, performed by Water Treatment Engineers, cost $60. Replacement cost is incorporated into the user charge.
Customer costs at Papago Butte are somewhat artificial. Each lateral was designed to provide domestic and potable water to approximately 16 families. As-bid costs (Table 79) for a defluoridation station for each lateral, eight activated alumina devices, and 16 potable service connections were $5170 (1979). Allowing $25 for homeowner installation of underground piping and a share of a treated water meter gives an average capital cost per customer (household) of $350.
The device monitored at Papago Butte treated approximately 9500 gallons before fluoride levels reached the MCL. With a measured use rate of 18.5 gpd, a cartridge would require replacement every 1.4 years, at an exchange cost of $60. Three homes were using to the device during the study period, giving an average cost of $1.17 per month per customer for maintenance expenses. As with Thunderbird Farms, improper hookups by homeowners would significantly increase these average maintenance costs.
Average customer costs for fluoride reduction at Papago Butte are presented in Table 81.
TABLE 80. 1983-84 BUDGET - PAPAGO BUTTE DOMESTIC WATER IMPROVEMENT DISTRICT
Estimated Receipts: Water Service Charges $ 8,200.00 Hookup charges 1,500.00 Interest income 200.00
Total Estimated Receipts: $ 9,900.00
Estimated Expenses: Directors expense 300.00 Professional services 2,500.00 Water meters & equipment 400.00 Major repairs 500.00 Insurance 200.00 Uncollectable accounts 200.00 Contingencies 0.00 Minor repair & chemicals 2,200.00 Water Cost 1,100.00 Prior year deficit 2,500.00
Total Estimated Expenses: $ 9,900.00
119

TABLE 81. CUSTOMER COSTS - PAPAGO BUTTE
Interest Rate
8% 10% 12%
Capital Cost ($/month)
C-J
•CO-
3. 3.
97 43 ,90
Service Cost ($/month)
$1.17 1.17 1.17
Total Cost ($/month)
$4.14 4.60 5.07
Ruth Fisher School Two activated alumina devices serve four drinking fountains at the old Ruth Fisher School, where approximately 100 elementary students now attend. One unit is a standard 1/2 ft3 cartridge, while the other is slightly smaller because of spatial limitations. Capital costs for the devices and appurtenances are itemized in Table 82. The cost of one product water meter was included in the capital cost breakdown.
Cartridge exchanges at the school were performed three times over the past 2.5 years. Each exchange costs $85, and includes replacement of both cartridges. The average monthly expense for cartridge replacement is $8.48.
Average monthly costs for fluoride reduction at Ruth Fisher School appear in Table 83.
TABLE 82. CAPITAL COSTS - RUTH FISHER SCHOOL
Item Unit 1 (0.5 ft3) Unit 2 (0.4 ft3)
Media Cartridge Inlet & Outlet Fil Shutoff Valve Pipe Drinking Fountain Installation Water Meter
Interest Rate
8% 10% 12%
ttings
Fittings
TABLE 83.
$
$
Tots
TOTAL
Capital Cost1
($/month)
$3.06 3.52 4.02
150 4 2 2 4 10 40 212
il Cost
COSTS
Se
= $360
- RUTH FISHER
rvice Cost ($/month)
$8.48 8.48 8.48
$ 125 4 3 2 4 10
$ 148
SCHOOL
Total Cost ($/month)
$11.54 12.00 12.50
1 Amortized for 20 years.
120

You and I Trailer Park Capital costs for fluoride reduction at the You and I Trailer Park were approximately $230, and included $165 for a 1 ft3 activated alumina device, $40 for a product water meter, and $25 for manufacturer's installation. Equipment was installed in March 1983, and treated 2500 gallons before fluoride breakthrough. Approximately 16 guests resided at the trailer park, and used the device at an average rate of 5.5 gpd. At this use level, a 1 ft3
cartridge would have a service life of approximately 15 months. With an exchange cost of $60, monthly service costs would be $4.02. Total costs for activated alumina treatment appear in Table 84. This institutional approach to POU treatment employed at this site appears to present a cost-effective means of meeting the fluoride (and arsenic) MCL.
TALBE 84. TOTAL COSTS - YOU AND I TRAILER PARK
Capital Cost1 Service Cost Total Cost Interest Rate ($/month) ($/month) ($/month)
8% $1.95 $4.02 $5.97 10% 2.25 4.02 6.27 12% 2.57 4.02 6.59
Amortized for 20 years.
ILLINOIS COMMUNITIES
Equipment and installation costs presented in this section were incurred during field demonstrations of new POU equipment for fluoride reduction in three Illinois communities, Parkersburg (AA), Bureau Junction (AA), and Eraington (RO). Activated alumina maintenance costs, or the cost of replacing cartridges, were estimated from breakthrough curves and measured treated water use rates. The service life of RO modules and system components was estimated to obtain RO service costs. No significant repair costs were incurred in the communities. Average customer costs are derived for comparison with other communities, and include equipment, installation, and replacement costs.
In addition, estimated costs are presented for POU AA treatment in Emington, where a fluoride breakthrough curve was obtained from a site demonstration.
Associated costs for POU treatment include monitoring and administrative costs. Monitoring costs were site-specific and in some cases included travel expenses for a subcontracted sample collector. Travel expenses would not necessarily be incurred by a POU community. Estimates of monitoring and administrative costs for a POU water quality district (and assumptions used) are presented with the customer costs.
121
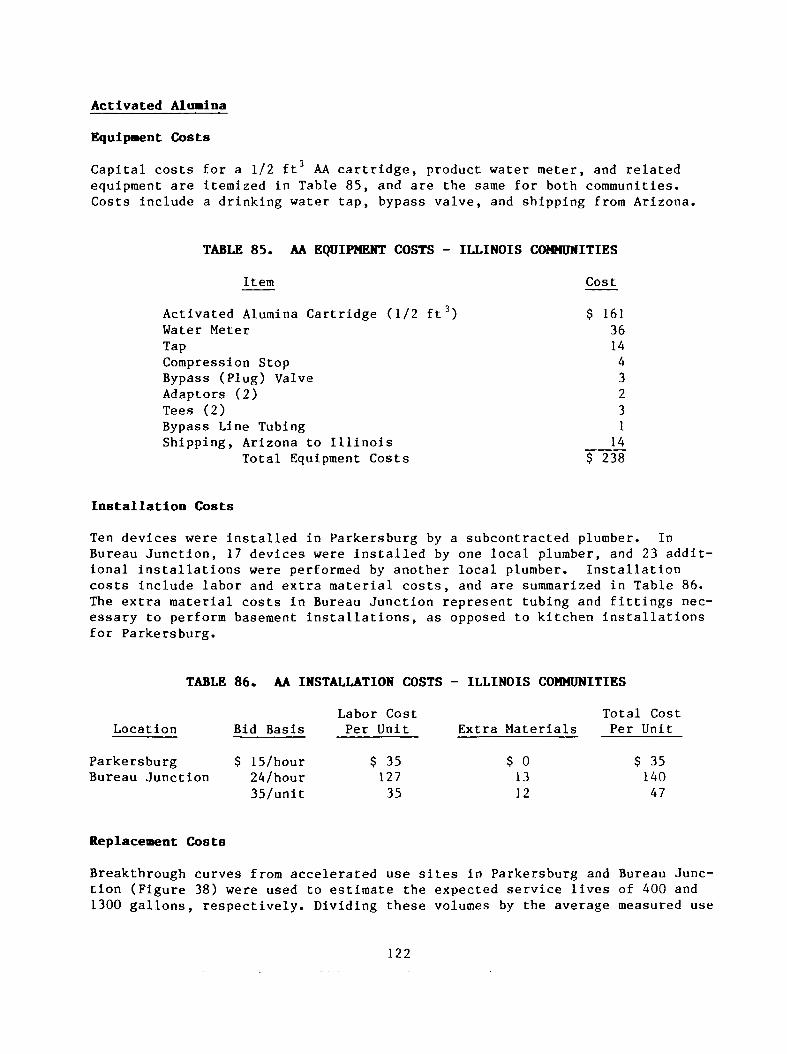
Activated Alumina
Equipment Costs
Capital costs for a 1/2 ft AA cartridge, product water meter, and related equipment are itemized in Table 85, and are the same for both communities. Costs include a drinking water tap, bypass valve, and shipping from Arizona.
TABLE 85. AA EQUIPMENT COSTS - ILLINOIS COMMUNITIES
Item Cost
Activated Alumina Cartridge (1/2 ft3) Water Meter Tap Compression Stop Bypass (Plug) Valve Adaptors (2) Tees (2) Bypass Line Tubing Shipping, Arizona to Illinois
Total Equipment Costs
161 36 14 4 3 2 3 1 14
$ 238
Installation Costs
Ten devices were installed in Parkersburg by a subcontracted plumber. In Bureau Junction, 17 devices were installed by one local plumber, and 23 additional installations were performed by another local plumber. Installation costs include labor and extra material costs, and are summarized in Table 86. The extra material costs in Bureau Junction represent tubing and fittings necessary to perform basement installations, as opposed to kitchen installations for Parkersburg.
TABLE 86. AA INSTALLATION COSTS - ILLINOIS COMMUNITIES
Location Bid Basis
Parkersburg $ 15/hour Bureau Junction 24/hour
35/unit
Labor Cost Per Unit
$ 35 127 35
Extra Materials
$ 0 13 12
Total Cost Per Unit
$ 35 140 47
Replacement Costs
Breakthrough curves from accelerated use sites in Parkersburg and Bureau Junction (Figure 38) were used to estimate the expected service lives of 400 and 1300 gallons, respectively. Dividing these volumes by the average measured use
122
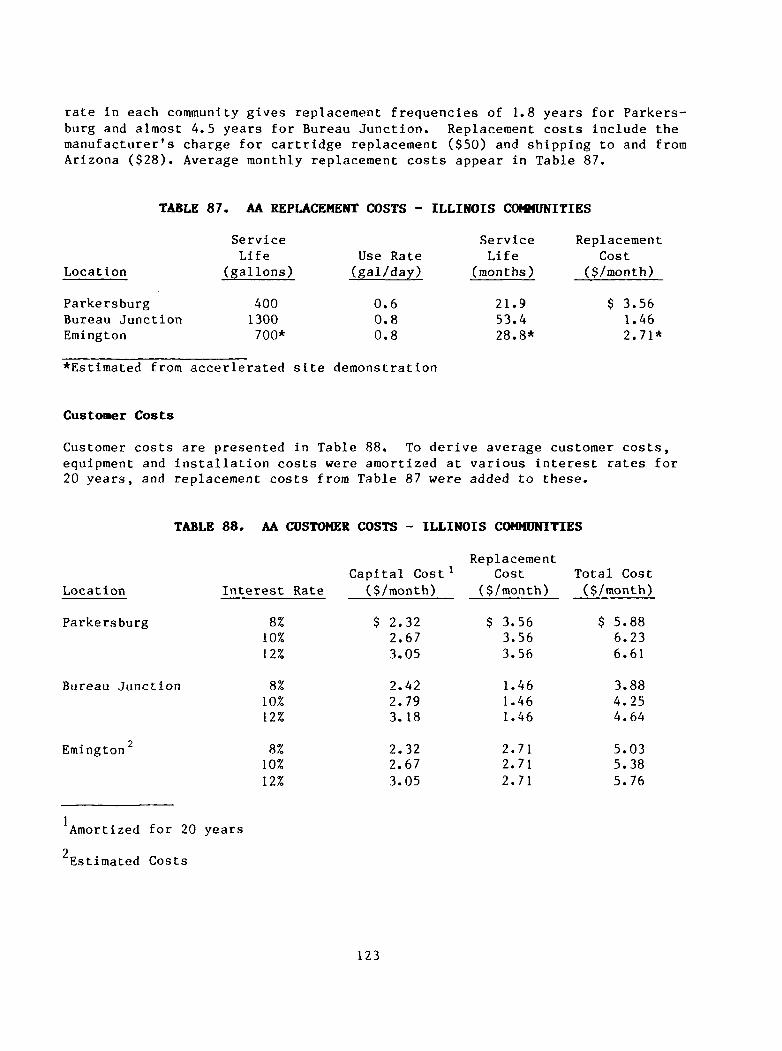
rate in each community gives replacement frequencies of 1.8 years for Parkers-burg and almost 4.5 years for Bureau Junction. Replacement costs include the manufacturer's charge for cartridge replacement ($50) and shipping to and from Arizona ($28). Average monthly replacement costs appear in Table 87.
TABLE 87. AA REPLACEMENT COSTS - ILLINOIS COMMUNITIES
Location
Parkersburg Bureau Junction Emington
Service Life
(gallons)
400 1300 700*
Use Rate (gal/day)
0.6 0.8 0.8
Service Life
(months)
21.9 53.4 28.8*
Replacement Cost
($/month)
$ 3.56 1.46 2.71*
*Estimated from accerlerated site demonstration
Customer Costs
Customer costs are presented in Table 88. To derive average customer costs, equipment and installation costs were amortized at various interest rates for 20 years, and replacement costs from Table 87 were added to these.
TABLE 88. AA CUSTOMER COSTS - ILLINOIS COMMUNITIES
Location
Parkersburg
Bureau Junction
Emington
Interest Rate
Replacement Capital Cost1 Cost Total Cost ($/month) ($/month) ($/month)
8% 10% 12%
8% 10% 12%
8% 10% 12%
$ 2.32 2.67 3.05
2.42 2.79 3.18
2.32 2.67 3.05
$ 3.56 3.56 3.56
1.46 1.46 1.46
2.71 2.71 2.71
$ 5.88 6.23 6.61
3.88 4.25 4.64
5.03 5.38 5.76
1 Amortized for 20 years
"Estimated Costs
123

Reverse Osmosis
Installation Costs
The first installation was performed by a local plumber at a cost of approximately $260. The remaining 46 units were installed by a local equipment dealer for approximately $68 each, demonstrating a substantial cost savings with a trained dealer. Unit components were flushed and pre-assembled on boards in the dealer's shop prior to home installation. The average time spent per installation was 2.7 hours, with 1.2 hours for shop preparation and 1.5 hours for home installation. A summary of installation costs for the dealer-installed units appears in Table 89; note that although a factory-trained dealer performed the installations, an average cost of $10.11 per unit was incurred for repair of leaks after installation.
TABLE 89. INSTALLATION COSTS, EMINGTON REVERSE OSMOSIS SYSTEMS
Total Cost Average Cost per Unit
Installation Labor Extra labor (travel, leak repair) Fittings (adaptors, connectors, reducers) Valves (saddle, self-piercing needle) Screws, nuts, bolts, brackets Tubing Freight Miscellaneous
Total $3,111.88 $67.67
Equipment Costs
Average equipment costs were $229 for each device and $42 for a water meter, bringing the total average cost per unit, including installation, to $339. The equipment price of $229 per unit represents the dealer cost. This cost is substantially lower than the retail costs for the other RO units (Table 60).
Capital and service costs for the RO systems appear in Table 90. The average quantity price per RO device ($430) from manufacturers' information in Table 60 was used in determining capital costs. (Because the price for device A was a dealer cost, this was excluded in calculating the average equipment cost.) Using the average incurred installation cost of $68 per unit and the water meter cost of $42, the average total capital cost for a POU reverse osmosis system would be $540.
A water meter was placed on product water lines to measure the volume of water consumed. Meters may not be necessary to monitor unit life, as module failure will result in no water production, or production of water with taste similar to the raw water. Meters may be useful, however, to determine when prefliters must be changed.
$1,740.00 465.00 474.09
86.93 80.89 61.00 72.10
131.87
$37.83 10.11 10.31
1.89 1.76 1.33 1.57 2.87
124

Service Costs
Service costs were derived with manufacturer's estimated replacement frequencies for system components. After more than one year of service, no RO modules have required replacement. The manufacturer's estimate of module life (2000 gallons) and the average product water flow rate (2.9 gpd) were used to estimate module replacement frequency. All costs for replacement components are based on a 20 percent discount on dealer's list price. Table 90 summarizes average capital cost and estimated service costs for P0U R Treatment at Emington.
Custoaer Costs
Average customer costs for POU R0 treatment at Emington appear in Table 91. The average capital cost of $540 was amortized for 20 years at various interest rates.
TABLE 90. COSTS FOR POD RO TREATMENT AT EMINGTON
Capital Costs: Average Equipment Cost $ 430 Installation 68 Water Meter 4_2
Total Capital Costs $ 540
Service Costs: Item Discounted Cost1 Replacement Frequency Monthly Cost
R0 Module GAC prefilter Sediment prefilter GAC postfilter
$ 94.40 15.70 3.74 13.60
1.9 years2
1 year 6 months 1 year
$ 4.13 1.31 0.62 1.13
Total Service Costs = $7.19/month
Based on 20 percent discount on dealer's list price.
2 Based on manufacturer's estimated life (2000 gallons) and average measured product flow rate (2.92 gpd).
TABLE 91. CUSTOMER COSTS - EMINGTON RO SYSTEMS
Capital Cost Service Cost Total Cost Interest Rate ($/month) ($/month) ($/month)
8% $ 4.59 $ 7.19 $ 11.78 10% 5.29 7.19 12.48 12% 6.03 7.19 13.22
125
ADMINISTRATIVE AND MONITORING COSTS
Routine administrative costs, including record keeping, billing, and inventory control, would be incurred by a community establishing a POU water quality district. Using the fiscal 1983-84 budget of the Thunderbird Farms Domestic Water Improvement District (Table 75) as a model, average monthly administrative costs were estimated. The Clerk works approximately 200 hours per month maintaining 1500 records, including water, maintenance, and assessment (debt retirement) accounts. This amounts to 0.133 hours per month per record. Assuming the district operates on a quarterly billing basis, estimated labor is 0.40 hours per record per quarter. At a labor rate of $8.00 per hour (including fringe), maintaining each record costs approximately $3.20 per quarter for administrative labor.
Projected expenses for telephone, postage, and miscellaneous supplies for the Improvement District's 643 customers are $1,275 for fiscal 1983-84. This amounts to $0,495 per customer per quarter.
Total administrative costs for each member of the Thunderbird Farms Improvement District are $3.70 per quarter, or $1.23 per month, based on a labor rate of $8.00 per hour. Districts may reduce costs with voluntary labor and/or more active homeowner participation.
Monitoring costs depend on source water quality, the type of treatment used, and the sample collector's proximity to the site. Field notes from Illinois sample collectors indicated that new activated alumina installations took 45 to 60 minutes for initial setup; this included flushing the device and bypass valve calibration. Average time spent for sample collection in Illinois, including a field fluoride test and record keeping, was 24 minutes per home. When bypass valve calibrations for AA devices were necessary, average time per home was 36 minutes.
The average cost per fluoride test for analytical reagents is $0.25. With an average time of 24 minutes per sample and a labor rate of $8.00 per hour, the cost of collecting a sample, including reagents, is $3.45. This does not reflect the additional cost of travel. Communities may significantly reduce the cost of monitoring with local, volunteer sample collectors. Monitoring could also be incorporated into the billing procedure. A sample bottle could be mailed to the customer with the water bill, or left with the customer during meter reading. The customer could mail or deliver the water sample to a main office for analysis.
Monitoring during the study period was performed at an accelerated rate in order to collect field data. Once the service life of a device has been demonstrated, either through a pilot study or with actual use, sample collection may be suspended (after initial setup) for a specified volume or time. This will significantly reduce monitoring costs.
126

SECTION 9.
CENTRAL AND POINT-OF-OSE TREATMENT COST COMPARISON
Activated Alumina
Tables 92 and 93 summarize costs for defluoridation with activated alumina at all project sites. All capital costs are based on a 20 year amortization at an interest rate of 10 percent.
With POU treatment, components such as cartridges and prefilters are periodically replaced. However, the housings, fittings, and related appurtenances remain in place and are comparable to other types of household plumbing fixtures. Considering the more permanent nature of these items, a 20 year amortization period for capital costs seems reasonable.
Table 92 presents a summary of central treatment costs at Gila Bend and Palo Verde, and estimated costs for North Myrtle Beach. For Gila Bend and Palo Verde, cost per 1000 gallons was calculated using actual flow rates (464,000 gpd for Gila Bend and 7200 gpd for Palo Verde). The design flow rate of 2 mgd for North Myrtle Beach was used to obtain cost per 1000 gallons. All cost derivations are presented in the text.
TABLE 92. ACTIVATED ALUMINA CENTRAL TREATMENT COSTS
Cost ($/1000 gal.) Gila Bend Palo Verde N. Myrtle Beach1
Capital2
Labor Chemicals Replacement Media Replacement Parts Electrical Other
Total
$ 0.298 0.049 0.042 0.041 0.009 0.004 0.006
0.449
$ 2.338 2.546 0.252 0.146 0.085 0.003 —
5.370
$ 0.347 0.068 0.123 0.007 0.007 0.006 0.013
0.571
Estimated costs.
Amortized @ 10% for 20 years.
127

Point-of-use activated alumina treatment costs appear in Table 93, and represent amortized capital costs and service costs, which include costs of cartridge exchanges. Replacement frequencies were based on measured use rates. Except for Thunderbird Farms, monitoring costs were not included in service costs. Monitoring costs are highly variable, and may not present a significant expense if a resident volunteer were to provide monitoring services with a field test kit.
TABLE 93. ACTIVATED ALUMINA POINT-OF-USE TREATMENT COSTS
Customer Costs
Site
Thunderbird Farms Papago Butte Ruth Fisher School You & I Trailer Park Parkersburg Bureau Junction Eraington (Estimated)
Capital1
20 43 52 25 67 79 67
: ($/mont
Service
$ 2.512
1.17 8.48 4.02 3.56 1.46 2.71
h)
Total
$ 4.71 4.60 12.00 6.27 6.23 4.25 5.38
1 Amortized @ 10% for 20 years.
'Includes monitoring costs.
Represents costs for entire institution.
To compare central and POU treatment costs for activated alumina, a cost curve was developed using the three central treatment sites. The curve displays the relation between average customer costs and plant production, and appears as Figure 46. The curve is a power curve of the form y = ax , where a = 72.7 and b = -0.51 when units for x and y are 1000 gpd and dollars per month respectively. The coefficient of determination, r2, is 0.994.
Capital and labor costs are costs dramatically when pla to minimize this effect on cost curve. For Palo Verde assumed to be 648,000 gpd, For North Myrtle Beach, the treatment system was used, based on a 2 mgd production gallons for a 200,000 gpd s derived assuming an average Table 94 presents central t design flows. Using design Bend and Palo Verde; other
essentially fixed costs nt production is low, as costs, design flows were this is 30,000 gpd and
or one half the maximum design flow of 200,000 Because the North Myrtl rate from 10 individual
ystem would be identical residential use rate of reatment production and flows reduces capital a costs remain unchanged.
and increase treatment with Palo Verde. In order used in developing the for Gila Bend, this was flow rate of 1.296 mgd. gpd for one individual e Beach cost estimate was systems, the cost per 1000
Customer costs were 8000 gallons per month, customer costs based on nd labdr costs for Gila
128

TABLE 94. AA CENTRAL TREATMENT COSTS BASED ON DESIGN FLOWS
Gila Bend Palo Verde
Design Flow (gpd) 648,000 30,000
Costs Capital1 ($/1000 gal) $ 0.214 $ 0.561 Labor ($/1000 gal) 0.036 0.609 Other ($/1000 gal) 0.102 0.486 Total ($/l000 gal) 0.352 1.656
Customer Cost2 ($/month) 2.82 13.25
Amortized @ 10% for 20 years.
2 Based on 8000 gallons per month per customer.
The range of POU customer costs also appears in Figure 46; an average monthly administrative cost of $1.23 was added to POU costs. POU customer costs intersect the central treatment curve between production rates of 88,000 gpd and 189,000 gpd, corresponding to communities having between 330 and 710 service connections (8000 gallons per month per service connection). (The costs for institutional POU treatment were not included in the POU cost range.)
The AA POU cost range appears to be predominantly influenced by raw water alkalinity. For example, with a high alkalinity site (e.g. Parkersburg), POU AA treatment may be cost competitive with central treatment for communities with up to approximately 330 service connections. For a low alkalinity site (e.g. Thunderbird Farms), POU treatment may be cost competitive for communities with up to approximately 710 service connections.
POU costs were based on measured use rates at all sites. Use rates at most residential sites were less than one gallon per day per household. Higher use rates would increase the frequency of cartridge replacement, thus increasing average service costs. For example, a use rate of two gpd at Parkersburg would increase the monthly service costs to $11.86. Assuming an average residential use rate of two gallons per day, POU costs (including administration costs) would intersect the central treatment curve between production rates of 20,000 and 154,000 gpd. This corresponds to communities having from 75 service connections (high alkalinity) to 580 service connections (low alkalinity).
Table 95 presents service costs for POU treatment, based on measured use rates and a two gpd use rate. Raw water alkalinity is also presented in Table 95.
129

.c r. O
£ 09
. O
CJ fc.
(1> F o </> 3
a
24
22
20
18
16
14
12
10
8
4
2
T
.3 .4
Average Flow (MGD)
Figure 46. Central and point-of-use treatment costs for activated alumina.
130

TABLE 95. AA POU SERVICE COSTS
Site
Service Costs ($/month) based on Measured Use Rate
Service Costs ($/month) based on 2 gpd Use Rate
Raw Water Alkalinity (mg/L as CaC03)
Thunderbird Farms Parkersburg Bureau Junction Eraington You & I
$ 1.24 3.56 1.46 2.71 3.872
$ 1.78 11.86 3.65 6.78 1.46
200 1000 540 870 40
1 Estimated from pilot demonstration.
'5.5 gpd measured use rate.
Reverse Osmosis
Costs for central reverse osmosis treatment at Emington were estimated by Basic Technologies, Inc., an engineering firm from Riviera Beach, Florida. Estimated capital costs include approximately $60,000 for a central RO system (including mechanical and electrical installation) and $60,000 for a concrete block building. The proposed system would treat 16,500 gpd with 5500 gpd reject water. Product water would be blended with raw water to give a plant effluent containing 1.0 mg/L fluoride.
Estimated operating costs per 1000 gallons product water include power for pumps ($0.36), membrane replacement every five years ($0.18), chemicals ($0.10), and prefilter cartridge replacement ($0.02). Thirty-two hours of operator's labor ($8 per hour) per month were also included in the operating costs. Reject water disposal costs were not included, but could be significant because no central wastewater system is available. A summary of estimated capital and operating costs for central reverse osmosis treatment at Emington appears in Table 96.
131

TABLE 96. ESTIMATED COSTS FOR CENTRAL RO TREATMENT AT EMINGTON
CAPITAL COSTS:
Reverse osmosis system Concrete block water plant Mechanical installation Electrical installation
Total
AMORTIZED CAPITAL COSTS: Time Interest Rate
8% 10% 12%
OPERATING COST:
Pumping Membrane replacement Chemicals Prefilter replacement Labor (32 hours per month @
Period
$8. ,00
=
pe:
20
r he
Estimated Cost $ 54,341
60,000 5,000 3,000
$122,341
years
>ur)
(1984)
Capital Cost ($/1000 gal) $ 2.10
2.42 2.76
Operating^ Cost ($/1000 gal) $ 0.36
0.18 0.10 0.02 0.52
Total $1.18/1000 gallons
Table 97 presents average customer costs for point-of-use RO treatment and estimated customer costs for central treatment. All capital costs were amortized for 20 years at various interest rates. Monthly central treatment customer costs were based on the design flow of 16,500 gpd. The low number of service connections in Emington (63) makes point-of-use reverse osmosis treatment more cost effective than central treatment.
TABLE 97. CUSTOMER COSTS FOR CENTRAL AND POD RO TREATMENT AT EMINGTON
(Amortization Period = 20 years)
CENTRAL TREATMENT: Capital Cost
Interest Rate ($/month)
8% $ 16.80 10% 19.36 12% 22.08
POINT-OF-USE TREATMENT:
Interest Rate
8% 10% 12%
Capital Cost"" ($/raonth)
4.59 5.29 6.03
Operating Cost ($/month)
$ 9.44 9.44 9.44
Service Cost ($/month)
7.19 7.19 7.19
1 Based on 8000 gallons per month per customer. > "Based on amortized average capital cost of $540.
Customer Cost ($/month)
$ 26, 28, 31,
Customer ($/raon1
.24
.80
.52
Cost th)
11.78 12.48 13.22
132
REFERENCES
Murray, J.J., A History of Water Fluoridation. Brit. Dent. J. , 134:250-4, 299-302, 347-50, April 3, 1973.
Hodge, H.C., and Smith, F.A. , Effects of Fluorides on Bones and Teeth, Fluorine Chemistry, Vol. 4, pp. 337-693, New York Academic Press, 1965.
Adler, P., Fluoride and Dental Health, Fluoride and Human Health, pp. 323-354, WHO, Geneva, 1970.
American Medical Association, Council on Foods and Nutrition. Efficacy and Safety of Fluoridation, AMA, Chicago, 1975.
Bhussry, B.R., Toxic Effects of Large Doses of Fluoride, Fluoride and Human Health, pp. 230-238, WHO, Geneva, 1970.
0'Donnell, T.A., The Chemistry of Fluorine, Pergamon Press, Elmsford, NY, 1973.
Public Health Service Drinking Water Standards-1962, USHPS. Publication 956, USGPO, Washington, DC, 1962.
Defluoridation Study for the Arizona Department of Health Services, Final Report, pp. 1-4, PRC Toups Corporation, 1979.
Les Kister, US Geological Survey, Tuscon AZ, personal communication.
Wu, Y.C., Water Defluoridation with Activated Alumina, Journal of the ASCE Environmental Engineering Division, 357, April 1979.
Natural Fluoride Content of Communal Water Supplies in the US, Division of Dental Public Health, US Department of Health, Education, and Welfare, USGPO, 1959.
Clifford, D., Sorg, T., and Frank, P., Survey of Inorganic Contaminants, Control of Inorganic Contaminants, AWWA Seminar Proceedings, pp. 1-17, AWWA, June 1983.
Sorg, T.J., Treatment Technology to Meet Interim Primary Drinking Water Regulations for Inorganics, Journal AWWA, pp. 105-112, February 1978.
Rubel, F. , and Woosley, R.D., The Removal of Excess Fluoride from Drinking Water by Activated Alumina, Journal AWWA, pp. 45-49, January 1979.
133

Savinelli, E.A., and Black, A.P., Defluoridation of Water with Activated Alumina, Journal AWWA, pp. 33-44, January 1958.
Singh, G. and Clifford, D.A., The Equilibrium Fluoride Capacity of Activated Alumina, Project Summary, EPA-600/S2-81-082, July 1981.
Choi, W. and Chen, K.Y., The Removal of Fluoride from Water by Adsorption, Journal AWWA, pp. 562-569, October 1979.
Canby, T.Y., Aluminum, the Magic Metal, National Geographic, pp. 192-193, August 1978.
Alcoa Activated Aluminas, Aluminum Company of America.
Wu, Y.C., Activated Alumina Removes Fluoride Ions from Water, Water & Sewage Works, pp. 76-81, June 1978.
Weber, W.J., Physiochemical Processes for Water Quality Control, pp. 204-207, Wiley-Interscience, 1972.
Clifford, D.A., et. al. Activated Alumina: Rediscovered Adsorbent for Fluoride, Humic Acids, and Silica, Industrial Water Engineering, pp. 6-12, December 1978.
Quality of Groundwater in the Lower Colorado River Region - Arizona, Nevada, New Mexico, and Utah, Kister, L.R., Atlas HA-478, USGS Water Resources Division, Tuscon, AZ.
"Gila Bend, Arizona Community Profile", Arizona Office of Economic Planning and Development, Phoenix, AZ, January 1980.
Report on Development of Small Water System Treatment Costs for Removal of Excess Fluoride at Gila Bend, Arizona, Rubel & Hager, Inc., Tuscon, AZ, April 1982.
Report of Well Driller, Town of Gila Bend, File No. C(5-4)31-bbd, Water Division, State Land Department, Phoenix, AZ, March 1977.
Robert Lake, Water Treatment Engineers, personal communication.
Pilot Study of Fluoride and Arsenic Removal from Potable Water, Rubel, F. and Williams, F.S., EPA-600/2-80-100, EPA-MERL, Cincinnati, OH, August 1980.
Registration of Existing Wells, Thunderbird Farms Improvement District, File No. D(5-2)24-dbb, Department of Water Resources, Phoenix, AZ, June 1982.
Registration of Existing Wells, Papago Butte Irrigation Water Delivery District, File Nos. D(5-3)19-ccc and D(5-2)24-acc, Department of Water Resources, Phoenix, AZ, June 1982.
134

Registration of Existing Wells, Ruth Fisher School District #90, File No. B(2-6)28-aab, Department of Water Resources, Phoenix, AZ, May 1982.
Jerry Lineback, Illinois State Geological Survey, personal communication.
Well production test reports, Well Nos. 1 and 2, Parkersburg, IL, August & October 1956, Illinois State Geological Survey, Urbana, IL.
Dennis Stover, Illinois EPA, personal coramuncation.
Well driller's log, Well No. 4, Bureau Junction, IL, October 1946, Illinois State Geological Survey, Urbana, IL.
Well production test report, Well No. 1, Emington, Illinois, July 1971, Illinois State Geological Survey, Urbana, IL.
Kelada, N.P., Electrochemical Characterization of Free and Complexed Fluorides in Drinking Water and the Effects of Aluminum and Iron on Fluoride Incorporation Into Tooth Enamel, PhD Dissertation, University of Michigan, Ann Arbor, MI, 1972.
Statement of Source and Status of Funds, Program Year 1976, CDBG No. B-76-DS-04-0003, Town of Gila Bend, Arizona.
Bellen, G.E., Anderson, M. and Gottler, R.A., Performance and Costs of Two Activated Alumina Defluoridation Treatment Plants, Control of Inorganic Contaminants, AWWA Seminar Proceedings, pp. 19-28, AWWA, June 1983.
Bellen, G.E., Gottler, R.A. and Anderson, M., Point-of-Use Reduction of Volatile Halogenated Organics in Drinking Water, USEPA-WERL, Cincinnati, Ohio, March 1985.
135

APPENDIX A
REPORT
ON
FLUORIDE REMOVAL PILOT PLANT PROJECT
AT
NORTH MYRTLE BEACH, SOUTH CAROLINA
Introduction
On January 29, 1982 the firm of Rubel and Hager, Inc. was contracted by the National Sanitation Foundation to conduct a pilot test program demonstrating the technology for the removal of excess fluoride from the drinking water supply in North Myrtle Beach, South Carolina. Equipment and material were transported from Tucson, Arizona to North Myrtle Beach, a pilot test site was selected, and the pilot test program commenced on February 5, 1982. The test site selected was Well No. 3 which provided a water supply with a fluoride level of 5.7 mg/1 which is representative of North Myrtle Beach water. The site also provided an enclosure to house the test equipment, electrical service and an unchlorinated water supply.
Initially the program called for three (3) pilot test treatment runs using the activated alumina fluoride removal process with raw water pH adjusted to 5.5. Upon startup of the first treatment run, it was immediately found that the acid requirement was very high due to the high alkalinity of the raw water. Also the cost of acid is high in this region. Thereby, the importance of reducing the acid consumption came into focus. The adjusted raw water pH was increased from 5.5 to 5.7 during the first treatment run. It was also decided to revise the test plan for the project to the following:
1) Repeat the raw water adjusted pH of 5.7'during the second treatment run
2) Employ a raw water adjusted pH of 6.0 during the third treatment run
136

APPENDIX A (continued)
3) Add a fourth treatment run to the scope of work using a raw water adjusted pH of 6.3.
In addition to the pilot test work, the project included a survey of the existing North Myrtle Beach water pumping, storage, and distribution system with the intent of deploying a treatment system that would provide a water that complies with the fluoride MCL to all consumers throughout the system. From this survey an implementation plan was developed for compliance with the MCL. The plan resulted in a prototype design with related operating and capital costs.
137
APPENDIX A (continued)
Test Apparatus
The pilot plant test apparatus was assembled in the building that houses Well No. 3. The apparatus included a vertical cylindrical PVC treatment column (10" diameter by 60" high) which contained one (1) cubic foot of Alcoa F-l (-28, +48 mesh) activated alumina. Also included were PVC piping and valves piped for upflow or downflow operation. Accessories included pH sensors and indicators at influent and effluent, a 20 micron cartridge prefilter, flow totalizer, pressure gauges at influent and effluent, vent, a dilute acid feed system, and a dilute caustic feed system. The acid and caustic feed systems included batch tanks, feed pumps, plastic tubing, foot valves and injectors. The assembled system was supported on a steel stand. Raw water was supplied to the test apparatus directly from the well pump discharge pipe. The well pump operated continuously throughout the duration of the test program. Treated water was discharged directly to a wooded area adjacent to the well site.
pH determinations were accomplished by means of Great Lakes Instrument solid state electronic Model 60 probes and Model 70 analyzers. These were backed up by a Great Lakes Instrument Model PT70 portable pH meter. Fluoride determinations were made using the SPADNS method with a Hach DR/2 Spectrophotometer (Model #2504) in a laboratory at the North Myrtle Beach sewage treatment plant. All other wet chemical water analyses were performed at that laboratory by means of the above mentioned Hach spectrophotometer or titration. Those analyses were aluminum, silica, chloride, sulfate, M alkalinity, P alkalinity and hardness. Total Dissolved Solids (TDS) and sodium were calculated.
138

APPENDIX A (continued)
Pilot Test Program Discussion
The pilot plant operation was flawless. Starting with the first treatment run operation was continuous. At the termination of each run the treatment bed was backwashed and regenerated. Upon completion of regeneration the treatment bed was neutralized and the subsequent treatment run begun. The test apparatus was checked out and samples were taken at six hour intervals continuously. Raw, treated, and regeneration waste water samples were obtained for and transmitted to the National Sanitation Foundation. There were no problems with flow, pressure, pH control, or suspended solids in the raw water.
Throughout the pilot test program the treatment flow rate was maintained at 1% gpm. Initially the raw water pH was adjusted to 5.5 by means of dilute sulfuric acid injection. However, when it was determined that the acid consumption would be unusually high, it was decided to operate at a higher pH. Therefore, during the first run, the treatment pH was increased to 5.7. This pH was sustained during the second run. The treatment pH was raised to 6.0 for the third run, and 6.3 for the fourth run. See Appendix A for Treatment Run Data and Appendix B for a summary of the data. The treatment efficiency was higher at the lower pH. However, the acid consumption was also higher resulting in higher operating chemical cost. After treatment, the pH is raised to a level acceptable for distribution. In existing fluoride removal water treatment systems this is accomplished by means of caustic soda addition. However, this water has an undesirably high sodium level already as well as high alkalinity. Therefore, aeration for removal of dissolved carbon dioxide is the preferred method of raising the pH in this case. Appendix C provides water analyses of the raw water and aerated treated water at the three different treatment pH.
After each treatment run (except the last) the beds were backwashed, regenerated, and neutralized. This procedure was not modified during the program. Backwash
139

APPENDIX A (continued)
requirements were minimal; this step was only needed to condition the bed and remove alumina fines. No suspended material was collected on the bed or on the prefilter during any of the runs. The regeneration included upflow and downflow steps employing 3/4% sodium hydroxide solution. The upflow regeneration step was followed by an upflow rinse. The downflow regeneration step was followed by neutralization commencing at pH 3.0. The total wastewater for each regeneration was the same, 210 gallons. This wastewater was neutralized with sulfuric acid to a pH below 9.0 each time. The acid required for bed neutralization after regeneration and for neutralization of regeneration waste water is included in the chemical cost calculations. The plan for regeneration waste water disposal includes neutralization followed by slow feed to the sewer where it is diluted by the low fluoride domestic and industrial waste water. The blending of the high and low fluoride waste waters in the sewer yields a fluoride level approaching that of the untreated water currently in the collection system.
The treated water average fluoride level is a significant value; all of the treated water can be blended by various methods (staggered operation of treatment units, storage, etc.). Thereby, a considerable amount of treated water can exceed the MCL and blend with low fluoride treated water yielding a water that satisfies the fluoride MCL, in this case, 1.6 0 mg/1. The test results indicate that the optimum treatment pH will be 6.3 for the water tested. The results yield the best economics and the best quality treated water. Treating at a higher pH will greatly reduce the efficiency resulting in very poor economics.
There is another treatment step that could be added to reduce the existing high sodium level. However, that is beyond the scope of this study. The sodium level is not increased by the fluoride removal process employed on this project. Aluminum level in the treated water is almost zero (0.03 mg/1 or lower); it decreases in each subsequent treatment run. Due to-the high alkalinity, the sulfate level is increased; however, within acceptable limits.
140
APPENDIX A (continued)
Operating Cost Discussion
Estimated operating costs are summarized in Appendix D. Costs are based on an average 2 MGD system operation and current chemical, labor, and energy costs.
The sulfuric acid cost has the most impact on the cost of operation. The delivered cost of this commodity for this location is $120/ton via (50,000 lb) tank truck or $75/ton via 200,000 lb. rail super tank car. The rail delivery rate was incorporated in this estimate. This does impact the capital cost (as will be seen later) by requiring a rail storage and unloading terminal and "mini tank" truck to transport the chemical to the treatment site. In turn, the acid storage tanks at each treatment site can be sized smaller to accommodate the "mini tank" truck quantity rather than the large commercial tank truck load. This imparts capital saving at each site. Correspondingly, the caustic soda delivery can be handled at the same rail terminal with an identical logistical system. Handling both chemicals identicaly will result in a lower cost, simpler operation. Although beyond the scope of this project, it is obvious that a chemical unloading and storage terminal can serve the other communities in the area that may require treatment for fluoride removal, thus resulting in cost sharing and reduction.
Each of the operating cost items (except the chemical cost derived from the test program) are based on experience at other operating treatment plants. This project entails a repressurization step subsequent to aeration which impacts the capital cost (as explained later), but has minimum effect on operating cost. In existing plants the raw water is pumped from the well through treatment to storage or distribution. For this application, the water is pumped from the well through treatment into a forced draft aerator where the C02 is stripped. There it cascades into a wet well where it must be repumped. This entails a new pres-surization pump for the wet well and modification to the well pump to reduce the pumped pressure to that which is necessary to propel the water through treatment and aeration to the wet well. The total horsepower requirement will be increased minimally.
The cost of operation for removing this excess fluoride at North Myrtle Beach, South Carolina will be 20C/1000 gallons of treated water.
141

APPENDIX A (continued)
Capital Cost Discussion
The City of North Myrtle Beach, South Carolina has a water system that includes ten (10) active wells and five (5) elevated storage tanks (see Appendix E). Each of the ten (10) wells produces high fluoride water and pumps directly to distribution as well as storage. For purposes of this study, combining wells into joint treatment facilities was considered, but deemed unwieldy due to dispersed well locations; and therefore, discarded. All well locations were inspected for implementation of treatment systems and were deemed adequate, except for Well No. 7 which has space limitations. Though some of the wells may not be needed for production requirements at this time; it would be prudent to equip all wells with fluoride removal capability at one time. Significant capital cost savings would be realized.
Even though three (3) of these wells deliver water at a lower flow rate, it was deemed prudent to design one standard 500 gpm system to be implemented at all ten (10) well sites.
The estimated capital cost for the project, including installation and engineering, is $1,900,000. For estimated capital cost breakdown, see Appendix F. This does not include cost for land acquisition, if required. The space required for each treatment plant is 40' x 30' plus space for the 24' diameter regeneration waste water surge tank.
As covered in the operating cost discussion above, a rail chemical storage and unloading terminal along with "mini chemical tank" truck is included in the capital cost estimate, and correspondingly, smaller chemical storage tanks are incorporated at each treatment site. The land area required for the rail terminal is 60' x 40'.
As pointed out in the operating cost discussion above, the well pumps are to be modified to reduce pressure output and correspondingly horsepower draw. An additional repressurization pump is included.
Design information is not included in the report.
142
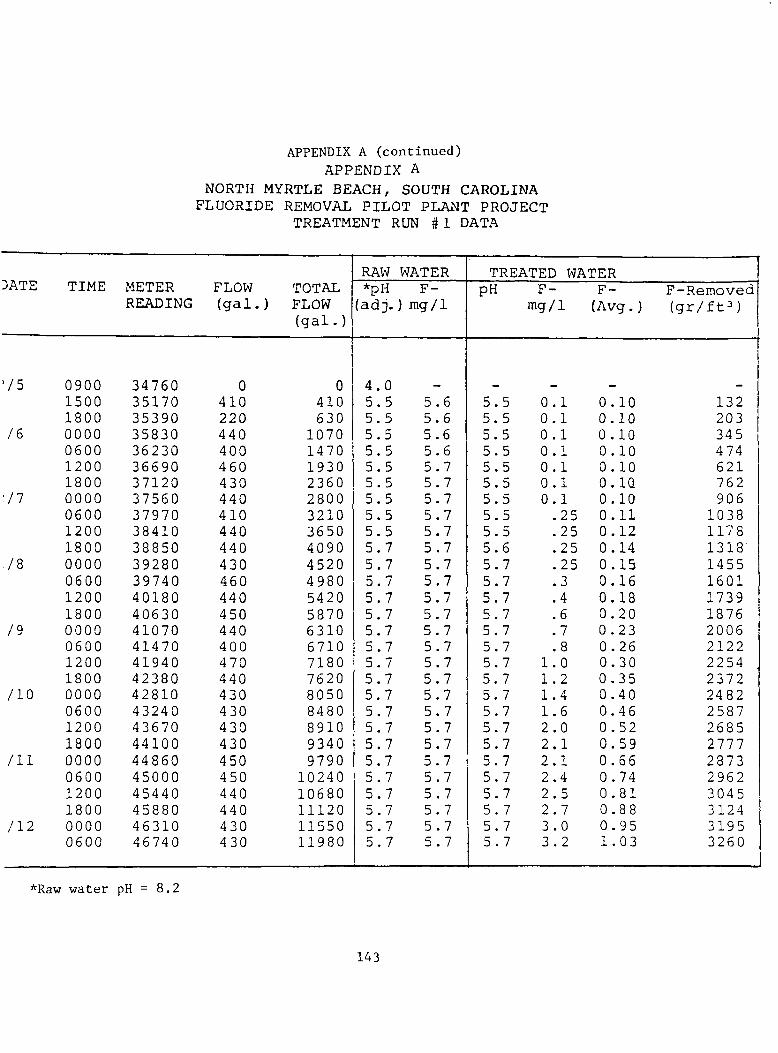
APPENDIX A (cont inued) APPENDIX A
NORTH MYRTLE BEACH, SOUTH CAROLINA FLUORIDE REMOVAL PILOT PLANT PROJECT
TREATMENT RUN #1 DATA
DATE
75
76
77
78
/9
/10
/ll
/12
TIME
0900 1500 1800 0000 0600 1200 1800 0000 0600 1200 1800 0000 0600 1200 1800 0000 0600 1200 1800 0000 0600 1200 1800 0000 0600 1200 1800 0000 0600
METER READING
34760 35170 35390 35830 36230 36690 37120 37560 37970 38410 38850 39280 39740 40180 40630 41070 41470 41940 42380 42810 43240 43670 44100 44860 45000 45440 45880 46310 46740
FLOW (gal.)
0 410 220 440 400 460 430 440 410 440 440 430 460 440 450 440 400 470 440 430 430 430 430 450 450 440 440 430 430
TOTAL FLOW (gal.)
0 410 630
1070 1470 1930 2360 2800 3210 3650 4090 4520 4980 5420 5870 6310 6710 7180 7620 8050 8480 8910 9340 9790
10240 10680 11120 11550 11980
RAW *pH (adj.)
4.0 5.5 5.5 5.5 5.5 5.5 5.5 5.5 5.5 5.5 5.7 5.7 5.7 5.7 5.7 5.7 5.7 5.7 5.7 5.7 5.7 5.7 5.7 5.7 5.7 5.7 5.7 5.7 5.7
WATER F-
mg/1
5.6 5.6 5.6 5.6 5.7 5.7 5.7 5.7 5.7 5.7 5.7 5.7 5.7 5.7 5.7 5.7 5.7 5.7 5.7 5.7 5.7 5.7 5.7 5.7 5.7 5.7 5.7 5.7
TREATED WATER PH
5.5 5.5 5.5 5.5 5.5 5.5 5.5 5.5 5.5 5.6 5.7 5.7 5.7 5.7 5.7 5.7 5.7 5.7 5.7 5.7 5.7 5.7 5.7 5.7 5.7 5.7 5.7 5. 7
F-mg/1
0.1 0.1 0.1 0.1 0.1 0.1 0.1 .25 .25 .25 .25 .3 .4 .6 .7 .8
1.0 1.2 1.4 1.6 2.0 2.1 2.1 2.4 2.5 2.7 3.0 3.2
F-(Avg.)
0.10 0.10 0.10 0.10 0.10 0.1Q 0.1Q 0.11 0.12 0.14 0.15 0.16 0.18 0.20 0.23 0.26 0.30 0.35 0.40 0.46 0.52 0.59 0.66 0.74 0.81 0.88 0.95 1.03
F-Removed (gr/ft3)
132 203 345 474 621 762 906
1038 1178 1318 1455 1601 1739 1876 2006 2122 2254 2372 2482 2587 2685 2777 2873 2962 3045 3124 3195 3260
*Raw water pH = 8.2
143

APPENDIX A (cont inued)
APPENDIX A NORTH MYRTLE BEACH, SOUTH CAROLINA
FLUORIDE REMOVAL PILOT PLANT PROJECT TREATMENT RUN # 2 DATA
DATE
2/12
2/13
2/14
1 2/15
| 2/16
' 2/17
2/18
2/19
TIME
1630 1800 0000 0600 1200 1800 0000 0600 1200 1800 0000 0600 1200 1800 0000 0600 1200 1800 0000 0600 1200 1800 0000 0600 1200 1800 0000 0600
METER READING
47120 47260 47720 48180 48640 49080 49520 49960 50410 50850 51290 51740 52150 52590 53020 52460 53880 54310 54730 55210 55640 56080 56520 56960 57390 57830 58260 58700
FLOW (gal.)
80 140 460 460 460 440 440 440 450 440 440 450 410 440 430 440 420 430 420 480 430 440 440 440 430 440 430 440
TOTAL FLOW (gal.)
80 220 680 1140 1600 2040 2480 2920 3370 3810 4250 4700 5110 5550 5980 6420 6840 7270 7690 8170 8600 9040 9480 9920 10350 10790 11220 11660
RAW WATER *pH (adj.)
5.7 5.7 5.7 5.7 5.7 5.7 5.7 5.7 5.7 5.7 5.7 5.7 5.7 5.7 5.7 5.7 5.7 5.7 5.7 5.7 5.7 5.7 5.7 5.7 5.7 5.7 5.7 5.7
F-mg/1
5.7 5.7 5.7 5.7 5.7 5.7 5.7 5.7 5.7 5.7 5.7 5.7 5.7 5.7 5.7 5.7 5.7 5.7 5.7 5.7 5.7 5.7 5.7 5.7 5.7 5.7 5.7 5.7
TREATED WATER PH
6.5 5.7 5.7 5.7 5.7 5.7 5.7 5.7 5.7 5.7 5.7 5.7 5.7 5.7 5.7 5.7 5.7 5.7 5.7 5.7 5.7 5.7 5.7 5.7 5.7 5.7 5.7 5.7
F-mg/1
.4
.35
.2
.1
.1
.15
.15
.2
.2
.2
.2
.2
.3.
.45
.65
.80 1.00 1.15 1.3 1.5 1.7 1.9 2.1 2.3 2.5 2.7 2.9 3.1
F-(Avg.)
0.40 0.37 0.25 0.19 0.16 0.16 0.16 0.17 0.17 0.17 0.18 0.18 0.19 0.21 0.24 0.28 0.33 0.37 0.42 0.48 0.55 0.62 0.68 0.75 0.83 0.90 0.98 1.06
F-Removed (gr/ft3)
25 69
217 364 511 655 797 939 1084 1226 1368 1512 1641 1775 1903 2029 2144 2258 2366 2484 2585 2683 2776 2863 2944 3021 3091 3158
*Raw water pH = 8.2
144

APPENDIX A (continued)
APPENDIX A NORTH MYRTLE BEACH, SOUTH CAROLINA
FLUORIDE REMOVAL PILOT PLANT PROJECT TREATMENT RUN #3 DATA
DATE TIME METER FLOW TOTAL READING (gal.) FLOW
(gal.)
719 1800 59270 460 460 720 0000 59730 460 920
0600 60190 450 1370 1200 60640 460 1830 1800 61100 450 2280
721 0000 61550 450 2730 0600 62000 440 3170 1200 62440 480 3650 1800 62920 450 4100
722 0000 63370 450 4550 0600 63820 450 5000 1200 64270 450 5450 1800 64720 450 5900
723 0000 65170 450 6350 0600 65620 450 6800 1200 66070 450 7250 1800 66520 460 7710
724 0000 66880 460 8170 0600 67440 460 8630 1200 67900 450 9080 1800 68350 460 9540
725 0000 68810 460 10000
RAW WATER *pH F-(adj.) mg/1
6.0 5.7 6.0 5.7 6.0 5.7 6.0 5.7 6.0 5.7 6.0 5.7 6.0 5.7 6.0 5.7 6.0 5.7 6.0 5.7 6.0 5.7 6.0 5.7 6.0 5.7 6.0 5.7 6.0 5.7 6.0 5.7 6.0 5.7 6.0 5.7 6.0 5.7 6.0 5.7 6.0 5.7 6.0 5.7
TREATED WATER pH F- F- F-Removed
mg/1 (Avg.) (gr/ft3)
6.3 0.7 0.70 135 6.0 0.35 0.52 279 6.0 0.30 0.45 421 6.0 0.30 0.41 566 6.0 0.35 0.40 707 6.0 0.35 0.39 847 6.0 0.4 0.39 983 6.0 0.4 0.39 1132 6.0 0.4 0.40 1271 6.0 0.45 0.40 1409 6.0 0.525 0.41 1545 6.0 0.65 0.43 1678 6.0 0.75 0.46 1807 6.0 0.9 0.49 1933 6.0 1.1 0.53 2054 6.0 1.4 0.59 2167 6.0 1.8 0.66 2272 6.0 2.1 0.73 2369 6.0 2.55 0.84 2454 6.0 2.9 0.94 2528 6.0 3.25 1.05 2594 6.0 3.65 1.17 2649
*Raw water pH = 8.2

APPENDIX A (cont inued)
APPENDIX A NORTH MYRTLE BEACH, SOUTH CAROLINA
FLUORIDE REMOVAL PILOT PLANT PROJECT TREATMENT RUN # 4 DATA
1 DATE
' 2/25
2/26
V27
J/28
1/1
J/2
TIME
1400 1800 0000 0600 1200 1800 0000 0600 1200 1800 0000 0600 1200 1800 0000 0600 1200 1800 0000
METER READING
69540 69860 70300 70740 71170 71620 72060 72520 72900 73410 73860 74310 74750 75190 75650 76110 76570 77020 77480
FLOW (gal.)
320 440 440 430 450 440 460 440 450 450 450 440 440 460 460 460 450 460 460
TOTAL FLOW (gal.)
320 760
1200 1630 2080 2520 2980 3420 3870 4320 4770 5210 5650 6110 6570 7030 7480 7940 8400
RAW 1 *pH (adj.)
6.3 6.3 6.3 6.3 6.3 6 .3 6.3 6.3 6.3 6.3 6.3 6.3 6.3 6.3 6.3 6.3 6.3 6.3 6.3
WATER F-
mg/1
5.7 5.7 5.7 5.7 5.7 5.7 5.7 5.7 5.7 5.7 5.7 5.7 5.7 5.7 5.7 5.7 5.7 5.7 5.7
TREATED WATER pH
7.6 6.3 6.3 6.3 6.3 6.3 6.3 6.3 6.3 6.3 6.3 6.3 6.3 6.3 6.3 6.3 6.3 6.3 6.3
F-mg/1
0.4 0.35 0.3 0.3 0.3 0.35 0.35 0.4 0.5 0.7 0.95 1.25 1.55 2.15 3.0 3.75 4.25 4.5 4.75
F-(Avg.)
0.40 0.37 0.34 0.33 0.33 0.33 0.34 0.35 0.37 0.40 0.45 0.52 0.59 0.70 0.86 1.05 1.25 1.43 1.60.
F-Removed (gr/ft3)
99 237 376 512 653 791 934 1070 1207 1339 1464 1579 1686 1781 1854 1907 1945 1977 2003
*Raw water pH = 8.2
146
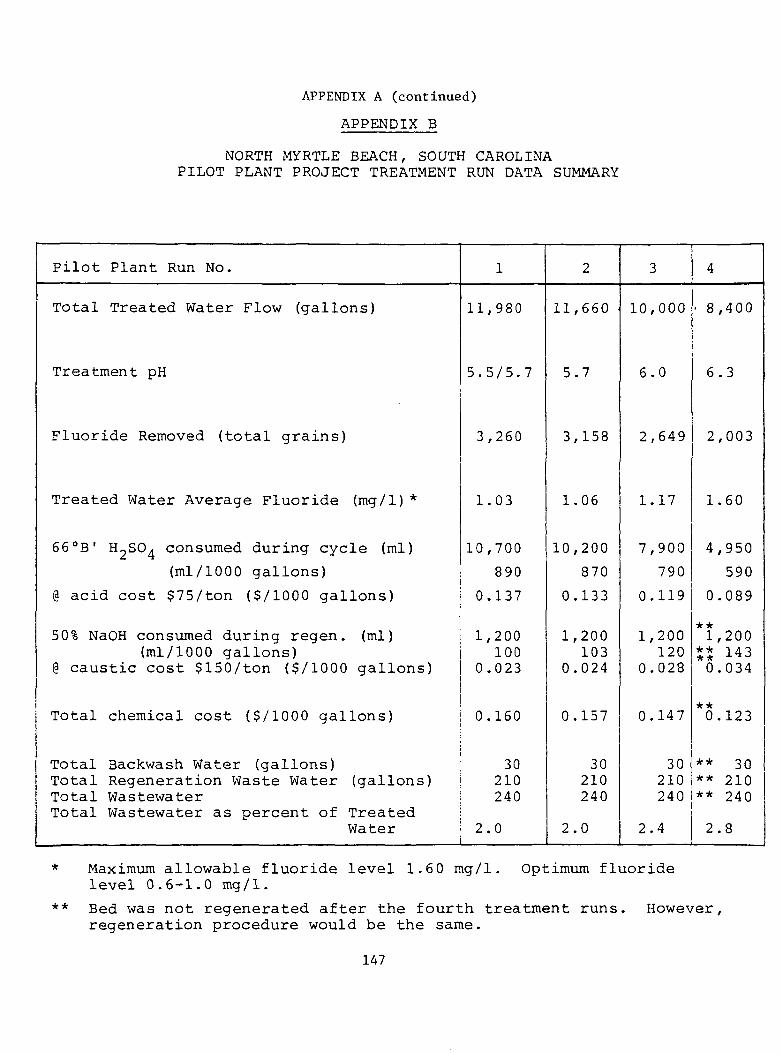
APPENDIX A (cont inued)
APPENDIX B
NORTH MYRTLE BEACH, SOUTH CAROLINA PILOT PLANT PROJECT TREATMENT RUN DATA SUMMARY
Pilot Plant Run No.
Total Treated Water Flow (gallons)
Treatment pH
Fluoride Removed (total grains)
Treated Water Average Fluoride (mg/1)*
66°B' H-SO. consumed during cycle (ml)
(ml/1000 gallons)
§ acid cost $75/ton ($/1000 gallons)
50% NaOH consumed during regen. (ml) (ml/1000 gallons)
@ caustic cost $150/ton ($/1000 gallons)
Total chemical cost ($/1000 gallons)
Total 3ackwash Water (gallons) Total Regeneration Waste Water (gallons) Total Wastewater Total Wastewater as percent of Treated
Water
1
11,980
5.5/5.7
3,260
1.03
10,700
890
0.137
1,200 100
0.023
0.160
30 210 240
2.0
2
11,660
5.7
3,158
1.06
10,200
870
0.133
1,200 103
0.024
0.157
30 210 240
2.0
3
10,000
6.0
2,649
1.17
7,900
790
0.119
1,200 120
0.028
0.147
30 210 240
2.4
4
• 8,400
6.3
2,003
1.60
4,950
590
0.089
** 1,200
** 143 0.034
** 0.123
** 30 ** 210 ** 240
2.8
Maximum allowable fluoride level 1.6 0 mg/1. Optimum fluoride level 0.6-1.0 mg/1.
Bed was not regenerated after the fourth treatment runs. However, regeneration procedure would be the same.
147

APPENDIX A (cont inued)
APPENDIX C
FLUORIDE REMOVAL PILOT PLANT PROJECT WATER ANALYSES
Hardness (mg/1 CaCO.,)
Total Alkalinity (mg/1 CaCOj
P Alkalinity (mg/1 CaCO-j)
TDS (mg/1 CaC03)
Sodium (mg/1)
Chloride (mg/1)
Sulfate (mg/1)
Fluoride (mg/1) ,
Aluminum (mg/1)
Silica (mg/1)
pH
Raw
18
560
17
1284
583
510
5
5.7
0
16
8.3
Treated Water - Aerated
Raw Water Adjustment
5.7
18
180
0
1286
583
510
372
0.7
0.03
16
8.0
6.0
18
235
0
1285
583
510
319
0.7
0.02
16
8.0
6.3
18
385
0
1286
583
510
175
0.7
0.01
16
8.0
148

APPENDIX A ( c o n t i n u e d )
APPENDIX E>
FLUORIDE REMOVAL WATER TREATMENT PLANT
NORTH MYRTLE BEACH, SOUTH CAROLINA
OPERATING COST ESTIMATE - SUMMARY
A. Chemical Costs
1) Acid for Raw Water pH Adjustment 2) Caustic for Regeneration 3) Acid for Neutralization of Bed
after Regeneration 4) Acid for Neutralization of Regen
eration Waste Water Sub Total
B. Operating Labor Cost
$30,000/year per 2 MGD operation
C. Electrical Energy
5 HP @ 5C/KWH, 500 gpm
D. Replacement Parts
$5,000/yr @ 2 MGD operation
E. Replacement Media
$5,000/yr @ 2 MGD operation
F. Water chemistry Lab Materials
$l,000/yr @ 2 MGD operation
G. Chemical Rail Terminal Operation
electrical, truck operation and misc. (labor included in B. above)
H. Outside Services
$5,000/yr @ 2 MGD operation
Raw Water Adjusted pH
5.7 6.0
*12.2 2.4 0.5
0.6
I5T7
**4.0
0.6
0.7
0.7
0.1
0.5
0.7
*23.0
*10.6 2.8 0.5
0.7
T4T7
**4.0
0.6
0.7
0.7
0.1
0.5
0.7
*22.0
6.3
*7.3 3.4 0.7
0.9
TO
**4.0
0.6
0.7
0.7
0.1
0.5
0.7
*19.6
* Costs are in cents per thousand gallons of treated water
** At lower pH operation there are fewer regenerations but more chemical handling. Therefore, labor cost is a function of gallons treated
149

APPENDIX A (cont inued)
APPENDIX E
NORTH iMYRTLE BEACH, SOUTH CAROLINA
WATER SYSTEM DATA
A WELLS
Well No.
1
2
3
4
5
6
7*
8**
9
10
Location
41st Ave. S. (Windy Hill)
27th Ave. S. West Side 17 (Stuckys)
Krispy Kreme
9th Ave. & Hillside
Bay Street & 2nd Ave. S.
11th Ave. N. on West Side
Sea Mountain Highway
4 6th Ave. S
Hwy. 65 & Hwy 17
2 4th Ave. S. at Airport
Flow Rate (gpm)
350
300
500
300
500
500
500
500
500
500
Fluoride (mg/1)
6.0
5.6
5.7
5.8
5.2
6.0
4.5 **
5.7
4.0
Insufficient space for treatment system at well site Well pump disassembled
B STORAGE TANKS
Tank
1
2
3
4
5
No. Location
41st Ave. S (Windy Hill)
Crescent Beach
Hillside & 2nd Ave. N.
31st Ave. N.
Bay Street & 2nd Ave.
Cap acity (gallons)
150,000
150,000
150,000
200,000
200,000
150
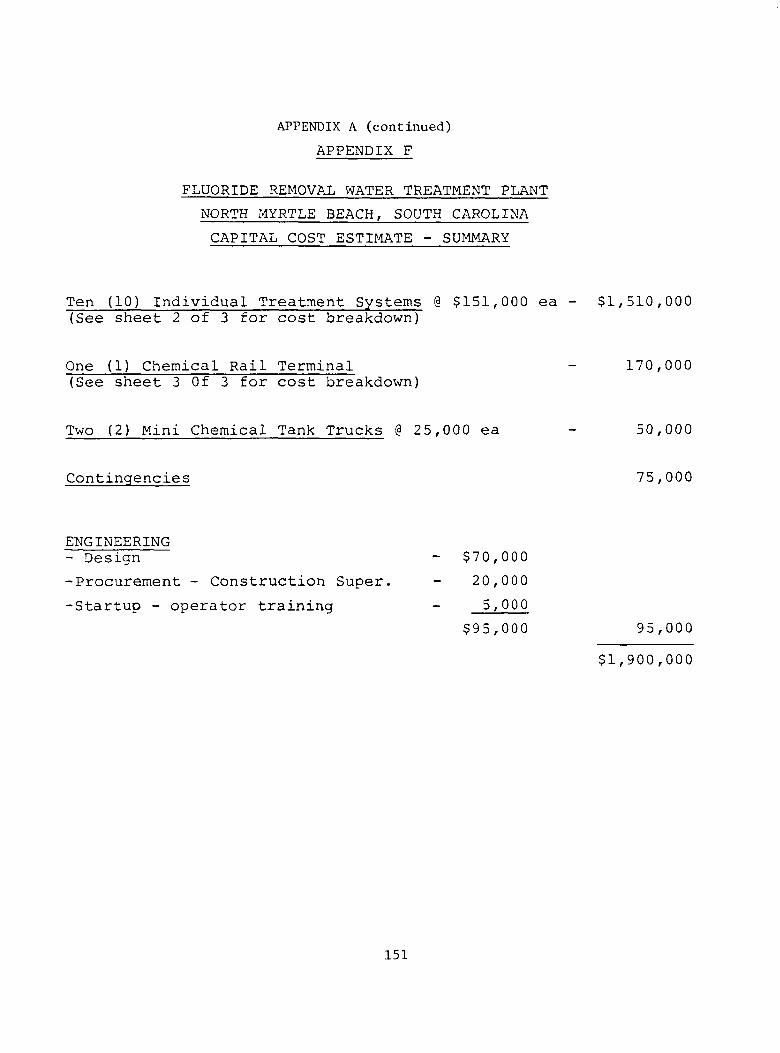
APPENDIX A (cont inued)
APPENDIX F
FLUORIDE REMOVAL WATER TREATMENT PLANT
NORTH MYRTLE BEACH, SOUTH CAROLINA
CAPITAL COST ESTIMATE - SUMMARY
Ten (10) Individual Treatment Systems @ $151,000 ea - $1,510,000 (See sheet 2 of 3 for cost breakdown)
One (1) Chemical Rail Terminal - 170,000
(See sheet 3 Of 3 for cost breakdown)
Two (2) Mini Chemical Tank Trucks @ 25,000 ea - 50,000
Contingencies 75,000
ENGINEERING - Design
-Procurement - Construction Super.
-Startup - operator training
$1,900,000
$70,000
20,000
5,000
$95,000 95,000
151

APPENDIX A (continued)
APPENDIX F
FLUORIDE REMOVAL WATER TREATMENT PLANT
NORTH MYRTLE BEACH, SOUTH CAROLINA
CAPITAL COST ESTIMATE - INDIVIDUAL TREATMENT SYSTEMS
Process Equipment
Treatment Vessels and Operating Platform - $22,000
Process Piping and Accessories - 10,000
Treatment Media - 10,000
Chemical Storage Vessels - 12,000
Chemical Pumps, Piping and Accessories - 7,000
Forced Draft Aerator with Blower - 12,000
Pressurization Pump - 5,000
Sub Total - $78,000 - $ 78,000
Process Equipment Installation
Mechanical (Iricl.Well Pump Modification) - $18,000
Electrical - 5,000
Painting - 2,000
Sub Total - $25,000 - $ 25,000
Miscellaneous Installed Items
Regeneration Wastewater Surge Tank - $25,000
Slabs, Foundations, Earthwork, Site Work and Fence - 12,000 Building to House Chemical Day Tanks, Electrical, and Controls - 3,000
Sub Total - $40,000 - $ 40,000
Freight and Taxes - 8,000 - $ 8,000
TOTAL - $151,000
152

APPENDIX A (cont inued)
APPENDIX F
FLUORIDE REMOVAL WATER TREATMENT PLANT
NORTH MYRTLE BEACH, SOUTH CAROLINA
CAPITAL COST ESTIMATE - CHEMICAL RAIL TERMINAL
Process Equipment
Chemical Storage Tanks with Platforms - $ 75,000
Chemical Pumps Piping and Accessories - 25,000
Sub Total - $100,000 - $100,000
Process Equipment Installation
Mechanical - 15,000
Electrical - 7,000
Painting & Misc. - 5,000
Sub Total - $ 27,000 - $ 27,000
Miscellaneous Installed Items
Slabs, Foundation, Earthwork,
Site Work, and Fence - $ 25,000
Roof to Cover Tanks (no building) - 8 ,000
Sub Total - $ 33,000 - $ 33,000
Freight and Taxes - $ 10,000
TOTAL - $170,000
153

APPENDIX B.
RAW AND TREATED WATER QUALITY
(All units are rag/L unless otherwise noted)
Gila Bend, AZ Palo Verde, AZ
Raw Treated Raw Treated
pH (units) Alkalinity (CaC03) F CI SO 4 NO 3 TDS Turbidity (NTU) Si MBAS Ag Al As Ba Ca Cd Cr Cu Fe Hg Mg Mn Na Pb Se Zn TOC TTHM (Wg/L)
8.4 27 5.0
566 172 ND
1300 <0.1 12.9 <0.05 <0.001 0.03 0.015 <0.1 34.0 <0.0001 0.020 0.009 0.15 <0.0002 0.5 <0.001 390 <0.001 <0.001 <0.01 0.3 ND
* 13 *
566 145 0.15
1330 <0.1 *
<0.05 <0.001 *
<0.001 <0.1 34.5 <0.0001 0.014 0.005 0.13 0.0002 0.5 <0.001 390 <0.001 <0.001 <0.01 0.3 ND
7.9 47 6.7
275 108 1
700 3.7 10.6 <0.05 <0.001 0.01 0.030 <0.1 29.0 <0.0001 0.006 0.042 <0.01 <0.0002 2.6 0.003
230 <0.001 <0.001 0.11 0.4 ND
* 35 *
272 161 1
730 5.5 *
<0.05 <0.001 *
<0.001 <0.1 30.5 <0.0001 <0.001 0.002 <0.01 <0.0002 2.7 0.005
210 <0.001 <0.001 <0.01 -ND
*Analyte varies with treatment conditions. ND = Not detectable.
154

APPENDIX B (cont.)
(All units are rag/L unless otherwise noted)
Thunderbtrd Farms Papago Butte
Raw Treated Raw Treated
pH (units) Alkalinity (CaC03) F CI so4 NO 3 TDS Turbidity (NTU) Si MBAS Ag Al As Ba Ca Cd Cr Cu Fe Hg Mg Mn Na Pb Se Zn TOC TTHM (Mg/L)
7.8 202 2.6
173 204 8
890 3.1 15.4 <0.05 <0.0002 0.02 0.013 <0.1 22.0 <0.0001 0.011 0.007 0.04 0.0003 16.5 <0.001 250 <0.001 <0.00l <0.01 0.2 4
* 196 *
168 210 10
870 3.0 *
<0.05 <0.0002 *
<0.001 <0.1 26.5 <0.0001 0.002 0.005 0.01 0.0011 17.0 <0.001 240 <0.001 <0.001 <0.01 0.4 ND
7.0 207 2.6
150 190 11
850 3.3 14.0 0.05 <0.0002 <0.01 0.008 <0.1 22.0 <0.0001 0.008 0.004 0. 19 <0.0002 17.0 <0.001 230 <0.001 <0.001 0.14 1.1 1
* 179 *
152 197 8
810 3.0 *
<0.05 <0.0002 *
<0.001 <0.1 29.0 <0.0001 0.004 0.017 0.15 0.0020 17.8 <0.001 220 0.006 <0.001 0.27 0.7 7
*Analyte varies with treatment conditions, ND = Not detectable.
155

APPENDIX B (coat.)
(All units are mg/L unless otherwise noted)
Ruth Fisher School You and I Trailer Park
pH (units) Alkalinity (CaC03) F CI S0„ NO 3 TDS Turbidity (NTU) Si MBAS Ag Al As Ba Ca Cd Cr Cu Fe Hg Mg Mn Na Pb Se Zn TOC TTHM (pg/L)
Raw
8.2 77 4.4
152 125 13
620 3.8 7.4 <0.05 <0.001 0.01 0.012 <0.1 32.5 <0.0001 0.047 0.022 <0.01 0.0003 3.9 <0.001 160 <0.001 <0.001 0.06 0.6 ND
Treated
*
76 *
157 -14
600 3.1 *
<0.05 <0.001 *
<0.001 <0.1 29.0 <0.0001 0.035 0.104 0.01 0.0003 3.8 <0.001 170 <0.001 0.003 0.08 0.5 ND
Raw
8.8 40 15.7 84 46 1
290 3.3 10.6 <0.05 <0.001 0.03 0.086 <0.1 4.2 <0.0001 <0.001 <0.001 <0.01 <0.0002 0.1 <0.001 94 <0.001 <0.001 <0.01 0.5 ND
Treated
*
1 *
84 -
1 290 3.0 *
<0.05 <0.001 *
<0.001 <0.1 0.3 <0.0001 <0.001 <0.001 <0.01 <0.0002 <0.1 <0.001 92 <0.001 <0.001 <0.01 0.3 ND
*Analyte varies with treatment conditions. ND = Not detectable.
156
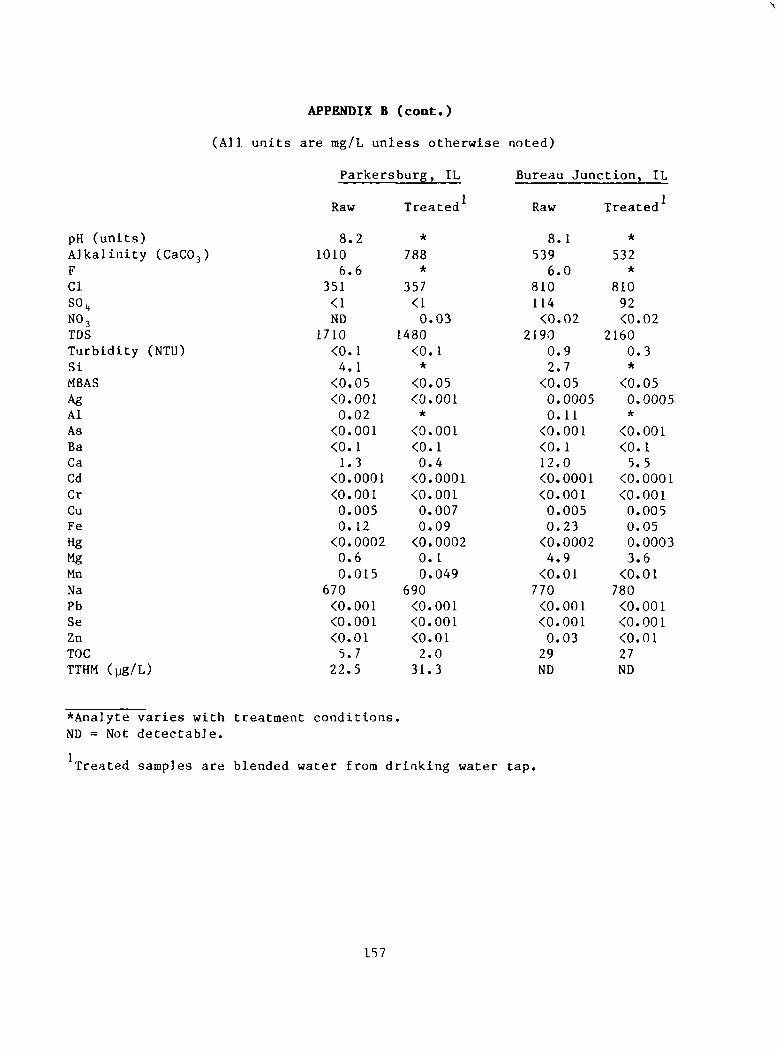
N
APPENDIX B (cont.)
(All units are rag/L unless otherwise noted)
Parkersburg, IL
pH (units) Alkalinity (CaC03) F CI so4 NO 3 TDS Turbidity (NTU) Si MBAS
Ag Al As Ba Ca Cd Cr Cu Fe Hg Mg Mn Na Pb Se Zn TOC TTHM (yg/L)
Raw
8.2 1010
6.6 351 <1 ND
1710 <0.1 4.1
<0.05 <0.001 0.02
<0.001 <0.1 1.3
<0.0001 <0.001 0.005 0.12 <0.0002 0.6 0.015
670 <0.001 <0.001 <0.01 5.7
22.5
Treated
*
788 *
357 <1 0.03
1480 <0.1 *
<0.05 <0.001 *
<0.00l <0.1 0.4
<0.0001 <0.001 0.007 0.09 <0.0002 0. 1 0.049
690 <0.001 <0.001 <0.01 2.0
31.3
Bureau Junction, IL
Raw
8.1 539 6.0
810 114 <0.02
2190 0.9 2.7
<0.05 0.0005 0.11 <0.001 <0. 1 12.0 <0.0001 <0.001 0.005 0.23 <0.0002 4.9
<0.01 770 <0.001 <0.001 0.03 29 ND
Treated
*
532 *
810 92 <0.02
2160 0.3 *
<0.05 0.0005 •k
<0.001 <0.1 5.5
<0.0001 <0.001 0.005 0.05 0.0003 3.6
<0.01 780 <0.001 <0.001 <0.01 27 ND
*Analyte varies with treatment conditions. ND = Not detectable.
1 Treated samples are blended water from drinking water tap.
157
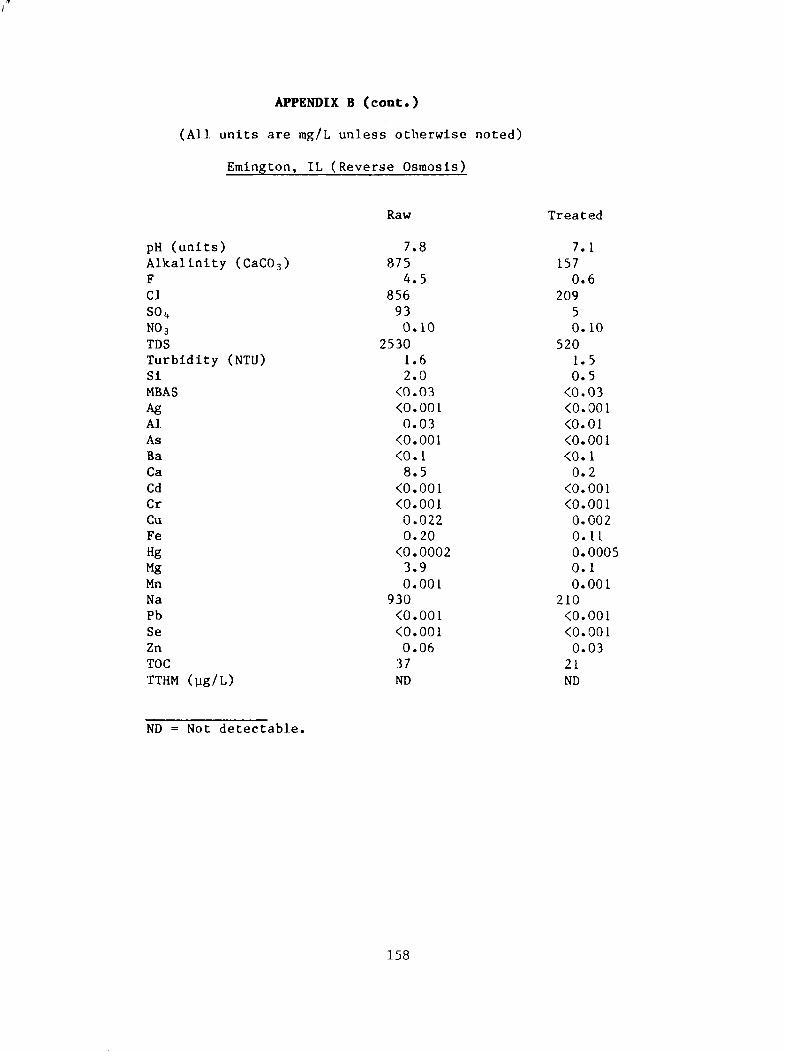
/"
APPENDIX B (coot.)
(All units are mg/L unless otherwise noted)
Emington, IL (Reverse Osmosis)
Raw Treated
pH (units) Alkalinity (CaC03) F CI SO 4 NO 3 TDS Turbidity (NTU) Si MBAS Ag Al As Ba Ca Cd Cr Cu Fe Hg Mg Mn Na Pb Se Zn TOC TTHM (yg/L)
7.8 875
4.5 856 93 0.10
2530 1.6 2.0
<0.03 <0.001 0.03
<0.001 <0.1 8.5
<0.001 <0.001 0.022 0.20
<0.0002 3.9 0.00L
930 <0.001 <0.001 0.06 37 ND
7. 157
0. 209
5 0.
520 1. 0.
10
5 5
<0.03 <0.001 <0.01 <0.001 <0. 0.
<0.001 <0.001 0.002 0.11 0.0005 0.1 0.001
210 <0.001 <0.001 0.03
21 ND
ND = Not detectable.
158


