
FINANCIAL ANALYSIS
MADE EASY
(FAME)
Workbook
Finding a specific company report ...................................................................................................... 2
Finding companies matching two or more criteria (location & industry) .......................................... 3
Company lists : selecting order of results and columns displayed ..................................................... 4
Creating a peer report for a company, e.g. Vax Ltd ............................................................................ 6
Comparing companies by peer analysis .............................................................................................. 7
Export a list to Excel ............................................................................................................................ 8
Searching on dormant companies ...................................................................................................... 9
Further analysis of data .................................................................................................................... 12
Further help ...................................................................................................................................... 12
You may like to try out these exercises to familiarize yourself with FAME’s interface,
functionality and coverage.

2 SO Jan 2014 File location: https://blackboard.swan.ac.uk/bbcswebdav/institution/LibraryISSResources/BusEconCrim/FAME%20workbook.pdf
Finding a specific company report
Enter the name of the company, e.g. VAX. Click on
Results
The entry for VAX Ltd should be displayed. To view different types of report go to the
menu on the right of the screen & select report format
Standard Report = covers 10 years, includes key financials, balance sheets, profit &
loss and lots of other sections.
Full Report = contains the same information as the standard report, plus extra
sections on filings, industry, brand names, plus lots of graphs & indices to show
structure of balance sheet and profit & loss.
TIP:
To start a brand new search, click on in the top left of screen
to return to the home page
Then Clear Search by clicking on to start afresh

3 SO Jan 2014 File location: https://blackboard.swan.ac.uk/bbcswebdav/institution/LibraryISSResources/BusEconCrim/FAME%20workbook.pdf
Finding companies matching two or more criteria (location & industry)
Research topic: Search for fish farms and hatcheries in the Edinburgh area.
Users can select one or more criteria to perform a more advanced search.
The grouped view categorises the criteria, to see a full listing of the criteria select
alphabetical list
First criterion: Location
Select Postal Regions from the Location menu:
Expand Scotland by clicking on the +, then select Edinburgh (EH) & click on

4 SO Jan 2014 File location: https://blackboard.swan.ac.uk/bbcswebdav/institution/LibraryISSResources/BusEconCrim/FAME%20workbook.pdf
Second criterion: Industry
Select Industry > UK SIC code* > Select 03 Fishing & Aquaculture > Click on OK
*UK SIC stands for UK Standard Industrial Classification
At the bottom of the home page in the Search Strategy box the steps for the latest
search are listed and the number of companies which have been found at each step.
Click on View list of results.
Company lists : selecting order of results and columns displayed
By default a list of company results will have the Standard display format and the
companies will be sorted by the column Latest Operating Revenue
You can change the sort option by clicking on the Sort icon at the top of any
column.
You also delete unwanted columns.
To introduce different columns into your display click on on
the right of the screen.
5 SO Jan 2014 File location: https://blackboard.swan.ac.uk/bbcswebdav/institution/LibraryISSResources/BusEconCrim/FAME%20workbook.pdf
There are 3 predefined formats: Standard (the default); Credit; Financial; Audit.
Alternatively the user can select their own format > New.
Display ownership information for the Edinburgh fisheries search
With the results for the Edinburgh fisheries search still on the screen, select List
Format > New
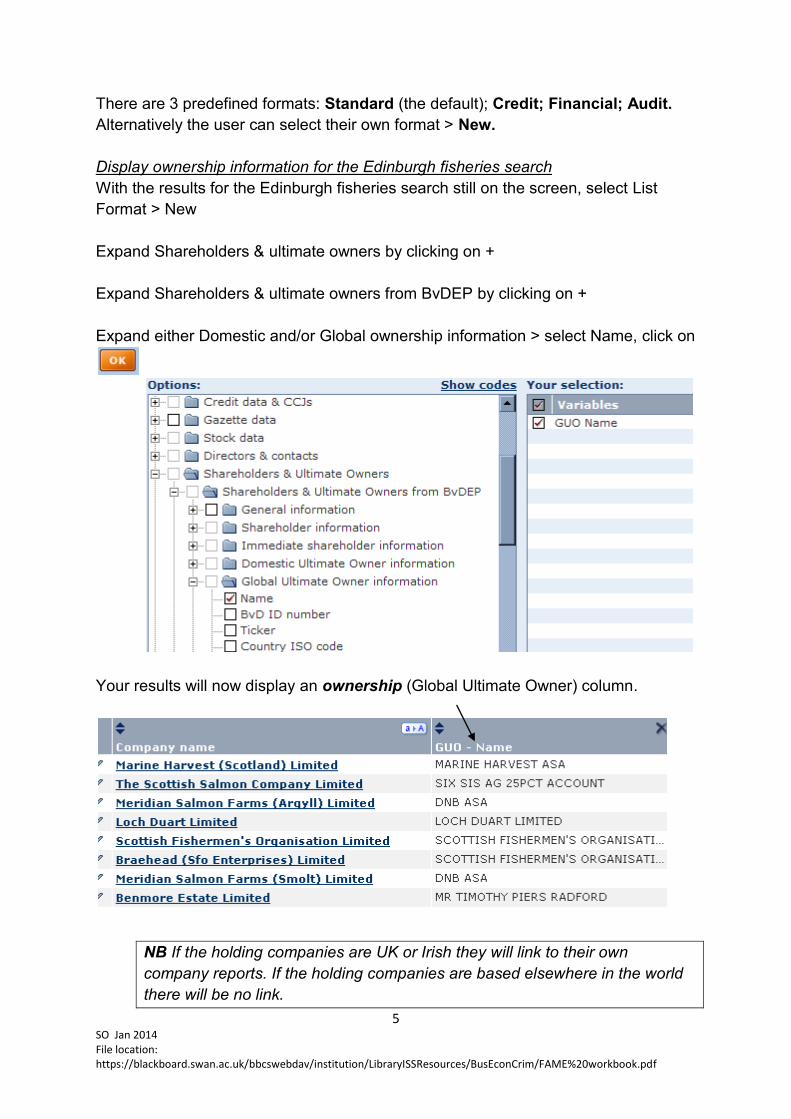
Expand Shareholders & ultimate owners by clicking on +
Expand Shareholders & ultimate owners from BvDEP by clicking on +
Expand either Domestic and/or Global ownership information > select Name, click on
Your results will now display an ownership (Global Ultimate Owner) column.
NB If the holding companies are UK or Irish they will link to their own
company reports. If the holding companies are based elsewhere in the world
there will be no link.

6 SO Jan 2014 File location: https://blackboard.swan.ac.uk/bbcswebdav/institution/LibraryISSResources/BusEconCrim/FAME%20workbook.pdf
Creating a peer report for a company, e.g. Vax Ltd
A Peer Report compares a company to its standard peer group. A standard
peer group is defined as 10 companies with the same SIC code (standard
industrial classification) and similar turnover.
TIP:
To start a brand new search, click on in the top left of screen
to return to the home page
Then Clear Search by clicking on to start afresh
Search for Vax Ltd and view the standard report (see page 2 for details)
Click on Peer Report on the right hand side of the screen, and select the type of
output you want, e.g. a chart or table.
The variables displayed can be changed by clicking the Options button or
using the left hand Variables menu.

7 SO Jan 2014 File location: https://blackboard.swan.ac.uk/bbcswebdav/institution/LibraryISSResources/BusEconCrim/FAME%20workbook.pdf
Comparing companies by peer analysis
Peer analysis enables the user to select the companies to be compared.
FAME can only perform peer analysis of a maximum of 500 companies.
Compare the Welsh companies which are listed on the stock exchange.
Start at the FAME homepage (clear previous searches first – see page 6 for details)
Select criteria> Location> Country > Wales > OK.
Select Stock Data > Listed companies > Publicly listed companies only > OK.
Go to Search Strategy > View list of results.
Click on Peer Analysis (on the right of the screen) > Compare companies – either
click New analysis to select your own variables or select a predefined analysis such
as Key Financials.
8 SO Jan 2014 File location: https://blackboard.swan.ac.uk/bbcswebdav/institution/LibraryISSResources/BusEconCrim/FAME%20workbook.pdf
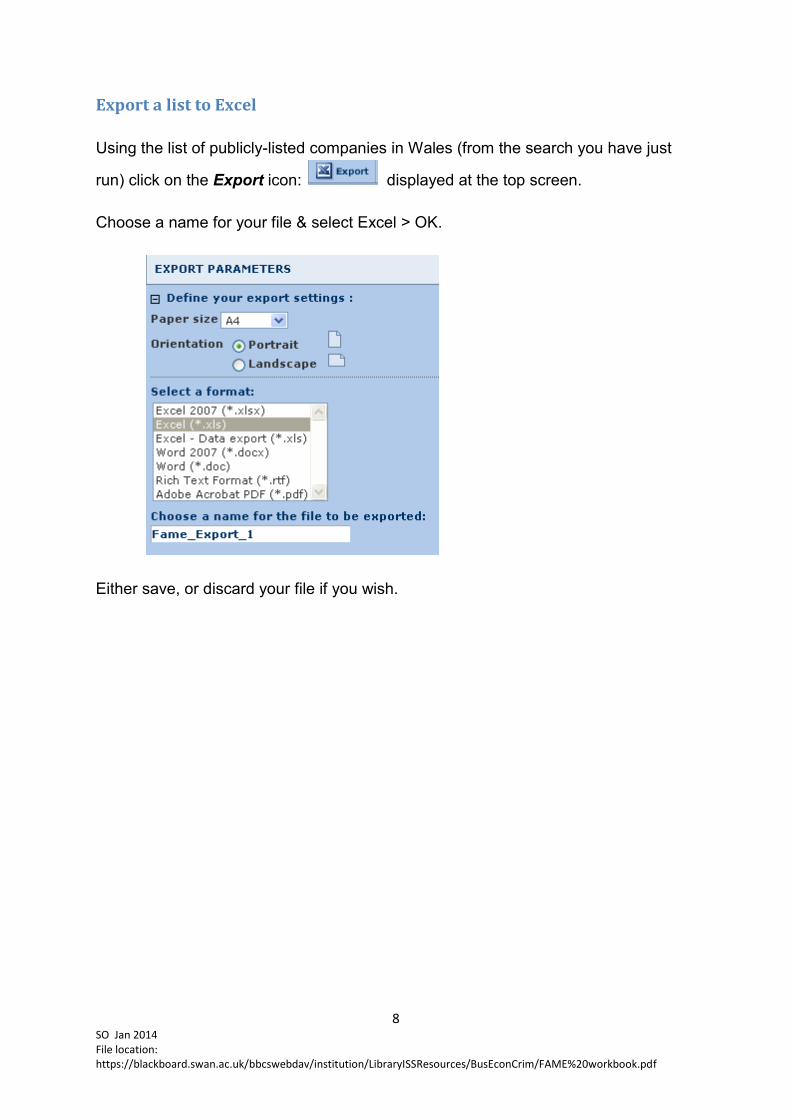
Export a list to Excel
Using the list of publicly-listed companies in Wales (from the search you have just
run) click on the Export icon: displayed at the top screen.
Choose a name for your file & select Excel > OK.
Either save, or discard your file if you wish.

9 SO Jan 2014 File location: https://blackboard.swan.ac.uk/bbcswebdav/institution/LibraryISSResources/BusEconCrim/FAME%20workbook.pdf
Searching on dormant companies
Tip:
By default FAME will always retrieve active companies only
Step 1 in the search strategy above represents all the active companies in the
database. The dissolved/dormant companies have been automatically
removed.
Research topic:
List dissolved or “in liquidation” construction companies in Wales.
Clear the previous search: ( then )
Start your new search
Criterion 1: Location
Select Location, Country > then select Wales
10 SO Jan 2014 File location: https://blackboard.swan.ac.uk/bbcswebdav/institution/LibraryISSResources/BusEconCrim/FAME%20workbook.pdf
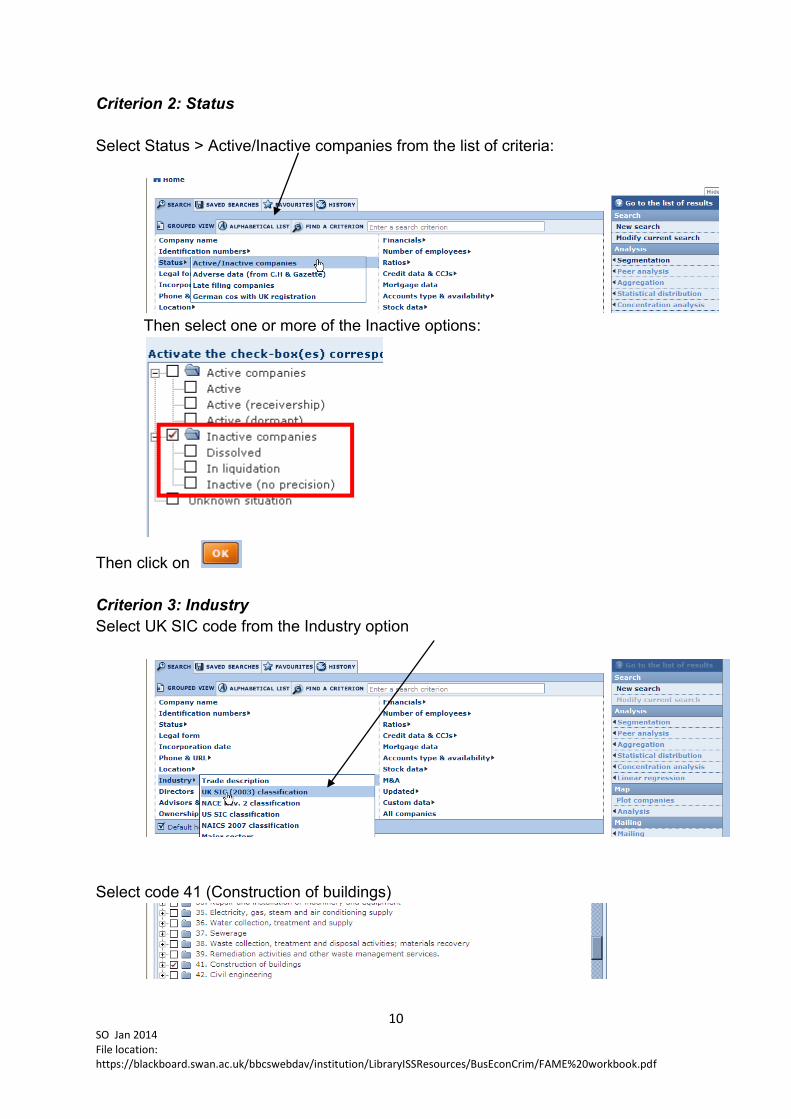
Criterion 2: Status
Select Status > Active/Inactive companies from the list of criteria:
Then select one or more of the Inactive options:
Then click on
Criterion 3: Industry
Select UK SIC code from the Industry option
Select code 41 (Construction of buildings)

11 SO Jan 2014 File location: https://blackboard.swan.ac.uk/bbcswebdav/institution/LibraryISSResources/BusEconCrim/FAME%20workbook.pdf
The Search Summary screen will show 0 companies because the default “active
companies” step has been included in the overall search as Step 1.
To remove Step 1, click on the cross.
You should now see about 45 as the total.
Click on
12 SO Jan 2014 File location: https://blackboard.swan.ac.uk/bbcswebdav/institution/LibraryISSResources/BusEconCrim/FAME%20workbook.pdf
Further analysis of data
There are a number of methods for undertaking further analysis of results:
Segmentation analysis can be performed on any number of companies, breaking-
down the group of companies according to up to two variables. The two variables are
defined by a primary and secondary variable such as industry, location, a financial
variable etc.
The results of the analysis can be viewed in a segmentation table as well as illustrated with a bar chart or a pie chart.
Aggregation analysis allows you to sum up, year by year, the lines of the accounts of each company selected from the list of results. The results of the analysis presents you with one final virtual company's yearly account statement.
Statistical distribution analysis allows you to analyse how a specific variable is distributed in a group of companies (max: 5,000) selected from the list of results. The results of the analysis are presented in a table displaying summary statistics such as the median, the average, the standard deviation, etc. The results may also be illustrated with a distribution chart.
Concentration analysis enables you to determine the share (or weight) of any additive financial variable for each company included in a group of companies selected from the list of results. The results of the analysis may be viewed in a tabular form as well as illustrated with a Pie chart or Lorenz curve.
Linear regression is a statistical technique that is used to determine the relationship between two random variables by plotting, in a two dimensional graph, all the observations and constructing a vertical line that best fits the data.
Further help
There is excellent in-depth guidance within the FAME database. Click on Help > FAME Help to access it.
Four video tutorials from the supplier (BvD) – each one is about 5-6 minutes in length: https://webhelp.bvdep.com/Robo/BIN/Robo.dll?project=fameneo_EN&context=1%3econtext&newsess=1
Email the subject librarians for the School of Management for help [email protected]


