Financial and
Economic
Performance
2015

On May 25, 2015, as disclosed in the Relevant Fact, the Company filed, together with the other companies in
the Lupatech Group, the request for judicial recovery. The request has been approved by the Courts on June
23, 2015 and all information relating to the process are available on the website of Brazilian Securities
Exchange Commission and of Investor Relations of Lupatech S/A - In Judicial Recovery.
On August 24, 2015, the Company presented the judicial recovery plan with the description of the recovery
means to be employed, as well the report with appraisals of property and assets of the Company. The
Company also presented the list of creditors to be paid under the terms and conditions set forth in the plan.
The notice containing the list of creditors was published on October 16, 2015. On October 26, 2015, the
Company published notice calling on creditors to gathered General Meeting of Creditors or (GMC) to vote
the Judicial Recovery Plan, with completion in first call on November 11, 2015, and in second call on
November 18, 2015.
On November 11, 2015, the court-appointed administrator verified that the present creditors did not reach the
minimum quorum required by the Law 11.101/2005 for the installation of General Meeting of Creditors in
first call and, thus, communicated to creditors its no installation, summoning them to appear on November
18, 2015, to carry out the General Meeting of Creditors in second call, opportunity that the meeting will be
installed with any numbers of present creditors.
On November 18, 2015, the General Meeting of Creditors approved the Judicial Recovery Plan, which was
ratified on December 11, 2015 by the judgment of the First Court of Bankruptcies, Judicial Recoveries and
Conflicts Related to the Arbitration of São Paulo, without any restrictions.
Judicial Recovery

Net Revenue
The Consolidated Net Revenue in the 2015 reached R$ 268.3 million versus R$ 384.3 million in the 2014, a
reduction of 30.2%.
The Products Segment presented strong decrease of 71.9% in Consolidated Net Revenue of 2015 compared
to 2014, from R$ 106.4 million in 2014 to R$ 29.9 million in 2015. This reduction was primarily
consequence of cash restrictions that drastically limited the Oil&Gas Valves and Anchoring Ropes
operations during 2015, leading to cancellation of orders by customers. Additionally, as a result of financial
crisis, the Company had suspended the CRCC (Certificate of Registration and Cadastral Classification) by
Petrobras in the third quarter of 2015, preventing the Company to capture new revenue related to Petrobras.
In the fourth quarter of 2015, the CRCC was reactivated, however, due to the crisis of Oil Gas segment, there
was a relevant reduction in the segment demand, so that the resumption of the backlog has been slow.
The Services Segment also presented a reduction in Consolidated Net Revenue, from R$ 277.9 million in
2014 to R$ 238.4 million in 2015, a decrease of 14.2%. The Tubular Services & Coating division presented a
growth of 9.9% in Net Revenue of this period due to priorization of resources to contract conclusion. The
operations of Oilfield Services Brazil division presented a reduction in Net Revenue of 19.3%, especially due
cash restrictions for acquisition of materials and supplies for maintenance, which limited the Company’s
capacity to provide equipment and comply with demand of existing contracts, enhanced by reduction of
Petrobras’ services demand. The operations in Colombia were affected by decrease of oil price in 2015, with
the consequent retraction of exploration on that market, presenting a reduction of 11.5%.
The Consolidated Net Revenue in the 4Q15 presented a reduction of 21.5% compared to the 3Q15, reaching
R$ 52.4 million versus R$ 66.7 million. The decrease of 27.0% in Net Revenue of Services Segment was
largely responsible for the reduction in Consolidated Net Revenue in the 4T15, due to cash restrictions that
limited the availability of equipment and services, as well as to reduction of Petrobras’ demand with the
finalizing of contracts and to the performance of unit in Colombia by retraction in market demand. The Net
Revenue of Products Segment was from R$ 1.6 million in the 3Q15 to R$ 4.9 million in the 4Q15. In the
Net Revenue (R$ thd) 1Q15 2Q15 3Q15 4Q15 Chg. % 2014 2015 Chg. %
Products 13,700 9,684 1,646 4,889 197.0% 106,359 29,919 -71.9%
Oil&Gas Valves 3,072 3,184 1,248 973 -22.0% 41,161 8,477 -79.4%
Industrial Valves 3,261 2,797 4,937 3,916 -20.7% 18,318 14,911 -18.6%
Anchoring Ropes 6,724 3,221 4,539- - n/a 39,055 5,406 -86.2%
Others Products 643 482 - - n/a 7,825 1,125 -85.6%
Services 69,513 56,250 65,093 47,519 -27.0% 277,928 238,375 -14.2%
Oilfield Services Brazil 39,804 32,356 33,072 21,991 -33.5% 157,652 127,223 -19.3%
Oilfield Services Colombia 21,666 19,979 24,788 20,653 -16.7% 98,384 87,086 -11.5%
Tubular Services & Coating 8,043 3,915 7,233 4,875 -32.6% 21,892 24,066 9.9%
Total 83,213 65,934 66,739 52,408 -21.5% 384,287 268,294 -30.2%
Financial and Economic Performance

3Q15 there was a reversal of canceled income of R$ 4.5 million that affects the comparative period. The
Oil&Gas Valves and Industrial Valves Segments presented a decrease of 22.0% and 20.7%, respectively, as
result of working capital constraint for replenishment of supplies, materials and finished products, as well as
the impact of the restrictions resulting from the CRCC suspension by Petrobras and the reduction of the
segment demand.
Net Operating Revenue (R$ thd)
Revenue Distribution – 2015
Products Services

The suspension of Petrobras CRCC (Certificate of Registration and Cadastral Classification), reinstated in
the 4Q15, and the difficulty in obtaining greater availability of resources for execution of hired investments
and for acquisition of materials and supplies, added to reduction of Oil&Gas segment demand, significantly
limited the potential for utilization of the plant’s capacity and services provision, which generated longer
delivery Backlog, with negative impacts on the generation of the Group Net Revenue.
As a result, our Backlog of firm orders on December 31, 2015, amounted R$ 0.5 billion. The conversion of
this Backlog is concentrated in the next eighteen months and may be limited in the amount of R$ 0.3 billion.
This amount represents the balance provided in signed contracts, even without warranty of consumption,
discounting the amounts already billed.
Costs on Goods Sold – COGS
The Consolidated Costs on Goods Sold (COGS) presented a reduction of 19.9% in 2015 compared to 2014,
reaching R$ 278.5 million in 2015 versus R$ 347.6 million in 2014, lower than the reduction of Consolidated
Net Revenue that was of 30.2%.
In Products Segment, the decrease of COGS was of 69.1% in 2015 compared to 2014, in line with the
reduction of Net Revenue of this Segment in the same period.
COGS (R$ thd) 1Q15 2Q15 3Q15 4Q15 Chg. % 2014 2015 Chg. %
Products 11,533 6,876 4,778 7,179 50.3% 98,287 30,366 -69.1%
Services 64,753 54,878 73,862 54,670 -26.0% 249,361 248,163 -0.5%
Total 76,286 61,754 78,640 61,849 -21.4% 347,648 278,529 -19.9%
By Region By Industrial Sector

In the Services Segment, the reduction of COGS was of 0.5% in 2015 compared to 2014, versus a reduction
of 14.2% in Net Revenue of this Segment in the same period, primarily due to the increase of non-recurring
storage costs of R$ 16.1 million that burdened the Oilfield Services Brazil division in 2015.
The Consolidated COGS presented a decrease of 21.4% comparing the 4Q15 with the 3Q15, from R$ 78.6
million in the 3Q15 to R$ 61.8 million in the 4Q15.
In the Products Segment, the COGS increased 50.3% in the 4Q15 compared to the 3Q15, due to the impact
of cancellation of orders in execution process that affected the Anchoring Ropes division in the 3Q15 and
due to the registration of inventory adjustment of R$ 0.4 million in the 4Q15.
In the Services Segment, the COGS presented a reduction of 26.0% in the 4Q15 compared to the 3Q15,
primarily due to the decrease of non-recurring storage costs in the Oilfield Services Brazil division in the
amount of R$ 16.1 million that occurred in the 3Q15.
COGS (R$ thd)
249,361 248,163
98,287
30,366
2014 2015
Services Products
28%
11%
89%
347,648
72%
278,529
-19.9%
-69.1%
-0.5%

Gross Profit and Gross Margin
Due to reduction of Consolidated Net Revenue of R$ 116.0 million (30.2%), dismissal costs that totaled R$
11.2 million and storage costs in the amount of R$ 16.1 million, the Total Gross Profit was negative in R$
10.2 million in 2015 compared to the positive amount of R$ 36.6 million in 2014. The Total Gross Margin
presented a decrease of 13.3 percentage points in 2015 when compared to the 2014.
In the 4Q15, the Total Gross Profit was negative of R$ 9.4 million and the Total Gross Margin was negative
of 18.0% comparing with the negative Gross Profit of R$ 11.9 million and negative Gross Margin of 17.8%
in the 3Q15.
In the Products Segment, the Gross Profit was negative of R$ 2.3 million in the 4Q15 and the Gross Margin
negative of 46.8%, as primarily result of decrease in revenue as mentioned above, as well as due to inventory
adjustment of R$ 0.4 million.
In the Services Segment, the Gross Profit was negative of R$ 7.2 million in the 4Q15 and the Gross Margin
was negative of 15.0%, as primarily result of decrease in revenue as mentioned above, as well as due to
dismissal costs of R$ 7.5 million and storage costs of R$ 16.1 million.
Gross Profit (R$ thd) and Gross Margin (%)
Gross Profit (R$ thd) 1Q15 2Q15 3Q15 4Q15 Chg. % 2014 2015 Chg. %
Products 2,167 2,808 -3,132 -2,290 -26.9% 8,072 -447 n/a
Gross Margin - Products 15.8% 29.0% -190.3% -46.8% 143.5% 7.6% -1.5% -9,1 p.p.
Services 4,760 1,372 -8,769 -7,151 -18.5% 28,567 -9,788 n/a
Gross Margin - Services 6.8% 2.4% -13.5% -15.0% -1.5% 10.3% -4.1% -14,4 p.p.
Total 6,927 4,180 -11,901 -9,441 -20.7% 36,639 -10,235 n/a
Gross Margin - Total 8.3% 6.3% -17.8% -18.0% -0.2% 9.5% -3.8% -13,3 p.p.

Expenses
The Consolidated Sales and Administrative Expenses and the Management Salary presented a decrease of
28.2% in the comparative period of 2015 with 2014 and reduction of 50.1% comparing the 4Q15 with the
3Q15, from R$ 87.5 million in 2014 to R$ 62.9 million in 2015 and from R$ 17.8 million in the 3Q15 to R$
8.9 million in the 4Q15.
The Sales Expenses reduced 64.0% in 2015 compared to 2014, from R$ 24.5 million in 2014 to R$ 8.8
million in 2015. In the Products Segment, the Sales Expenses decreased 45.6% in 2015 compared to 2014,
primarily due to reduction of expenses with commissions, freights, fines with customers and allowance for
doubtful accounts in the total amount of about R$ 5.3 million, consequence related to the reduction in Net
Revenue also. In the Services Segment, the Sales Expenses decreased 91.3% compared to 2014, especially
due to reduction in expenses with fines with customers, salaries and allowance for doubtful accounts, in the
total amount of about R$ 8.0 million.
The Sales Expenses went from R$ 2.8 million of expense in the 3Q15 to R$ 1.6 million of revenue in the
4Q15, primarily due to reversal of fines with customers in the amount of R$ 4.7 million.
The Administrative Expenses reduced 16.2% in 2015 compared to 2014 (from R$ 56.9 million in 2014 to R$
47.7 million in 2015), and 32.0% in the 4Q15 compared to the 3Q15 (from R$ 13.9 million in the 3Q15 to
R$ 9.4 million in the 4Q15). The decrease in salary expenses and consulting and advisory services in the
Services Segment, in the amount of R$ 3.5 million approximately, was the main reason to reduction of
Administrative Expenses in the comparative period of 4Q15 with the 3Q15. In 2015, the reduction of
Administrative Expenses both in Products Segments and Services Segment especially occurred due to
decrease in salary expenses comparing with the year of 2014 in the amount of R$ 12.5 million
approximately.
The Management Salary remained stable both in the quarter, R$ 1.1 million in the 3Q15 and in the 4Q15,
and in the comparative period of 2015 (R$ 6.3 million) with 2014 (R$ 6.1 million).
Expenses (R$ thd) 1Q15 2Q15 3Q15 4Q15 Chg. % 2014 2015 Chg. %
Total Sales Expenses 4,458 3,161 2,839 -1,647 n/a 24,482 8,811 -64.0%
Total Administrative Expenses 12,746 11,668 13,861 9,419 -32.0% 56,934 47,694 -16.2%
Products 6,711 5,099 4,511 4,075 -9.7% 32,159 20,396 -36.6%
Total Sales Expenses - Products 2,864 1,491 2,031 1,566 -22.9% 14,619 7,952 -45.6%
Total Administrative Expenses - Products 3,847 3,608 2,480 2,509 1.2% 17,540 12,444 -29.1%
Services 10,493 9,730 12,189 3,697 -69.7% 49,257 36,109 -26.7%
Total Sales Expenses - Services 1,594 1,670 808 -3,213 n/a 9,863 859 -91.3%
Total Administrative Expenses - Services 8,899 8,060 11,381 6,910 -39.3% 39,394 35,250 -10.5%
Total Sales and Administratives 17,204 14,829 16,700 7,772 -53.5% 81,416 56,505 -30.6%
Management Compensation 1,293 2,848 1,096 1,110 1.3% 6,081 6,347 4.4%
Total Sales, Administratives and Management
Compensation18,497 17,677 17,796 8,882 -50.1% 87,497 62,852 -28.2%

Operating Expenses (R$ thd)
Other Operating (Revenues) and Expenses
The Other Operating Expenses increased from R$ 156.8 million in 2014 to R$ 228.7 million in 2015, a
growth of 45.8%, and they are primarily related to the follow factors: (i) R$ 85.2 million of impairment
provision of fixed assets, according to the evaluation report prepared in accordance with the demand of
Judicial Recovery process; (ii) R$ 60.0 million of loss by the non-recoverability of goodwill; (iii) R$ 40.7
million of provision for loss of lawsuit (R$ 13.2 million in 2014); (iv) R$ 13.3 million of provision for losses
on inventory obsolescence and (v) R$ 26.1 million of cost of idle production (R$ 13.2 million in 2014).
Comparing the 4Q15 with the 3Q15, the Other Operating Expenses reduced from R$ 116.9 million in the
3Q15 to R$ 13.8 million in the 4Q15. While the 3Q15 was primarily affected by the registration of R$ 84.4
million of impairment provision of fixed assets, R$ 26.0 million of provision for loss of lawsuit and R$ 5.2
million of cost of idle production, the 4Q15 was especially impacted by the registration of R$ 4.6 million of
reversal of provision for loss of lawsuit against R$ 8.8 million of provision for losses on inventory
obsolescence, R$ 4.5 million of loss of non-recoverable taxes and contributions and R$ 3.8 million of cost of
idle production.
49,257
36,109
32,159
20,396
6,081
6,347
0
10,000
20,000
30,000
40,000
50,000
60,000
70,000
80,000
90,000
2014 2015Services Products Management Compensation
62,852
7%
37%
56%
87,497
-28.2%
10%
32%
57%
4.4%
-26.7%
-36.6%
Other Expenses (Income) (R$ thd) 1Q15 2Q15 3Q15 4Q15 Chg. % 2014 2015 Chg. %
Products 6,806 71,002 6,386 5,897 -7.7% 15,083 90,091 497.3%
Services 1,190 18,950 110,540 7,894 -92.9% 141,722 138,574 -2.2%
Total 7,996 89,952 116,926 13,791 -88.2% 156,805 228,665 45.8%

Other Operating Expenses (R$ thd)
Financial Result
The Total Financial Income (excluding Exchange Variance) in 2015 reached R$ 399.2 million versus R$
93.6 million in 2014, an increase of 326.5%, primarily due to the registration in 2015 of revenue for present
value adjustment of suppliers, loans, fines, debentures and Bonds in the amount of R$ 394.8 million.
The Total Financial Income (excluding Exchange Variance) in the 4Q15 increased from R$ 1.2 million in the
3Q15 to R$ 395.9 million due to the registration of present value adjustment of Company’s obligations as
mentioned above.
Financial Result (R$ thd) 1Q15 2Q15 3Q15 4Q15 Chg. % 2014 2015 Chg. %
Income from financial investments 199 207 247 307 24.3% 771 960 24.5%
Present value adjustment - - - 394,788 n/a 412 394,788 95722.3%
Embedded Derivatives - Debentures - - - - n/a 9,442 - n/a
Reversal of Premium on Non-Conversion of Debentures - - - - n/a 41,540 - n/a
Gain for Non-Conversion of Part of the Bonds - - - - n/a 36,244 - n/a
Monetary Variation 172 62 493 431 -12.6% 1,353 1,158 -14.4%
Interest on Receivables 303 564 309 310 0.3% 2,486 1,486 -40.2%
Others 104 459 153 78 -49.0% 1,339 794 -40.7%
Financial Revenue* 778 1,292 1,202 395,914 32837.9% 93,587 399,186 326.5%
Interest Expense and Fines on Loans and Financing -6,796 -9,265 -18,830 12,284 n/a -170,929 -22,607 -86.8%
Losses on Fair Value - - - - n/a -139,587 - n/a
Embedded Derivatives - Debentures - - - - n/a -8,623 - n/a
Provision for Interest on Suppliers -567 -944 -2,051 12,146 n.a -9,495 8,584 n/a
Banking Expenses, Taxes and Others -3,357 -2,132 -2,921 -2,090 -28.4% -16,377 -10,500 -35.9%
Financial Expense* -10,720 -12,341 -23,802 22,340 n/a -345,011 -24,523 -92.9%
Net Financial Result* -9,942 -11,049 -22,600 418,254 n/a -251,424 374,663 n/a
Exchange Variance Revenue 151,904 173,318 261,858 58,014 -77.8% 197,321 645,094 226.9%
Exchange Variance Expense -179,194 -177,531 -322,972 -20,381 -93.7% -178,702 -700,078 291.8%
Net Exchange Variance -27,290 -4,213 -61,114 37,633 n/a 18,619 -54,984 n/a
Net Financial Result - Total -37,232 -15,262 -83,714 455,887 n/a -232,805 319,679 n/a
* Excluding Exchange Variance

The Total Financial Expense (excluding Exchange Variance) reduced 92.9% in 2015 compared to 2014,
reaching R$ 24.5 million versus R$ 345.0 million in 2014 primarily due to recognition in 2014 of losses on
share’s fair value in the amount of R$ 139.6 million and loss with embedded derivatives of Debentures in the
amount of R$ 8.6 million not occurred in 2015, as well as due to reduction of interest expenses on loans and
financial debts, Bonds and on Debentures, as result of Company’s Debt reduction ended in the third quarter
of 2014, and the reversal of R$ 8.6 million of provision for interest on suppliers in 2015.
In the quarter, the Total Financial Expense (excluding Exchange Variance) decreased from R$ 23.8 million
of expense in the 3Q15 to R$ 22.3 million of revenue in the 4T15. This reduction was primarily consequence
of reversal in provision for interest on suppliers in the amount of R$ 12.1 million and of reversal of interest
expense on loans, financing and debentures in the amount of R$ 12.3 million to establish the Company’s
obligations under the Judicial Recovery Plan approved in November 18, 2015, at the General Meeting of
Creditors.
The Net Exchange Variance in 2015 resulted in expense of R$ 55.0 million versus a revenue of R$ 18.6
million in 2014 affected by valuation of 47.0% in U.S. dollar against Brazilian Real in 2015. In the 4Q15, the
Net Exchange Variance resulted in revenue of R$ 37.6 million versus an expense of R$ 61.1 million in the
3Q15 affected by devaluation of 1.7% in U.S. dollar against Brazilian Real in the 4Q15 versus a valuation of
28.0% in U.S. dollar in the 3Q15.
The Total Net Financial Result in 2015 resulted in revenue of R$ 319.7 million versus an expense of R$
232.8 million in 2014 primarily due to the registration of present value adjustment of suppliers, loans, fines,
debentures and Bonds in the amount of R$ 394.8 million in 2015.
The Total Net Financial Result went from an expense of R$ 83.7 million in the 3Q15 to a revenue of R$
455.9 million in the 4Q15, especially due to the registration of revenue for present value adjustment, already
mentioned, and due to positive effect of net exchange variance in the 4Q15.
Financial Result Breakdown (R$ thd)
* Excluindo Variação Cambial

Adjusted EBITDA from Continuing Operations 1
The Consolidated Adjusted EBITDA from Continuing Operations was negative in R$ 20.4 million in 2015
versus negative result of R$ 6.9 million in 2014. The EBITDA Margin was negative of 7.6% in 2015, with
negative variance of 5.8 percentage points compared to the Margin presented in 2014.
Both the Consolidated Adjusted EBITDA of Products Segment and of Services Segment presented reduction
in 2015 compared to 2014, primarily consequence of cash restrictions for acquisition of materials and
suppliers, creating high limitations to operations, leading to loss of revenue, including the cancellation of
orders. Additionally, the Company was affected by reduction in demand of products and services, as result of
crisis in the Oil&Gas segment, as well as by suspension, even temporary, of CRCC with Petrobras, as a
result of Lupatech’s financial crisis, creating limitations to capture new revenue.
The Consolidated Adjusted EBITDA from Continuing Operations in the 4Q15 comparatively to 3Q15
reduced from negative R$ 0.9 million in the 3Q15 to negative R$ 14.0 million in the 4Q15. The Consolidated
EBITDA Margin decreased 25.4 percentage points, from negative 1.3% in the 3Q15 to negative 26.7% in the
4Q15.
1 EBITDA from continuing operations is calculated as the net income (loss) before income tax and social contribution, financial income (expense), Equity Pick-up Result
and depreciation and amortization. The Adjusted EBITDA from continuing operations reflects the EBITDA from continuing operations, adjusted to exclude the expenses
with employees and management participation in the profits and results, provisions for inventory losses, net result on sold assets, provisions for lawsuits, provisions for
fines with customers and expenses related to the Company’s restructuring process. EBITDA is not a measure used in Brazilian accounting practices and does not represent
cash flow for the periods under review. It should not be considered as an alternative for net income, as an indicator of operational performance or as an alternative for
cash flow in the form of an indicator of liquidity. EBITDA does not have a standardized meaning and the Company’s definition of EBITDA may not be comparable with the
EBITDA or adjusted EBITDA of other companies. While in accordance with accounting practices used in Brazil EBITDA does not provide a measure of operational cash
flow, management uses it to measure operational performance. In addition, the Company understands that certain investors and financial analysts use EBITDA as an
indicator of the operational performance of a company and/or its cash flow. The EBITDA reconciliation as calculated by the Company can be found in Attachment II of
this report.
Adjusted EBITDA (R$ thd) 1Q15 2Q15 3Q15 4Q15 Chg. R$ Chg. % 2014 2015 Chg. R$ Chg. %
Products 7,869- 5,710- 9,563- 7,537- 2,026 -21.2% 24,532- 30,678- 6,146- 25.1%
Margin -57.4% -59.0% -581.0% -154.2% 426,8p.p. -23.1% -102.5% -79,4 p.p.
Services 3,749 4,259 8,702 6,460- 15,162- n/a 17,599 10,250 7,349- -41.8%
Margin 5.4% 7.6% 13.4% -13.6% -27,0 p.p. 6.3% 4.3% -2,0 p.p.
Total 4,119- 1,451- 861- 13,997- 13,136- 1525.7% 6,933- 20,428- 13,496- 194.7%
Margin -5.0% -2.2% -1.3% -26.7% -25,4 p.p. -1.8% -7.6% -5,8 p.p.
% Products 191% 394% 1111% 54% 354% 150%
% Services -91% -294% -1011% 46% -254% -50%
Adjusted Ebitda Reconciliation (R$ thd) 1Q15 2Q15 3Q15 4Q15 2015
Gross Profit 6,927 4,180 -11,901 -9,441 -10,235
SG&A -17,204 -14,829 -16,700 -7,772 -56,505
Management Compensation -1,293 -2,848 -1,096 -1,110 -6,347
Depreciation and Amortization 12,392 12,581 12,820 13,247 51,040
Operational Revenues/Expenses -7,996 -89,952 -116,926 -13,791 -228,665
Ebitda from Continuing Operations -7,174 -90,868 -133,803 -18,867 -250,712
Provision for Variable Compensation -21 175 218 4,243 4,615
934 80,456 112,749 5,069 199,208
Fines (Reversion of Fines) with Customers 1,352 408 -17 -3,316 -1,573
790 8,378 19,992 -1,126 28,034
Adjusted EBITDA from Continuing Operations -4,119 -1,451 -861 -13,997 -20,428
Restructuring Process and Other Extraordinary Expenses
Provision for Losses, Impairment and Net Profit/Loss on Disposal of Assets

Adjusted EBITDA (R$ thd)
The non-recurring expenses that totaled R$ 199.2 million primarily refers to impairment provision of fixed
assets in the amount of R$ 85.2 million, loss by the non-recoverability of goodwill in the amount of R$ 60.0
million, provision for loss of lawsuit in the amount of R$ 40.7 million and provision for losses on inventory
obsolescence in the amount of R$ 13.3 million.
17,599 10,250
-24,532 -30,678
-1.8%
-7.6%
-30%
-25%
-20%
-15%
-10%
-05%
00%
05%
-50000.0
-40000.0
-30000.0
-20000.0
-10000.0
-
10000.0
20000.0
30000.0
2014 2015
Services Products Margin
-6,933
-20,428
Adjusted Ebitda Reconciliation (R$ thd) Products Services Total
Gross Profit -447 -9,788 -10,235
SG&A -20,396 -36,109 -56,505
Management Compensation -639 -5,708 -6,347
Depreciation and Amortization 8,073 42,967 51,040
Operational Revenues/Expenses -90,091 -138,574 -228,665
Ebitda from Continuing Operations -103,500 -147,212 -250,712
Provision for Variable Compensation 899 3,716 4,615
67,341 131,868 199,208
Fines (Reversion of Fines) with Customers 1,037 -2,610 -1,573
3,545 24,489 28,034
Adjusted EBITDA from Continuing Operations -30,678 10,250 -20,428
2015
Provision for Losses, Impairment and Net Profit/Loss on Disposal of Assets
Restructuring Process and Other Extraordinary Expenses
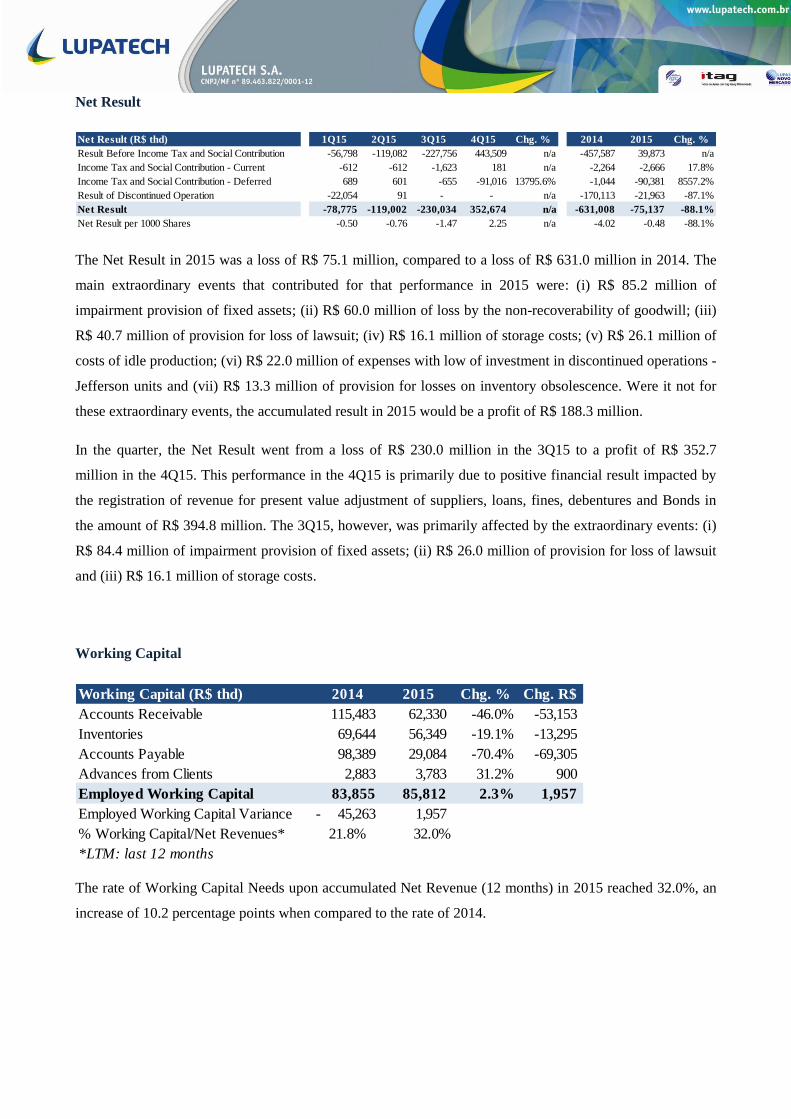
Net Result
The Net Result in 2015 was a loss of R$ 75.1 million, compared to a loss of R$ 631.0 million in 2014. The
main extraordinary events that contributed for that performance in 2015 were: (i) R$ 85.2 million of
impairment provision of fixed assets; (ii) R$ 60.0 million of loss by the non-recoverability of goodwill; (iii)
R$ 40.7 million of provision for loss of lawsuit; (iv) R$ 16.1 million of storage costs; (v) R$ 26.1 million of
costs of idle production; (vi) R$ 22.0 million of expenses with low of investment in discontinued operations -
Jefferson units and (vii) R$ 13.3 million of provision for losses on inventory obsolescence. Were it not for
these extraordinary events, the accumulated result in 2015 would be a profit of R$ 188.3 million.
In the quarter, the Net Result went from a loss of R$ 230.0 million in the 3Q15 to a profit of R$ 352.7
million in the 4Q15. This performance in the 4Q15 is primarily due to positive financial result impacted by
the registration of revenue for present value adjustment of suppliers, loans, fines, debentures and Bonds in
the amount of R$ 394.8 million. The 3Q15, however, was primarily affected by the extraordinary events: (i)
R$ 84.4 million of impairment provision of fixed assets; (ii) R$ 26.0 million of provision for loss of lawsuit
and (iii) R$ 16.1 million of storage costs.
Working Capital
The rate of Working Capital Needs upon accumulated Net Revenue (12 months) in 2015 reached 32.0%, an
increase of 10.2 percentage points when compared to the rate of 2014.
Net Result (R$ thd) 1Q15 2Q15 3Q15 4Q15 Chg. % 2014 2015 Chg. %
Result Before Income Tax and Social Contribution -56,798 -119,082 -227,756 443,509 n/a -457,587 39,873 n/a
Income Tax and Social Contribution - Current -612 -612 -1,623 181 n/a -2,264 -2,666 17.8%
Income Tax and Social Contribution - Deferred 689 601 -655 -91,016 13795.6% -1,044 -90,381 8557.2%
Result of Discontinued Operation -22,054 91 - - n/a -170,113 -21,963 -87.1%
Net Result -78,775 -119,002 -230,034 352,674 n/a -631,008 -75,137 -88.1%
Net Result per 1000 Shares -0.50 -0.76 -1.47 2.25 n/a -4.02 -0.48 -88.1%
Working Capital (R$ thd) 2014 2015 Chg. % Chg. R$
Accounts Receivable 115,483 62,330 -46.0% -53,153
Inventories 69,644 56,349 -19.1% -13,295
Accounts Payable 98,389 29,084 -70.4% -69,305
Advances from Clients 2,883 3,783 31.2% 900
Employed Working Capital 83,855 85,812 2.3% 1,957
Employed Working Capital Variance 45,263- 1,957
% Working Capital/Net Revenues* 21.8% 32.0%
*LTM: last 12 months

Working Capital (R$ thd) Net Revenue vs. Working Capital (R$ thd)
The reception of accrued revenue of approximately two years resulting from Hydraulic Key, Lifting Frame
and Flexitubo projects in the Services Segment was the main factor that resulted in the decrease of 46.0% of
the Accounts Receivable balance.
Additionally, there was a reduction of 70.4% of Accounts Payable balance in 2015 compared to 2014, as
consequence of Company’s Judicial Recovery process and of the registration of revenue for present value
adjustment with impact in the amount of R$ 156.9 million. The balance of R$ 72.0 million of Accounts
Payable has become chargeable in the long term.
Cash and Cash Equivalents
The consolidated position in Company’s Cash and Cash Equivalents in 2015 reached R$ 32.2 million
compared to the amount of R$ 4.3 million in 2014, due to the reception of revenues from Hydraulic Key,
Lifting Frame and Flexitubo projects in the Services Segment.
Cash and Cash Equivalents Balances (R$ thd)

The Company will make use of such availability of resources for the acquisition of materials and supplies
that contribute to higher operating cash flow, increasing the utilization of the units’ industrial capacity and
the ability to provide services.
Debt
Company’s Gross Debt ended the year 2015 in R$ 200.3 million, 50.1% lower than reported in 2014.
This reduction is primarily consequence of registration of revenue for present value adjustment of loans,
debentures and Bonds that decreased these obligations in about R$ 237.9 million in the 4Q15.
Combined Cash and Cash Equivalents, the Company’s Net Debt ended the year 2015 in R$ 168.2 million, a
reduction of 57.6% versus the amount in 2014.
Debt Breakdown (R$ million)
2014 2015 Chg. % Chg. R$
Short Term 56,884 31,145 -45.2% 25,739-
Financing Lines 56,884 31,145 -45.2% 25,739-
Long Term 344,425 169,203 -50.9% 175,222-
Financing Lines 144,742 169,203 16.9% 24,461
Debentures 71,715 - n/a 71,715-
Bonds 127,968 - n/a 127,968-
Total Debt 401,309 200,348 -50.1% 200,961-
Cash and Cash Equivalents 4,310 32,175 646.5% 27,865
Net Debt 396,999 168,173 -57.6% 228,826-
Debt (R$ thd)

Investment Balances
Company’s Investment Balances in 2015 totaled R$ 476.5 million, a reduction of 26.2% compared to the R$
645.6 million presented in 2014.
The Property, Plant and Equipment, presented a decrease of 21.1% in 2015 especially due to the recognition
of R$ 85.2 million of impairment provision of fixed assets, according to the evaluation report prepared in
accordance with the demand of Judicial Recovery process, as well as due to the recognition of R$ 28.4
million of Machines and Equipment deemed cost disposal in the Services Segment.
Intangible Assets reduced 32.6% in 2015 primarily due to the recognition of R$ 60.0 million of loss by the
non-recoverability of goodwill.
The Investments in Affiliates and Others decreased 95.8% due to reclassification of R$ 15.3 million of
Vicinay Marine S.L. Investment as assets held for sale, due to negotiation of sale of share’s participation
held by the Company in the society, as disclosed to the market in the Relevant Fact on January 6, 2016,
being such negotiations conditioned to approval by the judge responsible for handling the Company’s
judicial recovery.
Investment Balances (R$ thd)
Investments (R$ thd) 2014 2015 Chg. % Chg. R$
Investments in Affiliates and Others 15,960 676 -95.8% -15,284
Property, Plant and Equipment, net 449,950 354,862 -21.1% -95,088
Intangible Assets 179,652 121,004 -32.6% -58,648
Total 645,562 476,542 -26.2% -169,020
179,652 121,004
449,950
354,862
15,960
676
25000.0
125000.0
225000.0
325000.0
425000.0
525000.0
625000.0
725000.0
825000.0
2014 2015
Intangible Assets Property, Plant and Equipment, net
Investments in Affiliates and Others
476,542
645,562
-26.2%
28%
2%
70%
25%
74%
0%

Capex was R$ 6.6 million in 2015 primarily invested in the Services Segment units. Capex has been applied
in investments needed to improve production efficiency and execute Company’s Backlog, however the
amount applied is still significantly lower than that required.

Attachment I – Consolidated Income Statement (R$ thd)
2014 2015 % Change
Net Revenue From Sales 384.287 268.294 -30%
Cost of Goods and Services Sold (347.648) (278.529) -20%
Gross Profit 36.639 (10.235) n/a
Operating Income/Expenses (261.421) (269.571) 3%
Selling (24.482) (8.811) -64%
General and Administrative (56.934) (47.694) -16%
Management Compensation (6.081) (6.347) 4%
Equity Pick-up (17.119) 21.946 n/a
Other Operation Income (Expenses) (156.805) (228.665) 46%
Net Financial Result (232.805) 319.679 n/a
Financial Income 93.587 399.186 327%
Financial Expenses (345.011) (24.523) -93%
Net Exchange Variance 18.619 (54.984) n/a
Earnings (Loss) Before Income Tax and Social Contribution (457.587) 39.873 n/a
Provision Income Tax and Social Contribution - Current (2.264) (2.666) 18%
Provision Income Tax and Social Contribution - Deferred (1.044) (90.381) 8557%
Loss from Discontinued Operations (170.113) (21.963) -87%
Loss for the Period from Continued and Discontinued Operations (631.008) (75.137) -88%
Attachments

Attachment II – Reconciliation of Adjusted EBITDA from Continuing Operations (R$ thd)
2014 2015 % Change
Adjusted EBITDA from Continuing Operations (6,933) (20,428) 195%
Provision for Variable Remuneration (1,275) (4,615) 262%
Provision for Losses, Impairment and Net Result on Disposal of Assets (46,362) (199,208) 330%
Fines (Reversion of Fines) with Costumers (99,084) 1,573 n/aReestructuring Process and Other Extraordinary Expenses (3,948) (28,034) 610%
EBITDA from Continuing Operations (157,602) (250,712) 59%
Depreciation and Amortization (50,061) (51,040) 2%
Equity Pick-up Result (17,119) 21,946 n/a
Net Financial Result (232,805) 319,679 n/a
Income Tax and Social Contribution - Current and Deferred (3,308) (93,047) 2713%
Result from Discontinued Operations (170,113) (21,963) -87%
Net Loss from Continuing and Discontinued Operations (631,008) (75,137) -88%

Attachment III – Consolidated Balance Sheet (R$ thd)
2014 2015 % Change
Total Asset 1.022.629 814.031 -20%
Current Assets 277.799 235.735 -15%
Cash and Cash Equivalents 1.539 31.012 1915%
Securities-restricted 2.771 1.163 -58%
Accounts Receivable 115.483 62.330 -46%
Inventories 69.644 56.349 -19%
Recoverable Taxes 24.686 30.976 25%
Other Accounts Receivable 5.145 7.715 50%
Antecipated Expenses 10.970 4.672 -57%Advances to Suppliers 25.139 26.234 4%Assets Classified as Held for Sale 22.422 15.284 -32%
Non-Current Assets 744.830 578.296 -22%
Securities-restricted 4.500 5.640 25%
Judicial Deposits 25.295 22.275 -12%
Recoverable Taxes 47.452 40.455 -15%
Deferred Income Tax and Social Contribution 489 - n/a
Other Accounts Receivable 21.532 33.384 55%
Investments 15.960 676 -96%
Property, Plant and Equipment 449.950 354.862 -21%
Intangible Assets 179.652 121.004 -33%
Total Liabilities and Shareholders´Equity 1.022.629 814.031 -20%
Current Liabilities 305.378 211.624 -31%
Suppliers - Not Subject to Judicial Recovery 98.389 29.084 -70%Loans and Financing 56.884 31.145 -45%Provisions Payroll and Payroll Payable 29.479 23.005 -22%Commissions Payable 3.182 1.131 -64%Taxes Payable 57.652 61.448 7%Obligations and Provisions for Labor Risks - Subject to Judicial Recovery - 39.979 n/aAdvances from Customers 2.883 3.783 31%Employee's Profit Sharing 655 767 17%Other Accounts Payable 20.101 19.259 -4%Provision Contratual Fines 30.068 2.023 -93%Liabilities Directly Associated with Assets Held for Sale 6.085 - n/aNon-Current Liabilities 621.893 509.094 -18%
Suppliers - Subject to Judicial Recovery - 72.018 n/aLoans and Financing - Subject to Judicial Recovery - 161.026 n/a
Loans and Financing - Not Subject to Judicial Recovery 144.742 8.177 -94%Debentures 71.715 - n/aBonds 127.968 - n/aTaxes Payable 6.443 9.000 40%Deferred Income Tax and Social Contribution 33.780 120.947 258%Provision for Contigencies 107.948 125.301 16%Other Accounts Payable 6.453 8.965 39%Provision Contratual Fines 103.052 - n/aProvision for Unfunded Liabilities in Subsidiaries 19.792 3.660 -82%Shareholders' Equity 95.358 93.313 -2%
Capital Stock 1.853.684 1.853.684 0%Capital Transaction Reserve 136.183 136.183 0%Stock Options 13.549 13.549 0%Equity Valuation Adjustment (8.119) 64.973 n/aAccumulated Losses (1.899.939) (1.975.076) 4%
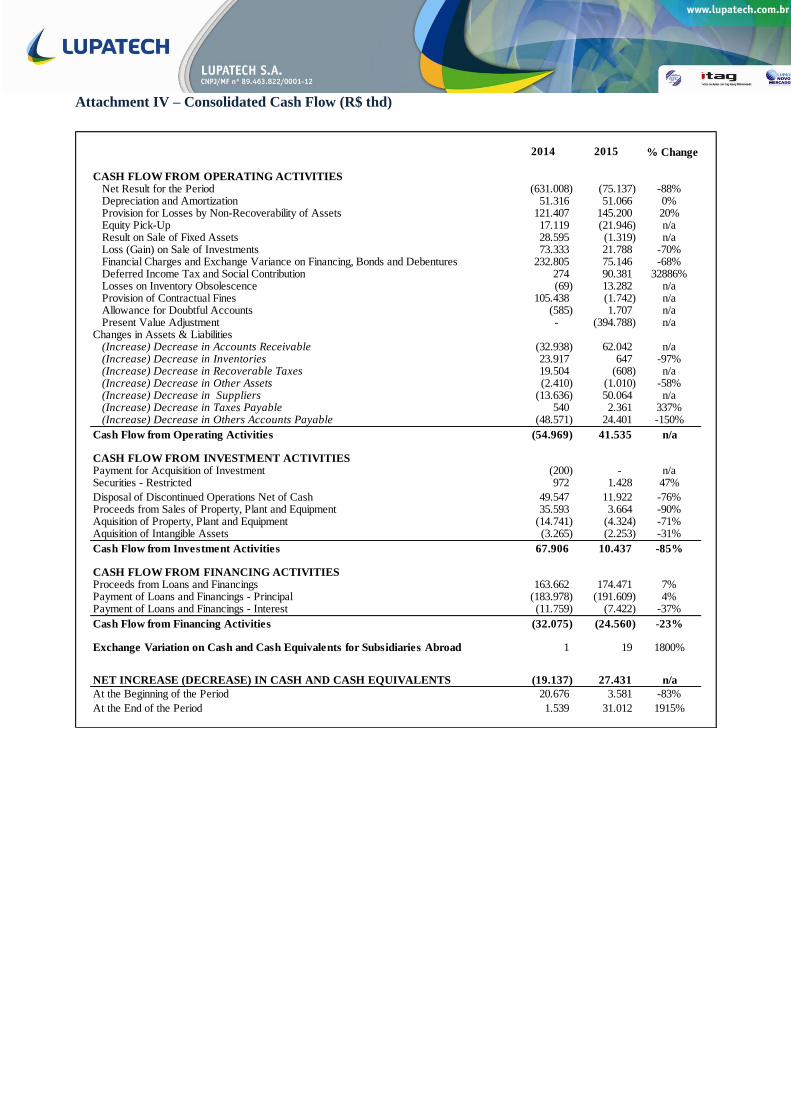
Attachment IV – Consolidated Cash Flow (R$ thd)
2014 2015 % Change
CASH FLOW FROM OPERATING ACTIVITIES Net Result for the Period (631.008) (75.137) -88% Depreciation and Amortization 51.316 51.066 0% Provision for Losses by Non-Recoverability of Assets 121.407 145.200 20% Equity Pick-Up 17.119 (21.946) n/a Result on Sale of Fixed Assets 28.595 (1.319) n/a Loss (Gain) on Sale of Investments 73.333 21.788 -70% Financial Charges and Exchange Variance on Financing, Bonds and Debentures 232.805 75.146 -68% Deferred Income Tax and Social Contribution 274 90.381 32886% Losses on Inventory Obsolescence (69) 13.282 n/a Provision of Contractual Fines 105.438 (1.742) n/a Allowance for Doubtful Accounts (585) 1.707 n/a Present Value Adjustment - (394.788) n/aChanges in Assets & Liabilities (Increase) Decrease in Accounts Receivable (32.938) 62.042 n/a (Increase) Decrease in Inventories 23.917 647 -97% (Increase) Decrease in Recoverable Taxes 19.504 (608) n/a (Increase) Decrease in Other Assets (2.410) (1.010) -58% (Increase) Decrease in Suppliers (13.636) 50.064 n/a (Increase) Decrease in Taxes Payable 540 2.361 337% (Increase) Decrease in Others Accounts Payable (48.571) 24.401 -150%
Cash Flow from Operating Activities (54.969) 41.535 n/a
CASH FLOW FROM INVESTMENT ACTIVITIESPayment for Acquisition of Investment (200) - n/aSecurities - Restricted 972 1.428 47%
Disposal of Discontinued Operations Net of Cash 49.547 11.922 -76%Proceeds from Sales of Property, Plant and Equipment 35.593 3.664 -90%Aquisition of Property, Plant and Equipment (14.741) (4.324) -71%Aquisition of Intangible Assets (3.265) (2.253) -31%
Cash Flow from Investment Activities 67.906 10.437 -85%
CASH FLOW FROM FINANCING ACTIVITIESProceeds from Loans and Financings 163.662 174.471 7%Payment of Loans and Financings - Principal (183.978) (191.609) 4%Payment of Loans and Financings - Interest (11.759) (7.422) -37%
Cash Flow from Financing Activities (32.075) (24.560) -23%
Exchange Variation on Cash and Cash Equivalents for Subsidiaries Abroad 1 19 1800%
NET INCREASE (DECREASE) IN CASH AND CASH EQUIVALENTS (19.137) 27.431 n/a
At the Beginning of the Period 20.676 3.581 -83%
At the End of the Period 1.539 31.012 1915%

Lupatech S/A - In Judicial Recovery is one of Brazilian suppliers of products and services with high value
added with focus in the oil and gas sector. Our businesses are organized in two Segments: Products and
Services. The Products Segment offers mainly to the oil and gas sector, anchoring ropes for production
platforms, valves and equipment for well completion, and significant participation in company of
compressors segment for natural vehicular gas. The Services Segment offers services as workover, well
intervention, coating and inspection of pipes.
This release contains forward-looking statements subject to risks and uncertainties. Such forward-looking statements are based on the management’s beliefs and
assumptions and information currently available to the Company. Forward-looking statements include information on our intentions, beliefs or current expectations, as
well as on those of the Company’s Board of Directors and Officers. The reservations as to forward-looking statements and information also include information on
possible or presumed operating results, as well as any statements preceded, followed or including words such as “believes”, “may”, “will”, “expects”, “intends”,
“plans”, “estimates” or similar expressions. Forward-looking statements are not performance guarantees; they involve risks, uncertainties and assumptions because they
refer to future events and, therefore, depend on circumstances which may or may not occur. Future results may differ materially from those expressed or suggested by
forward-looking statements. Many of the factors which will determine these results and figures are beyond Lupatech S/A – In Judicial Recovery’ control or prediction
capacity.
About Lupatech S/A – In Judicial Recovery


