
“Knots Ahead of the Rest”
Financial Results for 1H 2015
27 August 2015

Disclaimer
2
This presentation may contain statements of future expectations and other forward-looking statements based on management’s
and/or other information providers’ current views and assumptions and involve known and unknown risks and uncertainties that
could cause actual results, performance, or events to differ materially from those in such statements. Such forward-looking
statements are subject to various risks and uncertainties, which may materially and adversely impact the actual results and
performance of the Company’s businesses. Certain such forward-looking statements can be identified by the use of forward-looking
terminology such as “believes”, “may”, “will”, “should”, “would be”, “expects” or “anticipates” or similar expressions, or the negative
thereof, or other variations thereof, or comparable terminology, or by discussions of strategy, plans, or intentions. Should one or
more of these risks or uncertainties materialise, or should underlying assumptions prove incorrect, actual results may vary materially
from those described as anticipated, believed, or expected in this presentation. The Company does not intend, and does not assume
any obligation, to update any industry information or forward-looking statements set forth in this presentation to reflect subsequent
events or future circumstances.
“Knots Ahead of the Rest”
Q2 2015 Highlights

Key takeaways
Year to date EBITDA increased by 14.6% year-on-year to RM556.5 million.
Net cash flows generated from operating activities increased by 53.0% year-
on-year, to RM383.1 million in the first half of 2015.
Second quarter 2015 revenue declined by 22.2% to RM459.1 million
compared to the same quarter last year.
An impairment charge of RM 383.7 million was made during the quarter in
light of the weak outlook in the oil and gas sector.
Excluding the impairment charge, the Group would have posted an adjusted
net profit of RM 84.8 million for the second quarter of 2015.
Including the impairment charge, the Group reported a net loss of RM291.5
million for the period.
All new FPSO and FGS conversions remain on track for delivery.
The Company’s total order book as at 30 June 2015 was RM39.1 billion
(RM25.8 billion of firm contracts and RM13.3 billion of optional extensions).
4

72.0
(291.5)
Q1 2015 Q2 2015
Net Profit/(Loss)*
287.0 269.5
Q1 2015 Q2 2015
EBITDA
572.2
459.1
Q1 2015 Q2 2015
Revenue
Results Overview – Q2 2015 vs. Q1 2015
(in RM’mil)
5
EBITDA largely unchanged due to:• Initial recognition of Malta FGS project• Gain on disposal of Madura EPC subsidiary• Initial recognition of Madura FPSO projectOffset by:• Lower contributions from OSV and T&I • Settlement of arbitration
Revenue sequentially lower due to:• Decline in OSV vessel utilisation• Lower T&I activities• Lower scheduled activity on the Kraken
FPSO project and tanker operations Incremental contribution from:• Initial recognition of Malta FGS project
*Attributable to Bumi Armada shareholders
-19.8%-6.1%
-504.9%
• Net core profit (excluding impairment charge) of RM84.8 million
• Impairment charge of RM383.7 million

Normalised PAT
6
RM’mil Q2 2015 YTD 2015
Net loss (298.9) (225.9)
Impairment- Property, plant and equipment and
non-current assets held for sale- Non-core asset at a joint venture - Available-for-sale financial assets- Investment in a joint venture
353.820.5
6.72.7
353.820.5
8.82.7
Core net profit 84.8 159.9
- MFRS 136 Impairment of Assets
- Estimated recoverable amount is determined based on higher of the asset’s value in use (VIU) or fair value less costs to sell (FV)
- Key assumptions used in VIU calculation: Utilisation rates, daily charter rates and discount rate of 10%
- FV represents an estimate of the amount received in event the vessel is sold on a willing buyer and willing seller basis
- Impairment loss is recognised when recoverable amount of a vessel is lesser than its carrying value

Q2 2015 PAT Clarification
7
84.8
(353.8)
(20.5) (6.7) (2.7) (298.9)
(400)
(350)
(300)
(250)
(200)
(150)
(100)
(50)
-
50
100
150
Core net profitQ2 2015
Impairment forPPE and non-current assetsheld for sale
Impairment fornon-core asset
at a joint venture
Impairment foravailable-for-salefinancial assets
Impairment forinvestment in a
joint venture
Net loss Q22015
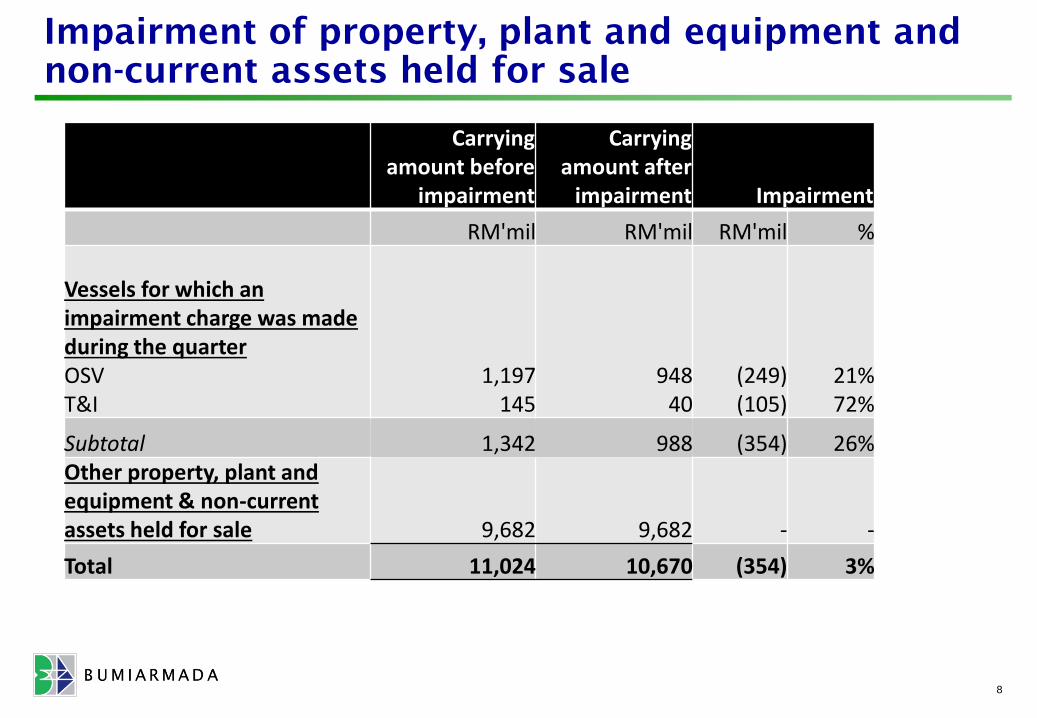
Impairment of property, plant and equipment and
non-current assets held for sale
8
Carrying amount before
impairment
Carrying amount after
impairment Impairment
RM'mil RM'mil RM'mil %
Vessels for which an impairment charge was made during the quarterOSVT&I
1,197145
94840
(249)(105)
21%72%
Subtotal 1,342 988 (354) 26%Other property, plant and equipment & non-current assets held for sale 9,682 9,682 - -
Total 11,024 10,670 (354) 3%

163.2
(219.5)
YTD 2014 YTD 2015
Net Profit*
485.8
556.5
YTD 2014 YTD 2015
EBITDA
1,059.0 1,031.2
YTD 2014 YTD 2015
Revenue
9
Higher EBITDA in line with:• Higher contributions from FPSO and tanker
operations• Initial recognition of Malta FGS project• Gain on disposal of Madura EPC subsidiary• Initial recognition of Madura FPSO projectOffset by:• Lower contributions from OSV and T&I • Severance charge for staff retrenchment
exercise• Settlement of arbitration
• Net core profit (excluding impairment charge) of RM159.9 million
• Impairment charge of RM385.8 million
Lower due to:• Lower activity from the Lukoil project and
lower utilisation from the Armada Condor and Armada Hawk
• Lower OSV vessel utilisationOffset by:• Higher revenue from the Armada Installer• Higher conversion activity from the Eni1506
FPSO project and initial revenue recognition on conversion activity from the Malta FGS project
• Higher contribution from the Armada Claire O&M and tanker operations
*Attributable to Bumi Armada shareholders
-2.6%
+14.6%
-234.5%
Results Overview – YTD 2015 vs. YTD 2014
(in RM’mil)
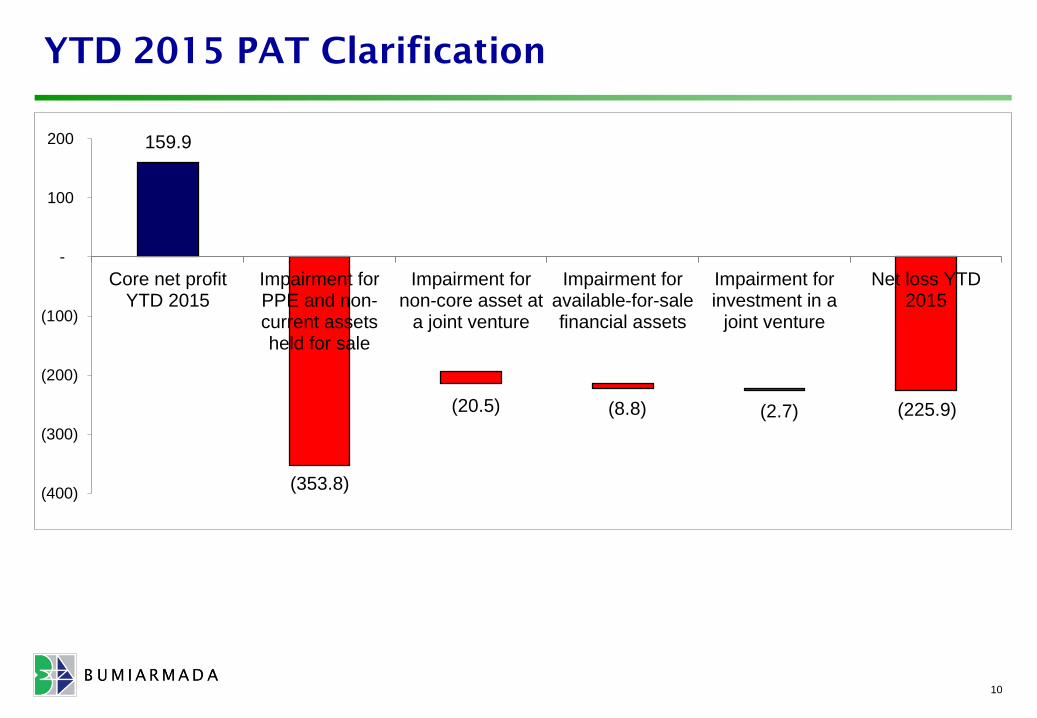
YTD 2015 PAT Clarification
10
159.9
(353.8)
(20.5) (8.8) (2.7) (225.9)
(400)
(300)
(200)
(100)
-
100
200
Core net profitYTD 2015
Impairment forPPE and non-current assetsheld for sale
Impairment fornon-core asset at
a joint venture
Impairment foravailable-for-salefinancial assets
Impairment forinvestment in a
joint venture
Net loss YTD2015

116.6
62.1
Q1 2015 Q2 2015
T&I
291.1 271.1
Q1 2015 Q2 2015
FPSO & FGS
164.5
125.9
Q1 2015 Q2 2015
OSV
11
Revenue composition by segments – Q2 2015 vs.
Q1 2015 (in RM’mil)
Lower OSV vessels utilisationLower contribution from Kraken and tanker operations offset by initial revenue recognition from
the Malta FGS project
Lower activity on LukOil project and lower utilisation from the Armada Installer, Armada Condor and Armada Hawk
Performance in established segments driven by the underlying activities
-6.9%-23.5%
-46.7%
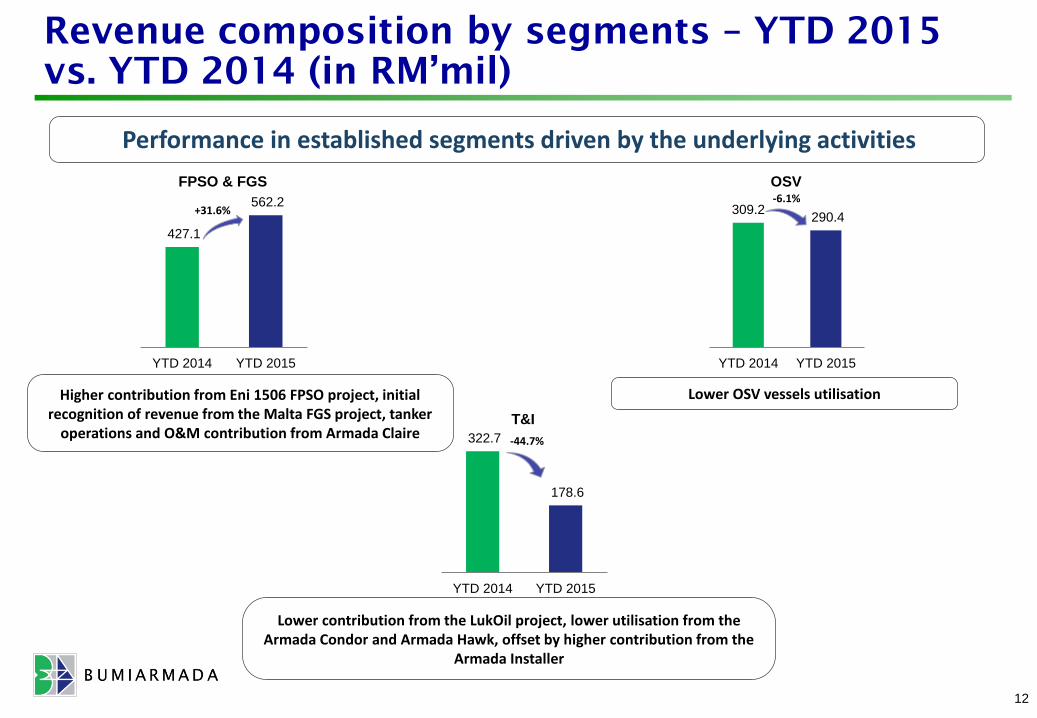
427.1
562.2
YTD 2014 YTD 2015
FPSO & FGS
322.7
178.6
YTD 2014 YTD 2015
T&I
309.2290.4
YTD 2014 YTD 2015
OSV
12
Revenue composition by segments – YTD 2015
vs. YTD 2014 (in RM’mil)
Lower OSV vessels utilisationHigher contribution from Eni 1506 FPSO project, initial recognition of revenue from the Malta FGS project, tanker
operations and O&M contribution from Armada Claire
Lower contribution from the LukOil project, lower utilisation from the Armada Condor and Armada Hawk, offset by higher contribution from the
Armada Installer
Performance in established segments driven by the underlying activities
+31.6%-6.1%
-44.7%
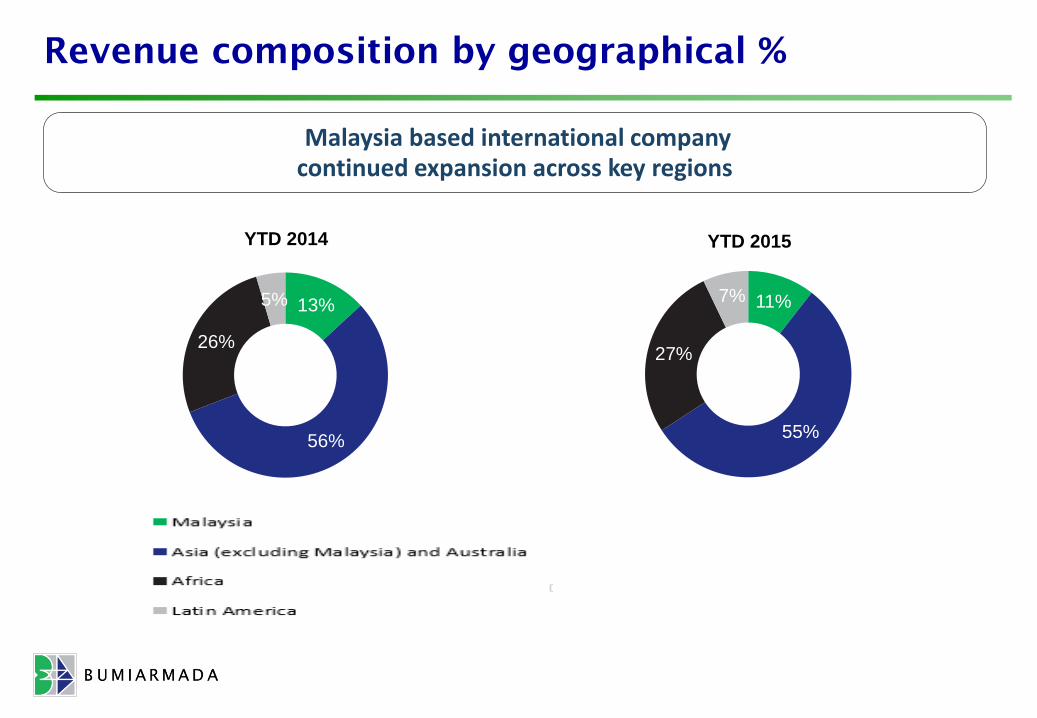
Revenue composition by geographical %
Malaysia based international company continued expansion across key regions
13%
56%
26%
5%
YTD 2014
11%
55%
27%
7%
YTD 2015

1414
Operating cash flows and gearing ratio
73.5
176.9
485.9
(56.2)
148.7
234.4
1.03x 1.06x
1.43x
0.93x0.87x
0.97x
0.00x
0.20x
0.40x
0.60x
0.80x
1.00x
1.20x
1.40x
1.60x
-100.0
0.0
100.0
200.0
300.0
400.0
500.0
600.0
Q1-2014 Q2-2014 Q3-2014 Q4-2014 Q1-2015 Q2-2015
Geari
ng
rati
o
RM
'mil
1515
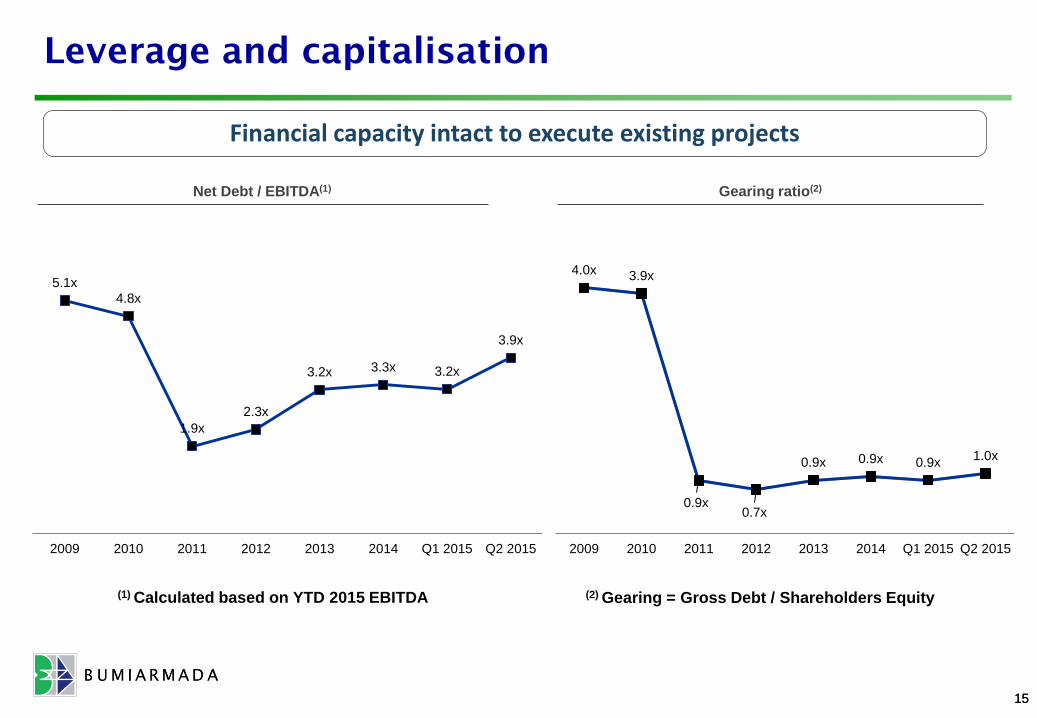
Leverage and capitalisation
Net Debt / EBITDA(1) Gearing ratio(2)
(1) Calculated based on YTD 2015 EBITDA
Financial capacity intact to execute existing projects
(2) Gearing = Gross Debt / Shareholders Equity
4.0x 3.9x
0.9x0.7x
0.9x 0.9x 0.9x1.0x
2009 2010 2011 2012 2013 2014 Q1 2015 Q2 2015
5.1x
4.8x
1.9x
2.3x
3.2x 3.3x 3.2x
3.9x
2009 2010 2011 2012 2013 2014 Q1 2015 Q2 2015

As at 30 June 2015, the Group’s order book stood at RM25.8 bn compared to RM25.6 bn as at 31March 2015. Upon expiration of the firm contract period, certain contracts contain extensionoptions which are renewable on annual basis with a total potential contract sum of RM13.3 bnover the entire option periods.
The breakdown of order book with firm contract period by business segments (fleets) is as follows:
The breakdown of order book with optional contract period by business segments (fleets) is as follows:
Firm contract period Optional extension period
Firm contract period order book: RM25.8bn Optional extension period order book: RM13.3bn
Quality firm order book increases to RM25.8 bn (Q1: RM25.6 bn)
Order book as at 30 June 2015
FPSO & FGS, RM22.7 bn,
88%
T&I, RM1.1 bn,
4%
OSV, RM2.0 bn,
8%
FPSO & FGS, RM11.9 bn,
89%
OSV, RM1.4 bn,
11%
“Knots Ahead of the Rest”
Updates & Outlook

Project Updates
Armada Kraken (North Sea, UK)
• Status: 60% completed
• Expected Completion: Q3 2016
Armada Olombendo (Angola 15/06)
• Status: 50% completed
• Expected Completion: Q4 2016
18
Armada Kraken: M40 Module
Armada Kraken: Load out of STP Buoy
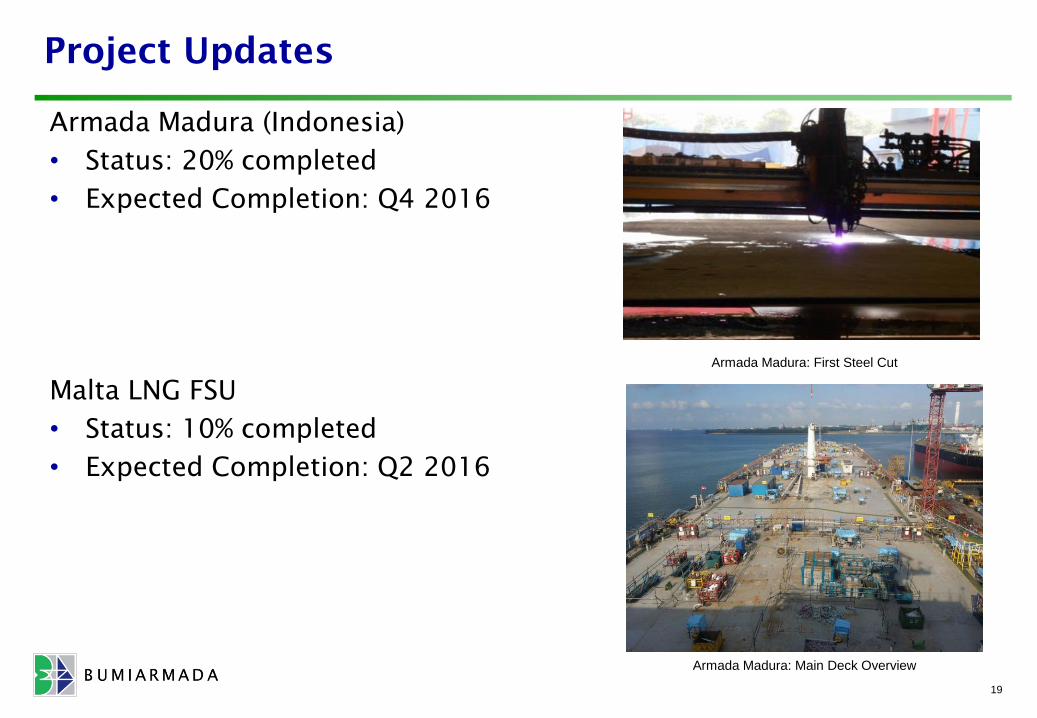
Project Updates
Armada Madura (Indonesia)
• Status: 20% completed
• Expected Completion: Q4 2016
Malta LNG FSU
• Status: 10% completed
• Expected Completion: Q2 2016
19
Armada Madura: First Steel Cut
Armada Madura: Main Deck Overview
In Summary
The O&G sector is expected to remain challenging into 2016.
The non-cash impairment was predominantly on OSV and T&I assets and
reflects their current recoverable value.
Core net profit without the impairment, would have been RM84 .8 million in
Q2 2015.
Net operating cash flows remain strong in 1H 2015 at RM383.1 million,
mainly from the FPSO business.
Strong firm order book of over RM25 billion remains in place.
All FPSO and FGS conversions remain on track for delivery.
20

“Knots Ahead of the Rest”
Thank You


