
A P R I L 2 0, 2 0 0 5
FINANCIAL RESULTS
First Quarter 2005

2
First Quarter 2005 Earnings
Most businesses show good momentum over the last year
IB revenues near record levels of 1Q04 with strength in trading and IB fees
Expense management and merger saves evident in results
Wholesale and consumer credit quality are strong
WorldCom litigation settled
Strong capital base
3
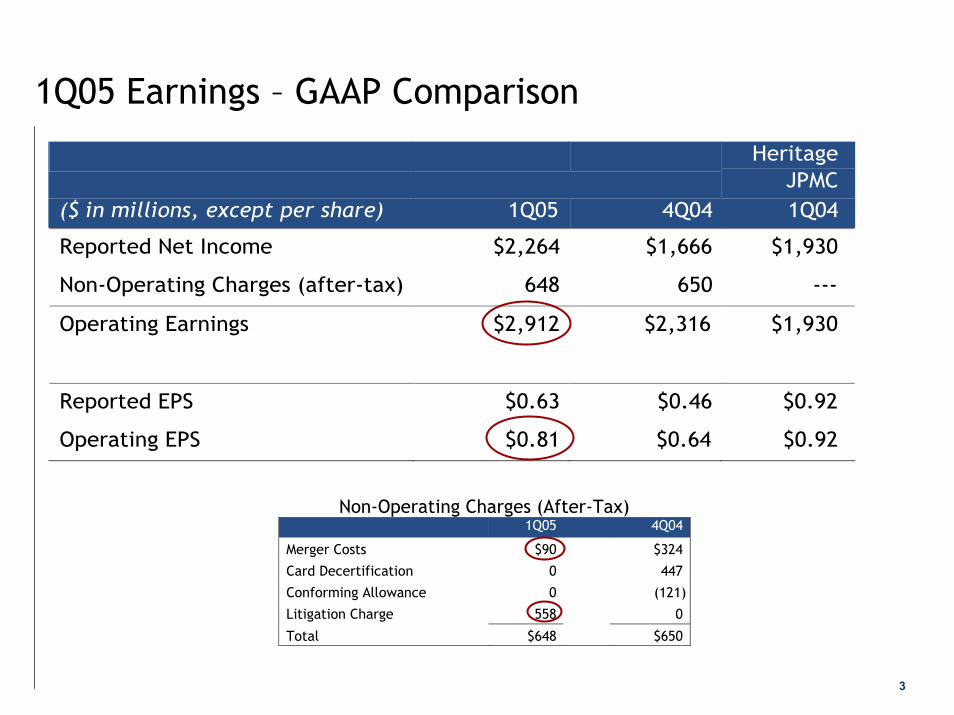
1Q05 Earnings – GAAP Comparison
Heritage JPMC
($ in millions, except per share) 1Q05 4Q04 1Q04
Reported Net Income $2,264 $1,666 $1,930
Non-Operating Charges (after-tax) 648 650 ---
Operating Earnings $2,912 $2,316 $1,930
Reported EPS $0.63 $0.46 $0.92
Operating EPS $0.81 $0.64 $0.92
Non-Operating Charges (After-Tax) 1Q05 4Q04
Merger Costs $90 $324
Card Decertification 0 447
Conforming Allowance 0 (121)
Litigation Charge 558 0
Total $648 $650

4
1Q05 LOB Operating Earnings – GAAP Comparison $ O/(U) Heritage
JPMC ($ in millions) 1Q05 4Q04 1Q04
Investment Bank $1,325 $665 $308
Retail Financial Services 988 213 782
Card Services 522 7 360
Commercial Banking 243 (11) 169
Treasury & Securities Services 245 100 147
Asset & Wealth Management 276 13 154
Corporate (687) (391) (938)
Total Firm $2,912 $596 $982
5
Proforma Discussion
The proforma combined historical lines of business information presents the business segments of the company as if these segments had existed as of the earliest date indicated. For further information regarding the proforma combined historical financial information, including reconciliation to JPMC GAAP financial information, see information furnished pursuant to Regulation FD by JPMC on Form 8-K dated October 1, 2004, as amended on October 20, 2004, January 19, 2005 and April 20, 2005.
6
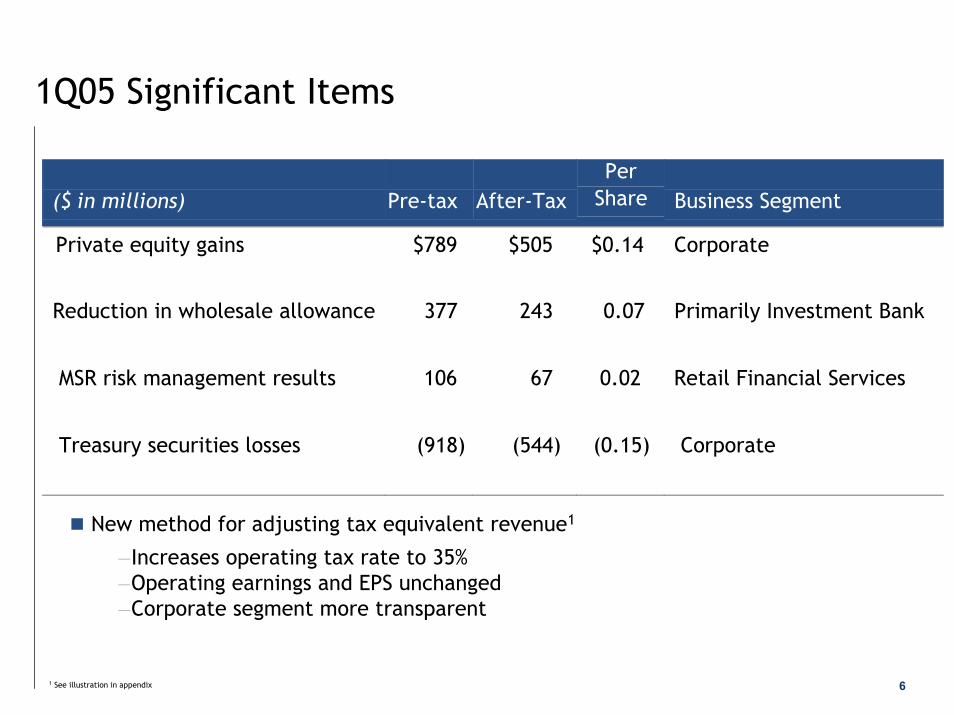
1Q05 Significant Items
($ in millions)
Pre-tax
After-Tax
Per Share
Business Segment
Private equity gains $789 $505 $0.14 Corporate
Reduction in wholesale allowance 377 243 0.07 Primarily Investment Bank
MSR risk management results 106 67 0.02 Retail Financial Services
Treasury securities losses (918) (544) (0.15) Corporate
New method for adjusting tax equivalent revenue1
—Increases operating tax rate to 35%—Operating earnings and EPS unchanged —Corporate segment more transparent
1 See illustration in appendix

7
1Q05 Proforma Operating Performance Comparison $ O/(U)
($ in millions) 1Q05 4Q04 1Q04
Revenue (FTE)1 $14,740 $591 ($516)
Credit Costs1 1,344 (299) (133)
Expenses 8,892 29 (220)
Earnings $2,912 $596 ($115)
EPS $0.81 $0.17 ($0.03)
Quarterly Results2 1Q05 4Q04 1Q04 Return on Equity 11% 9% 12%
Return on Equity-Net of GW 19% 15% 20% 1 Operating basis excludes merger costs, charges related to conforming accounting policies and litigation charges incurred in 2Q04 and 1Q05, and presents revenues and credit costs without the effect of credit card securitizations. All references to credit costs refer to provision for credit losses.
2 Actual numbers for all periods, not over/under.

8
1Q05 Operating Expenses
Revenues up 4% QoQ with expenses flat at $8,892mm
— Higher compensation expenses— Lower noncompensation expenses— $150mm incremental/$380mm total merger saves
2Q05 expenses
— Performance-based compensation— $60mm incremental/$440mm total merger saves— $70mm estimated from acquisitions1
— $200-$250mm estimated incremental spending – marketing & technology
1 Refers to Cazenove joint venture and Vastera acquisitions

9
LOB Operating Earnings – Proforma Comparison $ O/(U) % O/(U)
($ in millions) 1Q05 4Q04 1Q04 4Q04 1Q04
Investment Bank $1,325 $665 ($26) 101% (2%)
Retail Financial Services 988 213 2441 27% 33%1
Card Services 522 7 186 1% 55%
Commercial Banking 243 (11) (46) (4%) (16%)
Treasury & Securities Services 245 100 152 69% 163%
Asset & Wealth Management 276 13 47 5% 21%
Corporate (687) (391) (672) (132%) NM
Total Firm $2,912 $596 ($115) 26% (4%)
1 Change from 1Q04 includes the impact of non-core portfolio actions related to the sale of Bank One’s brokered home equity portfolio. The pre-tax impact was $86mm, the after-tax impact was $53mm. Excluding the impact of these actions the change versus 1Q04 would be $297mm or 43%

10
Investment Bank – Proforma ComparisonStrong revenue performance – up 31% QoQ, near record levels of 1Q04
IB fees up 33% YoY; sequentially down from strong 4Q
Fixed Income and Equity Markets up QoQ due to strong client activity and portfolio management trading
Credit costs benefited from improved portfolio quality and reduced loan balances
Expense increase QoQ primarily attributable to performance-based compensation
Completed formation of joint venture with Cazenove
$O/(U) ($ in millions) 1Q05 4Q04 1Q04
Revenues $4,180 $979 ($27)
Investment Bkg. 985 (95) 242 Fixed Income Mkts 2,289 759 (41) Equities Markets 556 313 (118) Credit Portfolio 350 2 (110) Credit Costs (366) (193) (63)
Expenses 2,525 135 97
Earnings $1,325 $665 ($26)
Key Statistics1 1Q05 4Q04 1Q04
ROE 27% 13% 27% Overhead 60% 75% 58% Comp./Rev. 39% 43% 35% VAR ($mm) $70 $79 $1022
¹ Actual numbers for all periods, not over/under. 2 1Q04 VAR numbers represent Heritage JPMC
1Q05 2004
Rank Share Rank Share
Global Announced M&A #4 25% #3 25%
Global Syndicated Loans #1 13% #1 19%
Global Debt, Equity and Equity Related #5 6% #3 7%
Global Long Term Debt #5 6% #2 7%
Global Equity and Equity-Related #4 10% #6 6% Source: Thompson Financial

11
Retail Financial Services – Proforma Comparison $ O/(U) ($ in millions) 1Q05 4Q04 1Q041
Revenues $3,847 $302 $167
Credit Costs 94 16 (103)
Expenses 2,162 (53) (217)
Earnings $988 $213 $297
Consumer & Small Bus. Bkg 477 47 187
Home Finance 442 203 148
Auto & Education Finance2 55 (29) (22)
Insurance 14 (8) (16)
Key Statistics3 1Q05 4Q04 1Q04
ROE 31% 24% 23%
Overhead 56% 62% 63% 1 Change from 1Q04 excludes the impact of non-core portfolio actions related to the sale of Bank One’s brokered home equity portfolio. 2 See appendix for more detail on Auto & Education Finance.3 Actual numbers for all periods, not over/under.
Earnings up 43%1 YoY and 27% QoQ driven by Consumer & Small Business Banking and Home Finance
Strong credit quality across all businesses
3 items affected Auto & Education Finance results
Transfer of auto loans to held for sale ($47)
Joint venture dissolution charge (25)
RV loan portfolio sale 21
Total after-tax impact ($51)
After-tax impact $mm

12
Consumer & Small Business – Proforma Comparison $ O/(U) ($ in millions) 1Q05 4Q04 1Q04
Revenues $2,157 $52 $150
Credit Costs 36 (3) (21)
Expenses 1,339 (23) (140)
Earnings $477 $47 $187
Key Statistics1 1Q05 4Q04 1Q04 Overhead 62% 65% 74%
Avg. Core Deposits ($B) $149.3 $147.8 $143.2
Avg. Total Loans ($B) $15.0 $14.6 $14.8
Avg. Small Bus. Loans ($B) $12.4 $12.4 $12.2
# of Branches 2,517 2,508 2,409
# of ATMs 6,687 6,650 6,496
Checking Accts (MM) 8.4 8.2 7.8
Investment Sales ($B) $2.9 $2.8 $2.7 ¹Actual numbers for all periods, not over/under.
Business drivers trending well, with good growth in deposits and new accounts as well as increases in credit card and investment sales- Good progress in legacy Chase branches- 108 net new branches YoY- 191 new ATMs YoY
Revenues up 7% YoY due to wider deposit spreads and higher deposit balances
Revenues up 2% QoQ reflecting seasonal tax refund business and merger momentum
Expenses down 9% YoY and 2% QoQ reflecting merger saves partially offset by investment in new branches
Update: Texas conversion in 3Q05

13
Home Finance – Proforma Comparison $O/(U) ($ in millions) 1Q05 4Q04 1Q04
Home Finance Earnings $442 $203 $148
Prime Production & Svcg (PP&S):
Production revenue $228 $32 $21
Servicing:
Mtg Svcg Rev, net of amort 146 (23) 1
MSR risk management results 106 293 52
Total Revenue 480 302 74
Expenses 229 (37) (74)
PP&S Earnings $158 214 95
Consumer Real Estate Lending (CREL):
Revenue $713 (12) 10
Credit Costs 30 50 (15)
Expenses 238 (45) (64)
CREL Earnings $284 (11) 53 Key Statistics1 1Q05 4Q04 1Q04
Mortgage loan originations ($B) $26.6 $32.4 $31.5
Mortgage loans serviced ($B)2 $495.8 $492.5 $462.2
Home equity originations ($B) $11.9 $12.0 $11.0
Avg. mortgage loans retained ($B) $44.3 $44.6 $37.4
Avg. home equity & other loans owned ($B) $66.5 $70.1 $59.2
1 Actual numbers for all periods, not over/under2 Includes prime first mortgage and subprime loans
Prime Production & Servicing- Strong secondary marketing results
offset drop in prime mortgage originations
- Favorable MSR risk management performance
- Expense trends reflect volume declines and productivity improvements
Consumer Real Estate Lending- Revenue decline QoQ reflects prior
period portfolio sales- Strong credit trends continue with
credit costs down after adjusting for 4Q MH sale
- Expense trends reflect merger saves and productivity improvements
14
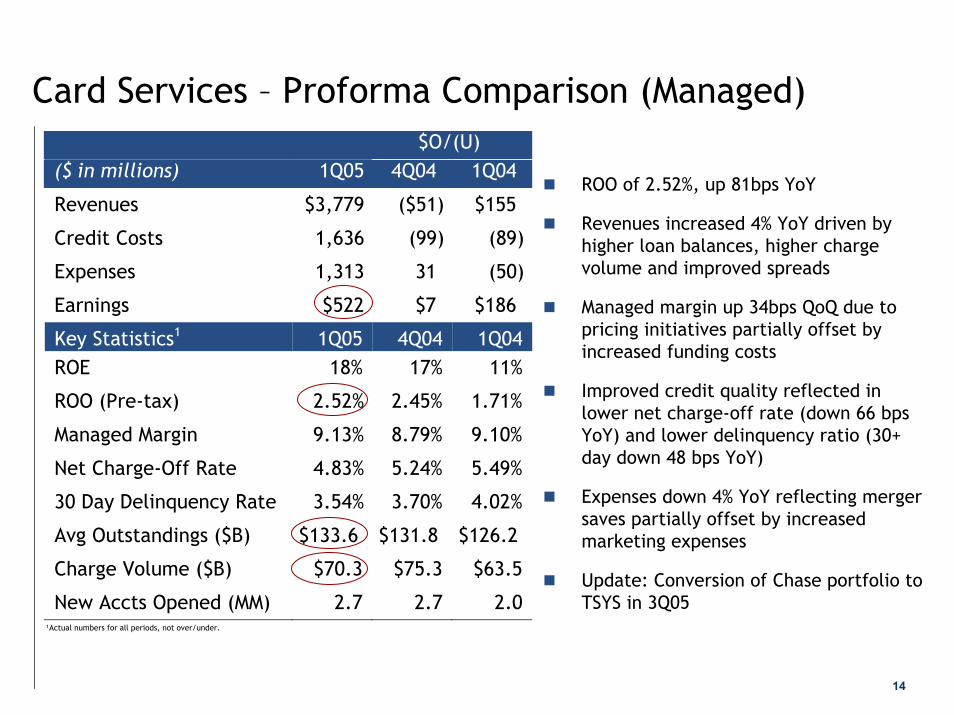
Card Services – Proforma Comparison (Managed) $O/(U) ($ in millions) 1Q05 4Q04 1Q04
Revenues $3,779 ($51) $155
Credit Costs 1,636 (99) (89)
Expenses 1,313 31 (50)
Earnings $522 $7 $186
Key Statistics1 1Q05 4Q04 1Q04 ROE 18% 17% 11%
ROO (Pre-tax) 2.52% 2.45% 1.71%
Managed Margin 9.13% 8.79% 9.10%
Net Charge-Off Rate 4.83% 5.24% 5.49%
30 Day Delinquency Rate 3.54% 3.70% 4.02%
Avg Outstandings ($B) $133.6 $131.8 $126.2
Charge Volume ($B) $70.3 $75.3 $63.5
New Accts Opened (MM) 2.7 2.7 2.0 ¹Actual numbers for all periods, not over/under.
ROO of 2.52%, up 81bps YoY
Revenues increased 4% YoY driven by higher loan balances, higher charge volume and improved spreads
Managed margin up 34bps QoQ due to pricing initiatives partially offset by increased funding costs
Improved credit quality reflected in lower net charge-off rate (down 66 bps YoY) and lower delinquency ratio (30+ day down 48 bps YoY)
Expenses down 4% YoY reflecting merger saves partially offset by increased marketing expenses
Update: Conversion of Chase portfolio to TSYS in 3Q05

15
Commercial Banking – Proforma Comparison $O/(U) ($ in millions) 1Q05 4Q04 1Q04
Revenues $850 ($35) $17
Middle Market 572 1 29 Corporate Banking 123 (19) (5) Real Estate 119 (14) - - Other 36 (3) (7) Credit Costs (6) (27) 80
Expenses 458 7 8
Earnings $243 ($11) ($46)
Key Statistics1 1Q05 4Q04 1Q04 ROE 29% 30% 34% Overhead 54% 51% 54% Net Charge-Off Rate 0.02% 0.35% 0.00% Avg Loans & Leases ($B) $50.0 $50.5 $48.9 Avg Liability Balances2 ($B) $71.6 $69.4 $66.6
¹ Actual numbers for all periods, not over/under. 2 Includes deposits and deposits swept to on-balance sheet liabilities
Revenue growth of 2% YoY was driven by 14% growth in Treasury Services revenue. QoQ decline of 4% primarily a result of lower IB revenue in Corporate Banking
Middle Market revenue increased 5% YoY primarily driven by higher Treasury Services revenue. 7% growth in loan balances was offset by spread compression
Credit costs were down QoQ as a result of lower charge-offs reflecting the continued favorable credit environment. NPL ratio of 0.87% down 73bps YoY and 17bps QoQ
Total expense increase of 2% YoY and QoQ primarily due to increased Treasury Services product costs

16
Treasury & Securities Services – Proforma Comparison $O/(U) ($ in millions) 1Q05 4Q04 1Q04
Revenues $1,482 $69 $202
Treasury Services 618 (24) 52
Investor Services 508 54 95
Institutional Trust Svcs 356 39 55
Expenses 1,065 (81) (36) Earnings $245 $100 $152
Key Statistics1 1Q05 4Q04 1Q04 ROE 52% 30% 20%
Pretax Margin 26% 16% 11%
TSS Firmwide Revenue $2,101 $2,009 $1,845
TSS Firmwide OH Ratio 63% 69% 72%
TS Firmwide Revenue $1,237 $1,238 $1,131
Avg. Liability Balances ($B)2 $154.7 $147.8 $122.7
Assets under Custody ($T) $10.23 $9.3 $8.2
Corp. Trust Securities under Admin ($T)
$6.7
$6.7
$6.6
¹Actual numbers for all periods, not over/under. 2 Includes deposits swept to on-balance sheet liabilities3 Includes an estimated $400 billion of assets under custody from ITS as of 3/31/2005
Revenues increased 16% YoY and 5% QoQ - NII up due to spread widening and
balance growth - Fees up due to growth in Custody,
Securities Lending, Trade and Trust products partially offset by decline in balance deficiency fees
Expenses decreased 7% QoQ reflecting lower corporate allocations, additional allocations to primarily Comm’l Banking and lower legal and technology-related expenses partially offset by an increase in compensation
Liability balances increased 26% YoY. Assets under custody increased 20% YoY excluding the $400 billion of assets under custody from ITS
TSS reorganized by combining IS and ITS into WSS. TSS will be managed in two segments – the cash business (TS) and the securities business (WSS)
17
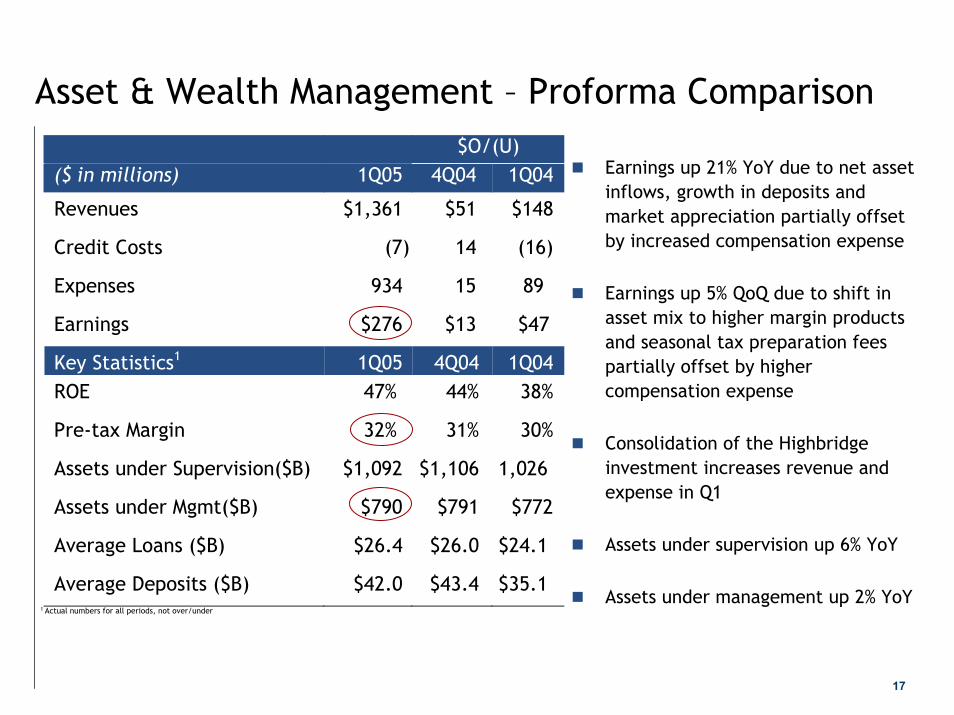
Asset & Wealth Management – Proforma Comparison $O/(U) ($ in millions) 1Q05 4Q04 1Q04
Revenues $1,361 $51 $148
Credit Costs (7) 14 (16)
Expenses 934 15 89
Earnings $276 $13 $47
Key Statistics1 1Q05 4Q04 1Q04 ROE 47% 44% 38%
Pre-tax Margin 32% 31% 30%
Assets under Supervision($B) $1,092 $1,106 1,026
Assets under Mgmt($B) $790 $791 $772
Average Loans ($B) $26.4 $26.0 $24.1
Average Deposits ($B) $42.0 $43.4 $35.1
1 Actual numbers for all periods, not over/under
Earnings up 21% YoY due to net asset inflows, growth in deposits and market appreciation partially offset by increased compensation expense
Earnings up 5% QoQ due to shift in asset mix to higher margin products and seasonal tax preparation fees partially offset by higher compensation expense
Consolidation of the Highbridge investment increases revenue and expense in Q1
Assets under supervision up 6% YoY
Assets under management up 2% YoY

18
Corporate – Proforma Comparison $O/(U) ($ in millions) 1Q05 4Q04 1Q04
Revenues (FTE)
Private Equity Gains $789 $283 $456
Treasury Securities Losses (918) (995) (1,144)
NII1 (677) (20) (365)
Other Income1 48 10 (18)
Expenses1 435 (25) (111)
Earnings ($687) ($391) ($672)
Earnings by Unit
Private Equity 437 198 340
Treasury (828) (596) (918)
Treasury Securities Gains/(Losses) (544) (592) (678)
Ongoing Treasury (284) (4) (240)
Corporate net expenses (296) 7 (94)
Total ($687) ($391) ($672)
($ in billions) 1Q05 4Q04 1Q04
Avg. Treasury Invst Portfolio2 $65.6 $63.4 $89.2
EOP Private Equity Portfolio2 $7.2 $7.5 $9.0
Corporate includes:- Private equity- Treasury- Net expenses- FTE offsets removed
Private equity gains very strong
Treasury results includes losses from repositioning of treasury portfolio and ongoing Treasury activities
Corporate net expenses down YoY and flat QoQ due to merger saves partially offset by increase in retained expense for tech & ops and staff
¹ NII, other income and expenses are included in Private Equity, Treasury and Other Corporate Earnings2 Actual not over/(under)

19
Capital
Continue to build fortress balance sheet
Capital strength with 3/31/05 Tier 1 estimate of 8.6% − Stock buyback: $1.3bn in 1Q05

20
Merger Milestones
Roll-out of branding changes
Technology- Treasury Services clearing conversions- Card conversions- Strategic Data Center mainframe
migration- Ongoing platform conversions &
consolidations
Texas market integration (Estimated timeframe: 3Q05) and Tri-state market integration- Lending platforms- Deposit systems- Check processing- Retail channels
Network
Merger investments
3/04 – Financial reporting architecture
6/04 – Branding decision
7/04 – Holding company merger
8/04 – Wholesale broker/dealer merger
8/04 - 10/04 – TSYS card conversions
10/04 – Proforma financials – 8K
10/04 – Card bank merger
6/04 – 1/05: HR policies & benefits conformed
11/04 – Merger of lead banks
1/05 – Technology insourcing
1/05 – Merger of payroll & benefit systems
2/05 – Merger of mutual funds
4/05 – Trade finance
Next – Clearing conversion
CompletedCompleted UpcomingUpcoming

21
Outlook – 2Q 2005Investment Bank
— IB fee pipeline: continues to be strong— Trading: 1Q seasonally strong— Credit Portfolio: lower NII & gains from loan workouts— Credit: returning to normal over time
Retail Financial Services— MSR hedging gains/losses: don’t plan for ($106mm Q1)— Portfolio sales: impact NII ($11bn to date)— Credit: stable outlook, not anticipating reductions in allowance
Card— Margin: stable—pricing initiatives— Credit : stable but bankruptcy & FFIEC— Marketing: increase in 2Q
Commercial Bank— Credit Costs: returning to normal over time
Corporate
— Private equity gains: 1Q front end loaded

22
Disclaimer
This presentation contains forward-looking statements within the meaning of the Private Securities Litigation Reform Act of 1995. Such statements are based upon the current beliefs and expectations of JPMorgan Chase’s management and are subject to significant risks and uncertainties. Actual results may differ from those set forth in the forward-looking statements. Factors that could cause JPMorgan Chase’s results to differ materially from those described in the forward-looking statements can be found in the 2004 Annual Report on Form 10-K for the year ended December 31, 2004 of JPMorgan Chase filed with the Securities and Exchange Commission and available at the Securities and Exchange Commission’s Internet site (http://www.sec.gov).

APPENDIX
23

24
Auto & Education Finance – Proforma Comparison $ O/(U) ($ in millions) 1Q05 4Q04 1Q04
Revenues $324 (40) (58)
Credit Costs 28 (31) (67)
Expenses 205 39 45
Earnings $55 (29) (22)
Key Statistics1 1Q05 4Q04 1Q04
Overhead 63% 46% 42%
Avg. Loans & Leases ($B) $60.9 $62.6 $65.2
Net Charge-off Rate 0.60% 0.65% 0.69%
¹Actual numbers for all periods, not over/under.
($ in millions) Pre-tax After-tax
Transfer of auto loans to HFSMarkdown ($88)Reduction in allowance 10Total ($78) ($47)
Joint venture cancellation charge ($40) ($25)
RV saleOther income $24Reduction in allowance 10Total $34 $21
Total impact ($84) ($51)
25
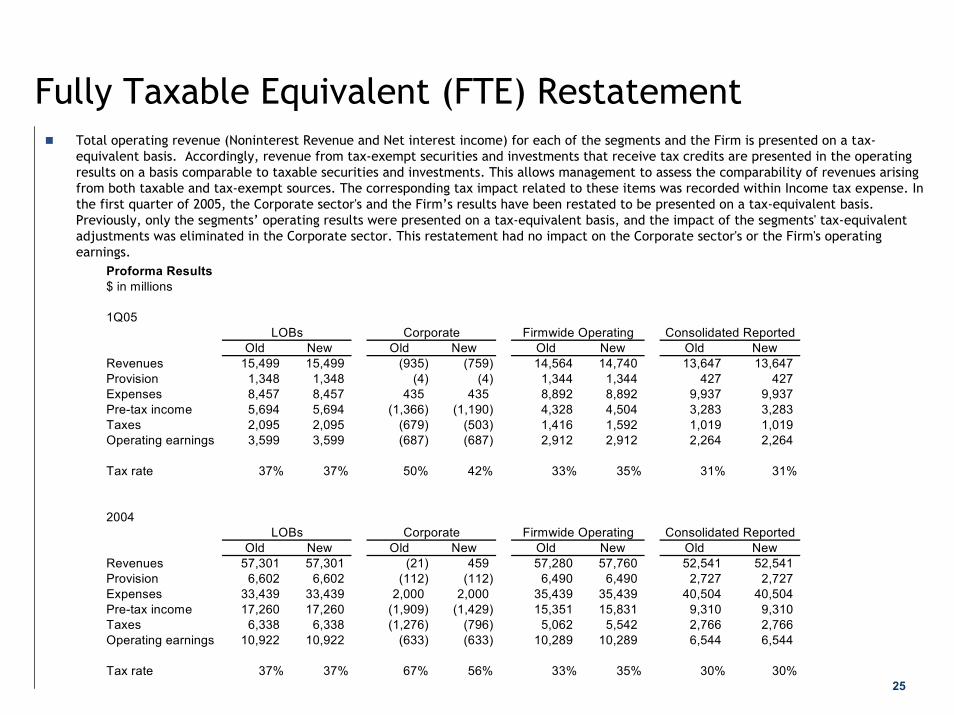
Fully Taxable Equivalent (FTE) RestatementTotal operating revenue (Noninterest Revenue and Net interest income) for each of the segments and the Firm is presented on a tax-equivalent basis. Accordingly, revenue from tax-exempt securities and investments that receive tax credits are presented in the operating results on a basis comparable to taxable securities and investments. This allows management to assess the comparability of revenues arising from both taxable and tax-exempt sources. The corresponding tax impact related to these items was recorded within Income tax expense. In the first quarter of 2005, the Corporate sector's and the Firm’s results have been restated to be presented on a tax-equivalent basis. Previously, only the segments’ operating results were presented on a tax-equivalent basis, and the impact of the segments' tax-equivalent adjustments was eliminated in the Corporate sector. This restatement had no impact on the Corporate sector's or the Firm's operating earnings.
Proforma Results$ in millions
1Q05LOBs Corporate Firmwide Operating Consolidated Reported
Old New Old New Old New Old NewRevenues 15,499 15,499 (935) (759) 14,564 14,740 13,647 13,647 Provision 1,348 1,348 (4) (4) 1,344 1,344 427 427 Expenses 8,457 8,457 435 435 8,892 8,892 9,937 9,937 Pre-tax income 5,694 5,694 (1,366) (1,190) 4,328 4,504 3,283 3,283 Taxes 2,095 2,095 (679) (503) 1,416 1,592 1,019 1,019 Operating earnings 3,599 3,599 (687) (687) 2,912 2,912 2,264 2,264
Tax rate 37% 37% 50% 42% 33% 35% 31% 31%
2004LOBs Corporate Firmwide Operating Consolidated Reported
Old New Old New Old New Old NewRevenues 57,301 57,301 (21) 459 57,280 57,760 52,541 52,541 Provision 6,602 6,602 (112) (112) 6,490 6,490 2,727 2,727 Expenses 33,439 33,439 2,000 2,000 35,439 35,439 40,504 40,504 Pre-tax income 17,260 17,260 (1,909) (1,429) 15,351 15,831 9,310 9,310 Taxes 6,338 6,338 (1,276) (796) 5,062 5,542 2,766 2,766 Operating earnings 10,922 10,922 (633) (633) 10,289 10,289 6,544 6,544
Tax rate 37% 37% 67% 56% 33% 35% 30% 30%
26
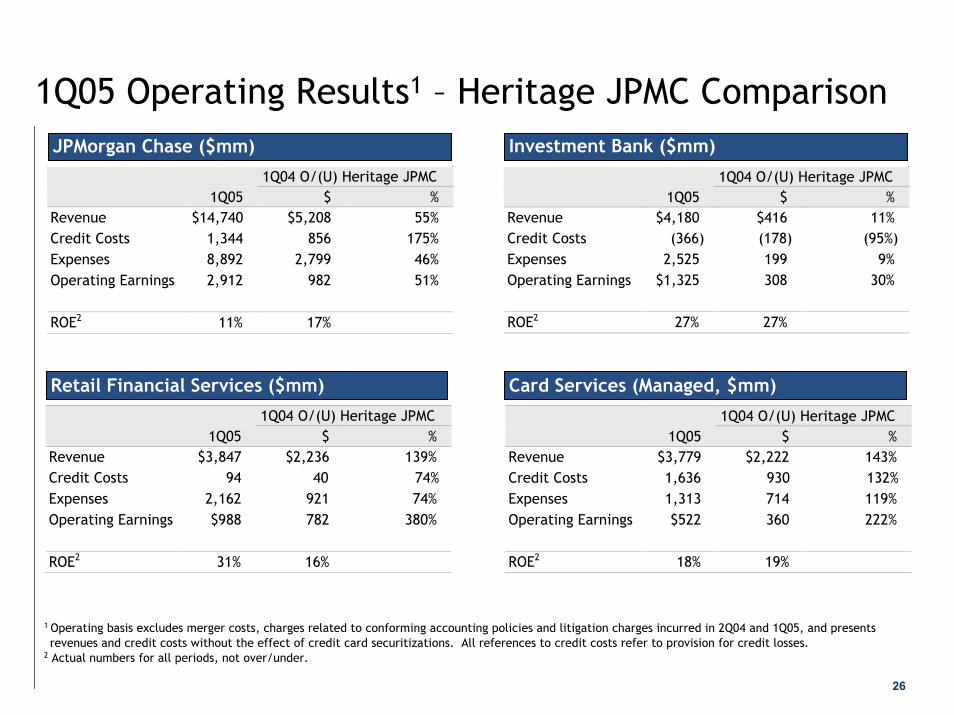
1Q05 Operating Results1 – Heritage JPMC Comparison
1Q04 O/(U) Heritage JPMC 1Q05 $ % Revenue $14,740 $5,208 55% Credit Costs 1,344 856 175% Expenses 8,892 2,799 46% Operating Earnings 2,912 982 51% ROE2 11% 17%
Retail Financial Services ($mm)Retail Financial Services ($mm)
1Q04 O/(U) Heritage JPMC 1Q05 $ % Revenue $4,180 $416 11% Credit Costs (366) (178) (95%) Expenses 2,525 199 9% Operating Earnings $1,325 308 30% ROE2 27% 27%
Card Services (Managed, $mm)Card Services (Managed, $mm)
JPMorgan Chase ($mm)JPMorgan Chase ($mm) Investment Bank ($mm)Investment Bank ($mm)
1Q04 O/(U) Heritage JPMC 1Q05 $ % Revenue $3,847 $2,236 139% Credit Costs 94 40 74% Expenses 2,162 921 74% Operating Earnings $988 782 380% ROE2 31% 16%
1Q04 O/(U) Heritage JPMC 1Q05 $ % Revenue $3,779 $2,222 143% Credit Costs 1,636 930 132% Expenses 1,313 714 119% Operating Earnings $522 360 222% ROE2 18% 19%
1 Operating basis excludes merger costs, charges related to conforming accounting policies and litigation charges incurred in 2Q04 and 1Q05, and presents revenues and credit costs without the effect of credit card securitizations. All references to credit costs refer to provision for credit losses.
2 Actual numbers for all periods, not over/under.

27
1Q05 Operating Results1 – Heritage JPMC Comparison
1Q04 O/(U) Heritage JPMC 1Q05 $ % Revenue $850 $528 164% Credit Costs (6) 7 54% Expenses 458 249 119% Operating Earnings $243 169 228% ROE2 29% 37%
Asset & Wealth Management ($mm)Asset & Wealth Management ($mm)
1Q04 O/(U) Heritage JPMC 1Q05 $ % Revenue $1,482 $470 46% Credit Costs (3) (4) NM Expenses 1,065 198 23% Operating Earnings $245 147 150% ROE2 52% 12%
Corporate ($mm)Corporate ($mm)
Commercial Banking ($mm)Commercial Banking ($mm) Treasury & Securities Services ($mm)Treasury & Securities Services ($mm)
1Q04 O/(U) Heritage JPMC 1Q05 $ % Revenue $1,361 $513 60% Credit Costs (7) (17) NM Expenses 934 285 44% Operating Earnings $276 154 126% ROE2 47% 9%
1Q04 O/(U) Heritage JPMC 1Q05 $ % Revenue ($759) ($1,177) NM Credit Costs (4) 78 95% Expenses 435 233 115% Operating Earnings ($687) ($938) NM
1 Operating basis excludes merger costs, charges related to conforming accounting policies and litigation charges incurred in 2Q04 and 1Q05, and presents revenues and credit costs without the effect of credit card securitizations. All references to credit costs refer to provision for credit losses.
2 Actual numbers for all periods, not over/under.


