
Financial services provision and prevention of financial exclusion
Eurobarometer report
Elaine Kempson, Mark Crame and Andrea Finney
Personal Finance Research Centre University of Bristol
August 2007

2
Contents
Contents ........................................................................................................................2
1 Introduction..........................................................................................................3 1.1 Definitions used in this report........................................................................4
1.2 Structure of this report ...................................................................................4
2 Levels of financial exclusion in the EU ..............................................................6 2.1 Variations in levels of financial exclusion by country...................................7
2.2 Levels of transaction banking exclusion........................................................9
2.3 Levels of credit exclusion ............................................................................13
2.4 Lack of savings ............................................................................................16
3 Who is the most likely to be financially excluded? .........................................17 3.1 Variations in the types of people who are financially excluded by overall
level of exclusion .........................................................................................22
4 Conclusion ..........................................................................................................24 Appendix 1: The Eurobarometer dataset .................................................................26
3
1 Introduction
This report is part of a wider project for the European Commission which will identify
and analyse the most effective policy measures taken by EU member states, and
EFTA/EEA Countries in the area of financial services provision and the prevention of
financial exclusion of people facing poverty or social exclusion. It uses data from the
Eurobarometer survey to examine how financial exclusion generally, as well as
banking, credit and savings exclusion more specifically, varies across the European
Union. This includes analysis to identify which factors are most strongly correlated
with financial exclusion in the EU and whether different factors assume importance in
countries where levels of exclusion are high, compared to those where levels are far
lower.
The main source that has been used to assess levels of financial exclusion in Europe is
the Eurobarometer Survey 60.2, undertaken at the end of 2003 (Anderloni and
Carluccio, 2006; Nieri, 2006; Corr, 2006). To date, however, use of the
Eurobarometer data has been restricted to looking at access to specific products only
(banking: Anderloni and Carluccio, 2006; Corr, 2006; credit: Nieri, 2006; life
insurance: Corr, 2006). We have, therefore, re-analysed the data to take this analysis
further and also taken into account data from Eurobarometer 2003.5 which looks at
the EU 10 new member states over the same period. Although there is more recent
data this was not suitable for the analysis we require1. One implication of this is that
for some countries (Cyprus, Czech Republic, Estonia, Lithuania, Malta, Poland,
Slovakia and Slovenia) the figures quoted will over-state the extent of financial
exclusion as levels seem to be falling.
Although Eurobarometer surveys individuals aged 15 or over, our analysis was
restricted to people aged over 18 as this is the legal age of access to some types of
product (including a transaction bank account with an overdraft and unsecured credit).
It asks about the holding of a range of financial products, including transaction
accounts (with a cheque book and/or a payment card facility), deposit accounts
(which pay interest but have no payment card or chequebook) and other savings
products including life assurance policies, stocks/shares, collective investments (unit
trusts) and bonds. The forms of credit covered include overdrafts, credit and charge
cards and loans for car purchase and other purposes.
It is important to note that the Eurobarometer data is useful to draft a broad picture
and to be able to draw very rough international comparisons, but that is it not 100%
accurate information. Indeed, experts have underlined that the questions are
sometimes interpreted differently from one country to another, and as the study
shows, comparisons with national data sometimes show quite important gaps, which
could not only be due to samples issues. To summarise, it is one of the best data
available for the moment, but it can still be improved in the future.
1 We have not used Eurobarometer 63.2 to undertake this analysis because the coding of the variables
does not differentiate between people who ‘do not know’ if they have an account and those who ‘do
not’ have one. It also lacks information on incomes. For further details, see Appendix 1.

4
1.1 Definitions used in this report
Within this report a number of terms are used which need to be defined as they have
often been constrained by the data available.
People were considered ‘fully banked’ if they had ‘transaction bank account’, that is if
they said they had access to a current account which comes with a payment card or a
chequebook. This group also includes people who said that they had only a deposit
account but also said they had access to a chequebook or an overdraft facility. It was
found that these people had similar characteristics to those who stated they had
current accounts, suggesting that they had misunderstood the question regarding
current accounts. People have been described as ‘marginally banked’ if they said that
had a deposit account but had no current account, payment card or chequebook. The
term ‘unbanked’ includes all those people they had neither a current account nor a
deposit account.
In looking at ‘credit exclusion’ we have focussed on people who said they did not
have access to either credit cards or an overdraft facility on a current account. It was
decided to use this narrower definition of credit for pragmatic reasons. Unfortunately
the Eurobarometer does not collect details of all forms of fixed term credit – only
loans. One notable omission is mail order catalogues, use of which is very common
in some EU countries. Moreover, the data on credit cards and overdrafts does not
include whether these were actually used for credit and had outstanding balances on
them. As a consequence it is inappropriate to add them together with loans. By
adopting the narrow definition we have, however, it is possible to get a common
measure across all 26 countries. It also provides as indication of people’s credit-
worthiness and the likelihood that they would be considered for a loan from the
mainstream credit market. Recognising that this was a compromise we also ran the
analysis including the data on loans. We found that this did not make a significance
difference to the levels of credit exclusion.
Turning now to savings, people have been considered as ‘savings excluded’, if they
lacked a range of savings and investment products: interest-bearing deposit accounts,
life assurance policies, stocks/shares, collective investments (i.e. unit trusts) and
bonds.
Finally, in this context, the term ‘financially excluded’ refers to people who had no
access to transaction banking or revolving credit or savings of any kind.
1.2 Structure of this report
The report begins, in section 2, by looking at the overall levels of financial exclusion
in the EU25 countries, before moving on to investigate the variation in levels of
financial exclusion between the different countries and then categorising all countries
by whether their levels of financial exclusion are high, medium-high, medium low or
low. Sections 2.2 to 2.4 cover levels of transaction banking, credit and savings
exclusion respectively.

5
Section 3 investigates which groups of people are the most likely to be financially
excluded, as well as examining whether particular attitudes to personal finance
influence (or are influenced by) this. Section 3.1 identifies whether or not the same
factors are important regardless of the level of financial exclusion faced in a country.
Section 4 draws together the findings in a short conclusion.
6
2 Levels of financial exclusion in the EU
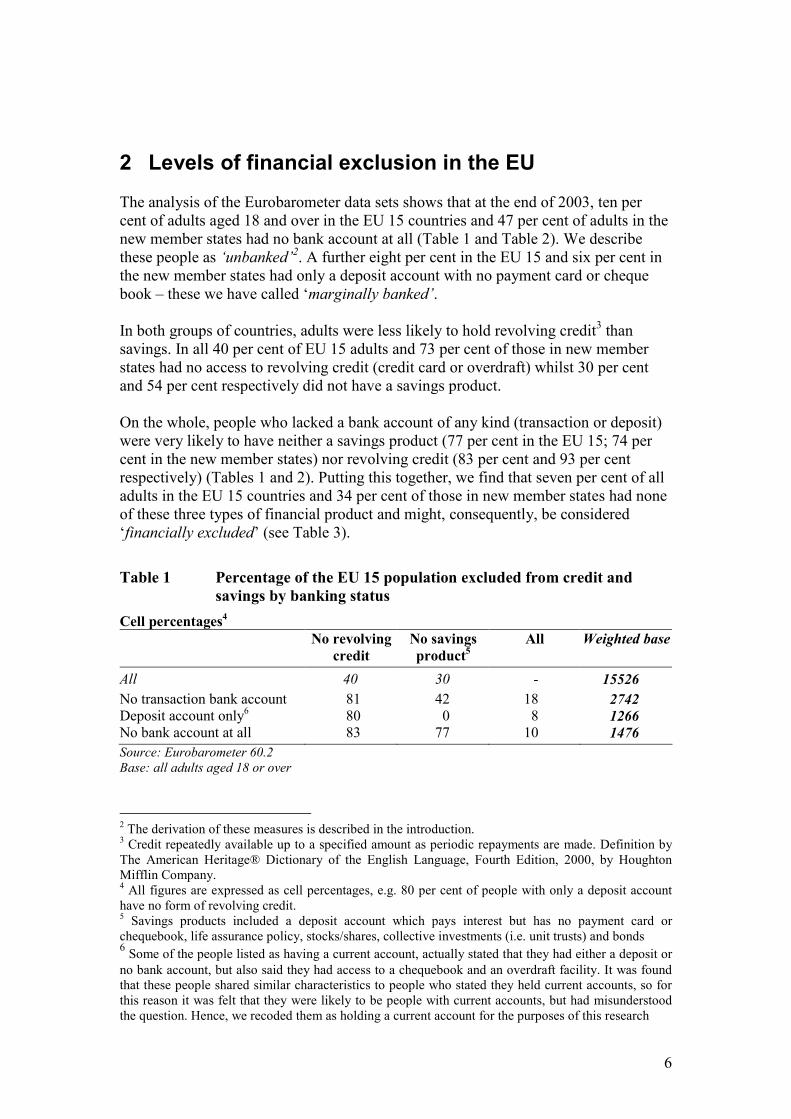
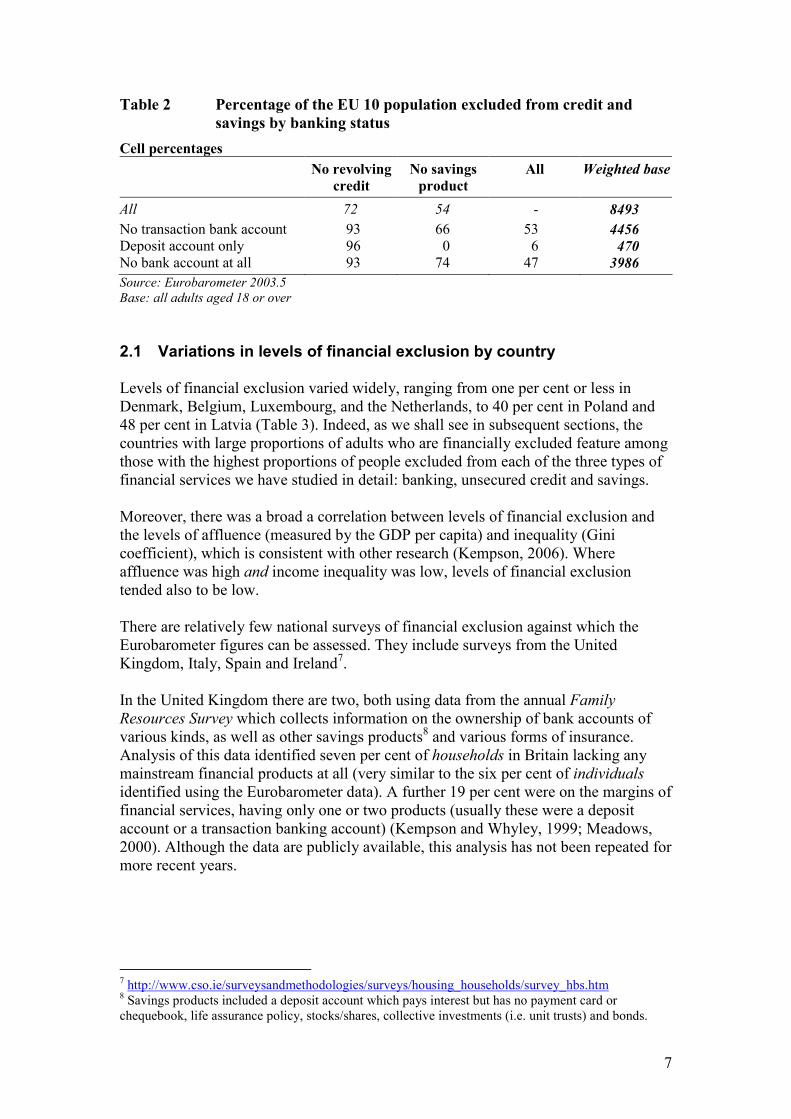
The analysis of the Eurobarometer data sets shows that at the end of 2003, ten per
cent of adults aged 18 and over in the EU 15 countries and 47 per cent of adults in the
new member states had no bank account at all (Table 1 and Table 2). We describe
these people as ‘unbanked’2. A further eight per cent in the EU 15 and six per cent in
the new member states had only a deposit account with no payment card or cheque
book – these we have called ‘marginally banked’.
In both groups of countries, adults were less likely to hold revolving credit3 than
savings. In all 40 per cent of EU 15 adults and 73 per cent of those in new member
states had no access to revolving credit (credit card or overdraft) whilst 30 per cent
and 54 per cent respectively did not have a savings product.
On the whole, people who lacked a bank account of any kind (transaction or deposit)
were very likely to have neither a savings product (77 per cent in the EU 15; 74 per
cent in the new member states) nor revolving credit (83 per cent and 93 per cent
respectively) (Tables 1 and 2). Putting this together, we find that seven per cent of all
adults in the EU 15 countries and 34 per cent of those in new member states had none
of these three types of financial product and might, consequently, be considered
‘financially excluded’ (see Table 3).
Table 1 Percentage of the EU 15 population excluded from credit and
savings by banking status
Cell percentages4
No revolving
credit
No savings
product5
All Weighted base
All 40 30 - 15526
No transaction bank account 81 42 18 2742 Deposit account only
6 80 0 8 1266
No bank account at all 83 77 10 1476
Source: Eurobarometer 60.2
Base: all adults aged 18 or over
2 The derivation of these measures is described in the introduction.
3 Credit repeatedly available up to a specified amount as periodic repayments are made. Definition by
The American Heritage® Dictionary of the English Language, Fourth Edition, 2000, by Houghton
Mifflin Company. 4 All figures are expressed as cell percentages, e.g. 80 per cent of people with only a deposit account
have no form of revolving credit. 5 Savings products included a deposit account which pays interest but has no payment card or
chequebook, life assurance policy, stocks/shares, collective investments (i.e. unit trusts) and bonds 6 Some of the people listed as having a current account, actually stated that they had either a deposit or
no bank account, but also said they had access to a chequebook and an overdraft facility. It was found
that these people shared similar characteristics to people who stated they held current accounts, so for
this reason it was felt that they were likely to be people with current accounts, but had misunderstood
the question. Hence, we recoded them as holding a current account for the purposes of this research
7
Table 2 Percentage of the EU 10 population excluded from credit and
savings by banking status
Cell percentages
No revolving
credit
No savings
product
All Weighted base
All 72 54 - 8493
No transaction bank account 93 66 53 4456 Deposit account only 96 0 6 470 No bank account at all 93 74 47 3986
Source: Eurobarometer 2003.5
Base: all adults aged 18 or over
2.1 Variations in levels of financial exclusion by country
Levels of financial exclusion varied widely, ranging from one per cent or less in
Denmark, Belgium, Luxembourg, and the Netherlands, to 40 per cent in Poland and
48 per cent in Latvia (Table 3). Indeed, as we shall see in subsequent sections, the
countries with large proportions of adults who are financially excluded feature among
those with the highest proportions of people excluded from each of the three types of
financial services we have studied in detail: banking, unsecured credit and savings.
Moreover, there was a broad a correlation between levels of financial exclusion and
the levels of affluence (measured by the GDP per capita) and inequality (Gini
coefficient), which is consistent with other research (Kempson, 2006). Where
affluence was high and income inequality was low, levels of financial exclusion
tended also to be low.
There are relatively few national surveys of financial exclusion against which the
Eurobarometer figures can be assessed. They include surveys from the United
Kingdom, Italy, Spain and Ireland7.
In the United Kingdom there are two, both using data from the annual Family
Resources Survey which collects information on the ownership of bank accounts of
various kinds, as well as other savings products8 and various forms of insurance.
Analysis of this data identified seven per cent of households in Britain lacking any
mainstream financial products at all (very similar to the six per cent of individuals
identified using the Eurobarometer data). A further 19 per cent were on the margins of
financial services, having only one or two products (usually these were a deposit
account or a transaction banking account) (Kempson and Whyley, 1999; Meadows,
2000). Although the data are publicly available, this analysis has not been repeated for
more recent years.
7 http://www.cso.ie/surveysandmethodologies/surveys/housing_households/survey_hbs.htm
8 Savings products included a deposit account which pays interest but has no payment card or
chequebook, life assurance policy, stocks/shares, collective investments (i.e. unit trusts) and bonds.

8
Table 3 Levels of financial exclusion in individual EU 25 countries
Source: Eurobarometer 60.2 and 2003.5
Base: All adults aged 18 or over9
Other countries have similar surveys although they have not been analysed to provide
similar information on overall levels of exclusion. For example, in Italy the biennial
panel survey on Household Income and Wealth collects data on deposit accounts
(with a bank or the Post Office), other kind of financial assets (savings), life insurance
and private supplementary pension plans. In Spain, the Survey on Household finances
(EFF) collects data on bank accounts (including transaction accounts that offer
payment facilities, deposit accounts without payment facilities and house-purchase
9 ‘Unweighted base’ is the number of people actually interviewed in each country (approximately equal
numbers of people were interviewed in each country)
‘Weighted base’ makes an adjustment so that the number per country reflects the country's population
as a proportion of the EU15 and EU10 populations. Weighted data is therefore used when analysing at
the EU15 and EU 10 levels.
Percentage
financially
excluded
Unweighted
base
Weighted
base
Gini
coefficients
GDP per
capita
EU15 7 15453 15526 -- --
EU10 34 8516 8493 -- --
EU15
Belgium 1 988 422 33 119
Denmark 1 970 214 24.7 122
Germany 3 2000 3517 28.3 109
Greece 28 964 434 34.3 82
Italy 16 955 2408 36 105
Spain 8 959 1659 34.7 98
France 2 957 2327 32.7 111
Ireland 12 949 145 34.3 139
UK 6 1294 2424 36 119
Luxembourg < 1 574 17 -- 223
Netherlands 1 978 645 30.9 120
Portugal 17 947 413 38.5 73
Finland 6 960 206 26.9 115
Sweden 2 969 356 25 116
Austria 3 989 339 29.1 122
EU10
Cyprus 18 456 79 -- 82
Czech Rep 17 953 1165 25.4 72
Estonia 16 910 153 35.8 50
Hungary 34 1001 1200 26.9 61
Latvia 48 946 265 37.7 43
Lithuania 41 934 382 36 48
Malta 21 478 44 -- 72
Poland 40 949 4368 34.5 47
Slovakia 26 950 614 25.8 52
Slovenia 6 939 223 28.4 78

9
saving accounts), other savings products, including pension schemes and unit-linked
or mixed life insurance.
2.2 Levels of transaction banking exclusion
Again the Eurobarometer analysis shows wide variation in exclusion from transaction
banking services across the 25 countries – ranging from two per cent of individuals in
the Netherlands to 78 per cent in Greece (Table 4, column 2). Other countries with
high proportions of individuals without a transaction account include Latvia and
Lithuania (65 per cent), Poland (58 per cent), Slovakia and Cyprus (48 per cent).
Spain (42 per cent), Ireland (41 per cent), Italy (26 per cent) and Portugal (20 per
cent) stand out amongst the EU 15.
It should be noted, however, that in Greece, Spain and Ireland, a high proportion of
individuals had a deposit account even though they lacked a transaction account, so
the proportion lacking an account of any kind was a good deal lower (Table 4, column
4).
The proportion of individuals who were completely unbanked ranged from two per
cent in the Netherlands to 62 per cent in Latvia. In general it was higher in the EU10
countries than in the EU15. It is, however, worth noting that the proportion of
completely unbanked people remained high in Greece (36 per cent), despite the high
level of deposit account-holding noted above. Among the EU10 counties, Slovenia
stands out as having a particularly small proportion of its population who are
completely unbanked.
In addition to the Eurobarometer surveys, national surveys have also been undertaken
in a number of member states. These are summarised below and, generally speaking,
they indicate levels of banking exclusion that are somewhat lower than is found using
the Eurobarometer data. This may well have arisen because of the problems of
defining the different types of account in a way that can be applied across Europe. For
example, the people surveyed may have under-reported accounts held with the post
office, savings banks or credit unions.
A 2005 survey of young people and adults in Austria aged 15 and over found that
only two per cent had no relationship with a bank at all and seven per cent possessed
no bank account. This was slightly lower than the nine per cent found from the
Eurobarometer analysis, although a direct comparison cannot be made because of the
difference in the age range of the people surveyed (Bank Austria Creditanstalt,
2006)10.
10 (Bank Austria Creditanstalt, 2006) [Lecture at the Annual Meeting 2006, European Bank for
Reconstruction and Development, London May 21st 2006].
10
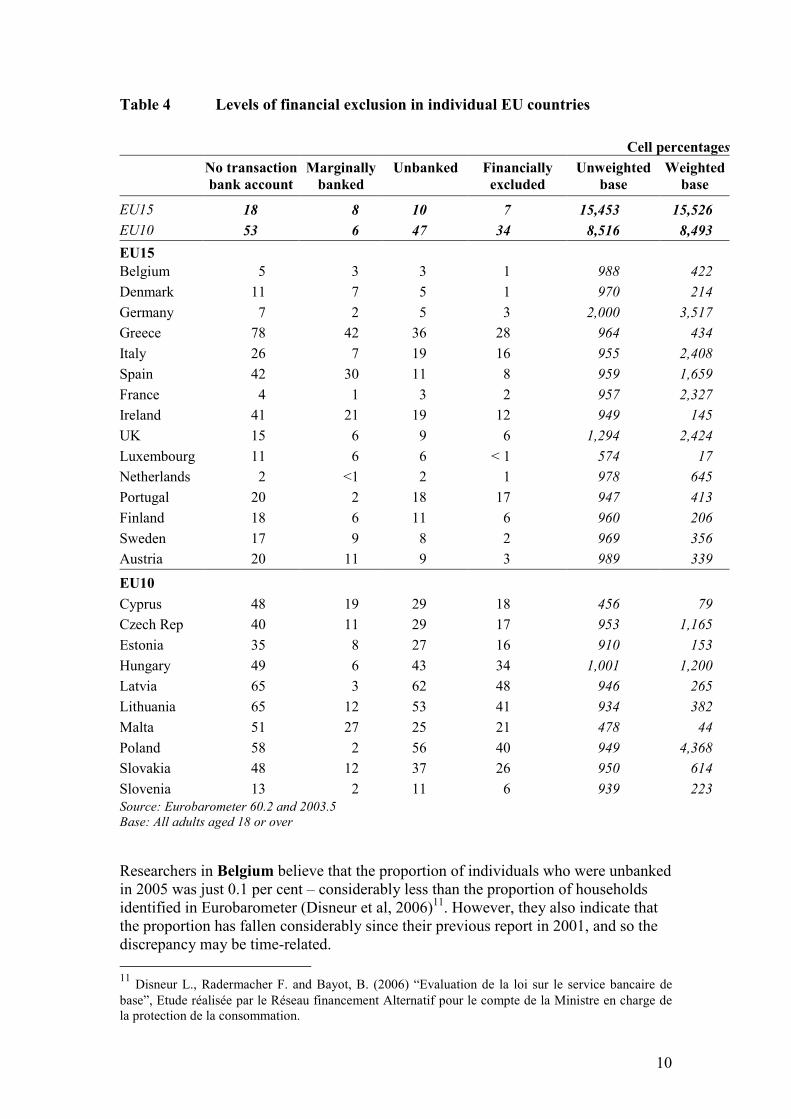
Table 4 Levels of financial exclusion in individual EU countries
Source: Eurobarometer 60.2 and 2003.5
Base: All adults aged 18 or over
Researchers in Belgium believe that the proportion of individuals who were unbanked
in 2005 was just 0.1 per cent – considerably less than the proportion of households
identified in Eurobarometer (Disneur et al, 2006)11. However, they also indicate that
the proportion has fallen considerably since their previous report in 2001, and so the
discrepancy may be time-related.
11 Disneur L., Radermacher F. and Bayot, B. (2006) “Evaluation de la loi sur le service bancaire de
base”, Etude réalisée par le Réseau financement Alternatif pour le compte de la Ministre en charge de
la protection de la consommation.
Cell percentages
No transaction
bank account
Marginally
banked
Unbanked Financially
excluded
Unweighted
base
Weighted
base
EU15 18 8 10 7 15,453 15,526
EU10 53 6 47 34 8,516 8,493
EU15
Belgium 5 3 3 1 988 422
Denmark 11 7 5 1 970 214
Germany 7 2 5 3 2,000 3,517
Greece 78 42 36 28 964 434
Italy 26 7 19 16 955 2,408
Spain 42 30 11 8 959 1,659
France 4 1 3 2 957 2,327
Ireland 41 21 19 12 949 145
UK 15 6 9 6 1,294 2,424
Luxembourg 11 6 6 < 1 574 17
Netherlands 2 <1 2 1 978 645
Portugal 20 2 18 17 947 413
Finland 18 6 11 6 960 206
Sweden 17 9 8 2 969 356
Austria 20 11 9 3 989 339
EU10
Cyprus 48 19 29 18 456 79
Czech Rep 40 11 29 17 953 1,165
Estonia 35 8 27 16 910 153
Hungary 49 6 43 34 1,001 1,200
Latvia 65 3 62 48 946 265
Lithuania 65 12 53 41 934 382
Malta 51 27 25 21 478 44
Poland 58 2 56 40 949 4,368
Slovakia 48 12 37 26 950 614
Slovenia 13 2 11 6 939 223

11
Research from 2001 indicated that just one per cent of households in France lacked a
transaction bank account (Daniel and Simon, 2001)12, compared with the four per cent
of individuals identified on Eurobarometer.
A recent report from the Combat Poverty Agency provides additional information on
the extent of banking exclusion in Ireland (Combat Poverty Agency, 2006). This
shows how measures can vary widely depending on the definitions used.
Drawing on data from the 1999/2000 Irish Household Budget Survey, they found that
33 per cent of households lacked a transaction bank account. While market research
undertaken for the Irish Bankers Federation in 2003 showed that 28 per cent of
individuals lacked such an account (Corr, 2006). Again these figures are somewhat
lower than those from our re-analysis of the Eurobarometer data, which identifies 41
per cent of Irish individuals as lacking a transaction account in 2003.
Taking a narrower definition of the unbanked, the Financial Regulator Consumer
Survey, in 2003, found that 10 per cent of individuals aged 15 or over lacked a bank
account of any kind (Corr, 2006) – very similar to the level (11 per cent) in a survey
for the Irish Payment Services Organisation in 2006 (Marketing Partners Ireland Ltd,
2006). Furthermore, subdividing the 11 per cent without a bank account, three per
cent had no account but seven per cent did have access to a post office or credit union
account. Again these are a good deal lower than the 19 per cent of individuals who
were found to lack an account of any kind in the Eurobarometer survey. This could
well be because credit union usage is high in Ireland and may not have been
consistently identified by the Eurobarometer survey. It would not, however, explain
the discrepancy found for transaction accounts as most credit unions do not offer
transaction banking facilities – just a deposit account (only 0.4% offer transaction
facilities).
In Italy, Banca d’Italia, since the 1960’s, carries out bi-annual surveys with the aim of
gathering data on the incomes and savings of Italian households. Over the years, the
scope of the survey has grown and it now provides data on the access to the Italian
banking system (Banca d’Italia 2002, 2004, 2006, and 2008). The most recent survey,
in 2008, found that 10.8 per cent of workers in Italy lacked a bank account of any
kind (Banca d’Italia 2008). Once again this is slightly lower than the 19 per cent of
individuals lacking a bank account in the Eurobarometer data. It does, however, need
to be remembered that the population being surveyed differs in the two studies.
Availability of local data in new member states is scarce. It is only in Poland and
Slovakia that we identified banking sector reports (of commercial character) with data
regarding the fact of having bank account. In Poland, unpublished research by Pentor
International Research indicates that the percentage of individuals (aged 15 or over)
without a current account in 2005 was 41 per cent and for households this fell to 30
per cent. As the age range is different, direct comparisons cannot be made with the
Eurobarometer statistics. However, the survey of financial exclusion in Poland that
12 Daniel A., Simon M.- (2001), L’utilisation des moyens de paiement et l’accès au crédit des
bénéficiaires de minima sociaux, rapport d’enquête réalisé par le CREDOC pour le Conseil national du
crédit et du titre, Paris.

12
was undertaken as part of our own study identified only 32 per cent of individuals
aged 18-75 as lacking an account. It did, however, uncover very high proportions of
people who were only marginally banked (Błędowski and Iwanicz-Drozdowska,
2007).
In Slovakia, according to the Focus Agency Report from 2005, the average of people
with more than one bank account was around 72% and the rest were individuals with
no bank account at all.
Although the Eurobarometer survey shows that 42 per cent of individuals in Spain
lacked a transaction account, 11 per cent lacked an account of any kind; both figures
are considerably higher than those identified in a panel survey commissioned by the
Banco de España. This found that 17 per cent of households lacked an account with
payment facilities, while only two per cent had no account at all (Banco de España,
2005). As in Italy, it is important to remember that the population being surveyed in
the two studies differs and this may, in part, explain the discrepancy.
Finally, in the United Kingdom, analysis of the Family Resources Survey data shows
that 12 per cent of families and 14 per cent of individuals lacked a current account in
the 2002/3 survey. In this case the figures for individuals were similar to those found
in the Eurobarometer data (15 per cent). Since then the Government’s Financial
Inclusion Taskforce has been monitoring progress towards the goal (shared by
Government and the banking sector) to halve the numbers of individuals living in
households without a transaction bank account,13 and the numbers with no bank
account at all. These show a considerable fall in levels of banking exclusion. In
2005/06 the number of families without a current account had fallen to 1.9 million
(compared with 3 million in 2002/03); while the number of families with no bank
account of any kind fell to 1.3 million (from 1.8 million in 2002/03) (Financial
Inclusion Taskforce, 2007)14. There were also large falls in the numbers of individuals
living in families either without a current account (from 4.5 million to 2.9 million) or
with no account of any kind (2.8 million to 2 million).
The Financial Inclusion Taskforce has also commissioned a survey that was designed
to explore the extent and nature of banking more fully. This included levels of use of
accounts by account-holders and also the overlap between banking exclusion and the
use of various forms of unsecured credit (BMRB, 2006). This found that eight per
cent of individuals lacked a transaction bank account in their own name, while five
per cent of individuals did not have such an account themselves nor did they live with
a partner who had one. They also identified that seven per cent of households either
lacked a transaction account or had one but did not use the transaction banking
facilities.
13 From 2003, basic bank accounts (simple transaction accounts that cannot become overdrawn)
became more common, and the Post Office has offered a stored value card (The Post Office Card
Account). The way that information about these was collected on the Family Resources Survey in
2003/03 and 2004/05 means that the data cannot be used to measure levels of account-holding
accurately. 14
http://www.financialinclusiontaskforce.org.uk/PDFs/second_annual_taskforce_banking_report_sept_2
007.pdf

13
Summarising these national findings, it appears that, on the whole, the Eurobarometer
surveys provide a broad international comparison based on “standard” functioning of
markets and economies more than a perfectly accurate picture of the relative levels of
financial exclusion across Europe. Although many of the discrepancies with national
surveys can be explained in terms of differences in sampling or the timing of surveys,
it does seem that Eurobarometer may slightly over-state the levels of banking
exclusion. It is, however, known that measures of transaction bank account exclusion
are heavily dependent on the wording of the question and the description of this type
of account (Kempson and Whyley 1998).
Ways to improve the Eurobarometer data include, on the one hand, a better sampling,
that is the panels in larger countries should be enlarged to better represent the
population, and on the other hand, the questions should be better designed to reduce
the potential misinterpretation, and therefore improve the quality of the answers.
More attention should be paid on this interesting tool, to make it more accurate in its
future use.
2.3 Levels of credit exclusion
Using the Eurobarometer data it is possible to compute two variables to measure the
level of exclusion from unsecured credit. The first is the proportion of people with no
credit in the form of an overdraft, credit card or loan; the second is a narrower
definition - of access to mainstream revolving credit facilities (overdrafts and credit
cards). Both measures, however, tend to provide an over-estimate of credit exclusion
as they will include people who are opposed to borrowing and so decline such
facilities,15 or they simply did not need them. Importantly, the extent of this will vary
from country to country, depending on the prevailing attitude towards borrowing. It
should also be noted that there are three quite distinct types of credit card in Europe,
and also that the Eurobarometer survey puts charge cards together with credit cards
even though they do not offer extended credit. Secondly, the Eurobarometer survey
excludes some forms of credit that are quite prevalent in some countries – including
goods bought on credit through mail order catalogues and, in the United Kingdom and
Ireland, a form of credit known as hire purchase. Finally, experience of designing
surveys in the United Kingdom has identified that a significant proportion of
consumers confuse debit cards with credit cards. Despite these concerns about the
Eurobarometer data, it does offer at least some insight into levels of access to credit
across the EU 15 countries. These should, however, be kept in mind when interpreting
the findings of the analysis.
Across the EU 15 countries four in ten (40 per cent) of adults aged 18 or over did not
have any revolving credit facilities in 2003; the comparable figure across new
member states is 72 per cent (Table 5). Again there was wide variation across
countries. The proportion of people with no revolving credit was lowest in France (14
15 Research in the United Kingdom, for example, showed that eight per cent of households did not have
any form of credit because they were opposed to borrowing. Although we lack precise figures, this
phenomenon emerges also from qualitative surveys in Italy, France and Spain.

14
per cent)16, Denmark (18 per cent) and Luxembourg (18 per cent). The highest
proportions were found in Lithuania (86 per cent), Slovakia (81 per cent) Estonia and
Latvia (80 per cent).
In the United Kingdom, a survey undertaken for the Government found that, in 2002,
26 per cent of households had no credit facilities (Kempson, 2002)17. This is
consistent with the Eurobarometer data which shows that 30 per cent of British adults
had no credit facilities. However, other research in the United Kingdom, using a
longitudinal data set where the same people are re-interviewed each year, has shown
that snapshot surveys lead to over-estimates of the numbers of people who are not
using credit. Although 64 per cent of adults did not owe money on unsecured credit in
2000 a much smaller proportion of people (45 per cent of all adults) had not owed any
money in either 1995 or 2000 (Kempson et al, 2004).
Where more direct measures of credit exclusion have been attempted at a national
level, they show that the figures from the Eurobarometer do seem to greatly over-state
the proportion of people excluded from the mainstream credit market – for the various
reasons spelt out above. The United Kingdom National Consumer Council has, for
example, estimated that 7.8 million people (17.5 per cent of the adult population aged
over 18) had applied for credit and been refused several times and could therefore be
considered excluded from mainstream credit (Treasury Select Committee 2006a).
This is considerably lower than the 30 per cent of the United Kingdom population that
the Eurobarometer data indicates as having no credit facilities.
A survey carried out in 2005 in France, Spain and Italy has attempted to understand
the behaviour of people on low incomes (unemployed or employed on a temporary
basis) with regard to credit access (Nieri, 2006). Although the aim of the research was
not to measure the level of credit exclusion but to analyse qualitative aspects, it
showed that a large proportion of people on low incomes did have access to credit,
although not necessarily from a bank. Most of them, however, paid no attention to the
difference in costs and terms between banks and other financial institutions and were
not able to evaluate how high the costs were. About half of the people interviewed
had never approached a bank or a credit institution for a loan: this percentage was
higher still for migrants (62 per cent of the sample), especially those living in France.
However, only 16 per cent of respondents said that they had applications for loans
rejected – a level that is remarkably similar to that found in the United Kingdom.
Adding to these the people who said they did not apply because they expected to be
rejected (21 per cent) gives a figure of 37 per cent of people who needed credit but
were excluded or chose to self-exclude (Nieri, 2006). The Eurobarometer data, which
looks at the whole population, not just those on low incomes, indicates that levels of
credit exclusion were 14 per cent in France; 46 per cent in Spain and 56 per cent in
Italy.
16 This percentage would mean that 86% of people in France have access to revolving credit – a
percentage which is considered totally inaccurate by the French expert. This shows that the
Eurobarometer data are not always correct. 17 This includes credit cards and overdrafts on which no money was owed and is, therefore, similar to
the Eurobarometer definition except that it does include people who have access to credit in the sub-
prime market only.

15
Table 5 Levels of revolving credit and savings exclusion
Source: Eurobarometer 60.2 and 2003.5
Base: All adults aged 18 or over
Levels of credit refusal were, however, somewhat high in the survey of financial
exclusion in Poland, in which 25 per cent of adults aged 18-75 said that they had no
credit currently because they had been refused (Błędowski and Iwanicz-Drozdowska,
2007).
In other words, by using the Eurobarometer data to assess the numbers of people who
do not have any credit facilities we are almost certainly adopting a wide definition of
credit exclusion – including those who self-exclude through choice as well as those
with constrained access.
Cell percentages
No
revolving
credit
Have a
loan(s)
No savings Financially
excluded
Unweighted
base
Weighted
base
EU15 40 18 30 7 15453 15526
EU10 72 11 54 34 8516 8493
EU15
Belgium 37 17 13 1 988 422
Denmark 18 35 15 1 970 214
Germany 46 16 21 3 2000 3517
Greece 76 9 41 28 964 434
Italy 56 13 50 16 955 2408
Spain 46 16 25 8 959 1659
France 14 21 39 2 957 2327
Ireland 51 34 21 12 949 145
UK 30 24 22 6 1294 2424
Luxembourg 18 35 28 < 1 574 17
Netherlands 21 11 28 1 978 645
Portugal 75 12 62 17 947 413
Finland 48 23 34 6 960 206
Sweden 33 22 7 2 969 356
Austria 36 21 11 3 989 339
EU10
Cyprus 54 33 24 18 456 79
Czech Rep 62 14 35 17 953 1165
Estonia 80 7 67 16 910 153
Hungary 78 11 58 34 1001 1200
Latvia 80 8 76 48 946 265
Lithuania 86 6 61 41 934 382
Malta 70 9 30 21 478 44
Poland 73 11 60 40 949 4368
Slovakia 81 13 40 26 950 614
Slovenia 36 23 32 6 939 223
16
2.4 Lack of savings
As we saw earlier, around a third (30 per cent) of adults living in one of the EU 15
countries and 54 per cent of those from the new member states had no savings
account at the time of the 2003 Eurobarometer survey. Once again there were wide
variations across individual countries (Table 5). Sweden was the country with the
highest incidence of saving account-holding – only seven per cent of adults lacked a
savings account. At the other extreme, countries in the EU 15 where a large
proportion of the population did not have a savings account included Portugal (62 per
cent), Italy (50 per cent), Greece (41 per cent) and France (39 per cent). Amongst the
new member states, proportions of the population without a savings account ranged
from 24 per cent in Cyprus to 76 per cent in Latvia.
Analysis of the Family Resources Survey in the United Kingdom suggests that just
over a quarter (27 per cent) of households (Department for Work and Pensions, 2006)
and over a third (37 per cent) of individuals (Rowlingson et al, 1999) lacked any
savings. This last figure is rather more than the proportion indicated by the
Eurobarometer survey (22 per cent) although it could be explained by the large time
gap.
The survey of financial exclusion in Poland identified 65 per cent of adults aged 18-
75 had no savings account – a figure that is close to that identified by the
Eurobarometer (60 per cent) (Błędowski and Iwanicz-Drozdowska, 2007)
Analysis of the last Household Income and Wealth survey in Italy (Bank of Italy,
2008) shows that 10,8 per cent of households lack any savings, that is they have no
assets at all.

17/27
3 Who is the most likely to be financially excluded?
Previous research in Europe18 has shown that complete financial exclusion among
households has very strong links to low income. It was, therefore, most common
among people who were not in paid work and in households where there was no wage
earner. Consequently unemployed people, lone parents and people unable to work
through disability had above average levels of exclusion. There was also a link with
age, with the youngest and oldest people being most likely to be excluded, and a link
with educational attainment so that the more education someone had received the less
likely they were to be excluded. Financial exclusion was also very prevalent among
ethnic minorities and migrants. The country reports of the fourteen countries studied
tended to confirm these research findings.
In addition to these personal characteristics, (multivariate) statistical analysis has also
shown that living in a neighbourhood that had high levels of deprivation increased the
likelihood of being financially excluded still further and so too did having friends and
family who were financially excluded.
Research around Europe has looked largely at the types of people who lack access to
transaction banking. On the whole, the findings are as just described above, although
in countries where transaction banking exclusion is relatively uncommon, it tends to
be concentrated among migrants and people who are over-indebted (see, for example
Disneur et al, 2006; IFF, 2000; IFF, 2006; Linz, 2006). Indeed, in Belgium even
though the numbers of people without a transaction account fell between 2001 and
2006, the types of people most likely to be affected (migrants, people with little or no
education and people going through debt settlement programmes) had remained the
same (Disneur et al, 2006). We explore the links between over-indebtedness and
financial exclusion further in section 5.3. The study of financial exclusion in Poland,
where financial exclusion is fairly high, found that levels of banking exclusion were
highest among: the under 25s and people over retirement age; people on low incomes;
people with low levels of education unemployed people, and students (Błędowski and
Iwanicz-Drozdowska, 2007).
It is also worth noting that our country correspondents in the Netherlands and
Norway indicated that financial exclusion is not considered to be a problem in their
countries (and statistics bear this out). The Dutch correspondent commented that the
only people excluded are those who choose not to have an account and a very small
number of people who have been laundering money or have behaved fraudulently.
Similarly, our Norwegian correspondent suggested that the only barriers to financial
inclusion in Norway are related to self-exclusion because of problems relating to
travelling or technology.
18 Anderloni, 2003; Anderloni and Carluccio, 2006; Bank of Italy 2004, BMRB, 2006; Barr, 2004;
Bayot, 2005; Błędowski and Iwanicz-Drozdowska, 2007; Corr, 2006; Devlin, 2005; Disneur et al,
2006; Gloukoviezoff, 2005; Kempson, 2006; Kempson and Whyley, 1998; Idzik, 2006; IFF, 2000; IFF,
2006; Marketing Partners Ireland Ltd, 2006; Mintel, 2005; Test Achats, 2001.
18/27
One previous study in the United Kingdom has explored gender differences in
transaction account-holding and found that ethnicity, having children, personal
income and economic activity status all had a greater effect on women’s propensity to
be financially excluded than they did on men. The authors note that this is consistent
with qualitative research showing that some married women give up having an
account in their own name when they give up work to have children (Kempson and
Whyley, 1998).
We were only able to find one study that looked at the characteristics of people who
had been refused credit – the study of financial exclusion in Poland (Błędowski and
Iwanicz-Drozdowska, 2007). This found that refusals were highest among people who
were over retirement age, had low incomes, had low levels of education or lived in a
rural village.
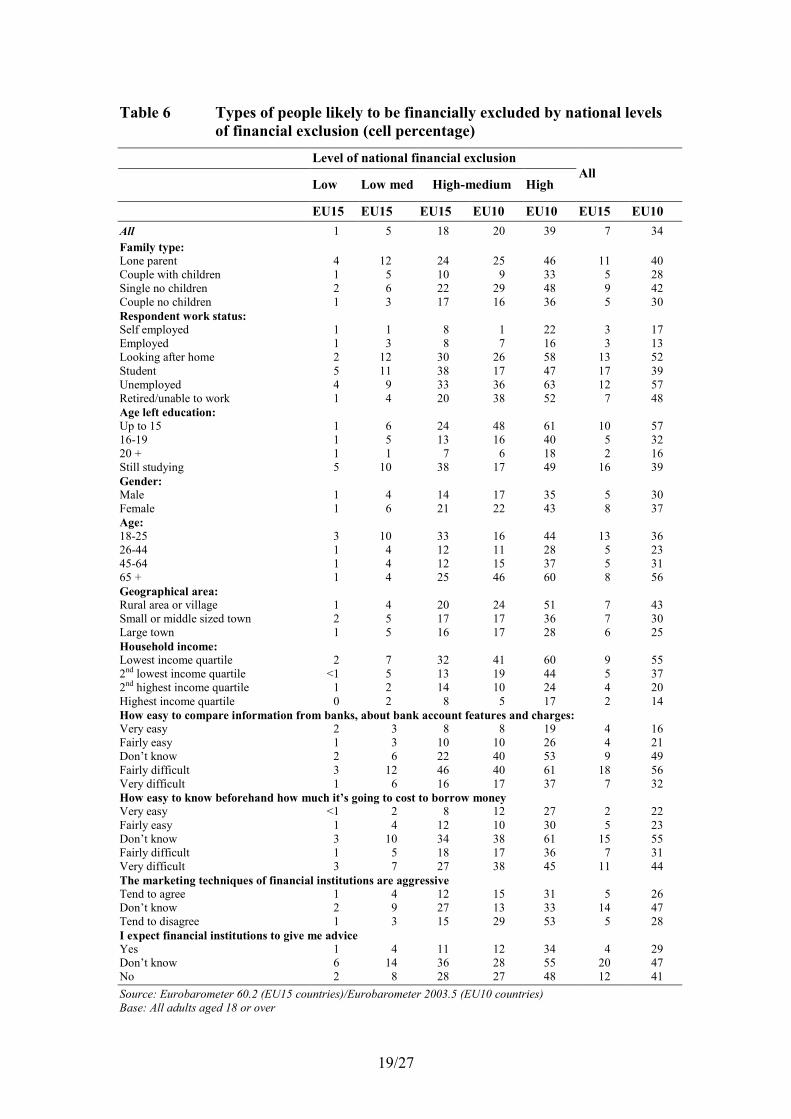
Analysis of the Eurobarometer data is mostly consistent with this earlier research
(Table 6, final two columns). This shows that women were more likely to be
completely financially excluded than men. Young people (aged 18-25) and adults
aged 65 and over were most likely to be financially excluded. Younger people were
the ones who were most likely to be excluded in EU 15 countries, while in new
member states it was most common among elderly people.
Lone parents and single people (who tended to be either quite young or quite old)
included a greater proportion of who were financially excluded than people who were
living with a partner, whether they had children or not.
There was a strong link between financial exclusion and level of education received
and also with income. So the less well-educated people were and the lower their
household income, the more likely they were to be excluded from all forms of
financial services. Students were also far more likely than average to be excluded.
Given that low income was associated with financial exclusion it is unsurprising that
unemployed people and those looking after the home full-time had high levels of
financial exclusion. Although it is not shown in the table, levels were also high for
people living in households where the head of household was either unemployed or
looking after a family full-time. In new member states, people who were retired or
unable to work through disability also had above-average levels of exclusion –
reflecting the age effect noted above.
Although a great deal has been written about the difficulties accessing financial
services faced by people living in rural areas, levels of financial exclusion varied little
by type of geographical area across EU15 countries. There was, however, a noticeable
difference between levels in rural areas (43 per cent) and large towns (25 per cent) in
new member states.
19/27
Table 6 Types of people likely to be financially excluded by national levels
of financial exclusion (cell percentage)
Level of national financial exclusion
Low Low med High-medium High
All
EU15 EU15 EU15 EU10 EU10 EU15 EU10
All 1 5 18 20 39 7 34
Family type:
Lone parent 4 12 24 25 46 11 40
Couple with children 1 5 10 9 33 5 28
Single no children 2 6 22 29 48 9 42
Couple no children 1 3 17 16 36 5 30
Respondent work status:
Self employed 1 1 8 1 22 3 17
Employed 1 3 8 7 16 3 13
Looking after home 2 12 30 26 58 13 52
Student 5 11 38 17 47 17 39
Unemployed 4 9 33 36 63 12 57
Retired/unable to work 1 4 20 38 52 7 48
Age left education:
Up to 15 1 6 24 48 61 10 57
16-19 1 5 13 16 40 5 32
20 + 1 1 7 6 18 2 16
Still studying 5 10 38 17 49 16 39
Gender:
Male 1 4 14 17 35 5 30
Female 1 6 21 22 43 8 37
Age:
18-25 3 10 33 16 44 13 36
26-44 1 4 12 11 28 5 23
45-64 1 4 12 15 37 5 31
65 + 1 4 25 46 60 8 56
Geographical area:
Rural area or village 1 4 20 24 51 7 43
Small or middle sized town 2 5 17 17 36 7 30
Large town 1 5 16 17 28 6 25
Household income:
Lowest income quartile 2 7 32 41 60 9 55
2nd lowest income quartile <1 5 13 19 44 5 37
2nd highest income quartile 1 2 14 10 24 4 20
Highest income quartile 0 2 8 5 17 2 14
How easy to compare information from banks, about bank account features and charges:
Very easy 2 3 8 8 19 4 16
Fairly easy 1 3 10 10 26 4 21
Don’t know 2 6 22 40 53 9 49
Fairly difficult 3 12 46 40 61 18 56
Very difficult 1 6 16 17 37 7 32
How easy to know beforehand how much it’s going to cost to borrow money
Very easy <1 2 8 12 27 2 22
Fairly easy 1 4 12 10 30 5 23
Don’t know 3 10 34 38 61 15 55
Fairly difficult 1 5 18 17 36 7 31
Very difficult 3 7 27 38 45 11 44
The marketing techniques of financial institutions are aggressive
Tend to agree 1 4 12 15 31 5 26
Don’t know 2 9 27 13 33 14 47
Tend to disagree 1 3 15 29 53 5 28
I expect financial institutions to give me advice
Yes 1 4 11 12 34 4 29
Don’t know 6 14 36 28 55 20 47
No 2 8 28 27 48 12 41
Source: Eurobarometer 60.2 (EU15 countries)/Eurobarometer 2003.5 (EU10 countries)
Base: All adults aged 18 or over

20/27
We have also investigated the influence of a range of skills and attitudes on financial
exclusion. Across both EU15 and new member states levels of exclusion were higher
if people:
• found it difficult to compare information from banks about bank account
features and charges;
• found it difficult to know beforehand how much it’s going to cost to borrow
money, and
• did not expect financial institutions to give them financial advice.
In each case, though, significant proportions of people replied ‘don’t know’ to these
questions and these people had higher levels of financial exclusion still. They were
also very likely to say they did not know whether the marketing techniques of
financial institutions are aggressive. Taken together, this suggests that financial
exclusion is influenced by:
• perceived difficulties likely to be encountered finding out the costs of using
banking services and credit;
• lack of knowledge about financial services, and
• not receiving any marketing materials – which other research has shown
reinforces a belief that financial services are ‘not for people like me’.
Clearly, many of these personal characteristics and attitudes are linked to one another.
For example, lone parents are often out of the labour market because they are looking
after their children and, as a group, they tend to have relatively low incomes. To
disentangle these effects we have used a statistical technique known as logistic
regression. This enables us to look at the effects of each factor in turn, independently
of all others included in the analysis, and to see the extent to which it raises the odds
of someone being financially excluded. It also enables us to disentangle the effects of
attitudes and personal characteristics. (See Table 7 column 2 – all EU25).
This analysis showed that the largest, and most statistically significant influence on
financial exclusion was being unemployed (which almost quadrupled the odds relative
to someone in employment) and not knowing whether financial institutions would
give advice or expecting they would not (both of which more than tripled the odds
compared with someone expecting them to do so). Other factors with a sizeable effect
(all of them doubling the odds) included: being retired or unable to work; being in the
lowest income quartile19, being a student and not knowing how easy it would be to
compare bank charges. Age, gender and type of locality lived in were significant to
some extent, but the effects were small. We were unable to include age at which
people left education in this model because of the strong co-linearity with the work
status variable (both having groups of current students).
19 By this we mean among people living in the quarter of households with the lowest incomes.

21/27
Table 7 Logistic regression of the odds of being financially excluded across
all EU25 countries and by national level of financial exclusion
R squared 0.24 0.14 0.18 0.21 0.29
Levels of exclusion All EU25 Low Low-
medium
High-
medium High
Exp(B) Exp(B) Exp(B) Exp(B) Exp(B)
Gender ns ns ns
Male (reference)
Female 1.1 0.8*
Age ns
26-44 (reference)
18-25 1.7** 2.2** 1.5** 1.6**
45-64 1.1 0.8 0.9 1.4*
65+ 1.0 1.0 1.0 2.3**
Family ns ns ns
Couple no children (reference)
Single parent 1.2** 1.9**
Couple with children 1.2* 1.5*
Single no children 1.2** 1.9**
Other 0.6 2.5 -
Respondent work status ns
Employed (reference)
Self employed 1.1 0.8 0.9 0.8
Looking after home 2.3** 3.5** 3.0** 3.4**
Student 2.0** 1.4 2.2** 2.2**
Unemployed 3.6** 3.2** 3.2** 3.1**
Retired/unable to work 2.3** 1.5* 2.2** 1.5**
Household income ns
Highest income quartile (reference)
Lowest income quartile 2.1** 2.8** 2.6** 2.4**
2nd lowest income quartile 1.9** 2.5** 1.9** 1.8**
2nd highest income quartile 1.4** 1.3 1.4* 1.3*
Geographical area ns ns
Large town (reference)
Rural area or village 1.2** 1.2* 1.9**
Small or middle sized town 1.0 1.0 1.3*
How easy to compare information from banks, about bank account features and charges ns
Very easy (reference)
Fairly easy 1.1 0.8 1.2 1.2
Don’t know 1.8** 2.1** 2.0** 2.7**
Fairly difficult 1.5** 1.0 1.5* 3.0**
Very difficult 2.0** 1.3 1.6** 1.8**
How easy to know beforehand how much it’s going to cost to borrow money ns
Very easy (reference)
Fairly easy 1.0 0.7 1.4 0.9
Don’t know 1.1 1.0 1.4 1.2
Fairly difficult 1.4** 2.9* 1.6 1.8**
Very difficult 1.9** 2.4 2.3** 1.5*
The marketing techniques of financial institutions are aggressive ns
Tend to agree (reference)
Tend to disagree 1.2** 1.3* 1.1
Don’t know 2.1** 1.4** 1.4**
I expect financial institutions to give me advice ns
Tend to agree (reference)
Tend to disagree 3.1** 2.1** 2.0** 1.6**
Don’t know 3.0** 2.9** 2.1** 1.6**
Eurobarometer 60.2 and 2003.5 Base: All adults aged 18 or over
** Significance < 0.01 * Significance < 0.05 * ns= not significant

22/27
3.1 Variations in the types of people who are financially excluded by overall level of exclusion
It is interesting to analyse whether the same types of people are financially excluded
in countries with high levels of financial exclusion as are found in those where the
levels are low, or whether a lower incidence of financial exclusion means that it tends
to be even more concentrated among certain groups in society.
It is plausible that, in countries with a lower level of financial exclusion, it becomes
concentrated among certain groups of people. To assess whether or not this is the
case, we have grouped the 25 EU countries according to their levels of financial
exclusion. These were as follows (Table 7 column 2-6):
• Low level of financial exclusion (i.e. those with levels of exclusion under
three per cent) – Luxembourg, Belgium, Denmark, Netherlands, France and
Sweden.
• Medium-low level of financial exclusion (between three and eight per cent) –
Germany, Austria, the United Kingdom, Finland, Spain and Slovenia.
• Medium-high level of financial exclusion (between 12 and 28 per cent) –
Italy, Ireland, Portugal, Greece, Estonia, Czech Republic, Cyprus, Malta and
Slovakia.
• High level of financial exclusion (34 per cent and above) – Hungary, Poland,
Lithuania and Latvia.
On the whole, the same types of people had an above-average likelihood of being
financially excluded regardless of whether they lived in a country with higher or
lower levels of financial exclusion. It is plausible that as one moves towards a low
level of financial exclusion, some groups get left behind. In fact, all groups, regardless
of their circumstances, benefit greatly as one moves from high to low levels of
financial exclusion. Even so, some groups of people disproportionately experienced
financial exclusion whether they lived in a country where overall levels were high or
one where they were low. These were lone parents, young people (aged 18-25),
students and people who were unemployed (Table 7 columns 2-6).
In contrast, the disproportionate exclusion experienced in countries with high and
medium-high levels of financial exclusion by women, single people without children,
retired people, those aged over 65, people who left school at an early age and rural
dwellers, disappeared in countries where the level of financial exclusion was low. The
effect of income also reduced markedly, as did the effects of attitudes, although
people who did not know whether one could expect financial institutions to give
advice remained disproportionately affected in areas of low exclusion.
As before, we have used regression analysis to identify whether different factors seem
to drive financial exclusion depending on whether overall levels are high or low
(Table 7 columns 3-6).
This showed that the number of factors that increased the odds of being financially
excluded increased with the level of financial exclusion experienced in a country. So
in Hungary, Poland, Lithuania and Latvia, where levels were high a large number of

23/27
factors were highly significant statistically (Table 7 column 6). These included: age,
employment status, household income, geographical area and a range of attitudes.
In contrast, in the countries with the lowest levels of financial exclusion
(Luxembourg, Belgium, Denmark, Netherlands, France and Sweden) no factor
reached the higher level of significance (Table 7 column 3).

24/27
4 Conclusion
On the whole, a minority of the adult population living in the EU 15 countries is
affected by financial exclusion – two in ten lacked access to transaction banking
facilities; around three in ten had no savings and four in ten had no credit facilities,
although rather fewer (less than one in ten) reported having been refused credit. The
proportion of people lacking access to any of these three forms of financial service
was lower still – at around seven per cent of the adult population aged 18 or over. In
contrast, a third of people in the new member states were financially excluded; more
than half had no transaction account, a similar proportion have no savings and almost
three quarters had no immediate access to revolving credit.
There were, however, considerable variations in levels of financial exclusion even
across the EU 15 countries. In general, levels were lowest in the countries such as
Netherlands, Denmark, Sweden and Luxembourg where the standard of living is
universally high. They are highest in countries like Latvia, Lithuania and Poland that
had transition economies and low levels of gross domestic profit.
Financial exclusion affects some groups of people more than others and, on the whole,
similar types of people were disproportionately affected regardless of the prevailing
level of exclusion in their country. These were people living on low incomes; and
consequently those who were unemployed, lone parents caring for children full-time
and people who were unable to work through sickness or disability. In new member
states, retired people also had high levels of financial exclusion. Regression analysis
shows that these were the most significant factors statistically and had the largest
effects.
There is also evidence that financial exclusion is linked to people’s knowledge of and
exposure to financial services and that this remains statistically significant and has a
large effect even when other factors such as income and work status are controlled.
There was a link with age, with younger (EU15) and older people (new member
states) being most likely to be excluded. Single people were more likely to be
excluded than those living with a partner. In both cases, however, the regression
analysis showed that the effects were small even though they were statistically
significant. This suggests that they mediate their effects through income and work
status. Although women had slightly higher levels of financial exclusion than men,
gender was not significant in the regression – again suggesting that gender effects
may be attributed to work status and income, as people who are retired or looking
after the home full-time are disproportionately women.
It is important to note that it is not just economic circumstances and personal
characteristics that affect the propensity to be financially excluded. There is evidence
that financial exclusion is concentrated in certain communities. So living in a deprived
area increases the likelihood of being financially excluded and so, too, did living in a
rural area in new member states. This almost certainly reflects the paucity of financial
service provision in such communities. At the same time, there is evidence that people
have higher levels of financial exclusion if their friends and family are also excluded.

25/27
This suggests that where operating in a cash economy is the norm, there is much less
of an incentive to use financial services and may also explain the geographical effects.
26/27
Appendix 1: The Eurobarometer dataset
Eurobarometer is a series of surveys across the member states that have been
commissioned by the European Commission since 1973. Surveys are carried out
twice a year (each autumn and spring) and cover public opinion on specific issues,
including, periodically, questions on people’s use of and experiences with financial
services. Until 2003, the Standard Eurobarometer covered the 15 countries in
membership at that time, namely Belgium, Denmark, Germany, Greece, Italy, Spain,
France, Ireland, UK, Luxembourg, Netherlands, Portugal, Finland, Sweden and
Austria (the EU15). The last one to cover financial services was Eurobarometer 60.2
in 2003. In 2003 a Candidate Eurobarometer was held for countries that were due to
enter the European Union (the EU10). This included Cyprus, Czech Republic,
Estonia, Hungary, Latvia, Lithuania, Malta, Poland, Slovakia and Slovenia. This
survey also included questions on financial services. The most recent dataset to cover
financial services for the expanded EU membership is Eurobarometer 63.2 carried out
in 2005.
Unfortunately it was not possible to use this most recent data for several reasons.
First, it does not collect information on household income, which we know from other
research is an important indicator of financial inclusion. The earlier datasets each
contain a variable for income quartiles. Secondly, while the earlier surveys asked
respondents about their ownership of specific products in turn (with ‘yes’, ‘no’ and
‘don’t know’ responses), the 2005 survey included a single question asking
respondents to indicate which of a list of products they held. It is known that people
miss items in lists and that, consequently, a single question will identify lower levels
of product-holding than a series of questions asked about each product in turn. A
question in this format also has the additional disadvantage that it conflates ‘no’ and
‘don’t know’ replies. Consequently, Eurobarometer 63.2 overestimates the numbers
of people in the EU15 countries, without different financial products. For example
using Eurobarometer 63.2 data 33 per cent of UK adults have no access to a
transaction banking account, whereas the figure using Eurobarometer 60.2 data is 15
per cent. Moreover, we know from survey data in the UK that the level is in fact, even
lower than 15 per cent, so the data in Eurobarometer 63.2 is seriously over estimating
financial exclusion. A similar pattern exists for other EU15 countries. In contrast, in
some EU10 countries the Eurobarometer 63.2 data show a lower level of exclusion
than 2005.5 survey. This was the case in Cyprus, Czech Republic, Estonia, Lithuania,
Malta, Poland, Slovakia and Slovenia. (In Hungary and Latvia the percentages were
broadly similar between the two surveys.) This seems to suggest that people in these
counties are fairly rapidly integrating into the transaction banking system.
The analysis in this report is, therefore, based on the two earlier datasets: EU15
Standard Eurobarometer 60.2 and a EU10 Candidate Eurobarometer 2003.5.
Both cover the period November to December 2003. They each include a nationally
representative sample of around 1,000 people aged 15 or over per country (except
Malta and Cyprus where samples sixes were just 500). The national samples reflect
the respective populations in terms of age, gender, education level and marital status,
regions of the country, settlement size. When comparisons have been made across

27/27
countries, the data has been weighted to reflect proportional population sizes. Our
analysis was restricted to people aged 18 and over, as in most countries this is the age
when people can access mainstream credit.


