
Financial Stability Report
j2018
No. 4

Financial Stability Report 2018
Saudi Arabian Monetary Authority
Monetary Policy and Financial Stability Department
King Saud Bin Abdulaziz Street
P.O. Box 2992
Riyadh 11169
Kingdom of Saudi Arabia
Email: [email protected]

Table of Contents
Executive Summary ...................................................................................................................................... 1
1. Global Economic Growth ....................................................................................................................... 3
1.1 Recent Developments ............................................................................................................................. 3
1.2 Global Financial Development and Financial Stability Risks ................................................................ 5
1.3 Global Growth Outlook .......................................................................................................................... 7
2. Domestic Macro-financial Developments ............................................................................................. 8
2.1 Growth Developments ............................................................................................................................ 8
2.2 Inflation Trends ....................................................................................................................................... 8
2.3 Monetary Developments ....................................................................................................................... 11
2.3.1 Monetary Aggregates ......................................................................................................................... 11
2.3.2 Monetary policy & market conditions ............................................................................................... 12
2.4 Fiscal Developments ............................................................................................................................. 13
2.5 Labour Market Performance ................................................................................................................. 14
2.6 Current accounts ................................................................................................................................... 15
2.7 Saudi Economy Growth Outlook and Risks ......................................................................................... 15
3. Government Debt .................................................................................................................................. 17
3.1 Overview: .............................................................................................................................................. 17
3.2 Liquidity and Government Securities Issuances: .................................................................................. 18
3.3 Government Securities Coupons and Maturities................................................................................... 18
4. Real Sector Developments .................................................................................................................... 22
4.1 Publicly Listed Companies ................................................................................................................... 22
4.1.1 Profitability ........................................................................................................................................ 22
4.1.2 Liquidity ............................................................................................................................................. 23
4.1.3 Debt ratios .......................................................................................................................................... 24
4.1.4 Efficiency ratios ................................................................................................................................. 24
4.2 Developments in Saudi Arabian Parallel Market (Nomu) .................................................................... 25
4.3 Real estate ............................................................................................................................................. 26
5. Banking Sector Developments ............................................................................................................. 30
5.1 Overview ............................................................................................................................................... 30
5.2 Banking Sector Assets .......................................................................................................................... 30
5.3 Overall Credit Developments................................................................................................................ 36
5.3.1 Corporate Credit ................................................................................................................................. 36
5.3.2 Retail Credit ....................................................................................................................................... 38
5.4 Asset Quality ......................................................................................................................................... 39
5.5 Funding and Liquidity ........................................................................................................................... 41
5.6 P&L Developments ............................................................................................................................... 44
5.7 Capitalization ........................................................................................................................................ 46
6. Developments in Finance Companies ................................................................................................. 49
6.1. Finance Companies Assets ................................................................................................................... 49
6.2 Financing Assets by Sector ................................................................................................................... 49
6.3 Sources of Funds ................................................................................................................................... 49
6.4 Credit Performance of Finance Companies .......................................................................................... 50
6.5. Risk Outlook of Finance Companies .................................................................................................... 50
6.6 Finance Companies Resilience ............................................................................................................. 51
6.6.1 Profitability ........................................................................................................................................ 51
6.6.2 Leverage ............................................................................................................................................. 51
7. Developments in Insurance Sector ...................................................................................................... 54
7.1 Overview ............................................................................................................................................... 54
7.2 Market Performance .............................................................................................................................. 55
7.3 Insurance Risk ....................................................................................................................................... 56
7.3.1 Market Risks ...................................................................................................................................... 56
7.3.2 Financial Risks ................................................................................................................................. 57
7.3.3 Operation Risks and Efficiency ......................................................................................................... 58
7.3.4 Other Risks......................................................................................................................................... 59
8. Capital Market Stability ....................................................................................................................... 60
8.1 Overview ............................................................................................................................................... 60
8.2 Capital Market Activities ...................................................................................................................... 61
8.3 Authorized Persons ............................................................................................................................... 62
8.3.1 Profitability ........................................................................................................................................ 62
8.3.2 Capital Adequacy ............................................................................................................................... 63
8.3.3 Liquidity ............................................................................................................................................. 63
8.3.4 Concentration and Distribution .......................................................................................................... 63

Executive Summary
Financial Stability Report 2018 1
Executive Summary
Global trade has picked up during 2017,
which has helped propel global economic growth
forward. The positive developments in growth can be
noted in both Emerging and Advanced Economies; the
US economy especially has exhibited a robust
recovery among its peers, which has led to their
gradual monetary normalization. The growth
momentum has had a tangible impact on commodity
prices increasing relative to the previous year; oil
market developments have benefited from the positive
tailwinds stemming from growth, and the successful
commitment of the OPEC and Non-OPEC production
cut.
The Saudi Economy contracted by the end
of 2017. Despite the pick-up in global growth, Saudi
economic growth recorded a contraction of 0.86
percent in 2017, largely attributed to the oil production
cuts. The oil sector dropped by 3 percent while the
non-oil GDP increased by 1 percent. Other
macroeconomic indicators showed some slowdown by
the end of the year, in line with the overall economic
environment. Inflation recorded a negative rate of 0.8
by 2017 along with sluggish growth in money supply
at 0.2 percent.
The domestic fiscal stance showed
improvement in 2017, as the budget deficit dropped
by 23 percent in 2017 and non-oil revenues increased
by 33 percent, compared with the previous year. The
main risk facing the Saudi economy continues to be a
reversal in the oil price. Oil is still the dominant
source of the budget revenues as well as the main
source of export receipts.
Recent global markets developments and
increased volatility in oil prices have motivated a
new fiscal approach. The Saudi government has
implemented a countercyclical fiscal policy aimed at
increasing spending financed through the issuance of
debt securities. In 2017, the Debt Management Office
1 Increased to 90 percent during 2018.
(DMO) continued its’ issuance program without
influencing liquidity conditions due to enhanced
coordination between the Fiscal and Monetary
Authorities. The demand for Saudi government bonds
has been overwhelmingly strong, for both
conventional bonds and Sukuk, which signals positive
investors’ expectation about the good future of the
Saudi economy. Even with the recent issuance, Debt
to GDP ratio remains low by global standards
reflecting the ample space to continue to stimulate the
domestic economy through efficient fiscal spending.
The real sector showed recovery signs in
2017, relative to the preceding two years. The
publicly listed companies' performance in 2017 was
largely dependent on the sector as different businesses
exposure to the decline in oil prices widely varies.
Consumer related sectors seem to have been most
impacted by the economic slowdown as revenue levels
are notably smaller than years prior to the fall in oil
prices. However, most sectors appear to be back-on-
track trend wise, although continued recovery at a
similar pace would be needed for the negative effects
to completely subside. The real estate market has
suffered a decline on both commercial and residential
fronts, the decline being evident in both the volume
and value of transactions.
The banking system continued to be stable,
resilient, and profitable, despite a notable
slowdown in credit demand. In line with the sluggish
economic growth, credit demand has contracted in the
aggregate as the economy undergoes the necessary
structural adjustments. However, there have been
some positive developments in the household sector;
despite the contraction in credit in most business lines,
the retail segment was lifted by a persistent increase in
retail real estate lending. This can be partially
attributed to the decrease in real estate prices, and
SAMA’s easing of the LTV to 85 percent.1 The

Executive Summary
Financial Stability Report 2018 2
decision to use the LTV countercyclically, considered
three main factors: real estate market developments,
retail real estate loan asset quality, and size of retail
real estate loans.
Asset quality remains strong despite the
small increase in Non-Performing Loans (NPLs).
The Saudi Arabian banking system remains highly
capitalized, and has reported an improvement in
liquidity relative to 2016. Overall, the banking sector
is in a good position to tackle any further increases in
NPLs. Looking at exposures prone to develop into
problem loans, we find that the banking system
remains highly capitalized with high provision
coverage far exceeding minimum requirements.
The year of 2017 was challenging for the
insurance industry. The overall written premiums
declined slightly, but profitability was down
significantly. In Health insurance, the number of
insured lives dropped significantly, chiefly due to the
reduction in the expatriate workforce and their
dependents. Medical costs inflation continued and due
to stiff competition did not allow companies to pass on
fully the increased costs in higher rates, causing a
spike in claims-to-premium ratio and hence squeezing
profits in the health insurance business, which is the
cause of the decreased overall profitability. In motor
insurance, total written premiums decreased, due
mainly to the reduction in the number of new cars sold.
SAMA’s introduction of compulsory no-claim
discounts and instructions for more differentiated
pricing added further pressure on total motor
premiums. Despite this, the profitability of the motor
business improved, as companies resorted to seeking
greater efficiency in managing claims and expenses.
The Engineering and Property lines of business were
affected by the slowdown in the construction and in
other business activities.
Despite the above challenges, the market
remains resilient and continues to make strides
towards greater sophistication and improvements in
risk management. SAMA further strengthened the
regulatory framework through the introduction of the
Risk-Based Supervision Framework. SAMA also has
increased the rigor of its inspections and its review of
the prudential returns. Companies are underwriting
new lines of business, such as cyber risks, and there is
a growing interest in motor telematics products. The
total shareholders’ equity of insurance companies has
continued to grow as has the total number employed in
the insurance industry, bringing more capacity and
skills to the industry. Overall, the outlook for the
insurance industry is positive and it is responding well
to the economic and regulatory changes.
Finance Companies have recorded a
slowdown in credit extended. Finance Companies
overall lending contracted slightly for the year,
although there was some growth in real estate lending.
The companies in this sector on a whole appear to have
de-risked some of their exposures given the large
uptick in NPLs, which may have attributed to the
slowdown in credit extended within the finance
companies sector.
Capital Markets showed some
improvement over the past year, with an increase
in the market capitalization of listed companies.
Although major policy developments and reforms
took place during 2017, the stock market index,
market capitalization, capital market activities and
listed companies’ performance improved when
compared to 2016. There was also greater amount of
financing operations during 2017 compared to 2016,
most notably in equity. However, turnover activity
which decreased over the year could reflect some
uncertainty as the economy undergoes a structural
adjustment in response to the implemented reforms.
Investment activity has been waning as well, which
can be noted in the slowdown in the net income growth
of Authorized Person’s (APs) over the year, although
they remain highly capitalized. The CMA has also
been diligent in monitoring the required liquidity
standards to ensure the resilience of the sector and
protect investors, and APs as a whole have witnessed
some improvement in liquidity.

Global Economic Growth
Financial Stability Report 2018 3
1. Global Economic Growth
1.1 Recent Developments
Global growth momentum increased amid
optimism due to increased global demand. Global
economic output grew by 3.8 percent in 2017, an
increase from just 3.2 percent growth in the preceding
year. Moreover, revised global growth forecasts for
2018 and 2019 indicate that the global growth will
continue to increase by upwards of 0.1 percent to a
global growth of 3.9 percent. The main reason for this
increase is that key economies that make up a
significant portion of the global economy have
experienced an upsurge in year-on-year growth in
2017 in output and trade activity during 2017. Growth
amongst developed economies, namely the United
States, South Korea, Japan, and Germany, was
particularly higher than anticipated in the third quarter
of 2017. Similarly, prominent emerging market and
developing economies such as China, Brazil and South
Africa all experienced stronger third-quarter growth
than predicted. This overall rise in the global economy
can be attributed primarily to stronger trade over 2017
as seen by the significant growth in world trade (world
trade volume growth reached 4.9, WEO, 2018). Trade
activity was notable within advanced economies, and
there was also an upswing in Asian manufacturing
output stemming from the launch of several new
smartphone models (WEO, 2017).
In general, global trade growth rates
experienced considerable improvement in 2017, as
global trade volume expanded to 4.9 percent
compared to 2.5 percent in 2016. In advanced
economies, trade volume (goods and services)
increased from 2.6 percent in 2016 to 4.1 percent in
2017. There was also positive growth in Emerging
Economies, which registered 5.9 percent relative to
2016. Noticeably, this strong increase in world trade
volume can be attributed to the recovery of overall
2 The U.S. tax policy changes are anticipated to stimulate economic activities because of investment response to corporate
income tax cuts.
global demand. However, a potential trade war could
bring up some risk that may reduce the world trade
growth, which in turn will reduce the global economic
growth.
Growth in the world’s advanced
economies accelerated in 2017, expanding by 2.3
percent. The increase was partially due to a boost in
growth amongst euro area countries, where growth
increased from 1.8 percent in 2016, to 2.3 percent in
2017. The U.S. contributed to this accelerated growth
as its 2017 GDP grew by 2.3 percent, well above the
1.5 growth during 2016. Unexpected upward growth
was also pronounced in Asia; most notably in Japan,
which showed faster growth at 1.7 percent in 2017
compared to only 0.9 percent in the prior year.
However, the UK registered 1.7 percent growth, which
is lower than the previous year. On average, since all
advanced economies except for the UK registered an
increase in growth, the growth rates of these advanced
economies have reached 2.3 as seen in Chart 1.1.
Arguably, the increased momentum experienced in
2017 should carry into 2018 and 2019 considering the
stronger momentum in external demand in Advanced
Economies if world trade remains robust, with
anticipated tailwinds stemming US tax reforms2.
Growth patterns in emerging and
developing economies showed significant
differences. The IMF estimated that the emerging and
developing Asian region will remain the fastest
growing region in the world (i.e. will grow around 6.5
percent into 2018 and 2019). In 2017, growth in China
was 6.9 percent, which is still higher than the previous
year. Russia’s economic growth registered 1.5 percent
in 2017 compared to a negative growth of 0.2 percent
in 2016. The emerging and developing European
region registered faster growth (5.2 percent) and is
expected to remain strong in 2018 and to continue into

Global Economic Growth
Financial Stability Report 2018 4
2019 due to a favorable external environment, which
includes positive financial conditions and strong
export demand in the euro area (IMF FSR, 2017).3
There was also a strong recovery in the emerging and
developing Latin American region in 2017, where
growth increased from -0.7 in 2016, to 1.3 percent in
2017. Moreover, IMF projects this region to continue
to grow to 1.9 and 2.6 percent in 2018 and 2019
respectively. In this context, economic improvement
in Brazil continued as its GDP increased from -3.5 in
2016 to 1.1 percent indicating a stable recovery.
Growth in the Middle East, North Africa, Afghanistan,
and Pakistan region dropped from 4.9 to 2.5 percent
from 2016 to 2017, yet the IMF expects growth in this
region to pick up in 2018 and 2019 due to the recovery
in oil price. Despite the divergence in growth across
emerging and developing economies, they all showed
upward momentum with growth rates reaching 4.8, as
can be seen in (Chart 1.1).
Chart 1.1: World and Regional Real GDP Growth Trends
Source: Bloomberg, IMF World Economic Outlook -
January 2018 and Saudi Arabia-GASTA
Globally, inflation is picking up and
deflation risks have declined. The global inflation
rate rose in 2017 to 3.1 percent (Chart 1.2), noticeably
higher than 2.8 percent growth during the previous
year. The uptick in global inflation has primarily
stemmed from advanced economies, as inflation in
advanced economies increased from 0.8 in 2016 to 1.7
percent in 2017, inflation in emerging and developing
3 The environment may deteriorate with the trade restriction games between us and China and the potential for trade war.
countries slowed slightly from 4.3 percent in 2016 to
4.0 percent in 2017. The rise in inflation in advanced
economies can be attributed to both higher commodity
prices as seen in the increase in oil prices, and a
recovery in economic growth.
Chart 1.2: World and Regional CPI Inflation Trends
Source: Bloomberg, IMF World Economic Outlook -
January 2018 and Saudi Arabia-GASTA
The U.S. economy recovered with growth
registering an increase from 1.5 in 2016 to 2.3 in
2017. The signs of real GDP growth are measured by
the pace of monetary policy normalization, and is
expected to increase with tax reforms. According to
the IMF, tax reforms are expected to stimulate
economic activities through stirring positive
investment responses to the corporate income tax cuts.
This tax policy package positively impacts U.S growth
in the short-term. However, this policy could slow U.S
growth for several years starting in 2022 because
certain provisions within the policy are only temporary
(WEO, April 2018). Overall activities showed more
resiliency supported by a strength in housing and labor
markets. However, the subtle unwinding of the central
bank balance sheet since 2014, and gradual increasing
of the federal funds’ rate since 2016, highlights the
slow path in monetary normalization which is due to
the sluggish increase in U.S. inflation, which rose from
1.2 in 2016 to 1.8 percent in 2017.
-2
0
2
4
6
2013 2014 2015 2016 2017
%
WorldAdvanced economiesEuro areaEmerging market and developing economiesGCC
0123456789
10
2013 2014 2015 2016 2017
%
WorldAdvanced economiesEuro areaMajor advanced economies (G7)Emerging market and developing economiesMiddle East, North Africa, Afghanistan, and PakistanGCC

Global Economic Growth
Financial Stability Report 2018 5
Euro area growth expanded to 2.4 percent
in 2017— 0.6 percentage points higher compared
with the preceding year. The positive effect on the
growth stems from the quantitative easing (QE)
program.
1.2 Global Financial Development and
Financial Stability Risks
Global near-term financial stability risks
have decreased as a result of stronger global
economic recovery. Most advanced economies have
continued following accommodative monetary
policies, growth performance experienced a pickup in
most advanced economies in 2017. Emerging
economies additionally experienced a growth pickup
in 2017, reversing the slowdown in some of these
economies during the prior year. These combined
factors have contributed to a further reduction of the
near-term financial risks for 2017. However, the
medium-term vulnerabilities have increased as the
search for yield intensifies and risk appetite increases
(GFSR, April 2018). Moreover, recent normalization
of monetary policies in advanced economies would
impact financial conditions via capital flows i.e.
capital flows to EME would decrease, and those would
significant debt loads may be impacted.
On average, equity markets in 2017
continued along an upward trend, with less
volatility, even with the monetary policy
normalization in certain advanced economies. All
equity markets witnessed an improvement and
reduced volatility during 2017 except the S&P 500
Index (SPX) which experienced a brief decrease
during the 4th quarter of 2017. In fact, despite the U.S.
monetary policy normalization and the Bank of
England interest rate cut, equity markets continued to
grow, defying prior expectations. (Chart 1.3).
Chart 1.3: Global Equity Markets
Source: Bloomberg
Overall, EMEs sovereign bond yields
remained stable. In the summer of 2013, the
“announcement effect” for the tapering of the QE
program triggered a short-lived volatility within
financial markets. For instance, selected EMEs
including Brazil, Indonesia, Turkey, India, and South
Africa, saw an average rise in bond yields of 2.5
percentage points. Additionally, exchange rates
depreciated by an average of 13.5 percent, the equity
market fell by 13.75 percent, and reserves declined by
4.1 percent after the announcement for tapering of
purchases of long-term assets (IMF, 2014).
Furthermore, the Taper Tantrum was marked by a
period of higher volatility relative to the current period
in which economic conditions are more favorable and
volatility is negligible. The tapering of QE could have
had an impact on EMEs currencies, i.e. it depreciates
EMEs currencies, augmenting net export for EMEs,
and ultimately offsetting the abrupt capital inflows
through the exchange rate channel. The gradual
shrinking of the balance sheets in advanced economies
evantually had a very weak impact on the EMEs
sovereign bond yields. This minor impact can be
attributed to the relatively deeper and better resilient
financial markets as well as better macroeconomic
fundamentals. Overall, EMEs soverign bond yields
remained stable during 2017, as can be seen in (Chart
1.4).
0
50
100
150
200
250
Jan
Apr
Jul
Oct
Jan
Apr
Jul
Oct
Jan
Apr
Jul
Oct
Jan
Apr
Jul
Oct
Jan
Apr
Jul
Oct
2013 2014 2015 2016 2017
Average of SPX Index NormalizedAverage of Dax Index NormalizedAverage of Shcomp Index NormalizedAverage of UKX Index NormalizedAverage of NKY Index Normalized

Global Economic Growth
Financial Stability Report 2018 6
Chart 1.4: 10Y Sovereign Bond Yields in Emerging
Markets
Source: Bloomberg
Bond yields in some advanced economies
witnessed an increase in 2017. In the U.S. the slight
increase in yields was mainly driven by the gradual
interest rate hikes, with some expectations of inflation
picking up in the long term. However, in Japan, the
sovereign bond yields remained flat during the 2017,
as can be seen in (Chart 1.5).
Chart 1.5: 10Y Sovereign Bond Yields in Advanced
Economies
Source: Bloomberg
Volatility in foreign exchange markets has
been lower compared to the last few years, while
the USD continued to appreciate against most
currencies (Charts 1.6, 1.7). This could be attributed
to the divergence of monetary policies of major
advanced economies from the U.S.’s monetary policy
normalization, and a relative improvement in output
performance in the U.S. Thus, the appreciation of the
US dollar may help EME exports improve and offset
any outflows (in 2018) that may cause by US monetary
normalization via the intensification of the search for
yield.
Chart 1.6: US Dollar Exchange Rate against the Chinese
Yuan (Yuan/ $)
Source: Federal Reserve Bank of St. Louis
Chart 1.7: US Dollar Exchange Rate against Major
Currencies
Source: Federal Reserve Bank of St. Louis
Considerable recovery of most commodity
prices should further contribute to global financial
stability. Throughout the 2017 year, the majority of
commodity prices increased—most notably energy
products—recovering from record-low levels
registered at the end of 2015. Furthermore, a more
pronounced recovery in most industrial commodities
(including agricultural products compared to the
0
1
2
3
4
5
6
7
8
9
10
0
2
4
6
8
10
12
14
16
18
Jan
Apr
Jul
Oct
Jan
Apr
Jul
Oct
Jan
Apr
Jul
Oct
Jan
Apr
Jul
Oct
2014 2015 2016 2017
%%
Average of Brazil 10 YR
Average of India 10 YR (RHS)
Average of China 10 YR (RHS)
-0.4
-0.2
0.0
0.2
0.4
0.6
0.8
0.0
0.5
1.0
1.5
2.0
2.5
3.0
Jan
Apr
Jul
Oct
Jan
Apr
Jul
Oct
Jan
Apr
Jul
Oct
Jan
Apr
Jul
Oct
2014 2015 2016 2017
%%
Average of US 10 Yr
Average of Japan 10 Yr (RHS)
5.6
5.8
6.0
6.2
6.4
6.6
6.8
7.0
Jan
Apr
Jul
Oct
Jan
Apr
Jul
Oct
Jan
Apr
Jul
Oct
Jan
Apr
Jul
Oct
Jan
Apr
Jul
Oct
2013 2014 2015 2016 2017P
er D
oll
ar
80
85
90
95
100
105
110
115
120
125
130
0.8
0.9
1.0
1.1
1.2
1.3
1.4
1.5
Jan
May
Sep Jan
May
Sep Jan
May
Sep Jan
May
Sep Jan
May
Sep
2013 2014 2015 2016 2017
Per
Doll
ar
Per
Doll
ar
Euro Swiss Franc Japanese Yen (RHS)
Global Economic Growth
Financial Stability Report 2018 7
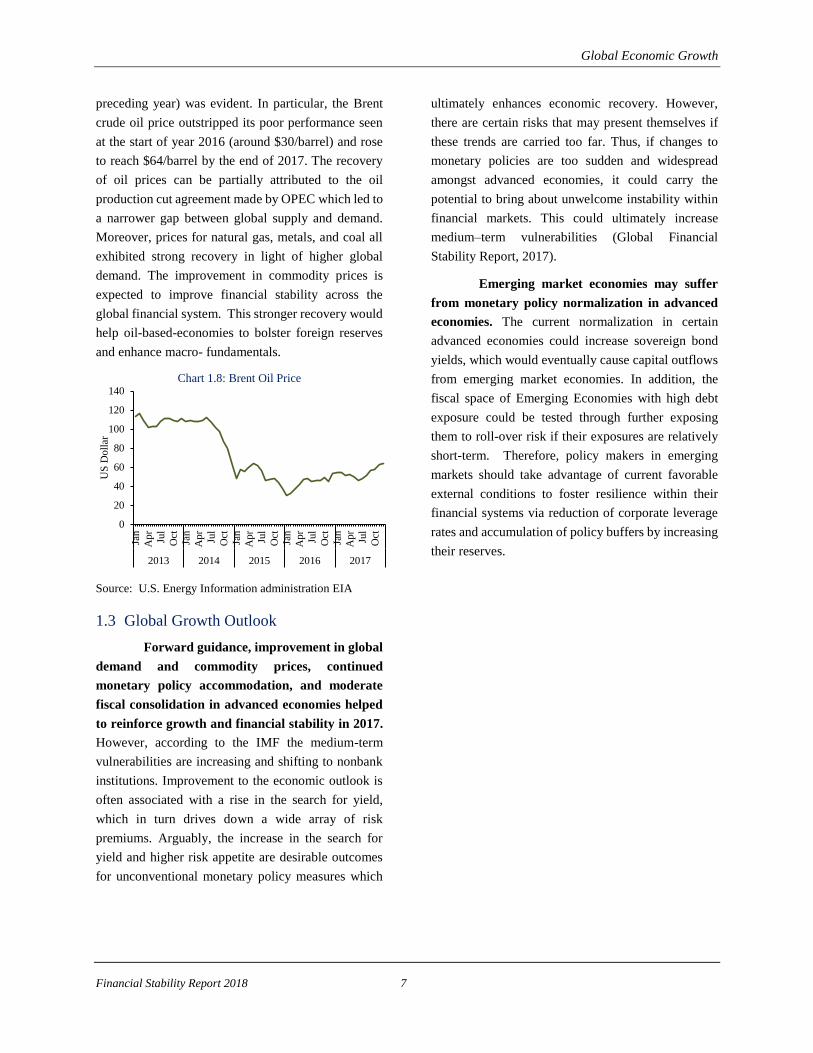
preceding year) was evident. In particular, the Brent
crude oil price outstripped its poor performance seen
at the start of year 2016 (around $30/barrel) and rose
to reach $64/barrel by the end of 2017. The recovery
of oil prices can be partially attributed to the oil
production cut agreement made by OPEC which led to
a narrower gap between global supply and demand.
Moreover, prices for natural gas, metals, and coal all
exhibited strong recovery in light of higher global
demand. The improvement in commodity prices is
expected to improve financial stability across the
global financial system. This stronger recovery would
help oil-based-economies to bolster foreign reserves
and enhance macro- fundamentals.
Chart 1.8: Brent Oil Price
Source: U.S. Energy Information administration EIA
1.3 Global Growth Outlook
Forward guidance, improvement in global
demand and commodity prices, continued
monetary policy accommodation, and moderate
fiscal consolidation in advanced economies helped
to reinforce growth and financial stability in 2017.
However, according to the IMF the medium-term
vulnerabilities are increasing and shifting to nonbank
institutions. Improvement to the economic outlook is
often associated with a rise in the search for yield,
which in turn drives down a wide array of risk
premiums. Arguably, the increase in the search for
yield and higher risk appetite are desirable outcomes
for unconventional monetary policy measures which
ultimately enhances economic recovery. However,
there are certain risks that may present themselves if
these trends are carried too far. Thus, if changes to
monetary policies are too sudden and widespread
amongst advanced economies, it could carry the
potential to bring about unwelcome instability within
financial markets. This could ultimately increase
medium–term vulnerabilities (Global Financial
Stability Report, 2017).
Emerging market economies may suffer
from monetary policy normalization in advanced
economies. The current normalization in certain
advanced economies could increase sovereign bond
yields, which would eventually cause capital outflows
from emerging market economies. In addition, the
fiscal space of Emerging Economies with high debt
exposure could be tested through further exposing
them to roll-over risk if their exposures are relatively
short-term. Therefore, policy makers in emerging
markets should take advantage of current favorable
external conditions to foster resilience within their
financial systems via reduction of corporate leverage
rates and accumulation of policy buffers by increasing
their reserves.
0
20
40
60
80
100
120
140
Jan
Apr
Jul
Oct
Jan
Apr
Jul
Oct
Jan
Apr
Jul
Oct
Jan
Apr
Jul
Oct
Jan
Apr
Jul
Oct
2013 2014 2015 2016 2017
US
Doll
ar

Domestic Macro-financial Developments
Financial Stability Report 2018 8
2. Domestic Macro-financial Developments
2.1 Growth Developments
The Saudi economy contracted by 0.86
percent during 2017, which was largely attributed
to the reduction in oil production. The contraction
was due to the country’s commitment to the OPEC
and Non-OPEC agreement which called for an oil
production cut in order to stabilize oil market. The oil
sector declined by 3 percent compared with an
increase of 3.6 percent during 2016, and an average
of 1.25 percent over the last 5 years. The non-oil
sector accounts for 56 percent of overall GDP. The
unstable oil market has led the government to take
serious actions towards diversifying the economy
away from oil dependency as a main source of
growth. In this context, the Saudi Government
launched Vision 2030 in 2016 to promote the
diversification of the economy by strengthening the
non-oil sector (Box 2.2).
Despite the contraction in Oil-GDP, the
Non-Oil GDP has improved in 2017. The Non-oil
GDP, which represents 56 percent of total GDP, grew
by 1 percent for 2017, compared to 0.23 percent in
the previous year. This is in line with the Vision 2030
objective of increasing non-oil GDP growth.
However, the non-oil growth is still significantly
lower than the 5-year average of 3.15 percent. Chart
2.1 displays growth rates broken down by sectors.
Chart 2.1: GDP Growth by Producing Sector
2.2 Inflation Trends
The economy experienced a deflationary
phase in 2017, where the CPI decreased by 0.9
percent. The dip into negative price levels has not
occurred since 2002, where there was a persistent
deflationary trend from 1996 – 2002. The previous
deflationary period was associated with low oil
prices, consequently impacting government
spending, where both factors clearly contributed to
the subdued economic growth. The recent
deflationary episode is similar to the previous one,
where the main factors contributing to the resulting
deflationary pressures were mainly due to the
economic slowdown, and to a lesser extent to the side
effects of some fiscal measures. Despite the partial
reversal of some fiscal measures, such as
reinstatement of salary benefits to public sector
employees, the measure may have possibly impacted
consumption behaviour (Chart 2.2).
Most sections of the cost of living index
witnessed a decrease over the year. Eight sections
out of 11 declined: Clothing and footwear (3
percent); Goods and services (1.0 percent);
recreation and culture (2.8 percent); transport (2
percent); furnishing, household equipment and
maintenance (1.8 percent); housing, water,
electricity, gas and other fuels (0.7 percent);
Telecommunication (1 percent) and food and
beverages (0.8 percent). The other three sections
(Hotels and restaurants, Education and Tobacco)
showed small increase during the same period except
for the tobacco section, which increased by 100
percent due to the introduction of excise taxation of
100 percent. However, the influence of the tobacco
section was limited in the overall index due to its low
weight (0.7 percent). The general drop in most
sections of the CPI comes as a result of the slowdown
in domestic demand, which may have contributed to
the sluggish non-oil growth over the past two years.
-2.00
-1.00
0.00
1.00
2.00
3.00
4.00
5.00
-4.00
-2.00
0.00
2.00
4.00
6.00
8.00
2013 2014 2015 2016 2017
%%
oil non-oil overall GDP

Domestic Macro-financial Developments
Financial Stability Report 2018 9
Chart 2.2: Inflation Trend
It is expected that inflation will increase
during 2018 due to a second wave of energy price
correction and other government measures such
as the VAT. Such increases may contribute to a
similar inflationary trend that occurred during 2016;
i.e. one round increase in prices. Therefore, it is
important to ensure the easing of deflationary
pressures through policies that stimulate economic
growth, attract investments, and increase aggregate
demand.
Taking the Point of Sales (POS) data as
indicative of consumer spending activity, it signals
a healthy trend, possibly motivated by a low-price
environment. POS transactions grew 42 percent,
while POS sales grew by 11 percent by the end of
2017. The strong growth in transactions could
possibly reflect the growing prevalence of terminals
in a variety of retail stores, which could partially
explain the consistent decline in the average value of
POS transactions (Chart 2.3). SAMA has been
playing a pivotal role in easing the use of cashless
technology, along with supporting a sustainable
fintech environment (Box 2.1).
-1.5
-1.0
-0.5
0.0
0.5
1.0
1.5
2.0
2.5
3.0
3.5
4.0
2012 2013 2014 2015 2016 2017
%
Domestic Macro-financial Developments
Financial Stability Report 2018 10
Box 2.1
Fintech Innovation in Saudi Arabia
Financial technology, or ‘fintech’, describes the use of new and disruptive technology in financial services. Fintech
has the capability to make financial products and services faster, more personalized or cheaper.
Fintech has the potential to support the development of the Saudi Arabian financial services industry including
contributing to greater financial inclusion, moving towards a cashless society and contributing to the objectives of
Vision 2030 by supporting the development of fintech SMEs and the development of fintech products and services
that help all SMEs.
However, there are also a number of risks related to the development of fintech activity including the entrance of
non-banking fintech companies that are not regulated in the same way as banks, the use of innovative technology
that may not be fully understood and the development of cross border fintech innovation, which is harder to regulate.
SAMA acknowledges the added value of fintech products and services, while taking into account the associated
risks. Therefore, SAMA has taken a dual approach to developing responsible fintech:
1. Risk based approach to testing and regulating fintech innovation.
SAMA is currently developing a Regulatory Sandbox that will provide a light touch risk based approach to testing
innovative fintech products. Through the Regulatory Sandbox, applicants are able to test innovative solutions whilst
SAMA is able to understand the risks associated with the solutions and regulate them effectively before they are
launched into the marketplace. SAMA also recognizes the importance of international co-operation in regulating
cross-border fintech activity. SAMA is therefore actively involved in building relationships with financial service
regulators in other markets and is represented on international bodies such as Financial Stability Board (FSB) and
the Committee on Payment and Market Infrastructure (CPMI). SAMA is also involved in supporting regional co-
ordination through Gulf Co-operation Council (GCC) and the Arab Monetary Fund (AMF).
2. Supporting fintechs through the development of a fintech ecosystem in Saudi Arabia.
SAMA launched Fintech Saudi in April 2018, to act as a catalyst to support the development of the fintech
ecosystem in Saudi Arabia. Fintech Saudi is developing a number of initiatives with the objective to create a culture
of collaboration by bringing together different stakeholders, build a broad understanding about fintech across Saudi
Arabia and support fintech entrepreneurship and the development of fintech products and services.
Through this dual approach, SAMA is seeking to address the challenges and hurdles faced in developing fintech
innovation in Saudi Arabia and support the transformation of Saudi Arabia into an innovative fintech hub with
a thriving and responsible fintech ecosystem driven by local and international stakeholders.
Domestic Macro-financial Developments
Financial Stability Report 2018 11
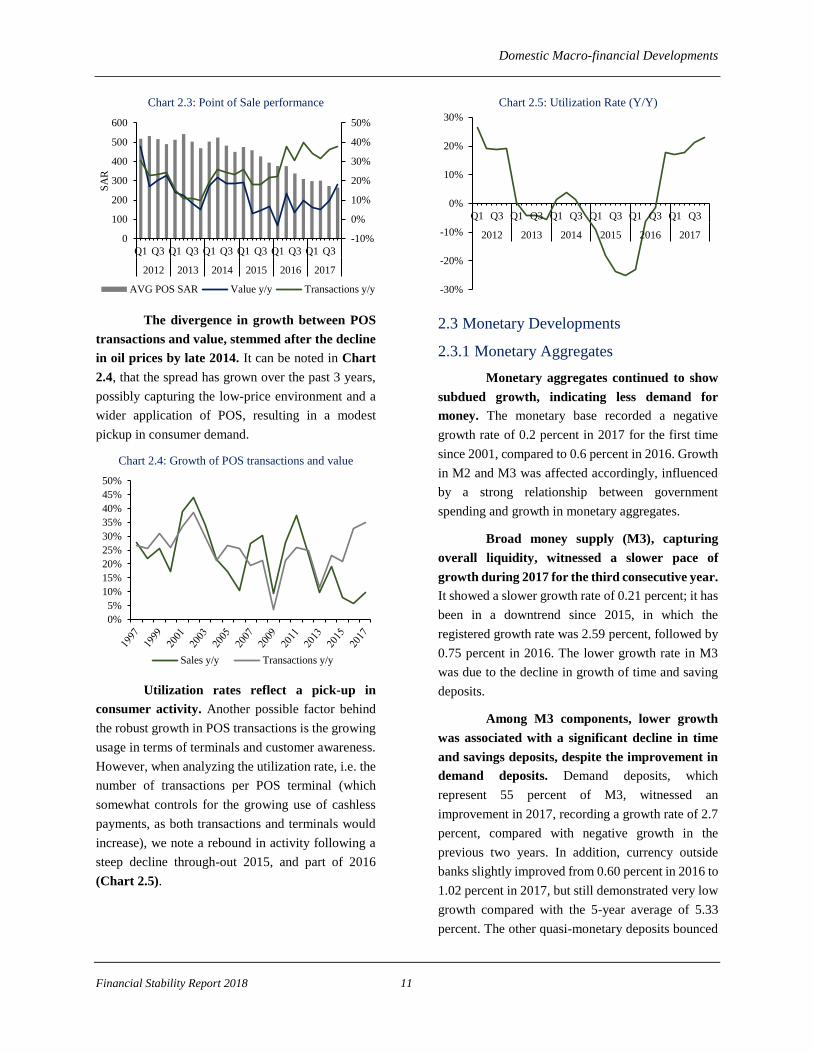
Chart 2.3: Point of Sale performance
The divergence in growth between POS
transactions and value, stemmed after the decline
in oil prices by late 2014. It can be noted in Chart
2.4, that the spread has grown over the past 3 years,
possibly capturing the low-price environment and a
wider application of POS, resulting in a modest
pickup in consumer demand.
Chart 2.4: Growth of POS transactions and value
Utilization rates reflect a pick-up in
consumer activity. Another possible factor behind
the robust growth in POS transactions is the growing
usage in terms of terminals and customer awareness.
However, when analyzing the utilization rate, i.e. the
number of transactions per POS terminal (which
somewhat controls for the growing use of cashless
payments, as both transactions and terminals would
increase), we note a rebound in activity following a
steep decline through-out 2015, and part of 2016
(Chart 2.5).
Chart 2.5: Utilization Rate (Y/Y)
2.3 Monetary Developments
2.3.1 Monetary Aggregates
Monetary aggregates continued to show
subdued growth, indicating less demand for
money. The monetary base recorded a negative
growth rate of 0.2 percent in 2017 for the first time
since 2001, compared to 0.6 percent in 2016. Growth
in M2 and M3 was affected accordingly, influenced
by a strong relationship between government
spending and growth in monetary aggregates.
Broad money supply (M3), capturing
overall liquidity, witnessed a slower pace of
growth during 2017 for the third consecutive year.
It showed a slower growth rate of 0.21 percent; it has
been in a downtrend since 2015, in which the
registered growth rate was 2.59 percent, followed by
0.75 percent in 2016. The lower growth rate in M3
was due to the decline in growth of time and saving
deposits.
Among M3 components, lower growth
was associated with a significant decline in time
and savings deposits, despite the improvement in
demand deposits. Demand deposits, which
represent 55 percent of M3, witnessed an
improvement in 2017, recording a growth rate of 2.7
percent, compared with negative growth in the
previous two years. In addition, currency outside
banks slightly improved from 0.60 percent in 2016 to
1.02 percent in 2017, but still demonstrated very low
growth compared with the 5-year average of 5.33
percent. The other quasi-monetary deposits bounced
-10%
0%
10%
20%
30%
40%
50%
0
100
200
300
400
500
600
Q1 Q3 Q1 Q3 Q1 Q3 Q1 Q3 Q1 Q3 Q1 Q3
2012 2013 2014 2015 2016 2017
SA
R
AVG POS SAR Value y/y Transactions y/y
0%
5%
10%
15%
20%
25%
30%
35%
40%
45%
50%
Sales y/y Transactions y/y
-30%
-20%
-10%
0%
10%
20%
30%
Q1 Q3 Q1 Q3 Q1 Q3 Q1 Q3 Q1 Q3 Q1 Q3
2012 2013 2014 2015 2016 2017

Domestic Macro-financial Developments
Financial Stability Report 2018 12
back in 2017 to register a 13 percent increase during
2017 compared with negative growth in the previous
year. Nonetheless, the only component of M3 that
experienced a reduction in its growth rate is time and
savings deposits, which declined by 8.9 percent in
2017 compared with 13 percent growth in 2016. The
evolution of M3 and its components over the past
five years is shown in Chart 2.6.
Chart 2.6: Growth Rates of M3 and its Components
Reverse repo transactions witnessed an
increase since 2016, which reflect the
improvement of system liquidity. As in Chart 2.7,
the reverse repo transactions were in a downward
trend since 2014 until mid-2016 and then
significantly improved. The monthly average reverse
repo stood at SAR 90 billion in 2017 compared with
SAR 43 billion in 2016. This is one indicator of the
improvement in the liquidity in the banking sector in
2017.
Chart 2.7: Reserve Repo transactions performance
2.3.2 Monetary policy & market conditions
SAMA remains committed to maintaining
its exchange rate policy. The Saudi Riyal (SAR)
has been pegged to the US Dollar (USD) since 1986
at 3.75 SAR. The current exchange rate regime suits
the economic structure and bolsters monetary and
financial stability. In terms of policy actions, SAMA
increased its reverse repo rate by an aggregate 75
basis points to reach 1.5 percent in 2017 to maintain
the country’s monetary and financial stability against
the international monetary developments.
The 3-month Saudi Arabian Interbank
Offer Rate (SAIBOR) declined in 2017, despite
the increase in SAMA’s reverse repo rate
reflecting the current positive liquidity condition.
As Chart 2.8 illustrates, the SAIBOR accelerated
during the first three quarters of 2016 and declined in
the fourth quarter and continued to decline up until
the second quarter of 2017, then it began to stabilize
around 1.8 percent. This drop in SAIBOR was due to
improved liquidity conditions in 2017 relative to
2016. One key observation is that the improvement
in liquidity and the decrease in SAIBOR occurred,
along with the continuation of government bond
issuance, which is the outcome of good coordination
between the fiscal and monetary authorities.
Chart 2.8: Saudi Interbank Offer Rate (SAIBOR)
Pressures on total foreign reserve assets
continue to decrease, partially due to
improvement in the fiscal position. In 2017, the
decline in SAMA’s total foreign reserve assets
moderated at 7.3 percent vs. 13.1 percent in 2016
(Chart 2.9). Foreign reserves totalled SAR 1.9
trillion at the end of 2017 versus SAR 2 trillion at the
0
2
4
6
8
10
12
14
-30
-20
-10
0
10
20
2013 2014 2015 2016 2017
%%
Currency Outside BanksDemand DepositsTime & Savings DepositsOther Quasi- Money DepositsM3 (RHS)
0
20
40
60
80
100
120
Jan
Apr
Jul
Oct
Jan
Apr
Jul
Oct
Jan
Apr
Jul
Oct
Jan
Apr
Jul
Oct
2014 2015 2016 2017
Bil
lion
SA
R
0.00
0.50
1.00
1.50
2.00
2.50
Q1
Q2
Q3
Q4
Q1
Q2
Q3
Q4
Q1
Q2
Q3
Q4
Q1
Q2
Q3
Q4
Q1
Q2
Q3
Q4
2013 2014 2015 2016 2017
%

Domestic Macro-financial Developments
Financial Stability Report 2018 13
end of 2016. In terms of reserve adequacy and
ranking, Saudi Arabia is among the top five countries
worldwide in foreign reserve assets. Furthermore, the
current reserve position is still at comfortable levels,
which is reflected in the high reserve adequacy levels
that is much higher than the standard reserve
adequacy norms. Finally, a combination of FX
reserves at 72 percent of GDP and the government’s
international borrowing program provides a strong
buffer to maintain the peg and meet the genuine FX
needs of the economy for the foreseeable future.
Chart 2.9: Total Reserve Assets
2.4 Fiscal Developments
The government’s fiscal consolidations
contributed to a significant improvement in the
government budget. In 2017, the government
budget deficit reached SAR 238.5 billion, around
23.3 percent lower than the previous year. It
represented approximately 8.9 percent of GDP
compared to about 12.8 percent in 2016 (Chart
2.10).
Chart 2.10: Fiscal Developments
Revenues have increased from the oil and
non-oil sectors alike. Total revenues reached SAR
691.5 billion in 2017, an increase of 33.1 percent
compared to the previous year. Despite the cut in oil
production, oil revenues witnessed an increase to
SAR 435.9 billion. Non-oil revenues grew
significantly as well and reached SAR 255.6 billion.
Tax revenues were around SAR 87 billion in 2017
and increased by 7 percent from the previous year. In
general, the government has been successful in
increasing revenues from non-oil resources. There
has been a good progress to further realize revenues
diversification, nonetheless oil revenues continue to
remain elevated at 63 percent of total revenues,
though down from 90 percent in 2013 (Chart 2.11).
Government expenditures increased by
12.0 percent to reach SAR 930 billion. Current
expenditures grew by 10.9 percent, reaching SAR
772.2 billion in 2017. It accounted approximately for
80 percent of total government expenditures.
Because of the relatively lower capital spending,
current expenditures account for a higher portion in
2017. Salary expenses are the main component of
current expenditures (59 percent); the government
has successfully limited the increase of this
component for 2017 and has a clear objective of
making the private sector the main driver of
employment rather than the government sector.
Capital expenditures reached SAR 180 billion by the
end of 2017, demonstrating growth of 34 percent
compared to the previous year but remains below
recent historical levels.
Chart 2.11: Revenues and Expenditures
-20%
-15%
-10%
-5%
0%
5%
10%
15%
0.0
0.5
1.0
1.5
2.0
2.5
3.0
2013 2014 2015 2016 2017
Tri
llio
n S
AR
Total Reserves Assets Growth Rate
-20
-10
0
10
20
-600
-400
-200
0
200
400
600
2012 2013 2014 2015 2016 2017
%
Bil
lion
SA
R
Deficit/ SurplusOutstanding Public DebtDebt-to GDP (RHS) Deficit/Surplus to GDP (RHS)
0%
20%
40%
60%
80%
100%
0
500,000
1,000,000
1,500,000
2013 2014 2015 2016 2017
Mil
lion
SA
R
Expenditure
Revenue
% of oil revenue in total revenue
% of current expenditure in total expenditure

Domestic Macro-financial Developments
Financial Stability Report 2018 14
It is also useful to shed light on the
implemented fiscal consolidation measures.
During 2017, the government applied some
measures—such as the dependant’s fees and the
Saudization of the telecom sector—in order to lessen
the fiscal burden on the government. Further fiscal
and structural reforms are expected to contribute
significantly to boosting fiscal balance. Such reforms
include the value-added tax 4in 2018 and a second
round of energy and water price alignment during
2018-2020. They would contribute to reducing the
downward pressures on the government’s fiscal
balance. It should be noted, the Ministry of Finance
announced that the fiscal balance target was
postponed to 2023. By postponing the balancing of
the budget, we believe it will allow for a more
gradual transmission that should support the
economy.
The government continued to finance its
deficit efficiently. The government financed its
deficit through a combined approach of issuing debt
and withdrawing from reserves. In addition, the
government diversified its debt across markets and
categories. It is important to mention that all
issuances received high attention from investors; as
they were oversubscribed by at least 3 times, which
reflects confidence in the Saudi economy.
Effective debt management is essential not
only for the sustainability of the economy, but also
for financial stability. The establishment of Debt
Management Office (DMO) in 2016 was a step in the
right direction to manage debt issuance at home and
abroad. The DMO is fully dedicated to exploit
resources for issuing debt in a cost-effective manner
and support the development of a secondary bond
market to create liquidity and demand for SAR
denominated debt and sukuk.
4 Implemented January 1st, 2018
2.5 Labour Market Performance
Unemployment continues to be a
challenge to the Saudi economy. The
unemployment rate for Saudis in Q4 2017 increased
to 12.8 percent. This increase in overall
unemployment was only associated with an increase
in unemployment among Saudi nationals. The
unemployment rate for males at 7.4 percent, which is
significantly lower than the female unemployment of
32.7 percent. This might reflect the limited number
of jobs created in the private sector due to sluggish
economic growth. There has been a noteworthy
slowdown in employment among Saudis. This is
expected to be temporary given that the country is in
a transitional period with various labour initiatives,
which aim to reduce unemployment among Saudis in
upcoming years. These initiatives are a continuation
of the labour market reforms that have been
implemented over the past years, aimed at attracting
more Saudis into the private sector by enhancing
their work environment in this sector, and
augmenting the skillset of potential Saudi employees.
Chart 2.12 displays the overall unemployment rate
as well as unemployment rates among Saudis and
foreigners. There have also been significant efforts to
reduce the female unemployment rate by both public
and private sectors measures.
Chart 2.12: Unemployment Rate
Source: General Authority for Statistics
0
2
4
6
8
10
12
14
2012 2013 2014 2015 2016 2017
%
Saudi Non-Saudi Total

Domestic Macro-financial Developments
Financial Stability Report 2018 15
2.6 Current accounts
The current account registered a surplus
during 2017, reflecting the rebound in oil prices
despite the cut in oil production. Preliminary data
suggest that there could be a surplus of SAR 57.1
billion, 2.2 percent of GDP, compared with a deficit
in 2016 and 2015 of 3.7 percent and 8.7 percent of
GDP, respectively. However, this improvement is
less than the five-year average surplus, which was
SAR 107 billion (Chart 2.12). The improvement in
the current account is primarily driven by two
factors: The first factor is the rebound in oil prices
despite the decline in crude oil exports. Total oil
export receipts increased to SAR 638 billion in 2017,
demonstrating growth of 25 percent. The second is
the drop in import prices, which recorded SAR 504
billion in 2017, representing a drop of 4 percent
compared with 2016. The decline in imports could
mainly be attributed to a slowdown in local demand,
as can be noted in the Real Sector section with most
corporates reporting declines in revenue over the past
two years.
Chart 2.13: Current Account
2.7 Saudi Economy Growth Outlook and
Risks
Economic forecasts point to an optimistic
outlook for the Saudi Economy. It is expected to
grow by 1.7 percent during 2018, as per estimates
from the IMF. Potential growth in the non-oil and oil
sectors alike is presumed to contribute to this
expected growth. In the oil sector, oil prices have
been in an upward trend since mid-2017 and are
expected to increase, due to the rise in global oil
demand and the decrease in oil supply in some oil-
exporting countries. For the non-oil sector, the
potential growth is contributed to the expansionary
government’s budget for 2018 and government
initiatives to boost non-oil sector growth.
The main challenge facing Saudi Arabia in
the upcoming year comes primarily from the
global oil market. Oil GDP sector represents around
43 percent of the total GDP and accounts for more
than 63 percent of budget revenue. Until the
government objectives of diversifying the economy
away from oil are met, the economy remains
vulnerable to fluctuations in oil prices.
The implementation of key economic
reforms during this period could bear some
temporary drag on economic growth over the
short term. The government is aware of these risks
and has introduced some initiatives to minimise the
negative impacts, especially plans targeted at low-
and middle-income households, such as the citizen's
account programme.
On balance, the Saudi economy can cope
with cyclical shocks, given the comfortable level of
reserve adequacy, low public debt/GDP and a
more disciplined approach to fiscal operations.
Saudi Arabia still maintains a high level of
accumulated foreign reserves and a low public debt
despite the withdrawals from the reserves and the rise
of public debt over the past two years, reflecting good
fiscal space for further budget financing. Therefore,
fiscal consolidation efforts can help nudge fiscal
planning in a manner that is both conducive to
economic growth and sustainable in the long-run.
The government’s budget balance programme made
a successful start by reducing the deficit in 2017, and
is expected to achieve its goal of a balanced budget
by 2023.
-15%
-10%
-5%
0%
5%
10%
15%
20%
-300
-200
-100
0
100
200
300
400
500
600
2013 2014 2015 2016 2017
Bil
lion
S
AR
Current Account
Current account as % of GDP

Domestic Macro-financial Developments
Financial Stability Report 2018 16
Box 2.2
Recent Developments toward VISON 2030
In 2016, Saudi Arabia launched Vision 2030, an ambitious plan for shifting the -dependent economy to a more
diversified economy. One of several initiatives is the National Transformation Programme (NTP) 2020, aiming to
accomplish various social and economic goals. Select government entities, based on the NTP 2020, has a key role
in diversifying the economy through the outlined strategies, in which all contribute to maintaining a sustainable and
more resilient economy. To pursue these goals, the government has been implementing a series of fiscal and
structural reforms since 2016 for a sustainable economy. The most recent developments are as follows:
Excise taxes on tobacco and carbonated energy were introduced in June 2017, with a rate of 100 percent
for tobacco and 50percent for carbonated drinks. The effect of excise duty/taxes on inflation was very
limited due to their small influence in the basket of the general price index.
In July 2017, expat levy was introduced on dependents of expatriate workers in the private sector,
starting from SAR 100 per person per month in 2017 to progressively rising by SAR 100 each year
until 2020. This reform has increased non-oil revenue and the cost of employing non-Saudis. The
flipside of it is seen in falling housing rents as expat families are leaving the country.
In January 2018, Value Added Tax (VAT) was introduced as part of GCC agreement. The 5 percent
VAT is applied on most goods and services, which will boost non-oil revenue.
In January 2018, energy price reforms were further phased-in as a part of a gradual implementation.
The government launched the “citizen’s account” program, which is designed to protect the income of
middle, and low-income groups form the side effects of higher energy prices. The first distribution was
in December 2017, totalling SAR 2 billion.
The Financial Sector Development Program was launched in 2018 and aims to promote financial
awareness, increase savings and inclusiveness while promoting financial stability.
In December 2017, the government announced a package of SAR 72 billion to stimulate growth in the
private sector. The package consists of 16 initiatives for several sectors such Housing, Small and
Medium-sized Enterprises (SMEs) and exports. In May 2018, the Quality of life program 2020 has been
launched to improve the quality of lifestyle and to build a society in which individuals enjoy a balanced
lifestyle.

Government Debt
Financial Stability Report 2018 17
3. Government Debt
3.1 Overview:
Government securities are debt
instruments issued by the government to meet its
financing needs. These instruments are
characterized by very low credit risk as it is backed
by the Saudi government. Hence, it is considered the
safest investment, and creates a benchmark in which
riskier securities may be compared to. Saudi Arabia
has long been familiar with debt issuance, dating
back to 1988 when a prolonged oil market weakness
in the 1980s caused persistent budget deficits. In
1999, outstanding government debt/GDP exceeded
100 percent, indicating the severity of oil market
volatility for public finances. SAMA back then
managed debt on behalf of the government on a
principal/agent relationship basis. Debt issuance was
suspended in 2007 given market conditions and fiscal
position.
In 2015, the Ministry of Finance
established the Debt Management Office (DMO).
The DMO’s main objective is to raise debt to finance
planned and unexpected budget deficits and to
manage central government debt portfolio all at the
best possible costs and within acceptable risk
parameters. To achieve its objectives, the DMO
developed a 5-year Medium Term Debt Strategy
(MTDS) and an Annual Borrowing Plan (ABP).
The Saudi Government resumed its debt
issuances in 2015 to finance the budget deficit
after eight years of suspension. During the period
from 2007 to 2014, the government suspended its
debt issuances and decided to pay down debt because
of the improved fiscal position. Since mid-2014,
volatility in the oil market affected the fiscal balance,
resulting in government debt issuance. (Chart 3.1)
shows the size of the local issuance since 2015.
5 Tadawul only has data on registered and listed government securities.
Chart 3.1: Government Local Debt Issuance
Source: Tadawul5
The yield curve, which plots the yield to
maturity for various tenors, also reflect economic
activity. The slope, shape and level of yield curve
may vary overtime; the upward sloping yield curve
represented in (Chart 3.2) reflect market expectation
of the future, indicating a rise in long-term interest
rates. A downward sloping or inverted yield curve
tends to reflect some pessimism towards future
economic growth. The government bond yield curve
is a guidepost for pricing quasi government and
corporate bonds. (Chart 3.2). Having a complete
government yield curve is imperative for the
development of the secondary market as it can be
used as a benchmark to measure the general direction
and performance of the market, as well as to compare
prices and yields of non-sovereign domestic
securities.
Chart 3.2: KSA vs. U.S. Yield Curve as of May 16th, 2018
Source: Reuters
0
20,000
40,000
60,000
80,000
100,000
120,000
2015 2016 2017
Millions SAR
1
2
3
4
5
3y 5y 7y 10y 30y
%
US Yield Curve KSA yield curve

Government Debt
Financial Stability Report 2018 18
3.2 Liquidity and Government Securities
Issuances:
Although the issuance continued in 2017,
the market did not experience any liquidity stress.
As captured in (Chart 3.3), the SAIBOR was stable
during the year, and reverse repo levels have
improved to 112 billion SAR. The improvement in
liquidity is further enhanced by strengthening
communication between fiscal authority and
monetary authority to ensure stability of liquidity
conditions. The two authorities engage in transparent
communication to gauge domestic liquidity levels
before the issuance of any domestic debt. Issuance
of government bonds aimed at financing government
spending should not have a significant impact on
liquidity conditions, as liquidity absorbed tends to
circulate back to the financial system through
government payments.
Chart 3.3: SAIBOR and Liquidity
Domestic and international demand for
government bonds is very strong and
overwhelmingly oversubscribed. (Chart 3.4)
shows the total outstanding local and international
debt. High demand reflects investors’ confidence in
government’s macroeconomic policies and structural
reforms. The total issuance as per registered
government securities on Tadawul was 83 billion
SAR in 2017, slightly lower relative to 2016, which
was around 103 billion SAR. (Chart 3.4). The
international issuance has a positive impact on
liquidity in the local market to the extent of capital
inflow for the following two main reasons:
1. Liquidity is not obtained from the local market.
2. International Issuance is usually injected into the
local market through government payments.
The balance between domestic and international
issuances is important to strike, as too much domestic
issuance could have an impact on liquidity if it is not
injected back into the system.
Chart 3.4: Total outstanding of Local and International
Issuance
Source: Tadawul
3.3 Government Securities Coupons and
Maturities.
There are two main types of pricing of
government securities, fixed or float. Government
debt includes both fixed and floating government
securities (Chart 3.5). The fixed coupon payments
are determined prior to the purchase of the security
and does not change over time. The floating coupon
payments, are linked to a specific benchmark,
therefore every payment varies depending on the
price of the benchmark. Moreover, the floating
coupons were issued in 2016, and suspended
thereafter. As at year-end 2017, 92 billion of
government local outstanding debt, in addition to
SAR 37.5 billion of international debt is priced with
0.5
0.7
0.9
1.1
1.3
1.5
1.7
1.9
2.1
2.3
2.5
0
20,000
40,000
60,000
80,000
100,000
120,000
140,000
Jan-2
015
Apr-
20
15
Jul-
20
15
Oct
-2015
Jan-2
016
Apr-
20
16
Jul-
20
16
Oct
-2016
Jan-2
017
Apr-
20
17
Jul-
20
17
Oct
-2017
%Millions
Banks Daily excess liquidity SAIBOR
100%67%
59%
33%
41%
0
100
200
300
400
500
2015 2016 2017
Billion
SAR
Domestic International

Government Debt
Financial Stability Report 2018 19
floating coupons, which represent 29 percent of total
issuance versus 71 percent of debt issuance with
fixed rate.
Chart 3.5: Fixed and Floating Issuance
Source: DMO
While floating rate notes tend to be more
attractive to liability sensitive investors (i.e.
banks), however, it may pose challenges to fiscal
policy in an increasing interest rate environment.
The floating issuance is very attractive to investors as
they are naturally hedged against interest rate risks.
However, the government will bear market risk
instead of the investors. In addition, it does not create
an effective risk-free yield curve as the pricing is
linked to an interbank benchmark.
Unlike 2016, government debt issued in
2017 carried fixed coupon rates. The shift to fixed
rate coupons, have effectively decreased the
proportion of floating rate notes. Furthermore, this
step helps limit the exposure of fiscal expenditures to
interest rate risk, as well as it helps develop the
secondary market by establishing a risk-free yield
curve. The maturity date of the government bonds is
of a high importance for the fiscal authority. On the
date of maturity, the government must pay back the
principle on the bonds. Therefore, it could represent
a notable cost on the fiscal budget. It is important to
diversify the maturities overtime to reduce the cost of
principle on the fiscal budget. However, data shows
6 Listed Tadawul securities as of end of 2017.
that there is a maturity concentration in the debt
securities in 2026, with around SAR 90 billion or 37
percent of the total issuance maturing in that year
(Chart 3.6).6 That is equivalent to 12 percent of 2018
government revenue. On the other hand, the year of
2021 is going to be the lowest with 3.2 billion
maturities. The lack of a clear well drafted strategy to
contain this issue could cause a pressure on the
government budget.
Chart 3.6: Government Securities Maturities
Source: Tadawul, MoF
The cost of borrowing has increased in
2017. (Chart 3.7). The pricing of debt is influenced
by domestic monetary conditions and international
rates, particularly U.S. rates, due to the currency peg
framework between the Saudi Riyal and the U.S.
Dollar. Given the recent monetary policy
developments, the interest rate increased in the U.S,
was reflected by an increase in cost of borrowing in
the Saudi market. In 2017, the average 5-year bond
yield was around 2.83 percent compared to 1.93
percent in 2016 (Chart 3.7).
71
29
0
20
40
60
80
100
120%
Fixed Issuance Floating Issuance
0.0%
2.0%
4.0%
6.0%
8.0%
10.0%
12.0%
14.0%
0
10,000
20,000
30,000
40,000
50,000
60,000
70,000
80,000
90,000
100,000
2020 2022 2024 2026
Millions
Amount
Percentage to 2018 Government Revenue

Government Debt
Financial Stability Report 2018 20
Chart 3.7: 5 Years Bonds Average Return
Source: Tadawul
3.4 Government Debt Effects on the Saudi
Economy.
The Saudi economy is highly dependent
on oil revenue, however non-oil revenue
diversification has shown some improvement. As
the private sector contribution to GDP is still a
function of government spending, Ministry of
Finance conducts a countercyclical fiscal policy
increasing spending, financed by the issuance of debt
or the drawdowns from the government reserves, to
stimulate the private sector and improve the
performance of the economy.
The Debt to GDP ratio continues to
increase, yet remains relatively low. Saudi Arabia’s
rationalization of spending and a debt ceiling
guideline of about 30 percent of GDP bodes well for
debt sustainability and economic activity (Chart
3.8). The ratio helps compare the amount of leverage
7 Debt to Nominal GDP
of debt by normalizing it to the countries’ domestic
production capacity. Despite the uptick in issuances,
Saudi Arabia has started from low levels after
consistently paying down its debt. In 2017, the ratio
in Saudi Arabia is 17 percent7 it is considered low
compared to other countries globally (Chart 3.8).
According to the IMF, the G7 major economies debt
to GDP is averaged around 119 percent while
emerging and developing Asian economies averaged
around 51 percent. This clearly indicates the ample
fiscal space to continue to stimulate the domestic
economy through efficient and expansionary fiscal
spending. Despite the ample room to increase debt,
the fiscal authority had placed a debt ceiling of 30
percent, which helps ensure that funds raised through
issuances are efficiently utilized.
Chart 3.8: Debt to GDP Ratio
Source: IMF
0.00%
0.50%
1.00%
1.50%
2.00%
2.50%
3.00%
2015 2016 2017
5 Years Maturity Average Return
0%
20%
40%
60%
80%
100%
120%
140%

Government Debt
Financial Stability Report 2018 21
Box 3.1 Debt Management Office
The Debt Management Office (“DMO”) was established in the fourth quarter of 2015 to secure Kingdom of Saudi
Arabia’s financing needs with the best financing costs in the short, medium, and long term under an acceptable
degree of risk in compliance with the financial policies of the fiscal authority, and to maintain Kingdom’s ability
to access different international financial markets at fair pricing.
DMO’s main responsibilities include the following:
Managing Government Direct and Contingent liabilities and all of its related operations.
Developing a strategy for the public debt (“Medium Term Debt Strategy” or “MTDS”) and an Annual
Debt Borrowing Plan (“ABP”).
Arranging, leading and issuing public debt in all forms (both local and international borrowing),
refinancing, restructuring, and managing the Ministry of Finance’s guarantees to support the Kingdom’s
public financing efficiently.
Developing legal frameworks, governance and risk management policies related to the public debt
management.
Developing internal policies of the DMO and its management structure.
In addition to the conventional bond issuance, the DMO is also committed to the sukuk market. The DMO has
established local sukuk program denominated in SAR. Additionally, an international sukuk issuance program
was established as well. As of 2017, total debt issued under the local sukuk program amounted to SAR 58.5
billion; moreover, total debt issued under the international sukuk program amounted to USD 9 billion.

Real Sector Developments
Financial Stability Report 2018 22
4. Real Sector Developments
4.1 Publicly Listed Companies
Corporate activities offer key insights
into the impact of the recent economic headwinds
on the real sector. To further assess such impact on
the stability of the financial system, we utilize the
financial statements of publicly listed companies.
The Saudi stock market consists of 181 companies
with a market capitalization of 1,689 billion riyals
divided into 20 sectors. Materials sector holds the
largest share in terms of market value with 33
percent, followed by the banking and
telecommunication sectors with 28 percent and 9
percent respectively (Chart 4.1). The analysis will
be conducted on a sectoral basis and will take into
account the key financial ratios that capture
developments in terms of liquidity, debt, efficiency,
and profitability. The sample set of companies will
then be assessed over the past five years in order to
extrapolate the financial soundness of the market.
Chart 4.1: Sectors Share by Market Value
Source: TADAWUL
4.1.1 Profitability
Selected sectors appear to be more
responsive to the sluggish economic conditions
with reduced levels of profitability by 2017. To
assess the overall sectoral profitability, we will
consider two ratios, namely return on assets (ROA)
and return on equity (ROE). Return on assets
measures corporate efficiency in asset utilization; the
higher ROA is the more efficient the sector would be.
As far as the return on equity is concerned, it
measures the level of income against the
shareholders’ investments rather than total assets,
which is captured in the ROA. In other words, it takes
into account the targeted-level of financial leverage.
In cases where we notice a significant discrepancy
between these two ratios, it is important to assess the
liquidity and coverage ratios as it is a sign of high
amounts of debt.
Profitability measures indicate a clear
decrease in profitability across all sectors over the
past few years relative to years prior to the drop in
oil prices. The lower levels of profitability reflect the
prevalence of oil induced shocks on the real
economy. However, a sign of recovery can be noted
in some sectors such as materials,
telecommunication, energy and utilities by 2017.
While sectors like transportation, consumer services,
retail and real estate have not found their way to an
upward trend as far as ROA and ROE ratios are
concerned (Chart 4.2). This is partially due to the
implementation of value added tax (VAT) and
removing government subsidies, which impacted
disposable income. A possible risk can come from
sectors with negative profitability ratios, such as
consumer durables, capital goods and media,
although the latter two are on an upward trend. The
risk for sectors with weak profits would be
exacerbated if these sectors were to witness a
continuation of negative profitability. However,
Chart 4.2 indicates that there is an improvement in
these sectors. In addition, these sectors are coupled
Materials
Banking
Telecommunication
Real Estate
Utilities
Food, beverage &
tobaccoInsurance
Diversified
financialsEnergy
Healthcare
Retailing
Other
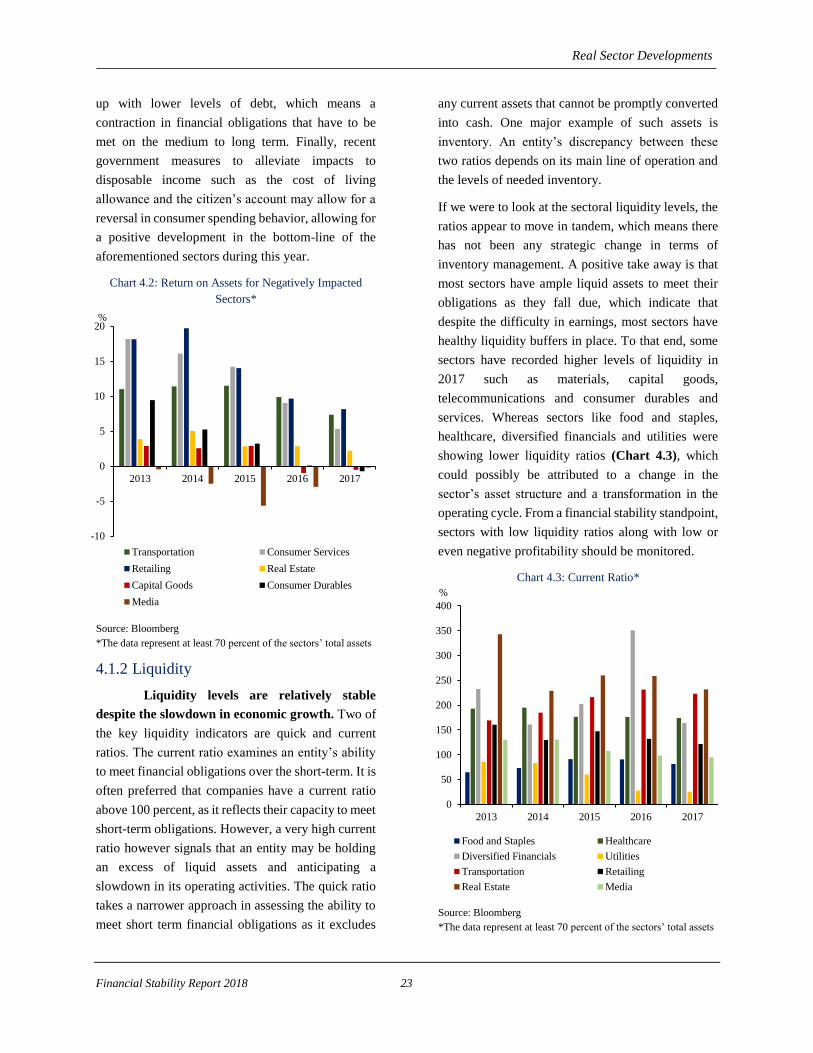
Real Sector Developments
Financial Stability Report 2018 23
up with lower levels of debt, which means a
contraction in financial obligations that have to be
met on the medium to long term. Finally, recent
government measures to alleviate impacts to
disposable income such as the cost of living
allowance and the citizen’s account may allow for a
reversal in consumer spending behavior, allowing for
a positive development in the bottom-line of the
aforementioned sectors during this year.
Chart 4.2: Return on Assets for Negatively Impacted
Sectors*
Source: Bloomberg
*The data represent at least 70 percent of the sectors’ total assets
4.1.2 Liquidity
Liquidity levels are relatively stable
despite the slowdown in economic growth. Two of
the key liquidity indicators are quick and current
ratios. The current ratio examines an entity’s ability
to meet financial obligations over the short-term. It is
often preferred that companies have a current ratio
above 100 percent, as it reflects their capacity to meet
short-term obligations. However, a very high current
ratio however signals that an entity may be holding
an excess of liquid assets and anticipating a
slowdown in its operating activities. The quick ratio
takes a narrower approach in assessing the ability to
meet short term financial obligations as it excludes
any current assets that cannot be promptly converted
into cash. One major example of such assets is
inventory. An entity’s discrepancy between these
two ratios depends on its main line of operation and
the levels of needed inventory.
If we were to look at the sectoral liquidity levels, the
ratios appear to move in tandem, which means there
has not been any strategic change in terms of
inventory management. A positive take away is that
most sectors have ample liquid assets to meet their
obligations as they fall due, which indicate that
despite the difficulty in earnings, most sectors have
healthy liquidity buffers in place. To that end, some
sectors have recorded higher levels of liquidity in
2017 such as materials, capital goods,
telecommunications and consumer durables and
services. Whereas sectors like food and staples,
healthcare, diversified financials and utilities were
showing lower liquidity ratios (Chart 4.3), which
could possibly be attributed to a change in the
sector’s asset structure and a transformation in the
operating cycle. From a financial stability standpoint,
sectors with low liquidity ratios along with low or
even negative profitability should be monitored.
Chart 4.3: Current Ratio*
Source: Bloomberg
*The data represent at least 70 percent of the sectors’ total assets
-10
-5
0
5
10
15
20
2013 2014 2015 2016 2017
%
Transportation Consumer Services
Retailing Real Estate
Capital Goods Consumer Durables
Media
0
50
100
150
200
250
300
350
400
2013 2014 2015 2016 2017
%
Food and Staples Healthcare
Diversified Financials Utilities
Transportation Retailing
Real Estate Media

Real Sector Developments
Financial Stability Report 2018 24
4.1.3 Debt ratios
Debt levels appear to have dropped for
most sectors in 2017. For debt level assessment, we
will use debt to equity and debt to assets ratios. Debt
to asset ratio assesses how much of an entity’s total
assets are financed through debt. High levels of
financial leverage raise the overall financial risk and
places extra burden on the sector in meeting its
financial obligations. Low levels of debt tend to be
preferable by both shareholders and regulators as
excessive credit growth is mitigated which lowers the
risk exposure, as long as it does not hinder the sectors
growth.
When assessing the sectoral debt ratios we notice that
most sectors have had lower debt in 2017, which is
in line with the credit trends exhibited from both
banking and finance companies. However, some
sectors have higher debt ratios by 2017 are consumer
services, healthcare, diversified financials and real
estate (Chart 4.4). Despite the slightly elevated
levels of debt, they remain comfortably low at below
30 percent. Lower sectoral financial leverage is
preferable as it weakens the ties to the banking and
financial sectors, However, lower debt may constrain
firms’ ability to reach higher levels of growth and
breakout from the most recent downturn. Most
certainly, debt ratios shall not be analyzed in vacuum,
and as we comprehensively observe the sectors’
financial conditions, it is clear that a continuation of
higher debt with dropping profitability may increase
the likelihood of the risk of default.
Chart 4.4: Debt to Assets*
Source: Bloomberg
*The data represent at least 70percent of the sectors’ total assets
4.1.4 Efficiency ratios
Given the reduced economic activity,
efficiency measures have dropped for most sectors
by 2017. For efficiency indicators, we will use two
indicators, namely asset turnover and inventory
turnover. The asset turnover ratio shows how a firm
uses their total assets to generate revenues, a higher
ratio is considered as an indication of better
efficiency in asset utilization. The inventory turnover
ratio indicates the rate by which an entity depletes
their inventory in ordinary circumstances. This ratio
is usually kept around the industry average since the
need of inventory depends on the business line. It’s
also important to mention that the interpretation may
not be accurate in abnormal economic conditions.
We will compare inventory turnover ratios in 2017
with the 2013-2016 average in order to get a better
industry benchmark.
Based on the previous five years, asset
turnover ratio in 2017 appears to have dropped
across the board except for media and real estate.
Sectors with the most significant drop were
consumer services, consumer durables, energy and
capital goods with 61 percent, 30 percent, 28 percent
and 23 percent respectively. As for inventory
turnover ratio, our benchmark is the 2013-2016
average. Sectors with the highest deviation from the
average (whether positive or negative deviation) are
considered the ones facing challenges with efficient
inventory management. A drop is recorded in
inventory levels by 66 percent and 46 percent in
consumer services and real estate sector respectively.
Whereas the highest positive deviation were in
diversified financials, utilities and media with 108
percent, 59 percent and 51 percent, respectively
Although there has been a sign of recovery in the
overall performance of the publicly traded
companies, most financial ratios in 2017 are still well
below the arithmetic average of the four preceding
years. Yet, it is anticipated that a full recovery is
expected in the coming years with the government’s
various plans and initiatives aiming to support the
economy.
0
5
10
15
20
25
30
2013 2014 2015 2016 2017
%
Consumer Services Healthcare
Diversified Financials Real Estate

Real Sector Developments
Financial Stability Report 2018 25
4.2 Developments in Saudi Arabian
Parallel Market (Nomu)
Nomu is an alternative stock exchange
designed to meet the listing need of small and
medium enterprises and other businesses in the
Kingdom. Listing requirements for Nomu are less
strict than TASI regulations (Box 8.1). Even though
the Nomu market has looser listing and disclosure
requirements, it is limited to Qualified investors that
are determined by the CMA, which should promote
sound investment decisions and lessen market
inefficiencies. The introduction of this market is
deemed to have a positive contribution to the
development of the overall capital market by
facilitating a new financing channel.
The Parallel market was launched in February 26,
2017 with seven companies initially listed and by the
end of the year, there were nine listed companies. By
the end of 2017, the breakdown of the listed
companies market share by sector as shown in Chart
4.5. As of the end of 2017, the total market value of
companies listed in Nomu market equals to SAR 2.26
billion. It is worth noting that as at the end of 2017
most stocks were trading below their listing price
resulting in 29 percent aggregate loss in market
capitalization, which is equivalent to SAR 919
million.
Chart 4.5: Market Share
Source: TADAWUL
The analysis will be on a sectoral basis and will take
into account the main financial ratios over the three
years preceding 2017 in order to extrapolate the
financial soundness of Nomu. The following analysis
will compare 2017 ratios with the industry average
for the period 2014-2016.
All sectors witnessed a downward trend
in profitability, due to the sluggish economic
growth over the most recent period (Chart 4.6).
The reduced profitability can be linked to the new
structural changes and the imposition of the value-
added-tax as well as the expatriate levy.
Chart 4.6: Return on Assets
Source: Bloomberg
Leverage ratios indicate less of a concern
with the decline in profitability from a financial
stability point of view as both the Debt to Assets
and Debt to Equity ratios are at a downward
trend as well. All sectors exposure to debt are
diminishing except for the Materials sector (Chart
4.7). Interestingly, two sectors did not use debt for
the past years, Consumer Durables & Apparel, and
Software & Services. When looking at the Consumer
Durables sector it can be noted that it has
significantly higher liquidity ratios than the average
of the remaining sectors, which can be attributed to
sufficient cash inflows to maintain the operations and
5% 3%
42%
21%
3%
21%
5%
Capital Goods
Commercial &
Professional Svc
Consumer
Durables &
ApparelConsumer Services
Materials
Retailing
Software &
Services
-20%
-10%
0%
10%
20%
30%
40%
50%
60%
70%
Cap
ital
Go
od
s
Co
mm
erci
al &
Pro
fess
ion
al S
vc
Co
nsu
mer
Du
rab
les
& A
pp
arel
Co
nsu
mer
Ser
vic
es
Mat
eria
ls
Ret
aili
ng
So
ftw
are
& S
erv
ices
2014 2015 2016
2017 3 years Avg.

Real Sector Developments
Financial Stability Report 2018 26
expansion of projects without resorting to debt. In
contrast, the Software and Services sector was
characterized by a decline in liquidity, which is
associated with weaker revenues.
Chart 4.7: Debt to Assets
Source: Bloomberg
The majority of the sectors show some
improvement in their liquidity ratios reflecting a
healthy position to meet short-term obligations.
The increasing liquidity ratios could indicate that the
companies are anticipating a slowdown in their
operations. The Materials and Software & Services
sectors exhibited some of the lowest liquidity ratios.
However, both the aforementioned sectors’ current
ratio, remain above 100 percent, indicating adequate
levels of liquidity (Chart 4.8). If we were to
consider the Quick Ratio, it can be noted that
liquidity measures drop for the Retail sector and
more significantly for Capital Goods, indicating an
accumulation of inventory.
Chart 4.8: Current Ratio
The Asset Turn-Over ratio is the highest
for Consumer Durables sector as at the end of
2017. Capital goods have a slight improvement in
efficiency compared to the historical 3-year average.
Overall, most sectors have shown a decline in
turnover. The asset-turnover ratio is most useful for
capital-intensive sectors, which justifies the low
value of this ratio for the Software sector compared
to others.
4.3 Real estate
The real estate sector is an integral part
of every economy and a core component of
economic development. A struggling real estate
sector with no sign of recovery could signal a
troubled economy. As we look into the real estate
sector and attempt to analyze the possible origins of
risk that may undermine the overall financial
stability, it would be most appropriate to start by
understanding how fluctuations in property prices
could influence economic activities and
development.
0%
5%
10%
15%
20%
25%
30%
35%
40%
45%
50% 2014
2015
2016
2017
3 years Avg.
0
2
4
6
8
10
12
14
16
18
20
% 2014
2015
2016
2017
3 years Avg.
Source: Bloomberg

Real Sector Developments
Financial Stability Report 2018 27
Property prices have the potential to
impact economic growth through different
propagation channels. For instance, high prices
could lead to exuberant optimism which will channel
investments toward real estate projects. Rising real
estate prices may fuel speculative behavior, which is
more prone to occur in Saudi Arabia given the
limited domestic investment opportunities. As prices
increase, which are initially driven by household
demand, developers may flood the supply hoping to
capitalize on the available opportunities, which
consequently increases the financing being lent to
developers. As demand for real estate wanes, prices
would respond in kind. Therefore, prices fluctuations
may impose immense risk to both development and
possibly on financial institutions as it would change
the valuation of real estate properties they hold as
collateral. A decline in prices may add to the
downside pressure on credit, as lower valuations of
collateral holdings would reduce the amount
extended by the financial system, and possibly banks
would exhibit more risk aversion towards the real
estate sector.
The government’s plan to increase the
real estate sector’s contribution to GDP according
to Vision 2030 comes with various initiatives. First,
we should mention the activity in the real estate
investment traded funds (REIT) market. Indeed, 7
Funds have been approved to operate in 2017 after
the CMA had finalized its guidelines in October
2016. This is expected to increase the cash injected
into the sector as it expands the prospective investor
pool. According to the current trend, more REITs
Funds are expected to be approved in 2018 as other
APs notice the investment opportunities.
Furthermore, the white land tax law has been put into
effect in 2017; lands sized 10,000 square meters and
larger are subject to taxation according to this law.
The objective of such a law is to encourage real estate
development and deter investment in white lands. It
seems like this law had reaped results already as the
Ministry of Justice (MoJ) reported 18.5 percent
decrease in land prices last year, which may allow for
a greater subset of the population to purchase land for
development. Finally, the Public Investment Fund
(PIF) have established the Saudi Real Estate
Refinancing Company (SRC) in October 2017.
Aiming to ease the residential real estate ownership,
SRC provides another channel of financing to
finance companies in need of further funding
options; the process aims to offer a securitization of
high quality real estate exposures extended by the
finance companies sector, which will be introduced
as investment opportunities for domestic and
international investors. The establishment of the SRC
will provide an additional source of liquidity, and
enhance development in the secondary market as
more securities become availed to the financial
sector.
As we assess the activity of this sector, we
shall look at the overall prices. Taking 2014 as a
base year, we notice a drop by 23 percent in the
commercial real estate prices. We can also notice
lower elasticity in the residential real estate demand,
since the downturn had only affected prices by 12
percent. Given the small size of the agriculture real
estate market it is not surprising that it was the least
affected with only a decrease of 6 percent (Chart
4.9).
Chart 4.9: Real Estate Quarterly Overall Prices
Source: General Authority for Statistics
60.0
65.0
70.0
75.0
80.0
85.0
90.0
95.0
100.0
105.0
Q1 Q2 Q3 Q4 Q1 Q2 Q3 Q4 Q1 Q2 Q3 Q4 Q1 Q2 Q3 Q4
2014 2015 2016 2017
Pri
ces
General index ResidentialCommercial Agricultural
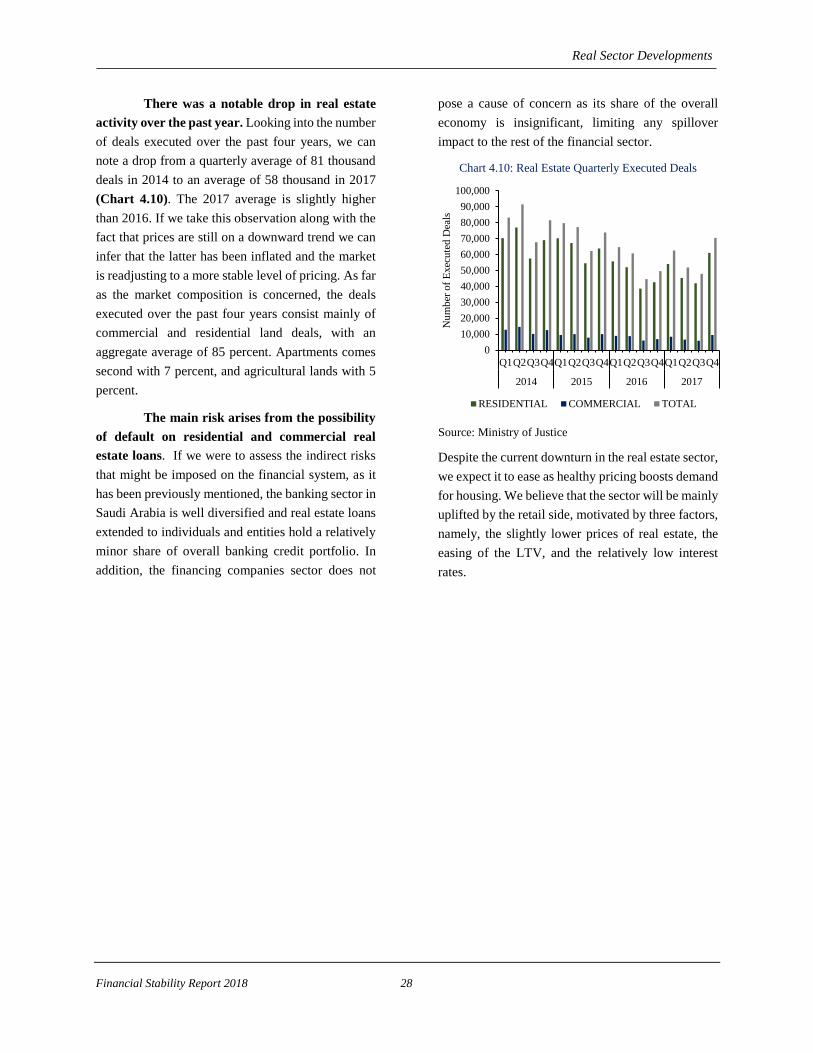
Real Sector Developments
Financial Stability Report 2018 28
There was a notable drop in real estate
activity over the past year. Looking into the number
of deals executed over the past four years, we can
note a drop from a quarterly average of 81 thousand
deals in 2014 to an average of 58 thousand in 2017
(Chart 4.10). The 2017 average is slightly higher
than 2016. If we take this observation along with the
fact that prices are still on a downward trend we can
infer that the latter has been inflated and the market
is readjusting to a more stable level of pricing. As far
as the market composition is concerned, the deals
executed over the past four years consist mainly of
commercial and residential land deals, with an
aggregate average of 85 percent. Apartments comes
second with 7 percent, and agricultural lands with 5
percent.
The main risk arises from the possibility
of default on residential and commercial real
estate loans. If we were to assess the indirect risks
that might be imposed on the financial system, as it
has been previously mentioned, the banking sector in
Saudi Arabia is well diversified and real estate loans
extended to individuals and entities hold a relatively
minor share of overall banking credit portfolio. In
addition, the financing companies sector does not
pose a cause of concern as its share of the overall
economy is insignificant, limiting any spillover
impact to the rest of the financial sector.
Chart 4.10: Real Estate Quarterly Executed Deals
Source: Ministry of Justice
Despite the current downturn in the real estate sector,
we expect it to ease as healthy pricing boosts demand
for housing. We believe that the sector will be mainly
uplifted by the retail side, motivated by three factors,
namely, the slightly lower prices of real estate, the
easing of the LTV, and the relatively low interest
rates.
0
10,000
20,000
30,000
40,000
50,000
60,000
70,000
80,000
90,000
100,000
Q1Q2Q3Q4Q1Q2Q3Q4Q1Q2Q3Q4Q1Q2Q3Q4
2014 2015 2016 2017
Nu
mb
er o
f E
xec
ute
d D
eals
RESIDENTIAL COMMERCIAL TOTAL

Real Sector Developments
Financial Stability Report 2018 29
Box 4.1
Residential lending, fixed interest vs. adjustable interest rate loans
Due to the changing nature of the economic climate, borrowers and lenders alike must take into account interest
rate risk when considering long term loan options. As consumers’ protection is one of SAMA’s primary mandates
that it is entrusted to do, we find it necessary to discuss real estate loans and their various features in addition to
different types of risk both entail.
Fixed interest rate loans, as the name suggest, offer funding with a predetermined interest rate that will hold
constant throughout the term of the loan, adjustable interest rate loans grant the lender the right to change the
interest rate as economic conditions change. Fixed usually start with a higher rate as lenders try to shield their
earnings from unexpected market fluctuations, in other words, the lender is the one who bears the risk of the
changing market rate. Adjustable interest rate loans, on the other hand, mitigate the risk for the lender as the
interest rate will be repriced in line with the benchmark rate.
When assessing a consumer’s choices regarding the type that best suits their preferences, factors such as economic
outlook, risk appetite, and loan duration help determine the suitability of the type of loan chosen. Not surprisingly,
expectations of future market conditions by consumers is key when determining the type of loan they are willing
to obtain. A consumer expecting market rates to remain constant or drop due to an increase in supply would prefer
adjustable interest rate loans and vice versa. Consumer’s attitude toward risk is also a primary factor that
distinguishes between preferable loan options. Finally, the duration of the loan also affects a consumer’s choice,
longer loan duration exacerbates the element of uncertainty that results in lower demand on adjustable interest rate
loans.

Banking Sector Developments
Financial Stability Report 2018 30
5. Banking Sector Developments
5.1 Overview
The impact from the domestic economic
environment has materialized with muted loan
growth within the banking sector. Lending
activities contracted by the end of the year in key
sectors that have historically benefited from thriving
economic activity. However, there have been
positive developments relative to 2016; liquidity
conditions have continued improving through-out the
year, along with an uptick in earnings which has
enhanced the capitalization of the banking sector.
Overall, despite the headwinds stemming from the
sluggish economic environment, the banking system
continue to be at comfortable levels in terms of
capital and liquidity to meet the anticipated structural
economic changes, which will serve to rejuvenate the
demand for credit.
5.2 Banking Sector Assets
Total Assets in the banking system grew
roughly at the same rate as in 2016, driven largely
by the growth stemmed from the public sector.
Total assets grew by 2.19 percent in 2017 compared
to 2.15 percent in 2016. The slowdown in asset
growth following the steep drop in oil prices by the
end of 2015 was immediate, where asset growth
noticeably decreased from 12.6 percent in 2014 to 3.5
percent in 2015; this has carried on well into 2017 as
depicted in Chart 5.1.
Chart 5.1: Asset Growth (Y/Y)
The improvement in oil prices helped
bring down leverage within the economy. Positive
developments in oil prices during 2017 were
captured in the year-end figures of nominal GDP.
The figure is primarily composed of output from oil
activities, therefore the value is largely guided by
changes in the international oil market.
Developments in a volatile market should be kept in
mind when attempting to normalize the banking
system’s assets by its total nominal output, as it is
heavily determined by swings in a volatile
commodity. The last sharp decline in oil prices prior
to the recent one was prompted by the global
financial crisis, which resulted in the Asset/GDP
ratio to sharply increase during 2009 (Chart 5.2).
The recent decline in oil prices had a stronger impact
on the ratio, which recorded elevated levels relative
to the 10-year historical average of 74 percent.
Chart 5.2: Bank Assets to Total GDP
The apparent slowdown in economic
growth is captured in the persistent decline in
claims on the private sector. Claims on the private
0
2
4
6
8
10
12
14
2013 2014 2015 2016 2017
%
-60
-40
-20
0
20
40
60
80
100
2008 2009 2010 2011 2012 2013 2014 2015 2016 2017
%
Assets/GDP Brent y/y

Banking Sector Developments
Financial Stability Report 2018 31
sector began its downward trend during 2016 to
register a negative growth by the first quarter of 2017
and onwards, reflecting the persistent slowdown in
economic growth (Chart 5.3). Similarly, the growth
in banking system’s reserves that are largely
composed of reverse repo placements with SAMA
has also been trending down to record a muted
growth in 2017. In contrast to the trends in private
claims, the public sector has continued to be a key
contributor to asset growth over 2017.
Chart 5.3: Y/Y Changes in Asset Growth by Type
The growing shares of exposures to the
public sector in the banking system have not
resulted in crowding out the private sector claims.
When looking at average shares of private and public
sectors at 5-year intervals, it can be noted that the
relationship was not necessarily inverse. Two key
elements to note are that as the government increased
its debt from the late 1990’s to early 2000’s (Chart
5.4), claims on the private sector also increased and
continued to do so as the government decreased its
debt financing activities.
Chart 5.4: Avg. Claim Shares of Private and Public to
Assets
-10
-8
-6
-4
-2
0
2
4
6
8
10
12
Q1 Q2 Q3 Q4 Q1 Q2 Q3 Q4 Q1 Q2 Q3 Q4
2015 2016 2017
%
Bank Reserves SAMA Bills
Foreign Assets Claims on Private Sector
Claims on Public Sector Claims on FIs
Other Assets & Fixed Total Assets y/y
0
10
20
30
40
50
60
70
80
1993-1997 1998-2002 2003-2007 2008-2012 2013-2017
%
Share of Private Claims Share of Public Claims
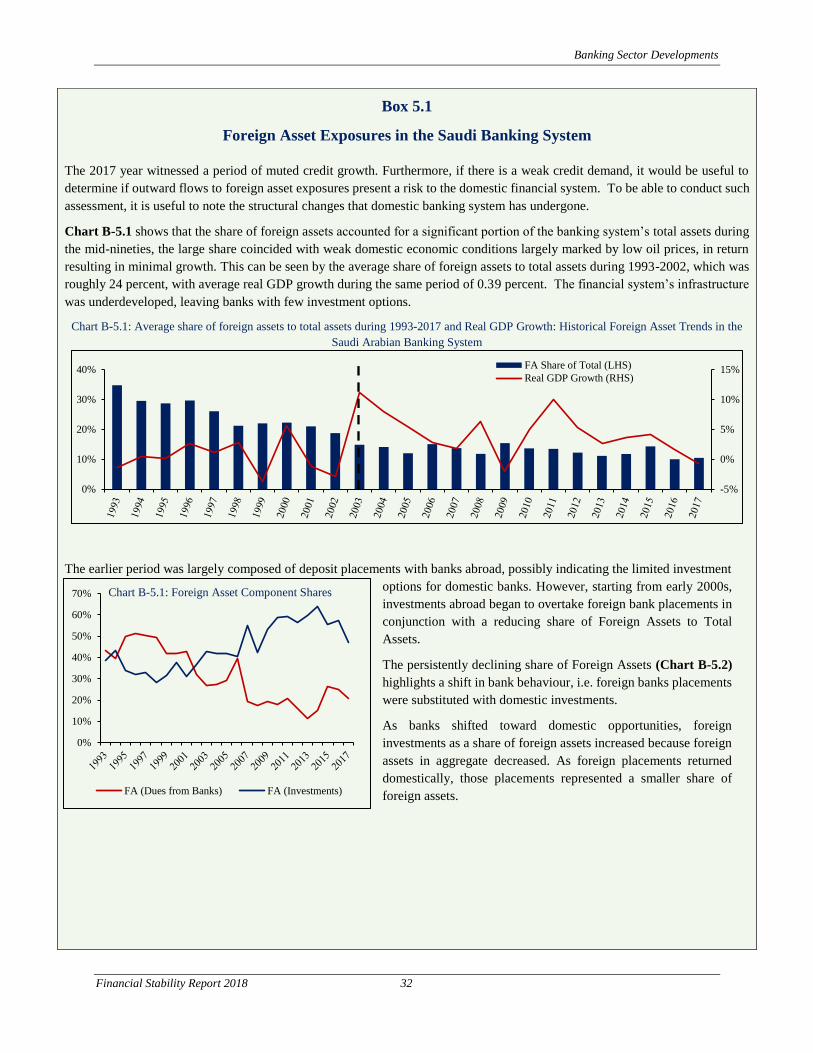
Banking Sector Developments
Financial Stability Report 2018 32
Box 5.1
Foreign Asset Exposures in the Saudi Banking System
The 2017 year witnessed a period of muted credit growth. Furthermore, if there is a weak credit demand, it would be useful to
determine if outward flows to foreign asset exposures present a risk to the domestic financial system. To be able to conduct such
assessment, it is useful to note the structural changes that domestic banking system has undergone.
Chart B-5.1 shows that the share of foreign assets accounted for a significant portion of the banking system’s total assets during
the mid-nineties, the large share coincided with weak domestic economic conditions largely marked by low oil prices, in return
resulting in minimal growth. This can be seen by the average share of foreign assets to total assets during 1993-2002, which was
roughly 24 percent, with average real GDP growth during the same period of 0.39 percent. The financial system’s infrastructure
was underdeveloped, leaving banks with few investment options.
Chart B-5.1: Average share of foreign assets to total assets during 1993-2017 and Real GDP Growth: Historical Foreign Asset Trends in the
Saudi Arabian Banking System
The earlier period was largely composed of deposit placements with banks abroad, possibly indicating the limited investment
options for domestic banks. However, starting from early 2000s,
investments abroad began to overtake foreign bank placements in
conjunction with a reducing share of Foreign Assets to Total
Assets.
The persistently declining share of Foreign Assets (Chart B-5.2)
highlights a shift in bank behaviour, i.e. foreign banks placements
were substituted with domestic investments.
As banks shifted toward domestic opportunities, foreign
investments as a share of foreign assets increased because foreign
assets in aggregate decreased. As foreign placements returned
domestically, those placements represented a smaller share of
foreign assets.
-5%
0%
5%
10%
15%
0%
10%
20%
30%
40% FA Share of Total (LHS)
Real GDP Growth (RHS)
0%
10%
20%
30%
40%
50%
60%
70%
FA (Dues from Banks) FA (Investments)
Chart B-5.1: Foreign Asset Component Shares

Banking Sector Developments
Financial Stability Report 2018 33
The changing composition of foreign assets is evident in the growing
divergence between the shares of foreign and domestic private sector
claims (Chart B-5.3), which became more pronounced by the late
90’s.
Given that the financial intermediaries primary function is the
extension of credit, as market segments expanded for domestic banks,
so did their claims on the private sector.
Domestic banks largely extended credit to businesses with minimal
lending activities to households. SAMA invested in the financial
ecosystem, such as facilitating salary assignment and the creation of
SIMAH. Furthermore, SAMA pushed banks to expand their branch
network.
The development of the financial system’s infrastructure in addition to a sharp uptick in economic activity saw an increase in
lending by banks, where the average share of foreign assets to total assets came down to around 13 percent (Chart B-5.4),
with economic growth averaging a 4.4 percent growth rate. Rapidly growing assets were mainly driven by growth in claims
on the private sector; the graph below further highlights the waning contribution of foreign assets to total asset growth.
Current Bank System Drivers in Foreign Assets
-5.0%
0.0%
5.0%
10.0%
15.0%
20.0%
25.0%
30.0%
Bank Reserves SAMA Bills Foreign Assets Private Sector Claims
Public Sector Claims FI Claims Other Total Assets y/y
0%
10%
20%
30%
40%
50%
60%
70%
0%
10%
20%
30%
40%
50%
60%
70%
Foreign Assets Private Sector Claims
Chart B-5.3: Shares of Foreign and Domestic Private Claims
Chart B-5.4: Divers of Asset Growth
Chart B-5.5: Foreign Share of Investments Chart B-5.6: Foreign Share of Loans Chart B-5.7: Foreign Share of Bank Placements
0%
5%
10%
15%
20%
25%
30%
35%
40%
45%
50%
0%
1%
2%
3%
4%
5%
6%
7%
8%

Banking Sector Developments
Financial Stability Report 2018 34
Utilizing information from the financial statements of 11 out of 12 domestic banks, we analyzed the major components of
foreign assets on more granular levels, allowing for a comparison on major concentrations of foreign exposures relative to
domestic exposures.
As of 2017, most of the line items were concentrated
domestically (Chart B-5.8), except for bank placements
which were 45 percent. The key takeaway is that 71
percent of investments, and 95 percent of loans are
domestic in nature. It should be noted that foreign loans
are assessed by SAMA on a case by case basis.
The main financial intermediation activities are centered
domestically, with minimal change between 2009 and
2017. However, in total, domestic exposures increased
to 89 percent in 2017 compared to 84 percent in 2009.
Foreign lending activities are slightly influenced by
banks with significant stakes in foreign banking
subsidiaries. When removing the exposures of one bank,
we get notably lower shares of foreign assets.
SAMA conducted a brief survey with domestic banks to quantify the makeup of their foreign asset exposures in greater level
of granularity. Banks submitted figures to each of the previously mentioned line items, along with weights and the purpose of
each line items; e.g. Investments could serve a number of purposes, such as diversification, liquidity, or simply profitability.
By quantifying the makeup of main foreign exposures, we were able to determine if there is room for those investments to be
funneled domestically.
We prepared charts based on the responses of banks in terms of levels and the average of weights, since the latter would
mitigate the bias of some of the larger banks in the sample. Foreign placements are primarily done for operational and liquidity
reasons that are two key measures to ensure the efficiency of the banking system (Chart B-5.9 & B-5.10).
Furthermore, foreign placements also allow banks greater avenues to place excess liquidity when the system as a whole has
surplus liquidity. Placements offer an avenue to build relationships with foreign banks, which would afford them greater access
to liquidity beyond the domestic banking system.
0 5,000 10,000 15,000
Liquidity
Hedging
Operational (e.g. nostro)
Profitability
Diversification
Other
SAR Million 0% 10% 20% 30% 40% 50%
Liquidity
Hedging
Operational (e.g. nostro)
Profitability
Diversification
Other
Chart B-5.8: Regional Distribution of Major Line Items
Chart B-5.9: Drivers of Foreign Bank Exposures in levels Chart B-5.10: Drivers of Foreign Bank Exposures by Average Weights
0%
20%
40%
60%
80%
100%
Bank
Placements
Investments Loans Total Exposure
KSA GCC and Mideast Europe
North America Other Countries

Banking Sector Developments
Financial Stability Report 2018 35
Furthermore, we noted that on average, the respondents placed the highest weight on profitability as a driver for foreign
investments (Chart B-5.11 & B-5.12).
Domestic banks tend to have country limits set up based on rigorous criteria, where credit ratings are taken into account.
Investments in foreign countries are mainly driven by yield after a thorough assessment of the risk-reward profile.
Even though profitability is the main driver, it pays dividends by allowing banks to mitigate other areas of risk. For example,
domestic banks will be able to reduce their concentration risk mitigating any potential fallout to both depositors and
shareholders. Despite the growing investment opportunities domestically, there remain further progress to be done in the
development of the capital markets. Foreign investments allow banks to diversify their pool of high quality liquid assets, which
would help meet international regulatory standards and to withstand domestic related shocks by having a diversified source of
revenues that will bolster their resilience.
0% 5% 10% 15% 20% 25% 30% 35%
Liquidity
Hedging
Operational (e.g. nostro)
Profitability
Diversification
Other
Chart B-5.11: Drivers of Foreign Investments in Levels Chart B-5.12: Drivers of Foreign Investments in Average Weights
0 10,000 20,000 30,000
Liquidity
Hedging
Operational (e.g. nostro)
Profitability
Diversification
Other
SAR Million

Banking Sector Developments
Financial Stability Report 2018 36
5.3 Overall Credit Developments
Banking sector credit contracted by the
end of 2017, a response to slowdown in economic
environment. The banking system’s credit
decreased by 1 percent at the end of 2017 in line with
the decreasing share of claims on the private sector.
The contraction in credit was mirrored in the negative
growth of real GDP (Chart 5.5) which was primarily
the result of the negative growth in the oil sector.
Chart 5.5: GDP and Total Banking Credit Growth Rates
Rebound in private sector economic
growth, and a credit contraction indicate that
growth was not fueled by credit. In contrast to total
GDP, non-oil GDP rebounded by the end of 2017,
growing by roughly 1 percent, mostly fueled by
expansion in the government sector. The private
sector rebounded at a moderate pace at 0.71 percent
compared to a historical low of 0.07 percent at the
end of 2016, indicating that credit played a limited
role in the rebound.
5.3.1 Corporate Credit
Credit extended to the corporate sector
contributed to the negative contraction in credit
for the first time since 2009. Previous episodes of
credit contraction in the corporate sector were
limited, as they rebounded the following year (Chart
5.6). The Chart below plots three historic periods of
contraction, each contraction period coincided with a
contraction in total GDP, driven by shocks to oil
prices. A key observation is the reaction to corporate
credit growth following the contraction; the first
episode (1999) resulted in a quite subdued rebound
in credit, while the second (2009) was much more
robust due to the quick recovery in economic growth.
Chart 5.6: Episodes of Corporate Credit Contraction
The two previous episodes of negative
credit growth were followed by two different
recoveries. Growth in 2010 was largely motivated by
a strong expansion in the non-oil sector, despite the
oil sector registering negative growth rates. During
2000, the recovery was both in the oil and non-oil
sector, however the former’s recovery quickly
returned to persistent declines. Furthermore, the
underlying structure of the economy varied between
2000 and 2010, where the non-oil sector’s
contribution to total output was roughly 40 percent,
which later increased to approximately 55 percent by
2010. The most recent contraction differs from the
previous two, in that it followed a gradual
deleveraging process; the non-oil sector’s
contribution by 2017 is around 56 percent,
highlighting the strong interlinkages between non-oil
economic output and bank lending.
The slowdown in economic activity
materialized in the credit extension to the
construction and manufacturing sectors. When
comparing exposures by corporate sector between
2016 and 2017, the results for the most recent year
seemed much more varied. Credit developments
primarily stemmed from the contraction in both
construction and manufacturing sectors, where both
capture the reduced economic activity in the
-2
0
2
4
6
8
10
12
14
2013 2014 2015 2016 2017
%
Real GDP y/y Bank Credit y/y
22.6
19.1
1.3
-0.9 -0.3 -0.30.1
8.6
-5
0
5
10
15
20
25
1998/1999/2000 2008/2009/2010 2016/2017
% Growth Rate Prior to ContractionRate During ContractionGrowth Rate Following Contraction

Banking Sector Developments
Financial Stability Report 2018 37
infrastructure and consumption front (Chart 5.7). It
should be noted that there could be different factors
at play when it pertains to the reduction in
construction and manufacturing credit. It could be a
byproduct of risk aversion by the banking system and
a slowdown in growth opportunities for both sectors.
However, this trend was not readily apparent in
exposures to the commerce sector, which slowed
down but continued to grow at a positive rate. The
composition of sectoral exposures to different
corporate sectors is not quick to change due to the
sticky nature of loans.
Chart 5.7: Contribution to Corporate Credit Growth
Energy and health services and transport
and communications sectors both grew at a rate
higher than their 2010-2014 average. The
slowdown in credit demand may compel the banking
system to expand to new segments in an effort to
grow their lending book, or it could be a reason for
banks to diversify their loan book to sectors with
higher asset quality. The recent slowdown allows us
to compare average individual growth rates by sector
prior to the drop in oil prices to individual growth
rates by the end of 2017 (Chart 5.8). Most sectors
registered growth rates in 2017 that were lower than
their average growth rates during the last 5 years.
However, when taking into consideration the
expansion in energy and health services and transport
and communications sectors, it can be noted that
these sectors have relatively small portions of total
corporate credit. The increased growth in the last two
sectors possibly indicates the banking system’s
expansion to untapped segments. The commerce
sector, which holds the largest proportion of
corporate credit, registered growth rates in 2017
below its historical average, which may indicate a
sector that is saturated. The expansion to new
segments could serve to reduce the banking system’s
sectoral concentration.
Chart 5.8: Loan Book Changes
The largest exposures within the
corporate segment also contain the highest
individual NPL rates, though they remain low at
the portfolio level. Earlier in the section, it was
noted that the reduction in construction and
manufacturing sectors could possibly be attributed to
some conscious deleveraging in the banking system.
The point is made clear by the elevated NPL rates in
the aforementioned sectors. As Chart 5.9 shows, NPL
rate in construction sector increased to 4.3 percent,
while NPL rate in manufacturing sector had a steeper
increase from a low 0.9 percent in 2016 to 2.2 percent
by the end of 2017. As for the commerce sector, NPL
rate remained roughly similar to previous year.
Despite the slight increase in NPL rates in
construction and manufacturing sectors, their
exposures have been coming down and is
outweighed by the relatively low NPL rates in the
remaining sectors, which is evident in the total NPL
rate for corporate sectors that reached 2 percent by
the end of 2017.
-5
0
5
10
15
2015 2016 2017
%
Services FinanceTransport and Communications CommerceConstruction Energy and Health ServicesMining ManufacturingAgriculture Total
-30
-20
-10
0
10
20
30
40
Agri
cult
ure
Manufa
cturi
ng
Min
ing
Ener
gy a
nd H
ealt
h S
ervic
es
Const
ructi
on
Com
mer
ce
Tra
nsp
ort
and C
om
munic
atio
ns
Fin
ance
Ser
vic
es
% 2017 Shares of Total Corporate Credit
2010 - 2014 Average Growth
2017 y/y growth

Banking Sector Developments
Financial Stability Report 2018 38
Chart 5.9: Largest Share of Corporate Credit and NPL
Rates
5.3.2 Retail Credit
Credit to the retail sector decreased in
2017, but continues to record a positive growth.
Total retail credit registered 2.7 percent growth by
the end of 2017 (Chart 5.10). The contribution of
personal loans was insignificant by the year-end,
which dipped into the negative territory during 2017,
before rebounding by the end of the year. There was
a slight increase in the contribution of credit card
exposures, while they remain small relative to the
total retail lending. This increase could reflect some
strain borne by retail customers as they resort to a
more expensive form of financing to meet payment
obligations.
Chart 5.10: Contribution to Retail Credit Growth
8 LTV was further raised to 90 percent in 2018 9 Risk weight of residential mortgages was further reduced to 50 percent in 2018
Credit dynamics within the retail sector
indicate some appetite for mortgage-based
lending. The quarterly contraction in personal
lending may reflect a shift towards real estate loans
over the year, and a smaller market for new retail
customers (Chart 5.11). However, the sustained
slowdown in economic activity could have reduced
the pool of potential new applicants that are
employed in low risk sectors. As a large majority of
retail exposures are salary assigned, reduced
employment opportunities in the domestic economy
may also contribute to fewer retail loans being
granted. Another factor could be the regulatory
measures taken, specifically, the easing of the LTV
from 75 percent to 85 percent during 2017 and the
reduction in risk weight of residential mortgages
from 100 percent to 75 percent, which clearly had the
anticipated impact on retail mortgages.8,9
Creditworthy retail customers may have shifted to
real estate loans as the down payment burden was
reduced, as opposed to refinancing their personal
loan exposures.
Chart 5.11: Quarterly Contribution to Retail Credit
Growth
Growth in retail loans coincided with a
decrease in the NPL rates of retail exposures by
the end of 2017. Loans to households tend to contain
lower default risk than loans to corporates (Chart
5.12). However, the large portion of growth during
2017 largely stemmed from real estate lending which
0
1
2
3
4
5
0
10
20
30
40
50
2013 2014 2015 2016 2017
%%
Commerce Manufacturing
Construction Commerce NPL (RHS)
Manufacturing NPL (RHS) Construction NPL (RHS)
Total Corp. NPL (RHS)
0
5
10
15
2013 2014 2015 2016 2017
% Personal Loans
Real Estate
Credit Card
Total Retail Credit y/y
(RHS)
-2.0
-1.0
0.0
1.0
2.0
3.0
Q1 Q2 Q3 Q4
%
Personal Loans Real EstateCredit Card Total Retail Credit y/y
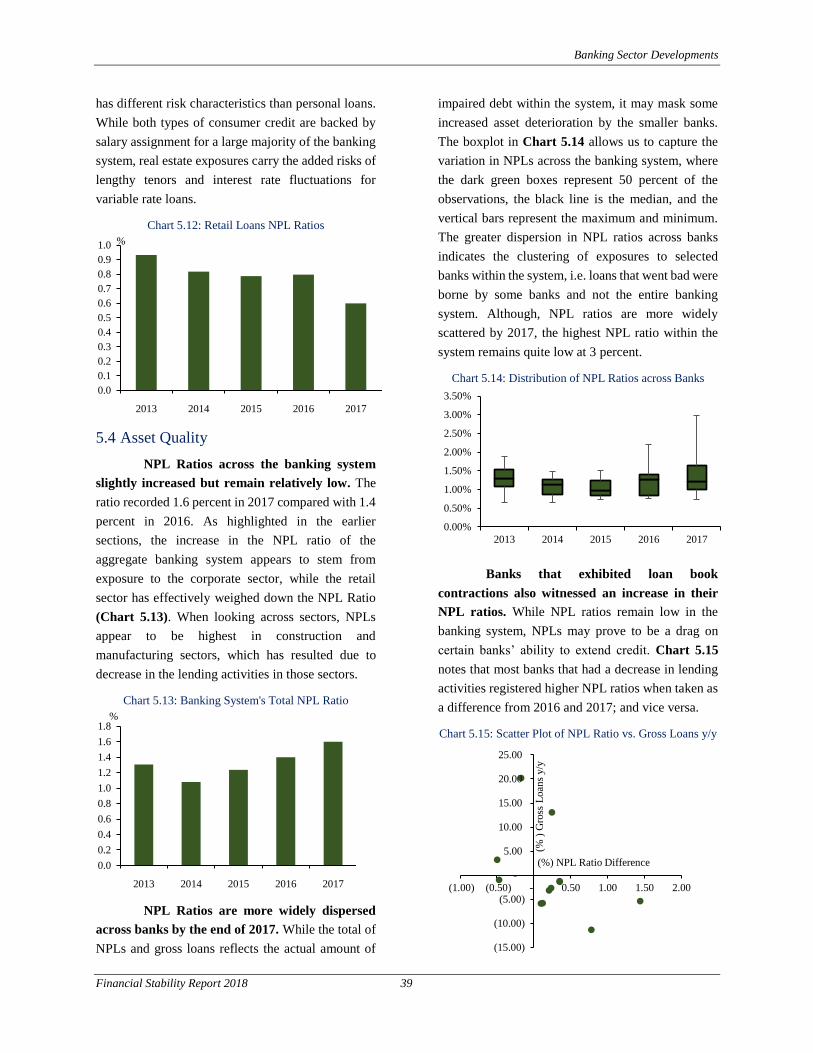
Banking Sector Developments
Financial Stability Report 2018 39
has different risk characteristics than personal loans.
While both types of consumer credit are backed by
salary assignment for a large majority of the banking
system, real estate exposures carry the added risks of
lengthy tenors and interest rate fluctuations for
variable rate loans.
Chart 5.12: Retail Loans NPL Ratios
5.4 Asset Quality
NPL Ratios across the banking system
slightly increased but remain relatively low. The
ratio recorded 1.6 percent in 2017 compared with 1.4
percent in 2016. As highlighted in the earlier
sections, the increase in the NPL ratio of the
aggregate banking system appears to stem from
exposure to the corporate sector, while the retail
sector has effectively weighed down the NPL Ratio
(Chart 5.13). When looking across sectors, NPLs
appear to be highest in construction and
manufacturing sectors, which has resulted due to
decrease in the lending activities in those sectors.
Chart 5.13: Banking System's Total NPL Ratio
NPL Ratios are more widely dispersed
across banks by the end of 2017. While the total of
NPLs and gross loans reflects the actual amount of
impaired debt within the system, it may mask some
increased asset deterioration by the smaller banks.
The boxplot in Chart 5.14 allows us to capture the
variation in NPLs across the banking system, where
the dark green boxes represent 50 percent of the
observations, the black line is the median, and the
vertical bars represent the maximum and minimum.
The greater dispersion in NPL ratios across banks
indicates the clustering of exposures to selected
banks within the system, i.e. loans that went bad were
borne by some banks and not the entire banking
system. Although, NPL ratios are more widely
scattered by 2017, the highest NPL ratio within the
system remains quite low at 3 percent.
Chart 5.14: Distribution of NPL Ratios across Banks
Banks that exhibited loan book
contractions also witnessed an increase in their
NPL ratios. While NPL ratios remain low in the
banking system, NPLs may prove to be a drag on
certain banks’ ability to extend credit. Chart 5.15
notes that most banks that had a decrease in lending
activities registered higher NPL ratios when taken as
a difference from 2016 and 2017; and vice versa.
Chart 5.15: Scatter Plot of NPL Ratio vs. Gross Loans y/y
0.0
0.1
0.2
0.3
0.4
0.5
0.6
0.7
0.8
0.9
1.0
2013 2014 2015 2016 2017
%
0.0
0.2
0.4
0.6
0.8
1.0
1.2
1.4
1.6
1.8
2013 2014 2015 2016 2017
%
0.00%
0.50%
1.00%
1.50%
2.00%
2.50%
3.00%
3.50%
2013 2014 2015 2016 2017
(15.00)
(10.00)
(5.00)
-
5.00
10.00
15.00
20.00
25.00
(1.00) (0.50) - 0.50 1.00 1.50 2.00
(% )
Gro
ss L
oan
s y/y
(%) NPL Ratio Difference

Banking Sector Developments
Financial Stability Report 2018 40
The banking system reported an increase
in write-offs over 2017. Write-offs tend to be
considered as a conservative practice, and the
profitability recorded across the banking sector
during the year reflects ample room for banks to
increase write-offs and maintain their high
provisions. Past year’s write-offs mainly stemmed
from construction and commerce segment. Write-off
activity has been trending upwards since 2014,
possibly reflecting the financial strains borne by the
private sector as economic growth slows down
(Chart 5.16). Despite the uptick in write-off activity
in the aforementioned sectors, both commerce and
construction registered higher NPL ratios over the
past year. The banking system has been reducing its
exposure to the construction sector, which can be
attributed to the relatively higher risk in that sector as
proxied by the NPL ratio. In addition, while the
commerce sector grew in 2017, it’s growth were at
rates below its historic average, which possibly
reflects some risk aversion by banks.
Chart 5.16: Write-Offs by Main Sectors
Specific provisions in the banking sector
decreased in 2017, primarily due to a reduction in
retail related provisions. Growth in specific
provisions tend to serve as a leading indicator to asset
quality deterioration. Chart 5.17 notes that a key
contributor to the decrease in specific provisions
stemmed from retail exposures, indicating some
improvement in the type of assets. The smaller
contribution of specific provisions of the corporate
sector also indicates some positive developments on
that front. The peak in specific provisions from the
past year did not carry over into 2017, highlighting
that the number of companies that have been
impacted by the economic slowdown did not pick up
pace during 2017.
Chart 5.17: Growth Contribution to Specific Provisions
There has been a notable uptick in
delinquency behavior over 2017. The large
majority of delinquent exposures are captured in
below 90 days buckets. The exposures in the 90 days
and above bucket are considered performing and not
impaired and they remain small relative to total
credit, making up roughly 0.46 percent (Chart 5.18).
Chart 5.18: Days past due (DPD) Buckets
Bank specific days past due (DPD)
indicates that some banks are carrying a
significantly higher amount of delinquent
exposures relative to 2016. As captured by Chart
5.19, certain banks have been taking on greater
exposures that are classified in the greater than 90-
day bucket. Taking into account the variations across
the banking system as opposed to the aggregate view
of delinquency behavior indicates that some banks
0
3
6
9
12
15
2013 2014 2015 2016 2017
SA
R B
illi
on
Other Sectors
Consumer loans and credit cards
Commerce
Building and construction
-30
-20
-10
0
10
20
2013 2014 2015 2016 2017
%
Corporate Specific Provision
Retail Specific Provision
Total
0.0
1.0
2.0
3.0
4.0
2013 2014 2015 2016 2017
%
Above 90 DPD to Credit (RHS)
Below 90 DPD to Credit (LHS)

Banking Sector Developments
Financial Stability Report 2018 41
are holding a greater amount of risky debt. The data
did not indicate any abnormalities with banks that
reported higher DPD amounts relative to credit, but
this may prove to be a strain on lending behavior
going into 2018, if these exposures remain
delinquent.
Chart 5.19: Bank Distribution of DPD>90 to Total Credit
The contraction in credit coincided with
some deterioration in asset quality. An important
take away from the Chart 5.20 is that banks have not
been allocating their credit to higher risk exposures,
but have noticed a degradation in the quality of their
loan book as loans shifted from standard to elevated
risk during 2017. However, risky debt had a smaller
contribution to growth by 2017 at 0.6 percent relative
to 1.2 percent in 2016, indicating a slower pace of
deterioration in credit.
Chart 5.20: Contribution to Credit Growth by Risk Type
Despite the slight deterioration in assets,
the banking system remains highly provisioned.
Provision coverage, as given by both general and
specific provisions over the value of NPLs, reflect
that banks have ample funds provided to meet further
deteriorations in assets (Chart 5.21).
Chart 5.21: Distribution of Provision Coverage
5.5 Funding and Liquidity
The liability and capital structure of the
banking system recorded minor variations from
historical trends, yet generally remained
unchanged. The muted asset growth noted in an
earlier section was funded by slightly different
dynamics. Given the slowdown in economic growth,
the liability structure recorded a slightly different
composition by the end of 2017 relative to the 5-year
average. While deposits remain the largest portion of
liabilities, their contribution moderately decreased
over 2017 (Chart 5.22). In addition, there has been
marginally higher reliance on foreign and interbank
liabilities recording 4.9 and 2 percent respectively by
the end of 2017 (Chart 5.23). However, overall there
have not been any significant changes in the liability
structure of the banking system and it remains
prudent to track changes in the development of
funding sources during an environment of low
lending activities.
0.00
0.50
1.00
1.50
2.00
2.50
3.00
3.50
2016 2017
%
-4
-2
0
2
4
6
8
10
12
14
16
2013 2014 2015 2016 2017
%
Low
Standard, Retail
Elevated
Total
0
50
100
150
200
250
300
350
2013 2014 2015 2016 2017
%
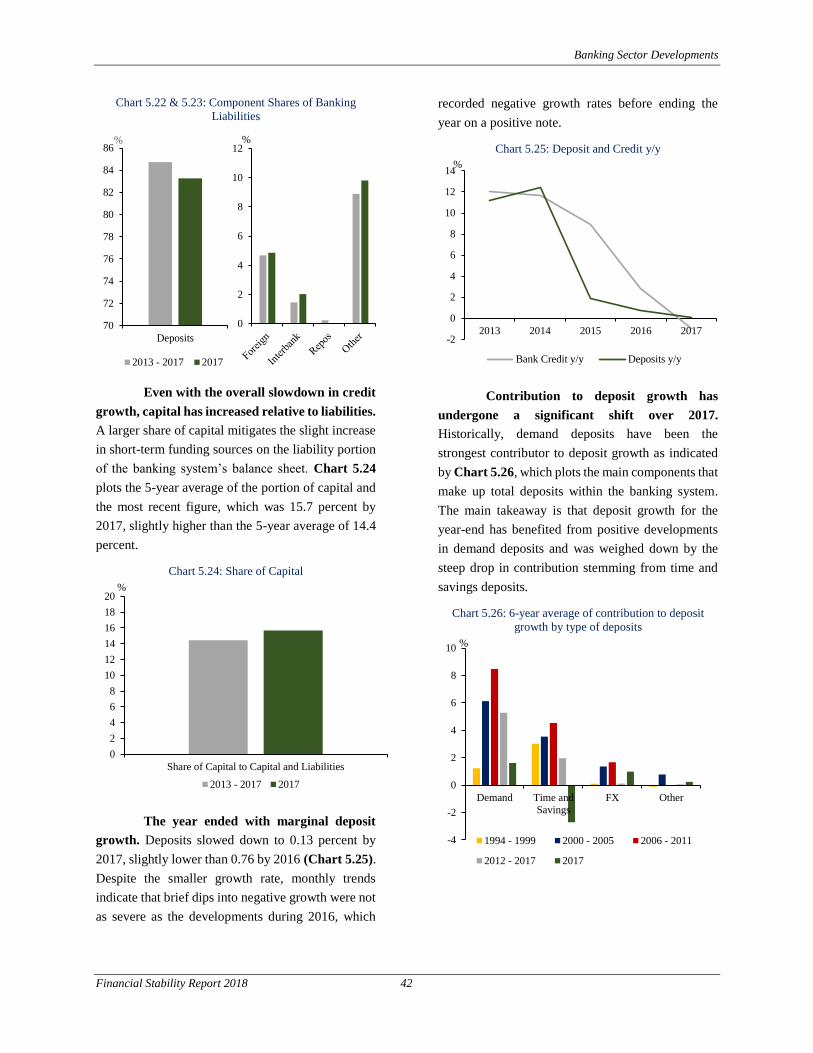
Banking Sector Developments
Financial Stability Report 2018 42
Chart 5.22 & 5.23: Component Shares of Banking
Liabilities
Even with the overall slowdown in credit
growth, capital has increased relative to liabilities.
A larger share of capital mitigates the slight increase
in short-term funding sources on the liability portion
of the banking system’s balance sheet. Chart 5.24
plots the 5-year average of the portion of capital and
the most recent figure, which was 15.7 percent by
2017, slightly higher than the 5-year average of 14.4
percent.
Chart 5.24: Share of Capital
The year ended with marginal deposit
growth. Deposits slowed down to 0.13 percent by
2017, slightly lower than 0.76 by 2016 (Chart 5.25).
Despite the smaller growth rate, monthly trends
indicate that brief dips into negative growth were not
as severe as the developments during 2016, which
recorded negative growth rates before ending the
year on a positive note.
Chart 5.25: Deposit and Credit y/y
Contribution to deposit growth has
undergone a significant shift over 2017.
Historically, demand deposits have been the
strongest contributor to deposit growth as indicated
by Chart 5.26, which plots the main components that
make up total deposits within the banking system.
The main takeaway is that deposit growth for the
year-end has benefited from positive developments
in demand deposits and was weighed down by the
steep drop in contribution stemming from time and
savings deposits.
Chart 5.26: 6-year average of contribution to deposit
growth by type of deposits
70
72
74
76
78
80
82
84
86
Deposits
%
2013 - 2017 2017
0
2
4
6
8
10
12
14
16
18
20
Share of Capital to Capital and Liabilities
%
2013 - 2017 2017
-2
0
2
4
6
8
10
12
14
2013 2014 2015 2016 2017
%
Bank Credit y/y Deposits y/y
-4
-2
0
2
4
6
8
10
Demand Time and
Savings
FX Other
%
1994 - 1999 2000 - 2005 2006 - 2011
2012 - 2017 2017
0
2
4
6
8
10
12%

Banking Sector Developments
Financial Stability Report 2018 43
There has been a steep drop in private-
sector deposits relative to historical trends. The
banking system’s deposits have largely stemmed
from demand deposits, with an increasingly larger
contribution from private sector deposits. By the end
of 2017, it can be noted that the private sector
recorded a contraction in deposit growth (Chart
5.27); while the public sector contributed to growth
approximately in line with historical averages in the
early 2000’s.
Chart 5.27: 6-year average of contribution to deposit
growth by sector
Changes in the drivers of deposits
became more pronounced by the end of the year.
The reduction in deposits during 2016 stemmed from
both the private and public sectors. Both Charts 5.28
and 5.29 show that the total deposits of public and
private related deposits in 2016 recorded a negative
contribution to total growth. However, when
considering deposit growth by type, it can be seen
that demand deposits suffered the greatest
contraction during Q2 and Q3 of 2016. The pressure
on demand deposits during 2016 may have stemmed
from two factors, the first being small demand
deposits leaving the system and the second being a
substitution effect as both public and private sector
entities shifted from demand to time and savings
deposits.
Deposit growth during 2017 was driven by
demand deposits, which are stickier source of
funding. The end of 2017 also noted a drop in time
and savings deposits, which poses a challenge as it
historically served as a stable source of medium term
funding.
Chart 5.28: Contribution to Deposit Growth by Type
Chart 5.29: Contribution to Deposit Growth by Sector
Loan to Deposit Ratio (LDR) shows a
marked improvement across the banking system.
The improvement in the LDR (Chart 5.30) can be
partially attributed to the contraction in lending with
a marginal improvement in deposit growth. It should
be noted that the LDR does reflect the capacity of the
banking system to meet unanticipated deposit
outflows.
-4
-2
0
2
4
6
8
10
12
Private Public Other
%
1994 - 1999 2000 - 2005 2006 - 2011
2012 - 2017 2017
-10
-5
0
5
10
15
Q1 Q2 Q3 Q4 Q1 Q2 Q3 Q4 Q1 Q2 Q3 Q4
2015 2016 2017
%
Demand Time and Savings
FX Other
Total
-6
-4
-2
0
2
4
6
8
10
12
Q1 Q2 Q3 Q4 Q1 Q2 Q3 Q4 Q1 Q2 Q3 Q4
2015 2016 2017
%
Private Public Other Total

Banking Sector Developments
Financial Stability Report 2018 44
Chart 5.30: Distribution of LDR
Basel’s Liquidity Coverage Ratio (LCR)
also reflects a rebound in liquidity. The LCR
serves as a stressed measure of liquidity, which
relates high quality liquid assets to net cash outflows.
Liquidity strains in 2016 resulted in a slight drop in
the LCR (it still remained largely above Basel’s
minimum requirement), however it rebounded by
2017 (Chart 5.31). The general resilience of the LCR
despite tightened market liquidity during 2016
offered a valuable window into bank behavior during
that period. Instead of drawing down on their assets
or posting collateral with SAMA, they resorted to
other sources of funding despite the higher cost paid.
Chart 5.31: Distribution of LCR
Long-term funding measures indicate
stability. The Net Stable Funding Ratio (NSFR) of
the banking system shows little changes in long-term
funding sources (Chart 5.32). This is in line with a
banking system that is highly capitalized and
represents a stable source of available funding.
Chart 5.32: Distribution of NSFR
5.6 P&L Developments
The banking system’s bottom line
improved by the end of 2017, which is mainly
attributed to a sharp reduction in expenses
relative to 2016. The brief liquidity squeeze during
2016 significantly increased both expenses and
revenue from revenue generating assets. However,
last year’s growth in expenses had a greater
contribution relative to revenues for all banks, which
has abated by 2017, where total expenses recorded
only negative 0.19 percent (Chart 5.33). Net income
has returned to a positive growth rate after the minor
drop in 2016. However, the sources of revenue
generation may test the banking system’s
profitability if credit growth remains muted.
Chart 5.33: Contribution to Net Income Growth
65
70
75
80
85
90
2016 2017
%
0
50
100
150
200
250
300
350
400
2013 2014 2015 2016 2017
%
80
90
100
110
120
130
140
150
2015 2016 2017
%
-60
-40
-20
0
20
40
60
2013 2014 2015 2016 2017
%
Total Expenses Total Revenue
Net Income y/y (RHS)
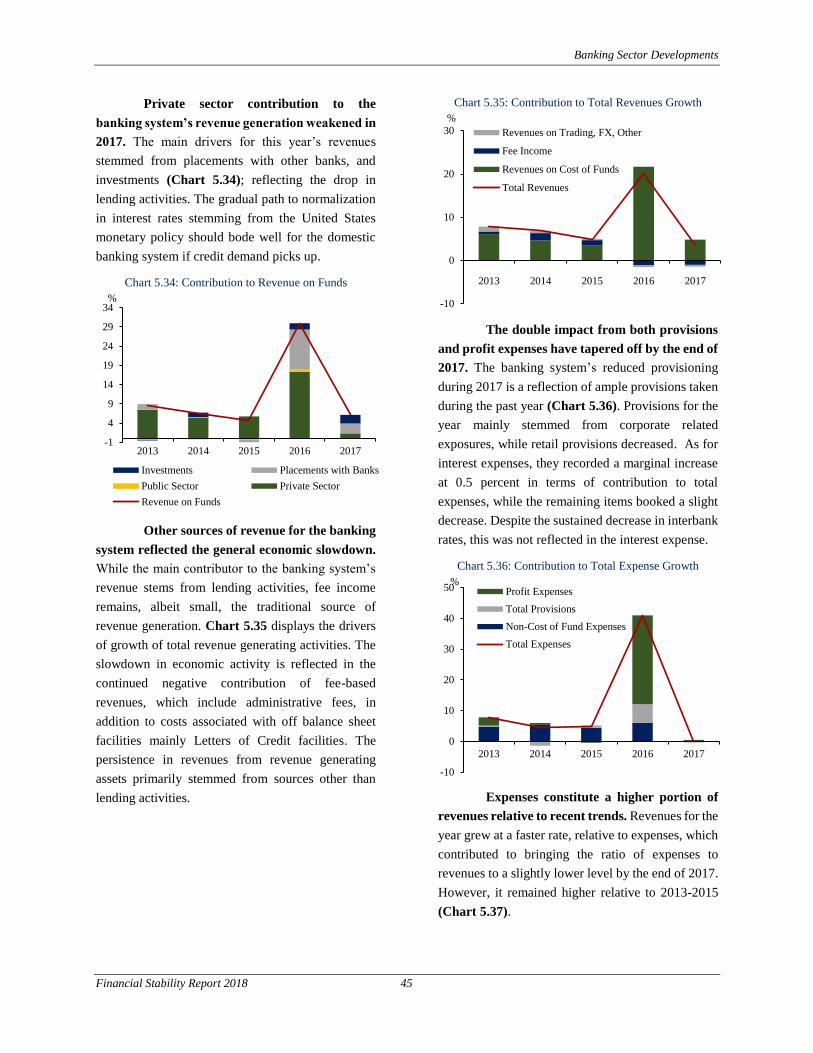
Banking Sector Developments
Financial Stability Report 2018 45
Private sector contribution to the
banking system’s revenue generation weakened in
2017. The main drivers for this year’s revenues
stemmed from placements with other banks, and
investments (Chart 5.34); reflecting the drop in
lending activities. The gradual path to normalization
in interest rates stemming from the United States
monetary policy should bode well for the domestic
banking system if credit demand picks up.
Chart 5.34: Contribution to Revenue on Funds
Other sources of revenue for the banking
system reflected the general economic slowdown.
While the main contributor to the banking system’s
revenue stems from lending activities, fee income
remains, albeit small, the traditional source of
revenue generation. Chart 5.35 displays the drivers
of growth of total revenue generating activities. The
slowdown in economic activity is reflected in the
continued negative contribution of fee-based
revenues, which include administrative fees, in
addition to costs associated with off balance sheet
facilities mainly Letters of Credit facilities. The
persistence in revenues from revenue generating
assets primarily stemmed from sources other than
lending activities.
Chart 5.35: Contribution to Total Revenues Growth
The double impact from both provisions
and profit expenses have tapered off by the end of
2017. The banking system’s reduced provisioning
during 2017 is a reflection of ample provisions taken
during the past year (Chart 5.36). Provisions for the
year mainly stemmed from corporate related
exposures, while retail provisions decreased. As for
interest expenses, they recorded a marginal increase
at 0.5 percent in terms of contribution to total
expenses, while the remaining items booked a slight
decrease. Despite the sustained decrease in interbank
rates, this was not reflected in the interest expense.
Chart 5.36: Contribution to Total Expense Growth
Expenses constitute a higher portion of
revenues relative to recent trends. Revenues for the
year grew at a faster rate, relative to expenses, which
contributed to bringing the ratio of expenses to
revenues to a slightly lower level by the end of 2017.
However, it remained higher relative to 2013-2015
(Chart 5.37).
-1
4
9
14
19
24
29
34
2013 2014 2015 2016 2017
%
Investments Placements with Banks
Public Sector Private Sector
Revenue on Funds
-10
0
10
20
30
2013 2014 2015 2016 2017
%
Revenues on Trading, FX, Other
Fee Income
Revenues on Cost of Funds
Total Revenues
-10
0
10
20
30
40
50
2013 2014 2015 2016 2017
%Profit Expenses
Total Provisions
Non-Cost of Fund Expenses
Total Expenses

Banking Sector Developments
Financial Stability Report 2018 46
Chart 5.37: Cost of Funds to Revenues on Funds Ratio
5.7 Capitalization
Capitalization improved in the banking
system by the end of 2017. There has been a notable
shift in the capitalization of the domestic banking
system (Chart 5.38). The range of capitalization
rates also indicated a comfortable buffer that all
banks within the system fall into.
Chart 5.38: Distribution of Capital Adequacy Ratio
Despite the sluggish growth in assets,
Risk-Weighted Assets (RWA) as a portion to total
assets continued its decreasing trend in 2017
(Chart 5.39). A factor contributing to this decreasing
trend is that a portion of RWAs have been shifting to
zero risk-weighted assets due to the increasing
exposure to domestic sovereign debt. In addition,
risk-weights for retail real estate exposures was
reduced from 100 percent to 75 percent as mentioned
earlier.
Chart 5.39: Risk-weighted Assets to Total Assets
High capitalization rate has been kept
steady. The main contributors of CAR stem from
regulatory capital and changes to total RWAs. It can
be noted in Chart 5.40 that RWAs have almost
halted to 0.65 percent growth by the end of 2017;
while growth in capital recorded 5.5 percent. The
sluggish growth in RWAs can partially be attributed
to a slightly higher exposure to retail mortgages,
sovereign exposures, and most notably a contraction
in credit. Growth in capital levels bode well for the
banking system, as it managed to increase its capital
during a period of negative credit.
Chart 5.40: Drivers of Total CAR
0
5
10
15
20
25
30
35
40
2013 2014 2015 2016 2017
%
15
16
17
18
19
20
21
22
23
2016 2017
%
75
77
79
81
83
85
87
89
2013 2014 2015 2016 2017
%
0
5
10
15
20
25
Q1 Q2 Q3 Q4 Q1 Q2 Q3 Q4 Q1 Q2 Q3 Q4
2015 2016 2017
%
CAR RWA y/y Regulatory Capital y/y

Banking Sector Developments
Financial Stability Report 2018 47
Box 5.2
Stress Testing of the Banking Sector in Saudi Arabia
As part of its risk assessment toolkit, SAMA conducts macro stress testing of the Saudi banking sector on an
annual basis. This Box provides an overview of SAMA’s credit risk stress testing model, its assumptions, and
its main results.
1. Objectives of the Exercise:
The main objective of the stress testing exercise is to assess the resilience of the Saudi Banking Sector to absorb
macroeconomic shocks. It also aims to identify weaknesses in the banking system or in the individual banks to
enable SAMA to design appropriate supervisory responses to proactively address such weaknesses.
2. Scope and Coverage:
The focus of the stress testing exercise is to stress test the banking sector against the credit risk. The exercise
has been carried out using bank level data of NPLs, provisions, income components and Risk-Weighted Assets
(RWAs) covering periods from 2000 to 2017. Total credit and NPLs are used at subsector levels. There are 12
subsectors used in this exercise i.e. Banks and Other Financial Institutions, Agriculture and Fishing,
Manufacturing, Mining and Quarrying, Electricity Water and Gas Health Services, Building and Construction,
Commerce, Transportation and Communication, Services, Consumer loans and Credit Cards and Other Loans.
3. Stress Testing Methodology:
The following methodology has been used to conduct the stress testing exercise:
i. Step 1 - three stress-testing scenarios are defined which are based on SAMA’s macro-economic
forecasting model and expert judgments. The scenarios assume shocks in several macroeconomic
variables including 1) oil prices; 2) government spending growth; 3) implicit lending rates; 4)
SAIBOR; and 5) Tadawal All Share Index (TASI) growth rate.
ii. Step 2 - various “satellite” models are constructed to investigate the underlying relationship
between macroeconomic and banking sector variables.
iii. Step 3 - based on the underlying scenarios, projections of changes in major banking variables (such
as NPLs, provisions, and profitability) are obtained.
iv. Step 4 - based on projections in step 3, the stressed levels of bank capital are projected.
4. Data Collection:
In order to complete the stress testing exercise for December 2017, the following data have been collected:
i. Bank level data: A time series of quarterly data from January 2000 to December 2017 on Non-
Performing loans, Total Credit, Provisions, Net Interest Income, Net Other Income, Net interest
Expense, Dividend payments, Total Regulatory Capital and Tier 1 Capital and Risk Weighted
Assets;
ii. Macroeconomic data: A time series of a quarterly data from January 2000 to December 2017 on Oil
Prices, Government Spending, SAIBOR, TASI, Implied Lending Rate and Total Credit.

Banking Sector Developments
Financial Stability Report 2018 48
5. Stress Test Results:
The stress testing results show that Saudi banks can easily withstand various economic shock scenarios. In the
baseline scenario, the non-performing loan ratio is expected to moderately increase from 1.5 percent to reach
1.54 percent by 2020. The NPL coverage ratio increases through-out the period from 162 percent to 186
percent. Individual banks NPL ratios range from 2.83 percent (the upper percentile) and 0.93 percent (the
lower percentile). The capital adequacy ratio (CAR) would increase throughout the stress period reaching
around 20 percent by the end of 2020.
Under the moderate scenario, the results show that the projected non-performing loan ratio is expected to
moderately increase on a weighted average basis to roughly 2 percent. Individual banks NPL ratios would
range from 2.92 percent (the upper percentile) and 0.71 percent (the lower percentile). Consequently, the
projected coverage ratio would decrease to reach 168 percent by the end of 2020. The Projected Capital
Adequacy Ratio (CAR) decreases on a weighted average basis from 20 percent to reach 18 percent by 2020.
Under the severe scenario, non-performing loans (NPL) increase to 2.3 percent by 2020. Individual bank NPL
ratios range from 3.9 percent (the upper percentile) and 0.83 percent (the lower percentile). The coverage ratio
decreases from 180 percent to reach 154 percent by 2020. The sector’s CAR drops to around 15.3 percent.
The stress test results using all three stress scenarios suggest that the banking sector will remain well
capitalized under large shocks. Banks capital adequacy ratios are still comfortably above the Basel minimum
requirement of 8 percent and more importantly, above SAMA’s threshold of 12 percent minimum CAR
requirement.

Developments in Finance Companies
Financial Stability Report 2018 49
6. Developments in Finance Companies
6.1. Finance Companies Assets
Finance companies have not grown in
2017. Total assets of this sector decreased by 1.5
percent (SAR 38.2 billion compared to SAR 38.7
billion in 2016) (Chart 6.1). Real estate and non-
real estate assets accounted for 30 percent and 70
percent of total finance companies’ assets,
respectively. These assets stood at 1.5 percent of
GDP and 2.6 percent of the non-oil GDP at the end
of 2017, exactly same as the previous year.
Moreover, the finance companies’ assets
accounted for 1.7 percent of total bank assets in
2017.
Chart 6.1: Total Assets of Finance Companies
Table (6.1): Development of Finance
Companies Sector
2017 2016 2015 2014 2013
37 34 30 18 3 Total
number of
licensed
companies
6 6 6 5 2 Real estate
companies
29 28 24 13 1 Non- real
estate
companies
1 0 0 0 0 Refinance
company
1 0 0 0 0 Micro
finance
14,158 12,470 11,250 7,401 1,650 Total
capital
(Million
SAR)
6.2 Financing Assets by Sector
Loans granted by finance companies are
divided into the following main sectors:
individuals, small and medium-sized
enterprises (SMEs) and corporate non-SMEs.
In 2017, loans granted to the individuals represent
76 percent, which was the major portion of total
net financial assets. While the SME sector
accounted for 16 percent and corporate non-SMEs
was only 8 percent (Chart 6.2).
Chart 6.2: Financing Assets by Sector
6.3 Sources of Funds
One of the main risks facing the finance
sector is the limited sources of funds and the
nature of their long-term assets. The capital
structure of finance companies is traditional and is
mainly limited to: debt, paid up capital,
factorization (portfolio selling), reserves and
provisions. In 2017, the portion of finance
companies’ debt was 39 percent of the total
sources of funds, while capital reached 36 percent
and the total reserves amounted to 25 percent of
the total sources of funds (Chart 6.3). The
concentration on debt sources leaves finance
companies exposed to higher rates stemming from
interbank developments, this would ultimately
translate to higher financing rates for households
and companies that rely on finance companies as a
source of credit.
0
5
10
15
20
25
30
35
40
45
2014 2015 2016 2017
Bil
lion
SA
R
Total Assets R.E Non.R.E
76%
16%
8%
Individuals SMEs Corporate non-SMEs

Developments in Finance Companies
Financial Stability Report 2018 50
Chart 6.3: Capital Structure
6.4 Credit Performance of Finance
Companies
Credit growth by finance companies
marginally grew by 2017. There was a notable
slowdown in credit growth in the finance
companies sector, with credit reaching SAR 51
billion in 2017. The subdued growth, largely
reflects the slowing economic environment.
Growth has come to a standstill as indicated by
non-oil GDP, and possibly the pool of clients with
acceptable levels of risk has decreased.
In contrast to trends in total credit, real
estate credit indicated some positive
developments. The real estate components were at
SAR 14.7 billion in December 2017, expanding by
8 percent, whereas, non-real estate declined by 8
percent reaching SAR 36 billion. While real estate
credit increased, the decrease in non-real estate
credit is similar to trends noted in the banking
sector, therefore the credit demand dynamics are
across the financial sector as a whole. Real estate
and non- real estate accounted for 29 percent and 71
percent, respectively of total finance companies
credit. Furthermore, the total credit extended by this
sector compared to the credit extended by the
banking sector was small during 2017. The total
credit (On-balance and off- balance sheet credit)
accounted for approximately 3.8 percent of the total
banking sector credit (Chart 6.4), it is equivalent to
2 percent of GDP, and 3.5 percent of the non-oil
GDP in 2017.
Chart 6.4: Credit by Business Line
6.5. Risk Outlook of Finance Companies
NPLs continue to rise stemming mostly
from SMEs and individuals’ consumption. The
slowdown of economic growth in 2017 as well as
the credit portfolio of finance companies, both
have resulted in high NPLs which rose from 9.2
percent in 2016 to 10.3 percent at the end of 2017
(Chart 6.5). The contribution to such increase
came mainly from SMEs which might have a
lower ability to adjust to the downturn
environment. While NPL rates are high within the
finance companies, the concentration is quite
limited to the overall economy. The relatively high
level of credit extended to the real estate sector
may constitute another avenue of risk, as the credit
to real-estate projects was 33 percent of the total
credit in 2017. In terms of the contribution to the
NPL ratio from the individuals’ sector, it was
amounted to 52 percent, while SMEs reached 42
percent and corporate non-SMEs accounted for 6
percent of the overall NPL ratio (Chart 6.6). In
addition, SAMA has ensured the sector’s
readiness for the implementation of IFRS 9, and
prudently monitors NPL developments.
25%
39%
36%
Total Reserves
and Provisions
Total Debt
Paid up capital
0
10
20
30
40
50
60
2016 2017
Bil
lion
SA
R
Total Credit R.E Non.R.E

Developments in Finance Companies
Financial Stability Report 2018 51
Chart 6.5: NPL Ratio of Finance Companies
Chart 6.6: NPLs of Finance Companies by Sector
6.6 Finance Companies Resilience
6.6.1 Profitability
Despite the slow economic growth,
profitability of finance companies recorded an
increase after two years of decline. Profits were
up by 18.2 percent from a year earlier reaching
SAR 1,176 billion. Correspondingly, at the end of
2017, both ROE and ROA have been positively
impacted, amounted for 6.5 and 3.1 percent
respectively (Chart 6.7). The upturn in profits
resulted mainly from two factors; 1- of the decline
in expenses especially marketing expenses; 2-
lower funding costs.
Chart 6.7: Profitability of Finance Companies
6.6.2 Leverage
The leverage ratio position of the finance
companies remained sound with a slight
decrease since last year. In 2017, the leverage
ratio varied between 2.2 percent for real estate
companies and 1.46 percent for non-real estate
companies compared to 2.13 percent and 1.59
percent respectively in 2016. These ratios
remained below the maximum limits allowed by
SAMA in their policy framework. Maintaining
finance companies’ leverage at prudent levels is an
important move to ensure stability within the
financial sector (Chart 6.8).
Chart 6.8: Leverage Ratio of Finance Companies
0%
2%
4%
6%
8%
10%
12%
2014 2015 2016 2017
52%42%
6%
Individuals SMEs Corporate non-SMEs
0%
2%
4%
6%
8%
10%
12%
14%
2014 2015 2016 2017
Return on Assets Return on Equities
1.5
1.55
1.6
1.65
1.7
1.75
1.8
1.85
1.9
1.95
2015 2016 2017

Developments in Finance Companies
Financial Stability Report 2018 52
Box 6.1
Saudi Real Estate Refinance Company (SRC)
In line with Vision 2030 objectives to improve the performance of the real estate market, increase its
contribution to GDP, and raise the rate of homeownership among Saudis, the Saudi Real Estate Refinance
Company (SRC) was established in 2017 by the Public Investment Fund (PIF) with the purpose of
developing the housing finance market in Saudi Arabia by enabling the originators to offer long term and
short-term financing solutions to home buyers.
The company will act as an intermediary access point for investors, aligning the liquidity, capital, and risk
management requirements of real estate mortgage companies, with the risk acceptability and return on
equity to meet investor targets.
SRC will adopt a strategy of acquiring mortgage funds to increase financial capabilities and broaden the
activities of real estate financing companies. It will also work on linking the investment capital of foreign
and local investors with the range of opportunities available in the Kingdom’s growing housing market.
In addition, the company’s activities will include issuing bonds as securities, supported through real estate
mortgage contracts over the short and long term, to real estate financing companies.
To regulate securitization in finance companies sector, in 2015 SAMA had issued the rules governing
disposal of finance assets or their contractual rights through setting clear controls in respect of the rights
of the finance company and the other entity in a stable and sustainable manner, thereby, mitigating risks
associated with finance. These rules govern the disposal of finance assets or their contractual rights,
whether the disposal takes the form of sale of assets, factoring, pledging, or assignment.
A finance company that intends to dispose finance assets or their contractual rights, shall apply for a no
objection letter from SAMA except pledging which require only informing SAMA with a written
notification.
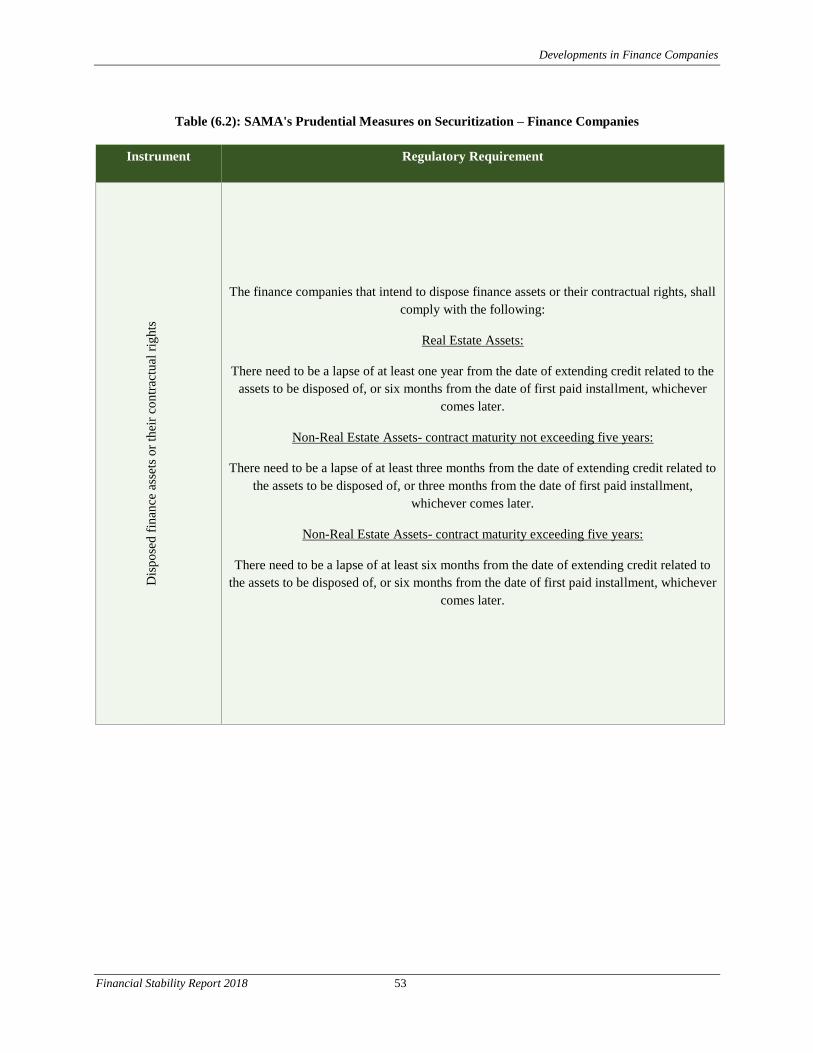
Developments in Finance Companies
Financial Stability Report 2018 53
Table (6.2): SAMA's Prudential Measures on Securitization – Finance Companies
Instrument Regulatory Requirement D
isp
ose
d f
inan
ce a
sset
s o
r th
eir
con
trac
tual
rig
hts
The finance companies that intend to dispose finance assets or their contractual rights, shall
comply with the following:
Real Estate Assets:
There need to be a lapse of at least one year from the date of extending credit related to the
assets to be disposed of, or six months from the date of first paid installment, whichever
comes later.
Non-Real Estate Assets- contract maturity not exceeding five years:
There need to be a lapse of at least three months from the date of extending credit related to
the assets to be disposed of, or three months from the date of first paid installment,
whichever comes later.
Non-Real Estate Assets- contract maturity exceeding five years:
There need to be a lapse of at least six months from the date of extending credit related to
the assets to be disposed of, or six months from the date of first paid installment, whichever
comes later.

Developments in Insurance Sector
Financial Stability Report 2018 54
7. Developments in Insurance Sector
7.1 Overview
The structure of the insurance sector in
2017 has not changed much from the previous
year but some components have changed slightly.
For example, the loss assessors and loss adjusters, the
insurance advisors and insurance agents' numbers
decreased, while the brokers and claims settlement
specialists' number increased (Table 7.1).
Table 7.1: The insurance sector structure (2013-2017)
Number of 2013 2014 2015 2016 2017
Insurance Companies 33 34 35 35 35
Assessors and Loss
Adjusters 13 14 15 16 15
Insurance Advisors 7 8 8 8 7
Actuaries 2 2 2 3 3
Insurance Brokers 72 79 85 92 96
Insurance Agents 70 82 86 95 94
Insurance Claims
Settlement Specialists
(third-party administration)
9 9 12 14 15
There are 35 insurance companies licensed in Saudi
Arabia, which operate at least in one of the three
following major insurance lines:
The market share of the insurance
sector is dominated by few companies. The
results of the last three years showed that only
about 15 percent of the insurance companies have
on average about 63 percent of the market share.
In 2017, the market shares of the big five
companies registered a small increase by 0.81
percent from 2016 reaching to 64.37 percent
(Chart 7.1).
Chart 7.1: Market Share of Top 5 Insurance as a
Percentage of Totals GWP
Market share of insurance business is
dominated by the two compulsory insurance
lines. The health insurance maintained its position
as the largest insurance segment holding 52.15
percent, followed by the motor insurance at 30.51
percent. They together accounted for almost 83
percent of the market share, leaving 17 percent for
the other insurance sectors (Chart 7.2).
Chart 7.2: 2017 Market Share of Insurance Business Lines
Health Insurance
Protection and Savings Insurance
General Insurance, consist of Motor Insurance
•Accident and Liability & Other General Insurance
•Property Insurance
•Marine Insurance
•Aviation Insurance
•Energy Insurance
•Engineering Insurance
59%
60%
61%
62%
63%
64%
65%
2015 2016 2017
Market Share of Top 5 Insurance as a Percentage of
Total GWP
30.5%
4.7%
52.1%
Accident and Liability Motor InsuranceProperty Insurance Marine InsuranceAviation Insurance Energy InsuranceEngineering Insurance Health Insurance

Developments in Insurance Sector
Financial Stability Report 2018 55
The year of 2017 witnessed a notable
decline in GWP. The overall insurance Gross
Written Premium (GWP) in 2017 decelerated by
SAR 352 million to reach SAR 36.50 billion,
compared to SAR 36.85 billion in 2016, representing
a negative growth rate of 1.0 percent (Chart 7.3).
Chart 7.3: Gross Written Premiums Growth rate (2013-
2017)
The sluggish growth in insurance,
continues to be reflected in its limited penetration.
In 2017, the penetration of the insurance sector fell
for the second year in a row, achieving 1.99 percent
to the non-oil GDP and 1.42 percent to the total GDP
(Chart 7.4).
Chart 7.4: Insurance Sector Penetration to GDP vs. Non-
Oil GDP
The insurance density or the insurance spending per
capita decreased for the second consecutive year
reaching SAR 1,121 in 2017 (Chart 7.5). The
density fell by 2.3 percent in 2016 and 3.3 percent in
2017.
Chart 7.5: Insurance Density- Spending Per Capita
7.2 Market Performance
In general, the insurance market showed
a decrease in net investment income and
underwriting revenue in 2017. Net investment
results have decreased for policyholders from SAR
368 thousand in 2016 to SAR 344 thousand in 2017,
while net investment for shareholders increased
slightly from SAR 358 thousand in 2016 to SAR 397
thousand in 2017 (Chart 7.7).
Total underwriting revenue had a
significant fall in 2017. Underwriting revenue
recorded a decline of around 27 percent. The
decrease in net investment income and underwriting
revenue was mostly led by the uncertainty about the
market and price increases, affecting profit margins
and the total value of the GWP (Chart 7.6).
Chart 7.6: Underwriting Revenue and Net Investment
Income
The net earned premiums decelerated in
2017. It decreased by SAR 308 million to reach SAR
30.60 billion, compared to SAR 30.91 billion in
2016, down by 1.00 percent (Chart 7.7).
-5
0
5
10
15
20
25
0
5
10
15
20
25
30
35
40
2013 2014 2015 2016 2017
%
Bil
lion
SA
R
GWP Growth Rate (RHS)
0.00%
0.50%
1.00%
1.50%
2.00%
2.50%
2013 2014 2015 2016 2017
Insurance Sector Penetration to non-oil GDP
Insurance Sector Penetration to GDP
-5%
0%
5%
10%
15%
20%
25%
0
200
400
600
800
1,000
1,200
1,400
2013 2014 2015 2016 2017
SA
R
Insurance Spending Per Capita
Annual Growth Rate
0
100
200
300
400
500
0
5,000
10,000
15,000
20,000
25,000
30,000
2014 2015 2016 2017
Th
ou
san
d S
AR
Th
ou
san
d S
AR
Total Underwriting Revenue
Net Investment Income ( policyholder)
Net Investment Income (Shareholder)

Developments in Insurance Sector
Financial Stability Report 2018 56
Chart 7.7: Net Earned Premiums (NEP)
On the other hand, the Net Claims
Incurred (NCI) increased in 2017. NCI
increased by SAR 893 million recording SAR
24.563 billion, compared to SAR 23.670 billion in
2016, which represents a growth rate of 3.8
percent (Chart 7.8).
Chart 7.8: Net Claims Incurred (NCI)
ROE and ROA decreased in 2017
compared to 2016. The ROE in 2017 recorded
around 4.67 percent compared to 14.5 percent in
2016. Also, the ROA registered around 1.16 percent
in 2017 compared to 3.7 percent in 2016 (Chart 7.9).
Chart 7.9: Returns on Assets and Equity
7.3 Insurance Risk
7.3.1 Market Risks
Solvency margins continued to show an
upward trend, despite the low rate of premiums
in 2017 compared to previous years. This is
primarily due to SAMA's corrective adjustments and
policies that have contributed to improving the
solvency margins. The solvency margin in 2017 was
about 143 percent, as compared to 150 percent in
2016 (Chart 7.10). While the ratio recorded a lower
rate in Q4 2017 compared to Q4 2016, the ratio
overall continues to show a consistent improvement.
In addition, the sector was able to maintain a
solvency margin above the 100 percent requirement.
Chart 7.10: Quarterly Solvency Margins (%)
The admitted assets results showed an
increase in both the net assets of the policyholders
and the net assets of the shareholders in 2017. The
net admissible assets are an indicator of liquidity and
availability of assets to pay claims, as and when
necessary. The 2017 results showed an increase of
3.14 percent and 7.61 percent respectively (Chart
7.11).
Chart 7.11: Net Admissible Assets
0
5
10
15
20
25
30
35
2013 2014 2015 2016 2017
Bil
lion
S
AR
General Insurance Health Insurance P&S Insurance
-
5
10
15
20
25
30
2013 2014 2015 2016 2017
Bil
lion
S
AR
General Insurance Health Insurance P&S Insurance
-20%
-15%
-10%
-5%
0%
5%
10%
15%
20%
2013 2014 2015 2016 2017
ROA ROE
0%
20%
40%
60%
80%
100%
120%
140%
160%
Q1 Q2 Q3 Q4 Q1 Q2 Q3 Q4 Q1 Q2 Q3 Q4 Q1 Q2 Q3 Q4
2014 2015 2016 2017
-6
-5
-4
-3
-2
-1
0
2014 2015 2016 2017
Mil
lion
SA
R
Avg. Net Assets - Policyholders (Operations) (Protection
and Savings Insurance), before adjustments
Avg. Net Assets - Policyholders (Operations) (General and
Health Insurance), before adjustments

Developments in Insurance Sector
Financial Stability Report 2018 57
There have been different developments
in gross capital at risk between individuals and
groups. The gross capital at risk for individuals has
decreased in 2017 by 2.65 percent, while the gross
capital at risk for groups has increased in the same
year by 16.44 percent. On the other hand, the
reinsurance share of the individuals' capital at risk
has decreased by 11.79 percent, but the reinsurance
share of the groups has increased by 7.41 percent
(Chart 7.12). This means improved reinsurance
coverage for individuals' capital at risk while worse
reinsurance coverage for groups' capital at risk.
Overall, the coverage ratio of the reinsurance for the
capital risks was 67.43 percent in 2017 compared to
72.99 percent in 2016.
Chart 7.12: Gross Capital at Risks
The strong technical reserve contributes
to the stability of the insurance sector, reducing
the risk of market volatility. Over the past five
years, the policies in force have contributed to
strengthening the technical reserves.
In 2017, technical reserves (funds set aside from
profits to cover claims) increased by 1.6 percent to
SAR 30.187 billion from around SAR 29.727 billion
in 2016 (Chart 7.13). In addition, the quarterly
technical reserve showed a steady increase since the
third quarter of 2015 (Chart 7.14).
Chart 7.13: Technical Reserve
Chart 7.14: Quarterly Technical Reserve (2013-2017)
7.3.2 Financial Risks
The Saudi insurance market bears most
of the risks related to the market. This is
demonstrated by the high and growing annual
retention ratio. The retention rate in 2017 was 84.5
percent vs. 83.7 percent in 2016 (Chart 7.15). The
retention ratio continued to rise at a Compound
Annual Growth Rate (CAGR) of 2.08 percent. This
enabled the insurance companies' on bearing the
shocks of the market instead of transferring them to
local or global reinsurance companies.
- 100,000 200,000 300,000
2014
2015
2016
2017
Thousdands SAR
Gross Capital at Risk - P&S Individual policies
Gross Capital at Risk - P&S Group policies
Reinsurance Share of Gross Capital at Risk -P&S Individual policies
Reinsurance Share of Gross Capital at Risk -P&SGroup policies
-
5.00
10.00
15.00
20.00
25.00
30.00
35.00
2013 2014 2015 2016 2017
Bu
kk
uib
SA
R
Q1 2013Q2 2013
Q32013
Q4 2013
Q1 2014
Q2 2014
Q3 2014
Q4 2014
Q1 2015
Q2 2015Q3 2015
Q4 2015
Q1 2016
Q2 2016
Q3 2016
Q4 2016
Q1 2017
Q2 2017
Q3 2017
Q4 2017

Developments in Insurance Sector
Financial Stability Report 2018 58
Chart 7.15: Retention Ratio
Given the quarterly results in 2016 and 2017, there is
a slight variation in the retention ratios within the
range of 82 percent to 86 percent. This difference is
due to the extent by which the market risk differs
from the gross premiums written during each quarter
(Chart 7.16).
Chart 7.16: Quarterly Retention Ratios (2016-2017)
Profitability in the sector was impacted
by developments in the combined ratio. The
combined ratio is used to measure the profitability of
an insurance sector. Unlike the years of 2015 and
2016, the insurance sector returned in 2017 to record
a combined rate of over 100 percent (Chart 7.17).
Chart 7.17: Combined Ratio
In addition, the quarterly data shows fluctuations
within each year. For instance, the ratio recorded in
the last quarter of 2017 around 110 percent compared
to 94 percent in the third quarter (Chart 7.18).
Chart 7.18: Combined Ratio (Quarterly data)
7.3.3 Operation Risks and Efficiency
In 2017, the insurance sector has
continued the implementation of its strategic
initiatives. The insurance companies have
successfully completed 84 projects from the running
141 strategic projects. All strategic projects aimed to
improve the operational efficiency and to enhance
the services quality in the three key classes in the
insurance sector.
By virtue of improved services, the percentage of the
open claims in 2017 slightly decreased from 2016
registering 18.8 percent (Chart 7.19).
72%
74%
76%
78%
80%
82%
84%
86%
2013 2014 2015 2016 2017
79%
80%
81%
82%
83%
84%
85%
86%
87%
Q1
2016
Q2
2016
Q3
2016
Q4
2016
Q1
2017
Q2
2017
Q3
2017
Q4
2017
85%
90%
95%
100%
105%
110%
115%
120%
2013 2014 2015 2016 2017
Combined Ratio of Losses and Expenses
85%
90%
95%
100%
105%
110%
115%
Q1
2016
Q2
2016
Q3
2016
Q4
2016
Q1
2017
Q2
2017
Q3
2017
Q4
2017

Developments in Insurance Sector
Financial Stability Report 2018 59
Chart 7.19: Complaints Received, Redressed and Solved
7.3.4 Other Risks
The compliance to the existing laws and
regulations in the insurance sector recorded
significant developments during the past years.
The number of observations raised by external
parties decreased rapidly as well as the legal penalties
(Chart 7.20).
The improvements in compliance resulted mainly
from the oversight of SAMA and CMA as regulatory
entities. Implementation of regulatory measures
contributed to ensuring the rights of beneficiaries as
well as enhancing the stability of the insurance
sector.
Chart 7.20: Compliance to Existing Rules, Laws and
Regulations
0.00%
5.00%
10.00%
15.00%
20.00%
25.00%
30.00%
35.00%
0
5
10
15
20
25
30
2014 2015 2016 2017
Th
ou
san
d S
AR
Number of valid complaints received
Number of open customer complaints out of all the
complaints received
Percantage of open customer complaints out of all the
complaints received (RHS)
0
5
10
15
20
25
30
35
40
0
5
10
15
20
25
30
35
2015 2016 2017
Mil
lion
SA
RObservations Raised by External Auditors (RHS)
Legal Penalties (SAR)

Capital Market Stability
Financial Stability Report 2018 60
8. Capital Market Stability
8.1 Overview
Major developments and reforms took
place during 2017. Some are expected to have a
short-term undesirable effect, such as introducing
some uncertainty in the market and economy. In
spite of these reforms and the slight contraction in
economic activities, the capital market is still sound
and well-positioned. Stock market index, market
capitalization, capital market activities and listed
companies’ performance improved when compared
to 2016.
The index witnessed limited volatility
during 2017, where average volatility was 13.50
compared to 21.24 in 2016. Advances and relative
stability of oil prices during 2017 had a positive
contribution to the index performance (Chart 8.1).
Chart 8.1: TASI & Oil Prices Correlation
The turnover was very sensitive to the
reforms and uncertainty looming in the horizon.
It declined by 27.0 percent year-on-year while the
market index performance increased by 0.22 percent
during 2017 (Chart 8.2).
Chart 8.2: TASI & Turnover
Overall, stock market capitalization
edged up slightly to SAR 1.7 Trillion in 2017,
representing 67.0 percent of GDP compared to
69.4 percent in 2016. The number of companies
listed in the main market increased to 179, and the
number of Authorized Persons (APs: brokerage
companies, asset management and investment
banking) increased to 86 compared to 83 in 2016
(Chart 8.3).
Chart 8.3: Market Size
0
20
40
60
80
100
120
0
2000
4000
6000
8000
10000
12000
Jan-13 Jan-14 Jan-15 Jan-16 Jan-17
TASI Index Oil Price
US.
Do
llar
Po
int
Source: Bloomberg
0
50
100
150
200
250
300
4000
6000
8000
10000
12000
Jan-1
3
Jul-
13
Jan-1
4
Jul-
14
Jan-1
5
Jul-
15
Jan-1
6
Jul-
16
Jan-1
7
Jul-
17
Turnover TASI
SAR
Bill
ion
Po
int
Source: Bloomberg
50
100
150
200
0
500
1,000
1,500
2,000
2013 2014 2015 2016 2017
Market Cap Listed Companies
Authorized Persons
Bil
lion
SA
R
Nu
mb
er o
f C
om
pan
ies
& A
P's
Source: CMA

Capital Market Stability
Financial Stability Report 2018 61
8.2 Capital Market Activities
At large, number of Capital market
activities in 2017 outperformed the five year
averages and their values posted better numbers
in all issuance activities compare to 2016 figures.
Through 213 financing operations in the market, total
value of issuances reached SAR 36.1 billion in 2017,
increasing by 26.2 percent as compared to last year,
and 20.3 percent below the 5-year average (Chart
8.4 & 8.5). Number of IPOs rose to 10 operations, 9
of them were through the parallel equity market
Nomu (see Box (8.1)).
Chart 8.4: Capital Market Activities (Number of
Activities)
Chart 8.5: Total Issuance Value
*Not Including Government Issuance.
There was a notable drop in trading
activity. The traded value witnessed a sharp decrease
reaching to SAR 836 Billion compared to SAR 1,570
Billion in 2016. Likewise, the total number of share
traded in 2017 decreased by 36.0 percent compared
to 2016, and below the five years average by 27.9
percent (Chart 8.6).
Chart 8.6: Number and Value of Share Traded
There was little change in the sectors
were trading activity was concentrated in. The
trading was concentrated in five sectors that
represent 73.1 percent out of the total trading value
of the market, which amounts to 611 Billion SAR.
The banking sector has the largest percent of the total
traded value that reached 23.3 percent which
represents SAR 194 Billion out of the total traded
value in 2017 (Chart 8.7).
Chart 8.7: Concentration as Percent of Value Share
Traded by Sectors
0
40
80
120
IPOs Public
Debt
Offers
Rights
Issue
Private
Placement
(Equity &
Debt)
Public
Funds
M&A
5 Years Ave. 2017 Activities.
Source: CMA
0
20
40
60
80
2013 2014 2015 2016 2017
Public Debt Offers
Rights Issue
Private Placement (Equity & Debt)*
IPOs
Bill
ion
SA
R
Source: CMA
30
40
50
60
70
80
0
500
1,000
1,500
2,000
2,500
2013 2014 2015 2016 2017
Value of shares traded - SAR Billion
# of share traded - Billion Shares
Source: CMA
Bill
ion
SA
R
Bill
ion
Sh
ares
0%
10%
20%
30%
Ban
ks
Mat
eria
ls
Insu
ran
ce
Rea
l Est
ate
Mgm
t&
Dev
't
Foo
d &
Bev
erag
es
oth
er
2016 2017
Source: CMA
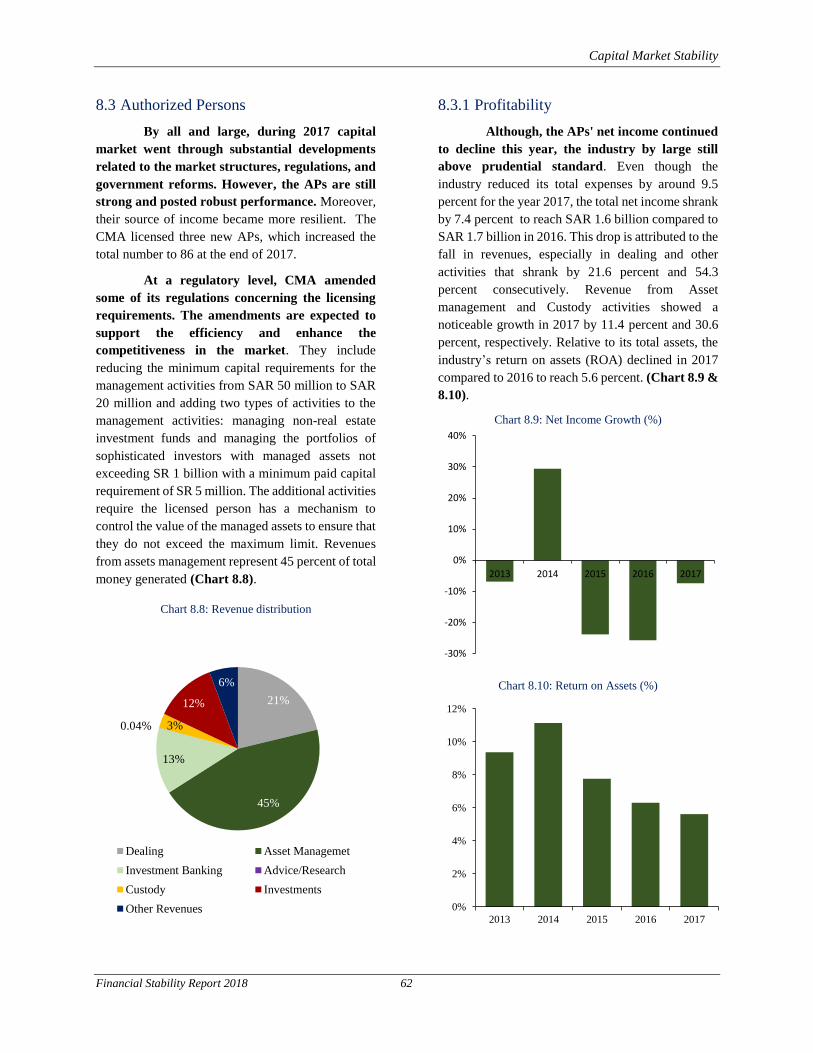
Capital Market Stability
Financial Stability Report 2018 62
8.3 Authorized Persons
By all and large, during 2017 capital
market went through substantial developments
related to the market structures, regulations, and
government reforms. However, the APs are still
strong and posted robust performance. Moreover,
their source of income became more resilient. The
CMA licensed three new APs, which increased the
total number to 86 at the end of 2017.
At a regulatory level, CMA amended
some of its regulations concerning the licensing
requirements. The amendments are expected to
support the efficiency and enhance the
competitiveness in the market. They include
reducing the minimum capital requirements for the
management activities from SAR 50 million to SAR
20 million and adding two types of activities to the
management activities: managing non-real estate
investment funds and managing the portfolios of
sophisticated investors with managed assets not
exceeding SR 1 billion with a minimum paid capital
requirement of SR 5 million. The additional activities
require the licensed person has a mechanism to
control the value of the managed assets to ensure that
they do not exceed the maximum limit. Revenues
from assets management represent 45 percent of total
money generated (Chart 8.8).
Chart 8.8: Revenue distribution
8.3.1 Profitability
Although, the APs' net income continued
to decline this year, the industry by large still
above prudential standard. Even though the
industry reduced its total expenses by around 9.5
percent for the year 2017, the total net income shrank
by 7.4 percent to reach SAR 1.6 billion compared to
SAR 1.7 billion in 2016. This drop is attributed to the
fall in revenues, especially in dealing and other
activities that shrank by 21.6 percent and 54.3
percent consecutively. Revenue from Asset
management and Custody activities showed a
noticeable growth in 2017 by 11.4 percent and 30.6
percent, respectively. Relative to its total assets, the
industry’s return on assets (ROA) declined in 2017
compared to 2016 to reach 5.6 percent. (Chart 8.9 &
8.10).
Chart 8.9: Net Income Growth (%)
Chart 8.10: Return on Assets (%)
21%
45%
13%
0.04% 3%
12%
6%
Dealing Asset Managemet
Investment Banking Advice/Research
Custody Investments
Other Revenues
-30%
-20%
-10%
0%
10%
20%
30%
40%
2013 2014 2015 2016 2017
0%
2%
4%
6%
8%
10%
12%
2013 2014 2015 2016 2017

Capital Market Stability
Financial Stability Report 2018 63
The level of diversification is an
important element when assessing the quality of
assets. APs' portfolio investments are adequately
diversified with a tendency to invest more in the
real estate sector over the last three years. The
majority of industry capital was channelled through
investment funds, reaching 59.0 percent of total
investments in 2017. Real estate ranks second and
accounts for 26.3 percent in 2017 (Chart 8.11).
Chart 8.11: Breakdown of APs Investments in Various
Asset Classes
8.3.2 Capital Adequacy
The capital to risk-weighted assets ratio
reached 26.9 percent compared with 27.4 percent
at the end of 2016, which remains high. Capital
adequacy regulations play critical role in ensuring
sound and effective business management.
According to recent data, APs licensed to conduct
dealing, managing and custody activities continued
to maintain an adequate level of capital at the end of
2017.
8.3.3 Liquidity
Asset liquidity is an important
determinant of the ongoing viability of financial
institutions. CMA requires APs to meet a set of
minimum liquidity requirements which assist in
identifying, measuring and managing the
corresponding liquidity risks. Liquidity within the
APs, measured by the liquid-assets to total-assets
ratio, increased slightly in 2017 to reach 64.5 percent,
compared to 60.6 percent in 2016 (Chart 8.12).
Chart 8.12: Liquid Assets to Total Assets
8.3.4 Concentration and Distribution
Brokerage and assets management
businesses remained concentrated since long. As
of 2017, 86.2 percent of the public funds' assets is
managed by only 9 APs out of 63 APs licensed as
fund managers (Chart 8.13). In-depth analysis of the
data shows concentration not only at the level of APs,
but also at the level of funds, as one single fund had
the largest share, amounting to 29.4 percent of total
public funds' assets.
Chart 8.13: Distribution of Public funds' assets by APs
With respect to equity trading, the brokerage
activities show a relatively high concentration, with
86.7 percent of trading value executed through 9 APs
out of 33 APs licensed to deal as agents (Chart 8.14).
Chart 8.14: Distribution of trading value by APs
0%
20%
40%
60%
80%
100%
2013 2014 2015 2016 2017
Real estate Private equity/subsidiaries
and sister companies
Securitization Debt instruments
Investment Funds Listed shares
0%
10%
20%
30%
40%
50%
60%
70%
80%
2013 2014 2015 2016 2017
Jadwa Investment
Fransi Capital
AlJazira Capital
HSBC
Alinma Investment
Al Rajhi Capital
Riyad Capital
SAMBA Capital
NCBC
0% 5% 10% 15% 20% 25% 30% 35%
19.6%
12.6%
11.8%
9.1%7.2%
7.1%
6.1%
5.3%
4.6% 3.3%
13.3%
Al Rajhi Capital
AlJazira Capital
NCBC
Alistithmar Capital
SAMBA Capital
HSBC
Fransi Capital
Riyad Capital
Arab investment
Derayah Investment
Others

Capital Market Stability
Financial Stability Report 2018 64
Box 8.1
Parallel Market (Nomu)
The Saudi Stock Exchange "Tadawul" launched the Parallel Market -Nomu- on Feb 2017. The main purpose of its launching is to develop the capital market structure in order to be aligned
with Vision 2030, which will support the investment diversification and stimulating the economic growth. Nomu could be attractive over the main markets in many aspects as clarified in the
following table:
Criteria Parallel Market “Nomu” Main Market “TASI”
Minimum Market Cap. SR 10 million SR 100 million
% Offered 20% 30%
Operational Listing Requirements Operating for at least one year Operating for at least three years
Continuous Obligations Quarterly financial statements within 30 calendar days from the end of the period and year-end financial statements within 3 months from the end of the
period
Quarterly financial statements within 45 business days from the end of the period and year-
end financial statements within 90 business days from the end of the period
Daily Price Fluctuation 20% 10%
Admission Document Modified, less stringent application Detailed application
Cost of listing low medium
Offering Process Simpler offering process, similar to a private placement Detailed and extended
Financial and legal advisor during IPO Financial advisor mandatory, legal advisor optional Financial advisor and legal advisor are mandatory
By the end of 2017, the number of listed companies in the parallel market -Nomu- reached nine companies that have offered value SAR 752.4 Million, and the total market capitalization
SAR 2.6 Billion. Parallel Market – Nomu- Summary During 2017:
Shares Traded Transaction Value of Shares Traded (000,000 SAR)
70.64 (000,000) 78.77 (000) 1,805.96 Total 2017
336.38 (000) 375.08 8.6 Daily Ave.
The highest close position for Parallel Market –Nomu- was 6037 points, where the index closed at 3140.01 by the end of 2017.Nomu is targeting sophisticated investors that obtained the
CMA's requirements in order to enter the market, which can contribute to the sustainability of the market.
0
200
400
600
800
Feb-17 Mar-17 Apr-17 May-17 Jun-17 Jul-17 Aug-17 Sep-17 Oct-17 Nov-17 Dec-17
Traded Value
Mill
ion
SA
R
Index
Source: Tadawul


