Financial Statement 2005
6 March 2006
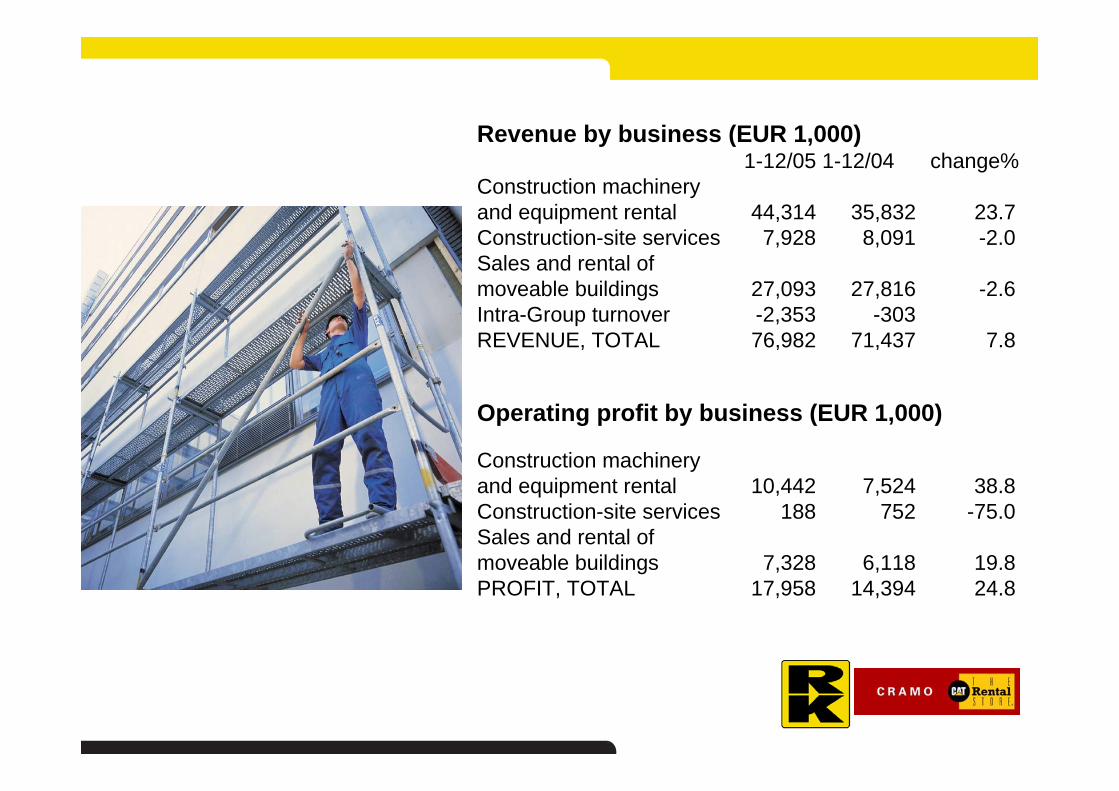
Revenue by business (EUR 1,000)1-12/05 1-12/04 change%
Construction machineryand equipment rental 44,314 35,832 23.7Construction-site services 7,928 8,091 -2.0Sales and rental ofmoveable buildings 27,093 27,816 -2.6Intra-Group turnover -2,353 -303REVENUE, TOTAL 76,982 71,437 7.8
Operating profit by business (EUR 1,000)
Construction machinery and equipment rental 10,442 7,524 38.8Construction-site services 188 752 -75.0Sales and rental ofmoveable buildings 7,328 6,118 19.8PROFIT, TOTAL 17,958 14,394 24.8
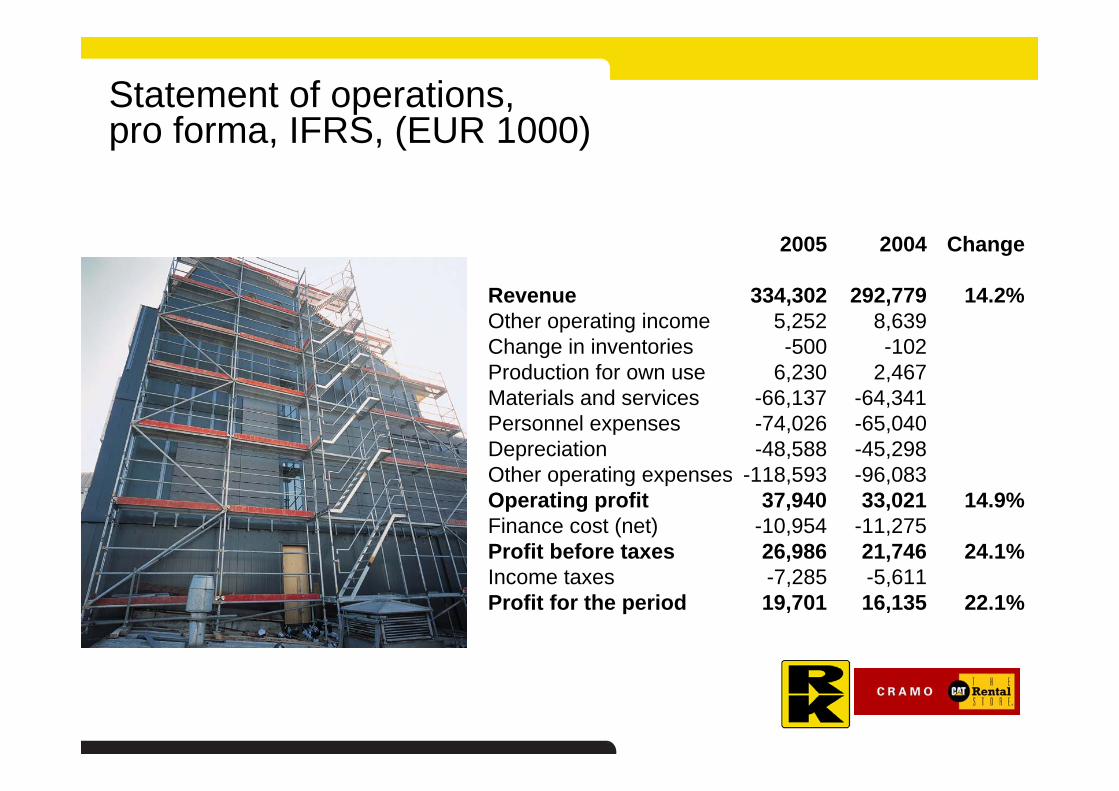
Statement of operations, pro forma, IFRS, (EUR 1000)
2005 2004 Change
Revenue 334,302 292,779 14.2%Other operating income 5,252 8,639Change in inventories -500 -102Production for own use 6,230 2,467Materials and services -66,137 -64,341Personnel expenses -74,026 -65,040Depreciation -48,588 -45,298Other operating expenses -118,593 -96,083Operating profit 37,940 33,021 14.9%Finance cost (net) -10,954 -11,275Profit before taxes 26,986 21,746 24.1%Income taxes -7,285 -5,611Profit for the period 19,701 16,135 22.1%

Key figures, pro forma, IFRS, (EUR 1000)
2005 2004
Revenue 334,302 292,779Operating profit 37,940 33,021Operating profit, % of revenue 11.3 11.3Profit before taxes 26,986 21,746Profit before taxes, % of revenue 8.1 7.4Equity ratio,% 38.2Gross investment on non-current assets 92,172 98,135Gross investment on non-current assets, % of revenue 27.6 33.5Average number of employees during the period 1,646 1,537Gearing, % 117.0Interest-bearing net debt 293,080Earnings per share, basic 0.66 0.54Number of shares, basic 30,015,501Earnings per share, diluted 0.65 0.53Number of shares, diluted 30,375,369

31.12.2005 Balance Sheet, Pro forma, IFRS (EUR 1,000)
670,428Total equity and liabilities122,771Current liabilities261,442Non-current liabilities
35,063Deferred income tax liabilities740Provisions
250,412Total equityEquity and liabilities
670,438Total assets22,631Cash and cash equivalents71,341Trade and other receivables10,292Inventories
Current assets9,695Deferred income tax assets1,107Receivables
577Available-for-sale investments 52,931Other intangible assets
184,319Goodwill317,535Property, plant and equipment
Non-current assetsAssets
The European rental market

European rental market sizeRental revenue (EUR in billions)
UK 5Germany 3France 3Nordic/Baltic 1.4Spain 0.8Netherlands 0.6Rest of Europe 1.3Total Europe 15
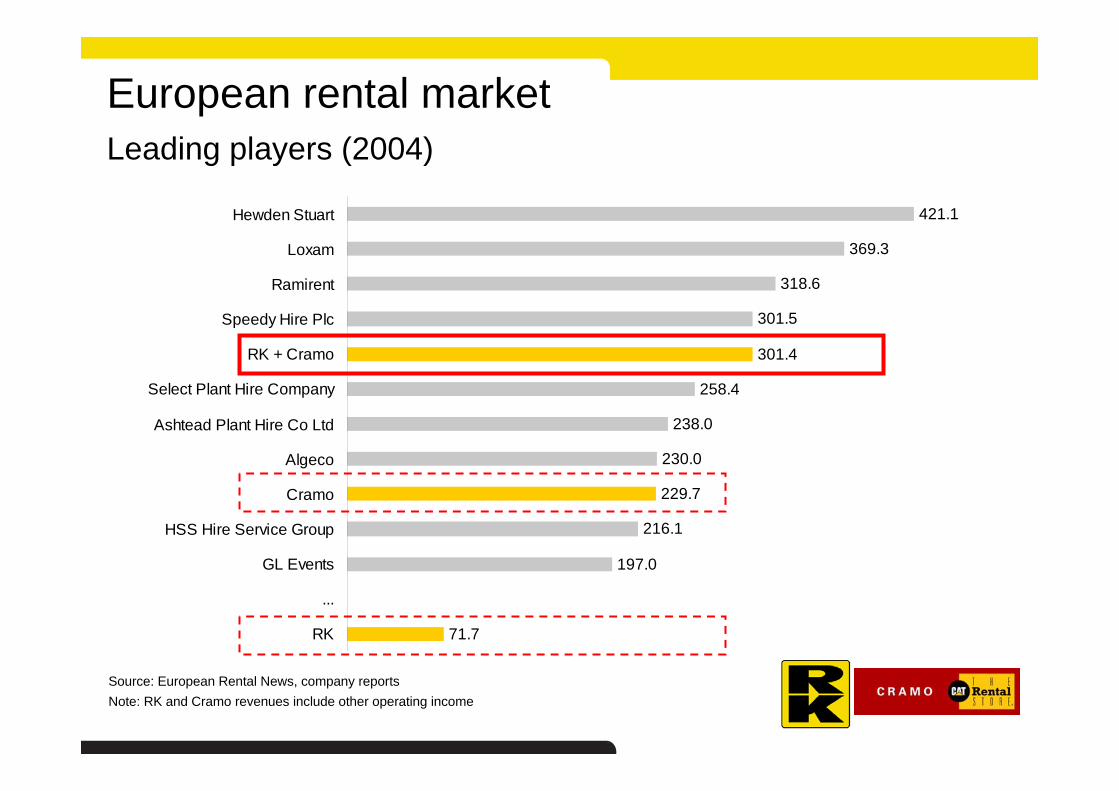
European rental marketLeading players (2004)
Source: European Rental News, company reportsNote: RK and Cramo revenues include other operating income
421.1
369.3
318.6
301.5
301.4
258.4
238.0
230.0
229.7
216.1
197.0
71.7
Hewden Stuart
Loxam
Ramirent
Speedy Hire Plc
RK + Cramo
Select Plant Hire Company
Ashtead Plant Hire Co Ltd
Algeco
Cramo
HSS Hire Service Group
GL Events
...
RK
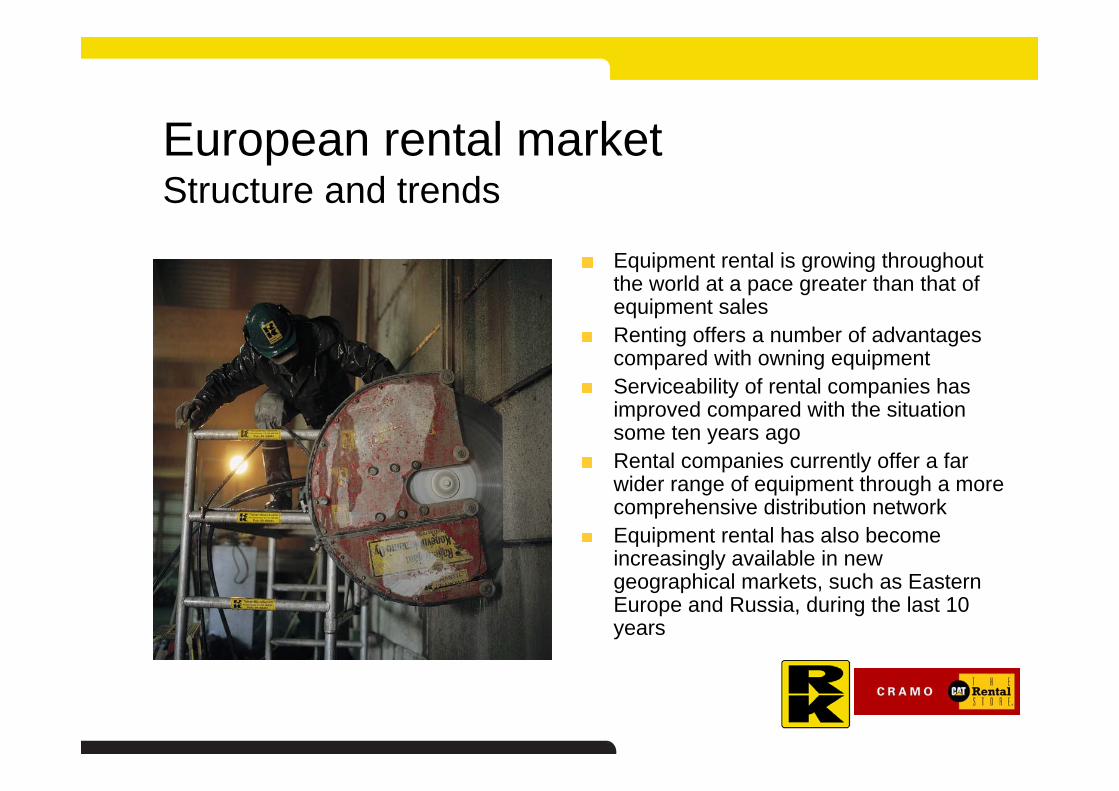
European rental marketStructure and trends
Equipment rental is growing throughout the world at a pace greater than that of equipment salesRenting offers a number of advantages compared with owning equipmentServiceability of rental companies has improved compared with the situation some ten years agoRental companies currently offer a far wider range of equipment through a more comprehensive distribution networkEquipment rental has also become increasingly available in new geographical markets, such as Eastern Europe and Russia, during the last 10 years

European rental market Rental penetration
The UK rental market is most developed and representing a penetration level of some 80 percent.Rental revenues in Germany (penetration some 20 percent) and France (penetration some 25 percent) amount to EUR 3 billion each.Sweden has the highest penetration in Scandinavia, amounting to some 40 percent, with Denmark, Norway and Finland having penetration levels of some 30 percent, respectively.The rental markets in Eastern Europe and Russia are clearly less developed with rental penetration levels estimated to be considerably less than 10 percent.
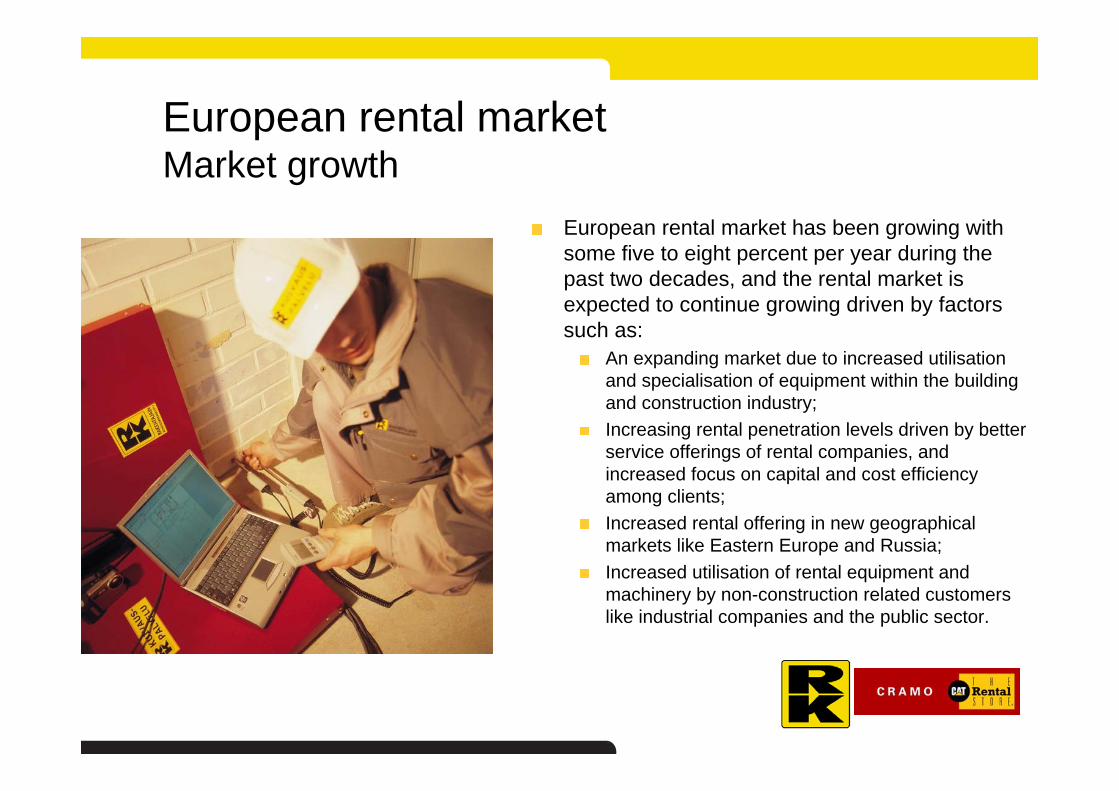
European rental marketMarket growth
European rental market has been growing with some five to eight percent per year during the past two decades, and the rental market is expected to continue growing driven by factors such as:
An expanding market due to increased utilisationand specialisation of equipment within the building and construction industry;Increasing rental penetration levels driven by better service offerings of rental companies, and increased focus on capital and cost efficiency among clients;Increased rental offering in new geographical markets like Eastern Europe and Russia;Increased utilisation of rental equipment and machinery by non-construction related customers like industrial companies and the public sector.
Source: European Rental 11-12/2005
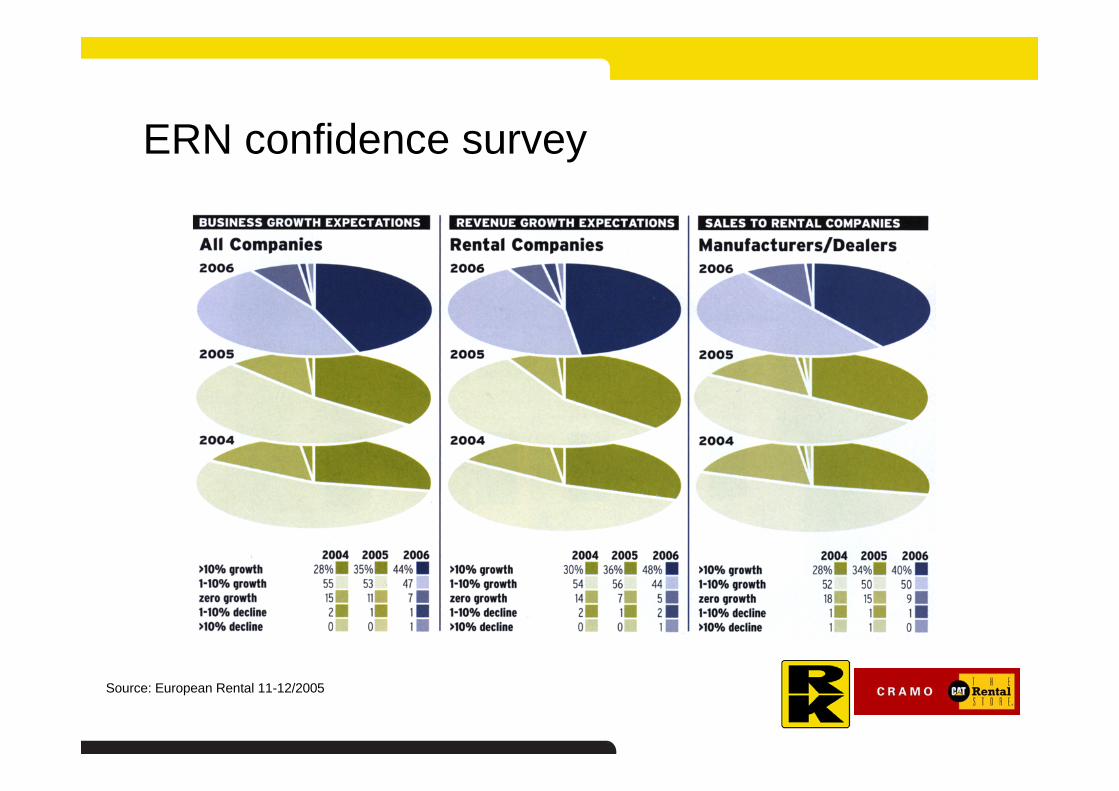
ERN confidence survey

.
Source: European Rental 11-12/2005
Rental companies - Planning for 2006

ERN confidence survey
84 % of rental companies plan to expand their fleets in 2006 (78 % in 2005).70 % will increase their investment in new fleet and almost one in five (twice the 2004 figure) will invest “much more”.Approximately half of the all rental businesses expect their revenue to grow by more than 10 % next year (up from 36 %).
Source: European Rental 11-12/2005
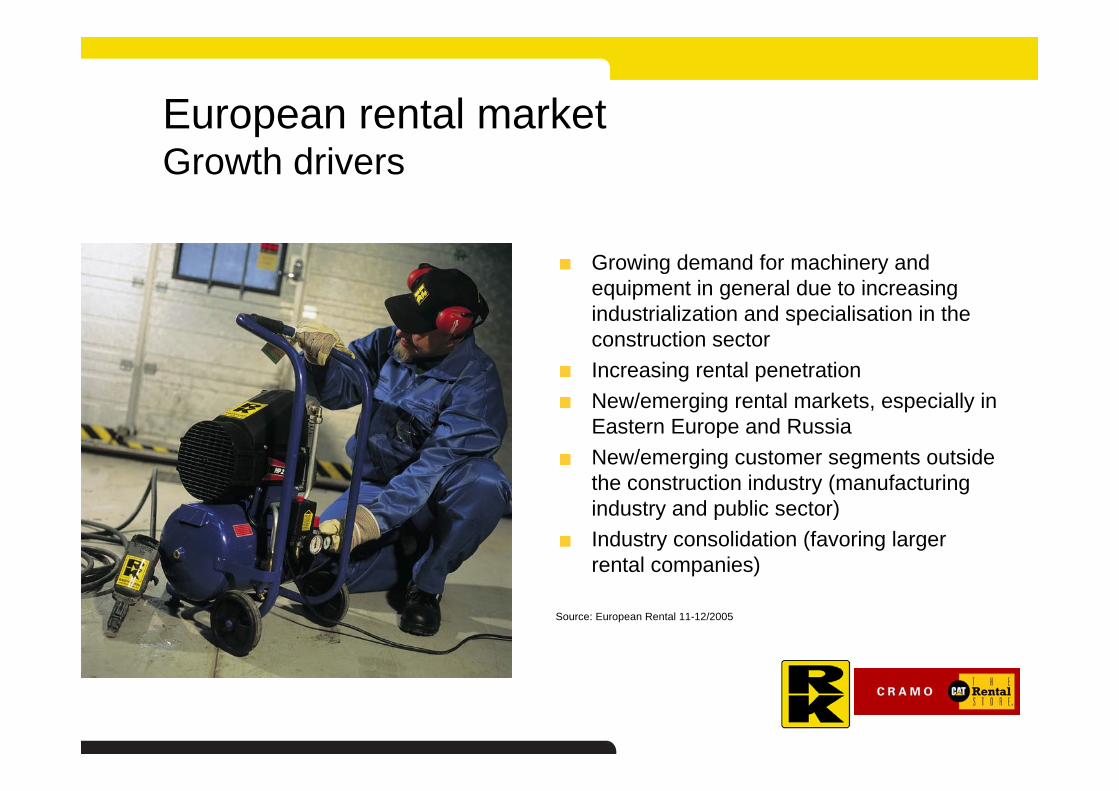
European rental market Growth drivers
Growing demand for machinery and equipment in general due to increasing industrialization and specialisation in the construction sectorIncreasing rental penetrationNew/emerging rental markets, especially in Eastern Europe and RussiaNew/emerging customer segments outside the construction industry (manufacturing industry and public sector)Industry consolidation (favoring larger rental companies)
Source: European Rental 11-12/2005

The RK Group
Company vision
To be the rental company of choice for all local and international customers in markets of presence
To be a market leader, and among the top three European rental companies in terms of sales
To be a market leader, and among the top three rental companies in
every market of presence

Customers
Within general equipment rental customer segments include construction companies, trade and industry, the public sector, entrepreneurs, and retail customers. National and regional construction companies form the largest customer segments.Within modular space the customer segments are trade and industry, and the public sector.New Group will have a large and diversified customer base, ranging from retail customers to large international companies.
Suppliers
The suppliers of New Group consist of manufacturers of equipment and machinery. Cramo has also suppliers of modules, while RK has an own production facility for modules. New Group will have several suppliers and will not be dependant of any single supplier.The operational idea of New Group is based on efficient renting services of machinery and equipment.
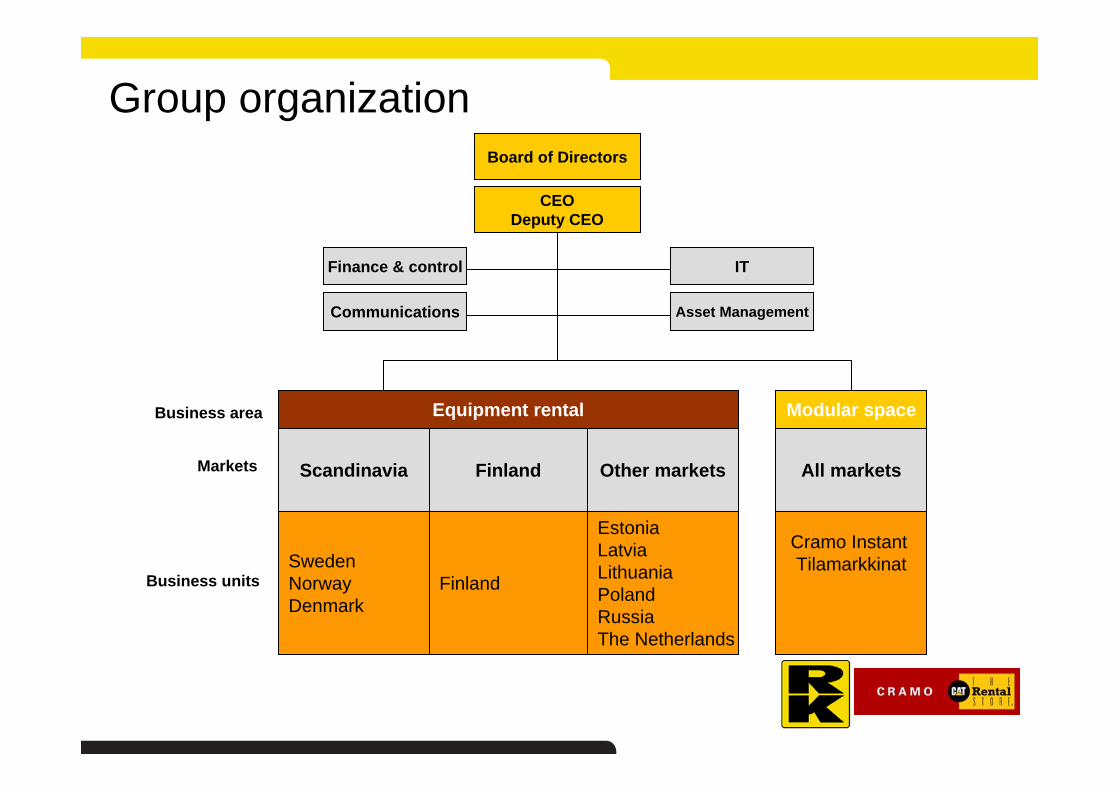
Group organization
Business area
Business units
Equipment rental
Asset Management
Board of Directors
Scandinavia Finland Other markets
CEODeputy CEO
IT
Communications
Finance & control
SwedenNorwayDenmark
Finland
EstoniaLatviaLithuaniaPolandRussiaThe Netherlands
Cramo Instant Tilamarkkinat
Modular space
All marketsMarkets
Group management
Executive CommitteeVesa Koivula, CEOGöran Carlson, deputy CEOMartti Ala-Härkönen, CFO
Enlarged Executive CommitteeExecutive Committee together with:Tatu Hauhio, Senior Vice President, FinlandJarmo Laasanen, Senior Vice President, Other MarketsMagnus Rosén, Senior Vice President, ScandinaviaAnders Collman, Head of Corporate CommunicationsHans König, Head of ITMats Stenholm, Head of Asset ManagementTo be appointed: Senior Vice President, Modular space

Group organization and management
The operations of the new Group are organized in two business areas Equipment Rental and Modular Space.Equipment rental is further divided in three market areas – Scandinavia, Finland, and Other markets – under which the business units (the equipment rental operations per country) are organized.Modular space includes two separate business units: Cramo Instant (Sweden, Denmark, Norway), and Tilamarkkinat (Finland).

Group organization and managementOn the corporate level there are four functional support units:
Finance & Control (financing, treasury, group accounting, tax, budget control, management reporting)Asset Management (product brand selection, supplier contracts, procurement, product application and product market competence)Communications (brand management, marketing support, investor and public relations, internal communication)IT (installation, maintenance, infrastructure and server operations, IT Helpdesk, workstation administration, application and process development, IT project management)

Position to grow

Strategy of combination
Creating shareholder value by excelling as an industrial services company
Meeting the machinery, equipment and modular space needs of customers in industry, construction, retail and the public sector, andProviding easy accessibility, and actively developing new concepts to satisfy shot and long term needs of clients
TargetsBest rental services provider to local and international customersMarket leader in Northern EuropeEuropean top 3 playerTop 3 player in every market of presenceGeographic expansion in Russia and Eastern Europe
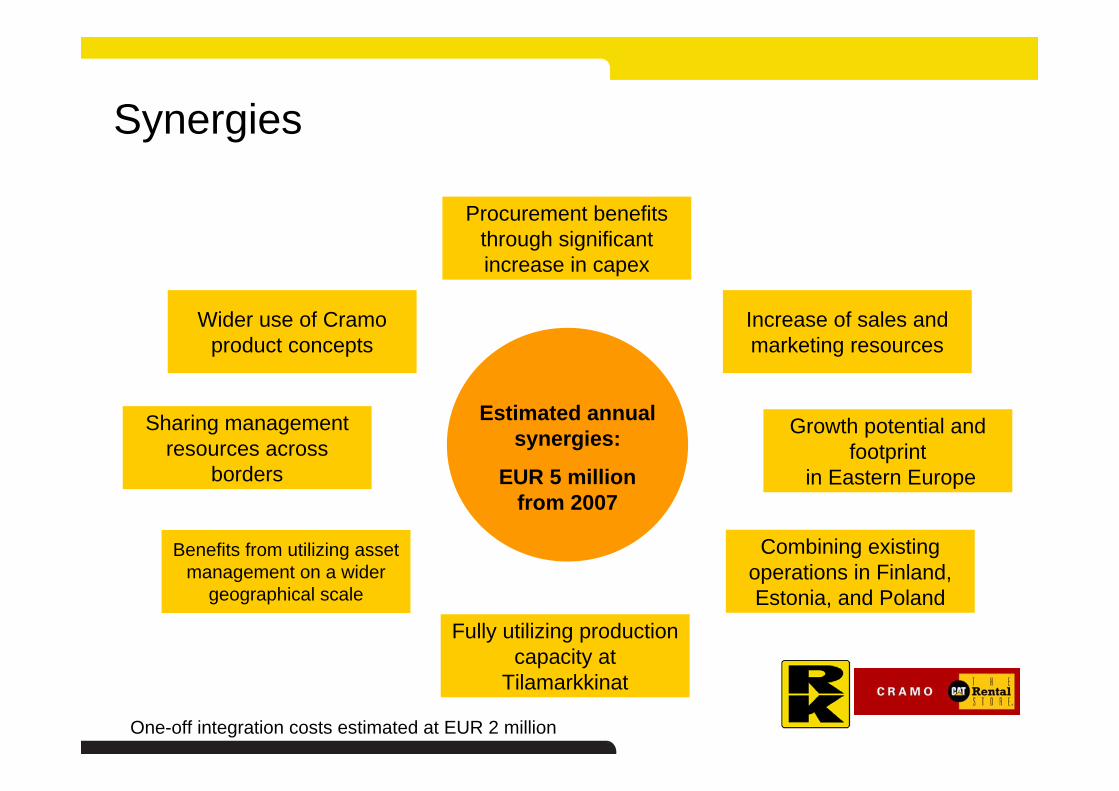
Synergies
Wider use of Cramo product concepts
Sharing management resources across
borders
Procurement benefits through significant increase in capex
Benefits from utilizing asset management on a wider
geographical scale
Fully utilizing production capacity at
Tilamarkkinat
Combining existing operations in Finland, Estonia, and Poland
Increase of sales and marketing resources
Growth potential and footprint
in Eastern Europe
Estimated annual synergies:
EUR 5 million from 2007
One-off integration costs estimated at EUR 2 million

Two strong players unite
78Rental Depots
79.9Sales
Finland
31Rental Depots
12.9Sales
Other Europe
16Rental Depots
21.1Sales
Norway
154.6Sales (EUR million)
101Rental Depots (#)
Sweden
9Rental Depots
13.6Sales
Denmark
8Rental Depots
10.6Sales
Netherlands
Sweden & Finland: 80% of combined
revenues
#1#1
#1
Note: Other Europe includes Estonia, Poland, Latvia, Lithuania and Russia


