
Statistical Series
Financial statement statistics (ratios – provisional data)May 2021

Deutsche Bundesbank
Wilhelm-Epstein-Straße 14
60431 Frankfurt am Main
Germany
Postfach 10 06 02
60006 Frankfurt am Main
Germany
Tel.: +49 (0)69 9566 3512
E-Mail: www.bundesbank.de/contact
Information pursuant to Section 5 of the German Tele-
media Act (Telemediengesetz) can be found at:
www.bundesbank.de/imprint
Reproduction permitted only if source is stated.
ISSN 2699-9226
Finalized in May 2021.
Deutsche Bundesbank
Financial statement statistics (ratios – provisional data)
May 2021
2
This Statistical Series is released once a year and published
on the basis of Section 18 of the Bundesbank Act (Gesetz
über die Deutsche Bundesbank).
To be informed when new issues of this Statistical Series
are published, subscribe to the newsletter at:
www.bundesbank.de/statistik-newsletter_en
Up-to-date information and time series are also available
online at:
www.bundesbank.de/content/821976
www.bundesbank.de/timeseries
Further statistics compiled by the Deutsche Bundesbank
can also be accessed at the Bundesbank web pages.
A publication schedule for selected statistics can be viewed
on the following page:
www.bundesbank.de/statisticalcalender
Contents
Explanatory Notes . . . . . . . . . . . . . . . . . . . . . . . . . . . . . . . . . . . . . . . . . . . . . . . . . . . . . . . . . . . . . 6
I. Enterprises by economic sector
1. All economic sectors (without Real estate activities and without Activities of head offices) . . . . . . . . . . . . . . . 16
2. Agriculture, forestry and fishing . . . . . . . . . . . . . . . . . . . . . . . . . . . . . . . . . . . . . . . . . . . . . . . . . . . . . . . . . . . 22
3. Mining and quarrying . . . . . . . . . . . . . . . . . . . . . . . . . . . . . . . . . . . . . . . . . . . . . . . . . . . . . . . . . . . . . . . . . . 24
4. Manufacturing . . . . . . . . . . . . . . . . . . . . . . . . . . . . . . . . . . . . . . . . . . . . . . . . . . . . . . . . . . . . . . . . . . . . . . . 26
a) Manufacture of food products . . . . . . . . . . . . . . . . . . . . . . . . . . . . . . . . . . . . . . . . . . . . . . . . . . . . . . . . . 32
b) Manufacture of beverages . . . . . . . . . . . . . . . . . . . . . . . . . . . . . . . . . . . . . . . . . . . . . . . . . . . . . . . . . . . . 34
c) Manufacture of textiles . . . . . . . . . . . . . . . . . . . . . . . . . . . . . . . . . . . . . . . . . . . . . . . . . . . . . . . . . . . . . . . 36
d) Manufacture of wood and of products of wood and cork, except furniture. . . . . . . . . . . . . . . . . . . . . . . . 38
e) Manufacture of paper and paper products . . . . . . . . . . . . . . . . . . . . . . . . . . . . . . . . . . . . . . . . . . . . . . . . 40
f) Printing and reproduction of recorded media . . . . . . . . . . . . . . . . . . . . . . . . . . . . . . . . . . . . . . . . . . . . . . 42
g) Manufacture of chemicals and chemical products . . . . . . . . . . . . . . . . . . . . . . . . . . . . . . . . . . . . . . . . . . . 44
h) Manufacture of basic pharmaceutical products and pharmaceutical preparations . . . . . . . . . . . . . . . . . . . 46
i) Manufacture of rubber and plastic products . . . . . . . . . . . . . . . . . . . . . . . . . . . . . . . . . . . . . . . . . . . . . . . 48
j) Manufacture of other non-metallic mineral products. . . . . . . . . . . . . . . . . . . . . . . . . . . . . . . . . . . . . . . . . 50
k) Manufacture of basic metals . . . . . . . . . . . . . . . . . . . . . . . . . . . . . . . . . . . . . . . . . . . . . . . . . . . . . . . . . . . 52
l) Manufacture of fabricated metal products, except machinery and equipment . . . . . . . . . . . . . . . . . . . . . . 54
m) Manufacture of computer, electronic and optical products . . . . . . . . . . . . . . . . . . . . . . . . . . . . . . . . . . . . 56
n) Manufacture of electrical equipment . . . . . . . . . . . . . . . . . . . . . . . . . . . . . . . . . . . . . . . . . . . . . . . . . . . . 58
o) Manufacture of machinery and equipment (not elsewhere classified) . . . . . . . . . . . . . . . . . . . . . . . . . . . . 60
p) Manufacture of motor vehicles, trailers and semi-trailers . . . . . . . . . . . . . . . . . . . . . . . . . . . . . . . . . . . . . . 62
q) Manufacture of other transport equipment . . . . . . . . . . . . . . . . . . . . . . . . . . . . . . . . . . . . . . . . . . . . . . . . 64
r) Manufacture of furniture . . . . . . . . . . . . . . . . . . . . . . . . . . . . . . . . . . . . . . . . . . . . . . . . . . . . . . . . . . . . . 66
s) Other manufacturing . . . . . . . . . . . . . . . . . . . . . . . . . . . . . . . . . . . . . . . . . . . . . . . . . . . . . . . . . . . . . . . . 68
t) Repair and installation of machinery and equipment . . . . . . . . . . . . . . . . . . . . . . . . . . . . . . . . . . . . . . . . . 70
5. Electricity, gas, steam and air conditioning supply . . . . . . . . . . . . . . . . . . . . . . . . . . . . . . . . . . . . . . . . . . . . . 72
6. Water supply; sewerage, waste management and remediation activities . . . . . . . . . . . . . . . . . . . . . . . . . . . . 74
7. Construction . . . . . . . . . . . . . . . . . . . . . . . . . . . . . . . . . . . . . . . . . . . . . . . . . . . . . . . . . . . . . . . . . . . . . . . . . 76
a) Construction of buildings . . . . . . . . . . . . . . . . . . . . . . . . . . . . . . . . . . . . . . . . . . . . . . . . . . . . . . . . . . . . . 82
b) Civil engineering . . . . . . . . . . . . . . . . . . . . . . . . . . . . . . . . . . . . . . . . . . . . . . . . . . . . . . . . . . . . . . . . . . . . 84
c) Specialised construction activities . . . . . . . . . . . . . . . . . . . . . . . . . . . . . . . . . . . . . . . . . . . . . . . . . . . . . . . 86
8. Wholesale and retail trade; repair of motor vehicles and motorcycles . . . . . . . . . . . . . . . . . . . . . . . . . . . . . . . 88
a) Wholesale and retail trade and repair of motor vehicles and motorcycles . . . . . . . . . . . . . . . . . . . . . . . . . 94
b) Wholesale trade, except of motor vehicles and motorcycles . . . . . . . . . . . . . . . . . . . . . . . . . . . . . . . . . . . 100
c) Retail trade, except of motor vehicles and motorcycles . . . . . . . . . . . . . . . . . . . . . . . . . . . . . . . . . . . . . . . 106
9. Transportation and storage . . . . . . . . . . . . . . . . . . . . . . . . . . . . . . . . . . . . . . . . . . . . . . . . . . . . . . . . . . . . . . 112
a) Land transport and transport via pipelines . . . . . . . . . . . . . . . . . . . . . . . . . . . . . . . . . . . . . . . . . . . . . . . . . 118
b) Warehousing and support activities for transportation . . . . . . . . . . . . . . . . . . . . . . . . . . . . . . . . . . . . . . . 120
10. Accommodation and food service activities . . . . . . . . . . . . . . . . . . . . . . . . . . . . . . . . . . . . . . . . . . . . . . . . . . 122
11. Information and communication . . . . . . . . . . . . . . . . . . . . . . . . . . . . . . . . . . . . . . . . . . . . . . . . . . . . . . . . . . 124
a) Publishing activities . . . . . . . . . . . . . . . . . . . . . . . . . . . . . . . . . . . . . . . . . . . . . . . . . . . . . . . . . . . . . . . . . . 126
b) Motion picture, video and television programme production, sound recording and music publishing
activities; programming and broadcasting activities . . . . . . . . . . . . . . . . . . . . . . . . . . . . . . . . . . . . . . . . . . 128
c) Telecommunications . . . . . . . . . . . . . . . . . . . . . . . . . . . . . . . . . . . . . . . . . . . . . . . . . . . . . . . . . . . . . . . . . 130
d) Computer programming, consultancy and related activities; information service activities . . . . . . . . . . . . . 132
Deutsche Bundesbank
Financial statement statistics (ratios – provisional data)
May 2021
3
12. Real estate activities . . . . . . . . . . . . . . . . . . . . . . . . . . . . . . . . . . . . . . . . . . . . . . . . . . . . . . . . . . . . . . . . . . . 134
13. Business services . . . . . . . . . . . . . . . . . . . . . . . . . . . . . . . . . . . . . . . . . . . . . . . . . . . . . . . . . . . . . . . . . . . . . . 140
a) Legal and accounting activities; management consultancy activities . . . . . . . . . . . . . . . . . . . . . . . . . . . . . 142
b) Architectural and engineering activities; technical testing and analysis . . . . . . . . . . . . . . . . . . . . . . . . . . . . 144
c) Scientific research and development . . . . . . . . . . . . . . . . . . . . . . . . . . . . . . . . . . . . . . . . . . . . . . . . . . . . . 146
d) Advertising and market research . . . . . . . . . . . . . . . . . . . . . . . . . . . . . . . . . . . . . . . . . . . . . . . . . . . . . . . . 148
e) Rental and leasing activities . . . . . . . . . . . . . . . . . . . . . . . . . . . . . . . . . . . . . . . . . . . . . . . . . . . . . . . . . . . 150
f) Employment activities . . . . . . . . . . . . . . . . . . . . . . . . . . . . . . . . . . . . . . . . . . . . . . . . . . . . . . . . . . . . . . . . 152
g) Travel agency, tour operator and other reservation service and related activities . . . . . . . . . . . . . . . . . . . . 154
h) Services to buildings and landscape activities . . . . . . . . . . . . . . . . . . . . . . . . . . . . . . . . . . . . . . . . . . . . . . 156
14. Personal service activities . . . . . . . . . . . . . . . . . . . . . . . . . . . . . . . . . . . . . . . . . . . . . . . . . . . . . . . . . . . . . . . . 158
a) Education . . . . . . . . . . . . . . . . . . . . . . . . . . . . . . . . . . . . . . . . . . . . . . . . . . . . . . . . . . . . . . . . . . . . . . . . . 160
b) Human health activities. . . . . . . . . . . . . . . . . . . . . . . . . . . . . . . . . . . . . . . . . . . . . . . . . . . . . . . . . . . . . . . 162
c) Residential care activities. . . . . . . . . . . . . . . . . . . . . . . . . . . . . . . . . . . . . . . . . . . . . . . . . . . . . . . . . . . . . . 164
d) Social work activities without accommodation . . . . . . . . . . . . . . . . . . . . . . . . . . . . . . . . . . . . . . . . . . . . . 166
15. Activities of head offices . . . . . . . . . . . . . . . . . . . . . . . . . . . . . . . . . . . . . . . . . . . . . . . . . . . . . . . . . . . . . . . . 168
II. Enterprises by selected legal form
1. Public limited companies . . . . . . . . . . . . . . . . . . . . . . . . . . . . . . . . . . . . . . . . . . . . . . . . . . . . . . . . . . . . . . . . 174
2. Private limited companies . . . . . . . . . . . . . . . . . . . . . . . . . . . . . . . . . . . . . . . . . . . . . . . . . . . . . . . . . . . . . . . 176
3. Cooperative societies . . . . . . . . . . . . . . . . . . . . . . . . . . . . . . . . . . . . . . . . . . . . . . . . . . . . . . . . . . . . . . . . . . . 178
4. Kapitalgesellschaften & Co . . . . . . . . . . . . . . . . . . . . . . . . . . . . . . . . . . . . . . . . . . . . . . . . . . . . . . . . . . . . . . 180
III. East German enterprises by economic sector
1. All economic sectors (without Real estate activities and without Activities of head offices) . . . . . . . . . . . . . . . 182
2. Manufacturing . . . . . . . . . . . . . . . . . . . . . . . . . . . . . . . . . . . . . . . . . . . . . . . . . . . . . . . . . . . . . . . . . . . . . . . 188
3. Construction . . . . . . . . . . . . . . . . . . . . . . . . . . . . . . . . . . . . . . . . . . . . . . . . . . . . . . . . . . . . . . . . . . . . . . . . . 190
4. Wholesale and retail trade; repair of motor vehicles and motorcycles . . . . . . . . . . . . . . . . . . . . . . . . . . . . . . . 192
IV. Enterprises by federal state and economic sector
1. Baden-Württemberg
a) All economic sectors . . . . . . . . . . . . . . . . . . . . . . . . . . . . . . . . . . . . . . . . . . . . . . . . . . . . . . . . . . . . . . . . . 194
b) Manufacturing . . . . . . . . . . . . . . . . . . . . . . . . . . . . . . . . . . . . . . . . . . . . . . . . . . . . . . . . . . . . . . . . . . . . . 200
2. Bavaria
a) All economic sectors . . . . . . . . . . . . . . . . . . . . . . . . . . . . . . . . . . . . . . . . . . . . . . . . . . . . . . . . . . . . . . . . . 202
b) Manufacturing . . . . . . . . . . . . . . . . . . . . . . . . . . . . . . . . . . . . . . . . . . . . . . . . . . . . . . . . . . . . . . . . . . . . . 208
3. Berlin – All economic sectors . . . . . . . . . . . . . . . . . . . . . . . . . . . . . . . . . . . . . . . . . . . . . . . . . . . . . . . . . . . . . 210
4. Brandenburg – All economic sectors . . . . . . . . . . . . . . . . . . . . . . . . . . . . . . . . . . . . . . . . . . . . . . . . . . . . . . . 212
5. Bremen – All economic sectors . . . . . . . . . . . . . . . . . . . . . . . . . . . . . . . . . . . . . . . . . . . . . . . . . . . . . . . . . . . 214
6. Hamburg – All economic sectors . . . . . . . . . . . . . . . . . . . . . . . . . . . . . . . . . . . . . . . . . . . . . . . . . . . . . . . . . . 216
7. Hesse
a) All economic sectors . . . . . . . . . . . . . . . . . . . . . . . . . . . . . . . . . . . . . . . . . . . . . . . . . . . . . . . . . . . . . . . . . 218
b) Manufacturing . . . . . . . . . . . . . . . . . . . . . . . . . . . . . . . . . . . . . . . . . . . . . . . . . . . . . . . . . . . . . . . . . . . . . 224
Deutsche Bundesbank
Financial statement statistics (ratios – provisional data)
May 2021
4
8. Mecklenburg-West Pomerania – All economic sectors . . . . . . . . . . . . . . . . . . . . . . . . . . . . . . . . . . . . . . . . . . 226
9. Lower Saxony
a) All economic sectors . . . . . . . . . . . . . . . . . . . . . . . . . . . . . . . . . . . . . . . . . . . . . . . . . . . . . . . . . . . . . . . . . 228
b) Manufacturing . . . . . . . . . . . . . . . . . . . . . . . . . . . . . . . . . . . . . . . . . . . . . . . . . . . . . . . . . . . . . . . . . . . . . 234
10. North Rhine-Westphalia
a) All economic sectors . . . . . . . . . . . . . . . . . . . . . . . . . . . . . . . . . . . . . . . . . . . . . . . . . . . . . . . . . . . . . . . . . 236
b) Manufacturing . . . . . . . . . . . . . . . . . . . . . . . . . . . . . . . . . . . . . . . . . . . . . . . . . . . . . . . . . . . . . . . . . . . . . 242
11. Rhineland-Palatinate – All economic sectors . . . . . . . . . . . . . . . . . . . . . . . . . . . . . . . . . . . . . . . . . . . . . . . . . 244
12. Saarland – All economic sectors. . . . . . . . . . . . . . . . . . . . . . . . . . . . . . . . . . . . . . . . . . . . . . . . . . . . . . . . . . . 246
13. Saxony – All economic sectors . . . . . . . . . . . . . . . . . . . . . . . . . . . . . . . . . . . . . . . . . . . . . . . . . . . . . . . . . . . . 248
14. Saxony-Anhalt – All economic sectors . . . . . . . . . . . . . . . . . . . . . . . . . . . . . . . . . . . . . . . . . . . . . . . . . . . . . . 250
15. Schleswig-Holstein – All economic sectors . . . . . . . . . . . . . . . . . . . . . . . . . . . . . . . . . . . . . . . . . . . . . . . . . . . 252
16. Thuringia – All economic sectors . . . . . . . . . . . . . . . . . . . . . . . . . . . . . . . . . . . . . . . . . . . . . . . . . . . . . . . . . . 254
Notes
The ratios shown in the tables were calculated from unrounded absolute figures.
Discrepancies in the totals are due to rounding.
Deutsche Bundesbank
Financial statement statistics (ratios – provisional data)
May 2021
5

Introduction
This publication presents preliminary non-extrapolated ra-
tios from the financial statements of German enterprises.
Its purpose is to provide the reader with an initial insight
into the financing and profitability ratios of German firms
differentiated by enterprise category for the reporting
years 2018 and 2019.
In particular, it serves to shorten the considerable time de-
lay between the end of a reporting year and the publica-
tion of final figures. Owing to the legally stipulated dead-
lines issued to small and medium-sized enterprises for the
preparation of their financial statements, which are very
long in some cases, it is not until around two years after
the end of a reporting year that the inflow of data to the
Bundesbank is complete to such an extent that final figures
can be presented.
Scope of the analysis and statistical preparation
The published ratios are based on the balance sheets and
income statements of legally independent firms domiciled
in Germany and operating outside the banking and insur-
ance sectors, which have been amalgamated in the Bun-
desbank’s Financial Statement Data Pool. The preliminary
data comprise figures which were calculated on the basis
of around 65,000 financial statements for the 2019 report-
ing year. These single-entity financial statements available
to the Bundesbank at the time of the analysis constitute
roughly three-fourth of the total data expected for the pe-
riod under review.
The ratios shown are calculated on the basis of “cylindered
samples”, which take into account only the financial state-
ments of firms for which data are available in the relevant
enterprise category for both reporting years. The advan-
tage of this procedure is that changes in ratios between
the two reporting years are not affected by changes in the
composition of the data (sample effect).
Creation of enterprise categories
The individual enterprise categories shown are derived
from many different combinations of economic sector, size
category, and legal form, whereby:
– the economic sector classification is based on the offi-
cial German Classification of Economic Activities of the
Federal Statistical Office, Edition 2008 (WZ 2008);
– differentiation by size category is in keeping with the
enterprise category classification recommended by the
EU;
– differentiation by legal form focuses mainly on distin-
guishing between the groups corporations and non-
corporations.
Corporations include public limited companies, partner-
ships limited by shares, private limited companies, coop-
erative societies and public-law institutions, foundations,
etc. Non-corporations include partnerships which take the
form of limited partnerships, including partnerships desig-
nated Kapitalgesellschaft & Co, general partnerships and
civil-law associations as well as sole proprietorships which
take the form of registered traders, craftsmen, self-em-
ployed persons, etc.
Due to the provisional nature of the data, a breakdown by
legal form is not yet possible in most sectors. As there are
initially only a few financial statements available for non-
corporations, in particular, the published data for all legal
forms are usually largely based on the financial statements
of corporations. While the ratios given in the first two
sections of the publication relate to Germany as a whole,
Section III of the publication contains selected figures for
eastern Germany (due to the problems of differentiating
between west and east Berlin, Berlin is excluded), and Sec-
tion IV contains data broken down by federal state.
Calculation and interpretation of the ratios
The ratios are calculated as weighted averages and quar-
tiles and shown for the structural ratios of the balance
sheet and the income statement as well as for other ratios.
For the weighted averages, the weights of the individual
enterprises are calculated from their relative shares in the
reference variable (e.g. balance sheet total, gross revenue,
sales, etc.). In the categories not broken down by size,
these averages are therefore affected to a very considera-
ble degree by the ratios of the large enterprises, which are
overrepresented. It is thus advisable to break the data
down by size when conducting the analysis. The quartile
Explanatory notes
Deutsche Bundesbank
Financial statement statistics (ratios – provisional data)
May 2021
6
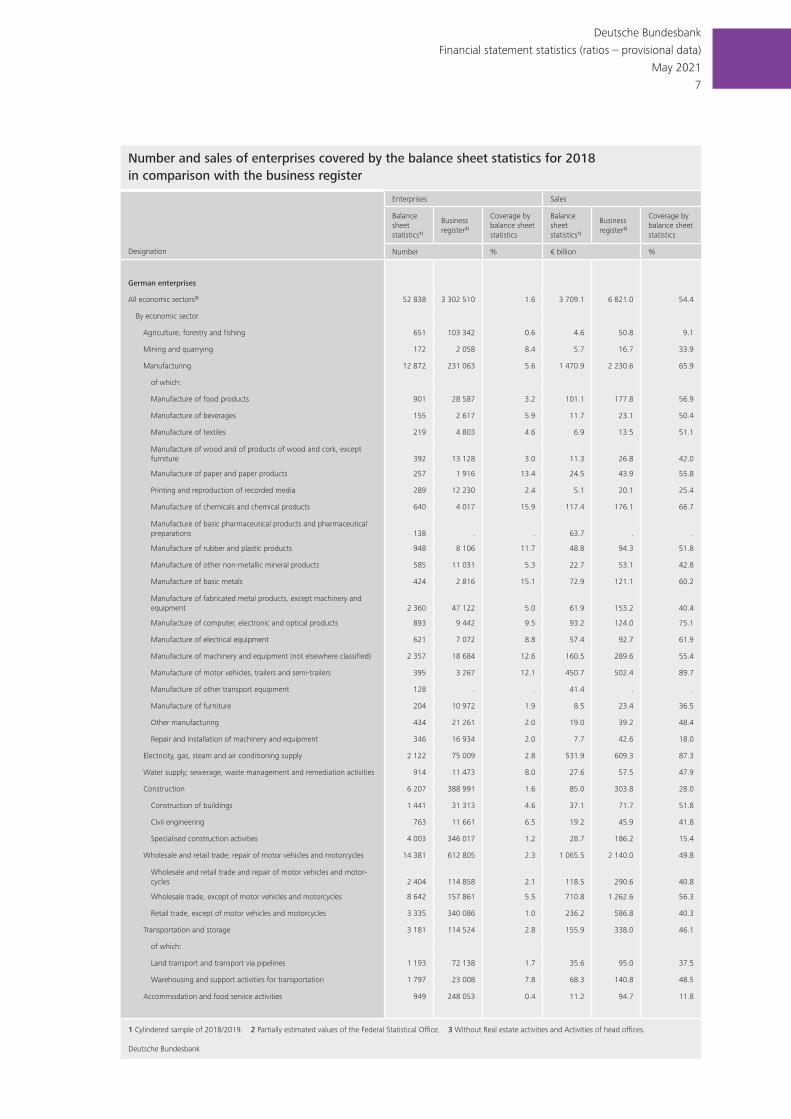
Number and sales of enterprises covered by the balance sheet statistics for 2018 in comparison with the business register
Designation
Enterprises Sales
Balance sheet statistics1)
Business register2)
Coverage by balance sheet statistics
Balance sheet statistics1)
Business register2)
Coverage by balance sheet statistics
Number % € billion %
German enterprises
All economic sectors3) 52 838 3 302 510 1.6 3 709.1 6 821.0 54.4
By economic sector
Agriculture, forestry and fishing 651 103 342 0.6 4.6 50.8 9.1
Mining and quarrying 172 2 058 8.4 5.7 16.7 33.9
Manufacturing 12 872 231 063 5.6 1 470.9 2 230.6 65.9
of which:
Manufacture of food products 901 28 587 3.2 101.1 177.8 56.9
Manufacture of beverages 155 2 617 5.9 11.7 23.1 50.4
Manufacture of textiles 219 4 803 4.6 6.9 13.5 51.1
Manufacture of wood and of products of wood and cork, except furniture 392 13 128 3.0 11.3 26.8 42.0
Manufacture of paper and paper products 257 1 916 13.4 24.5 43.9 55.8
Printing and reproduction of recorded media 289 12 230 2.4 5.1 20.1 25.4
Manufacture of chemicals and chemical products 640 4 017 15.9 117.4 176.1 66.7
Manufacture of basic pharmaceutical products and pharmaceutical preparations 138 . . 63.7 . .
Manufacture of rubber and plastic products 948 8 106 11.7 48.8 94.3 51.8
Manufacture of other non-metallic mineral products 585 11 031 5.3 22.7 53.1 42.8
Manufacture of basic metals 424 2 816 15.1 72.9 121.1 60.2
Manufacture of fabricated metal products, except machinery and equipment 2 360 47 122 5.0 61.9 153.2 40.4
Manufacture of computer, electronic and optical products 893 9 442 9.5 93.2 124.0 75.1
Manufacture of electrical equipment 621 7 072 8.8 57.4 92.7 61.9
Manufacture of machinery and equipment (not elsewhere classified) 2 357 18 684 12.6 160.5 289.6 55.4
Manufacture of motor vehicles, trailers and semi-trailers 395 3 267 12.1 450.7 502.4 89.7
Manufacture of other transport equipment 128 . . 41.4 . .
Manufacture of furniture 204 10 972 1.9 8.5 23.4 36.5
Other manufacturing 434 21 261 2.0 19.0 39.2 48.4
Repair and installation of machinery and equipment 346 16 934 2.0 7.7 42.6 18.0
Electricity, gas, steam and air conditioning supply 2 122 75 009 2.8 531.9 609.3 87.3
Water supply; sewerage, waste management and remediation activities 914 11 473 8.0 27.6 57.5 47.9
Construction 6 207 388 991 1.6 85.0 303.8 28.0
Construction of buildings 1 441 31 313 4.6 37.1 71.7 51.8
Civil engineering 763 11 661 6.5 19.2 45.9 41.8
Specialised construction activities 4 003 346 017 1.2 28.7 186.2 15.4
Wholesale and retail trade; repair of motor vehicles and motorcycles 14 381 612 805 2.3 1 065.5 2 140.0 49.8
Wholesale and retail trade and repair of motor vehicles and motor-cycles 2 404 114 858 2.1 118.5 290.6 40.8
Wholesale trade, except of motor vehicles and motorcycles 8 642 157 861 5.5 710.8 1 262.6 56.3
Retail trade, except of motor vehicles and motorcycles 3 335 340 086 1.0 236.2 586.8 40.3
Transportation and storage 3 181 114 524 2.8 155.9 338.0 46.1
of which:
Land transport and transport via pipelines 1 193 72 138 1.7 35.6 95.0 37.5
Warehousing and support activities for transportation 1 797 23 008 7.8 68.3 140.8 48.5
Accommodation and food service activities 949 248 053 0.4 11.2 94.7 11.8
1 Cylindered sample of 2018/2019. 2 Partially estimated values of the Federal Statistical Office. 3 Without Real estate activities and Activities of head offices.
Deutsche Bundesbank
Deutsche Bundesbank
Financial statement statistics (ratios – provisional data)
May 2021
7
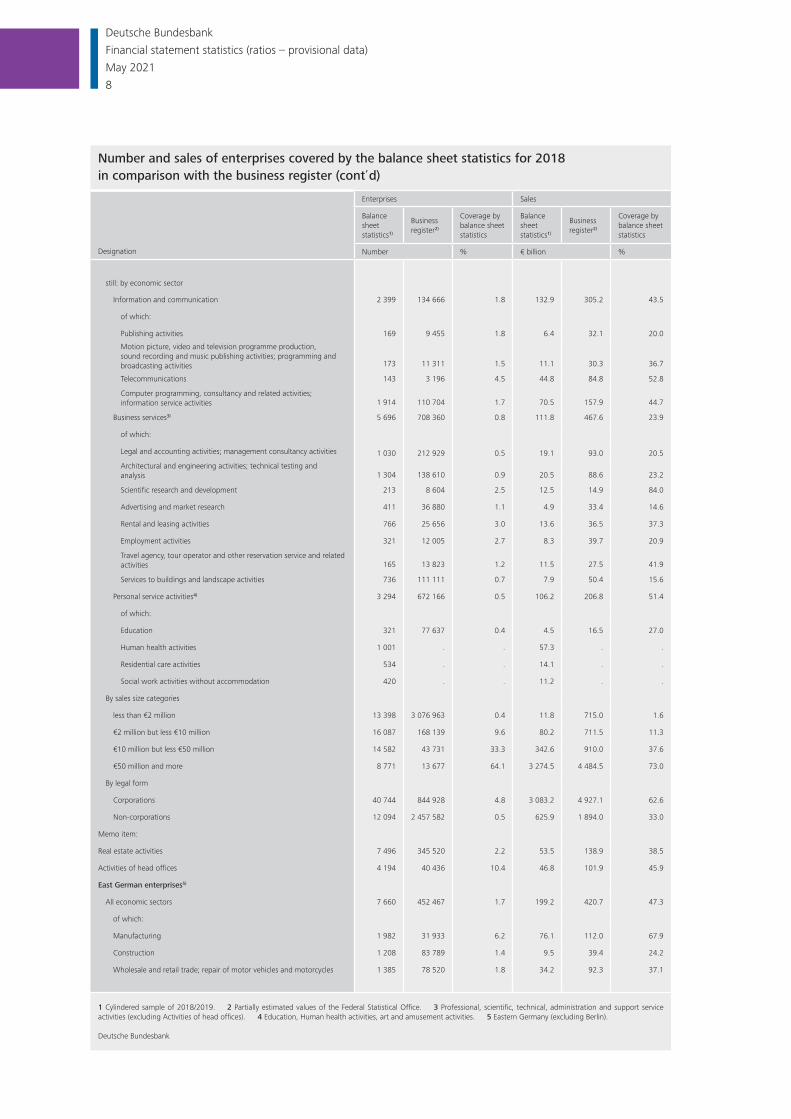
Number and sales of enterprises covered by the balance sheet statistics for 2018 in comparison with the business register (contʼd)
Designation
Enterprises Sales
Balance sheet statistics1)
Business register2)
Coverage by balance sheet statistics
Balance sheet statistics1)
Business register2)
Coverage by balance sheet statistics
Number % € billion %
still: by economic sector
Information and communication 2 399 134 666 1.8 132.9 305.2 43.5
of which:
Publishing activities 169 9 455 1.8 6.4 32.1 20.0
Motion picture, video and television programme production, sound recording and music publishing activities; programming and broadcasting activities 173 11 311 1.5 11.1 30.3 36.7
Telecommunications 143 3 196 4.5 44.8 84.8 52.8
Computer programming, consultancy and related activities; information service activities 1 914 110 704 1.7 70.5 157.9 44.7
Business services3) 5 696 708 360 0.8 111.8 467.6 23.9
of which:
Legal and accounting activities; management consultancy activities 1 030 212 929 0.5 19.1 93.0 20.5
Architectural and engineering activities; technical testing and analysis 1 304 138 610 0.9 20.5 88.6 23.2
Scientific research and development 213 8 604 2.5 12.5 14.9 84.0
Advertising and market research 411 36 880 1.1 4.9 33.4 14.6
Rental and leasing activities 766 25 656 3.0 13.6 36.5 37.3
Employment activities 321 12 005 2.7 8.3 39.7 20.9
Travel agency, tour operator and other reservation service and related activities 165 13 823 1.2 11.5 27.5 41.9
Services to buildings and landscape activities 736 111 111 0.7 7.9 50.4 15.6
Personal service activities4) 3 294 672 166 0.5 106.2 206.8 51.4
of which:
Education 321 77 637 0.4 4.5 16.5 27.0
Human health activities 1 001 . . 57.3 . .
Residential care activities 534 . . 14.1 . .
Social work activities without accommodation 420 . . 11.2 . .
By sales size categories
less than €2 million 13 398 3 076 963 0.4 11.8 715.0 1.6
€2 million but less €10 million 16 087 168 139 9.6 80.2 711.5 11.3
€10 million but less €50 million 14 582 43 731 33.3 342.6 910.0 37.6
€50 million and more 8 771 13 677 64.1 3 274.5 4 484.5 73.0
By legal form
Corporations 40 744 844 928 4.8 3 083.2 4 927.1 62.6
Non-corporations 12 094 2 457 582 0.5 625.9 1 894.0 33.0
Memo item:
Real estate activities 7 496 345 520 2.2 53.5 138.9 38.5
Activities of head offices 4 194 40 436 10.4 46.8 101.9 45.9
East German enterprises5)
All economic sectors 7 660 452 467 1.7 199.2 420.7 47.3
of which:
Manufacturing 1 982 31 933 6.2 76.1 112.0 67.9
Construction 1 208 83 789 1.4 9.5 39.4 24.2
Wholesale and retail trade; repair of motor vehicles and motorcycles 1 385 78 520 1.8 34.2 92.3 37.1
1 Cylindered sample of 2018/2019. 2 Partially estimated values of the Federal Statistical Office. 3 Professional, scientific, technical, administration and support service activities (excluding Activities of head offices). 4 Education, Human health activities, art and amusement activities. 5 Eastern Germany (excluding Berlin).
Deutsche Bundesbank
Deutsche Bundesbank
Financial statement statistics (ratios – provisional data)
May 2021
8
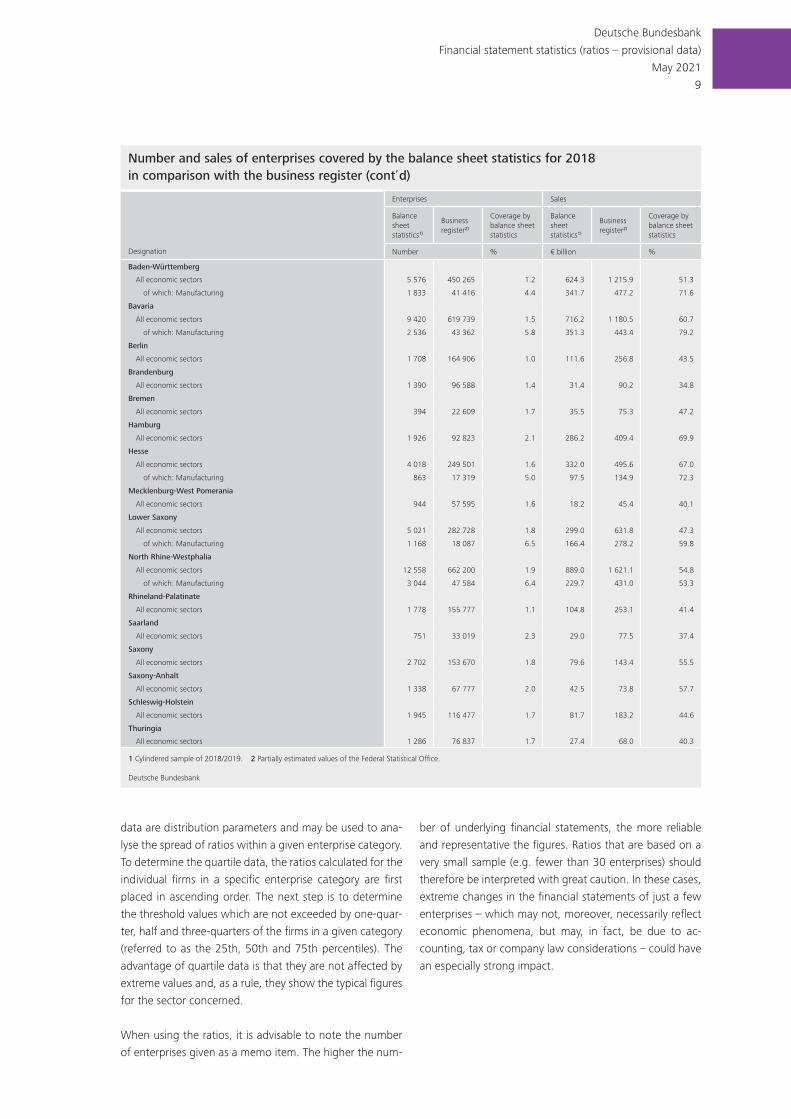
data are distribution parameters and may be used to ana-
lyse the spread of ratios within a given enterprise category.
To determine the quartile data, the ratios calculated for the
individual firms in a specific enterprise category are first
placed in ascending order. The next step is to determine
the threshold values which are not exceeded by one-quar-
ter, half and three-quarters of the firms in a given category
(referred to as the 25th, 50th and 75th percentiles). The
advantage of quartile data is that they are not affected by
extreme values and, as a rule, they show the typical figures
for the sector concerned.
When using the ratios, it is advisable to note the number
of enterprises given as a memo item. The higher the num-
ber of underlying financial statements, the more reliable
and representative the figures. Ratios that are based on a
very small sample (e.g. fewer than 30 enterprises) should
therefore be interpreted with great caution. In these cases,
extreme changes in the financial statements of just a few
enterprises – which may not, moreover, necessarily reflect
economic phenomena, but may, in fact, be due to ac-
counting, tax or company law considerations – could have
an especially strong impact.
Number and sales of enterprises covered by the balance sheet statistics for 2018 in comparison with the business register (contʼd)
Designation
Enterprises Sales
Balance sheet statistics1)
Business register2)
Coverage by balance sheet statistics
Balance sheet statistics1)
Business register2)
Coverage by balance sheet statistics
Number % € billion %
Baden-Württemberg
All economic sectors 5 576 450 265 1.2 624.3 1 215.9 51.3
of which: Manufacturing 1 833 41 416 4.4 341.7 477.2 71.6
Bavaria
All economic sectors 9 420 619 739 1.5 716.2 1 180.5 60.7
of which: Manufacturing 2 536 43 362 5.8 351.3 443.4 79.2
Berlin
All economic sectors 1 708 164 906 1.0 111.6 256.8 43.5
Brandenburg
All economic sectors 1 390 96 588 1.4 31.4 90.2 34.8
Bremen
All economic sectors 394 22 609 1.7 35.5 75.3 47.2
Hamburg
All economic sectors 1 926 92 823 2.1 286.2 409.4 69.9
Hesse
All economic sectors 4 018 249 501 1.6 332.0 495.6 67.0
of which: Manufacturing 863 17 319 5.0 97.5 134.9 72.3
Mecklenburg-West Pomerania
All economic sectors 944 57 595 1.6 18.2 45.4 40.1
Lower Saxony
All economic sectors 5 021 282 728 1.8 299.0 631.8 47.3
of which: Manufacturing 1 168 18 087 6.5 166.4 278.2 59.8
North Rhine-Westphalia
All economic sectors 12 558 662 200 1.9 889.0 1 621.1 54.8
of which: Manufacturing 3 044 47 584 6.4 229.7 431.0 53.3
Rhineland-Palatinate
All economic sectors 1 778 155 777 1.1 104.8 253.1 41.4
Saarland
All economic sectors 751 33 019 2.3 29.0 77.5 37.4
Saxony
All economic sectors 2 702 153 670 1.8 79.6 143.4 55.5
Saxony-Anhalt
All economic sectors 1 338 67 777 2.0 42.5 73.8 57.7
Schleswig-Holstein
All economic sectors 1 945 116 477 1.7 81.7 183.2 44.6
Thuringia
All economic sectors 1 286 76 837 1.7 27.4 68.0 40.3
1 Cylindered sample of 2018/2019. 2 Partially estimated values of the Federal Statistical Office.
Deutsche Bundesbank
Deutsche Bundesbank
Financial statement statistics (ratios – provisional data)
May 2021
9
Final figures
The final figures for 2018 to 2019 will be published as Sta-
tistical series – Financial statement statistics (ratios) 2018
to 2019 (expected publication date: May 2022).
Further information
More detailed information on the source of financial state-
ments, the statistical preparation and notes on individual
balance sheet and income statement items can be ob-
tained from Statistical series – Financial statement statistics
(ratios) 2017 to 2018, which was published in May 2021.
Deutsche Bundesbank
Financial statement statistics (ratios – provisional data)
May 2021
10

Definitions of items
Item Calculation
Income statement
Income
Sales Sales
Change in finished goods Increase or decrease in finished goods inventories and work in progress
Other own work capitalised
Gross revenue Sum of sales and changes in stocks of finished goods
Interest and similar income Interest and similar income (for example, from securities and long-term loans)
Other income1)
Income from long-term equity investments Income from long-term equity investments
Other income Other operating income
Extraordinary income
Total income Sum of income items
Expenses
Cost of materials Cost of raw materials, consumables and supplies, and of purchased merchandise and services
Personnel expenses Wages and salaries as well as social security, post-employment and other employee benefit costs
DepreciationDepreciation of tangible fixed assets Amortisation and write-downs of intangible fixed assets, depreciation and write-downs of tangible
fixed assets and amortisation of capitalised business start-up and expansion expenses
Other depreciation Write-downs of current assets to the extent that they exceed the write-downs that are usual for the corporation
Write-downs of long-term financial assets and securities classified as current assets
Interest and similar expenses Interest and similar expenses
Operating taxes Excise duties ./. Other taxes
Other expenses2) Other operating expenses
Extraordinary expenses
Total expenses before taxes on income Sum of expense items
Annual result before taxes on income Total income ./. Less total expenses before taxes on income
Taxes on income Corporate income tax
Trade earnings tax
Other income taxes
Annual result Annual result before taxes on income ./. Less taxes on income
Profit and loss transfers (parent company) Income from profit transfers (parent company) ./. Less costs arising from loss transfers (parent company)
Profit and loss transfers (subsidiary) Costs arising from profit transfers (subsidiary) ./. Less income from loss transfers (subsidiary)
Profit for the year Annual result plus profit and loss transfers (parent company) ./. Less profit and loss transfers (subsidiary)
1 Excluding income from profit transfers (parent company) and loss transfers (subsidiary). 2 Excluding costs arising from loss transfers (parent company) and profit transfers (subsidiary).
Deutsche Bundesbank
Deutsche Bundesbank
Financial statement statistics (ratios – provisional data)
May 2021
11

Definitions of items (contʼd)
Item Calculation
Balance sheet
Assets
Intangible fixed assets Concessions, industrial and similar rights and assets, and licences in such rights and assets
Prepayments (intangible fixed assets)
Other intangible fixed assets
Tangible fixed assets
Land and buildings Land, land rights and buildings, including buildings on third-party land
Other fixed assets Technical equipment and machinery
Other equipment, operating and office equipment
Prepayments and assets under construction
Inventories
Finished goods and merchandise Finished goods and merchandise
Other inventories Raw materials, consumables and supplies
Work in progress
Prepayments (inventories)
Cash Cash-in-hand, central bank balances, bank balances and cheques
Receivables
Short-term receivables
Trade receivables Trade receivables
Receivables from affiliated companies Receivables from affiliated companies
Receivables from other long-term investees and investors
Receivables from shareholders
Call obligations of general and limited partners arising from share of loss not covered by capital contributions
Other receivables and other assets Other receivables and other assets
Long-term receivables
Loans to affiliated companies Loans to shareholders
Loans to affiliated companies
Loans to other long-term investees and investors
Other loans and long-term financial assets Other loans and long-term financial assets
Securities Short-term securities (excluding own shares)
Long-term securities
Other long-term equity investments Other long-term equity investments
Shares in affiliated companies
Goodwill
Excess of plan assets over pension liability
Prepaid expenses Prepaid expenses
Balance sheet total (adjusted) Total assets
Deutsche Bundesbank
Deutsche Bundesbank
Financial statement statistics (ratios – provisional data)
May 2021
12

Definitions of items (contʼd)
Item Calculation
Balance sheet (cont’d)
Capital
Equity (adjusted) Subscribed capital/capital shares
Capital reserves
Revenue reserves
Retained profits/accumulated losses brought forward
Net income/net loss for the financial year
Net retained profits/net accumulated losses
Minority interests
Proportionate special tax-allowable reserve
Other special reserves
Other equity items
Equity-equivalent partner loans or partner loans with a subordinate claim
Equity-equivalent profit participation capital
Equity-equivalent contributions by silent partners
Reserves (partnerships)
Liabilities to shareholders with a subordinate claim
Adjustments
./. Less deficit not covered by equity in the case of corporations, excess indebtedness or
negative capital in the case of non-corporations
./. Less outstanding contributions to subscribed capital
./. Less own shares
./. Less deferred tax assets
./. Less business start-up and expansion expenses
./. Less discount
./. Less self created industrial and similar rights and assets
./. Less other adjustments
Liabilities
Short-term liabilities
Liabilities to banks Liabilities to banks
Trade payables Trade payables
Liabilities on bills accepted and drawn
Liabilities to affiliated companies Liabilities to affiliated companies
Liabilities to other long-term investees and investors
Liabilities to shareholders
Other liabilitiesPayments received on account of orders including payments on account of inventories deducted from inventories on the face of the balance sheet
Bonds
Other liabilities
Long-term liabilities
Liabilities to banks Liabilities to banks
Liabilities to affiliated companies Liabilities to affiliated companies
Liabilities to other long-term investees and investors
Liabilities to shareholders
Other liabilities Bonds
Other liabilities
Provisions
Provisions for pensions Provisions for pensions and similar obligations
Other provisions Provisions for taxes
Proportionate special tax-allowable reserve
Other provisions
Deferred income Deferred income
Balance sheet total (adjusted) Total capital
Deutsche Bundesbank
Deutsche Bundesbank
Financial statement statistics (ratios – provisional data)
May 2021
13

Definitions of items (contʼd)
Item Calculation
Other ratios
Liabilities and provisions Liabilitites
Provisions
Deferred income
Fixed assets Intangible fixed assets
Tangible fixed assets
Other long-term equity investments
Long-term receivables
Long-term securities
Long-term equity and liabilities Equity (adjusted)
Provisions for pensions
Proportionate special tax-allowable reserve
Long-term liabilities
Cash resources Cash
Short-term securities
Deutsche Bundesbank
Deutsche Bundesbank
Financial statement statistics (ratios – provisional data)
May 2021
14

Deutsche Bundesbank
Financial statement statistics (ratios – provisional data)
May 2021
15
Deutsche BundesbankFinancial statement statistics (ratios - provisional data)May 202116
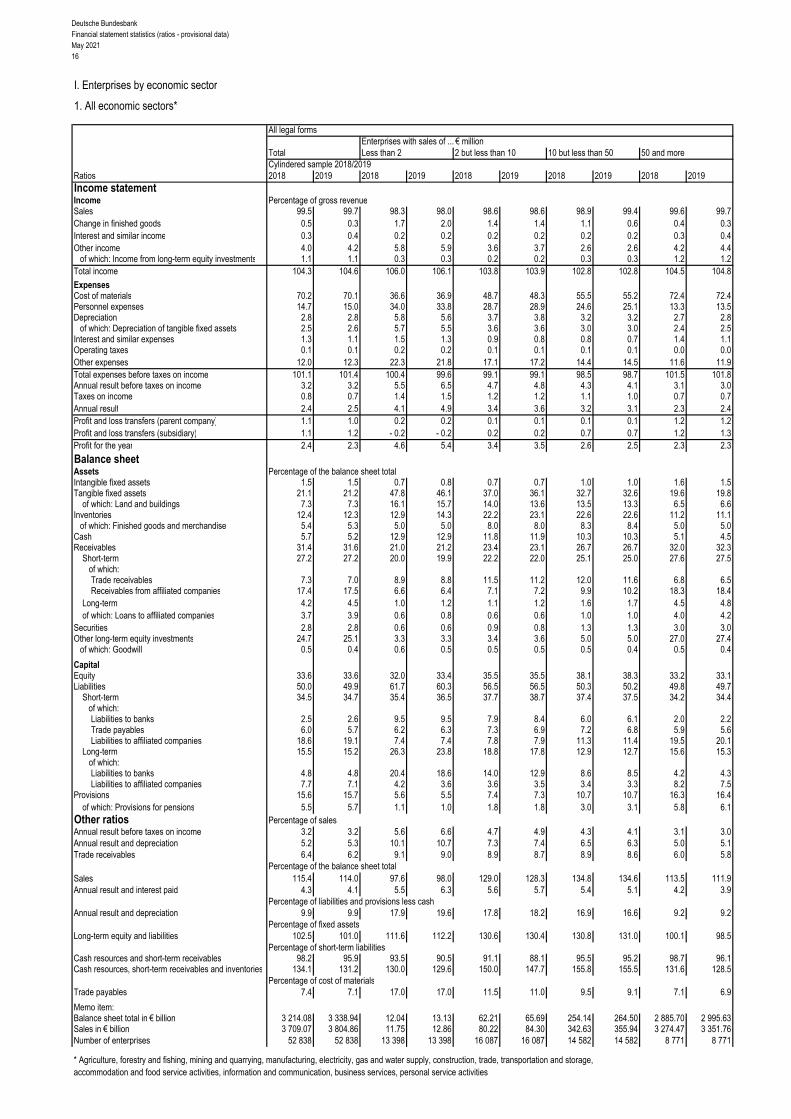
I. Enterprises by economic sector
1. All economic sectors*
All legal formsEnterprises with sales of ... € million
Total Less than 2 2 but less than 10 10 but less than 50 50 and moreCylindered sample 2018/2019
Ratios 2018 2019 2018 2019 2018 2019 2018 2019 2018 2019Income statementIncome Percentage of gross revenueSales 99.5 99.7 98.3 98.0 98.6 98.6 98.9 99.4 99.6 99.7Change in finished goods 0.5 0.3 1.7 2.0 1.4 1.4 1.1 0.6 0.4 0.3Interest and similar income 0.3 0.4 0.2 0.2 0.2 0.2 0.2 0.2 0.3 0.4Other income 4.0 4.2 5.8 5.9 3.6 3.7 2.6 2.6 4.2 4.4
of which: Income from long-term equity investments 1.1 1.1 0.3 0.3 0.2 0.2 0.3 0.3 1.2 1.2Total income 104.3 104.6 106.0 106.1 103.8 103.9 102.8 102.8 104.5 104.8
ExpensesCost of materials 70.2 70.1 36.6 36.9 48.7 48.3 55.5 55.2 72.4 72.4Personnel expenses 14.7 15.0 34.0 33.8 28.7 28.9 24.6 25.1 13.3 13.5Depreciation 2.8 2.8 5.8 5.6 3.7 3.8 3.2 3.2 2.7 2.8
of which: Depreciation of tangible fixed assets 2.5 2.6 5.7 5.5 3.6 3.6 3.0 3.0 2.4 2.5Interest and similar expenses 1.3 1.1 1.5 1.3 0.9 0.8 0.8 0.7 1.4 1.1Operating taxes 0.1 0.1 0.2 0.2 0.1 0.1 0.1 0.1 0.0 0.0Other expenses 12.0 12.3 22.3 21.8 17.1 17.2 14.4 14.5 11.6 11.9Total expenses before taxes on income 101.1 101.4 100.4 99.6 99.1 99.1 98.5 98.7 101.5 101.8Annual result before taxes on income 3.2 3.2 5.5 6.5 4.7 4.8 4.3 4.1 3.1 3.0Taxes on income 0.8 0.7 1.4 1.5 1.2 1.2 1.1 1.0 0.7 0.7Annual result 2.4 2.5 4.1 4.9 3.4 3.6 3.2 3.1 2.3 2.4Profit and loss transfers (parent company) 1.1 1.0 0.2 0.2 0.1 0.1 0.1 0.1 1.2 1.2Profit and loss transfers (subsidiary) 1.1 1.2 - 0.2 - 0.2 0.2 0.2 0.7 0.7 1.2 1.3Profit for the year 2.4 2.3 4.6 5.4 3.4 3.5 2.6 2.5 2.3 2.3
Balance sheetAssets Percentage of the balance sheet totalIntangible fixed assets 1.5 1.5 0.7 0.8 0.7 0.7 1.0 1.0 1.6 1.5Tangible fixed assets 21.1 21.2 47.8 46.1 37.0 36.1 32.7 32.6 19.6 19.8
of which: Land and buildings 7.3 7.3 16.1 15.7 14.0 13.6 13.5 13.3 6.5 6.6Inventories 12.4 12.3 12.9 14.3 22.2 23.1 22.6 22.6 11.2 11.1
of which: Finished goods and merchandise 5.4 5.3 5.0 5.0 8.0 8.0 8.3 8.4 5.0 5.0Cash 5.7 5.2 12.9 12.9 11.8 11.9 10.3 10.3 5.1 4.5Receivables 31.4 31.6 21.0 21.2 23.4 23.1 26.7 26.7 32.0 32.3
Short-term 27.2 27.2 20.0 19.9 22.2 22.0 25.1 25.0 27.6 27.5 of which:
Trade receivables 7.3 7.0 8.9 8.8 11.5 11.2 12.0 11.6 6.8 6.5Receivables from affiliated companies 17.4 17.5 6.6 6.4 7.1 7.2 9.9 10.2 18.3 18.4
Long-term 4.2 4.5 1.0 1.2 1.1 1.2 1.6 1.7 4.5 4.8of which: Loans to affiliated companies 3.7 3.9 0.6 0.8 0.6 0.6 1.0 1.0 4.0 4.2
Securities 2.8 2.8 0.6 0.6 0.9 0.8 1.3 1.3 3.0 3.0Other long-term equity investments 24.7 25.1 3.3 3.3 3.4 3.6 5.0 5.0 27.0 27.4
of which: Goodwill 0.5 0.4 0.6 0.5 0.5 0.5 0.5 0.4 0.5 0.4
CapitalEquity 33.6 33.6 32.0 33.4 35.5 35.5 38.1 38.3 33.2 33.1Liabilities 50.0 49.9 61.7 60.3 56.5 56.5 50.3 50.2 49.8 49.7
Short-term 34.5 34.7 35.4 36.5 37.7 38.7 37.4 37.5 34.2 34.4of which:Liabilities to banks 2.5 2.6 9.5 9.5 7.9 8.4 6.0 6.1 2.0 2.2Trade payables 6.0 5.7 6.2 6.3 7.3 6.9 7.2 6.8 5.9 5.6Liabilities to affiliated companies 18.6 19.1 7.4 7.4 7.8 7.9 11.3 11.4 19.5 20.1
Long-term 15.5 15.2 26.3 23.8 18.8 17.8 12.9 12.7 15.6 15.3 of which:
Liabilities to banks 4.8 4.8 20.4 18.6 14.0 12.9 8.6 8.5 4.2 4.3Liabilities to affiliated companies 7.7 7.1 4.2 3.6 3.6 3.5 3.4 3.3 8.2 7.5
Provisions 15.6 15.7 5.6 5.5 7.4 7.3 10.7 10.7 16.3 16.4of which: Provisions for pensions 5.5 5.7 1.1 1.0 1.8 1.8 3.0 3.1 5.8 6.1
Other ratios Percentage of salesAnnual result before taxes on income 3.2 3.2 5.6 6.6 4.7 4.9 4.3 4.1 3.1 3.0Annual result and depreciation 5.2 5.3 10.1 10.7 7.3 7.4 6.5 6.3 5.0 5.1Trade receivables 6.4 6.2 9.1 9.0 8.9 8.7 8.9 8.6 6.0 5.8
Percentage of the balance sheet totalSales 115.4 114.0 97.6 98.0 129.0 128.3 134.8 134.6 113.5 111.9Annual result and interest paid 4.3 4.1 5.5 6.3 5.6 5.7 5.4 5.1 4.2 3.9
Percentage of liabilities and provisions less cashAnnual result and depreciation 9.9 9.9 17.9 19.6 17.8 18.2 16.9 16.6 9.2 9.2
Percentage of fixed assetsLong-term equity and liabilities 102.5 101.0 111.6 112.2 130.6 130.4 130.8 131.0 100.1 98.5
Percentage of short-term liabilitiesCash resources and short-term receivables 98.2 95.9 93.5 90.5 91.1 88.1 95.5 95.2 98.7 96.1Cash resources, short-term receivables and inventories 134.1 131.2 130.0 129.6 150.0 147.7 155.8 155.5 131.6 128.5
Percentage of cost of materialsTrade payables 7.4 7.1 17.0 17.0 11.5 11.0 9.5 9.1 7.1 6.9
Memo item:Balance sheet total in € billion 3 214.08 3 338.94 12.04 13.13 62.21 65.69 254.14 264.50 2 885.70 2 995.63Sales in € billion 3 709.07 3 804.86 11.75 12.86 80.22 84.30 342.63 355.94 3 274.47 3 351.76Number of enterprises 52 838 52 838 13 398 13 398 16 087 16 087 14 582 14 582 8 771 8 771
* Agriculture, forestry and fishing, mining and quarrying, manufacturing, electricity, gas and water supply, construction, trade, transportation and storage,accommodation and food service activities, information and communication, business services, personal service activities

Deutsche BundesbankFinancial statement statistics (ratios - provisional data)
May 202117
I. Enterprises by economic sector
cont'd: 1. All economic sectors*
cont'd: All legal formsEnterprises with sales of ... € million
Total Less than 2 2 but less than 10 10 but less than 50 50 and moreQuartile Cylindered sample 2018/2019value 2018 2019 2018 2019 2018 2019 2018 2019 2018 2019Of the enterprises captured …
Ratios ... % had a ratio of less than …Percentage of gross revenue
Cost of materials 25 27.4 27.0 7.2 7.0 27.9 27.3 38.0 37.4 47.6 47.5 50 50.1 49.7 31.7 31.0 48.5 47.9 57.5 56.9 66.4 66.2 75 70.6 70.2 52.5 52.1 67.3 66.9 74.9 74.5 81.5 81.5
Personnel expenses 25 11.3 11.5 14.6 14.7 14.3 14.5 10.6 10.9 6.9 7.0 50 23.6 23.9 31.1 31.1 26.8 27.3 20.6 21.0 14.5 14.8 75 38.6 39.0 46.6 46.7 39.8 40.2 34.2 35.0 26.0 26.9
Depreciation 25 0.7 0.7 0.9 0.9 0.7 0.7 0.7 0.7 0.6 0.6 50 1.8 1.8 2.3 2.3 1.7 1.7 1.7 1.7 1.6 1.6 75 4.2 4.2 5.7 5.7 4.0 4.0 3.8 3.8 3.6 3.7
Annual result 25 0.5 0.6 0.2 0.8 0.6 0.7 0.6 0.5 0.3 0.3 50 2.6 2.7 3.6 4.4 2.6 2.7 2.4 2.4 2.1 1.9 75 6.5 6.7 10.7 11.1 6.1 6.3 5.5 5.5 5.2 5.0
Percentage of the balance sheet totalTangible fixed assets 25 4.3 4.2 3.9 3.8 4.3 4.2 4.4 4.5 4.5 4.5
50 15.8 15.7 16.5 16.1 14.9 14.8 15.9 16.0 16.6 16.6 75 40.4 40.4 47.0 46.7 40.3 40.2 38.4 38.5 36.0 37.0
Inventories 25 0.9 1.0 0.0 0.0 1.5 1.6 2.2 2.1 3.5 3.4 50 15.3 15.2 4.3 4.7 17.3 17.3 22.4 21.7 18.7 18.1 75 39.5 39.8 27.1 27.8 44.5 44.5 43.4 43.3 37.0 36.6
Equity 25 10.6 12.1 4.0 7.4 10.5 11.6 13.8 14.6 14.4 15.0 50 29.5 30.8 25.6 28.1 28.4 29.7 31.8 33.0 31.2 31.8 75 52.3 53.9 52.9 55.5 52.1 53.7 53.2 54.4 50.6 51.6
Short-term liabilities 25 19.2 18.3 16.7 15.9 20.1 18.9 19.5 18.8 20.5 19.8 50 40.2 39.2 39.4 37.7 41.2 40.4 40.5 39.6 39.1 38.3 75 66.5 65.0 71.2 66.9 67.7 66.7 64.8 64.0 62.2 61.6
Liabilities to banks 25 0.0 0.0 0.0 0.0 0.0 0.0 0.0 0.0 0.0 0.0 50 5.2 5.0 7.8 7.6 8.0 7.8 4.1 3.8 0.2 0.2 75 27.7 27.4 36.1 35.5 30.9 30.3 24.2 24.4 17.2 16.5
Percentage of salesAnnual result before taxes on income 25 0.7 0.8 0.3 1.1 0.9 1.0 0.9 0.8 0.6 0.5
50 3.5 3.6 4.6 5.5 3.5 3.6 3.2 3.1 2.7 2.4 75 8.4 8.6 13.3 13.7 8.0 8.2 7.1 7.0 6.5 6.2
Annual result and depreciation 25 2.5 2.6 2.6 3.7 2.7 2.9 2.5 2.4 1.9 1.8 50 6.2 6.3 8.3 9.3 6.4 6.4 5.6 5.4 4.9 4.5 75 12.6 12.9 19.5 20.0 12.1 12.3 10.8 10.7 9.9 9.6
Trade receivables 25 3.0 2.8 1.8 1.8 3.4 3.2 3.6 3.3 3.1 3.0 50 7.0 6.6 6.2 5.8 7.2 6.7 7.4 7.0 7.0 6.7 75 12.0 11.6 12.2 11.8 12.1 11.6 12.1 11.7 11.6 11.3
Percentage of the balance sheet totalAnnual result and interest paid 25 2.1 2.3 1.6 2.7 2.4 2.5 2.3 2.1 1.9 1.7
50 6.1 6.2 7.5 8.6 6.2 6.4 5.7 5.5 5.3 4.9 75 13.0 13.2 19.2 21.1 12.9 13.2 11.3 11.0 10.4 9.8
Percentage of liabilities and provisions less cashAnnual result and depreciation 25 4.3 4.8 - 1.6 2.2 4.6 4.8 5.7 5.7 6.0 5.6
50 16.3 16.8 15.6 18.6 16.5 17.0 17.0 16.7 15.6 15.0 75 40.1 41.3 48.5 54.0 41.8 43.0 38.9 37.9 31.7 31.6
Percentage of fixed assetsLong-term equity and liabilities 25 92.1 94.1 72.7 82.5 95.7 97.5 98.0 98.0 94.2 94.1
50 160.3 165.4 142.0 157.0 177.8 183.6 169.3 168.6 146.7 146.5 75 410.1 429.3 430.0 474.3 473.5 508.4 402.5 403.7 305.8 307.9
Percentage of short-term liabilitiesCash resources and short-term receivables 25 51.4 51.9 47.4 49.4 48.0 47.7 52.9 53.4 59.6 59.7
50 105.0 107.4 113.1 119.2 101.6 103.3 102.6 103.4 105.7 107.9 75 221.3 232.4 271.7 298.1 218.1 228.3 206.9 216.3 193.7 198.6
Percentage of cost of materialsTrade payables 25 4.3 4.0 4.4 4.0 4.7 4.3 4.3 4.0 3.7 3.4
50 8.9 8.3 11.4 10.6 9.6 8.9 8.2 7.7 7.3 6.9 75 16.9 16.1 28.2 26.2 18.1 17.3 14.4 13.7 12.1 11.7
* Agriculture, forestry and fishing, mining and quarrying, manufacturing, electricity, gas and water supply, construction, trade, transportation and storage,accommodation and food service activities, information and communication, business services, personal service activities

Deutsche BundesbankFinancial statement statistics (ratios - provisional data)May 202118
I. Enterprises by economic sector
cont'd: 1. All economic sectors*
CorporationsEnterprises with sales of ... € million
Total Less than 2 2 but less than 10 10 but less than 50 50 and moreCylindered sample 2018/2019
Ratios 2018 2019 2018 2019 2018 2019 2018 2019 2018 2019Income statementIncome Percentage of gross revenueSales 99.5 99.7 98.1 97.9 98.5 98.5 99.0 99.4 99.6 99.7Change in finished goods 0.5 0.3 1.9 2.1 1.5 1.5 1.0 0.6 0.4 0.3Interest and similar income 0.4 0.4 0.3 0.2 0.2 0.2 0.2 0.2 0.4 0.4Other income 4.4 4.6 6.3 6.5 4.0 4.1 2.9 2.9 4.5 4.8
of which: Income from long-term equity investments 1.3 1.3 0.3 0.2 0.2 0.2 0.3 0.3 1.4 1.4Total income 104.7 105.1 106.5 106.7 104.2 104.2 103.0 103.0 104.9 105.3
ExpensesCost of materials 70.3 70.3 37.4 37.7 48.3 47.8 54.6 54.3 72.5 72.6Personnel expenses 14.9 15.2 37.7 37.3 30.3 30.5 25.7 26.1 13.5 13.7Depreciation 2.9 2.9 4.4 4.3 3.5 3.5 3.2 3.2 2.8 2.9
of which: Depreciation of tangible fixed assets 2.6 2.6 4.3 4.2 3.4 3.4 3.0 3.0 2.5 2.6Interest and similar expenses 1.4 1.2 1.1 1.0 0.8 0.7 0.7 0.7 1.5 1.2Operating taxes 0.1 0.1 0.2 0.2 0.1 0.1 0.1 0.1 0.1 0.0Other expenses 12.1 12.2 22.6 22.0 17.2 17.3 14.6 14.7 11.7 11.8Total expenses before taxes on income 101.6 101.9 103.4 102.5 100.1 100.0 98.9 99.0 101.9 102.2Annual result before taxes on income 3.1 3.2 3.2 4.2 4.1 4.2 4.1 4.0 3.0 3.0Taxes on income 0.8 0.8 1.4 1.5 1.3 1.3 1.1 1.1 0.8 0.7Annual result 2.3 2.4 1.8 2.7 2.8 2.9 3.0 2.9 2.2 2.3Profit and loss transfers (parent company) 1.2 1.2 0.3 0.2 0.1 0.1 0.1 0.1 1.3 1.3Profit and loss transfers (subsidiary) 1.3 1.4 - 0.3 - 0.3 0.2 0.2 0.9 0.8 1.4 1.5Profit for the year 2.2 2.2 2.4 3.3 2.7 2.7 2.2 2.2 2.2 2.2
Balance sheetAssets Percentage of the balance sheet totalIntangible fixed assets 1.6 1.5 0.9 0.9 0.7 0.7 1.0 1.0 1.6 1.6Tangible fixed assets 20.4 20.5 37.8 36.8 34.3 33.6 32.9 32.9 19.1 19.2
of which: Land and buildings 7.0 7.0 15.7 15.1 14.2 13.7 13.8 13.6 6.3 6.4Inventories 11.2 11.1 15.8 17.1 22.5 23.2 21.0 21.0 10.2 10.0
of which: Finished goods and merchandise 4.8 4.8 5.9 5.8 7.6 7.6 7.6 7.6 4.5 4.5Cash 5.5 4.9 14.9 14.6 12.7 12.6 10.4 10.4 4.9 4.3Receivables 31.3 31.5 25.1 25.1 24.5 24.4 27.4 27.4 31.7 32.0
Short-term 26.8 26.8 23.9 23.6 23.3 23.1 25.6 25.5 27.0 27.0 of which:
Trade receivables 7.0 6.7 10.9 10.5 12.1 11.7 11.8 11.5 6.5 6.2Receivables from affiliated companies 17.5 17.6 7.8 7.5 7.4 7.6 10.5 10.8 18.3 18.4
Long-term 4.4 4.7 1.2 1.5 1.3 1.3 1.8 1.9 4.7 5.0of which: Loans to affiliated companies 3.9 4.1 0.7 1.0 0.7 0.7 1.1 1.1 4.3 4.4
Securities 3.0 3.0 0.9 0.8 1.0 1.0 1.4 1.4 3.2 3.2Other long-term equity investments 26.6 27.0 4.0 4.0 3.7 3.9 5.4 5.4 28.8 29.2
of which: Goodwill 0.5 0.4 0.7 0.5 0.5 0.5 0.5 0.5 0.5 0.4
CapitalEquity 34.5 34.5 35.1 36.6 39.2 39.0 41.1 41.1 33.9 33.9Liabilities 48.7 48.7 57.2 55.9 51.9 52.3 46.9 46.8 48.8 48.7
Short-term 32.9 33.1 37.3 38.0 36.0 36.7 34.6 34.3 32.7 32.9of which:Liabilities to banks 2.2 2.3 7.8 7.7 7.0 7.2 5.4 5.4 1.8 1.9Trade payables 5.6 5.2 7.2 7.1 7.4 6.9 7.2 6.8 5.4 5.1Liabilities to affiliated companies 18.2 18.7 7.4 7.4 6.5 6.7 9.9 9.9 19.1 19.7
Long-term 15.8 15.5 19.9 18.0 15.9 15.6 12.3 12.5 16.1 15.8 of which:
Liabilities to banks 4.4 4.4 13.1 12.0 11.3 10.9 8.2 8.3 3.9 4.0Liabilities to affiliated companies 8.2 7.5 4.9 4.2 3.4 3.4 3.2 3.2 8.7 8.0
Provisions 16.0 16.0 6.9 6.7 8.1 7.9 11.1 11.1 16.5 16.6of which: Provisions for pensions 5.7 5.9 1.6 1.5 2.1 2.1 3.2 3.3 5.9 6.2
Other ratios Percentage of salesAnnual result before taxes on income 3.1 3.2 3.2 4.3 4.2 4.3 4.2 4.0 3.0 3.0Annual result and depreciation 5.2 5.3 6.3 7.1 6.4 6.6 6.3 6.2 5.0 5.2Trade receivables 6.5 6.2 9.7 9.5 9.2 9.1 9.1 8.9 6.1 5.9
Percentage of the balance sheet totalSales 108.2 106.9 112.3 110.6 130.4 128.9 130.1 129.9 106.0 104.6Annual result and interest paid 4.0 3.8 3.3 4.2 4.7 4.8 4.9 4.7 3.9 3.7
Percentage of liabilities and provisions less cashAnnual result and depreciation 9.3 9.4 14.1 16.2 17.3 17.5 16.8 16.5 8.7 8.8
Percentage of fixed assetsLong-term equity and liabilities 101.9 100.6 127.7 128.3 140.4 140.8 134.1 134.8 99.4 97.9
Percentage of short-term liabilitiesCash resources and short-term receivables 101.5 99.1 105.1 101.5 100.7 98.3 105.1 105.7 101.2 98.6Cash resources, short-term receivables and inventories 135.5 132.6 147.5 146.5 163.1 161.5 165.8 166.7 132.4 129.1
Percentage of cost of materialsTrade payables 7.3 6.9 16.8 16.7 11.5 11.0 10.0 9.6 7.0 6.7
Memo item:Balance sheet total in € billion 2 849.88 2 962.83 7.78 8.72 47.53 50.66 207.59 216.51 2 586.97 2 686.94Sales in € billion 3 083.16 3 166.91 8.74 9.65 61.98 65.32 270.04 281.35 2 742.39 2 810.59Number of enterprises 40 744 40 744 9 877 9 877 12 478 12 478 11 505 11 505 6 884 6 884
* Agriculture, forestry and fishing, mining and quarrying, manufacturing, electricity, gas and water supply, construction, trade, transportation and storage,accommodation and food service activities, information and communication, business services, personal service activities

Deutsche BundesbankFinancial statement statistics (ratios - provisional data)
May 202119
I. Enterprises by economic sector
cont'd: 1 All economic sectors*
cont'd: CorporationsEnterprises with sales of ... € million
Total Less than 2 2 but less than 10 10 but less than 50 50 and moreQuartile Cylindered sample 2018/2019value 2018 2019 2018 2019 2018 2019 2018 2019 2018 2019Of the enterprises captured …
Ratios ... % had a ratio of less than …Percentage of gross revenue
Cost of materials 25 27.2 26.9 9.4 9.1 27.7 27.1 35.6 35.4 46.0 45.5 50 49.8 49.4 32.9 32.3 48.0 47.2 56.7 56.2 65.6 65.4 75 70.4 69.8 53.0 52.8 66.5 66.0 74.7 74.4 81.9 81.8
Personnel expenses 25 12.2 12.5 19.5 19.7 15.7 15.8 10.8 11.0 6.6 6.7 50 25.4 25.7 35.4 35.4 28.4 28.9 21.4 21.8 14.7 15.1 75 41.1 41.5 50.7 50.5 41.5 42.0 35.8 36.7 27.3 28.0
Depreciation 25 0.7 0.7 0.8 0.8 0.7 0.7 0.6 0.7 0.6 0.6 50 1.7 1.7 2.0 2.0 1.6 1.6 1.6 1.7 1.6 1.7 75 4.0 4.0 4.5 4.5 3.8 3.9 3.9 3.9 3.8 3.8
Annual result 25 0.3 0.4 - 0.1 0.4 0.4 0.5 0.5 0.4 0.3 0.2 50 2.2 2.3 2.4 3.1 2.2 2.3 2.3 2.2 2.0 1.9 75 5.6 5.8 7.3 7.9 5.4 5.5 5.3 5.3 5.1 4.9
Percentage of the balance sheet totalTangible fixed assets 25 3.6 3.6 3.0 2.9 3.7 3.7 3.9 4.0 3.8 3.8
50 13.6 13.6 12.3 12.1 13.1 12.7 14.4 14.7 15.3 15.2 75 36.4 36.6 35.4 34.6 35.9 36.1 37.7 37.9 36.1 37.1
Inventories 25 0.8 0.8 0.0 0.0 1.4 1.4 1.4 1.3 2.3 2.4 50 14.0 14.0 5.0 5.4 16.4 16.4 19.9 18.9 16.1 15.4 75 38.9 39.1 28.9 29.2 43.9 43.8 42.1 42.0 35.4 35.0
Equity 25 13.7 15.2 6.9 10.7 14.1 15.3 16.7 17.6 16.4 16.7 50 33.2 34.8 29.3 32.3 32.8 34.2 35.7 36.6 34.0 34.8 75 56.0 57.5 56.3 59.1 56.0 57.5 56.9 58.1 54.0 54.9
Short-term liabilities 25 17.6 16.8 16.6 15.8 18.1 17.3 17.2 16.6 18.3 17.6 50 37.0 35.8 38.5 36.6 38.0 36.7 36.3 34.9 34.8 34.3 75 63.2 61.5 69.3 64.8 64.1 62.7 61.0 60.1 58.2 57.6
Liabilities to banks 25 0.0 0.0 0.0 0.0 0.0 0.0 0.0 0.0 0.0 0.0 50 2.7 2.6 2.7 3.1 5.6 5.5 2.3 2.1 0.0 0.0 75 22.8 22.7 26.0 25.2 26.1 26.0 21.4 21.7 15.2 14.4
Percentage of salesAnnual result before taxes on income 25 0.5 0.6 0.0 0.6 0.7 0.7 0.7 0.7 0.5 0.4
50 3.0 3.2 3.2 4.0 3.1 3.2 3.1 3.0 2.6 2.4 75 7.5 7.7 9.4 10.1 7.4 7.6 7.0 6.9 6.5 6.3
Annual result and Depreciation 25 2.1 2.3 1.7 2.8 2.3 2.5 2.3 2.3 1.8 1.6 50 5.6 5.8 6.2 7.1 5.8 5.9 5.5 5.4 4.9 4.6 75 11.4 11.7 14.0 14.7 11.3 11.6 10.9 10.8 9.9 9.8
Trade receivables 25 3.2 3.0 2.3 2.3 3.6 3.3 3.6 3.3 3.2 3.1 50 7.3 6.9 6.8 6.5 7.5 7.0 7.5 7.2 7.3 7.0 75 12.5 12.1 13.0 12.6 12.4 12.1 12.4 12.1 12.1 11.8
Percentage of the balance sheet totalAnnual result and interest paid 25 1.7 1.9 0.7 1.9 2.0 2.2 2.0 1.9 1.6 1.5
50 5.3 5.5 5.8 6.9 5.4 5.5 5.3 5.1 5.0 4.6 75 11.4 11.6 14.4 16.1 11.2 11.5 10.5 10.3 9.8 9.4
Percentage of liabilities and provisions less cashAnnual result and Depreciation 25 2.9 3.4 - 8.6 - 2.7 3.1 3.4 5.0 4.8 5.3 5.0
50 14.9 15.4 11.2 14.2 15.1 15.5 16.7 16.5 15.5 15.0 75 38.5 39.9 39.1 45.2 41.1 42.5 40.5 39.7 32.4 32.4
Percentage of fixed assetsLong-term equity and liabilities 25 100.8 102.9 87.5 97.4 106.9 108.6 104.1 104.1 99.1 98.5
50 184.4 190.3 184.0 203.7 210.3 217.1 183.0 183.7 153.6 155.1 75 479.6 504.6 545.8 609.2 556.3 594.5 445.1 450.8 335.5 337.1
Percentage of short-term liabilitiesCash resources and short-term receivables 25 58.4 59.2 55.7 59.1 54.4 54.3 59.9 60.5 66.3 65.6
50 118.6 122.4 130.6 138.2 116.0 118.7 114.4 117.2 118.3 121.5 75 254.2 269.7 318.0 348.3 254.6 268.0 237.7 249.6 217.6 222.9
Percentage of cost of materialsTrade payables 25 4.4 4.0 4.5 4.1 4.7 4.3 4.4 4.1 3.6 3.3
50 9.0 8.5 11.4 10.5 9.5 8.8 8.5 8.1 7.4 7.0 75 17.2 16.3 28.2 26.1 18.1 17.3 15.2 14.4 12.7 12.2
* Agriculture, forestry and fishing, mining and quarrying, manufacturing, electricity, gas and water supply, construction, trade, transportation and storage,accommodation and food service activities, information and communication, business services, personal service activities
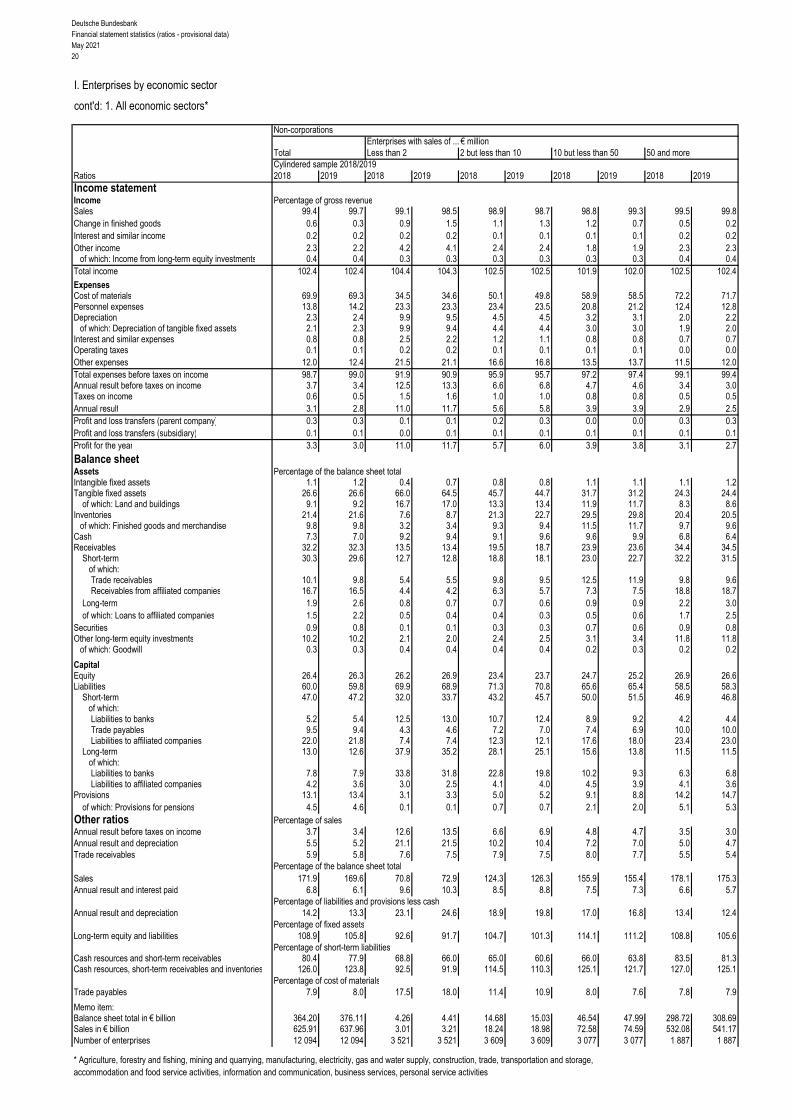
Deutsche BundesbankFinancial statement statistics (ratios - provisional data)May 202120
I. Enterprises by economic sector
cont'd: 1. All economic sectors*
Non-corporationsEnterprises with sales of ... € million
Total Less than 2 2 but less than 10 10 but less than 50 50 and moreCylindered sample 2018/2019
Ratios 2018 2019 2018 2019 2018 2019 2018 2019 2018 2019Income statementIncome Percentage of gross revenueSales 99.4 99.7 99.1 98.5 98.9 98.7 98.8 99.3 99.5 99.8Change in finished goods 0.6 0.3 0.9 1.5 1.1 1.3 1.2 0.7 0.5 0.2Interest and similar income 0.2 0.2 0.2 0.2 0.1 0.1 0.1 0.1 0.2 0.2Other income 2.3 2.2 4.2 4.1 2.4 2.4 1.8 1.9 2.3 2.3
of which: Income from long-term equity investments 0.4 0.4 0.3 0.3 0.3 0.3 0.3 0.3 0.4 0.4Total income 102.4 102.4 104.4 104.3 102.5 102.5 101.9 102.0 102.5 102.4
ExpensesCost of materials 69.9 69.3 34.5 34.6 50.1 49.8 58.9 58.5 72.2 71.7Personnel expenses 13.8 14.2 23.3 23.3 23.4 23.5 20.8 21.2 12.4 12.8Depreciation 2.3 2.4 9.9 9.5 4.5 4.5 3.2 3.1 2.0 2.2
of which: Depreciation of tangible fixed assets 2.1 2.3 9.9 9.4 4.4 4.4 3.0 3.0 1.9 2.0Interest and similar expenses 0.8 0.8 2.5 2.2 1.2 1.1 0.8 0.8 0.7 0.7Operating taxes 0.1 0.1 0.2 0.2 0.1 0.1 0.1 0.1 0.0 0.0Other expenses 12.0 12.4 21.5 21.1 16.6 16.8 13.5 13.7 11.5 12.0Total expenses before taxes on income 98.7 99.0 91.9 90.9 95.9 95.7 97.2 97.4 99.1 99.4Annual result before taxes on income 3.7 3.4 12.5 13.3 6.6 6.8 4.7 4.6 3.4 3.0Taxes on income 0.6 0.5 1.5 1.6 1.0 1.0 0.8 0.8 0.5 0.5Annual result 3.1 2.8 11.0 11.7 5.6 5.8 3.9 3.9 2.9 2.5Profit and loss transfers (parent company) 0.3 0.3 0.1 0.1 0.2 0.3 0.0 0.0 0.3 0.3Profit and loss transfers (subsidiary) 0.1 0.1 0.0 0.1 0.1 0.1 0.1 0.1 0.1 0.1Profit for the year 3.3 3.0 11.0 11.7 5.7 6.0 3.9 3.8 3.1 2.7
Balance sheetAssets Percentage of the balance sheet totalIntangible fixed assets 1.1 1.2 0.4 0.7 0.8 0.8 1.1 1.1 1.1 1.2Tangible fixed assets 26.6 26.6 66.0 64.5 45.7 44.7 31.7 31.2 24.3 24.4
of which: Land and buildings 9.1 9.2 16.7 17.0 13.3 13.4 11.9 11.7 8.3 8.6Inventories 21.4 21.6 7.6 8.7 21.3 22.7 29.5 29.8 20.4 20.5
of which: Finished goods and merchandise 9.8 9.8 3.2 3.4 9.3 9.4 11.5 11.7 9.7 9.6Cash 7.3 7.0 9.2 9.4 9.1 9.6 9.6 9.9 6.8 6.4Receivables 32.2 32.3 13.5 13.4 19.5 18.7 23.9 23.6 34.4 34.5
Short-term 30.3 29.6 12.7 12.8 18.8 18.1 23.0 22.7 32.2 31.5 of which:
Trade receivables 10.1 9.8 5.4 5.5 9.8 9.5 12.5 11.9 9.8 9.6Receivables from affiliated companies 16.7 16.5 4.4 4.2 6.3 5.7 7.3 7.5 18.8 18.7
Long-term 1.9 2.6 0.8 0.7 0.7 0.6 0.9 0.9 2.2 3.0of which: Loans to affiliated companies 1.5 2.2 0.5 0.4 0.4 0.3 0.5 0.6 1.7 2.5
Securities 0.9 0.8 0.1 0.1 0.3 0.3 0.7 0.6 0.9 0.8Other long-term equity investments 10.2 10.2 2.1 2.0 2.4 2.5 3.1 3.4 11.8 11.8
of which: Goodwill 0.3 0.3 0.4 0.4 0.4 0.4 0.2 0.3 0.2 0.2
CapitalEquity 26.4 26.3 26.2 26.9 23.4 23.7 24.7 25.2 26.9 26.6Liabilities 60.0 59.8 69.9 68.9 71.3 70.8 65.6 65.4 58.5 58.3
Short-term 47.0 47.2 32.0 33.7 43.2 45.7 50.0 51.5 46.9 46.8of which:Liabilities to banks 5.2 5.4 12.5 13.0 10.7 12.4 8.9 9.2 4.2 4.4Trade payables 9.5 9.4 4.3 4.6 7.2 7.0 7.4 6.9 10.0 10.0Liabilities to affiliated companies 22.0 21.8 7.4 7.4 12.3 12.1 17.6 18.0 23.4 23.0
Long-term 13.0 12.6 37.9 35.2 28.1 25.1 15.6 13.8 11.5 11.5 of which:
Liabilities to banks 7.8 7.9 33.8 31.8 22.8 19.8 10.2 9.3 6.3 6.8Liabilities to affiliated companies 4.2 3.6 3.0 2.5 4.1 4.0 4.5 3.9 4.1 3.6
Provisions 13.1 13.4 3.1 3.3 5.0 5.2 9.1 8.8 14.2 14.7of which: Provisions for pensions 4.5 4.6 0.1 0.1 0.7 0.7 2.1 2.0 5.1 5.3
Other ratios Percentage of salesAnnual result before taxes on income 3.7 3.4 12.6 13.5 6.6 6.9 4.8 4.7 3.5 3.0Annual result and depreciation 5.5 5.2 21.1 21.5 10.2 10.4 7.2 7.0 5.0 4.7Trade receivables 5.9 5.8 7.6 7.5 7.9 7.5 8.0 7.7 5.5 5.4
Percentage of the balance sheet totalSales 171.9 169.6 70.8 72.9 124.3 126.3 155.9 155.4 178.1 175.3Annual result and interest paid 6.8 6.1 9.6 10.3 8.5 8.8 7.5 7.3 6.6 5.7
Percentage of liabilities and provisions less cashAnnual result and depreciation 14.2 13.3 23.1 24.6 18.9 19.8 17.0 16.8 13.4 12.4
Percentage of fixed assetsLong-term equity and liabilities 108.9 105.8 92.6 91.7 104.7 101.3 114.1 111.2 108.8 105.6
Percentage of short-term liabilitiesCash resources and short-term receivables 80.4 77.9 68.8 66.0 65.0 60.6 66.0 63.8 83.5 81.3Cash resources, short-term receivables and inventories 126.0 123.8 92.5 91.9 114.5 110.3 125.1 121.7 127.0 125.1
Percentage of cost of materialsTrade payables 7.9 8.0 17.5 18.0 11.4 10.9 8.0 7.6 7.8 7.9
Memo item:Balance sheet total in € billion 364.20 376.11 4.26 4.41 14.68 15.03 46.54 47.99 298.72 308.69Sales in € billion 625.91 637.96 3.01 3.21 18.24 18.98 72.58 74.59 532.08 541.17Number of enterprises 12 094 12 094 3 521 3 521 3 609 3 609 3 077 3 077 1 887 1 887
* Agriculture, forestry and fishing, mining and quarrying, manufacturing, electricity, gas and water supply, construction, trade, transportation and storage,accommodation and food service activities, information and communication, business services, personal service activities

Deutsche BundesbankFinancial statement statistics (ratios - provisional data)
May 202121
I. Enterprises by economic sector
cont'd: 1. All economic sectors*
cont'd: Non-corporationsEnterprises with sales of ... € million
Total Less than 2 2 but less than 10 10 but less than 50 50 and moreQuartile Cylindered sample 2018/2019value 2018 2019 2018 2019 2018 2019 2018 2019 2018 2019Of the enterprises captured …
Ratios ... % had a ratio of less than …Percentage of gross revenue
Cost of materials 25 28.2 27.7 2.1 2.3 28.8 28.6 43.9 43.3 52.4 51.8 50 51.3 50.7 28.3 27.4 50.4 50.0 60.3 59.6 68.9 68.2 75 71.6 71.2 50.8 50.1 70.3 70.1 75.4 75.0 80.7 80.2
Personnel expenses 25 8.7 9.0 3.1 3.1 10.8 11.2 10.1 10.4 7.5 7.8 50 18.4 18.7 19.3 19.6 21.4 21.5 18.3 18.7 13.6 13.8 75 31.0 31.6 33.6 34.1 33.9 34.3 29.6 30.4 22.9 23.6
Depreciation 25 0.9 0.9 1.4 1.4 0.9 0.9 0.8 0.8 0.7 0.7 50 2.1 2.1 3.8 3.6 2.0 2.0 1.7 1.7 1.5 1.5 75 5.0 5.1 12.2 11.7 4.8 4.8 3.5 3.7 2.9 3.1
Annual result 25 1.4 1.5 3.7 4.3 1.7 1.7 1.0 0.9 0.7 0.6 50 4.4 4.4 10.4 10.9 4.3 4.4 2.9 2.8 2.4 2.1 75 10.1 10.3 21.2 21.6 8.3 8.4 6.0 6.0 5.4 5.2
Percentage of the balance sheet totalTangible fixed assets 25 8.0 7.9 10.5 9.9 7.6 7.2 7.1 7.3 7.7 7.7
50 24.6 24.6 40.0 38.7 23.6 23.6 20.2 20.3 20.3 20.4 75 51.8 52.0 73.3 72.8 52.2 52.0 40.3 40.9 35.7 36.7
Inventories 25 1.6 1.7 0.0 0.0 2.5 2.4 10.6 10.6 12.6 12.2 50 19.0 18.9 3.0 3.0 20.1 20.2 29.8 29.2 25.3 25.0 75 41.2 41.8 22.8 23.5 46.4 46.3 47.0 47.1 41.9 41.6
Equity 25 4.3 5.1 0.0 0.5 3.6 4.2 7.1 7.5 9.7 10.7 50 17.9 19.2 15.6 17.9 15.0 16.3 20.1 20.8 22.7 23.9 75 37.0 38.3 40.3 42.2 33.5 34.9 37.1 38.4 38.5 38.9
Short-term liabilities 25 27.5 26.6 16.9 16.5 29.7 29.0 34.0 33.2 33.4 32.9 50 51.5 50.9 42.7 41.6 53.8 53.5 54.2 54.1 52.8 52.5 75 75.3 74.0 75.8 73.4 77.1 76.2 73.8 74.0 72.7 70.6
Liabilities to banks 25 0.0 0.0 1.0 1.4 0.6 0.5 0.0 0.0 0.0 0.0 50 16.7 16.3 30.4 29.7 20.1 19.7 12.3 11.7 4.1 4.4 75 43.5 43.3 63.6 61.6 46.5 46.3 33.1 32.7 23.7 23.6
Percentage of salesAnnual result before taxes on income 25 1.8 1.8 4.1 5.0 2.1 2.1 1.3 1.2 0.9 0.7
50 5.1 5.2 11.7 12.4 5.1 5.2 3.6 3.5 2.9 2.6 75 11.7 12.1 23.8 24.4 9.9 10.0 7.2 7.1 6.6 6.2
Annual result and Depreciation 25 3.9 3.8 8.8 9.5 4.3 4.2 3.1 2.9 2.1 2.1 50 8.4 8.4 19.0 19.1 8.2 8.2 5.9 5.7 4.8 4.4 75 17.5 17.6 38.1 38.4 14.7 15.0 10.7 10.5 9.5 8.9
Trade receivables 25 2.3 2.2 0.9 0.9 2.9 2.7 3.8 3.4 2.7 2.6 50 6.0 5.7 4.5 4.1 6.3 6.0 6.9 6.5 6.2 6.0 75 10.4 10.0 9.9 9.4 10.6 10.1 10.7 10.3 10.1 9.8
Percentage of the balance sheet totalAnnual result and interest paid 25 4.1 4.2 5.9 6.3 4.5 4.6 3.5 3.4 3.0 2.6
50 9.4 9.4 16.2 17.3 10.0 10.0 7.5 7.4 6.8 6.3 75 19.8 20.2 38.4 40.7 19.3 19.6 13.6 13.0 11.9 10.9
Percentage of liabilities and provisions less cashAnnual result and Depreciation 25 9.0 9.3 11.0 13.1 9.7 10.0 8.2 8.1 7.6 7.2
50 20.5 21.0 28.4 31.0 21.3 22.0 17.8 17.4 16.1 15.1 75 44.7 45.7 73.7 81.9 43.7 44.1 34.3 33.4 30.1 29.8
Percentage of fixed assetsLong-term equity and liabilities 25 64.9 67.0 45.0 49.8 63.2 66.3 75.5 73.8 77.5 77.0
50 110.4 112.1 98.3 100.8 109.9 111.3 126.7 126.0 124.0 121.6 75 219.2 227.7 166.1 185.7 232.8 243.0 253.8 253.0 220.5 222.5
Percentage of short-term liabilitiesCash resources and short-term receivables 25 37.4 36.7 32.2 32.0 35.5 34.0 39.3 38.5 46.0 46.6
50 71.4 71.5 78.9 80.5 67.0 66.5 67.7 67.5 75.3 75.6 75 129.6 131.5 169.5 179.0 120.1 125.8 115.7 116.2 115.9 117.2
Percentage of cost of materialsTrade payables 25 4.2 3.9 4.1 3.9 4.8 4.4 4.0 3.7 3.9 3.8
50 8.4 7.9 11.2 10.6 9.7 9.0 7.0 6.7 7.0 6.8 75 15.6 15.0 28.1 26.5 18.0 17.4 11.9 11.2 10.5 10.5
* Agriculture, forestry and fishing, mining and quarrying, manufacturing, electricity, gas and water supply, construction, trade, transportation and storage,accommodation and food service activities, information and communication, business services, personal service activities

Deutsche BundesbankFinancial statement statistics (ratios - provisional data)May 202122
I. Enterprises by economic sector
2. Agriculture, forestry and fishing
All legal formsEnterprises with sales of ... € million
Total Less than 2 2 but less than 10 10 but less than 50 50 and moreCylindered sample 2018/2019
Ratios 2018 2019 2018 2019 2018 2019 2018 2019 2018 2019Income statementIncome Percentage of gross revenueSales 98.2 98.8 100.8 99.8 100.7 100.1 97.3 98.2 97.0 98.3Change in finished goods 1.8 1.2 - 0.8 0.2 - 0.7 - 0.1 2.7 1.8 3.0 1.7Interest and similar income 0.4 0.4 0.6 0.4 0.4 0.3 0.4 0.4 0.3 0.4Other income 10.3 11.7 24.2 25.9 14.6 14.6 4.2 4.5 8.7 11.2
of which: Income from long-term equity investments 0.9 1.2 0.3 0.3 0.8 0.8 0.2 0.1 1.3 2.0Total income 110.6 112.1 124.8 126.3 115.0 115.0 104.6 104.9 109.0 111.5
ExpensesCost of materials 54.0 55.2 51.3 51.1 54.3 54.4 49.4 48.9 55.8 58.4Personnel expenses 25.2 26.6 19.1 19.4 22.2 22.4 20.5 20.5 29.0 31.8Depreciation 7.1 7.5 11.5 12.3 9.8 9.9 7.7 8.3 5.1 5.3
of which: Depreciation of tangible fixed assets 7.0 7.3 11.4 12.0 9.6 9.9 7.5 7.7 5.1 5.3Interest and similar expenses 1.9 2.2 3.7 3.6 2.3 2.3 1.3 1.2 1.8 2.4Operating taxes 0.4 0.3 0.6 0.7 0.5 0.4 0.2 0.2 0.4 0.3Other expenses 18.1 19.2 32.7 31.7 22.4 22.5 19.0 18.5 14.1 16.3Total expenses before taxes on income 106.8 111.1 118.9 118.8 111.4 112.0 98.1 97.6 106.2 114.5Annual result before taxes on income 3.8 1.0 6.0 7.5 3.6 3.0 6.5 7.3 2.8 - 3.0Taxes on income 0.6 0.7 0.7 1.0 1.0 0.8 0.7 1.0 0.4 0.4Annual result 3.2 0.4 5.3 6.5 2.6 2.1 5.8 6.3 2.4 - 3.4Profit and loss transfers (parent company) 0.6 0.8 0.2 - 0.1 0.1 0.1 - 0.2 0.3 1.1 1.4Profit and loss transfers (subsidiary) 0.9 0.8 - 0.1 0.2 - 0.1 - 0.3 4.0 3.4 0.4 0.4Profit for the year 2.9 0.4 5.5 6.3 2.8 2.5 1.6 3.2 3.1 - 2.4
Balance SheetAssets Percentage of the balance sheet totalIntangible fixed assets 1.0 1.0 0.2 0.2 0.2 0.2 0.2 0.2 1.6 1.5Tangible fixed assets 67.6 65.1 67.8 68.4 63.1 63.1 48.1 47.4 72.2 67.8
of which: Land and buildings 45.5 43.8 48.6 49.0 42.3 42.4 21.9 22.4 49.9 46.7Inventories 6.3 5.8 8.3 8.0 12.1 11.7 12.0 12.1 3.0 2.4
of which: Finished goods and merchandise 3.7 3.2 4.2 3.7 6.6 6.1 6.6 6.3 2.1 1.7Cash 5.0 4.0 4.3 3.6 5.0 4.4 9.9 9.2 4.4 3.1Receivables 12.1 18.0 13.4 14.0 14.6 15.2 20.8 22.0 9.7 18.9
Short-term 10.7 15.0 12.3 12.9 13.4 14.0 17.0 18.4 8.4 15.1 of which:
Trade receivables 3.4 3.2 3.5 4.0 4.0 3.8 6.3 6.6 2.8 2.4Receivables from affiliated companies 5.4 6.1 6.3 5.7 7.3 8.0 9.0 8.8 4.0 5.1
Long-term 1.5 3.0 1.1 1.1 1.2 1.2 3.8 3.5 1.3 3.8of which: Loans to affiliated companies 1.2 1.1 0.1 0.2 0.6 0.7 3.5 3.1 1.3 1.0
Securities 1.9 0.3 0.4 0.3 0.8 0.8 0.3 0.3 2.7 0.0Other long-term equity investments 5.8 5.7 5.2 5.0 3.8 4.2 8.4 8.6 6.2 5.8
of which: Goodwill 0.0 0.0 0.0 0.0 0.0 0.0 0.2 0.1 0.0 0.0
CapitalEquity 64.2 60.3 44.6 43.2 47.5 46.5 31.9 32.1 78.1 71.5Liabilities 28.6 32.3 52.8 54.1 49.7 50.7 59.7 58.8 12.7 19.1
Short-term 15.1 19.9 26.1 27.5 19.9 20.5 37.8 39.0 8.4 15.9of which:Liabilities to banks 3.8 7.6 10.1 10.5 7.4 7.7 6.9 7.7 1.1 7.2Trade payables 2.8 2.7 4.6 5.1 4.2 3.9 5.6 5.5 1.6 1.6Liabilities to affiliated companies 7.1 8.0 7.7 8.3 5.8 6.2 22.1 23.3 5.2 6.4
Long-term 13.5 12.4 26.7 26.6 29.8 30.2 21.9 19.8 4.3 3.2 of which:
Liabilities to banks 10.5 9.4 19.1 19.4 20.8 20.4 18.1 16.4 4.3 3.2Liabilities to affiliated companies 2.7 2.8 7.0 6.5 8.3 9.2 2.5 2.7 0.0 0.0
Provisions 6.5 6.7 1.9 1.7 2.1 2.0 8.2 8.8 8.5 8.8of which: Provisions for pensions 3.7 4.1 0.4 0.4 0.2 0.2 3.8 4.1 5.5 6.0
Other ratios Percentage of salesAnnual result before taxes on income 3.9 1.0 5.9 7.5 3.6 3.0 6.7 7.4 2.9 - 3.1Annual result and depreciation 10.5 7.9 16.7 18.8 12.3 12.1 13.9 14.8 7.8 1.9Trade receivables 8.3 8.4 11.2 13.2 8.7 8.4 8.0 8.3 7.9 7.8
Percentage of the balance sheet totalSales 41.1 38.3 31.6 30.3 45.7 44.7 78.9 79.4 34.9 31.2Annual result and interest paid 2.2 1.0 2.8 3.1 2.2 2.0 5.7 6.0 1.5 - 0.3
Percentage of liabilities and provisions less cashAnnual result and depreciation 14.1 8.5 10.3 10.7 11.8 11.0 18.8 20.1 15.5 2.3
Percentage of fixed assetsLong-term equity and liabilities 105.1 102.6 96.2 93.5 112.9 111.3 94.9 93.5 104.8 102.0
Percentage of short-term liabilitiesCash resources and short-term receivables 104.7 96.1 64.0 60.2 95.3 92.2 71.7 70.9 152.4 114.7Cash resources, short-term receivables and inventories 146.4 125.2 96.0 89.3 156.1 149.2 103.5 102.1 187.9 130.1
Percentage of cost of materialsTrade payables 12.3 12.8 28.7 33.2 17.0 15.9 14.0 13.8 7.9 8.8
Memo item:Balance sheet total in € billion 11.24 11.85 0.91 0.94 2.54 2.61 1.03 1.03 6.76 7.26Sales in € billion 4.62 4.54 0.29 0.29 1.16 1.17 0.81 0.82 2.36 2.27Number of enterprises 651 651 336 336 256 256 43 43 16 16

Deutsche BundesbankFinancial statement statistics (ratios - provisional data)
May 202123
I. Enterprises by economic sector
cont'd: 2. Agriculture, forestry and fishing
cont'd: All legal formsEnterprises with sales of ... € million
Total Less than 2 2 but less than 10 10 but less than 50 50 and moreQuartile Cylindered sample 2018/2019value 2018 2019 2018 2019 2018 2019 2018 2019 2018 2019Of the enterprises captured …
Ratios ... % had a ratio of less than …Percentage of gross revenue
Cost of materials 25 36.2 37.2 28.4 29.1 44.2 44.3 33.0 31.5 44.7 48.2 50 54.7 54.7 52.7 53.8 56.3 56.3 52.0 50.8 59.5 63.0 75 69.0 69.3 71.9 70.4 66.6 67.2 66.8 69.7 76.9 80.3
Personnel expenses 25 8.5 8.8 4.3 3.5 12.7 13.0 11.3 11.5 8.6 9.3 50 18.4 18.5 14.6 14.5 21.9 21.6 19.8 19.2 18.6 19.2 75 28.5 29.6 27.9 28.7 28.5 29.9 31.2 31.1 54.1 60.9
Depreciation 25 3.7 4.0 2.9 3.3 4.8 4.7 2.8 2.7 1.4 1.4 50 8.6 9.7 9.2 10.8 8.6 9.5 5.5 5.5 3.5 3.9 75 15.2 16.0 18.6 17.9 14.5 14.6 11.0 11.6 7.3 7.6
Annual result 25 - 1.1 - 1.4 - 0.9 - 1.8 - 1.9 - 1.4 - 0.5 0.0 - 0.2 - 9.2 50 4.5 3.6 8.0 7.2 3.0 2.5 2.1 2.1 1.6 0.4 75 13.0 12.1 20.5 18.6 8.1 6.7 7.0 5.2 5.8 1.8
Percentage of the balance sheet totalTangible fixed assets 25 42.9 43.3 45.4 45.3 51.9 52.1 21.8 21.5 20.0 19.9
50 65.6 66.1 67.5 67.1 66.3 67.6 40.2 41.0 29.4 32.2 75 78.9 79.7 82.3 83.0 77.6 78.2 66.3 69.6 90.7 91.9
Inventories 25 2.3 2.4 0.7 0.9 5.7 5.3 4.3 4.1 2.3 1.4 50 8.4 8.1 6.6 6.8 9.6 9.3 11.3 11.5 3.8 3.7 75 15.8 15.7 16.5 15.7 15.3 14.8 20.6 19.1 8.9 9.0
Equity 25 17.5 17.0 12.2 13.1 20.9 21.0 10.0 15.0 40.7 40.3 50 43.2 43.2 41.5 39.7 44.1 45.4 43.6 44.7 52.1 52.0 75 64.6 64.2 65.0 66.3 63.6 63.2 56.8 53.3 95.3 95.2
Short-term liabilities 25 9.0 9.6 8.5 10.0 9.1 8.7 15.2 16.5 1.5 1.8 50 20.6 22.4 22.3 26.4 17.8 18.4 26.4 28.1 18.0 15.5 75 42.7 43.4 48.8 48.2 37.2 39.4 47.7 46.0 27.5 29.4
Liabilities to banks 25 8.4 9.2 6.1 6.5 14.8 14.9 2.4 1.6 0.0 0.0 50 26.1 25.4 25.4 24.5 29.1 29.4 19.0 15.0 0.0 0.1 75 45.8 46.8 51.0 49.9 42.0 44.9 38.5 31.3 23.4 33.5
Percentage of salesAnnual result before taxes on income 25 - 0.9 - 1.4 - 0.5 - 2.1 - 1.5 - 1.5 - 0.5 0.1 0.2 - 8.9
50 5.0 4.4 8.8 7.8 3.8 2.8 2.4 2.5 2.2 0.6 75 14.6 13.4 20.9 18.7 10.1 8.7 8.5 8.3 6.6 1.9
Annual result and depreciation 25 5.9 6.0 7.4 7.9 6.4 6.2 4.3 5.2 3.3 - 0.8 50 15.5 14.8 21.0 20.7 13.3 12.2 8.0 9.9 6.8 3.2 75 26.9 26.2 34.9 33.7 21.1 19.6 14.6 16.0 10.7 6.5
Trade receivables 25 2.6 3.0 1.2 1.4 3.9 4.3 3.0 2.3 4.0 5.3 50 6.2 6.2 4.9 5.4 6.9 6.8 6.8 7.1 7.0 7.0 75 11.1 12.2 11.8 13.4 10.6 11.3 11.4 10.6 10.7 8.8
Percentage of the balance sheet totalAnnual result and interest paid 25 0.4 0.2 0.8 0.5 0.0 0.1 0.4 0.4 0.3 - 0.4
50 3.3 2.8 4.3 4.1 2.4 2.4 2.5 2.7 3.6 1.1 75 7.9 7.7 9.6 10.1 6.8 4.6 8.1 7.5 7.0 3.1
Percentage of liabilities and provisions less cashAnnual result and Depreciation 25 4.1 3.8 2.4 2.4 5.5 5.3 6.5 9.4 10.0 - 18.1
50 13.6 13.9 12.3 13.9 14.9 13.3 13.8 16.9 22.1 7.3 75 28.9 28.7 26.8 29.6 31.3 26.6 39.6 36.0 59.1 28.0
Percentage of fixed assetsLong-term equity and liabilities 25 81.4 80.8 68.6 73.1 90.1 89.3 86.2 91.2 101.8 100.4
50 107.3 105.3 99.9 98.4 112.2 110.0 121.0 120.1 108.1 104.7 75 133.4 133.3 129.2 130.8 131.1 130.9 178.5 153.7 258.0 261.1
Percentage of short-term liabilitiesCash resources and short-term receivables 25 32.0 31.1 23.7 21.9 42.4 37.3 42.0 37.3 112.0 109.6
50 82.7 76.9 64.1 58.5 91.1 91.6 95.7 89.8 290.6 224.9 75 203.9 179.8 189.4 166.7 188.9 178.1 222.3 211.9 538.0 448.9
Percentage of cost of materialsTrade payables 25 6.2 6.4 6.4 6.6 6.0 6.8 6.0 6.1 5.2 4.5
50 13.3 13.7 17.4 21.6 11.9 12.0 10.6 12.1 7.0 7.9 75 33.3 36.3 44.9 52.8 24.6 24.4 21.4 20.6 12.7 12.9

Deutsche BundesbankFinancial statement statistics (ratios - provisional data)May 202124
I. Enterprises by economic sector
3. Mining and quarrying
All legal formsEnterprises with sales of ... € million
Total Less than 2 2 but less than 10 10 but less than 50 50 and moreCylindered sample 2018/2019
Ratios 2018 2019 2018 2019 2018 2019 2018 2019 2018 2019Income statementIncome Percentage of gross revenueSales 99.7 99.1 98.6 99.8 98.9 98.9 100.8 99.5 99.5 99.0Change in finished goods 0.3 0.9 1.4 0.2 1.1 1.1 - 0.8 0.5 0.5 1.0Interest and similar income 0.5 0.5 0.2 0.2 0.3 0.3 0.3 0.3 0.6 0.6Other income 6.1 8.3 8.9 8.1 9.6 6.9 5.1 6.0 5.9 9.0
of which: Income from long-term equity investments 2.5 3.8 2.6 4.3 0.9 1.0 1.6 1.8 2.9 4.5Total income 106.6 108.8 109.1 108.3 109.9 107.2 105.4 106.3 106.5 109.6
ExpensesCost of materials 41.2 42.7 32.2 31.1 34.5 34.5 44.8 44.2 41.1 43.2Personnel expenses 21.7 22.1 22.3 20.3 23.2 23.6 20.2 21.2 21.9 22.2Depreciation 9.7 10.3 13.4 12.6 7.9 11.7 9.9 9.5 9.8 10.3
of which: Depreciation of tangible fixed assets 9.6 9.9 13.4 12.4 7.8 11.5 9.5 8.7 9.7 10.0Interest and similar expenses 3.8 3.6 1.9 1.6 1.6 1.3 1.3 1.3 4.6 4.4Operating taxes 0.3 0.3 0.2 0.2 0.1 0.1 0.1 0.1 0.4 0.4Other expenses 22.3 24.5 27.3 27.8 26.4 27.0 24.0 24.2 21.5 24.3Total expenses before taxes on income 99.1 103.5 97.3 93.7 93.8 98.2 100.3 100.5 99.3 104.9Annual result before taxes on income 7.5 5.3 11.9 14.6 16.1 9.0 5.1 5.9 7.2 4.7Taxes on income 1.1 0.9 1.8 2.0 2.6 2.4 1.3 1.1 0.9 0.7Annual result 6.4 4.4 10.1 12.6 13.5 6.6 3.8 4.8 6.3 4.0Profit and loss transfers (parent company) 2.5 2.1 0.0 0.0 0.2 0.1 0.0 0.0 3.3 2.8Profit and loss transfers (subsidiary) 6.3 4.0 0.3 0.5 0.4 0.2 1.0 0.7 8.1 5.2Profit for the year 2.6 2.5 9.8 12.1 13.3 6.5 2.9 4.1 1.6 1.6
Balance sheetAssets Percentage of the balance sheet totalIntangible fixed assets 1.1 0.9 2.8 2.7 1.1 1.1 3.1 3.1 0.9 0.6Tangible fixed assets 28.2 26.4 65.3 62.7 51.8 51.0 51.7 51.4 24.1 22.2
of which: Land and buildings 10.4 9.4 34.4 33.2 28.8 26.8 24.6 24.6 7.7 6.7Inventories 4.7 4.9 7.4 7.8 9.0 9.1 6.8 7.0 4.2 4.5
of which: Finished goods and merchandise 1.7 1.7 5.8 6.6 3.4 3.5 3.0 3.4 1.4 1.4Cash 5.4 11.9 8.8 10.4 13.8 14.6 7.2 8.6 4.8 12.1Receivables 47.9 42.8 13.6 14.2 18.6 17.2 20.7 19.5 52.7 46.9
Short-term 42.6 34.7 13.4 13.8 18.1 16.7 19.2 17.8 46.7 37.7 of which:
Trade receivables 3.2 2.8 5.0 3.2 5.5 5.1 5.5 4.9 2.8 2.4Receivables from affiliated companies 35.5 28.5 5.2 7.5 10.1 9.0 11.0 10.6 39.7 31.6
Long-term 5.3 8.1 0.2 0.4 0.5 0.5 1.5 1.8 6.0 9.2of which: Loans to affiliated companies 5.2 8.0 0.1 0.1 0.4 0.4 1.4 1.4 5.9 9.1
Securities 0.1 0.1 0.4 0.4 0.8 1.0 0.3 0.7 0.0 0.0Other long-term equity investments 11.8 12.2 1.2 1.4 4.3 5.4 10.0 9.5 12.5 12.9
of which: Goodwill 0.0 0.0 0.0 0.0 0.2 0.1 0.1 0.0 0.0 0.0
CapitalEquity 26.3 24.6 26.4 30.2 31.9 30.6 37.9 36.3 24.6 23.0Liabilities 27.1 28.2 59.3 54.8 49.6 50.9 34.1 35.2 25.0 26.2
Short-term 21.6 23.4 41.2 39.5 31.6 31.9 24.6 26.0 20.6 22.6of which:Liabilities to banks 0.6 0.6 9.4 8.8 4.6 5.2 2.6 2.5 0.1 0.1Trade payables 2.7 2.2 3.1 2.7 5.0 4.5 3.5 3.2 2.4 1.9Liabilities to affiliated companies 17.0 19.0 23.9 23.0 16.1 16.6 16.0 17.9 17.2 19.2
Long-term 5.5 4.8 18.1 15.3 18.0 19.0 9.5 9.1 4.4 3.6 of which:
Liabilities to banks 1.6 1.5 10.0 9.2 13.8 14.3 5.3 5.4 0.6 0.4Liabilities to affiliated companies 1.9 1.4 6.5 4.5 3.0 3.3 3.3 2.6 1.7 1.1
Provisions 46.6 47.1 14.3 14.7 18.4 18.5 27.8 28.4 50.3 50.8of which: Provisions for pensions 10.5 10.7 0.8 0.9 1.2 1.3 3.5 3.7 11.8 12.1
Other ratios Percentage of salesAnnual result before taxes on income 7.5 5.3 12.0 14.6 16.3 9.1 5.1 5.9 7.3 4.7Annual result and depreciation 16.2 14.8 23.8 25.3 21.6 18.5 13.6 14.3 16.3 14.5Trade receivables 6.7 6.2 8.4 5.0 6.7 6.2 6.8 6.2 6.6 6.3
Percentage of the balance sheet totalSales 47.7 44.3 60.3 64.0 81.5 81.2 82.1 79.3 42.0 38.5Annual result and interest paid 4.9 3.6 7.3 9.1 12.5 6.5 4.2 4.8 4.6 3.3
Percentage of liabilities and provisions less cashAnnual result and depreciation 11.3 10.3 22.2 27.3 32.5 27.4 20.3 20.7 9.7 8.6
Percentage of fixed assetsLong-term equity and liabilities 90.9 84.2 65.3 69.0 87.5 86.4 76.6 74.3 94.0 85.9
Percentage of short-term liabilitiesCash resources and short-term receivables 222.3 199.7 55.0 62.3 101.3 98.7 108.1 102.3 249.4 220.8Cash resources, short-term receivables and inventories 244.1 220.7 72.9 82.0 129.7 127.3 135.5 129.1 270.0 240.6
Percentage of cost of materialsTrade payables 13.4 11.3 15.7 13.7 17.4 15.9 9.7 9.1 14.1 11.5
Memo item:Balance sheet total in € billion 11.86 12.51 0.07 0.08 0.46 0.49 1.20 1.23 10.12 10.71Sales in € billion 5.66 5.54 0.04 0.05 0.38 0.40 0.99 0.97 4.25 4.12Number of enterprises 172 172 40 40 78 78 40 40 14 14

Deutsche BundesbankFinancial statement statistics (ratios - provisional data)
May 202125
I. Enterprises by economic sector
cont'd: 3. Mining and quarrying
cont'd: All legal formsEnterprises with sales of ... € million
Total Less than 2 2 but less than 10 10 but less than 50 50 and moreQuartile Cylindered sample 2018/2019value 2018 2019 2018 2019 2018 2019 2018 2019 2018 2019Of the enterprises captured …
Ratios ... % had a ratio of less than …Percentage of gross revenue
Cost of materials 25 23.3 22.9 15.1 14.8 22.5 22.8 26.7 26.1 37.8 38.9 50 34.3 35.0 31.4 28.3 32.7 32.4 43.3 41.7 38.9 46.2 75 48.0 48.4 42.4 44.7 44.7 45.4 60.0 60.2 60.5 58.8
Personnel expenses 25 14.0 13.8 12.0 10.3 16.1 15.8 11.6 12.9 18.9 17.8 50 20.6 21.1 19.6 18.0 21.0 22.1 17.7 18.5 22.1 22.6 75 28.9 28.8 32.4 30.6 28.5 28.5 27.5 29.4 29.0 28.0
Depreciation 25 4.2 4.6 4.8 5.5 4.9 4.9 3.1 3.3 3.9 4.1 50 7.8 8.6 8.4 11.4 8.0 8.1 6.8 7.9 7.8 8.7 75 11.6 12.6 18.2 15.3 10.4 11.0 10.7 11.6 13.0 13.4
Annual result 25 1.1 1.9 0.4 2.4 2.0 2.9 0.7 0.6 - 3.2 - 4.3 50 6.3 6.2 7.6 7.5 8.0 7.2 4.1 5.0 9.1 0.6 75 13.7 13.5 14.5 15.7 13.8 13.5 8.7 10.7 12.6 10.0
Percentage of the balance sheet totalTangible fixed assets 25 30.6 32.6 40.6 37.0 33.5 34.2 35.7 31.7 16.2 15.1
50 50.8 50.9 59.4 57.4 53.1 51.4 49.9 50.4 28.8 28.3 75 67.9 67.2 73.6 73.0 67.9 66.1 64.3 70.7 44.8 46.4
Inventories 25 1.8 1.6 0.2 0.5 1.9 1.8 3.7 1.8 1.8 3.8 50 5.3 5.0 3.9 3.8 4.8 4.4 6.9 6.9 6.9 7.0 75 12.5 12.4 17.5 12.1 10.2 11.7 12.0 12.5 12.1 13.0
Equity 25 11.2 12.4 9.2 9.9 10.2 10.5 16.3 13.9 13.0 14.6 50 25.9 26.7 25.6 29.4 25.2 26.2 29.2 30.1 27.1 28.0 75 50.9 48.6 47.7 46.7 51.0 49.5 52.1 48.5 46.7 47.6
Short-term liabilities 25 12.9 10.2 15.9 7.3 13.0 10.4 14.0 12.2 6.1 8.8 50 25.1 23.7 25.9 23.0 23.5 22.8 28.3 27.3 17.2 20.6 75 50.2 49.3 53.8 54.1 52.6 51.6 45.9 41.4 34.9 34.5
Liabilities to banks 25 0.0 0.0 0.0 0.0 0.8 1.3 0.0 0.0 0.0 0.0 50 9.7 7.8 10.0 4.4 13.2 13.8 7.9 6.7 0.0 0.0 75 27.7 28.6 32.3 30.1 31.9 39.1 15.5 19.3 0.0 0.0
Percentage of salesAnnual result before taxes on income 25 1.5 2.6 0.7 2.6 3.3 4.0 1.0 1.2 - 2.3 - 4.4
50 8.1 9.2 8.9 9.6 10.6 10.3 4.8 5.9 10.0 1.8 75 16.4 15.6 15.7 19.3 18.1 15.8 10.9 12.9 18.2 11.5
Annual result and Depreciation 25 8.7 10.0 9.5 10.6 10.3 11.0 6.0 7.1 4.6 6.4 50 16.1 17.6 21.8 24.0 16.5 18.3 13.7 15.5 14.2 11.2 75 29.4 28.1 34.8 32.9 29.9 29.0 19.5 19.9 28.4 24.9
Trade receivables 25 2.8 3.0 1.9 1.4 3.1 3.4 3.3 3.6 4.2 3.5 50 5.6 5.2 4.5 4.0 4.9 5.1 6.7 6.6 5.9 5.7 75 9.6 7.9 10.2 8.2 8.7 7.3 9.2 8.1 9.8 8.7
Percentage of the balance sheet totalAnnual result and interest paid 25 2.6 2.5 1.6 2.1 3.3 3.7 2.5 2.9 0.7 - 0.1
50 6.2 7.2 6.1 6.9 7.7 8.4 5.4 7.4 4.3 1.7 75 13.7 12.8 13.5 12.4 16.1 15.0 10.2 11.7 10.7 5.5
Percentage of liabilities and provisions less cashAnnual result and Depreciation 25 7.1 9.2 7.2 9.3 7.1 10.3 12.6 11.3 4.1 6.7
50 23.6 25.6 21.5 27.7 26.0 25.6 23.6 28.2 8.5 10.3 75 43.4 49.2 40.4 53.3 50.6 59.3 43.3 50.6 28.3 19.0
Percentage of fixed assetsLong-term equity and liabilities 25 53.7 58.2 33.9 33.1 59.7 60.7 52.5 48.1 83.6 58.8
50 84.9 89.4 78.8 93.8 83.4 83.8 86.8 88.7 95.4 93.1 75 128.1 128.7 154.8 154.1 128.1 124.6 115.5 124.7 153.5 112.8
Percentage of short-term liabilitiesCash resources and short-term receivables 25 43.4 38.5 30.2 22.8 42.9 41.3 44.2 47.8 102.7 50.7
50 108.7 125.4 94.0 121.9 107.1 120.8 107.7 129.7 267.9 208.6 75 282.1 310.3 269.2 491.8 239.7 305.9 225.5 261.0 635.1 363.3
Percentage of cost of materialsTrade payables 25 6.6 5.6 4.2 4.7 8.0 5.8 5.1 5.1 7.8 6.0
50 11.2 9.5 8.6 8.8 12.4 12.3 9.0 8.3 10.6 9.0 75 19.6 20.3 32.6 19.3 20.2 22.7 16.8 15.3 16.7 17.1
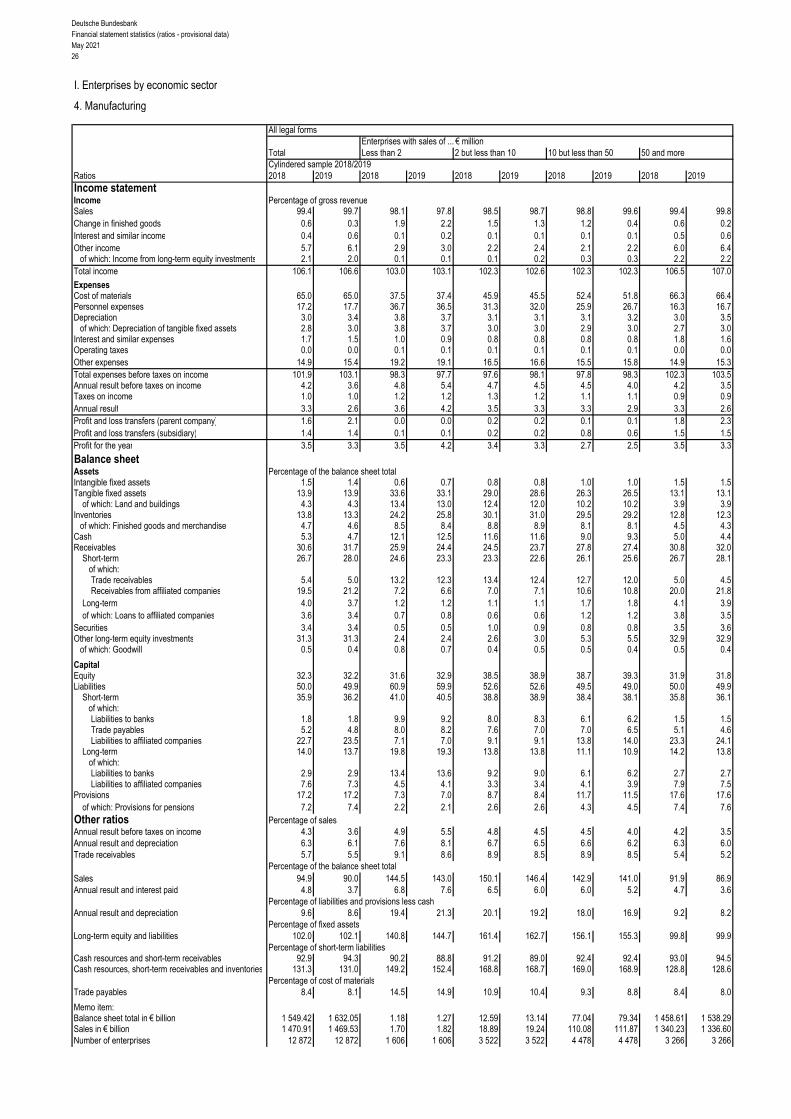
Deutsche BundesbankFinancial statement statistics (ratios - provisional data)May 202126
I. Enterprises by economic sector
4. Manufacturing
All legal formsEnterprises with sales of ... € million
Total Less than 2 2 but less than 10 10 but less than 50 50 and moreCylindered sample 2018/2019
Ratios 2018 2019 2018 2019 2018 2019 2018 2019 2018 2019Income statementIncome Percentage of gross revenueSales 99.4 99.7 98.1 97.8 98.5 98.7 98.8 99.6 99.4 99.8Change in finished goods 0.6 0.3 1.9 2.2 1.5 1.3 1.2 0.4 0.6 0.2Interest and similar income 0.4 0.6 0.1 0.2 0.1 0.1 0.1 0.1 0.5 0.6Other income 5.7 6.1 2.9 3.0 2.2 2.4 2.1 2.2 6.0 6.4
of which: Income from long-term equity investments 2.1 2.0 0.1 0.1 0.1 0.2 0.3 0.3 2.2 2.2Total income 106.1 106.6 103.0 103.1 102.3 102.6 102.3 102.3 106.5 107.0
ExpensesCost of materials 65.0 65.0 37.5 37.4 45.9 45.5 52.4 51.8 66.3 66.4Personnel expenses 17.2 17.7 36.7 36.5 31.3 32.0 25.9 26.7 16.3 16.7Depreciation 3.0 3.4 3.8 3.7 3.1 3.1 3.1 3.2 3.0 3.5
of which: Depreciation of tangible fixed assets 2.8 3.0 3.8 3.7 3.0 3.0 2.9 3.0 2.7 3.0Interest and similar expenses 1.7 1.5 1.0 0.9 0.8 0.8 0.8 0.8 1.8 1.6Operating taxes 0.0 0.0 0.1 0.1 0.1 0.1 0.1 0.1 0.0 0.0Other expenses 14.9 15.4 19.2 19.1 16.5 16.6 15.5 15.8 14.9 15.3Total expenses before taxes on income 101.9 103.1 98.3 97.7 97.6 98.1 97.8 98.3 102.3 103.5Annual result before taxes on income 4.2 3.6 4.8 5.4 4.7 4.5 4.5 4.0 4.2 3.5Taxes on income 1.0 1.0 1.2 1.2 1.3 1.2 1.1 1.1 0.9 0.9Annual result 3.3 2.6 3.6 4.2 3.5 3.3 3.3 2.9 3.3 2.6Profit and loss transfers (parent company) 1.6 2.1 0.0 0.0 0.2 0.2 0.1 0.1 1.8 2.3Profit and loss transfers (subsidiary) 1.4 1.4 0.1 0.1 0.2 0.2 0.8 0.6 1.5 1.5Profit for the year 3.5 3.3 3.5 4.2 3.4 3.3 2.7 2.5 3.5 3.3
Balance sheetAssets Percentage of the balance sheet totalIntangible fixed assets 1.5 1.4 0.6 0.7 0.8 0.8 1.0 1.0 1.5 1.5Tangible fixed assets 13.9 13.9 33.6 33.1 29.0 28.6 26.3 26.5 13.1 13.1
of which: Land and buildings 4.3 4.3 13.4 13.0 12.4 12.0 10.2 10.2 3.9 3.9Inventories 13.8 13.3 24.2 25.8 30.1 31.0 29.5 29.2 12.8 12.3
of which: Finished goods and merchandise 4.7 4.6 8.5 8.4 8.8 8.9 8.1 8.1 4.5 4.3Cash 5.3 4.7 12.1 12.5 11.6 11.6 9.0 9.3 5.0 4.4Receivables 30.6 31.7 25.9 24.4 24.5 23.7 27.8 27.4 30.8 32.0
Short-term 26.7 28.0 24.6 23.3 23.3 22.6 26.1 25.6 26.7 28.1 of which:
Trade receivables 5.4 5.0 13.2 12.3 13.4 12.4 12.7 12.0 5.0 4.5Receivables from affiliated companies 19.5 21.2 7.2 6.6 7.0 7.1 10.6 10.8 20.0 21.8
Long-term 4.0 3.7 1.2 1.2 1.1 1.1 1.7 1.8 4.1 3.9of which: Loans to affiliated companies 3.6 3.4 0.7 0.8 0.6 0.6 1.2 1.2 3.8 3.5
Securities 3.4 3.4 0.5 0.5 1.0 0.9 0.8 0.8 3.5 3.6Other long-term equity investments 31.3 31.3 2.4 2.4 2.6 3.0 5.3 5.5 32.9 32.9
of which: Goodwill 0.5 0.4 0.8 0.7 0.4 0.5 0.5 0.4 0.5 0.4
CapitalEquity 32.3 32.2 31.6 32.9 38.5 38.9 38.7 39.3 31.9 31.8Liabilities 50.0 49.9 60.9 59.9 52.6 52.6 49.5 49.0 50.0 49.9
Short-term 35.9 36.2 41.0 40.5 38.8 38.9 38.4 38.1 35.8 36.1of which:Liabilities to banks 1.8 1.8 9.9 9.2 8.0 8.3 6.1 6.2 1.5 1.5Trade payables 5.2 4.8 8.0 8.2 7.6 7.0 7.0 6.5 5.1 4.6Liabilities to affiliated companies 22.7 23.5 7.1 7.0 9.1 9.1 13.8 14.0 23.3 24.1
Long-term 14.0 13.7 19.8 19.3 13.8 13.8 11.1 10.9 14.2 13.8 of which:
Liabilities to banks 2.9 2.9 13.4 13.6 9.2 9.0 6.1 6.2 2.7 2.7Liabilities to affiliated companies 7.6 7.3 4.5 4.1 3.3 3.4 4.1 3.9 7.9 7.5
Provisions 17.2 17.2 7.3 7.0 8.7 8.4 11.7 11.5 17.6 17.6of which: Provisions for pensions 7.2 7.4 2.2 2.1 2.6 2.6 4.3 4.5 7.4 7.6
Other ratios Percentage of salesAnnual result before taxes on income 4.3 3.6 4.9 5.5 4.8 4.5 4.5 4.0 4.2 3.5Annual result and depreciation 6.3 6.1 7.6 8.1 6.7 6.5 6.6 6.2 6.3 6.0Trade receivables 5.7 5.5 9.1 8.6 8.9 8.5 8.9 8.5 5.4 5.2
Percentage of the balance sheet totalSales 94.9 90.0 144.5 143.0 150.1 146.4 142.9 141.0 91.9 86.9Annual result and interest paid 4.8 3.7 6.8 7.6 6.5 6.0 6.0 5.2 4.7 3.6
Percentage of liabilities and provisions less cashAnnual result and depreciation 9.6 8.6 19.4 21.3 20.1 19.2 18.0 16.9 9.2 8.2
Percentage of fixed assetsLong-term equity and liabilities 102.0 102.1 140.8 144.7 161.4 162.7 156.1 155.3 99.8 99.9
Percentage of short-term liabilitiesCash resources and short-term receivables 92.9 94.3 90.2 88.8 91.2 89.0 92.4 92.4 93.0 94.5Cash resources, short-term receivables and inventories 131.3 131.0 149.2 152.4 168.8 168.7 169.0 168.9 128.8 128.6
Percentage of cost of materialsTrade payables 8.4 8.1 14.5 14.9 10.9 10.4 9.3 8.8 8.4 8.0
Memo item:Balance sheet total in € billion 1 549.42 1 632.05 1.18 1.27 12.59 13.14 77.04 79.34 1 458.61 1 538.29Sales in € billion 1 470.91 1 469.53 1.70 1.82 18.89 19.24 110.08 111.87 1 340.23 1 336.60Number of enterprises 12 872 12 872 1 606 1 606 3 522 3 522 4 478 4 478 3 266 3 266
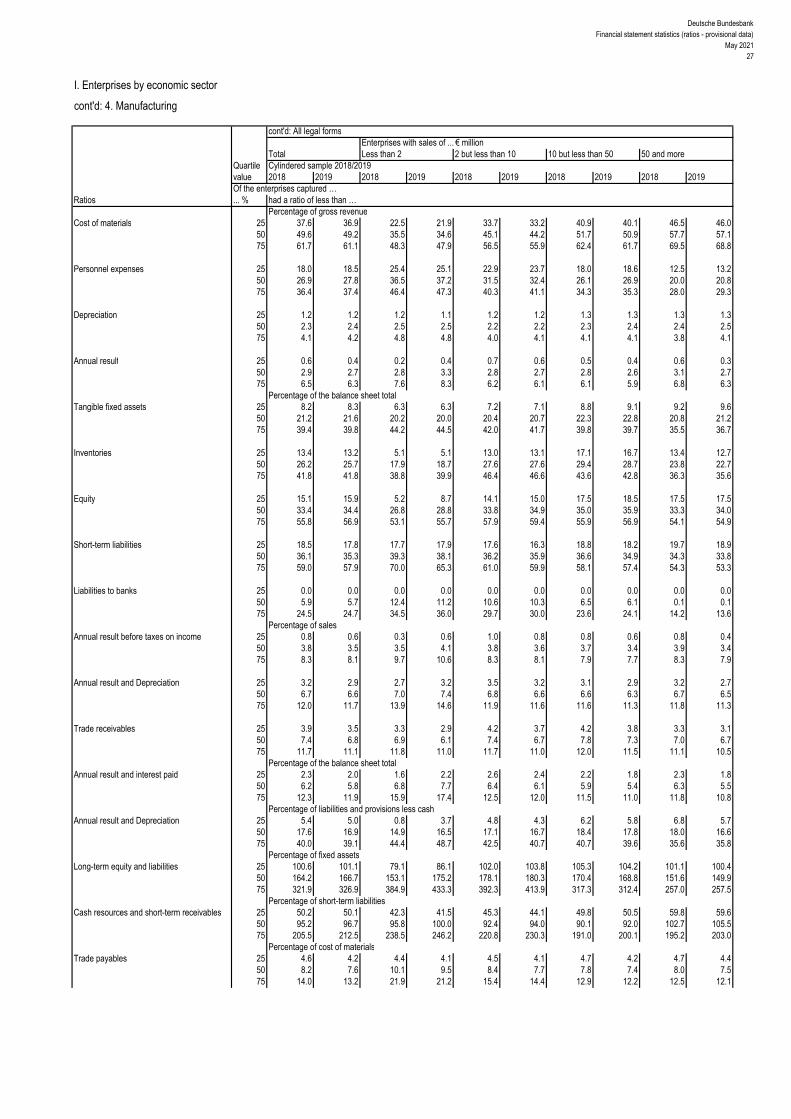
Deutsche BundesbankFinancial statement statistics (ratios - provisional data)
May 202127
I. Enterprises by economic sector
cont'd: 4. Manufacturing
cont'd: All legal formsEnterprises with sales of ... € million
Total Less than 2 2 but less than 10 10 but less than 50 50 and moreQuartile Cylindered sample 2018/2019value 2018 2019 2018 2019 2018 2019 2018 2019 2018 2019Of the enterprises captured …
Ratios ... % had a ratio of less than …Percentage of gross revenue
Cost of materials 25 37.6 36.9 22.5 21.9 33.7 33.2 40.9 40.1 46.5 46.0 50 49.6 49.2 35.5 34.6 45.1 44.2 51.7 50.9 57.7 57.1 75 61.7 61.1 48.3 47.9 56.5 55.9 62.4 61.7 69.5 68.8
Personnel expenses 25 18.0 18.5 25.4 25.1 22.9 23.7 18.0 18.6 12.5 13.2 50 26.9 27.8 36.5 37.2 31.5 32.4 26.1 26.9 20.0 20.8 75 36.4 37.4 46.4 47.3 40.3 41.1 34.3 35.3 28.0 29.3
Depreciation 25 1.2 1.2 1.2 1.1 1.2 1.2 1.3 1.3 1.3 1.3 50 2.3 2.4 2.5 2.5 2.2 2.2 2.3 2.4 2.4 2.5 75 4.1 4.2 4.8 4.8 4.0 4.1 4.1 4.1 3.8 4.1
Annual result 25 0.6 0.4 0.2 0.4 0.7 0.6 0.5 0.4 0.6 0.3 50 2.9 2.7 2.8 3.3 2.8 2.7 2.8 2.6 3.1 2.7 75 6.5 6.3 7.6 8.3 6.2 6.1 6.1 5.9 6.8 6.3
Percentage of the balance sheet totalTangible fixed assets 25 8.2 8.3 6.3 6.3 7.2 7.1 8.8 9.1 9.2 9.6
50 21.2 21.6 20.2 20.0 20.4 20.7 22.3 22.8 20.8 21.2 75 39.4 39.8 44.2 44.5 42.0 41.7 39.8 39.7 35.5 36.7
Inventories 25 13.4 13.2 5.1 5.1 13.0 13.1 17.1 16.7 13.4 12.7 50 26.2 25.7 17.9 18.7 27.6 27.6 29.4 28.7 23.8 22.7 75 41.8 41.8 38.8 39.9 46.4 46.6 43.6 42.8 36.3 35.6
Equity 25 15.1 15.9 5.2 8.7 14.1 15.0 17.5 18.5 17.5 17.5 50 33.4 34.4 26.8 28.8 33.8 34.9 35.0 35.9 33.3 34.0 75 55.8 56.9 53.1 55.7 57.9 59.4 55.9 56.9 54.1 54.9
Short-term liabilities 25 18.5 17.8 17.7 17.9 17.6 16.3 18.8 18.2 19.7 18.9 50 36.1 35.3 39.3 38.1 36.2 35.9 36.6 34.9 34.3 33.8 75 59.0 57.9 70.0 65.3 61.0 59.9 58.1 57.4 54.3 53.3
Liabilities to banks 25 0.0 0.0 0.0 0.0 0.0 0.0 0.0 0.0 0.0 0.0 50 5.9 5.7 12.4 11.2 10.6 10.3 6.5 6.1 0.1 0.1 75 24.5 24.7 34.5 36.0 29.7 30.0 23.6 24.1 14.2 13.6
Percentage of salesAnnual result before taxes on income 25 0.8 0.6 0.3 0.6 1.0 0.8 0.8 0.6 0.8 0.4
50 3.8 3.5 3.5 4.1 3.8 3.6 3.7 3.4 3.9 3.4 75 8.3 8.1 9.7 10.6 8.3 8.1 7.9 7.7 8.3 7.9
Annual result and Depreciation 25 3.2 2.9 2.7 3.2 3.5 3.2 3.1 2.9 3.2 2.7 50 6.7 6.6 7.0 7.4 6.8 6.6 6.6 6.3 6.7 6.5 75 12.0 11.7 13.9 14.6 11.9 11.6 11.6 11.3 11.8 11.3
Trade receivables 25 3.9 3.5 3.3 2.9 4.2 3.7 4.2 3.8 3.3 3.1 50 7.4 6.8 6.9 6.1 7.4 6.7 7.8 7.3 7.0 6.7 75 11.7 11.1 11.8 11.0 11.7 11.0 12.0 11.5 11.1 10.5
Percentage of the balance sheet totalAnnual result and interest paid 25 2.3 2.0 1.6 2.2 2.6 2.4 2.2 1.8 2.3 1.8
50 6.2 5.8 6.8 7.7 6.4 6.1 5.9 5.4 6.3 5.5 75 12.3 11.9 15.9 17.4 12.5 12.0 11.5 11.0 11.8 10.8
Percentage of liabilities and provisions less cashAnnual result and Depreciation 25 5.4 5.0 0.8 3.7 4.8 4.3 6.2 5.8 6.8 5.7
50 17.6 16.9 14.9 16.5 17.1 16.7 18.4 17.8 18.0 16.6 75 40.0 39.1 44.4 48.7 42.5 40.7 40.7 39.6 35.6 35.8
Percentage of fixed assetsLong-term equity and liabilities 25 100.6 101.1 79.1 86.1 102.0 103.8 105.3 104.2 101.1 100.4
50 164.2 166.7 153.1 175.2 178.1 180.3 170.4 168.8 151.6 149.9 75 321.9 326.9 384.9 433.3 392.3 413.9 317.3 312.4 257.0 257.5
Percentage of short-term liabilitiesCash resources and short-term receivables 25 50.2 50.1 42.3 41.5 45.3 44.1 49.8 50.5 59.8 59.6
50 95.2 96.7 95.8 100.0 92.4 94.0 90.1 92.0 102.7 105.5 75 205.5 212.5 238.5 246.2 220.8 230.3 191.0 200.1 195.2 203.0
Percentage of cost of materialsTrade payables 25 4.6 4.2 4.4 4.1 4.5 4.1 4.7 4.2 4.7 4.4
50 8.2 7.6 10.1 9.5 8.4 7.7 7.8 7.4 8.0 7.5 75 14.0 13.2 21.9 21.2 15.4 14.4 12.9 12.2 12.5 12.1

Deutsche BundesbankFinancial statement statistics (ratios - provisional data)May 202128
I. Enterprises by economic sector
cont'd: 4 Manufacturing
CorporationsEnterprises with sales of ... € million
Total Less than 2 2 but less than 10 10 but less than 50 50 and moreCylindered sample 2018/2019
Ratios 2018 2019 2018 2019 2018 2019 2018 2019 2018 2019Income statementIncome Percentage of gross revenueSales 99.4 99.8 97.8 97.3 98.4 98.6 98.7 99.6 99.5 99.8Change in finished goods 0.6 0.2 2.2 2.7 1.6 1.4 1.3 0.4 0.5 0.2Interest and similar income 0.5 0.6 0.2 0.2 0.1 0.1 0.1 0.2 0.5 0.7Other income 6.0 6.5 3.0 3.0 2.2 2.5 2.3 2.3 6.4 6.9
of which: Income from long-term equity investments 2.3 2.2 0.1 0.0 0.1 0.1 0.4 0.3 2.5 2.4Total income 106.5 107.1 103.1 103.2 102.3 102.6 102.5 102.4 106.9 107.6
ExpensesCost of materials 66.1 66.3 37.7 37.7 45.9 45.6 52.6 52.1 67.3 67.6Personnel expenses 16.7 17.1 38.1 37.8 31.7 32.3 26.0 26.7 15.8 16.2Depreciation 3.0 3.5 3.5 3.4 3.0 3.1 3.2 3.2 3.0 3.5
of which: Depreciation of tangible fixed assets 2.7 3.0 3.5 3.4 2.9 3.0 2.9 3.0 2.7 3.0Interest and similar expenses 1.8 1.6 0.9 0.9 0.7 0.7 0.8 0.8 1.9 1.6Operating taxes 0.0 0.0 0.1 0.1 0.1 0.1 0.1 0.1 0.0 0.0Other expenses 14.8 15.2 19.4 19.3 16.5 16.6 15.5 15.7 14.8 15.2Total expenses before taxes on income 102.5 103.7 99.8 99.3 97.9 98.5 98.2 98.6 102.9 104.1Annual result before taxes on income 4.1 3.5 3.3 3.8 4.4 4.1 4.3 3.8 4.0 3.4Taxes on income 1.0 1.0 1.1 1.1 1.3 1.3 1.2 1.1 1.0 1.0Annual result 3.1 2.5 2.1 2.7 3.1 2.9 3.1 2.7 3.1 2.4Profit and loss transfers (parent company) 1.9 2.4 0.1 0.1 0.1 0.0 0.1 0.1 2.0 2.6Profit and loss transfers (subsidiary) 1.7 1.7 0.1 0.0 0.3 0.3 1.0 0.8 1.8 1.7Profit for the year 3.2 3.2 2.2 2.8 2.8 2.6 2.2 2.0 3.3 3.3
Balance sheetAssets Percentage of the balance sheet totalIntangible fixed assets 1.5 1.5 0.7 0.7 0.8 0.8 1.0 1.0 1.5 1.5Tangible fixed assets 12.9 12.8 30.3 29.8 27.8 27.3 25.3 25.7 12.2 12.1
of which: Land and buildings 3.8 3.8 11.1 10.6 11.3 11.0 9.6 9.7 3.5 3.5Inventories 12.8 12.3 25.2 27.1 30.5 31.4 29.0 28.7 11.9 11.4
of which: Finished goods and merchandise 4.6 4.4 9.0 8.7 8.7 8.9 7.7 7.7 4.4 4.2Cash 4.9 4.4 12.7 13.1 12.1 12.1 8.7 9.0 4.7 4.1Receivables 30.1 31.3 27.7 25.8 24.8 24.0 28.9 28.4 30.2 31.5
Short-term 26.0 27.5 26.2 24.4 23.7 22.9 27.1 26.4 25.9 27.6 of which:
Trade receivables 5.0 4.5 13.8 12.7 13.5 12.5 12.5 11.9 4.5 4.1Receivables from affiliated companies 19.3 21.2 7.6 6.8 7.0 7.2 11.7 11.7 19.7 21.8
Long-term 4.2 3.8 1.5 1.4 1.1 1.1 1.9 2.0 4.3 3.9of which: Loans to affiliated companies 3.8 3.5 0.9 1.0 0.7 0.6 1.4 1.5 4.0 3.6
Securities 3.7 3.7 0.6 0.6 1.1 0.9 0.8 0.8 3.8 3.9Other long-term equity investments 33.8 33.8 2.2 2.2 2.5 3.0 5.9 6.0 35.4 35.3
of which: Goodwill 0.5 0.4 0.6 0.5 0.4 0.5 0.6 0.5 0.5 0.4
CapitalEquity 33.1 32.9 33.7 34.8 42.5 42.6 41.9 42.3 32.6 32.4Liabilities 49.0 49.1 58.1 57.4 48.2 48.5 46.0 45.6 49.1 49.2
Short-term 34.7 35.1 39.1 38.8 35.4 35.6 35.9 35.5 34.6 35.1of which:Liabilities to banks 1.6 1.6 8.8 8.1 7.4 7.8 5.8 5.8 1.3 1.4Trade payables 5.1 4.6 8.4 8.5 7.4 6.9 7.0 6.5 5.0 4.5Liabilities to affiliated companies 22.0 22.9 5.9 5.5 6.6 6.4 11.6 11.8 22.6 23.6
Long-term 14.3 14.0 19.0 18.6 12.7 12.9 10.2 10.1 14.5 14.1 of which:
Liabilities to banks 2.6 2.6 12.0 12.3 8.5 8.3 5.6 5.8 2.5 2.4Liabilities to affiliated companies 7.9 7.6 5.0 4.5 3.0 3.3 3.8 3.5 8.2 7.8
Provisions 17.4 17.4 8.1 7.6 9.1 8.8 11.9 11.9 17.7 17.7of which: Provisions for pensions 7.2 7.3 2.7 2.6 3.0 3.0 4.5 4.7 7.4 7.5
Other ratios Percentage of salesAnnual result before taxes on income 4.1 3.5 3.3 3.9 4.5 4.2 4.3 3.8 4.1 3.4Annual result and depreciation 6.1 6.0 5.8 6.3 6.2 6.0 6.3 6.0 6.1 6.0Trade receivables 5.5 5.2 9.5 8.9 9.2 8.7 9.1 8.7 5.2 4.9
Percentage of the balance sheet totalSales 90.5 85.7 145.2 141.6 147.6 143.5 137.6 136.4 87.8 83.0Annual result and interest paid 4.4 3.5 4.6 5.2 5.7 5.2 5.4 4.7 4.4 3.4
Percentage of liabilities and provisions less cashAnnual result and depreciation 8.9 8.1 15.7 17.1 20.2 19.1 17.6 16.7 8.6 7.8
Percentage of fixed assetsLong-term equity and liabilities 100.3 100.7 158.5 162.5 178.0 179.0 163.8 162.6 98.1 98.5
Percentage of short-term liabilitiesCash resources and short-term receivables 93.7 95.6 100.3 97.5 102.6 99.7 100.6 100.5 93.3 95.4Cash resources, short-term receivables and inventories 130.7 130.5 164.9 167.4 188.5 187.8 181.4 181.3 127.8 127.8
Percentage of cost of materialsTrade payables 8.6 8.2 15.0 15.4 10.8 10.3 9.5 9.1 8.5 8.1
Memo item:Balance sheet total in € billion 1 387.34 1 467.63 0.92 1.01 9.88 10.39 60.40 62.18 1 316.15 1 394.06Sales in € billion 1 255.20 1 258.03 1.33 1.42 14.58 14.90 83.14 84.84 1 156.15 1 156.87Number of enterprises 9 865 9 865 1 259 1 259 2 752 2 752 3 390 3 390 2 464 2 464
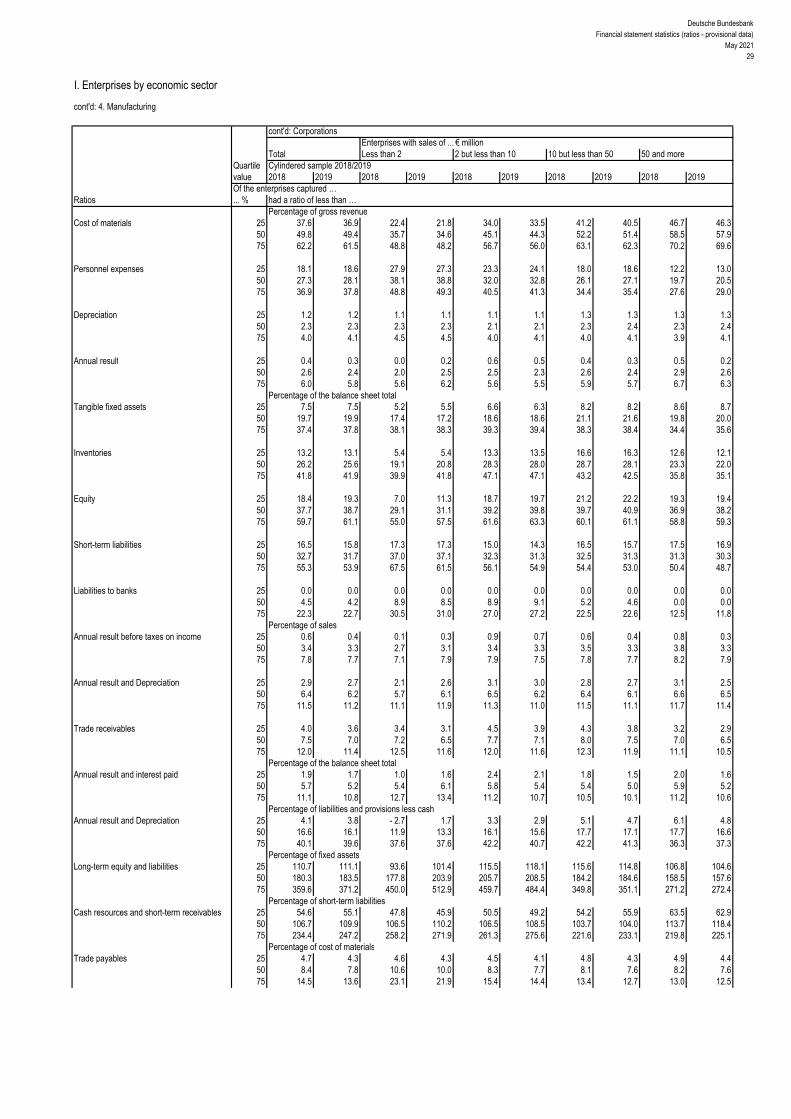
Deutsche BundesbankFinancial statement statistics (ratios - provisional data)
May 202129
I. Enterprises by economic sector
cont'd: 4. Manufacturing
cont'd: CorporationsEnterprises with sales of ... € million
Total Less than 2 2 but less than 10 10 but less than 50 50 and moreQuartile Cylindered sample 2018/2019value 2018 2019 2018 2019 2018 2019 2018 2019 2018 2019Of the enterprises captured …
Ratios ... % had a ratio of less than …Percentage of gross revenue
Cost of materials 25 37.6 36.9 22.4 21.8 34.0 33.5 41.2 40.5 46.7 46.3 50 49.8 49.4 35.7 34.6 45.1 44.3 52.2 51.4 58.5 57.9 75 62.2 61.5 48.8 48.2 56.7 56.0 63.1 62.3 70.2 69.6
Personnel expenses 25 18.1 18.6 27.9 27.3 23.3 24.1 18.0 18.6 12.2 13.0 50 27.3 28.1 38.1 38.8 32.0 32.8 26.1 27.1 19.7 20.5 75 36.9 37.8 48.8 49.3 40.5 41.3 34.4 35.4 27.6 29.0
Depreciation 25 1.2 1.2 1.1 1.1 1.1 1.1 1.3 1.3 1.3 1.3 50 2.3 2.3 2.3 2.3 2.1 2.1 2.3 2.4 2.3 2.4 75 4.0 4.1 4.5 4.5 4.0 4.1 4.0 4.1 3.9 4.1
Annual result 25 0.4 0.3 0.0 0.2 0.6 0.5 0.4 0.3 0.5 0.2 50 2.6 2.4 2.0 2.5 2.5 2.3 2.6 2.4 2.9 2.6 75 6.0 5.8 5.6 6.2 5.6 5.5 5.9 5.7 6.7 6.3
Percentage of the balance sheet totalTangible fixed assets 25 7.5 7.5 5.2 5.5 6.6 6.3 8.2 8.2 8.6 8.7
50 19.7 19.9 17.4 17.2 18.6 18.6 21.1 21.6 19.8 20.0 75 37.4 37.8 38.1 38.3 39.3 39.4 38.3 38.4 34.4 35.6
Inventories 25 13.2 13.1 5.4 5.4 13.3 13.5 16.6 16.3 12.6 12.1 50 26.2 25.6 19.1 20.8 28.3 28.0 28.7 28.1 23.3 22.0 75 41.8 41.9 39.9 41.8 47.1 47.1 43.2 42.5 35.8 35.1
Equity 25 18.4 19.3 7.0 11.3 18.7 19.7 21.2 22.2 19.3 19.4 50 37.7 38.7 29.1 31.1 39.2 39.8 39.7 40.9 36.9 38.2 75 59.7 61.1 55.0 57.5 61.6 63.3 60.1 61.1 58.8 59.3
Short-term liabilities 25 16.5 15.8 17.3 17.3 15.0 14.3 16.5 15.7 17.5 16.9 50 32.7 31.7 37.0 37.1 32.3 31.3 32.5 31.3 31.3 30.3 75 55.3 53.9 67.5 61.5 56.1 54.9 54.4 53.0 50.4 48.7
Liabilities to banks 25 0.0 0.0 0.0 0.0 0.0 0.0 0.0 0.0 0.0 0.0 50 4.5 4.2 8.9 8.5 8.9 9.1 5.2 4.6 0.0 0.0 75 22.3 22.7 30.5 31.0 27.0 27.2 22.5 22.6 12.5 11.8
Percentage of salesAnnual result before taxes on income 25 0.6 0.4 0.1 0.3 0.9 0.7 0.6 0.4 0.8 0.3
50 3.4 3.3 2.7 3.1 3.4 3.3 3.5 3.3 3.8 3.3 75 7.8 7.7 7.1 7.9 7.9 7.5 7.8 7.7 8.2 7.9
Annual result and Depreciation 25 2.9 2.7 2.1 2.6 3.1 3.0 2.8 2.7 3.1 2.5 50 6.4 6.2 5.7 6.1 6.5 6.2 6.4 6.1 6.6 6.5 75 11.5 11.2 11.1 11.9 11.3 11.0 11.5 11.1 11.7 11.4
Trade receivables 25 4.0 3.6 3.4 3.1 4.5 3.9 4.3 3.8 3.2 2.9 50 7.5 7.0 7.2 6.5 7.7 7.1 8.0 7.5 7.0 6.5 75 12.0 11.4 12.5 11.6 12.0 11.6 12.3 11.9 11.1 10.5
Percentage of the balance sheet totalAnnual result and interest paid 25 1.9 1.7 1.0 1.6 2.4 2.1 1.8 1.5 2.0 1.6
50 5.7 5.2 5.4 6.1 5.8 5.4 5.4 5.0 5.9 5.2 75 11.1 10.8 12.7 13.4 11.2 10.7 10.5 10.1 11.2 10.6
Percentage of liabilities and provisions less cashAnnual result and Depreciation 25 4.1 3.8 - 2.7 1.7 3.3 2.9 5.1 4.7 6.1 4.8
50 16.6 16.1 11.9 13.3 16.1 15.6 17.7 17.1 17.7 16.6 75 40.1 39.6 37.6 37.6 42.2 40.7 42.2 41.3 36.3 37.3
Percentage of fixed assetsLong-term equity and liabilities 25 110.7 111.1 93.6 101.4 115.5 118.1 115.6 114.8 106.8 104.6
50 180.3 183.5 177.8 203.9 205.7 208.5 184.2 184.6 158.5 157.6 75 359.6 371.2 450.0 512.9 459.7 484.4 349.8 351.1 271.2 272.4
Percentage of short-term liabilitiesCash resources and short-term receivables 25 54.6 55.1 47.8 45.9 50.5 49.2 54.2 55.9 63.5 62.9
50 106.7 109.9 106.5 110.2 106.5 108.5 103.7 104.0 113.7 118.4 75 234.4 247.2 258.2 271.9 261.3 275.6 221.6 233.1 219.8 225.1
Percentage of cost of materialsTrade payables 25 4.7 4.3 4.6 4.3 4.5 4.1 4.8 4.3 4.9 4.4
50 8.4 7.8 10.6 10.0 8.3 7.7 8.1 7.6 8.2 7.6 75 14.5 13.6 23.1 21.9 15.4 14.4 13.4 12.7 13.0 12.5

Deutsche BundesbankFinancial statement statistics (ratios - provisional data)May 202130
I. Enterprises by economic sector
cont'd: 4. Manufacturing
Non-corporationsEnterprises with sales of ... € million
Total Less than 2 2 but less than 10 10 but less than 50 50 and moreCylindered sample 2018/2019
Ratios 2018 2019 2018 2019 2018 2019 2018 2019 2018 2019Income statementIncome Percentage of gross revenueSales 99.1 99.6 99.3 99.5 98.9 99.0 99.1 99.5 99.1 99.6Change in finished goods 0.9 0.4 0.7 0.5 1.1 1.0 0.9 0.5 0.9 0.4Interest and similar income 0.2 0.2 0.1 0.1 0.1 0.1 0.1 0.1 0.2 0.2Other income 3.5 3.3 2.7 2.9 2.2 2.4 1.6 1.8 3.9 3.6
of which: Income from long-term equity investments 0.5 0.6 0.0 0.2 0.2 0.2 0.2 0.2 0.6 0.6Total income 103.7 103.5 102.8 103.0 102.3 102.5 101.7 101.9 104.1 103.8
ExpensesCost of materials 58.7 57.3 36.4 36.2 45.7 45.1 51.5 50.9 60.1 58.6Personnel expenses 20.2 21.2 31.6 31.3 30.0 30.8 25.6 26.4 19.1 20.2Depreciation 3.0 3.2 4.9 4.8 3.2 3.3 3.1 3.1 3.0 3.2
of which: Depreciation of tangible fixed assets 2.8 3.0 4.9 4.8 3.1 3.2 3.0 3.0 2.8 3.0Interest and similar expenses 1.1 1.2 1.2 1.2 0.9 0.9 0.8 0.8 1.2 1.3Operating taxes 0.1 0.1 0.1 0.1 0.1 0.1 0.1 0.1 0.1 0.1Other expenses 15.4 16.4 18.3 18.0 16.4 16.6 15.6 16.0 15.4 16.5Total expenses before taxes on income 98.4 99.4 92.5 91.7 96.3 96.8 96.6 97.3 98.8 99.8Annual result before taxes on income 5.3 4.1 10.3 11.3 6.0 5.7 5.1 4.6 5.3 4.0Taxes on income 0.8 0.7 1.4 1.5 1.0 1.0 0.9 0.8 0.7 0.7Annual result 4.5 3.4 8.9 9.8 4.9 4.7 4.2 3.7 4.6 3.3Profit and loss transfers (parent company) 0.4 0.4 - 0.2 - 0.1 0.5 1.1 0.0 0.1 0.4 0.4Profit and loss transfers (subsidiary) 0.1 0.1 0.1 0.2 0.0 0.0 0.1 0.1 0.1 0.1Profit for the year 4.8 3.7 8.6 9.5 5.4 5.7 4.1 3.7 4.9 3.6
Balance sheetAssets Percentage of the balance sheet totalIntangible fixed assets 1.1 1.2 0.5 0.5 0.6 0.7 0.9 0.9 1.2 1.2Tangible fixed assets 22.6 23.4 45.2 45.4 33.5 33.4 29.8 29.5 21.5 22.4
of which: Land and buildings 8.3 8.5 21.6 21.9 16.2 15.6 12.4 12.0 7.7 7.9Inventories 22.3 22.4 20.6 20.8 28.8 29.6 31.1 30.8 21.2 21.3
of which: Finished goods and merchandise 6.1 6.0 6.9 7.4 8.9 9.1 9.5 9.4 5.7 5.6Cash 8.2 7.0 10.2 10.2 9.6 9.4 10.3 10.3 8.0 6.6Receivables 34.9 35.0 19.6 19.2 23.3 22.6 23.8 23.7 36.5 36.7
Short-term 32.6 32.2 19.3 18.8 22.2 21.6 22.9 22.7 34.0 33.6 of which:
Trade receivables 9.5 9.3 11.1 10.7 12.9 12.0 13.5 12.5 8.9 8.8Receivables from affiliated companies 21.0 20.6 5.8 5.8 6.7 7.1 6.7 7.6 22.9 22.5
Long-term 2.3 2.8 0.3 0.4 1.1 1.0 0.9 1.0 2.5 3.1of which: Loans to affiliated companies 1.7 2.3 0.1 0.0 0.3 0.4 0.4 0.5 1.9 2.6
Securities 1.0 0.9 0.1 0.2 0.8 0.8 0.6 0.5 1.1 1.0Other long-term equity investments 9.4 9.7 3.1 3.0 2.9 3.1 3.2 3.8 10.2 10.5
of which: Goodwill 0.2 0.2 1.5 1.4 0.3 0.3 0.2 0.1 0.2 0.2
CapitalEquity 25.9 26.1 24.4 26.0 23.9 24.8 27.1 28.4 25.9 25.9Liabilities 58.2 57.5 70.8 69.2 68.8 68.3 62.2 61.3 57.5 56.8
Short-term 46.9 46.1 48.0 47.1 51.1 51.2 47.7 47.4 46.7 45.8of which:Liabilities to banks 3.6 3.7 13.8 13.7 10.2 10.1 7.4 7.6 3.0 3.1Trade payables 6.0 5.8 6.6 7.0 8.2 7.6 7.0 6.3 5.9 5.7Liabilities to affiliated companies 28.6 28.1 11.3 12.3 18.5 19.1 22.0 21.9 29.6 29.0
Long-term 11.3 11.5 22.7 22.1 17.7 17.1 14.4 13.9 10.8 11.1 of which:
Liabilities to banks 5.3 6.1 18.4 18.4 11.7 11.6 8.0 7.8 4.9 5.7Liabilities to affiliated companies 5.1 4.6 2.9 2.5 4.6 3.9 5.5 5.3 5.1 4.5
Provisions 15.7 16.2 4.7 4.7 7.3 6.9 10.6 10.3 16.4 17.1of which: Provisions for pensions 7.5 7.9 0.4 0.3 1.3 1.2 3.6 3.6 8.1 8.6
Other Ratios Percentage of salesAnnual result before taxes on income 5.3 4.1 10.4 11.4 6.0 5.8 5.1 4.6 5.4 4.0Annual result and depreciation 7.6 6.7 13.9 14.7 8.2 8.1 7.3 6.9 7.6 6.6Trade receivables 7.1 7.2 7.8 7.2 8.1 7.6 8.4 7.9 6.9 7.1
Percentage of the balance sheet totalSales 133.1 128.6 142.1 147.9 159.1 157.4 161.9 157.5 129.2 124.6Annual result and interest paid 7.6 5.9 14.5 16.3 9.3 8.9 8.1 7.2 7.5 5.7
Percentage of liabilities and provisions less cashAnnual result and depreciation 15.3 12.8 30.2 34.1 19.7 19.3 18.8 17.7 14.8 12.1
Percentage of fixed assetsLong-term equity and liabilities 123.6 120.4 96.6 98.1 110.5 111.1 128.7 129.1 123.4 119.7
Percentage of short-term liabilitiesCash resources and short-term receivables 87.7 85.6 61.4 61.8 62.7 61.0 70.0 70.1 90.4 88.1Cash resources, short-term receivables and inventories 135.3 134.4 104.2 105.9 119.0 118.8 135.3 135.2 135.7 134.7
Percentage of cost of materialsTrade payables 7.6 7.8 12.6 13.0 11.1 10.5 8.4 7.8 7.5 7.7
Memo item:Balance sheet total in € billion 162.08 164.42 0.26 0.27 2.71 2.75 16.64 17.16 142.46 144.23Sales in € billion 215.71 211.50 0.37 0.39 4.32 4.34 26.94 27.03 184.08 179.74Number of enterprises 3 007 3 007 347 347 770 770 1 088 1 088 802 802

Deutsche BundesbankFinancial statement statistics (ratios - provisional data)
May 202131
I. Enterprises by economic sector
cont'd: 4 Manufacturing
cont'd: Non-corporationsEnterprises with sales of ... € million
Total Less than 2 2 but less than 10 10 but less than 50 50 and moreQuartile Cylindered sample 2018/2019value 2018 2019 2018 2019 2018 2019 2018 2019 2018 2019Of the enterprises captured …
Ratios ... % had a ratio of less than …Percentage of gross revenue
Cost of materials 25 37.7 36.9 23.1 22.9 32.4 32.2 40.1 39.3 45.2 44.9 50 49.0 48.6 35.2 34.6 45.1 43.9 50.3 49.6 55.7 54.9 75 60.3 59.6 47.7 46.5 55.8 55.6 60.9 60.1 66.6 65.8
Personnel expenses 25 17.5 18.0 19.3 19.0 21.3 22.2 17.8 18.4 13.6 14.7 50 25.8 26.5 29.7 30.1 30.0 30.9 25.9 26.5 20.6 21.5 75 35.0 35.8 39.6 40.3 39.0 40.2 34.2 35.0 28.7 30.3
Depreciation 25 1.4 1.4 1.6 1.6 1.3 1.4 1.3 1.4 1.4 1.4 50 2.5 2.5 3.3 3.2 2.4 2.4 2.4 2.5 2.5 2.6 75 4.2 4.3 6.2 6.2 4.1 4.3 4.2 4.2 3.8 4.0
Annual result 25 1.3 1.0 3.0 4.4 1.6 1.1 1.1 0.8 0.9 0.6 50 4.0 3.8 8.5 8.8 4.3 4.0 3.5 3.3 3.6 2.9 75 8.2 7.9 16.0 16.5 8.2 8.1 6.6 6.8 7.1 6.3
Percentage of the balance sheet totalTangible fixed assets 25 12.0 12.1 12.7 15.1 11.7 11.2 11.9 12.6 12.2 12.0
50 26.7 26.7 34.6 34.9 28.4 29.0 26.3 26.6 23.4 24.5 75 44.6 45.2 62.3 62.4 48.5 49.1 43.5 43.8 37.7 39.2
Inventories 25 14.2 13.9 3.8 3.8 11.7 11.7 19.1 18.8 16.4 15.5 50 26.4 26.5 13.9 14.0 25.2 26.4 31.5 30.5 25.3 24.8 75 41.6 41.5 31.6 30.7 43.8 44.6 44.1 43.9 37.2 36.1
Equity 25 7.9 8.0 1.2 1.1 4.9 5.4 9.5 9.7 13.0 12.5 50 22.2 22.9 15.6 16.3 16.2 16.9 23.9 24.9 26.3 26.4 75 39.1 40.1 43.0 46.0 36.0 36.3 39.3 40.2 40.2 41.2
Short-term liabilities 25 28.6 27.9 18.9 21.9 31.2 31.3 30.4 28.5 27.4 27.7 50 47.3 48.0 46.3 45.0 51.7 52.1 48.0 48.5 43.4 43.8 75 68.2 67.6 77.4 75.4 73.5 73.6 67.1 66.1 62.3 62.1
Liabilities to banks 25 0.0 0.0 1.4 2.8 1.1 0.2 0.0 0.0 0.0 0.0 50 11.0 10.7 27.2 24.2 17.3 16.5 11.8 10.7 3.1 3.3 75 31.6 31.5 57.1 53.1 39.1 40.1 28.1 28.7 19.5 20.6
Percentage of salesAnnual result before taxes on income 25 1.6 1.3 3.3 4.9 2.1 1.6 1.4 1.1 1.1 0.7
50 4.9 4.5 9.8 10.5 5.0 4.7 4.3 4.0 4.3 3.5 75 9.7 9.2 17.9 18.6 9.8 9.6 8.1 7.9 8.3 7.6
Annual result and Depreciation 25 4.2 3.9 7.1 8.5 4.7 4.3 4.0 3.6 3.6 2.9 50 7.8 7.5 13.6 14.1 8.3 8.1 7.1 6.8 7.0 6.5 75 13.5 13.3 22.2 23.0 13.6 13.5 12.0 11.7 12.1 11.1
Trade receivables 25 3.6 3.2 2.8 2.3 3.4 3.2 4.1 3.8 3.7 3.4 50 6.9 6.4 5.6 4.6 6.0 5.8 7.5 6.8 7.3 7.1 75 10.7 10.1 9.7 8.0 10.2 9.1 10.8 10.7 10.9 10.6
Percentage of the balance sheet totalAnnual result and interest paid 25 3.7 3.4 7.2 8.2 4.5 3.8 3.4 2.9 3.1 2.2
50 8.7 8.1 15.7 17.4 9.5 9.1 8.0 7.4 7.5 6.3 75 15.8 15.0 33.5 34.9 17.8 17.0 13.7 13.0 13.1 11.3
Percentage of liabilities and provisions less cashAnnual result and Depreciation 25 9.0 8.8 10.6 13.0 9.0 8.8 9.0 8.8 8.5 7.9
50 20.2 19.4 25.9 32.0 19.9 19.8 20.4 18.9 18.6 16.2 75 39.6 38.2 69.5 85.0 42.8 40.5 36.3 34.6 33.5 31.9
Percentage of fixed assetsLong-term equity and liabilities 25 74.5 73.2 51.7 49.8 62.9 65.0 78.7 77.3 87.1 84.2
50 123.4 123.3 98.2 101.9 112.6 113.1 127.8 129.7 135.2 130.4 75 213.3 212.3 178.8 200.2 201.7 215.4 221.2 218.0 219.1 209.2
Percentage of short-term liabilitiesCash resources and short-term receivables 25 41.0 39.6 28.2 27.4 35.8 32.3 40.7 40.0 51.8 51.9
50 70.5 70.0 70.4 69.7 63.5 61.8 66.7 66.7 82.9 82.1 75 120.4 123.4 163.9 162.8 112.1 112.4 112.3 116.9 133.5 129.6
Percentage of cost of materialsTrade payables 25 4.4 4.1 3.6 3.6 4.7 4.2 4.5 4.0 4.5 4.4
50 7.7 7.2 8.6 7.5 8.9 7.8 7.0 6.8 7.7 7.2 75 12.5 12.0 18.2 19.4 14.9 14.2 11.2 10.5 11.2 10.9

Deutsche BundesbankFinancial statement statistics (ratios - provisional data)May 202132
I. Enterprises by economic sector
4.a) Manufacture of food products
All legal formsEnterprises with sales of ... € million
Total Less than 2 2 but less than 10 10 but less than 50 50 and moreCylindered sample 2018/2019
Ratios 2018 2019 2018 2019 2018 2019 2018 2019 2018 2019Income statementIncome Percentage of gross revenueSales 99.6 100.0 99.8 99.6 99.6 99.7 99.7 99.9 99.6 100.0Change in finished goods 0.4 0.0 0.2 0.4 0.4 0.3 0.3 0.1 0.4 0.0Interest and similar income 0.1 0.1 0.1 0.1 0.1 0.1 0.1 0.1 0.1 0.1Other income 1.7 1.7 2.0 1.7 2.2 2.2 1.6 1.4 1.7 1.7
of which: Income from long-term equity investments 0.3 0.4 0.0 0.0 0.0 0.0 0.1 0.1 0.3 0.4Total income 101.8 101.9 102.1 101.8 102.3 102.3 101.7 101.4 101.8 101.9
ExpensesCost of materials 72.1 71.8 46.4 43.4 45.3 45.0 57.9 57.4 73.6 73.4Personnel expenses 10.6 10.8 27.6 27.8 28.8 29.0 20.1 20.3 9.6 9.8Depreciation 2.1 2.2 3.8 3.5 3.7 3.9 3.2 3.2 2.0 2.1
of which: Depreciation of tangible fixed assets 2.0 2.1 3.8 3.4 3.6 3.7 3.1 3.1 1.9 2.0Interest and similar expenses 0.5 0.5 1.1 1.0 0.9 0.8 0.6 0.6 0.5 0.5Operating taxes 0.0 0.0 0.2 0.2 0.1 0.1 0.1 0.1 0.0 0.0Other expenses 14.0 14.0 22.0 22.8 20.5 20.8 17.0 17.4 13.7 13.6Total expenses before taxes on income 99.4 99.3 101.1 98.8 99.3 99.4 98.8 98.9 99.4 99.4Annual result before taxes on income 2.4 2.5 1.0 3.0 3.0 2.8 2.8 2.6 2.4 2.5Taxes on income 0.5 0.4 0.7 0.1 0.8 0.7 0.8 0.7 0.5 0.4Annual result 1.9 2.1 0.3 3.0 2.2 2.2 2.1 1.8 1.9 2.1Profit and loss transfers (parent company) 0.3 0.3 0.0 0.0 0.1 0.0 0.1 0.3 0.3 0.3Profit and loss transfers (subsidiary) 0.4 0.6 - 0.4 - 0.6 0.2 0.4 0.2 0.2 0.5 0.7Profit for the year 1.7 1.8 0.7 3.6 2.1 1.9 2.0 1.9 1.7 1.8
Balance sheetAssets Percentage of the balance sheet totalIntangible fixed assets 0.9 0.9 0.4 0.5 2.8 2.6 0.7 0.5 0.9 1.0Tangible fixed assets 30.1 30.7 43.4 38.6 45.1 45.6 46.1 45.5 28.5 29.0
of which: Land and buildings 10.8 10.9 14.5 12.5 18.9 19.3 17.2 17.0 10.1 10.2Inventories 16.5 16.0 13.2 17.0 13.3 14.1 16.3 15.8 16.6 16.1
of which: Finished goods and merchandise 8.6 8.3 9.7 12.1 7.0 7.8 7.3 7.2 8.7 8.4Cash 5.4 4.8 11.9 12.5 6.5 6.6 6.9 7.3 5.2 4.5Receivables 32.1 32.9 28.7 28.2 27.1 26.2 26.2 26.6 32.7 33.6
Short-term 30.1 30.8 22.2 23.7 26.6 25.4 24.8 24.9 30.7 31.5 of which:
Trade receivables 13.5 13.1 11.9 14.4 11.8 11.7 12.8 12.5 13.6 13.2Receivables from affiliated companies 13.1 14.4 5.7 4.8 9.2 8.1 8.2 8.9 13.6 15.0
Long-term 1.9 2.0 6.6 4.5 0.5 0.8 1.3 1.7 2.0 2.1of which: Loans to affiliated companies 1.5 1.5 0.0 0.0 0.2 0.5 0.9 1.4 1.6 1.6
Securities 1.3 1.1 0.3 0.1 0.5 0.4 0.2 0.4 1.4 1.2Other long-term equity investments 13.5 13.4 1.6 2.6 4.4 4.0 3.2 3.5 14.6 14.4
of which: Goodwill 0.5 0.4 1.3 1.0 1.5 1.3 0.6 0.6 0.5 0.4
CapitalEquity 35.9 36.1 14.3 20.0 32.6 32.0 36.7 37.8 35.9 36.0Liabilities 50.5 50.5 82.0 75.9 61.8 62.1 55.0 53.8 49.9 50.0
Short-term 36.4 36.7 47.4 43.6 36.8 35.9 36.9 36.8 36.3 36.6of which:Liabilities to banks 4.4 4.6 10.3 8.0 10.0 9.3 8.0 8.0 4.0 4.2Trade payables 10.9 10.6 11.0 11.6 10.7 10.2 10.5 9.9 11.0 10.7Liabilities to affiliated companies 18.4 18.4 13.1 12.0 9.8 9.4 14.4 15.0 18.8 18.9
Long-term 14.1 13.8 34.7 32.3 25.0 26.2 18.1 17.0 13.6 13.3 of which:
Liabilities to banks 6.3 7.3 19.5 20.1 15.8 16.1 11.2 11.1 5.8 6.8Liabilities to affiliated companies 6.7 5.7 13.2 10.4 6.4 6.2 5.9 5.0 6.8 5.7
Provisions 13.6 13.4 3.6 4.0 5.3 5.7 8.2 8.3 14.2 14.0of which: Provisions for pensions 5.1 5.4 1.1 1.1 1.4 1.4 2.9 3.0 5.4 5.7
Other ratios Percentage of salesAnnual result before taxes on income 2.4 2.5 1.0 3.1 3.0 2.9 2.9 2.6 2.4 2.5Annual result and depreciation 4.0 4.3 4.2 6.5 6.0 6.1 5.3 5.0 3.9 4.2Trade receivables 6.6 6.4 7.3 8.2 6.8 6.6 6.7 6.5 6.6 6.4
Percentage of the balance sheet totalSales 205.9 205.9 163.2 176.1 173.8 178.4 191.3 190.8 207.6 207.7Annual result and interest paid 5.0 5.3 2.2 7.1 5.5 5.4 5.2 4.5 4.9 5.4
Percentage of liabilities and provisions less cashAnnual result and depreciation 14.2 14.8 9.2 17.0 17.0 17.7 17.9 17.4 13.8 14.6
Percentage of fixed assetsLong-term equity and liabilities 118.4 117.3 96.1 115.4 111.0 111.6 112.1 112.1 119.2 118.0
Percentage of short-term liabilitiesCash resources and short-term receivables 100.8 99.9 71.8 82.9 90.0 89.4 86.1 87.5 102.3 101.2Cash resources, short-term receivables and inventories 146.2 143.6 99.8 122.0 126.2 128.7 130.3 130.3 148.0 145.1
Percentage of cost of materialsTrade payables 7.3 7.2 14.6 15.1 13.5 12.6 9.4 9.0 7.1 7.0
Memo item:Balance sheet total in € billion 49.13 50.54 0.03 0.04 0.48 0.49 4.22 4.42 44.40 45.58Sales in € billion 101.14 104.07 0.05 0.06 0.83 0.88 8.06 8.44 92.20 94.68Number of enterprises 901 901 59 59 150 150 326 326 366 366
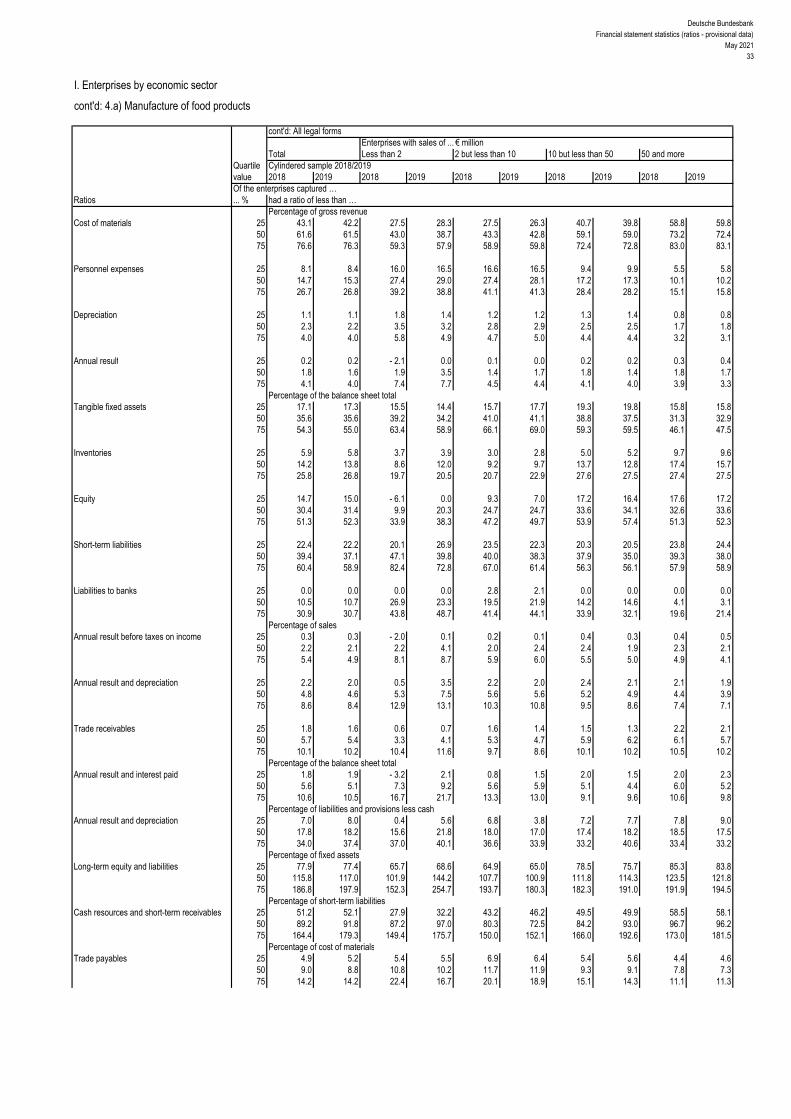
Deutsche BundesbankFinancial statement statistics (ratios - provisional data)
May 202133
I. Enterprises by economic sector
cont'd: 4.a) Manufacture of food products
cont'd: All legal formsEnterprises with sales of ... € million
Total Less than 2 2 but less than 10 10 but less than 50 50 and moreQuartile Cylindered sample 2018/2019value 2018 2019 2018 2019 2018 2019 2018 2019 2018 2019Of the enterprises captured …
Ratios ... % had a ratio of less than …Percentage of gross revenue
Cost of materials 25 43.1 42.2 27.5 28.3 27.5 26.3 40.7 39.8 58.8 59.8 50 61.6 61.5 43.0 38.7 43.3 42.8 59.1 59.0 73.2 72.4 75 76.6 76.3 59.3 57.9 58.9 59.8 72.4 72.8 83.0 83.1
Personnel expenses 25 8.1 8.4 16.0 16.5 16.6 16.5 9.4 9.9 5.5 5.8 50 14.7 15.3 27.4 29.0 27.4 28.1 17.2 17.3 10.1 10.2 75 26.7 26.8 39.2 38.8 41.1 41.3 28.4 28.2 15.1 15.8
Depreciation 25 1.1 1.1 1.8 1.4 1.2 1.2 1.3 1.4 0.8 0.8 50 2.3 2.2 3.5 3.2 2.8 2.9 2.5 2.5 1.7 1.8 75 4.0 4.0 5.8 4.9 4.7 5.0 4.4 4.4 3.2 3.1
Annual result 25 0.2 0.2 - 2.1 0.0 0.1 0.0 0.2 0.2 0.3 0.4 50 1.8 1.6 1.9 3.5 1.4 1.7 1.8 1.4 1.8 1.7 75 4.1 4.0 7.4 7.7 4.5 4.4 4.1 4.0 3.9 3.3
Percentage of the balance sheet totalTangible fixed assets 25 17.1 17.3 15.5 14.4 15.7 17.7 19.3 19.8 15.8 15.8
50 35.6 35.6 39.2 34.2 41.0 41.1 38.8 37.5 31.3 32.9 75 54.3 55.0 63.4 58.9 66.1 69.0 59.3 59.5 46.1 47.5
Inventories 25 5.9 5.8 3.7 3.9 3.0 2.8 5.0 5.2 9.7 9.6 50 14.2 13.8 8.6 12.0 9.2 9.7 13.7 12.8 17.4 15.7 75 25.8 26.8 19.7 20.5 20.7 22.9 27.6 27.5 27.4 27.5
Equity 25 14.7 15.0 - 6.1 0.0 9.3 7.0 17.2 16.4 17.6 17.2 50 30.4 31.4 9.9 20.3 24.7 24.7 33.6 34.1 32.6 33.6 75 51.3 52.3 33.9 38.3 47.2 49.7 53.9 57.4 51.3 52.3
Short-term liabilities 25 22.4 22.2 20.1 26.9 23.5 22.3 20.3 20.5 23.8 24.4 50 39.4 37.1 47.1 39.8 40.0 38.3 37.9 35.0 39.3 38.0 75 60.4 58.9 82.4 72.8 67.0 61.4 56.3 56.1 57.9 58.9
Liabilities to banks 25 0.0 0.0 0.0 0.0 2.8 2.1 0.0 0.0 0.0 0.0 50 10.5 10.7 26.9 23.3 19.5 21.9 14.2 14.6 4.1 3.1 75 30.9 30.7 43.8 48.7 41.4 44.1 33.9 32.1 19.6 21.4
Percentage of salesAnnual result before taxes on income 25 0.3 0.3 - 2.0 0.1 0.2 0.1 0.4 0.3 0.4 0.5
50 2.2 2.1 2.2 4.1 2.0 2.4 2.4 1.9 2.3 2.1 75 5.4 4.9 8.1 8.7 5.9 6.0 5.5 5.0 4.9 4.1
Annual result and depreciation 25 2.2 2.0 0.5 3.5 2.2 2.0 2.4 2.1 2.1 1.9 50 4.8 4.6 5.3 7.5 5.6 5.6 5.2 4.9 4.4 3.9 75 8.6 8.4 12.9 13.1 10.3 10.8 9.5 8.6 7.4 7.1
Trade receivables 25 1.8 1.6 0.6 0.7 1.6 1.4 1.5 1.3 2.2 2.1 50 5.7 5.4 3.3 4.1 5.3 4.7 5.9 6.2 6.1 5.7 75 10.1 10.2 10.4 11.6 9.7 8.6 10.1 10.2 10.5 10.2
Percentage of the balance sheet totalAnnual result and interest paid 25 1.8 1.9 - 3.2 2.1 0.8 1.5 2.0 1.5 2.0 2.3
50 5.6 5.1 7.3 9.2 5.6 5.9 5.1 4.4 6.0 5.2 75 10.6 10.5 16.7 21.7 13.3 13.0 9.1 9.6 10.6 9.8
Percentage of liabilities and provisions less cashAnnual result and depreciation 25 7.0 8.0 0.4 5.6 6.8 3.8 7.2 7.7 7.8 9.0
50 17.8 18.2 15.6 21.8 18.0 17.0 17.4 18.2 18.5 17.5 75 34.0 37.4 37.0 40.1 36.6 33.9 33.2 40.6 33.4 33.2
Percentage of fixed assetsLong-term equity and liabilities 25 77.9 77.4 65.7 68.6 64.9 65.0 78.5 75.7 85.3 83.8
50 115.8 117.0 101.9 144.2 107.7 100.9 111.8 114.3 123.5 121.8 75 186.8 197.9 152.3 254.7 193.7 180.3 182.3 191.0 191.9 194.5
Percentage of short-term liabilitiesCash resources and short-term receivables 25 51.2 52.1 27.9 32.2 43.2 46.2 49.5 49.9 58.5 58.1
50 89.2 91.8 87.2 97.0 80.3 72.5 84.2 93.0 96.7 96.2 75 164.4 179.3 149.4 175.7 150.0 152.1 166.0 192.6 173.0 181.5
Percentage of cost of materialsTrade payables 25 4.9 5.2 5.4 5.5 6.9 6.4 5.4 5.6 4.4 4.6
50 9.0 8.8 10.8 10.2 11.7 11.9 9.3 9.1 7.8 7.3 75 14.2 14.2 22.4 16.7 20.1 18.9 15.1 14.3 11.1 11.3

Deutsche BundesbankFinancial statement statistics (ratios - provisional data)May 202134
I. Enterprises by economic sector
4.b) Manufacture of beverages
All legal formsEnterprises with sales of ... € million
Total Less than 2 2 but less than 10 10 but less than 50 50 and moreCylindered sample 2018/2019
Ratios 2018 2019 2018 2019 2018 2019 2018 2019 2018 2019Income statementIncome Percentage of gross revenueSales 99.7 100.2 99.4 100.6 100.1 100.3 99.8 99.9 99.7 100.3Change in finished goods 0.3 - 0.2 0.6 - 0.6 - 0.1 - 0.3 0.2 0.1 0.3 - 0.3Interest and similar income 0.2 0.5 0.3 0.2 0.3 0.2 0.2 0.2 0.2 0.5Other income 2.3 2.2 4.5 1.8 2.7 3.0 2.0 2.1 2.3 2.2
of which: Income from long-term equity investments 0.4 0.4 0.0 0.0 0.0 0.0 0.1 0.1 0.4 0.4Total income 102.5 102.6 104.7 102.0 102.9 103.2 102.3 102.4 102.5 102.7
ExpensesCost of materials 48.9 48.3 41.5 41.9 42.3 40.9 45.8 45.9 49.5 48.7Personnel expenses 15.5 15.6 30.7 31.6 23.4 24.7 19.8 20.5 14.8 14.7Depreciation 5.3 5.3 7.1 5.6 7.3 7.8 6.8 6.9 5.0 5.0
of which: Depreciation of tangible fixed assets 5.2 5.1 6.8 5.6 6.9 7.7 6.7 6.8 5.0 4.9Interest and similar expenses 0.8 0.8 1.3 1.5 1.2 1.1 0.9 1.1 0.8 0.8Operating taxes 0.2 0.2 0.7 0.6 1.1 1.1 0.5 0.5 0.1 0.1Other expenses 25.2 25.3 26.9 27.2 22.7 23.0 24.2 23.4 25.3 25.7Total expenses before taxes on income 95.9 95.4 108.2 108.5 98.0 98.5 98.0 98.3 95.6 95.0Annual result before taxes on income 6.6 7.2 - 3.5 - 6.4 4.9 4.7 4.2 4.1 6.9 7.7Taxes on income 1.2 1.3 0.3 - 0.1 1.0 1.0 1.0 1.1 1.3 1.4Annual result 5.3 5.9 - 3.7 - 6.3 3.9 3.7 3.2 3.0 5.7 6.3Profit and loss transfers (parent company) 0.2 0.3 2.2 4.4 0.0 0.0 0.1 0.2 0.2 0.3Profit and loss transfers (subsidiary) 1.0 0.9 - 1.6 0.0 0.0 0.0 0.6 0.5 1.1 1.0Profit for the year 4.5 5.3 0.1 - 1.9 3.9 3.7 2.7 2.7 4.7 5.7
Balance sheetAssets Percentage of the balance sheet totalIntangible fixed assets 1.3 1.2 0.7 0.6 0.6 0.6 2.1 2.1 1.2 1.1Tangible fixed assets 31.6 32.3 46.8 46.5 45.7 48.2 41.7 42.2 29.9 30.6
of which: Land and buildings 15.3 15.6 20.4 18.6 20.1 21.0 19.7 19.0 14.6 15.1Inventories 10.6 10.0 22.6 20.2 21.6 21.8 15.7 15.6 9.6 8.9
of which: Finished goods and merchandise 5.1 4.5 12.7 11.9 13.1 12.7 6.4 6.4 4.8 4.1Cash 5.9 5.4 8.6 9.7 6.8 6.3 7.5 7.6 5.7 5.0Receivables 37.1 35.0 20.4 22.3 22.0 19.9 29.0 28.7 38.6 36.2
Short-term 33.3 32.9 16.1 20.3 16.3 18.5 26.6 26.3 34.6 34.1 of which:
Trade receivables 11.0 10.9 7.8 8.2 7.7 7.8 12.3 12.1 10.9 10.8Receivables from affiliated companies 18.3 17.4 4.9 5.4 6.5 8.2 11.6 11.6 19.5 18.4
Long-term 3.8 2.1 4.3 2.0 5.7 1.4 2.4 2.3 4.0 2.1of which: Loans to affiliated companies 0.5 0.3 0.9 0.2 4.3 0.0 0.8 0.8 0.3 0.3
Securities 2.7 5.0 0.0 0.0 1.8 1.4 0.3 0.2 3.1 5.7Other long-term equity investments 10.5 10.8 0.4 0.4 1.3 1.6 3.5 3.3 11.7 12.1
of which: Goodwill 0.1 0.0 0.1 0.0 0.0 0.0 0.2 0.1 0.1 0.0
CapitalEquity 41.0 41.1 17.6 25.7 35.2 33.2 39.9 39.4 41.4 41.5Liabilities 42.0 42.4 73.0 66.5 55.1 57.0 46.4 47.3 41.0 41.3
Short-term 24.7 25.7 38.5 30.2 26.2 27.1 30.3 31.9 23.9 24.8of which:Liabilities to banks 2.4 2.8 8.9 7.2 7.4 7.5 4.5 4.8 2.0 2.4Trade payables 8.5 8.7 8.8 8.8 9.4 9.7 10.2 9.9 8.3 8.5Liabilities to affiliated companies 9.1 9.2 7.9 6.4 4.2 3.8 9.4 10.3 9.2 9.2
Long-term 17.2 16.7 34.4 36.3 28.9 30.0 16.2 15.5 17.1 16.5 of which:
Liabilities to banks 7.2 7.3 22.7 24.4 19.5 20.0 11.7 12.1 6.3 6.4Liabilities to affiliated companies 6.8 6.5 11.1 11.6 8.2 8.8 3.0 2.4 7.3 7.0
Provisions 17.0 16.5 9.4 7.8 9.6 9.7 13.6 13.3 17.6 17.1of which: Provisions for pensions 3.1 3.1 4.1 3.8 1.0 0.7 4.7 4.5 2.9 3.0
Other ratios Percentage of salesAnnual result before taxes on income 6.6 7.2 - 3.5 - 6.4 4.9 4.7 4.2 4.1 7.0 7.7Annual result and depreciation 10.7 11.1 3.3 - 0.7 11.2 11.4 10.1 9.9 10.8 11.3Trade receivables 10.1 10.3 6.9 7.5 8.0 7.7 11.3 11.3 9.9 10.2
Percentage of the balance sheet totalSales 109.0 105.6 112.5 110.4 95.3 101.2 108.3 106.7 109.4 105.6Annual result and interest paid 6.8 7.0 - 2.7 - 5.3 4.8 4.8 4.4 4.3 7.1 7.5
Percentage of liabilities and provisions less cashAnnual result and depreciation 21.9 21.9 5.1 - 1.2 18.4 19.1 20.8 19.9 22.2 22.3
Percentage of fixed assetsLong-term equity and liabilities 123.5 129.7 107.6 133.0 118.3 120.1 122.4 118.8 123.8 131.5
Percentage of short-term liabilitiesCash resources and short-term receivables 159.5 149.3 64.2 99.4 88.3 91.6 113.4 106.9 169.5 158.0Cash resources, short-term receivables and inventories 202.4 188.1 122.8 166.5 170.8 171.9 165.4 156.0 209.9 194.1
Percentage of cost of materialsTrade payables 15.9 17.1 18.7 19.2 23.2 23.5 20.5 20.1 15.2 16.5
Memo item:Balance sheet total in € billion 10.70 11.17 0.02 0.02 0.19 0.19 1.26 1.31 9.22 9.65Sales in € billion 11.66 11.80 0.03 0.03 0.18 0.19 1.37 1.40 10.08 10.18Number of enterprises 155 155 21 21 30 30 59 59 45 45

Deutsche BundesbankFinancial statement statistics (ratios - provisional data)
May 202135
I. Enterprises by economic sector
cont'd: 4.b) Manufacture of beverages
cont'd: All legal formsEnterprises with sales of ... € million
Total Less than 2 2 but less than 10 10 but less than 50 50 and moreQuartile Cylindered sample 2018/2019value 2018 2019 2018 2019 2018 2019 2018 2019 2018 2019Of the enterprises captured …
Ratios ... % had a ratio of less than …Percentage of gross revenue
Cost of materials 25 30.5 30.1 33.3 33.3 28.5 27.5 30.9 29.2 31.3 33.6 50 43.3 42.6 36.6 39.2 33.9 31.5 41.5 41.5 59.0 59.0 75 68.4 63.6 47.6 46.3 51.0 48.0 56.2 53.4 75.1 75.2
Personnel expenses 25 10.1 10.9 19.5 20.4 19.1 18.2 12.3 13.9 7.3 8.3 50 19.4 20.6 27.9 30.4 24.9 25.9 21.1 21.9 11.4 12.1 75 27.7 28.8 37.2 37.8 31.7 33.4 27.6 28.8 17.3 17.6
Depreciation 25 2.2 2.1 2.0 1.5 3.5 2.9 2.5 2.5 1.6 1.7 50 5.3 5.6 3.6 2.9 6.2 6.0 7.5 6.9 3.7 3.2 75 9.6 9.5 7.6 7.8 9.6 11.9 10.0 10.4 8.4 8.4
Annual result 25 0.5 0.6 - 1.7 - 0.4 0.7 0.3 0.4 0.7 2.3 1.0 50 2.7 2.9 0.9 1.2 2.1 2.0 2.9 2.9 3.6 4.5 75 6.2 6.7 2.5 5.4 4.7 4.8 6.4 7.4 6.4 6.8
Percentage of the balance sheet totalTangible fixed assets 25 15.0 15.1 4.9 6.3 25.6 33.8 18.3 18.0 10.9 13.6
50 36.6 39.1 24.3 23.6 48.2 47.5 41.2 40.2 28.2 26.7 75 55.6 54.7 54.8 50.0 62.1 62.1 61.0 58.1 47.4 48.0
Inventories 25 6.0 5.7 12.8 6.0 6.0 6.0 5.8 5.7 5.5 5.2 50 13.4 11.3 20.2 19.8 13.4 12.7 12.3 10.2 11.8 10.8 75 30.1 30.2 38.5 52.6 30.8 34.9 23.7 25.7 28.0 26.9
Equity 25 21.0 19.4 2.5 8.2 13.3 11.1 20.6 19.4 25.3 24.7 50 32.8 33.1 22.1 20.9 31.3 31.9 34.9 33.5 38.0 40.0 75 50.1 50.8 31.4 39.5 49.1 51.3 55.7 56.0 55.1 50.6
Short-term liabilities 25 15.5 14.7 15.8 14.6 11.3 12.8 14.8 13.7 19.2 16.0 50 27.5 27.5 29.0 22.8 22.9 27.4 26.8 27.3 28.5 28.3 75 48.0 48.9 56.5 51.5 51.7 45.7 44.6 50.7 46.5 43.4
Liabilities to banks 25 0.0 0.0 0.0 0.0 1.3 1.7 0.0 0.0 0.0 0.0 50 9.3 8.7 16.5 16.4 23.2 24.3 9.8 9.2 5.2 5.4 75 31.9 33.6 33.2 38.2 46.0 43.7 30.5 32.2 17.4 19.4
Percentage of salesAnnual result before taxes on income 25 0.7 0.6 - 1.4 - 0.3 0.9 0.3 0.3 0.7 2.1 1.2
50 3.7 3.4 0.9 1.3 2.6 2.5 4.4 3.6 5.2 4.6 75 7.4 7.6 2.5 5.6 7.1 5.6 7.5 8.0 7.8 7.9
Annual result and Depreciation 25 4.0 4.1 0.0 1.1 6.8 6.4 4.5 5.7 4.5 4.3 50 10.8 9.8 3.8 3.5 11.3 10.2 11.8 12.0 11.0 9.6 75 16.3 16.8 13.5 13.9 17.2 18.2 16.9 17.8 15.2 16.6
Trade receivables 25 5.3 5.2 3.6 3.9 5.6 5.2 6.6 6.2 5.2 4.4 50 8.1 8.0 6.9 5.8 7.6 7.4 9.0 9.4 8.6 7.8 75 11.9 12.4 7.9 9.2 9.4 8.8 13.5 13.3 12.8 13.7
Percentage of the balance sheet totalAnnual result and interest paid 25 1.9 1.8 0.7 1.9 1.4 0.6 1.1 1.9 2.8 2.2
50 4.7 4.5 3.1 4.2 3.7 3.9 5.0 4.6 5.5 5.1 75 8.5 8.9 5.9 5.4 7.0 9.2 10.0 10.2 8.5 8.8
Percentage of liabilities and provisions less cashAnnual result and depreciation 25 7.0 7.2 - 10.1 3.5 10.7 9.5 6.1 5.8 11.3 7.4
50 18.8 17.1 5.9 9.9 16.6 17.5 20.4 17.7 19.4 17.5 75 35.2 37.3 15.3 15.7 28.4 35.3 36.9 38.3 35.2 39.5
Percentage of fixed assetsLong-term equity and liabilities 25 86.0 88.4 70.5 102.4 96.7 98.5 83.2 84.9 90.7 85.1
50 122.6 122.3 137.2 204.0 122.9 118.6 128.0 115.8 118.2 118.7 75 205.9 212.0 624.6 618.8 155.6 160.5 209.8 186.0 227.5 245.8
Percentage of short-term liabilitiesCash resources and short-term receivables 25 52.6 58.8 42.3 40.0 46.9 59.1 61.5 56.7 70.3 63.4
50 107.1 104.0 92.6 160.3 68.1 113.7 95.4 88.3 111.1 111.7 75 212.0 195.8 188.2 227.8 170.7 159.6 274.1 248.7 213.4 194.5
Percentage of cost of materialsTrade payables 25 9.4 8.4 7.1 8.2 9.5 9.5 9.4 7.7 9.6 8.6
50 13.7 13.6 13.7 12.7 12.8 12.6 14.6 13.8 13.3 14.0 75 21.9 21.3 19.0 28.1 33.2 24.2 21.7 21.5 21.3 20.4
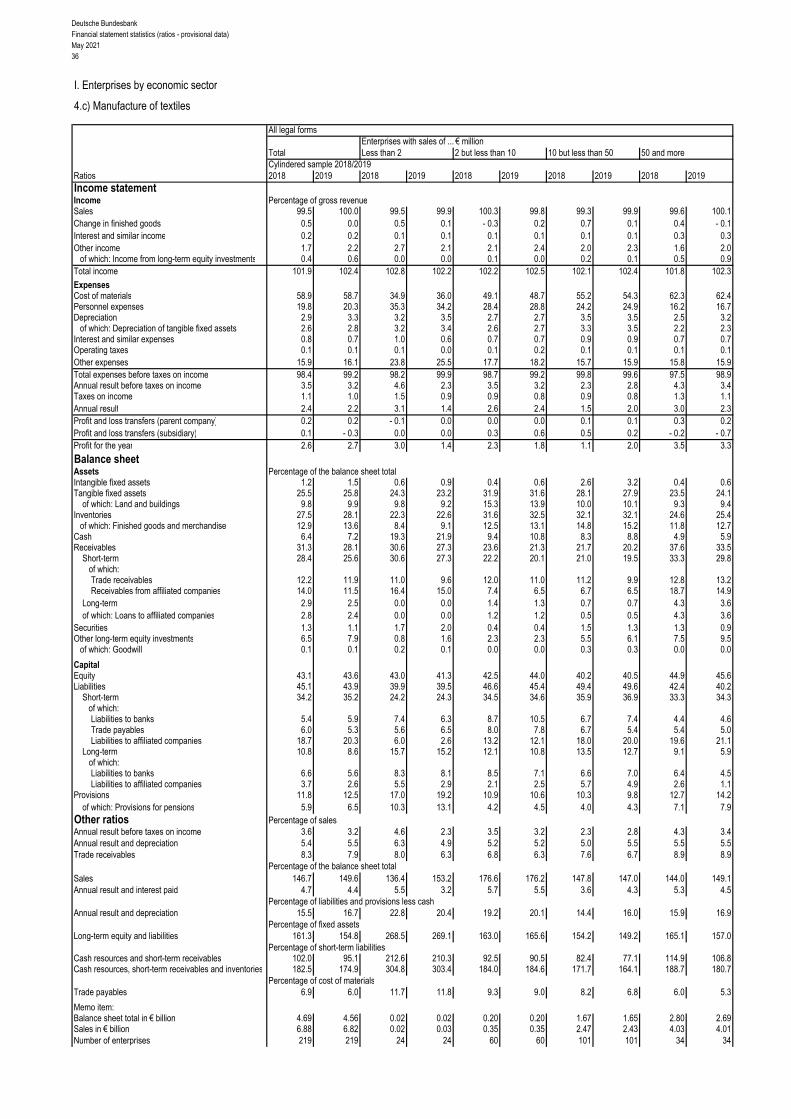
Deutsche BundesbankFinancial statement statistics (ratios - provisional data)May 202136
I. Enterprises by economic sector
4.c) Manufacture of textiles
All legal formsEnterprises with sales of ... € million
Total Less than 2 2 but less than 10 10 but less than 50 50 and moreCylindered sample 2018/2019
Ratios 2018 2019 2018 2019 2018 2019 2018 2019 2018 2019Income statementIncome Percentage of gross revenueSales 99.5 100.0 99.5 99.9 100.3 99.8 99.3 99.9 99.6 100.1Change in finished goods 0.5 0.0 0.5 0.1 - 0.3 0.2 0.7 0.1 0.4 - 0.1Interest and similar income 0.2 0.2 0.1 0.1 0.1 0.1 0.1 0.1 0.3 0.3Other income 1.7 2.2 2.7 2.1 2.1 2.4 2.0 2.3 1.6 2.0
of which: Income from long-term equity investments 0.4 0.6 0.0 0.0 0.1 0.0 0.2 0.1 0.5 0.9Total income 101.9 102.4 102.8 102.2 102.2 102.5 102.1 102.4 101.8 102.3
ExpensesCost of materials 58.9 58.7 34.9 36.0 49.1 48.7 55.2 54.3 62.3 62.4Personnel expenses 19.8 20.3 35.3 34.2 28.4 28.8 24.2 24.9 16.2 16.7Depreciation 2.9 3.3 3.2 3.5 2.7 2.7 3.5 3.5 2.5 3.2
of which: Depreciation of tangible fixed assets 2.6 2.8 3.2 3.4 2.6 2.7 3.3 3.5 2.2 2.3Interest and similar expenses 0.8 0.7 1.0 0.6 0.7 0.7 0.9 0.9 0.7 0.7Operating taxes 0.1 0.1 0.1 0.0 0.1 0.2 0.1 0.1 0.1 0.1Other expenses 15.9 16.1 23.8 25.5 17.7 18.2 15.7 15.9 15.8 15.9Total expenses before taxes on income 98.4 99.2 98.2 99.9 98.7 99.2 99.8 99.6 97.5 98.9Annual result before taxes on income 3.5 3.2 4.6 2.3 3.5 3.2 2.3 2.8 4.3 3.4Taxes on income 1.1 1.0 1.5 0.9 0.9 0.8 0.9 0.8 1.3 1.1Annual result 2.4 2.2 3.1 1.4 2.6 2.4 1.5 2.0 3.0 2.3Profit and loss transfers (parent company) 0.2 0.2 - 0.1 0.0 0.0 0.0 0.1 0.1 0.3 0.2Profit and loss transfers (subsidiary) 0.1 - 0.3 0.0 0.0 0.3 0.6 0.5 0.2 - 0.2 - 0.7Profit for the year 2.6 2.7 3.0 1.4 2.3 1.8 1.1 2.0 3.5 3.3
Balance sheetAssets Percentage of the balance sheet totalIntangible fixed assets 1.2 1.5 0.6 0.9 0.4 0.6 2.6 3.2 0.4 0.6Tangible fixed assets 25.5 25.8 24.3 23.2 31.9 31.6 28.1 27.9 23.5 24.1
of which: Land and buildings 9.8 9.9 9.8 9.2 15.3 13.9 10.0 10.1 9.3 9.4Inventories 27.5 28.1 22.3 22.6 31.6 32.5 32.1 32.1 24.6 25.4
of which: Finished goods and merchandise 12.9 13.6 8.4 9.1 12.5 13.1 14.8 15.2 11.8 12.7Cash 6.4 7.2 19.3 21.9 9.4 10.8 8.3 8.8 4.9 5.9Receivables 31.3 28.1 30.6 27.3 23.6 21.3 21.7 20.2 37.6 33.5
Short-term 28.4 25.6 30.6 27.3 22.2 20.1 21.0 19.5 33.3 29.8 of which:
Trade receivables 12.2 11.9 11.0 9.6 12.0 11.0 11.2 9.9 12.8 13.2Receivables from affiliated companies 14.0 11.5 16.4 15.0 7.4 6.5 6.7 6.5 18.7 14.9
Long-term 2.9 2.5 0.0 0.0 1.4 1.3 0.7 0.7 4.3 3.6of which: Loans to affiliated companies 2.8 2.4 0.0 0.0 1.2 1.2 0.5 0.5 4.3 3.6
Securities 1.3 1.1 1.7 2.0 0.4 0.4 1.5 1.3 1.3 0.9Other long-term equity investments 6.5 7.9 0.8 1.6 2.3 2.3 5.5 6.1 7.5 9.5
of which: Goodwill 0.1 0.1 0.2 0.1 0.0 0.0 0.3 0.3 0.0 0.0
CapitalEquity 43.1 43.6 43.0 41.3 42.5 44.0 40.2 40.5 44.9 45.6Liabilities 45.1 43.9 39.9 39.5 46.6 45.4 49.4 49.6 42.4 40.2
Short-term 34.2 35.2 24.2 24.3 34.5 34.6 35.9 36.9 33.3 34.3of which:Liabilities to banks 5.4 5.9 7.4 6.3 8.7 10.5 6.7 7.4 4.4 4.6Trade payables 6.0 5.3 5.6 6.5 8.0 7.8 6.7 5.4 5.4 5.0Liabilities to affiliated companies 18.7 20.3 6.0 2.6 13.2 12.1 18.0 20.0 19.6 21.1
Long-term 10.8 8.6 15.7 15.2 12.1 10.8 13.5 12.7 9.1 5.9 of which:
Liabilities to banks 6.6 5.6 8.3 8.1 8.5 7.1 6.6 7.0 6.4 4.5Liabilities to affiliated companies 3.7 2.6 5.5 2.9 2.1 2.5 5.7 4.9 2.6 1.1
Provisions 11.8 12.5 17.0 19.2 10.9 10.6 10.3 9.8 12.7 14.2of which: Provisions for pensions 5.9 6.5 10.3 13.1 4.2 4.5 4.0 4.3 7.1 7.9
Other ratios Percentage of salesAnnual result before taxes on income 3.6 3.2 4.6 2.3 3.5 3.2 2.3 2.8 4.3 3.4Annual result and depreciation 5.4 5.5 6.3 4.9 5.2 5.2 5.0 5.5 5.5 5.5Trade receivables 8.3 7.9 8.0 6.3 6.8 6.3 7.6 6.7 8.9 8.9
Percentage of the balance sheet totalSales 146.7 149.6 136.4 153.2 176.6 176.2 147.8 147.0 144.0 149.1Annual result and interest paid 4.7 4.4 5.5 3.2 5.7 5.5 3.6 4.3 5.3 4.5
Percentage of liabilities and provisions less cashAnnual result and depreciation 15.5 16.7 22.8 20.4 19.2 20.1 14.4 16.0 15.9 16.9
Percentage of fixed assetsLong-term equity and liabilities 161.3 154.8 268.5 269.1 163.0 165.6 154.2 149.2 165.1 157.0
Percentage of short-term liabilitiesCash resources and short-term receivables 102.0 95.1 212.6 210.3 92.5 90.5 82.4 77.1 114.9 106.8Cash resources, short-term receivables and inventories 182.5 174.9 304.8 303.4 184.0 184.6 171.7 164.1 188.7 180.7
Percentage of cost of materialsTrade payables 6.9 6.0 11.7 11.8 9.3 9.0 8.2 6.8 6.0 5.3
Memo item:Balance sheet total in € billion 4.69 4.56 0.02 0.02 0.20 0.20 1.67 1.65 2.80 2.69Sales in € billion 6.88 6.82 0.02 0.03 0.35 0.35 2.47 2.43 4.03 4.01Number of enterprises 219 219 24 24 60 60 101 101 34 34

Deutsche BundesbankFinancial statement statistics (ratios - provisional data)
May 202137
I. Enterprises by economic sector
cont'd: 4.c) Manufacture of textiles
cont'd: All legal formsEnterprises with sales of ... € million
Total Less than 2 2 but less than 10 10 but less than 50 50 and moreQuartile Cylindered sample 2018/2019value 2018 2019 2018 2019 2018 2019 2018 2019 2018 2019Of the enterprises captured …
Ratios ... % had a ratio of less than …Percentage of gross revenue
Cost of materials 25 41.8 40.4 14.7 15.0 35.8 34.2 45.0 42.1 55.8 55.9 50 53.6 53.3 29.3 30.0 47.5 48.3 55.2 54.1 59.8 60.0 75 62.0 61.9 49.7 48.6 59.4 60.6 63.1 62.1 69.7 70.8
Personnel expenses 25 17.8 18.3 28.9 27.5 21.4 22.2 17.7 17.9 14.0 14.9 50 23.9 24.4 32.9 36.9 28.1 27.9 23.2 24.3 18.2 19.0 75 33.2 33.8 41.7 44.4 37.8 37.3 28.9 30.7 20.3 21.4
Depreciation 25 1.2 1.2 0.9 0.6 1.0 1.0 1.4 1.5 0.9 1.1 50 2.2 2.3 2.4 2.3 1.7 1.7 2.5 2.7 2.1 2.4 75 3.8 4.2 5.5 5.6 3.7 3.8 3.8 4.2 3.7 4.4
Annual result 25 0.1 0.1 0.0 0.1 0.2 0.1 0.1 0.1 0.3 - 0.5 50 2.4 1.9 2.7 2.2 2.8 1.8 2.0 1.9 2.9 2.3 75 5.9 5.2 5.8 6.0 5.4 4.9 6.7 5.3 5.7 4.6
Percentage of the balance sheet totalTangible fixed assets 25 7.9 7.4 8.7 6.7 8.6 7.3 9.7 11.8 5.1 5.9
50 20.1 19.7 15.3 13.8 20.6 21.7 21.9 20.9 16.7 16.2 75 34.5 37.5 41.7 41.4 37.3 41.6 34.2 35.3 32.0 34.6
Inventories 25 17.1 16.7 3.3 3.6 15.7 15.4 22.6 22.9 14.7 14.8 50 32.8 33.6 16.7 15.6 32.5 34.6 34.6 35.6 32.0 33.1 75 48.6 48.9 41.3 46.7 47.1 50.9 51.8 49.6 47.8 45.5
Equity 25 21.2 19.3 5.4 10.5 17.6 19.7 23.4 22.2 22.1 27.3 50 39.9 37.9 36.0 38.8 42.9 42.8 39.9 36.5 34.9 37.2 75 56.3 58.7 65.7 71.5 59.0 59.5 55.4 56.5 53.1 56.7
Short-term liabilities 25 16.6 15.8 10.8 12.0 14.1 10.4 17.3 16.7 23.2 20.8 50 33.5 34.6 31.7 26.8 31.5 32.5 35.8 35.6 37.0 45.6 75 53.1 53.5 67.4 52.9 52.8 47.4 51.7 55.5 57.1 58.8
Liabilities to banks 25 0.0 0.0 0.0 0.0 0.0 0.0 0.0 0.0 0.0 0.0 50 8.0 8.0 11.4 8.4 12.4 12.3 8.0 8.0 0.0 0.1 75 27.1 27.5 44.7 41.8 25.9 27.5 25.1 26.9 28.9 24.2
Percentage of salesAnnual result before taxes on income 25 0.1 0.3 0.2 0.3 0.5 0.3 0.1 0.3 0.3 0.1
50 3.1 2.7 3.9 3.2 3.4 2.5 2.9 2.9 4.0 2.9 75 7.9 6.6 8.3 7.3 7.4 6.5 8.2 6.6 6.9 5.8
Annual result and depreciation 25 2.9 2.4 3.3 1.0 3.0 2.3 3.1 2.8 2.8 2.0 50 6.3 5.6 5.7 5.9 6.4 4.9 6.3 6.1 6.1 6.3 75 10.0 9.7 10.7 8.4 9.5 8.4 11.2 10.5 9.0 9.7
Trade receivables 25 3.4 2.6 1.8 1.7 3.1 2.6 4.1 3.0 5.2 5.5 50 7.4 6.4 5.4 2.9 6.2 5.6 7.6 6.6 8.8 7.4 75 10.0 9.7 8.9 6.6 9.5 9.6 10.9 9.8 10.7 10.3
Percentage of the balance sheet totalAnnual result and interest paid 25 1.5 1.2 1.8 0.7 1.9 1.1 1.1 1.7 1.9 0.2
50 5.7 4.5 7.7 7.1 6.1 4.1 5.1 4.1 5.6 4.6 75 12.4 10.8 14.2 15.9 12.7 11.4 11.9 10.4 9.9 8.3
Percentage of liabilities and provisions less cashAnnual result and depreciation 25 3.7 3.1 - 19.3 - 20.8 3.5 2.6 5.4 5.8 4.1 2.3
50 15.7 15.0 14.2 11.7 17.1 15.8 15.7 16.0 15.7 15.8 75 37.5 33.3 42.0 31.6 42.5 35.1 38.3 38.9 30.0 25.4
Percentage of fixed assetsLong-term equity and liabilities 25 110.3 115.5 102.0 110.7 122.7 124.8 114.0 111.5 110.4 122.8
50 182.9 180.9 116.9 221.9 203.4 196.9 182.2 170.1 187.8 176.9 75 322.3 334.8 538.7 473.9 395.2 484.1 312.2 281.1 285.1 304.4
Percentage of short-term liabilitiesCash resources and short-term receivables 25 48.9 45.3 67.8 86.2 42.3 40.2 48.9 41.1 53.0 52.9
50 90.0 99.0 131.9 165.2 112.2 117.3 84.1 75.9 75.8 80.0 75 235.9 229.8 408.3 308.9 334.0 373.2 162.9 175.6 201.8 177.8
Percentage of cost of materialsTrade payables 25 4.3 3.8 3.4 3.8 3.9 4.3 4.6 3.8 3.8 3.2
50 7.0 6.1 9.1 9.6 7.0 6.4 7.0 6.0 6.7 4.9 75 11.2 11.0 25.0 17.2 12.0 13.0 10.9 9.2 10.3 9.3

Deutsche BundesbankFinancial statement statistics (ratios - provisional data)May 202138
I. Enterprises by economic sector
4.d) Manufacture of wood and of products of wood and cork, except furniture
All legal formsEnterprises with sales of ... € million
Total Less than 2 2 but less than 10 10 but less than 50 50 and moreCylindered sample 2018/2019
Ratios 2018 2019 2018 2019 2018 2019 2018 2019 2018 2019Income statementIncome Percentage of gross revenueSales 99.4 100.1 96.8 96.4 99.0 98.4 99.8 99.8 99.4 100.3Change in finished goods 0.6 - 0.1 3.2 3.6 1.0 1.6 0.2 0.2 0.6 - 0.3Interest and similar income 0.2 0.2 0.1 0.1 0.1 0.1 0.1 0.1 0.2 0.2Other income 1.4 1.8 2.6 2.1 2.3 2.0 1.4 1.5 1.4 1.8
of which: Income from long-term equity investments 0.2 0.2 0.0 0.0 0.1 0.0 0.1 0.2 0.3 0.2Total income 101.6 102.0 102.7 102.2 102.4 102.1 101.5 101.7 101.6 102.1
ExpensesCost of materials 64.0 61.6 44.5 45.5 52.8 51.4 60.9 58.7 66.0 63.5Personnel expenses 15.0 15.8 33.3 32.5 26.6 27.6 18.4 19.2 12.9 13.6Depreciation 3.2 3.3 3.5 3.2 2.8 2.8 2.9 2.9 3.3 3.4
of which: Depreciation of tangible fixed assets 3.0 3.2 3.4 3.2 2.8 2.8 2.9 2.8 3.0 3.3Interest and similar expenses 0.8 0.7 1.1 0.9 0.8 0.7 0.7 0.7 0.8 0.7Operating taxes 0.1 0.1 0.1 0.1 0.1 0.1 0.1 0.1 0.1 0.1Other expenses 14.8 15.9 16.3 15.9 15.2 15.4 15.8 16.1 14.5 15.9Total expenses before taxes on income 97.8 97.3 98.8 98.2 98.4 98.0 98.7 97.8 97.6 97.2Annual result before taxes on income 3.8 4.6 3.9 4.0 4.1 4.1 2.8 3.9 4.0 4.9Taxes on income 0.7 0.8 0.8 0.8 0.9 1.0 0.6 0.8 0.8 0.7Annual result 3.0 3.9 3.1 3.2 3.2 3.1 2.2 3.1 3.2 4.2Profit and loss transfers (parent company) 0.3 0.2 0.0 0.0 0.0 0.0 0.0 0.0 0.5 0.3Profit and loss transfers (subsidiary) 0.6 0.8 - 0.1 0.0 0.1 0.1 0.2 0.3 0.8 1.0Profit for the year 2.7 3.3 3.2 3.2 3.1 3.1 2.0 2.7 2.9 3.5
Balance sheetAssets Percentage of the balance sheet totalIntangible fixed assets 0.6 0.6 0.4 0.4 0.3 0.3 0.6 0.8 0.6 0.5Tangible fixed assets 38.0 38.4 36.4 34.3 33.9 31.4 32.9 34.9 40.0 40.3
of which: Land and buildings 13.6 13.2 15.5 15.3 15.4 14.3 11.6 11.6 14.0 13.5Inventories 27.9 26.5 31.0 35.5 37.1 38.8 32.7 30.9 25.5 23.7
of which: Finished goods and merchandise 8.8 8.3 9.9 9.9 11.4 11.3 10.7 10.1 8.0 7.4Cash 6.4 7.6 8.0 8.9 9.2 11.3 11.3 11.2 4.6 6.1Receivables 21.3 21.2 23.1 19.8 18.1 16.8 19.3 19.4 22.2 22.2
Short-term 20.0 19.5 22.5 19.2 17.5 15.4 17.9 18.0 20.9 20.4 of which:
Trade receivables 9.1 8.5 12.4 11.3 10.6 9.4 11.3 11.0 8.3 7.6Receivables from affiliated companies 8.1 8.3 6.5 4.6 4.6 3.6 4.0 4.7 9.7 9.9
Long-term 1.3 1.6 0.6 0.5 0.6 1.5 1.4 1.3 1.4 1.8of which: Loans to affiliated companies 0.9 1.3 0.0 0.0 0.2 1.1 0.7 0.5 1.1 1.6
Securities 0.8 1.1 0.0 0.0 0.0 0.1 0.8 0.7 0.9 1.3Other long-term equity investments 4.7 4.5 0.4 0.3 0.9 0.8 2.0 1.9 5.9 5.7
of which: Goodwill 0.3 0.2 0.2 0.1 0.5 0.4 0.2 0.2 0.3 0.2
CapitalEquity 32.9 34.4 25.6 22.5 33.5 33.4 33.2 33.9 32.8 34.8Liabilities 58.4 56.9 68.6 71.9 58.4 59.1 59.8 58.8 57.8 55.8
Short-term 43.3 43.4 48.7 53.2 42.7 42.1 41.6 41.9 43.8 43.8of which:Liabilities to banks 5.6 5.1 14.0 14.3 10.6 8.1 7.2 8.3 4.5 3.6Trade payables 7.9 7.4 7.9 8.0 6.8 5.9 10.1 7.9 7.4 7.4Liabilities to affiliated companies 18.3 18.8 5.8 6.0 7.3 7.2 8.6 9.5 22.4 23.0
Long-term 15.1 13.5 19.9 18.7 15.8 17.0 18.2 16.9 14.0 12.0 of which:
Liabilities to banks 8.0 7.0 16.2 14.0 9.8 10.2 10.5 8.7 6.9 6.0Liabilities to affiliated companies 6.0 5.3 3.2 4.0 2.8 3.3 4.9 5.4 6.7 5.5
Provisions 8.7 8.7 5.7 5.6 8.0 7.3 6.9 7.2 9.3 9.3of which: Provisions for pensions 2.2 2.2 1.4 1.5 2.3 2.3 2.0 2.1 2.2 2.3
Other ratios Percentage of salesAnnual result before taxes on income 3.8 4.6 4.0 4.2 4.1 4.2 2.8 3.9 4.0 4.9Annual result and depreciation 6.3 7.1 6.8 6.6 6.1 6.1 5.2 6.0 6.6 7.6Trade receivables 4.7 4.5 7.7 6.9 6.3 6.0 6.2 6.2 4.1 3.9
Percentage of the balance sheet totalSales 193.8 188.1 160.5 163.4 167.8 155.6 183.9 177.9 199.8 194.9Annual result and interest paid 7.4 8.7 7.0 7.0 6.8 6.0 5.3 6.7 8.1 9.5
Percentage of liabilities and provisions less cashAnnual result and depreciation 20.0 23.2 16.4 15.8 17.8 17.1 17.1 19.4 21.0 24.9
Percentage of fixed assetsLong-term equity and liabilities 111.0 108.9 124.5 120.1 144.1 154.3 143.3 135.2 101.2 99.4
Percentage of short-term liabilitiesCash resources and short-term receivables 61.6 62.9 62.7 53.0 62.6 63.3 71.2 70.6 58.9 60.9Cash resources, short-term receivables and inventories 126.0 123.9 126.5 119.7 149.5 155.3 149.9 144.4 117.2 115.0
Percentage of cost of materialsTrade payables 6.4 6.4 10.7 10.4 7.5 7.2 9.0 7.5 5.6 6.0
Memo item:Balance sheet total in € billion 5.81 6.00 0.07 0.07 0.40 0.43 1.21 1.27 4.13 4.23Sales in € billion 11.26 11.29 0.11 0.12 0.67 0.67 2.23 2.25 8.25 8.25Number of enterprises 392 392 103 103 133 133 99 99 57 57

Deutsche BundesbankFinancial statement statistics (ratios - provisional data)
May 202139
I. Enterprises by economic sector
cont'd: 4.d) Manufacture of wood and of products of wood and cork, except furniture
cont'd: All legal formsEnterprises with sales of ... € million
Total Less than 2 2 but less than 10 10 but less than 50 50 and moreQuartile Cylindered sample 2018/2019value 2018 2019 2018 2019 2018 2019 2018 2019 2018 2019Of the enterprises captured …
Ratios ... % had a ratio of less than …Percentage of gross revenue
Cost of materials 25 43.6 42.4 33.0 30.8 43.7 42.9 52.1 52.2 56.8 55.7 50 55.1 54.0 43.3 41.8 52.1 52.3 60.5 59.4 63.1 60.7 75 63.8 61.3 51.4 52.9 60.3 58.7 67.3 64.9 71.1 69.1
Personnel expenses 25 14.8 15.7 25.2 25.8 19.7 19.1 12.7 13.5 8.3 10.6 50 24.1 24.4 33.3 35.3 27.2 27.9 18.5 18.4 12.1 12.6 75 33.5 34.2 41.6 43.1 35.6 35.8 27.3 25.3 19.4 19.4
Depreciation 25 1.3 1.3 1.4 1.2 1.4 1.3 1.4 1.4 1.2 1.5 50 2.4 2.4 2.6 2.3 2.4 2.5 2.4 2.3 2.3 2.2 75 4.0 4.0 4.7 4.3 3.5 3.7 3.6 3.5 4.2 4.9
Annual result 25 0.6 0.6 0.2 0.1 0.7 0.8 0.6 0.7 0.7 1.1 50 2.3 2.6 2.6 3.1 2.3 2.4 2.2 2.6 2.6 3.6 75 5.0 5.5 6.1 7.2 4.8 4.7 4.5 4.4 5.7 6.4
Percentage of the balance sheet totalTangible fixed assets 25 13.8 13.0 10.6 8.2 14.6 13.6 13.1 13.3 18.3 15.6
50 26.7 27.3 24.8 26.2 27.3 27.2 25.6 26.3 33.7 36.7 75 47.5 47.6 52.0 52.2 43.8 39.8 46.8 47.2 51.0 51.9
Inventories 25 14.9 13.4 6.8 7.2 16.6 15.8 14.5 13.9 17.8 13.5 50 27.6 25.9 25.6 24.0 30.0 32.1 25.5 24.6 27.5 21.8 75 48.2 47.4 47.8 45.1 53.3 54.2 44.8 46.4 38.0 39.8
Equity 25 9.5 9.9 0.6 2.3 10.6 12.8 10.7 12.3 14.0 13.4 50 24.4 25.4 14.9 16.0 27.8 27.5 27.7 30.1 31.0 30.3 75 51.3 51.1 43.2 43.8 46.4 48.0 54.8 53.1 54.9 55.5
Short-term liabilities 25 19.2 18.3 18.2 21.5 20.8 18.3 16.5 17.7 22.6 20.5 50 38.3 38.8 50.4 50.2 38.7 38.5 34.5 33.4 35.3 41.2 75 68.1 68.6 84.3 80.7 59.2 60.0 67.6 66.5 60.8 65.8
Liabilities to banks 25 0.0 0.0 0.0 1.7 1.5 0.6 0.0 0.8 0.0 0.0 50 13.4 11.4 26.4 27.9 14.1 10.8 6.5 7.7 4.6 0.5 75 34.8 33.2 52.1 50.8 34.9 32.3 29.2 27.0 24.4 18.5
Percentage of salesAnnual result before taxes on income 25 0.6 0.9 0.2 0.2 0.9 1.1 0.6 0.8 0.8 1.1
50 2.9 3.3 2.9 3.5 3.1 2.9 2.7 3.3 3.8 4.4 75 6.3 7.0 6.8 7.7 6.5 6.4 5.2 5.7 7.2 7.6
Annual result and depreciation 25 3.1 3.5 3.1 2.8 3.0 3.8 2.8 3.1 4.2 4.0 50 5.9 6.3 7.0 7.0 5.6 5.9 5.1 5.8 5.9 7.4 75 10.0 10.5 11.7 12.0 9.9 9.4 8.2 9.1 9.2 10.7
Trade receivables 25 2.9 2.6 3.1 2.6 3.5 3.4 2.9 2.6 0.7 0.9 50 5.3 5.0 6.3 5.5 5.4 5.2 5.5 5.1 3.4 3.1 75 8.4 8.1 10.2 9.6 8.3 7.9 8.5 9.2 5.4 5.4
Percentage of the balance sheet totalAnnual result and interest paid 25 2.4 2.5 2.2 1.0 2.8 2.7 2.3 2.1 2.4 4.4
50 6.2 6.5 6.2 7.7 6.2 5.6 5.4 5.3 7.8 9.3 75 11.5 13.1 14.2 17.6 10.7 10.4 9.2 11.6 15.5 15.9
Percentage of liabilities and provisions less cashAnnual result and depreciation 25 6.4 6.0 4.0 3.6 6.0 7.0 6.1 4.5 12.3 11.8
50 15.5 17.0 11.6 14.5 14.8 13.5 14.5 18.2 22.0 26.9 75 30.0 35.0 25.0 27.0 29.6 31.4 38.6 35.7 43.7 56.6
Percentage of fixed assetsLong-term equity and liabilities 25 78.3 79.3 54.7 52.7 90.3 99.5 94.1 79.1 85.8 77.7
50 137.2 142.9 110.8 125.7 157.5 157.1 150.2 147.8 126.2 115.0 75 281.9 278.8 287.5 296.5 317.5 322.1 285.0 272.1 192.7 200.1
Percentage of short-term liabilitiesCash resources and short-term receivables 25 31.9 32.3 27.8 28.5 35.2 38.2 32.6 34.8 29.2 31.3
50 69.7 67.1 55.3 57.0 70.9 69.3 83.8 77.6 71.6 68.8 75 169.8 179.1 140.0 147.4 141.2 189.5 229.1 229.9 160.8 153.6
Percentage of cost of materialsTrade payables 25 3.9 3.2 4.0 3.1 3.1 2.8 4.1 3.4 4.0 4.1
50 6.2 6.1 7.6 7.4 5.7 5.3 6.7 6.3 5.4 6.2 75 10.6 9.9 15.5 16.0 10.1 9.3 9.2 8.9 7.6 8.6

Deutsche BundesbankFinancial statement statistics (ratios - provisional data)May 202140
I. Enterprises by economic sector
4.e) Manufacture of paper and paper products
All legal formsEnterprises with sales of ... € million
Total Less than 2 2 but less than 10 10 but less than 50 50 and moreCylindered sample 2018/2019
Ratios 2018 2019 2018 2019 2018 2019 2018 2019 2018 2019Income statementIncome Percentage of gross revenueSales 99.2 100.1 . . 99.4 99.6 99.6 99.7 99.1 100.2Change in finished goods 0.8 - 0.1 . . 0.6 0.4 0.4 0.3 0.9 - 0.2Interest and similar income 0.2 0.3 . . 0.1 0.1 0.1 0.1 0.2 0.3Other income 2.4 2.5 . . 1.7 1.7 3.3 1.8 2.2 2.6
of which: Income from long-term equity investments 0.3 0.9 . . 0.1 0.0 0.3 0.4 0.3 1.0Total income 102.6 102.8 . . 101.8 101.7 103.4 102.0 102.5 102.9
ExpensesCost of materials 61.9 60.7 . . 51.0 49.7 55.5 55.1 62.9 61.7Personnel expenses 14.9 15.8 . . 26.2 27.2 22.6 22.7 13.7 14.7Depreciation 3.3 3.6 . . 3.8 3.8 3.7 3.3 3.3 3.7
of which: Depreciation of tangible fixed assets 3.2 3.4 . . 3.7 3.8 3.6 3.2 3.2 3.4Interest and similar expenses 1.1 1.2 . . 0.8 0.8 0.7 0.7 1.2 1.3Operating taxes 0.1 0.1 . . 0.1 0.1 0.1 0.1 0.1 0.1Other expenses 15.3 16.1 . . 16.6 17.0 17.5 16.8 15.0 15.9Total expenses before taxes on income 96.7 97.6 . . 98.5 98.6 100.2 98.7 96.2 97.4Annual result before taxes on income 5.9 5.2 . . 3.3 3.1 3.3 3.3 6.3 5.5Taxes on income 0.8 0.7 . . 0.9 1.0 0.8 0.8 0.8 0.7Annual result 5.1 4.5 . . 2.5 2.1 2.5 2.5 5.5 4.8Profit and loss transfers (parent company) 0.2 0.3 . . 0.0 0.0 0.2 0.2 0.2 0.3Profit and loss transfers (subsidiary) 2.2 2.7 . . 1.0 0.7 0.6 0.4 2.5 3.0Profit for the year 3.1 2.1 . . 1.4 1.4 2.1 2.3 3.2 2.1
Balance sheetAssets Percentage of the balance sheet totalIntangible fixed assets 0.9 0.8 . . 0.5 0.5 0.6 0.6 0.9 0.9Tangible fixed assets 30.9 33.5 . . 46.0 46.9 28.7 29.0 31.1 33.9
of which: Land and buildings 10.0 10.8 . . 19.5 19.4 11.7 11.7 9.7 10.6Inventories 15.1 13.8 . . 18.1 17.3 18.7 18.3 14.6 13.2
of which: Finished goods and merchandise 6.2 5.8 . . 7.8 8.3 9.3 9.5 5.8 5.4Cash 4.4 5.1 . . 8.0 9.2 5.4 6.0 4.2 4.9Receivables 33.4 32.1 . . 19.5 17.5 29.6 28.3 34.0 32.6
Short-term 30.7 29.5 . . 19.2 17.2 28.5 27.2 31.1 29.9 of which:
Trade receivables 7.9 7.0 . . 10.2 9.5 9.2 8.9 7.7 6.8Receivables from affiliated companies 20.2 20.3 . . 5.7 5.4 16.7 15.5 20.8 21.0
Long-term 2.7 2.5 . . 0.3 0.3 1.1 1.2 2.9 2.7of which: Loans to affiliated companies 2.4 2.2 . . 0.0 0.0 0.7 0.7 2.7 2.4
Securities 0.4 0.3 . . 2.0 2.5 0.1 0.1 0.4 0.3Other long-term equity investments 14.6 14.1 . . 5.4 5.7 16.7 17.4 14.4 13.8
of which: Goodwill 0.4 0.3 . . 0.0 0.0 0.1 0.1 0.4 0.3
CapitalEquity 38.2 38.5 . . 32.2 36.9 46.2 47.3 37.3 37.5Liabilities 48.6 48.4 . . 60.4 55.1 41.0 41.0 49.4 49.2
Short-term 31.0 30.7 . . 35.2 32.6 31.3 30.4 31.0 30.7of which:Liabilities to banks 4.2 2.4 . . 10.0 8.5 5.9 4.7 3.9 2.1Trade payables 8.4 8.1 . . 6.5 6.0 6.1 5.6 8.8 8.4Liabilities to affiliated companies 15.9 17.6 . . 14.6 13.7 16.6 17.4 15.8 17.7
Long-term 17.5 17.7 . . 25.3 22.5 9.8 10.6 18.5 18.5 of which:
Liabilities to banks 5.8 7.7 . . 16.5 17.0 4.8 6.1 5.8 7.8Liabilities to affiliated companies 9.0 6.9 . . 7.4 4.3 4.6 4.0 9.5 7.3
Provisions 13.1 13.0 . . 7.4 8.0 12.7 11.6 13.2 13.3of which: Provisions for pensions 7.4 7.5 . . 2.8 3.2 6.5 6.8 7.5 7.6
Other ratios Percentage of salesAnnual result before taxes on income 5.9 5.2 . . 3.3 3.2 3.3 3.3 6.4 5.5Annual result and depreciation 8.5 8.1 . . 6.3 6.0 6.2 5.8 8.8 8.5Trade receivables 6.1 5.8 . . 6.3 5.7 6.5 6.2 6.0 5.7
Percentage of the balance sheet totalSales 129.5 120.9 . . 162.9 166.4 142.6 143.4 127.5 117.9Annual result and interest paid 8.1 6.9 . . 5.4 4.9 4.6 4.7 8.5 7.2
Percentage of liabilities and provisions less cashAnnual result and depreciation 19.1 17.4 . . 17.3 18.4 18.3 17.8 19.2 17.4
Percentage of fixed assetsLong-term equity and liabilities 128.1 124.7 . . 114.3 115.6 132.4 133.9 127.7 123.7
Percentage of short-term liabilitiesCash resources and short-term receivables 113.8 113.4 . . 81.8 86.4 108.5 109.1 114.9 114.1Cash resources, short-term receivables and inventories 162.4 158.3 . . 133.3 139.4 168.4 169.2 161.9 157.2
Percentage of cost of materialsTrade payables 10.4 11.0 . . 7.8 7.2 7.7 7.1 10.8 11.5
Memo item:Balance sheet total in € billion 18.94 19.93 . . 0.15 0.15 2.12 2.11 16.66 17.67Sales in € billion 24.52 24.10 . . 0.25 0.25 3.02 3.03 21.24 20.82Number of enterprises 257 257 . . 44 44 109 109 104 104
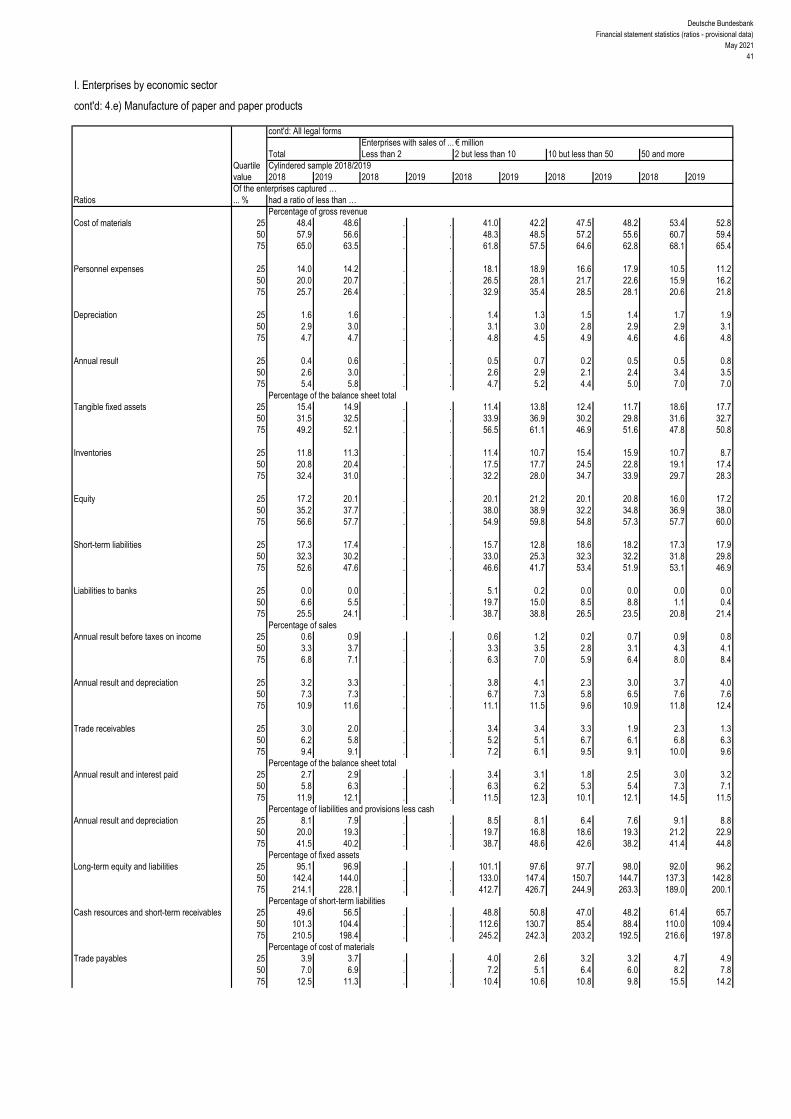
Deutsche BundesbankFinancial statement statistics (ratios - provisional data)
May 202141
I. Enterprises by economic sector
cont'd: 4.e) Manufacture of paper and paper products
cont'd: All legal formsEnterprises with sales of ... € million
Total Less than 2 2 but less than 10 10 but less than 50 50 and moreQuartile Cylindered sample 2018/2019value 2018 2019 2018 2019 2018 2019 2018 2019 2018 2019Of the enterprises captured …
Ratios ... % had a ratio of less than …Percentage of gross revenue
Cost of materials 25 48.4 48.6 . . 41.0 42.2 47.5 48.2 53.4 52.8 50 57.9 56.6 . . 48.3 48.5 57.2 55.6 60.7 59.4 75 65.0 63.5 . . 61.8 57.5 64.6 62.8 68.1 65.4
Personnel expenses 25 14.0 14.2 . . 18.1 18.9 16.6 17.9 10.5 11.2 50 20.0 20.7 . . 26.5 28.1 21.7 22.6 15.9 16.2 75 25.7 26.4 . . 32.9 35.4 28.5 28.1 20.6 21.8
Depreciation 25 1.6 1.6 . . 1.4 1.3 1.5 1.4 1.7 1.9 50 2.9 3.0 . . 3.1 3.0 2.8 2.9 2.9 3.1 75 4.7 4.7 . . 4.8 4.5 4.9 4.6 4.6 4.8
Annual result 25 0.4 0.6 . . 0.5 0.7 0.2 0.5 0.5 0.8 50 2.6 3.0 . . 2.6 2.9 2.1 2.4 3.4 3.5 75 5.4 5.8 . . 4.7 5.2 4.4 5.0 7.0 7.0
Percentage of the balance sheet totalTangible fixed assets 25 15.4 14.9 . . 11.4 13.8 12.4 11.7 18.6 17.7
50 31.5 32.5 . . 33.9 36.9 30.2 29.8 31.6 32.7 75 49.2 52.1 . . 56.5 61.1 46.9 51.6 47.8 50.8
Inventories 25 11.8 11.3 . . 11.4 10.7 15.4 15.9 10.7 8.7 50 20.8 20.4 . . 17.5 17.7 24.5 22.8 19.1 17.4 75 32.4 31.0 . . 32.2 28.0 34.7 33.9 29.7 28.3
Equity 25 17.2 20.1 . . 20.1 21.2 20.1 20.8 16.0 17.2 50 35.2 37.7 . . 38.0 38.9 32.2 34.8 36.9 38.0 75 56.6 57.7 . . 54.9 59.8 54.8 57.3 57.7 60.0
Short-term liabilities 25 17.3 17.4 . . 15.7 12.8 18.6 18.2 17.3 17.9 50 32.3 30.2 . . 33.0 25.3 32.3 32.2 31.8 29.8 75 52.6 47.6 . . 46.6 41.7 53.4 51.9 53.1 46.9
Liabilities to banks 25 0.0 0.0 . . 5.1 0.2 0.0 0.0 0.0 0.0 50 6.6 5.5 . . 19.7 15.0 8.5 8.8 1.1 0.4 75 25.5 24.1 . . 38.7 38.8 26.5 23.5 20.8 21.4
Percentage of salesAnnual result before taxes on income 25 0.6 0.9 . . 0.6 1.2 0.2 0.7 0.9 0.8
50 3.3 3.7 . . 3.3 3.5 2.8 3.1 4.3 4.1 75 6.8 7.1 . . 6.3 7.0 5.9 6.4 8.0 8.4
Annual result and depreciation 25 3.2 3.3 . . 3.8 4.1 2.3 3.0 3.7 4.0 50 7.3 7.3 . . 6.7 7.3 5.8 6.5 7.6 7.6 75 10.9 11.6 . . 11.1 11.5 9.6 10.9 11.8 12.4
Trade receivables 25 3.0 2.0 . . 3.4 3.4 3.3 1.9 2.3 1.3 50 6.2 5.8 . . 5.2 5.1 6.7 6.1 6.8 6.3 75 9.4 9.1 . . 7.2 6.1 9.5 9.1 10.0 9.6
Percentage of the balance sheet totalAnnual result and interest paid 25 2.7 2.9 . . 3.4 3.1 1.8 2.5 3.0 3.2
50 5.8 6.3 . . 6.3 6.2 5.3 5.4 7.3 7.1 75 11.9 12.1 . . 11.5 12.3 10.1 12.1 14.5 11.5
Percentage of liabilities and provisions less cashAnnual result and depreciation 25 8.1 7.9 . . 8.5 8.1 6.4 7.6 9.1 8.8
50 20.0 19.3 . . 19.7 16.8 18.6 19.3 21.2 22.9 75 41.5 40.2 . . 38.7 48.6 42.6 38.2 41.4 44.8
Percentage of fixed assetsLong-term equity and liabilities 25 95.1 96.9 . . 101.1 97.6 97.7 98.0 92.0 96.2
50 142.4 144.0 . . 133.0 147.4 150.7 144.7 137.3 142.8 75 214.1 228.1 . . 412.7 426.7 244.9 263.3 189.0 200.1
Percentage of short-term liabilitiesCash resources and short-term receivables 25 49.6 56.5 . . 48.8 50.8 47.0 48.2 61.4 65.7
50 101.3 104.4 . . 112.6 130.7 85.4 88.4 110.0 109.4 75 210.5 198.4 . . 245.2 242.3 203.2 192.5 216.6 197.8
Percentage of cost of materialsTrade payables 25 3.9 3.7 . . 4.0 2.6 3.2 3.2 4.7 4.9
50 7.0 6.9 . . 7.2 5.1 6.4 6.0 8.2 7.8 75 12.5 11.3 . . 10.4 10.6 10.8 9.8 15.5 14.2

Deutsche BundesbankFinancial statement statistics (ratios - provisional data)May 202142
I. Enterprises by economic sector
4.f) Printing and reproduction of recorded media
All legal formsEnterprises with sales of ... € million
Total Less than 2 2 but less than 10 10 but less than 50 50 and moreCylindered sample 2018/2019
Ratios 2018 2019 2018 2019 2018 2019 2018 2019 2018 2019Income statementIncome Percentage of gross revenueSales 99.6 100.1 99.5 99.3 99.9 100.2 99.9 99.8 99.2 100.3Change in finished goods 0.4 - 0.1 0.5 0.7 0.1 - 0.2 0.1 0.2 0.8 - 0.3Interest and similar income 0.1 0.1 0.1 0.1 0.1 0.1 0.1 0.1 0.2 0.1Other income 3.5 4.1 3.4 3.2 2.4 2.7 1.9 2.3 4.7 5.6
of which: Income from long-term equity investments 1.2 1.0 0.0 0.4 0.3 0.2 0.1 0.0 2.1 1.9Total income 103.6 104.3 103.5 103.4 102.5 102.8 102.0 102.4 104.9 105.8
ExpensesCost of materials 49.4 48.8 33.5 33.1 40.9 41.2 48.5 47.6 52.0 51.4Personnel expenses 25.0 25.4 35.0 34.6 32.7 32.6 28.7 29.4 20.8 21.1Depreciation 5.3 5.3 4.5 4.2 4.0 3.7 4.4 4.3 6.3 6.2
of which: Depreciation of tangible fixed assets 5.2 5.1 4.5 4.2 3.8 3.6 4.3 4.2 6.0 6.0Interest and similar expenses 1.4 1.3 1.0 1.0 0.8 0.7 0.7 0.7 1.9 1.8Operating taxes 0.1 0.1 0.1 0.1 0.1 0.1 0.1 0.1 0.1 0.1Other expenses 18.3 19.1 23.7 22.8 21.3 21.7 16.1 17.2 18.9 19.8Total expenses before taxes on income 99.4 99.9 97.7 95.8 99.7 100.0 98.4 99.3 99.9 100.4Annual result before taxes on income 4.2 4.4 5.8 7.6 2.8 2.9 3.5 3.1 4.9 5.4Taxes on income 1.0 1.3 1.0 1.3 0.8 0.8 0.7 0.8 1.3 1.8Annual result 3.2 3.1 4.8 6.3 2.0 2.1 2.9 2.4 3.6 3.6Profit and loss transfers (parent company) 0.5 0.3 0.0 0.0 0.0 0.0 0.3 0.3 0.7 0.4Profit and loss transfers (subsidiary) 1.4 1.1 0.4 0.3 0.0 0.0 1.7 1.1 1.4 1.4Profit for the year 2.3 2.3 4.4 6.0 2.0 2.1 1.5 1.6 2.9 2.7
Balance sheetAssets Percentage of the balance sheet totalIntangible fixed assets 1.7 1.5 0.8 0.7 0.7 0.6 1.0 1.1 2.1 1.8Tangible fixed assets 33.3 32.7 37.6 37.8 40.1 40.1 40.4 38.8 29.8 29.5
of which: Land and buildings 13.5 13.1 10.2 11.4 14.6 14.9 14.6 14.1 12.9 12.6Inventories 10.2 9.7 10.0 10.6 14.5 13.9 12.9 13.5 8.7 7.9
of which: Finished goods and merchandise 3.1 3.0 4.4 4.5 6.1 5.4 3.9 4.5 2.5 2.2Cash 10.6 10.4 12.4 12.1 12.2 13.6 8.3 9.2 11.4 10.6Receivables 28.0 29.7 30.2 30.1 27.5 28.3 32.3 32.2 26.2 28.9
Short-term 26.3 27.5 30.1 30.0 26.6 27.3 31.5 31.1 24.2 26.1 of which:
Trade receivables 12.5 12.0 17.1 15.5 17.3 17.0 14.5 14.1 11.2 10.6Receivables from affiliated companies 11.1 12.9 9.4 10.3 5.1 6.1 13.3 13.4 10.8 13.4
Long-term 1.6 2.2 0.1 0.1 0.9 1.0 0.8 1.1 2.0 2.8of which: Loans to affiliated companies 1.4 1.3 0.0 0.0 0.7 0.4 0.4 0.6 1.9 1.6
Securities 0.7 0.5 1.0 0.9 2.6 1.2 1.1 1.1 0.4 0.2Other long-term equity investments 14.8 14.8 7.0 6.7 1.5 1.3 3.3 3.4 20.8 20.6
of which: Goodwill 4.0 3.2 0.4 0.5 0.2 0.2 0.1 0.1 5.9 4.7
CapitalEquity 41.9 42.3 28.1 27.3 35.9 36.4 40.2 41.4 43.4 43.5Liabilities 38.0 38.2 61.1 62.5 54.3 53.8 46.3 44.7 32.7 33.8
Short-term 28.7 29.1 36.9 35.1 36.7 36.4 31.8 31.8 26.5 27.3of which:Liabilities to banks 4.8 4.7 12.9 10.2 9.0 9.6 9.2 8.1 2.5 2.9Trade payables 6.7 6.1 8.7 9.2 11.0 10.6 8.3 7.5 5.6 5.1Liabilities to affiliated companies 13.4 14.6 5.6 7.7 10.2 10.3 9.6 11.6 15.4 16.3
Long-term 9.3 9.1 24.1 27.4 17.7 17.4 14.5 12.8 6.2 6.5 of which:
Liabilities to banks 6.2 6.1 20.6 24.1 14.2 13.5 10.4 8.8 3.5 4.0Liabilities to affiliated companies 2.1 1.9 1.7 1.7 1.0 1.5 3.0 2.6 1.8 1.7
Provisions 20.0 19.3 10.6 10.0 9.7 9.7 13.5 13.9 23.8 22.4of which: Provisions for pensions 9.6 9.1 4.1 4.2 4.3 4.2 5.3 5.4 11.9 11.1
Other ratios Percentage of salesAnnual result before taxes on income 4.3 4.4 5.9 7.7 2.8 2.9 3.5 3.1 5.0 5.4Annual result and depreciation 8.6 8.3 9.3 10.6 6.0 5.8 7.2 6.7 10.0 9.8Trade receivables 10.1 9.4 9.0 8.3 9.0 8.3 8.8 8.3 11.1 10.4
Percentage of the balance sheet totalSales 124.8 127.4 189.7 187.6 192.6 204.4 164.8 170.9 101.0 102.2Annual result and interest paid 5.8 5.6 11.0 13.8 5.4 5.6 5.9 5.2 5.6 5.6
Percentage of liabilities and provisions less cashAnnual result and depreciation 22.7 22.5 29.7 32.8 22.1 23.7 23.1 23.1 22.3 21.9
Percentage of fixed assetsLong-term equity and liabilities 118.1 118.0 123.9 130.4 132.2 134.6 131.3 133.7 112.4 111.6
Percentage of short-term liabilitiesCash resources and short-term receivables 131.1 131.6 117.4 122.9 111.4 115.5 128.4 129.8 135.4 134.7Cash resources, short-term receivables and inventories 166.7 165.0 144.6 153.0 150.9 153.8 169.0 172.2 168.3 163.5
Percentage of cost of materialsTrade payables 10.9 9.8 13.7 14.8 13.9 12.7 10.4 9.2 10.6 9.7
Memo item:Balance sheet total in € billion 4.09 4.12 0.05 0.05 0.27 0.25 1.08 1.07 2.70 2.75Sales in € billion 5.11 5.25 0.09 0.09 0.51 0.52 1.78 1.83 2.73 2.81Number of enterprises 289 289 91 91 100 100 76 76 22 22

Deutsche BundesbankFinancial statement statistics (ratios - provisional data)
May 202143
I. Enterprises by economic sector
cont'd: 4.f) Printing and reproduction of recorded media
cont'd: All legal formsEnterprises with sales of ... € million
Total Less than 2 2 but less than 10 10 but less than 50 50 and moreQuartile Cylindered sample 2018/2019value 2018 2019 2018 2019 2018 2019 2018 2019 2018 2019Of the enterprises captured …
Ratios ... % had a ratio of less than …Percentage of gross revenue
Cost of materials 25 29.2 30.0 19.6 16.2 32.3 33.8 39.1 38.1 43.5 42.1 50 41.0 41.3 32.2 30.5 40.6 42.0 51.0 48.9 58.7 59.2 75 52.6 53.4 43.0 42.1 48.9 48.1 58.2 59.4 75.6 73.9
Personnel expenses 25 22.4 22.2 23.2 25.1 25.4 25.4 21.7 21.7 12.2 11.7 50 31.1 31.5 37.1 35.3 32.7 32.2 26.5 27.4 20.0 18.3 75 38.5 39.3 45.3 43.5 38.7 39.0 35.2 35.5 25.5 26.7
Depreciation 25 1.9 1.8 1.4 1.3 1.6 1.7 2.3 2.4 3.3 3.2 50 3.6 3.5 2.9 2.9 3.2 3.3 4.0 3.9 5.0 4.7 75 5.8 5.5 5.0 5.4 5.8 5.4 6.5 6.0 6.2 6.1
Annual result 25 0.0 - 0.1 0.3 0.1 0.0 0.2 0.0 - 1.6 - 1.0 - 0.8 50 2.0 2.0 2.7 3.0 1.7 2.0 1.8 1.1 1.5 2.4 75 5.0 5.6 7.9 9.3 4.4 4.5 4.1 4.8 7.9 6.2
Percentage of the balance sheet totalTangible fixed assets 25 12.0 13.3 7.8 7.3 11.0 11.4 22.2 20.7 17.1 19.0
50 33.8 31.6 28.7 24.9 33.3 30.0 38.4 35.3 40.3 40.2 75 54.1 52.9 47.2 46.9 56.2 55.3 59.9 54.0 60.4 53.1
Inventories 25 4.6 4.6 1.2 1.2 7.0 6.9 6.8 6.0 4.0 5.7 50 10.9 11.8 6.2 5.9 13.9 13.8 11.0 12.6 9.0 9.2 75 20.7 20.5 17.3 19.3 21.9 23.0 21.4 21.0 13.4 14.3
Equity 25 10.1 11.1 - 0.3 0.0 13.2 11.8 21.5 20.5 12.6 16.6 50 27.6 30.3 22.7 22.9 25.2 29.8 37.0 39.5 26.8 24.8 75 48.4 51.5 48.3 51.7 48.5 52.0 50.9 52.1 48.1 51.5
Short-term liabilities 25 21.5 20.2 19.3 16.8 23.2 20.1 20.8 21.6 26.2 29.5 50 37.4 34.5 40.0 34.7 37.2 35.2 35.1 33.4 40.4 40.0 75 57.8 54.5 70.9 62.0 55.3 56.8 44.8 45.2 62.0 59.5
Liabilities to banks 25 0.0 0.0 0.0 0.0 1.1 0.1 1.0 0.0 0.0 0.0 50 16.8 14.4 20.9 17.9 17.0 16.3 17.3 13.4 0.0 0.0 75 39.8 37.7 46.9 48.7 40.1 38.3 38.8 33.3 26.8 26.8
Percentage of salesAnnual result before taxes on income 25 0.1 0.1 0.3 0.3 0.1 0.4 0.0 - 1.2 - 0.5 - 0.8
50 2.5 2.5 3.3 3.7 2.2 2.6 2.6 1.5 2.5 3.4 75 6.1 6.9 9.6 9.8 5.7 5.3 5.7 5.3 9.0 6.9
Annual result and depreciation 25 3.3 3.1 2.4 2.9 4.4 3.8 3.8 2.2 2.9 3.9 50 6.8 6.8 7.3 7.5 6.6 6.6 6.5 5.5 8.4 8.5 75 11.8 11.3 13.7 15.0 10.2 9.2 10.1 10.4 14.0 13.4
Trade receivables 25 4.1 4.2 4.0 4.3 4.1 4.7 3.9 3.2 4.5 3.9 50 6.8 6.9 6.5 6.6 6.7 7.0 7.6 6.7 7.5 7.9 75 11.3 9.7 11.3 9.6 10.6 9.3 11.9 10.3 15.8 13.3
Percentage of the balance sheet totalAnnual result and interest paid 25 1.4 0.9 1.3 1.3 1.9 1.9 1.0 - 1.0 - 0.2 - 0.3
50 5.6 5.4 9.4 7.7 5.5 5.4 4.8 3.6 3.4 4.7 75 12.0 13.7 20.8 25.6 10.5 13.9 8.3 8.6 13.1 10.7
Percentage of liabilities and provisions less cashAnnual result and depreciation 25 6.7 6.4 1.4 5.7 5.2 8.9 12.0 5.9 2.0 1.9
50 19.9 20.0 20.7 20.2 20.0 20.9 20.0 16.3 12.4 15.7 75 42.8 41.9 53.2 65.0 48.5 40.6 34.8 40.5 30.2 34.1
Percentage of fixed assetsLong-term equity and liabilities 25 75.6 85.5 71.3 94.0 75.9 74.9 87.0 90.5 56.5 66.4
50 117.3 126.5 130.2 152.5 118.3 126.4 124.5 127.8 93.1 92.3 75 233.3 237.5 322.2 406.0 260.0 262.5 194.4 200.4 119.7 119.3
Percentage of short-term liabilitiesCash resources and short-term receivables 25 59.5 60.5 59.5 56.5 55.6 60.6 67.5 65.2 57.7 55.5
50 98.4 104.1 115.5 125.5 90.4 108.4 103.3 104.1 73.7 69.2 75 202.3 216.6 236.2 305.1 222.6 227.3 156.3 182.1 144.8 108.3
Percentage of cost of materialsTrade payables 25 6.5 5.9 5.8 5.3 6.9 6.4 6.4 5.5 5.4 5.1
50 10.2 9.9 11.7 10.7 10.4 9.7 9.7 9.3 10.4 10.0 75 18.7 16.4 23.6 26.5 17.9 18.0 15.5 12.8 17.9 15.4

Deutsche BundesbankFinancial statement statistics (ratios - provisional data)May 202144
I. Enterprises by economic sector
4.g) Manufacture of chemicals and chemical products
All legal formsEnterprises with sales of ... € million
Total Less than 2 2 but less than 10 10 but less than 50 50 and moreCylindered sample 2018/2019
Ratios 2018 2019 2018 2019 2018 2019 2018 2019 2018 2019Income statementIncome Percentage of gross revenueSales 99.4 99.9 99.7 99.8 99.6 100.0 99.4 99.9 99.4 99.9Change in finished goods 0.6 0.1 0.3 0.2 0.4 0.0 0.6 0.1 0.6 0.1Interest and similar income 0.8 1.2 0.3 0.3 0.2 0.2 0.1 0.2 0.9 1.3Other income 6.4 8.7 3.1 3.0 2.7 2.8 1.7 1.6 6.7 9.2
of which: Income from long-term equity investments 3.0 4.5 0.0 0.0 0.3 0.4 0.2 0.2 3.2 4.8Total income 107.3 110.0 103.4 103.3 102.9 103.0 101.8 101.8 107.6 110.5
ExpensesCost of materials 65.0 62.8 37.7 34.6 47.8 46.7 52.8 51.7 65.7 63.5Personnel expenses 15.7 16.7 33.1 32.2 26.1 27.2 21.3 22.1 15.3 16.3Depreciation 3.6 4.2 4.0 4.1 3.3 3.3 3.7 3.6 3.6 4.2
of which: Depreciation of tangible fixed assets 3.3 3.4 4.0 4.1 3.1 3.3 3.4 3.5 3.3 3.4Interest and similar expenses 2.8 1.7 1.0 1.2 0.9 0.9 1.1 1.0 2.9 1.8Operating taxes 0.1 0.1 0.1 0.1 0.1 0.1 0.1 0.1 0.1 0.1Other expenses 15.0 18.4 24.5 25.0 19.3 19.8 18.5 19.0 14.8 18.4Total expenses before taxes on income 102.1 103.8 100.4 97.2 97.5 97.9 97.5 97.5 102.4 104.3Annual result before taxes on income 5.1 6.1 3.0 6.1 5.4 5.1 4.4 4.4 5.2 6.3Taxes on income 0.7 0.6 0.8 1.7 1.6 1.7 1.3 1.2 0.6 0.5Annual result 4.5 5.6 2.3 4.4 3.8 3.4 3.0 3.1 4.5 5.7Profit and loss transfers (parent company) 2.8 3.4 0.0 0.0 0.5 0.7 0.2 0.1 3.0 3.6Profit and loss transfers (subsidiary) 2.9 3.5 0.2 - 0.3 0.4 0.2 1.3 0.9 3.0 3.7Profit for the year 4.3 5.5 2.1 4.7 3.8 3.9 1.9 2.3 4.5 5.7
Balance sheetAssets Percentage of the balance sheet totalIntangible fixed assets 1.7 1.6 0.8 0.7 0.7 0.7 0.8 0.8 1.7 1.6Tangible fixed assets 15.1 15.2 35.0 34.8 37.5 36.3 34.3 34.8 14.4 14.5
of which: Land and buildings 3.5 3.5 15.5 15.7 20.3 18.7 12.4 12.2 3.2 3.1Inventories 8.4 8.0 15.9 14.9 21.3 19.7 18.2 17.6 8.0 7.7
of which: Finished goods and merchandise 3.6 3.4 7.8 7.0 9.3 9.6 7.7 7.7 3.5 3.3Cash 3.1 3.0 7.7 9.9 10.4 11.7 7.9 8.0 2.9 2.8Receivables 33.4 33.1 38.2 35.5 23.1 25.8 29.5 27.9 33.5 33.3
Short-term 30.4 31.3 28.8 27.2 22.3 24.2 28.2 26.5 30.5 31.5 of which:
Trade receivables 5.2 4.4 9.6 9.9 9.7 8.4 10.0 9.6 5.0 4.3Receivables from affiliated companies 23.4 24.9 14.8 12.8 10.1 13.3 15.2 14.2 23.7 25.3
Long-term 2.9 1.8 9.5 8.3 0.8 1.6 1.3 1.4 3.0 1.8of which: Loans to affiliated companies 2.8 1.6 9.4 8.3 0.4 0.8 1.1 1.1 2.8 1.6
Securities 0.3 0.4 0.4 0.3 2.9 1.7 0.5 0.3 0.3 0.4Other long-term equity investments 38.0 38.5 1.2 3.1 3.7 3.7 8.4 10.1 39.1 39.6
of which: Goodwill 1.2 1.3 0.6 0.5 0.3 0.2 1.7 1.6 1.2 1.2
CapitalEquity 38.3 37.5 48.8 48.3 47.2 45.1 39.4 39.1 38.2 37.4Liabilities 50.0 51.1 40.8 41.2 44.0 46.1 44.7 45.1 50.2 51.3
Short-term 35.2 36.1 28.2 26.9 26.5 26.2 35.0 33.3 35.2 36.2of which:Liabilities to banks 1.8 1.8 9.3 7.8 6.2 7.6 4.0 4.1 1.7 1.7Trade payables 4.1 3.8 6.8 5.2 7.1 5.6 6.8 6.3 4.0 3.7Liabilities to affiliated companies 24.5 28.3 1.5 2.3 10.0 10.0 20.4 19.1 24.7 28.7
Long-term 14.9 15.1 12.6 14.3 17.5 19.8 9.7 11.8 15.0 15.2 of which:
Liabilities to banks 2.1 2.6 9.5 10.4 11.7 9.9 4.5 4.6 2.0 2.5Liabilities to affiliated companies 2.4 2.2 1.3 1.6 4.1 8.3 4.7 6.7 2.3 2.0
Provisions 11.4 11.1 10.3 10.4 8.8 8.8 15.7 15.5 11.3 10.9of which: Provisions for pensions 6.1 6.3 5.3 5.6 3.8 3.7 8.0 8.2 6.0 6.3
Other ratios Percentage of salesAnnual result before taxes on income 5.2 6.1 3.1 6.1 5.4 5.1 4.4 4.4 5.2 6.3Annual result and depreciation 8.1 9.8 6.3 8.4 7.1 6.7 6.8 6.7 8.2 9.9Trade receivables 6.7 6.2 7.6 8.8 7.7 7.2 7.7 7.6 6.6 6.1
Percentage of the balance sheet totalSales 78.2 71.8 125.2 112.9 125.3 116.1 130.4 126.5 76.3 69.9Annual result and interest paid 5.7 5.3 4.1 6.3 5.9 5.0 5.4 5.2 5.7 5.3
Percentage of liabilities and provisions less cashAnnual result and depreciation 10.8 11.8 18.0 22.8 20.9 18.0 16.8 16.1 10.6 11.6
Percentage of fixed assetsLong-term equity and liabilities 102.7 103.1 143.6 145.0 158.4 160.9 126.7 125.0 102.0 102.4
Percentage of short-term liabilitiesCash resources and short-term receivables 96.0 96.1 130.8 139.0 132.4 141.6 104.4 104.1 95.6 95.7Cash resources, short-term receivables and inventories 119.8 118.4 187.4 194.6 212.9 216.8 156.3 156.9 118.4 116.9
Percentage of cost of materialsTrade payables 8.0 8.5 14.3 13.3 11.8 10.3 9.8 9.6 7.9 8.4
Memo item:Balance sheet total in € billion 150.16 157.56 0.03 0.04 0.52 0.56 4.65 4.86 144.96 152.11Sales in € billion 117.40 113.13 0.04 0.04 0.65 0.65 6.07 6.14 110.64 106.30Number of enterprises 640 640 32 32 103 103 239 239 266 266
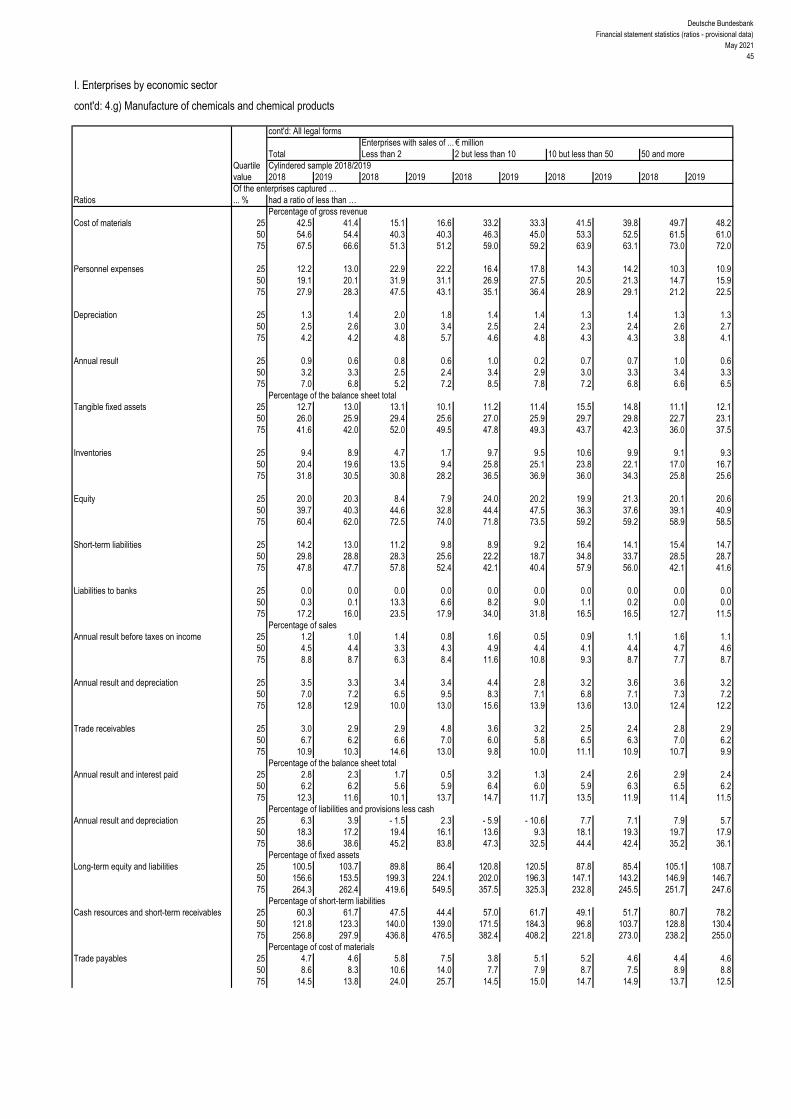
Deutsche BundesbankFinancial statement statistics (ratios - provisional data)
May 202145
I. Enterprises by economic sector
cont'd: 4.g) Manufacture of chemicals and chemical products
cont'd: All legal formsEnterprises with sales of ... € million
Total Less than 2 2 but less than 10 10 but less than 50 50 and moreQuartile Cylindered sample 2018/2019value 2018 2019 2018 2019 2018 2019 2018 2019 2018 2019Of the enterprises captured …
Ratios ... % had a ratio of less than …Percentage of gross revenue
Cost of materials 25 42.5 41.4 15.1 16.6 33.2 33.3 41.5 39.8 49.7 48.2 50 54.6 54.4 40.3 40.3 46.3 45.0 53.3 52.5 61.5 61.0 75 67.5 66.6 51.3 51.2 59.0 59.2 63.9 63.1 73.0 72.0
Personnel expenses 25 12.2 13.0 22.9 22.2 16.4 17.8 14.3 14.2 10.3 10.9 50 19.1 20.1 31.9 31.1 26.9 27.5 20.5 21.3 14.7 15.9 75 27.9 28.3 47.5 43.1 35.1 36.4 28.9 29.1 21.2 22.5
Depreciation 25 1.3 1.4 2.0 1.8 1.4 1.4 1.3 1.4 1.3 1.3 50 2.5 2.6 3.0 3.4 2.5 2.4 2.3 2.4 2.6 2.7 75 4.2 4.2 4.8 5.7 4.6 4.8 4.3 4.3 3.8 4.1
Annual result 25 0.9 0.6 0.8 0.6 1.0 0.2 0.7 0.7 1.0 0.6 50 3.2 3.3 2.5 2.4 3.4 2.9 3.0 3.3 3.4 3.3 75 7.0 6.8 5.2 7.2 8.5 7.8 7.2 6.8 6.6 6.5
Percentage of the balance sheet totalTangible fixed assets 25 12.7 13.0 13.1 10.1 11.2 11.4 15.5 14.8 11.1 12.1
50 26.0 25.9 29.4 25.6 27.0 25.9 29.7 29.8 22.7 23.1 75 41.6 42.0 52.0 49.5 47.8 49.3 43.7 42.3 36.0 37.5
Inventories 25 9.4 8.9 4.7 1.7 9.7 9.5 10.6 9.9 9.1 9.3 50 20.4 19.6 13.5 9.4 25.8 25.1 23.8 22.1 17.0 16.7 75 31.8 30.5 30.8 28.2 36.5 36.9 36.0 34.3 25.8 25.6
Equity 25 20.0 20.3 8.4 7.9 24.0 20.2 19.9 21.3 20.1 20.6 50 39.7 40.3 44.6 32.8 44.4 47.5 36.3 37.6 39.1 40.9 75 60.4 62.0 72.5 74.0 71.8 73.5 59.2 59.2 58.9 58.5
Short-term liabilities 25 14.2 13.0 11.2 9.8 8.9 9.2 16.4 14.1 15.4 14.7 50 29.8 28.8 28.3 25.6 22.2 18.7 34.8 33.7 28.5 28.7 75 47.8 47.7 57.8 52.4 42.1 40.4 57.9 56.0 42.1 41.6
Liabilities to banks 25 0.0 0.0 0.0 0.0 0.0 0.0 0.0 0.0 0.0 0.0 50 0.3 0.1 13.3 6.6 8.2 9.0 1.1 0.2 0.0 0.0 75 17.2 16.0 23.5 17.9 34.0 31.8 16.5 16.5 12.7 11.5
Percentage of salesAnnual result before taxes on income 25 1.2 1.0 1.4 0.8 1.6 0.5 0.9 1.1 1.6 1.1
50 4.5 4.4 3.3 4.3 4.9 4.4 4.1 4.4 4.7 4.6 75 8.8 8.7 6.3 8.4 11.6 10.8 9.3 8.7 7.7 8.7
Annual result and depreciation 25 3.5 3.3 3.4 3.4 4.4 2.8 3.2 3.6 3.6 3.2 50 7.0 7.2 6.5 9.5 8.3 7.1 6.8 7.1 7.3 7.2 75 12.8 12.9 10.0 13.0 15.6 13.9 13.6 13.0 12.4 12.2
Trade receivables 25 3.0 2.9 2.9 4.8 3.6 3.2 2.5 2.4 2.8 2.9 50 6.7 6.2 6.6 7.0 6.0 5.8 6.5 6.3 7.0 6.2 75 10.9 10.3 14.6 13.0 9.8 10.0 11.1 10.9 10.7 9.9
Percentage of the balance sheet totalAnnual result and interest paid 25 2.8 2.3 1.7 0.5 3.2 1.3 2.4 2.6 2.9 2.4
50 6.2 6.2 5.6 5.9 6.4 6.0 5.9 6.3 6.5 6.2 75 12.3 11.6 10.1 13.7 14.7 11.7 13.5 11.9 11.4 11.5
Percentage of liabilities and provisions less cashAnnual result and depreciation 25 6.3 3.9 - 1.5 2.3 - 5.9 - 10.6 7.7 7.1 7.9 5.7
50 18.3 17.2 19.4 16.1 13.6 9.3 18.1 19.3 19.7 17.9 75 38.6 38.6 45.2 83.8 47.3 32.5 44.4 42.4 35.2 36.1
Percentage of fixed assetsLong-term equity and liabilities 25 100.5 103.7 89.8 86.4 120.8 120.5 87.8 85.4 105.1 108.7
50 156.6 153.5 199.3 224.1 202.0 196.3 147.1 143.2 146.9 146.7 75 264.3 262.4 419.6 549.5 357.5 325.3 232.8 245.5 251.7 247.6
Percentage of short-term liabilitiesCash resources and short-term receivables 25 60.3 61.7 47.5 44.4 57.0 61.7 49.1 51.7 80.7 78.2
50 121.8 123.3 140.0 139.0 171.5 184.3 96.8 103.7 128.8 130.4 75 256.8 297.9 436.8 476.5 382.4 408.2 221.8 273.0 238.2 255.0
Percentage of cost of materialsTrade payables 25 4.7 4.6 5.8 7.5 3.8 5.1 5.2 4.6 4.4 4.6
50 8.6 8.3 10.6 14.0 7.7 7.9 8.7 7.5 8.9 8.8 75 14.5 13.8 24.0 25.7 14.5 15.0 14.7 14.9 13.7 12.5
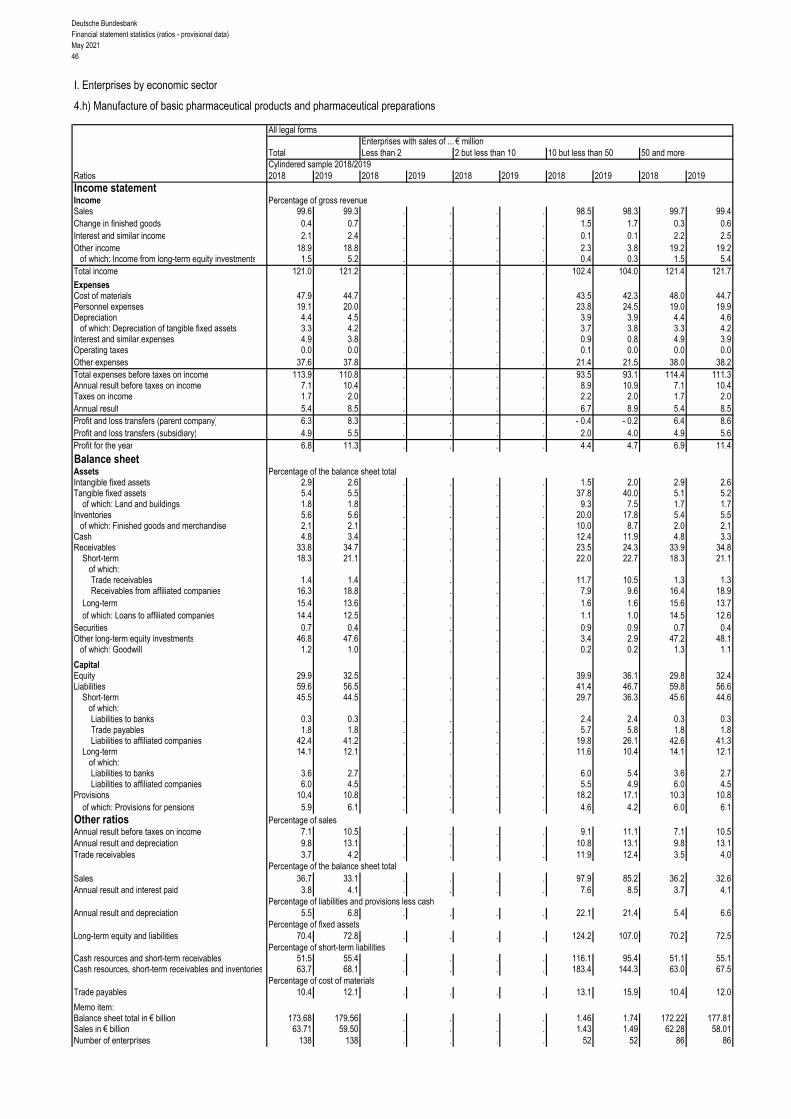
Deutsche BundesbankFinancial statement statistics (ratios - provisional data)May 202146
I. Enterprises by economic sector
4.h) Manufacture of basic pharmaceutical products and pharmaceutical preparations
All legal formsEnterprises with sales of ... € million
Total Less than 2 2 but less than 10 10 but less than 50 50 and moreCylindered sample 2018/2019
Ratios 2018 2019 2018 2019 2018 2019 2018 2019 2018 2019Income statementIncome Percentage of gross revenueSales 99.6 99.3 . . . . 98.5 98.3 99.7 99.4Change in finished goods 0.4 0.7 . . . . 1.5 1.7 0.3 0.6Interest and similar income 2.1 2.4 . . . . 0.1 0.1 2.2 2.5Other income 18.9 18.8 . . . . 2.3 3.8 19.2 19.2
of which: Income from long-term equity investments 1.5 5.2 . . . . 0.4 0.3 1.5 5.4Total income 121.0 121.2 . . . . 102.4 104.0 121.4 121.7
ExpensesCost of materials 47.9 44.7 . . . . 43.5 42.3 48.0 44.7Personnel expenses 19.1 20.0 . . . . 23.8 24.5 19.0 19.9Depreciation 4.4 4.5 . . . . 3.9 3.9 4.4 4.6
of which: Depreciation of tangible fixed assets 3.3 4.2 . . . . 3.7 3.8 3.3 4.2Interest and similar expenses 4.9 3.8 . . . . 0.9 0.8 4.9 3.9Operating taxes 0.0 0.0 . . . . 0.1 0.0 0.0 0.0Other expenses 37.6 37.8 . . . . 21.4 21.5 38.0 38.2Total expenses before taxes on income 113.9 110.8 . . . . 93.5 93.1 114.4 111.3Annual result before taxes on income 7.1 10.4 . . . . 8.9 10.9 7.1 10.4Taxes on income 1.7 2.0 . . . . 2.2 2.0 1.7 2.0Annual result 5.4 8.5 . . . . 6.7 8.9 5.4 8.5Profit and loss transfers (parent company) 6.3 8.3 . . . . - 0.4 - 0.2 6.4 8.6Profit and loss transfers (subsidiary) 4.9 5.5 . . . . 2.0 4.0 4.9 5.6Profit for the year 6.8 11.3 . . . . 4.4 4.7 6.9 11.4
Balance sheetAssets Percentage of the balance sheet totalIntangible fixed assets 2.9 2.6 . . . . 1.5 2.0 2.9 2.6Tangible fixed assets 5.4 5.5 . . . . 37.8 40.0 5.1 5.2
of which: Land and buildings 1.8 1.8 . . . . 9.3 7.5 1.7 1.7Inventories 5.6 5.6 . . . . 20.0 17.8 5.4 5.5
of which: Finished goods and merchandise 2.1 2.1 . . . . 10.0 8.7 2.0 2.1Cash 4.8 3.4 . . . . 12.4 11.9 4.8 3.3Receivables 33.8 34.7 . . . . 23.5 24.3 33.9 34.8
Short-term 18.3 21.1 . . . . 22.0 22.7 18.3 21.1 of which:
Trade receivables 1.4 1.4 . . . . 11.7 10.5 1.3 1.3Receivables from affiliated companies 16.3 18.8 . . . . 7.9 9.6 16.4 18.9
Long-term 15.4 13.6 . . . . 1.6 1.6 15.6 13.7of which: Loans to affiliated companies 14.4 12.5 . . . . 1.1 1.0 14.5 12.6
Securities 0.7 0.4 . . . . 0.9 0.9 0.7 0.4Other long-term equity investments 46.8 47.6 . . . . 3.4 2.9 47.2 48.1
of which: Goodwill 1.2 1.0 . . . . 0.2 0.2 1.3 1.1
CapitalEquity 29.9 32.5 . . . . 39.9 36.1 29.8 32.4Liabilities 59.6 56.5 . . . . 41.4 46.7 59.8 56.6
Short-term 45.5 44.5 . . . . 29.7 36.3 45.6 44.6of which:Liabilities to banks 0.3 0.3 . . . . 2.4 2.4 0.3 0.3Trade payables 1.8 1.8 . . . . 5.7 5.8 1.8 1.8Liabilities to affiliated companies 42.4 41.2 . . . . 19.8 26.1 42.6 41.3
Long-term 14.1 12.1 . . . . 11.6 10.4 14.1 12.1 of which:
Liabilities to banks 3.6 2.7 . . . . 6.0 5.4 3.6 2.7Liabilities to affiliated companies 6.0 4.5 . . . . 5.5 4.9 6.0 4.5
Provisions 10.4 10.8 . . . . 18.2 17.1 10.3 10.8of which: Provisions for pensions 5.9 6.1 . . . . 4.6 4.2 6.0 6.1
Other ratios Percentage of salesAnnual result before taxes on income 7.1 10.5 . . . . 9.1 11.1 7.1 10.5Annual result and depreciation 9.8 13.1 . . . . 10.8 13.1 9.8 13.1Trade receivables 3.7 4.2 . . . . 11.9 12.4 3.5 4.0
Percentage of the balance sheet totalSales 36.7 33.1 . . . . 97.9 85.2 36.2 32.6Annual result and interest paid 3.8 4.1 . . . . 7.6 8.5 3.7 4.1
Percentage of liabilities and provisions less cashAnnual result and depreciation 5.5 6.8 . . . . 22.1 21.4 5.4 6.6
Percentage of fixed assetsLong-term equity and liabilities 70.4 72.8 . . . . 124.2 107.0 70.2 72.5
Percentage of short-term liabilitiesCash resources and short-term receivables 51.5 55.4 . . . . 116.1 95.4 51.1 55.1Cash resources, short-term receivables and inventories 63.7 68.1 . . . . 183.4 144.3 63.0 67.5
Percentage of cost of materialsTrade payables 10.4 12.1 . . . . 13.1 15.9 10.4 12.0
Memo item:Balance sheet total in € billion 173.68 179.56 . . . . 1.46 1.74 172.22 177.81Sales in € billion 63.71 59.50 . . . . 1.43 1.49 62.28 58.01Number of enterprises 138 138 . . . . 52 52 86 86
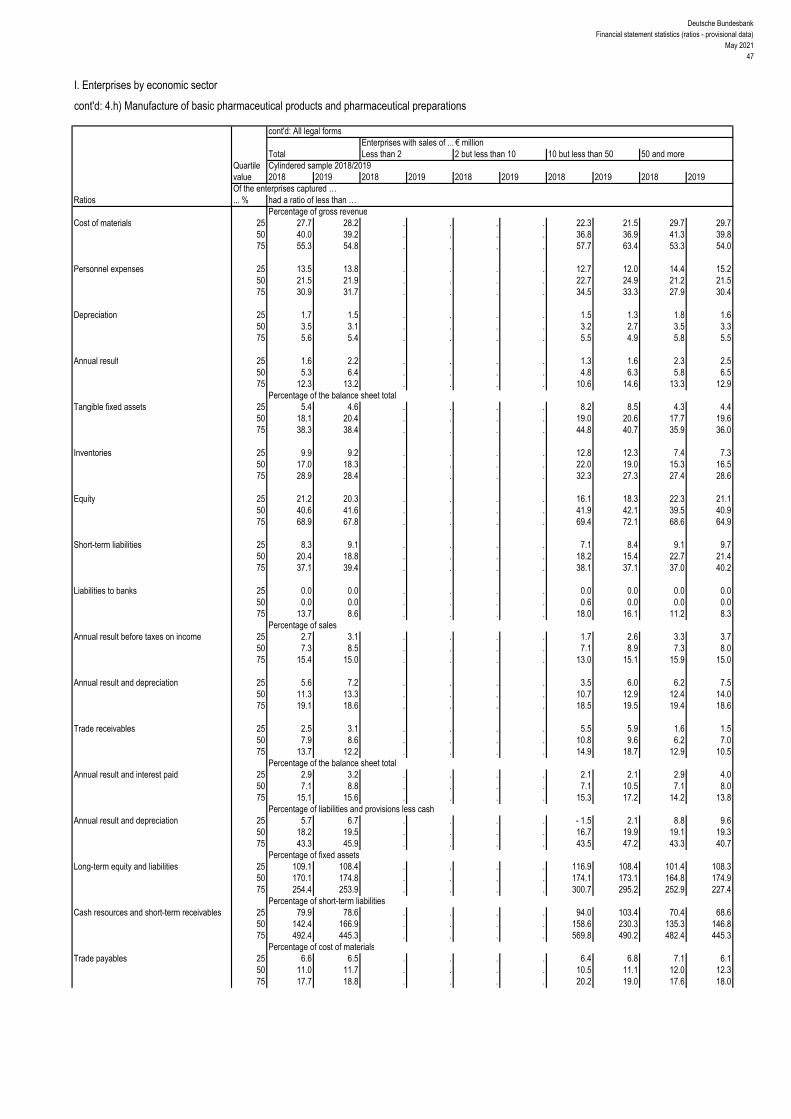
Deutsche BundesbankFinancial statement statistics (ratios - provisional data)
May 202147
I. Enterprises by economic sector
cont'd: 4.h) Manufacture of basic pharmaceutical products and pharmaceutical preparations
cont'd: All legal formsEnterprises with sales of ... € million
Total Less than 2 2 but less than 10 10 but less than 50 50 and moreQuartile Cylindered sample 2018/2019value 2018 2019 2018 2019 2018 2019 2018 2019 2018 2019Of the enterprises captured …
Ratios ... % had a ratio of less than …Percentage of gross revenue
Cost of materials 25 27.7 28.2 . . . . 22.3 21.5 29.7 29.7 50 40.0 39.2 . . . . 36.8 36.9 41.3 39.8 75 55.3 54.8 . . . . 57.7 63.4 53.3 54.0
Personnel expenses 25 13.5 13.8 . . . . 12.7 12.0 14.4 15.2 50 21.5 21.9 . . . . 22.7 24.9 21.2 21.5 75 30.9 31.7 . . . . 34.5 33.3 27.9 30.4
Depreciation 25 1.7 1.5 . . . . 1.5 1.3 1.8 1.6 50 3.5 3.1 . . . . 3.2 2.7 3.5 3.3 75 5.6 5.4 . . . . 5.5 4.9 5.8 5.5
Annual result 25 1.6 2.2 . . . . 1.3 1.6 2.3 2.5 50 5.3 6.4 . . . . 4.8 6.3 5.8 6.5 75 12.3 13.2 . . . . 10.6 14.6 13.3 12.9
Percentage of the balance sheet totalTangible fixed assets 25 5.4 4.6 . . . . 8.2 8.5 4.3 4.4
50 18.1 20.4 . . . . 19.0 20.6 17.7 19.6 75 38.3 38.4 . . . . 44.8 40.7 35.9 36.0
Inventories 25 9.9 9.2 . . . . 12.8 12.3 7.4 7.3 50 17.0 18.3 . . . . 22.0 19.0 15.3 16.5 75 28.9 28.4 . . . . 32.3 27.3 27.4 28.6
Equity 25 21.2 20.3 . . . . 16.1 18.3 22.3 21.1 50 40.6 41.6 . . . . 41.9 42.1 39.5 40.9 75 68.9 67.8 . . . . 69.4 72.1 68.6 64.9
Short-term liabilities 25 8.3 9.1 . . . . 7.1 8.4 9.1 9.7 50 20.4 18.8 . . . . 18.2 15.4 22.7 21.4 75 37.1 39.4 . . . . 38.1 37.1 37.0 40.2
Liabilities to banks 25 0.0 0.0 . . . . 0.0 0.0 0.0 0.0 50 0.0 0.0 . . . . 0.6 0.0 0.0 0.0 75 13.7 8.6 . . . . 18.0 16.1 11.2 8.3
Percentage of salesAnnual result before taxes on income 25 2.7 3.1 . . . . 1.7 2.6 3.3 3.7
50 7.3 8.5 . . . . 7.1 8.9 7.3 8.0 75 15.4 15.0 . . . . 13.0 15.1 15.9 15.0
Annual result and depreciation 25 5.6 7.2 . . . . 3.5 6.0 6.2 7.5 50 11.3 13.3 . . . . 10.7 12.9 12.4 14.0 75 19.1 18.6 . . . . 18.5 19.5 19.4 18.6
Trade receivables 25 2.5 3.1 . . . . 5.5 5.9 1.6 1.5 50 7.9 8.6 . . . . 10.8 9.6 6.2 7.0 75 13.7 12.2 . . . . 14.9 18.7 12.9 10.5
Percentage of the balance sheet totalAnnual result and interest paid 25 2.9 3.2 . . . . 2.1 2.1 2.9 4.0
50 7.1 8.8 . . . . 7.1 10.5 7.1 8.0 75 15.1 15.6 . . . . 15.3 17.2 14.2 13.8
Percentage of liabilities and provisions less cashAnnual result and depreciation 25 5.7 6.7 . . . . - 1.5 2.1 8.8 9.6
50 18.2 19.5 . . . . 16.7 19.9 19.1 19.3 75 43.3 45.9 . . . . 43.5 47.2 43.3 40.7
Percentage of fixed assetsLong-term equity and liabilities 25 109.1 108.4 . . . . 116.9 108.4 101.4 108.3
50 170.1 174.8 . . . . 174.1 173.1 164.8 174.9 75 254.4 253.9 . . . . 300.7 295.2 252.9 227.4
Percentage of short-term liabilitiesCash resources and short-term receivables 25 79.9 78.6 . . . . 94.0 103.4 70.4 68.6
50 142.4 166.9 . . . . 158.6 230.3 135.3 146.8 75 492.4 445.3 . . . . 569.8 490.2 482.4 445.3
Percentage of cost of materialsTrade payables 25 6.6 6.5 . . . . 6.4 6.8 7.1 6.1
50 11.0 11.7 . . . . 10.5 11.1 12.0 12.3 75 17.7 18.8 . . . . 20.2 19.0 17.6 18.0

Deutsche BundesbankFinancial statement statistics (ratios - provisional data)May 202148
I. Enterprises by economic sector
4.i) Manufacture of rubber and plastic products
All legal formsEnterprises with sales of ... € million
Total Less than 2 2 but less than 10 10 but less than 50 50 and moreCylindered sample 2018/2019
Ratios 2018 2019 2018 2019 2018 2019 2018 2019 2018 2019Income statementIncome Percentage of gross revenueSales 99.5 99.7 100.2 99.1 99.1 99.9 99.4 99.9 99.5 99.7Change in finished goods 0.5 0.3 - 0.2 0.9 0.9 0.1 0.6 0.1 0.5 0.3Interest and similar income 0.3 0.3 0.1 0.2 0.1 0.1 0.1 0.1 0.4 0.3Other income 3.1 2.7 3.5 2.6 2.3 2.9 1.6 1.8 3.5 2.9
of which: Income from long-term equity investments 0.9 0.6 0.0 0.0 0.3 0.3 0.2 0.3 1.2 0.8Total income 103.4 103.0 103.7 102.8 102.4 103.0 101.7 101.9 103.9 103.2
ExpensesCost of materials 58.6 57.6 42.3 40.1 48.5 47.8 53.3 52.0 60.4 59.5Personnel expenses 20.3 21.9 35.5 35.5 29.0 30.2 24.1 25.5 18.9 20.6Depreciation 3.3 3.7 3.3 3.1 3.0 3.1 3.4 3.8 3.2 3.7
of which: Depreciation of tangible fixed assets 3.1 3.4 3.2 3.1 2.9 3.0 3.3 3.6 3.1 3.4Interest and similar expenses 1.0 1.0 1.1 1.0 0.8 0.8 0.7 0.7 1.1 1.2Operating taxes 0.1 0.1 0.1 0.1 0.1 0.1 0.1 0.1 0.1 0.1Other expenses 14.9 15.3 19.1 19.9 16.5 17.2 15.7 16.2 14.6 15.0Total expenses before taxes on income 98.1 99.6 101.5 99.7 97.9 99.1 97.3 98.1 98.3 100.1Annual result before taxes on income 5.3 3.3 2.2 3.1 4.5 3.9 4.4 3.8 5.6 3.2Taxes on income 0.9 0.7 0.7 0.6 1.2 1.1 1.1 1.0 0.8 0.6Annual result 4.4 2.6 1.5 2.5 3.3 2.8 3.3 2.8 4.7 2.5Profit and loss transfers (parent company) 0.2 0.3 0.0 0.0 0.0 0.0 0.2 0.3 0.2 0.4Profit and loss transfers (subsidiary) 0.9 0.8 0.0 - 0.1 0.1 0.4 0.7 0.7 1.1 0.9Profit for the year 3.7 2.1 1.5 2.6 3.2 2.4 2.9 2.4 3.9 2.0
Balance sheetAssets Percentage of the balance sheet totalIntangible fixed assets 1.0 1.0 0.3 0.2 0.7 0.8 0.7 0.7 1.1 1.1Tangible fixed assets 27.8 29.4 33.4 33.0 30.8 31.7 34.2 34.3 26.2 28.1
of which: Land and buildings 9.7 10.3 11.8 11.6 12.1 11.5 13.7 13.6 8.7 9.5Inventories 20.9 20.7 29.1 31.9 29.7 28.5 25.6 25.2 19.5 19.4
of which: Finished goods and merchandise 8.8 8.6 15.2 16.1 13.0 13.1 10.5 10.2 8.3 8.0Cash 4.2 4.8 5.4 5.7 9.8 10.3 6.9 7.8 3.4 3.8Receivables 33.4 30.7 27.3 24.7 25.7 25.4 26.7 25.9 35.2 32.0
Short-term 30.4 27.9 26.4 23.9 24.7 24.4 24.5 23.7 31.9 29.0 of which:
Trade receivables 10.1 9.5 13.7 11.1 13.3 12.3 12.6 11.8 9.4 8.8Receivables from affiliated companies 17.8 15.9 6.0 5.4 8.3 8.6 8.9 8.8 20.1 17.9
Long-term 3.0 2.8 0.9 0.8 1.0 0.9 2.2 2.2 3.3 3.0of which: Loans to affiliated companies 2.8 2.5 0.0 0.0 0.3 0.2 1.9 1.9 3.0 2.8
Securities 1.0 0.2 1.2 1.1 0.7 0.7 0.4 0.3 1.2 0.1Other long-term equity investments 11.3 13.0 2.8 2.7 2.0 2.1 5.1 5.5 13.0 15.2
of which: Goodwill 0.5 0.4 1.8 1.7 0.2 0.5 0.4 0.3 0.5 0.4
CapitalEquity 37.6 38.9 29.7 31.9 39.0 39.2 40.7 42.2 36.8 38.1Liabilities 48.2 45.7 62.5 60.0 52.3 52.5 51.3 49.8 47.4 44.5
Short-term 35.2 32.3 45.3 43.9 36.9 36.7 36.2 35.4 34.9 31.4of which:Liabilities to banks 4.5 5.1 14.7 14.9 9.2 9.6 8.2 8.1 3.5 4.2Trade payables 6.7 6.5 12.0 11.3 8.2 7.7 7.4 6.7 6.5 6.4Liabilities to affiliated companies 19.1 15.6 5.9 6.3 10.0 10.9 14.7 14.7 20.5 16.0
Long-term 13.0 13.4 17.2 16.1 15.4 15.8 15.1 14.4 12.5 13.1 of which:
Liabilities to banks 8.2 8.5 13.0 11.3 10.4 10.2 9.8 9.5 7.7 8.1Liabilities to affiliated companies 4.5 4.5 2.6 2.3 4.1 4.3 4.5 4.1 4.5 4.6
Provisions 14.1 15.3 7.7 8.1 8.5 8.3 7.9 7.9 15.7 17.4of which: Provisions for pensions 7.5 8.1 3.3 3.7 3.6 3.8 2.3 2.4 8.9 9.7
Other ratios Percentage of salesAnnual result before taxes on income 5.3 3.3 2.2 3.1 4.6 3.9 4.4 3.8 5.6 3.2Annual result and depreciation 7.7 6.3 4.8 5.6 6.4 5.9 6.7 6.5 8.0 6.3Trade receivables 7.0 6.6 7.6 6.0 7.8 7.5 7.8 7.5 6.7 6.3
Percentage of the balance sheet totalSales 144.6 144.2 180.0 185.1 169.8 164.9 161.2 157.1 139.8 140.3Annual result and interest paid 7.9 5.3 4.7 6.4 7.0 5.9 6.5 5.5 8.3 5.2
Percentage of liabilities and provisions less cashAnnual result and depreciation 19.1 16.2 13.3 16.7 21.2 19.2 20.7 20.5 18.8 15.2
Percentage of fixed assetsLong-term equity and liabilities 132.0 130.6 133.8 139.3 166.8 164.5 136.4 137.7 130.1 128.2
Percentage of short-term liabilitiesCash resources and short-term receivables 98.7 101.3 72.4 69.3 94.9 96.2 87.0 89.5 101.8 104.8Cash resources, short-term receivables and inventories 158.2 165.4 136.5 141.9 175.6 173.8 157.8 160.6 157.7 166.5
Percentage of cost of materialsTrade payables 7.9 7.8 15.9 15.0 9.9 9.7 8.5 8.2 7.7 7.6
Memo item:Balance sheet total in € billion 33.77 33.28 0.04 0.04 0.84 0.87 6.20 6.31 26.68 26.07Sales in € billion 48.82 48.00 0.08 0.08 1.43 1.43 10.00 9.91 37.31 36.59Number of enterprises 948 948 66 66 260 260 408 408 214 214
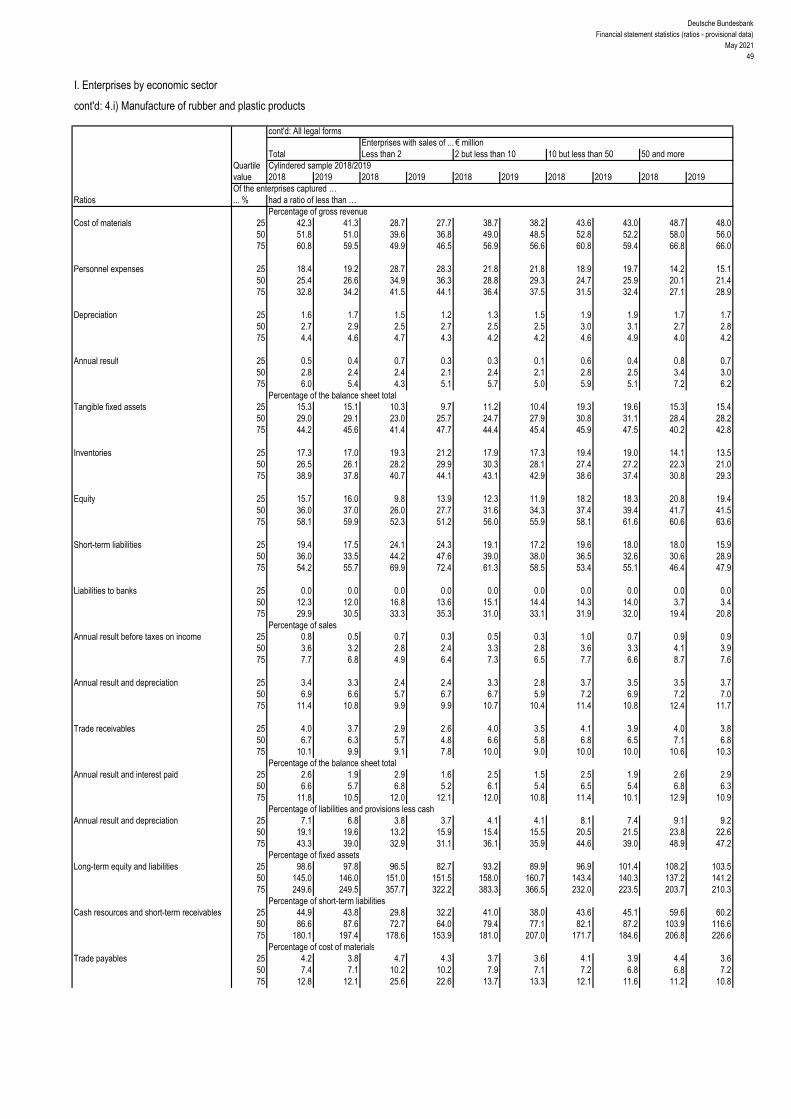
Deutsche BundesbankFinancial statement statistics (ratios - provisional data)
May 202149
I. Enterprises by economic sector
cont'd: 4.i) Manufacture of rubber and plastic products
cont'd: All legal formsEnterprises with sales of ... € million
Total Less than 2 2 but less than 10 10 but less than 50 50 and moreQuartile Cylindered sample 2018/2019value 2018 2019 2018 2019 2018 2019 2018 2019 2018 2019Of the enterprises captured …
Ratios ... % had a ratio of less than …Percentage of gross revenue
Cost of materials 25 42.3 41.3 28.7 27.7 38.7 38.2 43.6 43.0 48.7 48.0 50 51.8 51.0 39.6 36.8 49.0 48.5 52.8 52.2 58.0 56.0 75 60.8 59.5 49.9 46.5 56.9 56.6 60.8 59.4 66.8 66.0
Personnel expenses 25 18.4 19.2 28.7 28.3 21.8 21.8 18.9 19.7 14.2 15.1 50 25.4 26.6 34.9 36.3 28.8 29.3 24.7 25.9 20.1 21.4 75 32.8 34.2 41.5 44.1 36.4 37.5 31.5 32.4 27.1 28.9
Depreciation 25 1.6 1.7 1.5 1.2 1.3 1.5 1.9 1.9 1.7 1.7 50 2.7 2.9 2.5 2.7 2.5 2.5 3.0 3.1 2.7 2.8 75 4.4 4.6 4.7 4.3 4.2 4.2 4.6 4.9 4.0 4.2
Annual result 25 0.5 0.4 0.7 0.3 0.3 0.1 0.6 0.4 0.8 0.7 50 2.8 2.4 2.4 2.1 2.4 2.1 2.8 2.5 3.4 3.0 75 6.0 5.4 4.3 5.1 5.7 5.0 5.9 5.1 7.2 6.2
Percentage of the balance sheet totalTangible fixed assets 25 15.3 15.1 10.3 9.7 11.2 10.4 19.3 19.6 15.3 15.4
50 29.0 29.1 23.0 25.7 24.7 27.9 30.8 31.1 28.4 28.2 75 44.2 45.6 41.4 47.7 44.4 45.4 45.9 47.5 40.2 42.8
Inventories 25 17.3 17.0 19.3 21.2 17.9 17.3 19.4 19.0 14.1 13.5 50 26.5 26.1 28.2 29.9 30.3 28.1 27.4 27.2 22.3 21.0 75 38.9 37.8 40.7 44.1 43.1 42.9 38.6 37.4 30.8 29.3
Equity 25 15.7 16.0 9.8 13.9 12.3 11.9 18.2 18.3 20.8 19.4 50 36.0 37.0 26.0 27.7 31.6 34.3 37.4 39.4 41.7 41.5 75 58.1 59.9 52.3 51.2 56.0 55.9 58.1 61.6 60.6 63.6
Short-term liabilities 25 19.4 17.5 24.1 24.3 19.1 17.2 19.6 18.0 18.0 15.9 50 36.0 33.5 44.2 47.6 39.0 38.0 36.5 32.6 30.6 28.9 75 54.2 55.7 69.9 72.4 61.3 58.5 53.4 55.1 46.4 47.9
Liabilities to banks 25 0.0 0.0 0.0 0.0 0.0 0.0 0.0 0.0 0.0 0.0 50 12.3 12.0 16.8 13.6 15.1 14.4 14.3 14.0 3.7 3.4 75 29.9 30.5 33.3 35.3 31.0 33.1 31.9 32.0 19.4 20.8
Percentage of salesAnnual result before taxes on income 25 0.8 0.5 0.7 0.3 0.5 0.3 1.0 0.7 0.9 0.9
50 3.6 3.2 2.8 2.4 3.3 2.8 3.6 3.3 4.1 3.9 75 7.7 6.8 4.9 6.4 7.3 6.5 7.7 6.6 8.7 7.6
Annual result and depreciation 25 3.4 3.3 2.4 2.4 3.3 2.8 3.7 3.5 3.5 3.7 50 6.9 6.6 5.7 6.7 6.7 5.9 7.2 6.9 7.2 7.0 75 11.4 10.8 9.9 9.9 10.7 10.4 11.4 10.8 12.4 11.7
Trade receivables 25 4.0 3.7 2.9 2.6 4.0 3.5 4.1 3.9 4.0 3.8 50 6.7 6.3 5.7 4.8 6.6 5.8 6.8 6.5 7.1 6.8 75 10.1 9.9 9.1 7.8 10.0 9.0 10.0 10.0 10.6 10.3
Percentage of the balance sheet totalAnnual result and interest paid 25 2.6 1.9 2.9 1.6 2.5 1.5 2.5 1.9 2.6 2.9
50 6.6 5.7 6.8 5.2 6.1 5.4 6.5 5.4 6.8 6.3 75 11.8 10.5 12.0 12.1 12.0 10.8 11.4 10.1 12.9 10.9
Percentage of liabilities and provisions less cashAnnual result and depreciation 25 7.1 6.8 3.8 3.7 4.1 4.1 8.1 7.4 9.1 9.2
50 19.1 19.6 13.2 15.9 15.4 15.5 20.5 21.5 23.8 22.6 75 43.3 39.0 32.9 31.1 36.1 35.9 44.6 39.0 48.9 47.2
Percentage of fixed assetsLong-term equity and liabilities 25 98.6 97.8 96.5 82.7 93.2 89.9 96.9 101.4 108.2 103.5
50 145.0 146.0 151.0 151.5 158.0 160.7 143.4 140.3 137.2 141.2 75 249.6 249.5 357.7 322.2 383.3 366.5 232.0 223.5 203.7 210.3
Percentage of short-term liabilitiesCash resources and short-term receivables 25 44.9 43.8 29.8 32.2 41.0 38.0 43.6 45.1 59.6 60.2
50 86.6 87.6 72.7 64.0 79.4 77.1 82.1 87.2 103.9 116.6 75 180.1 197.4 178.6 153.9 181.0 207.0 171.7 184.6 206.8 226.6
Percentage of cost of materialsTrade payables 25 4.2 3.8 4.7 4.3 3.7 3.6 4.1 3.9 4.4 3.6
50 7.4 7.1 10.2 10.2 7.9 7.1 7.2 6.8 6.8 7.2 75 12.8 12.1 25.6 22.6 13.7 13.3 12.1 11.6 11.2 10.8

Deutsche BundesbankFinancial statement statistics (ratios - provisional data)May 202150
I. Enterprises by economic sector
4.j) Manufacture of other non-metallic mineral products
All legal formsEnterprises with sales of ... € million
Total Less than 2 2 but less than 10 10 but less than 50 50 and moreCylindered sample 2018/2019
Ratios 2018 2019 2018 2019 2018 2019 2018 2019 2018 2019Income statementIncome Percentage of gross revenueSales 99.5 99.3 94.5 97.7 98.9 98.5 99.8 99.8 99.5 99.2Change in finished goods 0.5 0.7 5.5 2.3 1.1 1.5 0.2 0.2 0.5 0.8Interest and similar income 0.4 0.4 0.2 0.1 0.1 0.1 0.1 0.2 0.5 0.5Other income 3.9 4.7 3.4 3.1 2.2 2.6 3.2 2.5 4.3 5.5
of which: Income from long-term equity investments 1.2 1.5 0.7 0.4 0.3 0.3 0.6 0.5 1.5 1.9Total income 104.3 105.1 103.6 103.2 102.3 102.7 103.4 102.7 104.7 106.0
ExpensesCost of materials 50.2 50.1 42.4 43.2 49.7 49.4 51.2 50.7 49.9 50.0Personnel expenses 22.6 22.4 30.7 28.3 26.5 26.5 24.4 24.6 21.7 21.5Depreciation 4.6 4.1 4.7 4.6 3.4 3.4 4.0 4.1 4.8 4.2
of which: Depreciation of tangible fixed assets 4.0 4.0 4.7 4.4 3.3 3.3 3.8 3.9 4.0 4.0Interest and similar expenses 1.9 1.8 1.1 1.0 0.8 0.8 0.8 0.8 2.2 2.2Operating taxes 0.1 0.1 0.2 0.2 0.1 0.1 0.1 0.1 0.1 0.1Other expenses 19.8 20.8 20.8 19.9 17.1 16.9 17.8 17.4 20.6 22.1Total expenses before taxes on income 99.1 99.4 99.9 97.2 97.6 97.2 98.3 97.7 99.5 100.1Annual result before taxes on income 5.2 5.6 3.6 6.0 4.7 5.5 5.1 5.0 5.2 5.9Taxes on income 1.0 1.1 0.8 1.2 1.0 1.1 1.1 1.1 1.0 1.1Annual result 4.2 4.5 2.8 4.8 3.7 4.5 4.0 3.9 4.2 4.8Profit and loss transfers (parent company) 1.1 0.9 0.0 0.0 0.0 - 0.1 0.1 0.2 1.5 1.1Profit and loss transfers (subsidiary) 1.4 2.1 0.1 - 0.1 0.5 0.5 0.9 0.9 1.6 2.6Profit for the year 3.9 3.3 2.7 4.9 3.1 3.9 3.2 3.2 4.1 3.3
Balance sheetAssets Percentage of the balance sheet totalIntangible fixed assets 0.4 0.5 0.2 0.2 0.5 0.6 0.7 0.7 0.4 0.5Tangible fixed assets 25.4 25.9 36.8 34.2 37.5 36.3 35.0 35.5 23.2 23.9
of which: Land and buildings 9.1 9.1 9.8 8.3 16.6 15.1 12.3 12.8 8.2 8.3Inventories 14.1 14.3 25.8 27.8 23.0 23.8 22.9 22.7 12.2 12.5
of which: Finished goods and merchandise 6.0 6.2 9.2 9.6 9.3 8.9 9.3 9.4 5.3 5.5Cash 5.6 6.5 9.1 13.2 11.5 12.4 8.5 8.9 4.9 5.9Receivables 30.5 30.5 23.6 20.5 24.8 23.4 22.9 22.1 32.1 32.2
Short-term 28.3 27.7 18.5 16.4 22.9 21.9 22.0 21.0 29.6 29.1 of which:
Trade receivables 5.0 4.8 7.9 8.9 11.8 10.8 8.9 8.4 4.1 3.9Receivables from affiliated companies 21.5 21.1 8.0 4.4 8.2 8.2 10.2 9.9 23.9 23.5
Long-term 2.3 2.7 5.1 4.1 1.8 1.5 0.8 1.1 2.5 3.1of which: Loans to affiliated companies 2.1 2.6 5.0 4.1 1.2 0.8 0.5 0.6 2.4 3.0
Securities 0.2 0.4 0.1 0.1 0.5 0.6 0.7 0.9 0.2 0.3Other long-term equity investments 23.5 21.7 3.9 3.6 1.9 2.6 8.9 8.9 26.9 24.7
of which: Goodwill 0.2 0.4 1.3 1.1 0.1 0.1 0.1 0.1 0.3 0.5
CapitalEquity 45.3 44.9 25.5 25.8 34.7 35.4 40.3 41.1 46.6 45.9Liabilities 36.2 36.0 68.8 68.7 51.9 51.8 46.7 45.9 33.7 33.7
Short-term 26.4 26.4 48.1 50.8 37.0 36.8 35.6 33.6 24.4 24.8of which:Liabilities to banks 2.8 2.4 10.5 7.6 8.3 6.6 5.3 4.5 2.2 1.9Trade payables 4.7 4.4 6.5 9.0 7.0 6.2 5.9 5.6 4.5 4.1Liabilities to affiliated companies 13.3 13.8 13.7 15.3 11.5 11.6 17.0 16.1 12.8 13.4
Long-term 9.8 9.6 20.7 17.9 14.9 15.0 11.1 12.3 9.3 8.9 of which:
Liabilities to banks 4.6 4.7 14.1 13.7 11.7 12.1 5.9 6.0 4.1 4.2Liabilities to affiliated companies 5.0 4.7 5.1 2.0 2.5 2.3 4.6 5.7 5.2 4.6
Provisions 18.5 19.0 5.5 5.5 13.4 12.7 12.8 12.8 19.7 20.4of which: Provisions for pensions 10.6 10.8 1.5 1.3 3.9 3.8 4.4 4.5 11.9 12.1
Other ratios Percentage of salesAnnual result before taxes on income 5.2 5.7 3.9 6.1 4.8 5.6 5.1 5.0 5.2 5.9Annual result and depreciation 8.8 8.8 8.0 9.6 7.2 8.0 8.0 8.0 9.1 9.0Trade receivables 5.5 5.2 7.4 7.3 7.9 7.5 6.2 5.9 5.1 4.9
Percentage of the balance sheet totalSales 91.6 90.8 107.1 121.0 148.9 143.5 143.0 143.2 80.6 79.9Annual result and interest paid 5.5 5.8 4.5 7.2 6.8 7.6 6.9 6.7 5.3 5.6
Percentage of liabilities and provisions less cashAnnual result and depreciation 16.4 16.4 13.0 19.1 19.9 21.9 22.3 22.8 15.2 15.0
Percentage of fixed assetsLong-term equity and liabilities 126.8 127.8 103.7 107.1 127.6 131.7 121.6 124.0 127.6 128.4
Percentage of short-term liabilitiesCash resources and short-term receivables 128.6 130.4 57.6 58.5 94.1 94.4 86.3 89.6 141.7 142.2Cash resources, short-term receivables and inventories 181.9 184.5 111.3 113.3 156.2 159.0 150.7 157.1 191.6 192.6
Percentage of cost of materialsTrade payables 10.2 9.6 13.5 16.7 9.3 8.7 8.0 7.7 11.0 10.2
Memo item:Balance sheet total in € billion 24.79 25.95 0.07 0.07 0.63 0.67 3.64 3.74 20.46 21.46Sales in € billion 22.71 23.56 0.07 0.09 0.94 0.96 5.21 5.35 16.49 17.15Number of enterprises 585 585 72 72 172 172 226 226 115 115

Deutsche BundesbankFinancial statement statistics (ratios - provisional data)
May 202151
I. Enterprises by economic sector
cont'd: 4.j) Manufacture of other non-metallic mineral products
cont'd: All legal formsEnterprises with sales of ... € million
Total Less than 2 2 but less than 10 10 but less than 50 50 and moreQuartile Cylindered sample 2018/2019value 2018 2019 2018 2019 2018 2019 2018 2019 2018 2019Of the enterprises captured …
Ratios ... % had a ratio of less than …Percentage of gross revenue
Cost of materials 25 38.9 38.5 23.8 25.8 35.8 35.9 41.9 40.8 39.8 40.3 50 48.8 48.7 40.9 41.7 48.0 47.2 51.4 49.7 49.5 50.1 75 59.9 60.1 54.2 56.8 62.4 60.8 59.6 59.8 61.0 60.6
Personnel expenses 25 16.8 16.4 19.7 15.5 16.9 17.3 17.2 17.1 15.3 15.9 50 24.2 24.2 31.7 30.3 26.8 27.2 24.1 24.2 21.9 21.6 75 33.3 33.0 41.3 41.4 36.6 36.2 31.5 32.1 27.6 27.6
Depreciation 25 1.7 1.8 1.8 1.7 1.4 1.5 1.9 1.9 2.4 2.3 50 3.3 3.1 3.2 2.9 2.6 2.7 3.3 3.4 4.0 3.7 75 5.2 5.2 6.0 6.3 4.7 4.8 5.2 5.3 5.7 5.3
Annual result 25 0.3 1.0 0.1 1.0 0.8 1.1 0.4 1.1 - 0.3 0.3 50 3.3 3.8 1.1 4.1 3.3 3.7 3.7 3.7 3.8 3.7 75 7.2 7.7 7.0 9.0 7.0 7.2 6.7 6.6 8.9 9.4
Percentage of the balance sheet totalTangible fixed assets 25 16.0 16.7 10.3 11.4 13.7 11.8 21.2 20.3 15.4 16.7
50 32.2 32.0 36.7 29.5 27.9 29.2 37.4 37.3 28.6 28.9 75 50.0 50.1 53.5 52.8 49.1 47.5 52.7 51.6 45.5 45.4
Inventories 25 9.4 9.4 5.6 3.2 7.1 7.7 13.8 13.2 9.0 9.4 50 19.9 19.2 16.6 17.3 18.8 18.4 22.7 22.2 14.9 15.1 75 32.7 32.8 35.6 37.5 36.4 38.1 32.8 32.3 26.7 24.7
Equity 25 14.5 14.5 3.2 6.3 13.2 12.9 15.5 14.5 25.7 26.9 50 33.2 34.2 15.2 21.1 29.9 30.6 33.0 35.5 42.5 41.6 75 55.0 55.9 42.5 43.2 56.1 57.8 55.0 55.9 56.4 57.5
Short-term liabilities 25 17.4 16.7 22.0 25.4 17.2 14.4 19.1 18.4 14.0 14.7 50 34.6 31.7 47.7 49.4 36.7 36.6 35.4 33.2 23.8 24.8 75 56.5 55.4 72.1 71.1 57.5 59.7 58.2 55.7 42.8 40.0
Liabilities to banks 25 0.0 0.0 0.0 0.0 0.0 0.0 0.0 0.0 0.0 0.0 50 5.2 3.5 15.0 7.7 11.8 9.0 4.0 1.9 0.0 0.0 75 23.9 22.0 41.9 39.7 29.8 29.4 17.5 18.2 10.6 12.5
Percentage of salesAnnual result before taxes on income 25 0.4 1.2 0.1 1.0 1.2 1.4 0.6 1.3 0.0 0.6
50 4.2 4.8 1.5 4.8 4.1 4.7 4.8 4.8 4.7 4.8 75 9.0 9.4 9.2 11.6 8.1 9.4 8.8 8.7 10.4 10.8
Annual result and depreciation 25 3.5 4.3 2.9 4.5 3.6 4.0 3.7 4.5 3.2 3.9 50 7.9 8.3 6.8 8.1 7.9 8.2 8.0 7.9 8.0 8.9 75 13.4 13.9 13.0 16.9 12.5 13.2 12.9 12.9 15.6 15.2
Trade receivables 25 2.6 2.3 2.8 2.2 3.2 3.0 2.6 2.3 1.1 1.4 50 5.2 4.8 6.4 5.9 5.7 5.3 5.1 4.4 3.8 3.7 75 8.4 8.2 10.9 8.9 9.1 9.8 7.8 7.1 8.3 7.8
Percentage of the balance sheet totalAnnual result and interest paid 25 1.9 2.6 0.9 2.9 2.7 2.6 2.7 3.4 1.6 2.0
50 6.4 7.4 3.9 9.1 7.3 7.5 7.6 7.6 6.0 5.9 75 13.3 13.2 11.9 16.3 14.4 13.0 14.7 13.5 10.9 11.8
Percentage of liabilities and provisions less cashAnnual result and depreciation 25 6.1 9.3 4.9 11.2 4.7 6.4 9.1 10.8 3.8 6.5
50 19.7 21.9 12.8 19.0 19.7 20.8 24.6 25.4 16.8 20.4 75 44.3 50.6 33.1 61.6 46.3 50.7 47.7 52.2 35.1 40.6
Percentage of fixed assetsLong-term equity and liabilities 25 79.5 85.9 51.7 73.5 84.0 91.5 72.1 82.4 98.9 99.4
50 126.9 131.7 123.3 122.8 137.9 145.6 119.5 128.3 128.8 126.9 75 215.8 216.2 251.7 194.7 250.6 255.3 199.2 213.5 196.3 198.9
Percentage of short-term liabilitiesCash resources and short-term receivables 25 49.3 45.7 33.1 36.2 52.0 45.7 46.9 42.6 71.6 67.3
50 94.8 97.9 79.3 76.1 104.3 107.1 79.5 87.7 115.5 122.5 75 203.1 202.4 166.3 136.9 230.1 259.5 178.3 179.7 215.4 250.1
Percentage of cost of materialsTrade payables 25 4.0 4.0 3.5 2.5 3.5 3.5 3.9 3.9 5.9 5.2
50 7.6 7.1 9.5 9.9 7.1 6.4 6.7 6.6 9.2 8.1 75 12.9 12.3 22.7 31.0 12.1 10.6 11.5 10.4 14.6 13.6

Deutsche BundesbankFinancial statement statistics (ratios - provisional data)May 202152
I. Enterprises by economic sector
4.k) Manufacture of basic metals
All legal formsEnterprises with sales of ... € million
Total Less than 2 2 but less than 10 10 but less than 50 50 and moreCylindered sample 2018/2019
Ratios 2018 2019 2018 2019 2018 2019 2018 2019 2018 2019Income statementIncome Percentage of gross revenueSales 99.1 100.9 96.2 98.1 99.2 99.9 99.1 100.0 99.1 100.9Change in finished goods 0.9 - 0.9 3.8 1.9 0.8 0.1 0.9 0.0 0.9 - 0.9Interest and similar income 0.1 0.2 0.5 0.4 0.1 0.1 0.1 0.1 0.1 0.2Other income 1.7 2.5 2.8 3.6 1.6 1.6 1.4 1.7 1.7 2.6
of which: Income from long-term equity investments 0.3 0.4 0.0 0.0 0.0 0.0 0.1 0.2 0.3 0.4Total income 101.8 102.7 103.3 104.0 101.7 101.7 101.6 101.9 101.8 102.8
ExpensesCost of materials 74.5 75.6 35.9 38.2 46.5 45.2 57.5 57.0 75.7 76.9Personnel expenses 13.1 14.2 39.1 38.7 31.0 33.0 24.4 25.5 12.3 13.4Depreciation 2.5 2.8 5.0 4.7 3.3 3.1 2.9 2.9 2.5 2.8
of which: Depreciation of tangible fixed assets 2.3 2.6 5.0 4.7 3.0 3.0 2.6 2.7 2.3 2.6Interest and similar expenses 0.9 1.0 1.3 1.4 0.7 0.7 0.8 0.8 0.9 1.0Operating taxes 0.0 0.0 0.1 0.1 0.1 0.1 0.0 0.1 0.0 0.0Other expenses 8.4 8.9 19.1 18.9 16.5 16.8 13.1 13.2 8.1 8.6Total expenses before taxes on income 99.4 102.5 100.3 102.0 98.0 98.8 98.7 99.5 99.5 102.7Annual result before taxes on income 2.4 0.2 2.9 2.0 3.7 2.8 2.8 2.4 2.4 0.1Taxes on income 0.5 0.4 1.6 1.1 1.0 1.0 0.8 0.8 0.5 0.4Annual result 1.8 - 0.2 1.3 0.9 2.7 1.9 2.0 1.6 1.8 - 0.3Profit and loss transfers (parent company) 0.0 0.0 0.0 0.0 0.0 0.0 0.0 0.0 0.0 0.0Profit and loss transfers (subsidiary) 0.7 - 0.5 0.1 0.0 0.3 0.3 0.0 - 0.1 0.8 - 0.5Profit for the year 1.1 0.3 1.3 0.9 2.4 1.7 2.0 1.7 1.1 0.2
Balance sheetAssets Percentage of the balance sheet totalIntangible fixed assets 0.6 0.6 0.4 0.3 0.7 0.7 0.8 0.8 0.6 0.6Tangible fixed assets 28.6 28.1 32.0 40.3 33.7 35.0 27.2 27.1 28.6 28.1
of which: Land and buildings 7.7 7.6 10.3 8.8 13.8 14.0 9.7 9.9 7.5 7.5Inventories 28.0 25.7 16.5 15.2 29.6 29.4 30.5 30.0 27.9 25.4
of which: Finished goods and merchandise 8.0 7.8 3.8 2.8 12.2 11.9 10.3 10.7 7.8 7.6Cash 4.6 4.9 18.4 12.6 10.8 10.1 10.0 10.9 4.2 4.6Receivables 26.1 27.1 28.1 27.0 23.0 22.1 26.9 26.7 26.1 27.2
Short-term 23.7 23.7 27.7 25.6 21.2 20.2 25.6 25.5 23.6 23.6 of which:
Trade receivables 8.8 8.1 11.0 9.0 12.0 11.6 11.6 10.7 8.6 8.0Receivables from affiliated companies 12.0 13.3 12.6 11.6 5.7 4.8 10.7 11.6 12.1 13.4
Long-term 2.4 3.4 0.3 1.4 1.9 1.8 1.3 1.1 2.4 3.6of which: Loans to affiliated companies 1.2 2.3 0.0 1.1 1.1 1.1 1.0 0.8 1.2 2.4
Securities 1.0 0.9 1.8 2.1 0.1 0.4 1.1 1.0 1.0 0.9Other long-term equity investments 10.9 12.4 2.5 1.8 1.6 1.9 3.3 3.2 11.5 13.1
of which: Goodwill 0.0 0.0 1.9 1.3 0.1 0.3 0.4 0.4 0.0 0.0
CapitalEquity 37.3 37.2 34.1 26.9 42.5 42.2 41.8 43.1 37.0 36.9Liabilities 42.7 42.5 58.3 67.5 49.2 50.1 46.3 44.8 42.5 42.3
Short-term 31.6 32.6 38.6 32.3 34.3 34.8 35.4 32.7 31.4 32.6of which:Liabilities to banks 2.8 5.6 9.9 6.0 8.8 10.4 6.4 6.2 2.5 5.5Trade payables 10.5 9.8 6.7 8.7 9.0 9.2 7.9 6.7 10.6 10.0Liabilities to affiliated companies 15.1 13.8 6.0 4.4 6.8 6.6 15.6 13.9 15.2 13.9
Long-term 11.1 9.9 19.8 35.2 15.0 15.3 10.9 12.0 11.1 9.7 of which:
Liabilities to banks 4.8 4.9 14.7 20.9 10.3 10.1 4.4 4.4 4.8 4.8Liabilities to affiliated companies 5.7 4.4 4.8 12.7 3.4 3.5 5.6 7.1 5.7 4.3
Provisions 19.9 20.2 7.5 5.5 8.3 7.7 11.9 12.0 20.5 20.8of which: Provisions for pensions 10.4 11.0 3.3 2.2 3.2 3.2 6.1 6.5 10.7 11.4
Other ratios Percentage of salesAnnual result before taxes on income 2.4 0.2 3.1 2.0 3.7 2.9 2.8 2.4 2.4 0.1Annual result and depreciation 4.4 2.6 6.6 5.7 6.0 5.0 5.0 4.5 4.3 2.5Trade receivables 5.1 4.9 10.1 9.2 7.1 7.1 7.0 6.6 5.0 4.8
Percentage of the balance sheet totalSales 172.5 164.5 109.6 97.3 170.2 162.2 165.7 162.6 173.0 164.7Annual result and interest paid 4.7 1.3 3.0 2.3 5.8 4.2 4.7 4.0 4.7 1.1
Percentage of liabilities and provisions less cashAnnual result and depreciation 13.0 7.4 15.1 9.1 21.9 16.9 17.0 15.9 12.7 7.0
Percentage of fixed assetsLong-term equity and liabilities 135.5 128.1 154.4 140.2 160.1 153.0 180.4 191.2 133.4 125.4
Percentage of short-term liabilitiesCash resources and short-term receivables 89.9 88.2 119.6 118.3 93.4 87.4 103.6 114.3 88.9 86.6Cash resources, short-term receivables and inventories 178.5 167.0 162.2 165.4 179.8 171.8 189.8 206.0 177.8 164.7
Percentage of cost of materialsTrade payables 8.1 7.9 16.3 23.0 11.3 12.5 8.3 7.2 8.0 8.0
Memo item:Balance sheet total in € billion 42.27 42.49 0.03 0.03 0.28 0.29 2.33 2.30 39.62 39.86Sales in € billion 72.93 69.89 0.03 0.03 0.48 0.47 3.87 3.75 68.55 65.64Number of enterprises 424 424 25 25 78 78 141 141 180 180
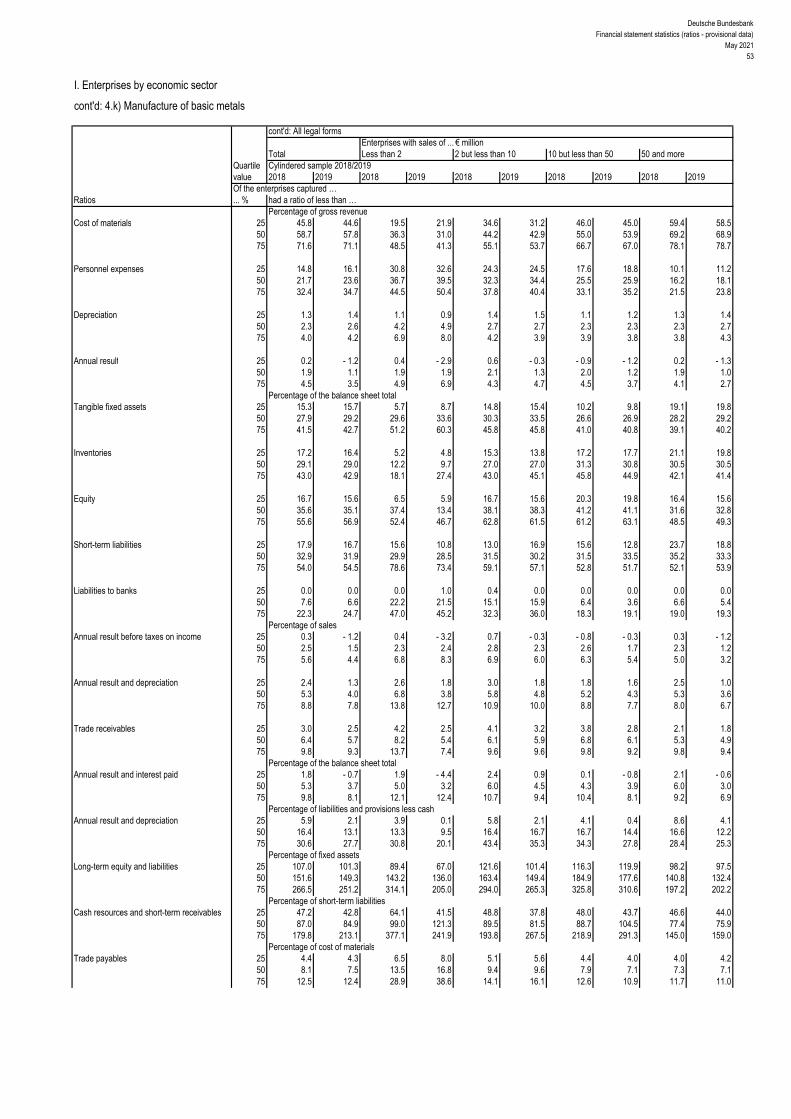
Deutsche BundesbankFinancial statement statistics (ratios - provisional data)
May 202153
I. Enterprises by economic sector
cont'd: 4.k) Manufacture of basic metals
cont'd: All legal formsEnterprises with sales of ... € million
Total Less than 2 2 but less than 10 10 but less than 50 50 and moreQuartile Cylindered sample 2018/2019value 2018 2019 2018 2019 2018 2019 2018 2019 2018 2019Of the enterprises captured …
Ratios ... % had a ratio of less than …Percentage of gross revenue
Cost of materials 25 45.8 44.6 19.5 21.9 34.6 31.2 46.0 45.0 59.4 58.5 50 58.7 57.8 36.3 31.0 44.2 42.9 55.0 53.9 69.2 68.9 75 71.6 71.1 48.5 41.3 55.1 53.7 66.7 67.0 78.1 78.7
Personnel expenses 25 14.8 16.1 30.8 32.6 24.3 24.5 17.6 18.8 10.1 11.2 50 21.7 23.6 36.7 39.5 32.3 34.4 25.5 25.9 16.2 18.1 75 32.4 34.7 44.5 50.4 37.8 40.4 33.1 35.2 21.5 23.8
Depreciation 25 1.3 1.4 1.1 0.9 1.4 1.5 1.1 1.2 1.3 1.4 50 2.3 2.6 4.2 4.9 2.7 2.7 2.3 2.3 2.3 2.7 75 4.0 4.2 6.9 8.0 4.2 3.9 3.9 3.8 3.8 4.3
Annual result 25 0.2 - 1.2 0.4 - 2.9 0.6 - 0.3 - 0.9 - 1.2 0.2 - 1.3 50 1.9 1.1 1.9 1.9 2.1 1.3 2.0 1.2 1.9 1.0 75 4.5 3.5 4.9 6.9 4.3 4.7 4.5 3.7 4.1 2.7
Percentage of the balance sheet totalTangible fixed assets 25 15.3 15.7 5.7 8.7 14.8 15.4 10.2 9.8 19.1 19.8
50 27.9 29.2 29.6 33.6 30.3 33.5 26.6 26.9 28.2 29.2 75 41.5 42.7 51.2 60.3 45.8 45.8 41.0 40.8 39.1 40.2
Inventories 25 17.2 16.4 5.2 4.8 15.3 13.8 17.2 17.7 21.1 19.8 50 29.1 29.0 12.2 9.7 27.0 27.0 31.3 30.8 30.5 30.5 75 43.0 42.9 18.1 27.4 43.0 45.1 45.8 44.9 42.1 41.4
Equity 25 16.7 15.6 6.5 5.9 16.7 15.6 20.3 19.8 16.4 15.6 50 35.6 35.1 37.4 13.4 38.1 38.3 41.2 41.1 31.6 32.8 75 55.6 56.9 52.4 46.7 62.8 61.5 61.2 63.1 48.5 49.3
Short-term liabilities 25 17.9 16.7 15.6 10.8 13.0 16.9 15.6 12.8 23.7 18.8 50 32.9 31.9 29.9 28.5 31.5 30.2 31.5 33.5 35.2 33.3 75 54.0 54.5 78.6 73.4 59.1 57.1 52.8 51.7 52.1 53.9
Liabilities to banks 25 0.0 0.0 0.0 1.0 0.4 0.0 0.0 0.0 0.0 0.0 50 7.6 6.6 22.2 21.5 15.1 15.9 6.4 3.6 6.6 5.4 75 22.3 24.7 47.0 45.2 32.3 36.0 18.3 19.1 19.0 19.3
Percentage of salesAnnual result before taxes on income 25 0.3 - 1.2 0.4 - 3.2 0.7 - 0.3 - 0.8 - 0.3 0.3 - 1.2
50 2.5 1.5 2.3 2.4 2.8 2.3 2.6 1.7 2.3 1.2 75 5.6 4.4 6.8 8.3 6.9 6.0 6.3 5.4 5.0 3.2
Annual result and depreciation 25 2.4 1.3 2.6 1.8 3.0 1.8 1.8 1.6 2.5 1.0 50 5.3 4.0 6.8 3.8 5.8 4.8 5.2 4.3 5.3 3.6 75 8.8 7.8 13.8 12.7 10.9 10.0 8.8 7.7 8.0 6.7
Trade receivables 25 3.0 2.5 4.2 2.5 4.1 3.2 3.8 2.8 2.1 1.8 50 6.4 5.7 8.2 5.4 6.1 5.9 6.8 6.1 5.3 4.9 75 9.8 9.3 13.7 7.4 9.6 9.6 9.8 9.2 9.8 9.4
Percentage of the balance sheet totalAnnual result and interest paid 25 1.8 - 0.7 1.9 - 4.4 2.4 0.9 0.1 - 0.8 2.1 - 0.6
50 5.3 3.7 5.0 3.2 6.0 4.5 4.3 3.9 6.0 3.0 75 9.8 8.1 12.1 12.4 10.7 9.4 10.4 8.1 9.2 6.9
Percentage of liabilities and provisions less cashAnnual result and depreciation 25 5.9 2.1 3.9 0.1 5.8 2.1 4.1 0.4 8.6 4.1
50 16.4 13.1 13.3 9.5 16.4 16.7 16.7 14.4 16.6 12.2 75 30.6 27.7 30.8 20.1 43.4 35.3 34.3 27.8 28.4 25.3
Percentage of fixed assetsLong-term equity and liabilities 25 107.0 101.3 89.4 67.0 121.6 101.4 116.3 119.9 98.2 97.5
50 151.6 149.3 143.2 136.0 163.4 149.4 184.9 177.6 140.8 132.4 75 266.5 251.2 314.1 205.0 294.0 265.3 325.8 310.6 197.2 202.2
Percentage of short-term liabilitiesCash resources and short-term receivables 25 47.2 42.8 64.1 41.5 48.8 37.8 48.0 43.7 46.6 44.0
50 87.0 84.9 99.0 121.3 89.5 81.5 88.7 104.5 77.4 75.9 75 179.8 213.1 377.1 241.9 193.8 267.5 218.9 291.3 145.0 159.0
Percentage of cost of materialsTrade payables 25 4.4 4.3 6.5 8.0 5.1 5.6 4.4 4.0 4.0 4.2
50 8.1 7.5 13.5 16.8 9.4 9.6 7.9 7.1 7.3 7.1 75 12.5 12.4 28.9 38.6 14.1 16.1 12.6 10.9 11.7 11.0

Deutsche BundesbankFinancial statement statistics (ratios - provisional data)May 202154
I. Enterprises by economic sector
4.l) Manufacture of fabricated metal products, except machinery and equipment
All legal formsEnterprises with sales of ... € million
Total Less than 2 2 but less than 10 10 but less than 50 50 and moreCylindered sample 2018/2019
Ratios 2018 2019 2018 2019 2018 2019 2018 2019 2018 2019Income statementIncome Percentage of gross revenueSales 99.5 99.2 98.0 97.8 98.2 98.8 97.7 99.1 100.5 99.3Change in finished goods 0.5 0.8 2.0 2.2 1.8 1.2 2.3 0.9 - 0.5 0.7Interest and similar income 0.2 0.3 0.1 0.2 0.1 0.1 0.1 0.1 0.3 0.3Other income 2.7 2.5 2.7 2.9 2.0 2.3 1.7 2.0 3.2 2.8
of which: Income from long-term equity investments 0.9 0.7 0.0 0.0 0.1 0.2 0.3 0.3 1.2 1.0Total income 102.9 102.8 102.8 103.0 102.1 102.5 101.8 102.1 103.5 103.1
ExpensesCost of materials 54.1 53.5 33.5 34.3 42.1 41.9 51.7 51.5 56.9 56.1Personnel expenses 25.2 26.4 39.3 39.4 33.5 34.5 27.2 28.1 23.2 24.6Depreciation 3.5 3.8 4.2 4.1 3.6 3.7 3.4 3.6 3.5 3.9
of which: Depreciation of tangible fixed assets 3.1 3.3 4.1 4.1 3.5 3.6 3.2 3.4 3.1 3.3Interest and similar expenses 0.9 1.0 0.9 0.9 0.8 0.8 0.7 0.7 1.1 1.1Operating taxes 0.1 0.1 0.1 0.1 0.1 0.1 0.1 0.1 0.1 0.1Other expenses 14.2 14.7 18.3 18.0 16.9 17.0 14.1 14.5 13.8 14.5Total expenses before taxes on income 98.0 99.5 96.4 96.8 97.0 97.9 97.2 98.5 98.5 100.2Annual result before taxes on income 4.9 3.3 6.5 6.2 5.2 4.6 4.6 3.6 5.0 2.9Taxes on income 0.9 0.8 1.3 1.3 1.3 1.2 1.1 1.0 0.8 0.6Annual result 4.0 2.5 5.2 5.0 3.8 3.3 3.4 2.6 4.2 2.3Profit and loss transfers (parent company) 0.2 0.2 - 0.1 - 0.1 0.1 0.0 0.0 0.0 0.2 0.3Profit and loss transfers (subsidiary) 1.0 0.7 0.1 0.0 0.4 0.3 0.5 0.4 1.3 0.8Profit for the year 3.1 2.0 5.0 4.9 3.6 3.1 3.0 2.2 3.1 1.7
Balance sheetAssets Percentage of the balance sheet totalIntangible fixed assets 0.8 1.0 0.4 0.4 0.5 0.5 0.6 0.6 0.8 1.1Tangible fixed assets 23.7 23.9 36.2 36.1 33.1 32.5 26.6 26.7 21.7 22.0
of which: Land and buildings 8.6 8.5 13.9 13.6 12.4 12.0 9.3 9.3 7.9 7.9Inventories 30.1 29.9 25.5 27.0 29.7 30.5 35.5 35.6 28.2 27.8
of which: Finished goods and merchandise 7.2 7.0 5.5 5.2 6.5 6.6 7.6 7.5 7.1 6.8Cash 6.0 6.4 10.9 11.4 10.9 10.7 8.0 8.6 4.7 5.2Receivables 28.1 27.5 23.4 21.6 21.9 20.9 24.5 23.5 30.0 29.7
Short-term 26.1 25.3 22.8 21.0 20.9 19.8 22.9 21.9 27.7 27.1 of which:
Trade receivables 9.5 8.6 12.4 11.1 12.5 11.3 12.5 11.6 8.1 7.3Receivables from affiliated companies 14.4 14.4 5.8 5.4 5.3 5.4 8.0 7.8 17.7 17.8
Long-term 2.0 2.2 0.6 0.7 1.1 1.2 1.6 1.5 2.3 2.6of which: Loans to affiliated companies 1.6 1.8 0.1 0.0 0.5 0.6 1.0 0.8 2.0 2.3
Securities 1.4 1.4 0.2 0.2 1.2 1.1 0.6 0.7 1.7 1.6Other long-term equity investments 9.7 9.6 2.7 2.6 2.3 3.2 3.9 4.0 12.5 12.2
of which: Goodwill 0.6 0.3 0.4 0.4 0.2 0.2 0.3 0.3 0.7 0.4
CapitalEquity 35.6 35.0 33.1 33.5 35.2 36.5 37.6 37.6 35.0 33.9Liabilities 52.6 53.1 60.4 60.5 57.0 56.2 52.2 52.5 52.2 53.0
Short-term 40.1 41.7 41.9 42.0 42.4 42.3 41.4 41.6 39.4 41.7of which:Liabilities to banks 5.0 4.9 9.7 8.9 8.4 8.5 7.1 7.4 3.8 3.7Trade payables 6.4 5.8 6.8 6.6 7.1 6.3 6.8 6.0 6.1 5.7Liabilities to affiliated companies 13.8 14.7 6.5 6.9 9.7 9.8 10.6 10.3 15.3 16.9
Long-term 12.5 11.4 18.5 18.5 14.6 13.9 10.9 10.9 12.8 11.3 of which:
Liabilities to banks 7.0 7.1 12.7 14.0 9.9 9.6 7.0 6.9 6.7 6.9Liabilities to affiliated companies 4.2 3.0 4.2 3.1 3.6 3.1 2.9 2.9 4.7 3.0
Provisions 11.7 11.8 6.5 6.0 7.7 7.3 10.1 9.8 12.8 13.1of which: Provisions for pensions 5.2 5.5 1.5 1.3 2.2 2.1 3.9 4.0 6.1 6.4
Other ratios Percentage of salesAnnual result before taxes on income 4.9 3.3 6.6 6.4 5.3 4.6 4.7 3.7 5.0 2.9Annual result and depreciation 7.5 6.4 9.5 9.3 7.6 7.1 7.0 6.3 7.6 6.3Trade receivables 7.4 7.1 8.5 7.7 8.4 7.8 8.9 8.4 6.6 6.4
Percentage of the balance sheet totalSales 129.1 122.5 145.9 144.1 149.1 145.4 140.4 137.5 122.8 114.7Annual result and interest paid 6.3 4.3 9.1 8.6 7.0 6.1 5.9 4.7 6.4 3.9
Percentage of liabilities and provisions less cashAnnual result and depreciation 16.6 13.3 24.8 24.2 21.0 19.6 18.1 16.0 15.6 11.8
Percentage of fixed assetsLong-term equity and liabilities 143.5 137.7 132.5 133.3 138.0 137.5 159.3 158.2 139.3 131.6
Percentage of short-term liabilitiesCash resources and short-term receivables 80.9 76.9 80.7 77.2 75.9 73.0 75.7 74.1 83.4 78.3Cash resources, short-term receivables and inventories 156.0 148.7 141.5 141.3 146.0 145.2 161.5 159.7 155.1 145.2
Percentage of cost of materialsTrade payables 9.0 8.8 13.6 13.1 11.1 10.2 9.1 8.4 8.8 8.8
Memo item:Balance sheet total in € billion 47.94 49.42 0.34 0.36 3.14 3.24 11.82 12.13 32.65 33.69Sales in € billion 61.88 60.54 0.50 0.52 4.68 4.71 16.59 16.68 40.11 38.64Number of enterprises 2 360 2 360 453 453 913 913 707 707 287 287

Deutsche BundesbankFinancial statement statistics (ratios - provisional data)
May 202155
I. Enterprises by economic sector
cont'd: 4.l) Manufacture of fabricated metal products, except machinery and equipment
cont'd: All legal formsEnterprises with sales of ... € million
Total Less than 2 2 but less than 10 10 but less than 50 50 and moreQuartile Cylindered sample 2018/2019value 2018 2019 2018 2019 2018 2019 2018 2019 2018 2019Of the enterprises captured …
Ratios ... % had a ratio of less than …Percentage of gross revenue
Cost of materials 25 31.7 30.7 19.2 19.5 28.6 27.6 40.1 39.4 46.3 45.8 50 44.1 43.8 32.4 30.7 41.5 39.8 50.3 50.0 56.1 54.9 75 56.5 56.0 41.9 44.3 51.9 51.5 61.8 61.1 64.8 64.3
Personnel expenses 25 23.2 23.6 28.1 28.3 26.5 27.6 20.2 20.7 17.8 18.0 50 31.5 32.8 38.9 39.6 34.8 36.2 27.9 29.3 24.2 25.0 75 39.9 41.4 48.7 49.5 42.3 43.7 35.1 37.0 31.0 31.5
Depreciation 25 1.4 1.4 1.3 1.3 1.4 1.3 1.4 1.5 1.6 1.6 50 2.7 2.7 2.7 2.8 2.6 2.7 2.6 2.7 2.8 3.0 75 4.6 4.8 4.9 4.9 4.8 5.1 4.3 4.6 4.4 5.0
Annual result 25 0.8 0.5 0.8 0.9 0.8 0.6 0.7 0.3 0.6 - 0.1 50 2.9 2.6 3.9 4.0 2.8 2.5 2.7 2.3 2.8 2.2 75 6.3 6.1 9.2 8.9 6.1 5.8 5.7 5.1 5.7 5.2
Percentage of the balance sheet totalTangible fixed assets 25 11.0 11.0 8.4 8.9 10.7 10.2 11.4 11.9 14.1 14.2
50 25.4 25.3 24.1 23.9 25.5 24.8 25.8 26.8 25.1 24.9 75 44.3 44.8 48.8 49.9 47.1 47.8 41.3 42.0 40.6 40.8
Inventories 25 13.5 13.3 4.7 4.8 11.2 10.9 21.4 19.8 19.3 18.3 50 27.2 27.0 15.5 16.3 24.9 25.8 33.2 33.3 27.4 26.4 75 44.4 44.8 38.6 41.0 45.6 46.0 46.0 46.0 39.2 38.9
Equity 25 13.8 14.4 6.8 9.3 13.4 14.3 17.1 18.2 17.2 17.0 50 32.0 32.6 28.3 28.8 30.2 31.6 36.0 35.9 33.2 32.7 75 54.6 56.3 54.6 57.6 55.7 56.5 54.5 55.3 51.1 53.8
Short-term liabilities 25 18.7 18.5 17.0 17.6 18.4 18.0 19.5 18.3 20.2 20.4 50 37.2 37.5 37.5 36.6 37.2 38.1 38.1 37.6 34.9 36.0 75 62.4 62.5 67.9 65.4 64.6 64.5 59.5 61.4 55.6 54.9
Liabilities to banks 25 0.0 0.0 0.0 0.0 0.0 0.0 0.0 0.0 0.0 0.0 50 10.7 10.1 13.3 12.0 11.3 11.1 10.8 10.1 3.4 2.6 75 28.4 28.9 32.6 34.7 31.4 32.1 25.1 27.7 19.1 20.8
Percentage of salesAnnual result before taxes on income 25 1.1 0.7 1.1 1.2 1.2 0.8 1.1 0.4 1.1 - 0.1
50 3.9 3.4 5.2 5.1 3.8 3.4 3.7 3.1 3.4 2.6 75 8.5 7.9 11.1 10.6 8.4 8.1 7.5 6.9 7.0 6.0
Annual result and depreciation 25 3.8 3.3 4.0 4.4 3.8 3.5 3.6 2.9 3.6 2.7 50 7.1 6.9 8.4 9.0 7.2 6.9 6.7 6.3 6.6 6.2 75 12.7 12.1 16.1 15.6 12.8 12.4 11.4 10.8 11.3 10.0
Trade receivables 25 4.0 3.4 3.4 2.7 4.2 3.5 4.8 4.2 3.3 2.7 50 7.2 6.6 7.1 5.9 7.0 6.5 8.0 7.2 6.8 6.0 75 11.1 10.3 12.2 10.4 11.0 10.0 11.6 11.0 10.4 9.8
Percentage of the balance sheet totalAnnual result and interest paid 25 2.7 1.9 2.8 2.9 2.7 2.4 2.5 1.5 2.2 1.0
50 6.4 5.7 8.0 8.3 6.3 5.7 5.9 4.8 6.3 4.9 75 12.4 11.6 18.1 17.5 12.0 11.4 11.0 9.8 10.8 9.1
Percentage of liabilities and provisions less cashAnnual result and depreciation 25 6.2 5.9 3.4 5.7 5.9 5.9 7.4 6.0 6.6 6.4
50 19.3 17.4 21.6 19.6 18.8 17.7 19.4 16.6 18.2 16.0 75 42.7 40.3 51.9 54.4 43.0 40.0 42.1 39.0 33.0 33.3
Percentage of fixed assetsLong-term equity and liabilities 25 97.2 98.8 83.0 89.0 93.7 97.2 113.7 110.3 98.2 98.1
50 156.0 156.6 147.3 157.0 156.2 154.7 167.9 167.4 149.6 142.4 75 290.1 289.9 328.3 346.5 313.9 315.4 290.1 275.5 218.0 211.9
Percentage of short-term liabilitiesCash resources and short-term receivables 25 42.5 41.3 39.7 39.9 41.3 39.3 44.6 42.7 47.0 48.3
50 83.4 80.8 94.1 92.8 83.5 81.3 79.1 76.9 82.1 79.9 75 190.1 188.0 240.6 231.2 199.8 195.8 177.3 175.6 163.4 162.5
Percentage of cost of materialsTrade payables 25 4.6 4.1 4.0 3.9 4.7 4.1 4.6 4.1 4.7 4.5
50 8.4 7.5 9.7 8.9 9.1 7.9 7.7 7.1 7.6 7.0 75 15.2 13.5 20.1 20.4 17.0 14.4 12.3 11.3 12.1 11.6

Deutsche BundesbankFinancial statement statistics (ratios - provisional data)May 202156
I. Enterprises by economic sector
4.m) Manufacture of computer, electronic and optical products
All legal formsEnterprises with sales of ... € million
Total Less than 2 2 but less than 10 10 but less than 50 50 and moreCylindered sample 2018/2019
Ratios 2018 2019 2018 2019 2018 2019 2018 2019 2018 2019Income statementIncome Percentage of gross revenueSales 99.5 99.5 99.4 98.1 98.6 98.0 98.4 98.9 99.6 99.6Change in finished goods 0.5 0.5 0.6 1.9 1.4 2.0 1.6 1.1 0.4 0.4Interest and similar income 0.6 0.8 0.2 0.2 0.2 0.2 0.2 0.2 0.6 0.9Other income 8.0 19.1 3.4 3.8 2.5 2.8 3.5 3.6 8.5 20.9
of which: Income from long-term equity investments 4.8 4.4 0.1 0.4 0.1 0.1 0.9 0.8 5.2 4.8Total income 108.5 119.9 103.5 104.0 102.7 103.0 103.7 103.8 109.1 121.8
ExpensesCost of materials 53.6 55.7 35.3 37.5 44.9 44.3 47.5 48.1 54.3 56.7Personnel expenses 26.0 25.9 39.4 39.8 33.6 34.2 30.3 30.6 25.5 25.3Depreciation 3.2 3.5 2.9 2.8 2.8 3.0 3.4 3.2 3.2 3.5
of which: Depreciation of tangible fixed assets 2.7 3.1 2.8 2.8 2.6 2.9 2.8 3.0 2.7 3.1Interest and similar expenses 2.3 2.9 0.9 0.9 0.8 0.8 0.9 0.9 2.4 3.1Operating taxes 0.0 0.1 0.1 0.1 0.0 0.1 0.0 0.0 0.1 0.1Other expenses 15.6 14.5 20.1 19.9 15.1 15.0 14.8 14.6 15.7 14.5Total expenses before taxes on income 100.7 102.6 98.7 101.0 97.2 97.5 96.9 97.4 101.2 103.2Annual result before taxes on income 7.8 17.3 4.9 3.0 5.5 5.6 6.8 6.3 7.9 18.6Taxes on income 1.5 2.4 1.8 1.4 1.8 1.8 1.6 1.7 1.5 2.5Annual result 6.3 14.9 3.1 1.6 3.7 3.8 5.2 4.6 6.4 16.1Profit and loss transfers (parent company) 2.9 0.4 0.0 0.0 0.3 0.2 0.3 0.2 3.2 0.4Profit and loss transfers (subsidiary) 1.0 1.2 0.7 1.1 0.0 0.2 2.2 1.1 0.9 1.2Profit for the year 8.2 14.2 2.4 0.5 4.0 3.8 3.3 3.8 8.8 15.4
Balance sheetAssets Percentage of the balance sheet totalIntangible fixed assets 0.9 0.7 1.3 1.6 1.0 1.0 1.3 1.1 0.8 0.7Tangible fixed assets 7.2 6.4 23.9 25.3 21.4 20.4 18.9 19.0 6.6 5.8
of which: Land and buildings 2.3 2.1 11.2 11.0 12.3 11.4 7.9 8.5 2.0 1.8Inventories 13.0 11.5 28.4 28.8 32.3 32.9 29.7 29.2 12.1 10.6
of which: Finished goods and merchandise 6.2 5.4 13.5 13.8 9.7 9.3 6.8 6.8 6.1 5.3Cash 5.3 5.1 15.6 14.0 12.8 13.0 10.6 10.4 5.0 4.9Receivables 27.5 25.3 26.3 26.1 27.2 25.8 31.3 31.2 27.3 25.1
Short-term 24.7 22.3 25.6 23.2 26.1 25.1 30.0 29.6 24.4 22.0 of which:
Trade receivables 5.0 4.3 17.4 15.3 14.1 12.7 13.3 12.3 4.5 4.0Receivables from affiliated companies 18.2 16.6 4.2 4.1 9.4 9.7 14.2 14.8 18.5 16.8
Long-term 2.8 3.0 0.6 2.8 1.0 0.7 1.4 1.5 2.9 3.1of which: Loans to affiliated companies 2.6 2.8 0.5 2.5 0.2 0.2 1.1 1.3 2.7 2.9
Securities 5.5 5.9 1.0 0.9 1.8 1.6 0.6 0.6 5.7 6.2Other long-term equity investments 40.2 44.7 2.8 2.5 3.2 4.7 6.9 7.8 41.9 46.4
of which: Goodwill 0.2 0.2 1.4 1.2 0.4 1.3 0.6 0.4 0.2 0.2
CapitalEquity 32.8 34.9 38.9 43.8 49.6 49.1 43.2 45.7 32.2 34.4Liabilities 48.0 47.6 51.2 46.0 41.0 41.0 43.7 41.4 48.2 47.9
Short-term 41.4 38.5 33.2 29.9 28.3 28.0 33.9 32.3 41.8 38.8of which:Liabilities to banks 1.2 1.1 6.9 7.8 7.6 8.1 5.5 6.1 0.9 0.8Trade payables 3.3 2.8 7.7 8.3 6.4 5.9 5.8 5.2 3.2 2.7Liabilities to affiliated companies 27.5 26.2 8.5 5.0 5.7 5.3 12.7 11.5 28.3 26.9
Long-term 6.6 9.1 18.0 16.1 12.7 13.0 9.8 9.2 6.4 9.1 of which:
Liabilities to banks 1.2 1.2 12.2 12.3 7.5 7.1 4.7 4.8 1.0 1.0Liabilities to affiliated companies 4.3 7.0 4.6 2.0 3.5 4.1 4.8 3.9 4.3 7.2
Provisions 18.6 16.5 9.2 9.5 9.0 9.4 12.5 12.0 19.0 16.7of which: Provisions for pensions 11.1 10.0 2.2 1.9 2.5 2.6 4.2 4.3 11.5 10.3
Other ratios Percentage of salesAnnual result before taxes on income 7.8 17.4 4.9 3.0 5.6 5.7 6.9 6.4 8.0 18.7Annual result and depreciation 9.6 18.5 6.1 4.5 6.6 7.0 8.7 7.9 9.7 19.7Trade receivables 7.9 8.4 12.1 10.7 10.6 10.2 10.8 10.1 7.6 8.2
Percentage of the balance sheet totalSales 62.6 51.9 143.4 142.7 132.6 125.3 122.7 121.1 59.5 48.7Annual result and interest paid 5.4 9.3 5.8 3.6 6.0 6.0 7.6 6.8 5.3 9.4
Percentage of liabilities and provisions less cashAnnual result and depreciation 9.7 16.0 19.1 15.2 23.2 23.1 23.0 21.8 9.2 15.8
Percentage of fixed assetsLong-term equity and liabilities 90.6 91.7 200.2 186.4 235.0 233.3 199.2 198.8 87.7 89.2
Percentage of short-term liabilitiesCash resources and short-term receivables 74.7 75.6 124.4 124.7 140.2 138.4 120.9 125.2 72.7 73.7Cash resources, short-term receivables and inventories 106.0 105.4 209.8 221.0 254.4 256.2 208.4 215.7 101.7 101.1
Percentage of cost of materialsTrade payables 9.9 9.8 15.1 15.1 10.6 10.5 9.7 8.8 9.9 9.9
Memo item:Balance sheet total in € billion 148.73 173.13 0.07 0.08 0.95 1.03 6.16 6.46 141.54 165.56Sales in € billion 93.16 89.82 0.11 0.11 1.27 1.29 7.56 7.82 84.22 80.60Number of enterprises 893 893 89 89 239 239 324 324 241 241

Deutsche BundesbankFinancial statement statistics (ratios - provisional data)
May 202157
I. Enterprises by economic sector
cont'd: 4.m) Manufacture of computer, electronic and optical products
cont'd: All legal formsEnterprises with sales of ... € million
Total Less than 2 2 but less than 10 10 but less than 50 50 and moreQuartile Cylindered sample 2018/2019value 2018 2019 2018 2019 2018 2019 2018 2019 2018 2019Of the enterprises captured …
Ratios ... % had a ratio of less than …Percentage of gross revenue
Cost of materials 25 34.3 34.2 20.7 20.7 34.6 33.2 35.3 35.4 37.8 38.0 50 45.9 45.1 31.8 33.5 44.8 42.9 46.4 46.3 48.5 48.3 75 57.5 58.2 49.0 49.2 54.8 55.2 59.3 59.8 59.5 63.9
Personnel expenses 25 21.8 22.0 27.4 27.1 24.4 26.1 22.4 22.4 18.4 18.9 50 30.4 31.0 40.6 39.9 33.0 33.8 30.4 30.7 25.2 25.7 75 39.4 40.2 48.9 52.1 42.0 43.7 38.5 39.5 33.6 35.1
Depreciation 25 1.2 1.2 1.0 1.0 1.1 1.0 1.2 1.2 1.4 1.4 50 2.2 2.1 1.7 1.7 1.9 1.9 2.2 2.3 2.5 2.4 75 3.6 3.7 3.6 3.0 3.4 3.4 3.7 3.8 3.7 3.8
Annual result 25 1.0 0.8 0.3 0.3 1.1 0.6 1.0 1.5 1.1 0.5 50 4.1 3.6 3.2 3.5 3.5 3.2 4.5 3.9 4.7 3.8 75 8.4 8.0 7.5 8.9 7.1 7.2 8.7 8.2 9.5 8.0
Percentage of the balance sheet totalTangible fixed assets 25 4.5 4.6 2.3 2.0 4.2 4.0 4.8 4.9 5.5 5.7
50 12.0 12.1 8.0 8.3 10.0 10.5 13.8 14.4 13.1 12.3 75 25.3 26.0 23.6 25.5 24.9 24.6 26.5 27.7 25.2 25.7
Inventories 25 17.2 16.8 10.3 15.9 20.3 18.4 20.3 19.3 15.3 14.3 50 28.9 27.9 28.3 25.9 33.8 35.1 31.5 30.6 23.9 22.9 75 44.1 42.6 44.1 46.1 51.7 51.3 45.0 42.6 34.8 32.8
Equity 25 24.5 24.1 16.7 21.1 30.2 29.3 24.0 24.5 22.7 19.7 50 42.2 43.9 37.8 43.1 46.8 48.9 42.1 45.7 38.3 38.6 75 63.7 65.2 60.2 63.7 66.7 70.4 63.1 65.5 61.4 62.2
Short-term liabilities 25 13.4 12.5 14.8 14.5 12.8 11.1 13.1 11.0 15.3 15.1 50 27.7 26.3 30.2 29.3 27.4 24.2 27.7 25.0 27.2 27.2 75 48.1 46.8 52.0 49.8 46.3 45.6 49.2 47.2 46.6 45.6
Liabilities to banks 25 0.0 0.0 0.0 0.0 0.0 0.0 0.0 0.0 0.0 0.0 50 2.1 2.2 2.7 5.1 5.6 6.2 2.9 2.6 0.0 0.0 75 20.4 19.4 25.0 26.0 26.4 28.2 19.0 20.7 11.4 9.4
Percentage of salesAnnual result before taxes on income 25 1.4 1.1 0.3 0.4 1.8 0.9 1.5 1.8 1.5 0.8
50 5.5 4.8 4.2 3.9 4.9 4.3 6.1 5.0 6.0 5.1 75 11.1 10.6 10.4 12.2 9.5 10.1 11.4 10.5 11.6 10.4
Annual result and depreciation 25 3.7 3.5 1.6 1.4 3.9 3.5 3.5 3.8 4.2 2.9 50 8.4 7.8 7.0 6.0 7.0 7.6 8.9 8.4 9.5 7.8 75 14.7 13.9 12.7 15.7 13.3 13.0 14.7 13.8 16.3 14.7
Trade receivables 25 4.6 4.3 4.5 3.2 5.2 4.5 5.4 4.8 3.8 3.7 50 8.8 8.3 7.9 7.3 9.5 8.4 9.1 8.9 7.6 7.8 75 14.2 13.6 17.0 15.5 14.3 14.0 14.7 13.8 13.3 12.6
Percentage of the balance sheet totalAnnual result and interest paid 25 2.8 2.4 1.6 1.3 2.8 2.4 2.8 2.9 3.2 2.0
50 7.5 6.9 6.5 7.7 7.2 6.8 8.0 7.0 7.7 6.4 75 14.3 13.2 14.4 15.5 13.3 11.9 14.3 13.4 15.1 13.7
Percentage of liabilities and provisions less cashAnnual result and depreciation 25 3.8 3.7 - 15.4 - 3.5 0.9 - 2.0 3.8 6.1 8.5 5.7
50 21.1 19.4 13.0 14.8 18.2 19.7 22.6 21.8 22.5 17.6 75 51.6 50.9 40.1 54.4 51.3 55.5 54.6 55.0 51.3 42.0
Percentage of fixed assetsLong-term equity and liabilities 25 142.6 137.5 136.6 140.2 148.6 156.8 148.2 148.0 132.5 116.9
50 252.6 251.5 333.0 304.1 349.0 352.8 240.7 244.9 219.1 222.0 75 551.0 543.7 1 158.1 1 127.1 756.5 791.3 532.9 487.3 359.1 354.0
Percentage of short-term liabilitiesCash resources and short-term receivables 25 70.7 72.5 70.7 74.2 66.7 69.2 66.5 68.9 86.2 84.0
50 138.5 138.3 150.2 133.9 135.4 144.6 126.4 133.8 152.4 150.0 75 320.0 348.0 320.0 309.8 352.9 405.3 307.8 379.1 285.4 271.7
Percentage of cost of materialsTrade payables 25 4.9 4.3 5.0 4.4 4.3 4.3 5.0 4.0 5.3 4.4
50 8.2 7.6 11.0 9.7 8.2 7.9 7.9 7.3 8.0 7.4 75 13.9 12.9 20.3 21.7 14.0 13.5 13.2 11.8 13.0 12.4

Deutsche BundesbankFinancial statement statistics (ratios - provisional data)May 202158
I. Enterprises by economic sector
4.n) Manufacture of electrical equipment
All legal formsEnterprises with sales of ... € million
Total Less than 2 2 but less than 10 10 but less than 50 50 and moreCylindered sample 2018/2019
Ratios 2018 2019 2018 2019 2018 2019 2018 2019 2018 2019Income statementIncome Percentage of gross revenueSales 99.0 99.1 93.2 91.1 98.2 99.1 98.3 99.3 99.1 99.0Change in finished goods 1.0 0.9 6.8 8.9 1.8 0.9 1.7 0.7 0.9 1.0Interest and similar income 0.3 0.4 0.1 0.1 0.1 0.1 0.1 0.1 0.3 0.4Other income 4.2 4.5 1.7 2.1 1.9 1.9 2.2 2.3 4.4 4.7
of which: Income from long-term equity investments 1.7 1.4 0.0 0.0 0.0 0.1 0.3 0.5 1.9 1.5Total income 104.4 104.9 101.8 102.2 102.0 102.0 102.3 102.4 104.7 105.2
ExpensesCost of materials 61.4 61.2 44.8 42.4 49.6 47.9 54.3 54.1 62.4 62.2Personnel expenses 21.7 22.2 35.6 35.0 31.2 32.1 26.1 27.5 21.1 21.4Depreciation 2.8 4.2 3.1 2.8 2.0 2.0 2.4 2.5 2.8 4.4
of which: Depreciation of tangible fixed assets 2.4 3.2 3.1 2.8 2.0 1.9 2.2 2.3 2.5 3.4Interest and similar expenses 1.2 1.1 0.7 0.6 0.7 0.7 0.7 0.7 1.3 1.2Operating taxes 0.0 0.0 0.1 0.1 0.1 0.1 0.1 0.1 0.0 0.0Other expenses 13.7 13.6 16.0 15.2 13.2 13.6 13.4 13.5 13.7 13.6Total expenses before taxes on income 100.8 102.4 100.2 96.1 96.7 96.3 97.0 98.3 101.3 102.9Annual result before taxes on income 3.6 2.5 1.6 6.1 5.3 5.7 5.4 4.1 3.4 2.3Taxes on income 0.8 0.7 0.9 1.2 1.5 1.4 1.3 1.1 0.7 0.7Annual result 2.8 1.8 0.7 4.8 3.8 4.2 4.1 3.0 2.7 1.6Profit and loss transfers (parent company) 0.6 0.0 0.0 - 0.1 0.0 0.0 0.0 0.0 0.7 0.0Profit and loss transfers (subsidiary) 1.7 1.5 - 0.2 0.0 - 0.2 - 0.2 0.8 0.6 1.8 1.7Profit for the year 1.8 0.3 1.0 4.7 4.0 4.5 3.3 2.5 1.6 0.0
Balance sheetAssets Percentage of the balance sheet totalIntangible fixed assets 1.3 1.2 1.0 1.3 1.2 1.3 0.9 1.0 1.3 1.3Tangible fixed assets 13.5 14.2 18.2 16.1 18.2 18.5 18.8 18.7 13.0 13.7
of which: Land and buildings 4.5 4.8 2.7 2.4 9.7 9.1 7.4 7.5 4.2 4.5Inventories 19.4 18.5 35.3 42.6 34.4 34.2 30.3 30.9 18.3 17.1
of which: Finished goods and merchandise 5.3 5.1 8.7 7.6 7.3 8.0 7.1 7.0 5.1 4.9Cash 5.2 5.4 14.6 13.0 14.3 14.7 9.5 10.6 4.7 4.8Receivables 39.0 39.7 26.6 23.8 28.4 27.6 32.4 31.2 39.7 40.6
Short-term 36.9 37.5 26.5 23.8 27.3 26.5 30.4 29.1 37.6 38.4 of which:
Trade receivables 9.0 8.5 16.2 15.3 15.5 15.3 14.0 13.6 8.5 7.9Receivables from affiliated companies 26.0 27.1 6.9 5.7 9.0 8.3 14.2 12.9 27.2 28.6
Long-term 2.0 2.2 0.1 0.0 1.1 1.1 2.0 2.1 2.1 2.2of which: Loans to affiliated companies 1.2 1.3 0.0 0.0 0.7 0.8 0.9 1.2 1.2 1.3
Securities 3.4 2.7 1.1 0.9 0.3 0.4 2.3 1.6 3.5 2.9Other long-term equity investments 18.0 18.0 2.6 1.9 2.8 2.8 5.4 5.7 19.3 19.3
of which: Goodwill 1.7 1.5 2.0 1.3 0.1 0.1 0.1 0.1 1.9 1.7
CapitalEquity 34.6 33.4 23.4 27.7 43.4 40.5 44.0 42.4 33.8 32.6Liabilities 45.4 46.2 67.4 63.3 46.0 49.5 44.7 46.9 45.4 46.1
Short-term 39.6 40.6 48.2 48.0 39.1 42.0 36.2 38.7 39.9 40.8of which:Liabilities to banks 2.4 2.6 4.1 3.8 6.2 9.3 6.3 5.8 2.0 2.2Trade payables 6.0 5.7 10.4 8.1 7.2 7.3 6.2 6.2 6.0 5.6Liabilities to affiliated companies 20.8 22.1 7.2 4.2 7.6 7.9 13.6 15.4 21.6 22.9
Long-term 5.8 5.6 19.2 15.3 6.9 7.5 8.5 8.2 5.5 5.3 of which:
Liabilities to banks 2.5 3.1 7.8 6.5 4.8 5.2 4.1 5.1 2.3 2.9Liabilities to affiliated companies 2.0 1.9 5.3 6.9 1.3 1.6 3.8 2.7 1.9 1.8
Provisions 19.5 19.9 8.8 8.9 10.4 9.8 11.1 10.5 20.3 20.9of which: Provisions for pensions 10.3 11.0 1.8 1.7 3.1 3.0 3.5 3.5 10.9 11.8
Other ratios Percentage of salesAnnual result before taxes on income 3.7 2.5 1.7 6.7 5.4 5.7 5.5 4.1 3.4 2.3Annual result and depreciation 5.7 6.1 4.1 8.4 5.9 6.2 6.6 5.5 5.6 6.1Trade receivables 8.0 7.6 10.4 10.8 10.0 10.4 9.8 10.0 7.8 7.2
Percentage of the balance sheet totalSales 112.6 111.8 155.9 141.5 154.8 147.4 141.9 136.1 109.6 109.1Annual result and interest paid 4.6 3.3 2.4 8.5 7.1 7.3 6.9 5.1 4.4 3.1
Percentage of liabilities and provisions less cashAnnual result and depreciation 10.6 11.1 10.4 20.0 21.7 20.6 20.0 16.0 9.9 10.7
Percentage of fixed assetsLong-term equity and liabilities 135.8 131.2 192.2 222.0 227.0 211.3 191.6 186.5 131.5 126.9
Percentage of short-term liabilitiesCash resources and short-term receivables 108.4 106.1 85.3 76.7 106.7 98.3 110.9 102.7 108.3 106.5Cash resources, short-term receivables and inventories 157.4 151.6 158.5 165.4 194.5 179.6 194.7 182.4 154.1 148.6
Percentage of cost of materialsTrade payables 8.7 8.2 13.9 12.3 9.2 10.2 7.9 8.4 8.7 8.1
Memo itemBalance sheet total in € billion 50.95 50.90 0.04 0.04 0.55 0.59 3.93 4.14 46.44 46.13Sales in € billion 57.38 56.92 0.05 0.06 0.85 0.87 5.57 5.63 50.90 50.35Number of enterprises 621 621 53 53 156 156 230 230 182 182

Deutsche BundesbankFinancial statement statistics (ratios - provisional data)
May 202159
I. Enterprises by economic sector
cont'd: 4.n) Manufacture of electrical equipment
cont'd: All legal formsEnterprises with sales of ... € million
Total Less than 2 2 but less than 10 10 but less than 50 50 and moreQuartile Cylindered sample 2018/2019value 2018 2019 2018 2019 2018 2019 2018 2019 2018 2019Of the enterprises captured …
Ratios ... % had a ratio of less than …Percentage of gross revenue
Cost of materials 25 42.2 41.1 30.4 26.0 40.1 38.8 43.5 42.4 45.0 44.5 50 51.8 51.5 44.4 39.0 49.1 48.5 53.2 52.9 55.7 54.2 75 62.5 62.4 55.0 53.0 59.9 57.2 63.2 64.0 66.6 67.8
Personnel expenses 25 19.9 20.6 22.1 24.7 22.6 25.5 19.3 20.5 16.9 17.6 50 28.0 28.6 39.2 36.2 31.4 31.4 26.7 28.4 24.1 25.0 75 36.2 37.0 47.3 45.8 39.6 40.0 35.1 36.5 31.4 33.0
Depreciation 25 1.0 1.0 0.8 1.1 0.9 0.9 1.0 1.0 1.2 1.3 50 1.7 1.8 1.9 1.8 1.4 1.4 1.7 1.7 2.1 2.2 75 2.8 3.1 3.4 3.3 2.3 2.4 2.7 3.1 3.3 3.7
Annual result 25 0.6 0.6 - 2.1 0.7 0.7 1.2 0.7 0.7 0.1 0.1 50 3.0 3.1 2.1 3.1 2.9 3.6 3.1 2.9 3.5 3.2 75 7.4 7.3 6.4 9.1 6.5 7.4 7.4 6.9 9.0 7.3
Percentage of the balance sheet totalTangible fixed assets 25 5.6 5.5 4.3 3.8 3.7 3.8 6.5 6.4 7.4 8.1
50 13.0 12.9 9.7 10.1 9.1 9.0 13.7 14.5 14.2 14.6 75 27.5 27.7 26.5 20.5 28.4 27.3 27.5 28.6 25.1 28.2
Inventories 25 16.7 17.5 6.3 7.9 18.4 19.5 18.0 19.0 14.7 15.5 50 30.2 29.9 27.5 31.0 34.9 34.6 33.8 32.7 26.1 24.5 75 44.4 45.2 49.0 53.1 53.1 52.2 45.1 46.9 36.8 36.1
Equity 25 17.0 18.8 11.3 12.9 16.2 15.1 18.8 19.5 19.1 19.3 50 36.0 36.5 26.7 34.1 40.8 39.8 39.0 38.1 33.9 33.1 75 56.0 55.4 44.9 51.8 61.8 63.4 61.5 57.5 50.5 49.9
Short-term liabilities 25 17.6 16.9 23.6 23.0 13.9 15.7 17.8 17.4 18.7 16.9 50 36.2 34.8 41.3 34.4 35.8 38.2 36.2 34.8 33.5 34.2 75 58.5 57.2 70.4 65.0 57.4 57.2 60.2 58.7 55.2 52.2
Liabilities to banks 25 0.0 0.0 0.0 0.0 0.0 0.0 0.0 0.0 0.0 0.0 50 1.0 1.6 0.4 3.3 3.8 5.5 1.4 2.5 0.0 0.0 75 16.5 16.9 21.7 21.8 18.7 22.2 21.5 17.7 7.5 7.3
Percentage of salesAnnual result before taxes on income 25 0.8 0.9 - 2.2 0.9 1.1 1.5 1.0 1.0 0.5 0.3
50 4.1 4.1 3.5 4.4 3.9 4.6 4.4 4.0 4.3 3.5 75 10.0 9.1 8.5 11.3 9.3 9.4 10.0 8.8 10.9 9.4
Annual result and depreciation 25 2.6 2.7 0.2 3.2 2.7 3.2 2.8 2.5 2.4 2.7 50 6.5 6.4 5.3 6.2 6.4 6.4 6.8 6.0 6.6 6.9 75 12.8 12.3 10.7 14.2 11.5 12.1 12.5 11.0 13.5 11.9
Trade receivables 25 4.4 4.2 3.9 3.5 4.5 4.6 4.9 5.2 3.3 3.0 50 8.4 7.7 8.1 6.9 8.4 7.9 9.0 8.4 7.3 6.8 75 12.7 11.8 16.0 14.9 13.4 12.2 12.8 12.2 11.2 10.7
Percentage of the balance sheet totalAnnual result and interest paid 25 2.2 2.3 - 2.5 2.7 2.6 3.5 2.8 1.8 1.9 1.7
50 6.4 6.4 5.5 6.7 6.4 7.3 6.5 5.3 6.4 6.7 75 13.6 12.9 16.0 17.6 14.6 13.8 12.0 11.5 13.9 12.0
Percentage of liabilities and provisions less cashAnnual result and depreciation 25 4.2 4.2 - 6.5 5.7 2.9 1.1 6.6 5.7 4.3 4.5
50 18.0 16.7 16.3 21.7 14.9 14.1 21.4 17.3 15.8 17.0 75 43.0 39.2 45.1 62.9 46.1 38.6 45.2 44.9 34.9 31.8
Percentage of fixed assetsLong-term equity and liabilities 25 117.5 119.9 91.1 119.9 137.2 146.0 116.9 102.2 110.0 114.8
50 207.3 211.8 199.2 263.2 284.5 288.7 202.7 210.0 182.4 178.0 75 451.6 478.6 510.8 594.0 718.5 900.0 451.6 484.1 346.7 345.2
Percentage of short-term liabilitiesCash resources and short-term receivables 25 55.4 56.6 43.2 44.9 48.1 49.6 54.9 53.0 72.3 74.4
50 113.2 109.8 122.1 130.3 113.9 107.3 104.5 99.4 125.2 128.1 75 243.5 265.9 244.6 315.8 320.4 314.8 235.8 246.7 226.0 241.9
Percentage of cost of materialsTrade payables 25 4.2 3.5 5.2 3.9 4.0 3.7 4.0 3.3 4.5 3.6
50 7.1 7.0 9.4 10.1 7.2 6.9 7.3 7.6 6.6 5.9 75 12.5 12.3 18.5 17.7 13.0 12.1 12.2 12.7 11.7 10.6
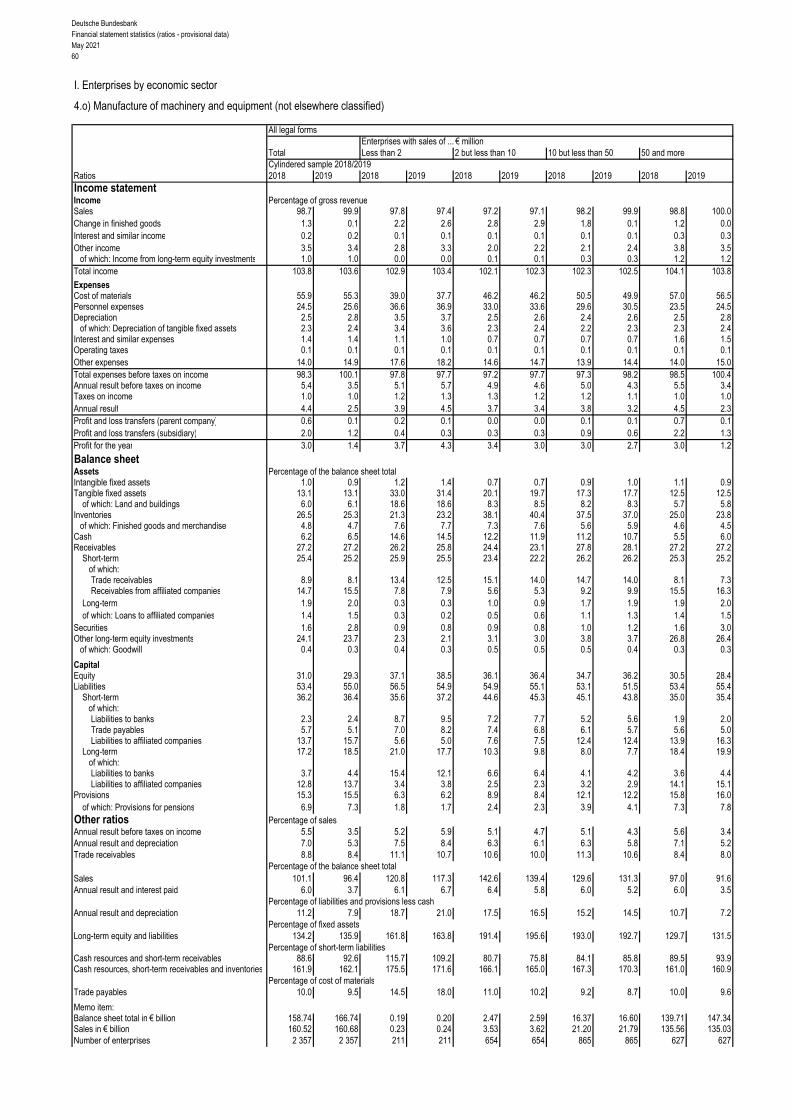
Deutsche BundesbankFinancial statement statistics (ratios - provisional data)May 202160
I. Enterprises by economic sector
4.o) Manufacture of machinery and equipment (not elsewhere classified)
All legal formsEnterprises with sales of ... € million
Total Less than 2 2 but less than 10 10 but less than 50 50 and moreCylindered sample 2018/2019
Ratios 2018 2019 2018 2019 2018 2019 2018 2019 2018 2019Income statementIncome Percentage of gross revenueSales 98.7 99.9 97.8 97.4 97.2 97.1 98.2 99.9 98.8 100.0Change in finished goods 1.3 0.1 2.2 2.6 2.8 2.9 1.8 0.1 1.2 0.0Interest and similar income 0.2 0.2 0.1 0.1 0.1 0.1 0.1 0.1 0.3 0.3Other income 3.5 3.4 2.8 3.3 2.0 2.2 2.1 2.4 3.8 3.5
of which: Income from long-term equity investments 1.0 1.0 0.0 0.0 0.1 0.1 0.3 0.3 1.2 1.2Total income 103.8 103.6 102.9 103.4 102.1 102.3 102.3 102.5 104.1 103.8
ExpensesCost of materials 55.9 55.3 39.0 37.7 46.2 46.2 50.5 49.9 57.0 56.5Personnel expenses 24.5 25.6 36.6 36.9 33.0 33.6 29.6 30.5 23.5 24.5Depreciation 2.5 2.8 3.5 3.7 2.5 2.6 2.4 2.6 2.5 2.8
of which: Depreciation of tangible fixed assets 2.3 2.4 3.4 3.6 2.3 2.4 2.2 2.3 2.3 2.4Interest and similar expenses 1.4 1.4 1.1 1.0 0.7 0.7 0.7 0.7 1.6 1.5Operating taxes 0.1 0.1 0.1 0.1 0.1 0.1 0.1 0.1 0.1 0.1Other expenses 14.0 14.9 17.6 18.2 14.6 14.7 13.9 14.4 14.0 15.0Total expenses before taxes on income 98.3 100.1 97.8 97.7 97.2 97.7 97.3 98.2 98.5 100.4Annual result before taxes on income 5.4 3.5 5.1 5.7 4.9 4.6 5.0 4.3 5.5 3.4Taxes on income 1.0 1.0 1.2 1.3 1.3 1.2 1.2 1.1 1.0 1.0Annual result 4.4 2.5 3.9 4.5 3.7 3.4 3.8 3.2 4.5 2.3Profit and loss transfers (parent company) 0.6 0.1 0.2 0.1 0.0 0.0 0.1 0.1 0.7 0.1Profit and loss transfers (subsidiary) 2.0 1.2 0.4 0.3 0.3 0.3 0.9 0.6 2.2 1.3Profit for the year 3.0 1.4 3.7 4.3 3.4 3.0 3.0 2.7 3.0 1.2
Balance sheetAssets Percentage of the balance sheet totalIntangible fixed assets 1.0 0.9 1.2 1.4 0.7 0.7 0.9 1.0 1.1 0.9Tangible fixed assets 13.1 13.1 33.0 31.4 20.1 19.7 17.3 17.7 12.5 12.5
of which: Land and buildings 6.0 6.1 18.6 18.6 8.3 8.5 8.2 8.3 5.7 5.8Inventories 26.5 25.3 21.3 23.2 38.1 40.4 37.5 37.0 25.0 23.8
of which: Finished goods and merchandise 4.8 4.7 7.6 7.7 7.3 7.6 5.6 5.9 4.6 4.5Cash 6.2 6.5 14.6 14.5 12.2 11.9 11.2 10.7 5.5 6.0Receivables 27.2 27.2 26.2 25.8 24.4 23.1 27.8 28.1 27.2 27.2
Short-term 25.4 25.2 25.9 25.5 23.4 22.2 26.2 26.2 25.3 25.2 of which:
Trade receivables 8.9 8.1 13.4 12.5 15.1 14.0 14.7 14.0 8.1 7.3Receivables from affiliated companies 14.7 15.5 7.8 7.9 5.6 5.3 9.2 9.9 15.5 16.3
Long-term 1.9 2.0 0.3 0.3 1.0 0.9 1.7 1.9 1.9 2.0of which: Loans to affiliated companies 1.4 1.5 0.3 0.2 0.5 0.6 1.1 1.3 1.4 1.5
Securities 1.6 2.8 0.9 0.8 0.9 0.8 1.0 1.2 1.6 3.0Other long-term equity investments 24.1 23.7 2.3 2.1 3.1 3.0 3.8 3.7 26.8 26.4
of which: Goodwill 0.4 0.3 0.4 0.3 0.5 0.5 0.5 0.4 0.3 0.3
CapitalEquity 31.0 29.3 37.1 38.5 36.1 36.4 34.7 36.2 30.5 28.4Liabilities 53.4 55.0 56.5 54.9 54.9 55.1 53.1 51.5 53.4 55.4
Short-term 36.2 36.4 35.6 37.2 44.6 45.3 45.1 43.8 35.0 35.4of which:Liabilities to banks 2.3 2.4 8.7 9.5 7.2 7.7 5.2 5.6 1.9 2.0Trade payables 5.7 5.1 7.0 8.2 7.4 6.8 6.1 5.7 5.6 5.0Liabilities to affiliated companies 13.7 15.7 5.6 5.0 7.6 7.5 12.4 12.4 13.9 16.3
Long-term 17.2 18.5 21.0 17.7 10.3 9.8 8.0 7.7 18.4 19.9 of which:
Liabilities to banks 3.7 4.4 15.4 12.1 6.6 6.4 4.1 4.2 3.6 4.4Liabilities to affiliated companies 12.8 13.7 3.4 3.8 2.5 2.3 3.2 2.9 14.1 15.1
Provisions 15.3 15.5 6.3 6.2 8.9 8.4 12.1 12.2 15.8 16.0of which: Provisions for pensions 6.9 7.3 1.8 1.7 2.4 2.3 3.9 4.1 7.3 7.8
Other ratios Percentage of salesAnnual result before taxes on income 5.5 3.5 5.2 5.9 5.1 4.7 5.1 4.3 5.6 3.4Annual result and depreciation 7.0 5.3 7.5 8.4 6.3 6.1 6.3 5.8 7.1 5.2Trade receivables 8.8 8.4 11.1 10.7 10.6 10.0 11.3 10.6 8.4 8.0
Percentage of the balance sheet totalSales 101.1 96.4 120.8 117.3 142.6 139.4 129.6 131.3 97.0 91.6Annual result and interest paid 6.0 3.7 6.1 6.7 6.4 5.8 6.0 5.2 6.0 3.5
Percentage of liabilities and provisions less cashAnnual result and depreciation 11.2 7.9 18.7 21.0 17.5 16.5 15.2 14.5 10.7 7.2
Percentage of fixed assetsLong-term equity and liabilities 134.2 135.9 161.8 163.8 191.4 195.6 193.0 192.7 129.7 131.5
Percentage of short-term liabilitiesCash resources and short-term receivables 88.6 92.6 115.7 109.2 80.7 75.8 84.1 85.8 89.5 93.9Cash resources, short-term receivables and inventories 161.9 162.1 175.5 171.6 166.1 165.0 167.3 170.3 161.0 160.9
Percentage of cost of materialsTrade payables 10.0 9.5 14.5 18.0 11.0 10.2 9.2 8.7 10.0 9.6
Memo item:Balance sheet total in € billion 158.74 166.74 0.19 0.20 2.47 2.59 16.37 16.60 139.71 147.34Sales in € billion 160.52 160.68 0.23 0.24 3.53 3.62 21.20 21.79 135.56 135.03Number of enterprises 2 357 2 357 211 211 654 654 865 865 627 627

Deutsche BundesbankFinancial statement statistics (ratios - provisional data)
May 202161
I. Enterprises by economic sector
cont'd: 4.o) Manufacture of machinery and equipment (not elsewhere classified)
cont'd: All legal formsEnterprises with sales of ... € million
Total Less than 2 2 but less than 10 10 but less than 50 50 and moreQuartile Cylindered sample 2018/2019value 2018 2019 2018 2019 2018 2019 2018 2019 2018 2019Of the enterprises captured …
Ratios ... % had a ratio of less than …Percentage of gross revenue
Cost of materials 25 38.8 38.1 24.7 24.8 34.7 34.3 40.5 39.7 44.1 43.5 50 48.5 47.9 38.0 37.1 45.2 44.5 48.9 48.3 53.3 52.6 75 58.9 58.2 52.6 50.0 56.5 56.3 58.8 57.9 61.9 60.8
Personnel expenses 25 22.2 23.1 25.8 24.7 24.0 24.5 23.5 24.2 18.9 20.0 50 30.2 31.5 36.5 38.1 33.0 34.1 30.3 31.7 25.7 27.7 75 37.8 38.9 46.1 48.4 41.5 41.6 36.7 37.8 33.4 34.6
Depreciation 25 1.1 1.1 0.9 1.0 1.0 1.0 1.1 1.1 1.1 1.1 50 1.9 2.0 2.0 2.3 1.8 1.8 1.9 2.0 1.9 2.0 75 3.2 3.3 4.2 4.6 3.2 3.2 3.1 3.2 3.1 3.3
Annual result 25 0.9 0.6 0.3 0.4 0.8 0.8 0.9 0.6 1.3 0.4 50 3.5 3.1 3.0 2.9 3.2 2.9 3.3 3.0 4.0 3.6 75 7.0 6.9 7.3 8.6 6.5 6.5 6.4 6.6 8.0 7.5
Percentage of the balance sheet totalTangible fixed assets 25 5.5 5.4 4.8 4.5 4.9 4.9 5.9 6.0 5.8 5.9
50 13.3 13.9 15.8 15.2 12.8 13.5 13.3 14.1 13.0 13.3 75 27.2 28.1 37.6 36.1 30.9 30.4 27.5 28.0 22.5 23.9
Inventories 25 21.0 21.0 5.4 8.4 19.3 20.3 24.8 24.4 21.2 20.6 50 34.2 34.2 20.9 24.6 35.3 36.3 36.5 36.8 32.2 31.1 75 49.1 47.9 39.9 42.8 52.8 52.8 50.1 49.1 45.1 44.2
Equity 25 14.8 16.3 6.0 8.7 13.8 15.2 15.7 18.4 16.3 17.0 50 30.9 32.7 29.1 29.1 32.4 34.3 31.5 33.4 30.3 30.6 75 52.7 55.5 55.8 57.5 55.4 58.7 50.3 52.7 53.8 55.2
Short-term liabilities 25 22.2 20.7 13.8 17.5 21.2 18.7 23.5 22.9 23.2 21.4 50 41.4 40.6 35.4 40.7 41.2 41.1 43.1 41.7 40.9 38.3 75 64.1 61.3 73.1 65.9 65.5 62.0 64.0 60.9 60.9 59.4
Liabilities to banks 25 0.0 0.0 0.0 0.0 0.0 0.0 0.0 0.0 0.0 0.0 50 2.9 3.0 7.1 7.7 7.2 7.2 3.4 3.8 0.0 0.0 75 18.3 18.9 29.7 30.6 25.0 24.0 18.3 19.1 7.5 7.8
Percentage of salesAnnual result before taxes on income 25 1.3 0.8 0.7 0.5 1.2 1.0 1.3 0.8 1.7 0.6
50 4.6 4.1 3.6 3.5 4.3 4.0 4.3 4.1 5.3 4.6 75 9.1 8.7 9.5 11.1 9.0 8.6 8.4 8.3 10.1 9.1
Annual result and depreciation 25 3.4 2.9 2.5 2.4 3.4 3.1 3.4 2.9 3.9 2.8 50 6.9 6.7 7.0 6.8 6.9 6.6 6.5 6.2 7.8 7.3 75 11.9 11.6 12.6 14.5 11.8 11.1 11.4 11.3 12.5 11.8
Trade receivables 25 5.4 4.8 3.2 3.2 5.5 4.7 6.2 5.2 5.0 4.7 50 8.9 8.5 7.1 6.6 9.0 8.2 9.6 9.4 8.4 7.9 75 14.0 13.3 14.5 12.4 13.9 13.7 14.5 13.4 12.6 12.6
Percentage of the balance sheet totalAnnual result and interest paid 25 2.4 2.0 1.5 1.6 2.4 2.4 2.4 1.9 2.6 1.9
50 6.4 5.7 5.7 5.8 6.5 6.2 6.0 5.5 6.7 5.7 75 12.0 11.8 15.4 16.9 12.9 12.2 11.3 11.3 12.0 10.9
Percentage of liabilities and provisions less cashAnnual result and depreciation 25 4.8 4.2 0.2 - 3.1 4.3 4.5 5.6 5.2 6.3 4.1
50 15.2 14.8 11.2 10.4 14.4 15.1 15.1 15.3 16.6 15.2 75 36.5 36.6 42.8 33.7 39.8 40.6 34.9 35.3 33.9 35.0
Percentage of fixed assetsLong-term equity and liabilities 25 119.1 118.9 100.0 100.7 108.7 121.1 126.1 125.2 123.8 114.0
50 200.2 202.7 179.2 220.9 209.9 222.1 205.4 206.7 185.7 186.5 75 398.6 407.4 468.1 587.5 469.5 500.4 400.7 386.4 323.3 322.4
Percentage of short-term liabilitiesCash resources and short-term receivables 25 51.0 51.6 54.6 45.8 43.2 41.9 51.8 55.1 58.5 57.6
50 89.3 91.4 113.8 104.4 82.8 85.0 86.8 86.7 95.1 99.2 75 183.1 183.7 265.6 274.5 193.2 203.7 161.7 165.8 173.5 175.0
Percentage of cost of materialsTrade payables 25 4.6 4.2 3.9 3.8 4.5 3.9 4.8 4.3 4.9 4.3
50 7.9 7.2 10.0 8.9 8.0 7.3 7.7 7.1 7.9 7.0 75 12.9 12.4 20.4 21.5 15.1 14.2 12.2 11.4 11.2 10.9

Deutsche BundesbankFinancial statement statistics (ratios - provisional data)May 202162
I. Enterprises by economic sector
4.p) Manufacture of motor vehicles, trailers and semi-trailers
All legal formsEnterprises with sales of ... € million
Total Less than 2 2 but less than 10 10 but less than 50 50 and moreCylindered sample 2018/2019
Ratios 2018 2019 2018 2019 2018 2019 2018 2019 2018 2019Income statementIncome Percentage of gross revenueSales 99.8 99.9 96.0 94.7 97.9 96.8 98.5 99.4 99.8 99.9Change in finished goods 0.2 0.1 4.0 5.3 2.1 3.2 1.5 0.6 0.2 0.1Interest and similar income 0.5 0.6 0.4 0.3 0.1 0.1 0.1 0.1 0.5 0.6Other income 7.3 5.8 4.4 9.0 2.7 2.5 2.6 1.8 7.4 5.9
of which: Income from long-term equity investments 3.4 2.3 0.0 0.0 0.0 0.0 1.0 0.4 3.4 2.3Total income 107.8 106.4 104.8 109.3 102.8 102.6 102.7 101.9 107.9 106.5
ExpensesCost of materials 72.7 73.5 53.5 50.7 50.2 49.0 56.1 56.2 72.9 73.6Personnel expenses 14.1 14.3 29.8 30.1 30.0 32.0 25.6 25.8 14.0 14.2Depreciation 3.2 3.8 2.2 3.9 2.8 2.6 3.0 3.9 3.2 3.8
of which: Depreciation of tangible fixed assets 3.0 3.3 2.2 3.9 2.6 2.5 2.9 2.9 3.0 3.3Interest and similar expenses 1.8 1.5 1.2 1.4 0.6 0.5 0.8 0.9 1.8 1.5Operating taxes 0.0 0.0 0.1 0.2 0.0 0.1 0.1 0.1 0.0 0.0Other expenses 12.9 13.5 15.7 16.1 15.9 15.8 13.3 13.5 12.9 13.5Total expenses before taxes on income 104.7 106.6 102.5 102.4 99.6 99.9 98.9 100.3 104.8 106.7Annual result before taxes on income 3.1 - 0.2 2.3 7.0 3.1 2.7 3.8 1.6 3.1 - 0.2Taxes on income 1.1 0.9 1.2 1.1 0.9 0.7 0.8 0.7 1.1 0.9Annual result 2.0 - 1.1 1.1 5.8 2.2 1.9 3.0 0.9 2.0 - 1.1Profit and loss transfers (parent company) 2.4 4.3 0.0 0.0 0.0 0.0 0.1 0.0 2.4 4.3Profit and loss transfers (subsidiary) 0.8 1.1 0.2 0.3 1.1 0.8 0.4 - 0.2 0.8 1.1Profit for the year 3.7 2.1 1.0 5.5 1.1 1.1 2.6 1.2 3.7 2.1
Balance sheetAssets Percentage of the balance sheet totalIntangible fixed assets 1.5 1.5 0.1 0.5 0.5 0.6 2.0 1.8 1.5 1.5Tangible fixed assets 11.5 11.6 28.6 41.3 21.7 18.7 23.8 24.5 11.4 11.5
of which: Land and buildings 2.7 2.7 14.1 19.4 9.2 8.4 7.6 7.5 2.7 2.7Inventories 7.4 7.3 29.5 28.9 25.3 29.7 29.3 28.5 7.3 7.2
of which: Finished goods and merchandise 4.1 4.0 14.8 16.5 8.2 8.9 6.3 6.3 4.1 4.0Cash 6.3 4.8 11.8 9.2 12.0 10.7 5.4 6.4 6.3 4.8Receivables 28.6 32.3 28.8 19.4 37.2 37.0 32.3 33.3 28.6 32.3
Short-term 26.8 30.1 27.6 19.4 36.7 36.5 30.5 31.0 26.8 30.1 of which:
Trade receivables 2.7 2.5 10.2 8.1 16.6 16.2 13.7 13.1 2.7 2.5Receivables from affiliated companies 22.3 25.7 11.9 8.2 17.1 17.4 14.2 15.1 22.3 25.8
Long-term 1.8 2.1 1.2 0.0 0.5 0.6 1.8 2.3 1.8 2.1of which: Loans to affiliated companies 1.8 2.1 0.0 0.0 0.3 0.4 1.7 2.1 1.8 2.1
Securities 7.1 6.7 0.0 0.0 0.1 0.2 0.5 0.4 7.1 6.8Other long-term equity investments 37.4 35.6 0.6 0.4 2.8 2.7 6.4 4.8 37.5 35.7
of which: Goodwill 0.1 0.0 0.3 0.2 1.7 1.4 0.0 0.0 0.1 0.0
CapitalEquity 29.5 28.6 26.3 24.3 50.2 47.3 35.3 36.1 29.4 28.6Liabilities 48.2 48.5 66.4 71.2 41.1 45.7 53.9 53.3 48.2 48.4
Short-term 30.4 31.6 47.8 35.8 34.3 34.0 38.9 38.9 30.3 31.6of which:Liabilities to banks 1.1 1.0 9.1 7.2 7.9 8.5 8.1 8.2 1.1 1.0Trade payables 5.0 4.3 15.9 12.0 9.4 9.3 10.0 10.0 4.9 4.3Liabilities to affiliated companies 22.0 23.3 13.3 6.9 11.1 9.1 13.5 14.3 22.1 23.3
Long-term 17.9 16.8 18.5 35.4 6.8 11.7 15.0 14.3 17.9 16.8 of which:
Liabilities to banks 1.3 1.1 8.7 27.5 4.9 4.4 7.0 8.4 1.3 1.1Liabilities to affiliated companies 12.0 10.7 4.1 3.4 1.4 6.4 6.9 4.0 12.0 10.7
Provisions 21.2 21.8 7.3 4.5 8.7 7.0 10.6 10.3 21.3 21.8of which: Provisions for pensions 5.8 6.1 3.4 1.4 1.7 1.7 3.6 3.8 5.8 6.1
Other ratios Percentage of salesAnnual result before taxes on income 3.1 - 0.2 2.4 7.3 3.2 2.7 3.8 1.6 3.1 - 0.2Annual result and depreciation 5.2 2.7 3.5 10.3 5.2 4.6 6.1 4.8 5.2 2.7Trade receivables 3.0 2.9 7.2 7.3 10.9 11.5 8.4 8.0 3.0 2.8
Percentage of the balance sheet totalSales 90.7 88.0 140.6 111.5 151.7 140.1 163.7 163.9 90.3 87.7Annual result and interest paid 3.5 0.4 3.4 8.5 4.3 3.5 6.2 2.9 3.5 0.4
Percentage of liabilities and provisions less cashAnnual result and depreciation 7.4 3.6 7.9 17.3 20.7 15.5 16.7 13.7 7.4 3.6
Percentage of fixed assetsLong-term equity and liabilities 95.6 94.9 158.0 144.5 229.9 266.7 158.5 162.7 95.4 94.7
Percentage of short-term liabilitiesCash resources and short-term receivables 120.9 120.6 82.4 80.0 142.1 138.8 93.3 97.0 121.1 120.7Cash resources, short-term receivables and inventories 145.4 143.8 144.0 160.7 216.0 226.3 168.6 170.3 145.3 143.6
Percentage of cost of materialsTrade payables 7.5 6.6 20.3 20.2 12.0 13.1 10.7 10.8 7.5 6.6
Memo item:Balance sheet total in € billion 497.11 524.31 0.01 0.02 0.24 0.26 1.98 2.00 494.88 522.03Sales in € billion 450.68 461.42 0.02 0.02 0.36 0.36 3.24 3.28 447.06 457.76Number of enterprises 395 395 19 19 64 64 113 113 199 199

Deutsche BundesbankFinancial statement statistics (ratios - provisional data)
May 202163
I. Enterprises by economic sector
cont'd: 4.p) Manufacture of motor vehicles, trailers and semi-trailers
cont'd: All legal formsEnterprises with sales of ... € million
Total Less than 2 2 but less than 10 10 but less than 50 50 and moreQuartile Cylindered sample 2018/2019value 2018 2019 2018 2019 2018 2019 2018 2019 2018 2019Of the enterprises captured …
Ratios ... % had a ratio of less than …Percentage of gross revenue
Cost of materials 25 49.9 49.3 40.2 38.9 36.9 41.6 44.7 47.3 54.7 52.9 50 60.2 59.4 53.8 45.7 54.7 53.5 56.5 56.0 64.0 63.0 75 69.4 68.6 61.0 59.4 66.5 64.5 64.4 64.9 72.2 70.6
Personnel expenses 25 16.1 17.1 23.2 24.3 21.2 21.3 17.3 18.8 13.7 14.7 50 23.4 24.3 27.8 30.3 27.7 29.0 25.4 25.5 20.4 21.1 75 30.6 31.7 35.5 39.1 35.7 36.5 32.6 33.0 26.0 27.6
Depreciation 25 1.1 1.2 0.7 0.8 0.9 0.8 1.1 1.2 1.5 1.6 50 2.5 2.5 1.2 1.5 1.7 1.4 2.3 2.5 3.0 3.0 75 4.0 4.3 2.9 2.9 3.1 2.8 4.1 4.3 4.2 4.8
Annual result 25 - 0.5 - 1.3 - 5.3 1.0 0.6 0.4 0.1 - 0.7 - 1.6 - 2.9 50 1.7 1.6 2.1 2.9 2.4 1.9 1.8 1.3 1.5 1.2 75 4.7 4.3 3.8 5.7 5.3 4.8 5.0 4.3 4.5 3.6
Percentage of the balance sheet totalTangible fixed assets 25 8.8 8.8 6.3 2.9 5.8 4.4 8.5 8.7 11.2 11.0
50 19.2 18.2 19.8 15.6 11.8 11.4 20.7 20.6 20.2 20.0 75 32.8 31.6 45.0 35.7 24.2 22.9 34.8 35.3 32.8 29.9
Inventories 25 12.6 12.5 0.0 0.0 8.6 14.5 20.5 19.1 11.2 11.1 50 26.1 26.2 21.0 39.1 31.5 35.6 31.2 28.9 19.8 19.0 75 41.1 41.9 53.5 62.9 53.4 47.0 46.1 46.3 33.4 33.3
Equity 25 14.9 16.2 2.3 13.8 14.3 14.1 18.9 20.6 14.0 15.7 50 30.6 30.4 22.0 29.4 35.0 34.2 33.5 33.3 28.4 29.7 75 51.6 51.6 53.9 46.0 62.2 56.2 56.3 54.7 46.5 44.3
Short-term liabilities 25 21.3 21.6 36.5 30.2 19.9 21.4 19.8 21.6 22.0 20.2 50 37.8 36.6 46.4 42.3 45.9 41.2 35.4 36.7 36.0 33.9 75 56.3 55.8 68.6 59.5 68.5 67.1 55.9 55.3 50.4 50.8
Liabilities to banks 25 0.0 0.0 0.0 0.0 0.0 0.0 0.0 0.0 0.0 0.0 50 3.4 4.0 2.3 4.0 9.3 7.2 7.6 8.1 1.0 1.8 75 24.4 24.7 27.4 40.8 25.0 27.8 27.6 31.1 18.8 16.5
Percentage of salesAnnual result before taxes on income 25 - 0.5 - 1.2 - 5.0 1.0 1.0 0.4 0.1 - 0.8 - 1.4 - 2.7
50 2.3 1.9 2.7 4.3 2.9 2.5 2.6 1.7 2.0 1.6 75 5.8 5.4 5.0 7.8 7.2 7.2 6.0 5.5 5.4 4.7
Annual result and depreciation 25 2.3 1.5 - 3.9 2.4 2.4 1.9 2.6 1.5 1.9 0.9 50 4.9 4.5 4.1 5.1 4.9 4.4 5.7 5.2 4.4 4.4 75 9.2 8.6 6.9 10.1 9.8 9.4 9.5 9.0 8.9 8.4
Trade receivables 25 4.2 4.3 2.3 2.0 4.3 5.0 4.8 4.7 4.2 3.7 50 7.7 7.4 8.3 6.1 9.1 8.7 8.5 7.8 7.3 7.0 75 11.4 10.3 12.4 9.4 13.5 14.5 11.5 10.1 10.4 9.8
Percentage of the balance sheet totalAnnual result and interest paid 25 0.7 - 0.5 - 8.6 3.0 2.8 2.0 1.6 0.0 - 0.6 - 2.7
50 4.5 4.0 6.2 6.9 6.1 4.4 5.0 4.0 3.7 3.0 75 10.0 8.9 8.6 10.2 12.6 10.6 12.0 9.3 8.9 7.7
Percentage of liabilities and provisions less cashAnnual result and depreciation 25 3.5 2.3 - 10.3 5.7 6.0 3.3 5.8 5.2 2.2 0.5
50 14.0 11.6 9.0 12.1 17.8 11.5 15.8 12.1 13.1 10.7 75 29.1 27.4 28.4 26.4 43.1 24.2 34.2 31.6 28.3 27.4
Percentage of fixed assetsLong-term equity and liabilities 25 94.2 100.2 68.7 77.9 110.8 130.4 125.5 125.3 87.1 92.1
50 161.4 169.5 189.1 198.5 218.3 239.7 185.1 187.3 127.1 141.7 75 283.0 301.9 343.2 1 175.9 591.8 642.0 366.8 365.2 230.1 222.6
Percentage of short-term liabilitiesCash resources and short-term receivables 25 55.3 58.0 24.4 22.3 38.6 57.1 50.7 51.3 64.7 67.3
50 98.1 96.9 86.8 57.2 95.8 94.7 93.0 93.3 101.3 99.9 75 172.6 177.3 122.2 116.4 226.9 182.6 165.8 193.1 172.0 180.7
Percentage of cost of materialsTrade payables 25 5.7 5.4 7.0 2.7 6.8 6.3 5.4 6.2 5.7 5.0
50 9.9 9.3 10.6 10.0 11.0 9.8 9.6 9.3 9.8 8.8 75 14.9 14.7 22.5 21.3 18.9 21.1 14.5 15.2 14.3 12.9

Deutsche BundesbankFinancial statement statistics (ratios - provisional data)May 202164
I. Enterprises by economic sector
4.q) Manufacture of other transport equipment
All legal formsEnterprises with sales of ... € million
Total Less than 2 2 but less than 10 10 but less than 50 50 and moreCylindered sample 2018/2019
Ratios 2018 2019 2018 2019 2018 2019 2018 2019 2018 2019Income statementIncome Percentage of gross revenueSales 98.7 98.3 104.8 101.2 98.9 99.3 97.8 97.8 98.7 98.3Change in finished goods 1.3 1.7 - 4.8 - 1.2 1.1 0.7 2.2 2.2 1.3 1.7Interest and similar income 0.4 0.3 0.0 0.1 0.1 0.1 0.1 0.0 0.4 0.3Other income 7.0 4.8 2.1 4.5 5.0 4.5 3.7 1.9 7.1 4.9
of which: Income from long-term equity investments 0.9 0.8 0.0 0.0 1.1 0.6 0.0 0.0 0.9 0.8Total income 107.4 105.2 102.1 104.6 105.1 104.5 103.8 101.9 107.5 105.3
ExpensesCost of materials 58.2 59.6 49.8 48.0 52.7 56.3 52.4 50.7 58.4 59.9Personnel expenses 23.2 21.9 29.6 29.5 27.9 24.7 28.0 29.1 23.1 21.6Depreciation 2.4 2.9 4.1 3.6 2.6 2.2 2.8 2.6 2.4 2.9
of which: Depreciation of tangible fixed assets 2.1 2.1 4.0 3.6 2.2 2.2 2.6 2.6 2.1 2.0Interest and similar expenses 2.6 2.3 1.3 1.4 0.8 0.8 1.1 1.1 2.7 2.4Operating taxes 0.0 0.0 0.1 0.1 0.1 0.1 0.0 0.0 0.0 0.0Other expenses 20.1 17.1 19.7 19.4 16.3 15.2 17.1 18.1 20.2 17.1Total expenses before taxes on income 106.6 103.8 104.5 101.9 100.3 99.3 101.4 101.6 106.8 103.9Annual result before taxes on income 0.8 1.4 - 2.4 2.6 4.8 5.2 2.4 0.3 0.7 1.4Taxes on income 1.2 1.3 0.4 0.3 1.7 1.9 0.6 0.9 1.2 1.3Annual result - 0.4 0.1 - 2.8 2.3 3.0 3.3 1.8 - 0.5 - 0.5 0.1Profit and loss transfers (parent company) 0.5 0.4 0.0 0.0 0.0 0.0 - 0.1 0.1 0.5 0.4Profit and loss transfers (subsidiary) - 0.2 - 0.3 0.0 0.0 - 1.9 - 2.5 0.5 0.0 - 0.2 - 0.3Profit for the year 0.2 0.7 - 2.8 2.3 5.0 5.8 1.3 - 0.4 0.2 0.7
Balance sheetAssets Percentage of the balance sheet totalIntangible fixed assets 3.1 3.0 4.8 1.8 1.4 1.6 2.8 2.0 3.1 3.0Tangible fixed assets 9.7 9.5 19.6 19.8 19.8 20.5 15.7 16.8 9.6 9.3
of which: Land and buildings 2.6 2.5 7.7 6.6 10.8 10.0 6.0 6.3 2.5 2.4Inventories 38.8 39.5 47.9 43.3 26.6 30.0 35.4 40.2 38.8 39.5
of which: Finished goods and merchandise 1.7 2.4 14.5 15.5 11.6 12.9 7.7 8.2 1.5 2.3Cash 2.1 1.7 3.7 15.0 27.4 23.5 8.7 6.3 2.0 1.6Receivables 34.4 34.4 22.9 19.5 21.2 20.8 31.5 30.8 34.5 34.5
Short-term 32.7 33.9 22.9 19.5 20.7 19.4 30.9 30.1 32.7 34.0 of which:
Trade receivables 7.1 7.3 16.1 11.9 15.0 13.2 11.9 12.9 7.0 7.2Receivables from affiliated companies 23.6 24.4 4.3 3.5 2.5 3.4 14.5 14.5 23.8 24.6
Long-term 1.8 0.4 0.0 0.0 0.4 1.4 0.6 0.7 1.8 0.4of which: Loans to affiliated companies 1.5 0.2 0.0 0.0 0.2 0.1 0.5 0.6 1.5 0.2
Securities 0.2 0.2 0.0 0.0 0.0 0.0 0.0 0.0 0.2 0.2Other long-term equity investments 11.5 11.5 0.4 0.0 3.3 3.3 5.3 3.4 11.6 11.7
of which: Goodwill 0.2 0.1 0.4 0.0 0.2 0.1 2.0 1.6 0.2 0.1
CapitalEquity 14.5 14.4 11.1 29.0 36.0 37.8 24.3 22.6 14.3 14.2Liabilities 61.9 62.8 84.5 67.6 55.5 54.4 61.1 60.2 61.9 62.9
Short-term 52.8 54.0 67.0 51.3 44.9 44.3 47.0 50.6 52.9 54.1of which:Liabilities to banks 0.5 0.6 14.2 11.1 6.8 9.1 5.9 4.9 0.3 0.5Trade payables 9.6 9.6 19.5 16.2 6.9 8.8 11.4 10.0 9.5 9.6Liabilities to affiliated companies 11.6 10.3 7.4 7.3 18.3 14.6 19.5 21.7 11.4 10.1
Long-term 9.1 8.8 17.5 16.3 10.6 10.1 14.1 9.6 9.0 8.8 of which:
Liabilities to banks 3.0 3.1 10.4 11.6 8.6 7.5 6.5 4.5 2.9 3.0Liabilities to affiliated companies 4.3 4.0 5.2 3.2 1.7 0.3 7.4 4.9 4.2 4.0
Provisions 23.6 22.7 2.5 1.9 8.3 7.7 14.5 17.1 23.8 22.9of which: Provisions for pensions 9.1 8.0 0.0 0.0 0.2 0.2 4.2 5.5 9.2 8.1
Other ratios Percentage of salesAnnual result before taxes on income 0.8 1.4 - 2.3 2.6 4.8 5.2 2.5 0.3 0.7 1.4Annual result and depreciation 2.0 3.0 1.2 5.8 5.7 5.6 4.7 2.1 1.9 3.0Trade receivables 8.2 8.1 11.3 9.4 12.2 9.7 9.0 9.2 8.2 8.1
Percentage of the balance sheet totalSales 85.7 90.1 142.2 127.1 123.5 136.8 132.8 141.4 84.8 89.1Annual result and interest paid 1.9 2.2 - 2.1 4.6 4.8 5.6 3.9 0.9 1.9 2.2
Percentage of liabilities and provisions less cashAnnual result and depreciation 2.1 3.2 2.0 13.2 19.1 19.6 9.3 4.2 2.0 3.2
Percentage of fixed assetsLong-term equity and liabilities 124.7 126.9 115.0 209.8 188.6 180.1 174.4 164.6 123.7 126.1
Percentage of short-term liabilitiesCash resources and short-term receivables 66.0 66.1 39.8 67.3 107.2 96.8 84.3 71.8 65.6 65.9Cash resources, short-term receivables and inventories 139.4 139.3 111.4 151.6 166.4 164.5 159.6 151.2 139.1 139.0
Percentage of cost of materialsTrade payables 18.9 17.7 28.9 26.8 10.4 11.4 16.0 13.7 19.0 17.8
Memo item:Balance sheet total in € billion 48.30 49.37 0.01 0.01 0.11 0.11 0.85 0.87 47.32 48.37Sales in € billion 41.40 44.49 0.02 0.02 0.14 0.16 1.13 1.23 40.11 43.08Number of enterprises 128 128 16 16 25 25 41 41 46 46

Deutsche BundesbankFinancial statement statistics (ratios - provisional data)
May 202165
I. Enterprises by economic sector
cont'd: 4.q) Manufacture of other transport equipment
cont'd: All legal formsEnterprises with sales of ... € million
Total Less than 2 2 but less than 10 10 but less than 50 50 and moreQuartile Cylindered sample 2018/2019value 2018 2019 2018 2019 2018 2019 2018 2019 2018 2019Of the enterprises captured …
Ratios ... % had a ratio of less than …Percentage of gross revenue
Cost of materials 25 40.6 40.3 26.9 25.7 36.9 40.4 40.4 40.4 44.5 45.4 50 53.4 53.1 53.4 44.8 51.9 49.8 47.7 48.1 58.4 57.8 75 69.4 70.3 74.9 72.3 66.3 68.3 64.1 64.4 71.1 75.6
Personnel expenses 25 17.1 15.2 16.4 15.8 21.3 22.6 21.0 18.0 13.8 13.6 50 26.3 26.0 25.8 26.8 26.4 26.1 30.2 31.0 22.6 21.3 75 37.1 35.2 41.4 45.8 39.2 34.6 40.0 39.2 31.9 32.0
Depreciation 25 1.1 1.0 1.5 1.2 1.0 0.9 1.5 1.1 1.2 1.0 50 2.0 1.8 2.5 2.1 1.5 1.4 2.2 2.2 1.9 1.7 75 3.5 3.1 3.8 3.2 4.1 3.3 3.5 2.9 3.3 3.1
Annual result 25 - 1.6 0.2 - 9.7 0.5 0.7 2.1 0.2 - 0.8 - 2.8 - 0.8 50 1.3 2.3 - 1.9 2.2 4.2 4.3 1.4 2.0 1.7 1.7 75 5.2 6.0 1.3 3.4 9.4 9.2 4.4 4.5 4.1 5.8
Percentage of the balance sheet totalTangible fixed assets 25 5.6 5.1 5.9 4.2 4.9 3.0 6.1 6.2 5.5 5.6
50 9.3 9.9 9.1 8.9 7.9 6.7 13.4 15.5 8.6 8.4 75 22.9 22.4 17.9 18.9 29.9 26.0 26.4 28.0 17.8 18.3
Inventories 25 23.1 23.5 34.3 29.4 13.8 14.6 22.9 29.5 31.5 34.4 50 39.4 40.6 47.0 52.3 31.0 23.2 37.5 39.5 44.7 48.2 75 56.2 57.9 69.3 68.9 54.0 50.4 46.5 46.7 63.7 60.6
Equity 25 3.7 3.8 - 12.2 - 5.6 7.7 8.9 4.0 3.3 4.5 4.3 50 15.0 19.1 9.3 19.1 27.7 28.3 12.9 18.1 13.8 15.2 75 34.4 36.3 30.7 33.3 74.5 75.9 36.8 36.2 26.5 24.7
Short-term liabilities 25 30.0 25.8 47.5 38.1 14.4 16.3 30.2 25.9 35.3 35.8 50 56.6 52.8 65.0 50.3 37.2 41.2 53.6 48.9 58.8 58.2 75 79.7 74.8 80.3 74.0 81.5 73.8 80.8 81.4 70.7 68.0
Liabilities to banks 25 0.0 0.0 0.0 3.1 0.0 0.0 0.0 0.0 0.0 0.0 50 0.0 0.0 13.1 22.5 0.0 0.0 0.0 0.0 0.0 0.0 75 16.1 17.3 43.4 36.5 28.8 23.7 20.0 18.6 1.1 2.7
Percentage of salesAnnual result before taxes on income 25 - 1.5 0.3 - 10.0 0.6 0.6 2.7 0.3 - 0.9 - 2.8 - 0.7
50 1.5 3.2 - 1.7 2.3 4.4 5.7 1.8 2.8 2.1 2.3 75 6.6 7.4 1.8 4.6 13.2 11.7 5.4 6.5 6.2 7.7
Annual result and depreciation 25 0.3 1.3 - 7.5 3.8 3.6 5.0 1.4 - 0.2 - 0.1 0.3 50 4.3 5.8 0.9 5.3 9.6 9.3 4.2 4.9 3.2 5.1 75 9.4 10.4 6.5 9.1 14.2 14.8 7.9 9.3 8.5 9.5
Trade receivables 25 2.7 3.6 4.0 4.0 3.1 4.4 1.9 2.4 2.9 3.9 50 9.6 8.7 11.0 9.8 9.2 7.4 8.6 8.7 10.4 9.2 75 17.6 14.9 23.6 14.7 15.9 9.8 15.9 14.4 17.5 19.5
Percentage of the balance sheet totalAnnual result and interest paid 25 - 0.1 1.7 - 10.9 2.9 1.9 3.1 1.0 0.3 - 0.1 0.1
50 3.2 5.0 - 0.2 5.0 7.4 8.1 3.0 5.0 3.0 3.8 75 9.4 10.5 5.3 8.1 17.0 15.5 8.1 7.9 7.7 10.5
Percentage of liabilities and provisions less cashAnnual result and depreciation 25 - 0.1 0.2 - 11.3 2.7 - 3.4 - 4.7 2.1 - 0.5 0.0 0.3
50 7.3 7.3 0.9 7.3 19.4 6.7 7.3 7.9 6.7 6.2 75 21.6 25.0 12.1 23.2 51.7 27.3 23.2 23.9 16.1 24.6
Percentage of fixed assetsLong-term equity and liabilities 25 93.6 90.9 25.5 125.7 119.4 142.5 114.8 43.8 61.5 91.5
50 172.8 200.7 154.4 212.3 205.5 283.1 188.2 204.9 148.2 146.0 75 404.2 472.8 218.6 870.9 832.1 677.7 498.5 441.7 373.1 433.0
Percentage of short-term liabilitiesCash resources and short-term receivables 25 31.6 36.0 19.9 24.5 30.6 28.6 51.7 42.7 30.5 38.7
50 69.0 58.7 40.1 53.0 93.9 105.3 73.4 62.8 58.2 54.6 75 117.3 167.5 87.8 121.5 304.6 261.3 112.0 169.4 127.0 123.9
Percentage of cost of materialsTrade payables 25 6.9 7.3 14.2 12.9 4.3 3.7 7.0 6.4 10.5 9.3
50 13.7 12.8 26.4 22.4 8.6 7.8 15.2 12.8 13.7 12.9 75 23.4 21.9 51.2 42.0 15.5 16.1 20.6 20.2 20.9 21.4

Deutsche BundesbankFinancial statement statistics (ratios - provisional data)May 202166
I. Enterprises by economic sector
4.r) Manufacture of furniture
All legal formsEnterprises with sales of ... € million
Total Less than 2 2 but less than 10 10 but less than 50 50 and moreCylindered sample 2018/2019
Ratios 2018 2019 2018 2019 2018 2019 2018 2019 2018 2019Income statementIncome Percentage of gross revenueSales 99.6 100.0 98.3 97.6 102.2 98.6 99.2 99.7 99.6 100.1Change in finished goods 0.4 0.0 1.7 2.4 - 2.2 1.4 0.8 0.3 0.4 - 0.1Interest and similar income 0.1 0.1 0.1 0.1 0.1 0.1 0.0 0.1 0.1 0.1Other income 1.9 2.1 2.4 2.0 3.6 4.0 2.0 1.6 1.8 2.2
of which: Income from long-term equity investments 0.2 0.2 0.0 0.0 0.0 0.0 0.1 0.1 0.3 0.2Total income 101.9 102.2 102.5 102.1 103.7 104.1 102.0 101.6 101.8 102.3
ExpensesCost of materials 54.7 54.7 40.0 40.7 47.2 47.6 55.9 53.8 54.8 55.3Personnel expenses 21.9 22.5 39.9 36.7 31.5 31.5 23.5 24.8 20.9 21.4Depreciation 2.6 2.6 3.0 2.8 2.8 2.8 2.2 2.2 2.7 2.7
of which: Depreciation of tangible fixed assets 2.5 2.5 3.0 2.8 2.8 2.8 2.2 2.1 2.6 2.6Interest and similar expenses 0.5 0.5 1.0 1.0 0.8 0.9 0.5 0.5 0.5 0.5Operating taxes 0.1 0.1 0.1 0.1 0.1 0.1 0.1 0.1 0.1 0.1Other expenses 17.4 17.3 18.5 17.0 18.1 18.4 17.9 18.4 17.2 17.0Total expenses before taxes on income 97.2 97.7 102.6 98.4 100.5 101.3 100.2 99.7 96.2 97.1Annual result before taxes on income 4.7 4.5 - 0.1 3.8 3.2 2.8 1.8 1.9 5.6 5.2Taxes on income 0.9 0.8 0.5 0.8 1.0 1.0 0.8 0.7 0.9 0.8Annual result 3.8 3.7 - 0.6 3.0 2.2 1.8 1.0 1.2 4.7 4.4Profit and loss transfers (parent company) 0.4 0.8 0.0 0.0 7.8 16.1 0.1 0.0 0.3 0.4Profit and loss transfers (subsidiary) 0.4 0.2 0.0 0.0 0.0 0.0 0.3 0.3 0.4 0.1Profit for the year 3.9 4.3 - 0.6 3.0 10.0 17.9 0.8 0.9 4.6 4.6
Balance sheetAssets Percentage of the balance sheet totalIntangible fixed assets 2.2 2.2 0.4 0.4 2.2 1.9 1.2 1.6 2.4 2.3Tangible fixed assets 32.5 34.0 39.3 38.0 31.2 29.7 27.3 27.7 33.7 35.5
of which: Land and buildings 12.6 12.9 21.2 18.5 12.7 11.1 13.2 13.3 12.4 12.8Inventories 16.5 15.0 29.3 26.6 27.6 28.1 26.7 26.8 13.7 12.0
of which: Finished goods and merchandise 3.0 2.7 8.5 6.8 7.1 7.8 6.8 6.9 2.0 1.6Cash 13.2 15.3 7.2 11.7 11.9 14.1 10.8 13.6 13.8 15.7Receivables 29.6 27.6 22.4 21.6 24.1 24.2 32.2 27.9 29.2 27.7
Short-term 28.3 25.8 22.3 21.4 23.5 23.6 31.8 27.0 27.7 25.7 of which:
Trade receivables 16.3 14.7 12.7 13.0 14.8 10.8 18.3 17.5 16.0 14.3Receivables from affiliated companies 9.0 7.9 5.4 5.0 4.5 9.7 9.0 5.1 9.2 8.5
Long-term 1.3 1.8 0.2 0.2 0.6 0.6 0.4 0.9 1.5 2.1of which: Loans to affiliated companies 1.1 1.6 0.0 0.0 0.5 0.4 0.2 0.2 1.4 1.9
Securities 1.1 1.1 0.4 0.4 1.7 0.5 0.2 0.2 1.3 1.3Other long-term equity investments 4.5 4.4 0.2 0.2 0.4 0.8 1.0 1.6 5.4 5.1
of which: Goodwill 0.2 0.2 0.0 0.0 0.0 0.4 0.2 0.2 0.2 0.1
CapitalEquity 39.5 38.6 21.4 24.6 32.5 29.3 33.8 32.2 41.1 40.4Liabilities 42.9 43.6 73.5 70.2 59.8 63.2 53.8 56.3 39.6 40.1
Short-term 35.4 34.3 47.9 49.1 46.7 47.8 40.7 40.9 33.8 32.4of which:Liabilities to banks 3.4 3.4 15.8 13.3 10.9 9.8 6.5 6.0 2.3 2.6Trade payables 7.2 6.3 8.5 8.3 10.7 10.7 7.5 7.4 7.0 5.9Liabilities to affiliated companies 18.7 18.4 2.5 6.9 9.6 9.2 17.8 17.1 19.3 19.1
Long-term 7.5 9.3 25.6 21.1 13.1 15.4 13.1 15.4 5.9 7.7 of which:
Liabilities to banks 4.1 5.1 15.4 15.4 9.0 9.1 6.5 8.1 3.3 4.2Liabilities to affiliated companies 2.9 3.6 7.7 5.1 1.7 1.1 5.8 6.6 2.2 3.0
Provisions 17.6 17.7 5.0 5.2 7.5 7.3 12.3 11.5 19.3 19.5of which: Provisions for pensions 4.9 5.0 1.4 1.4 1.5 1.4 2.2 2.3 5.7 5.7
Other ratios Percentage of salesAnnual result before taxes on income 4.7 4.5 - 0.1 3.9 3.1 2.8 1.8 1.9 5.6 5.2Annual result and depreciation 6.5 6.3 2.5 5.9 5.0 4.7 3.3 3.5 7.5 7.1Trade receivables 8.7 8.3 6.8 7.0 7.5 5.9 8.3 8.1 8.8 8.5
Percentage of the balance sheet totalSales 188.6 177.0 187.3 185.6 197.8 184.1 220.2 217.2 181.1 168.4Annual result and interest paid 8.2 7.4 0.9 7.5 5.8 5.0 3.3 3.8 9.5 8.2
Percentage of liabilities and provisions less cashAnnual result and depreciation 25.9 24.2 6.6 17.3 17.7 15.2 13.0 14.0 30.1 27.2
Percentage of fixed assetsLong-term equity and liabilities 126.3 122.9 119.6 120.5 130.3 138.5 163.5 156.0 120.4 117.8
Percentage of short-term liabilitiesCash resources and short-term receivables 118.4 121.0 61.5 67.4 75.8 79.0 105.0 99.4 124.7 129.3Cash resources, short-term receivables and inventories 165.0 164.6 122.7 121.6 135.0 137.7 170.5 165.0 165.4 166.4
Percentage of cost of materialsTrade payables 6.9 6.5 11.1 10.7 11.7 12.1 6.1 6.3 7.0 6.3
Memo item:Balance sheet total in € billion 4.52 4.88 0.02 0.03 0.13 0.14 0.81 0.80 3.56 3.91Sales in € billion 8.52 8.63 0.05 0.05 0.25 0.25 1.78 1.74 6.44 6.59Number of enterprises 204 204 43 43 47 47 73 73 41 41

Deutsche BundesbankFinancial statement statistics (ratios - provisional data)
May 202167
I. Enterprises by economic sector
cont'd: 4.r) Manufacture of furniture
cont'd: All legal formsEnterprises with sales of ... € million
Total Less than 2 2 but less than 10 10 but less than 50 50 and moreQuartile Cylindered sample 2018/2019value 2018 2019 2018 2019 2018 2019 2018 2019 2018 2019Of the enterprises captured …
Ratios ... % had a ratio of less than …Percentage of gross revenue
Cost of materials 25 39.7 39.6 31.1 29.4 38.3 38.3 45.9 45.5 46.6 45.7 50 49.8 50.0 37.0 37.0 47.0 47.3 54.0 53.7 54.4 53.9 75 58.8 57.8 43.3 47.6 55.5 54.6 60.5 60.1 63.1 63.5
Personnel expenses 25 19.9 19.5 34.6 32.0 24.7 24.7 17.3 18.3 13.3 16.9 50 27.3 27.7 41.8 40.2 29.6 29.7 23.2 24.3 20.9 21.7 75 36.9 36.9 48.2 45.4 39.6 38.6 29.1 31.1 28.7 31.0
Depreciation 25 1.1 1.1 1.0 1.0 1.2 1.2 1.0 1.0 1.3 1.4 50 2.1 2.1 2.2 2.6 2.1 1.9 1.9 1.8 2.4 2.4 75 3.2 3.3 4.9 4.4 3.2 3.3 2.7 2.8 3.2 3.3
Annual result 25 0.0 0.4 - 3.2 0.5 0.8 0.5 0.0 0.3 0.2 0.4 50 1.7 2.2 0.5 2.3 2.4 2.2 1.7 2.0 3.1 2.9 75 5.3 5.5 3.0 5.8 5.9 5.3 4.7 5.5 6.0 4.9
Percentage of the balance sheet totalTangible fixed assets 25 10.4 10.5 8.3 14.6 9.3 8.4 11.2 10.5 13.9 11.5
50 22.3 23.1 19.6 22.6 24.8 23.2 21.6 22.5 22.4 25.0 75 39.4 40.0 51.4 52.4 41.5 40.3 36.6 38.3 39.9 40.0
Inventories 25 15.4 15.0 13.9 13.8 15.4 17.0 18.0 18.4 12.2 11.6 50 24.1 23.7 33.3 24.9 25.6 25.6 28.9 25.1 19.6 19.7 75 37.4 37.2 43.1 41.8 35.8 38.7 41.6 38.0 26.7 25.1
Equity 25 8.5 9.4 0.0 7.1 9.0 9.7 14.2 10.8 13.3 12.3 50 29.3 29.3 21.5 24.0 39.1 45.4 31.0 30.8 30.2 31.4 75 52.5 51.1 54.1 40.6 60.8 65.7 43.0 48.1 48.8 48.3
Short-term liabilities 25 20.0 21.3 21.6 26.8 19.4 19.9 20.9 19.5 21.1 21.3 50 42.6 39.3 47.5 44.0 41.9 40.3 40.0 37.7 31.3 32.0 75 64.6 63.4 74.8 72.1 65.4 67.6 61.5 60.0 56.6 50.4
Liabilities to banks 25 0.0 0.0 6.3 4.2 1.0 0.0 0.0 0.0 0.0 0.0 50 10.1 9.5 20.5 19.5 13.5 9.5 10.8 8.7 2.2 2.2 75 27.4 24.9 45.5 42.4 29.0 28.3 24.6 24.2 10.3 12.1
Percentage of salesAnnual result before taxes on income 25 0.1 0.5 - 3.5 0.5 1.1 1.0 0.2 0.4 1.1 0.5
50 2.3 2.7 0.6 2.4 3.3 3.9 2.5 2.2 3.7 3.5 75 6.4 6.8 3.8 8.3 7.7 7.6 5.8 6.4 7.1 6.9
Annual result and depreciation 25 1.9 2.2 - 0.8 2.5 3.0 1.9 1.8 2.3 2.3 2.5 50 5.0 5.5 3.2 5.4 5.4 5.8 5.0 5.1 5.9 5.8 75 9.7 10.2 7.1 10.7 11.3 10.5 8.1 8.7 9.5 10.3
Trade receivables 25 4.0 3.6 3.3 3.3 3.3 2.8 3.7 3.7 5.5 5.3 50 6.9 6.5 6.0 5.7 6.7 5.4 6.8 7.3 8.7 7.2 75 10.6 9.7 8.7 7.8 10.6 8.6 12.6 11.5 10.3 9.6
Percentage of the balance sheet totalAnnual result and interest paid 25 1.6 2.4 - 6.2 3.7 2.7 3.0 1.8 1.7 2.2 1.4
50 5.1 6.0 2.9 7.4 7.1 5.8 4.9 5.5 8.5 6.3 75 13.3 13.2 10.1 14.7 10.8 13.6 14.3 13.3 13.9 12.8
Percentage of liabilities and provisions less cashAnnual result and depreciation 25 2.1 4.6 - 6.1 5.5 5.3 4.3 1.1 3.9 8.2 9.8
50 15.9 15.6 8.4 13.0 16.3 14.7 14.9 14.2 26.6 17.9 75 37.4 36.8 26.4 27.5 42.4 49.1 37.3 39.8 36.9 40.0
Percentage of fixed assetsLong-term equity and liabilities 25 84.3 93.0 84.3 90.4 67.5 93.8 99.7 101.4 72.1 90.6
50 151.2 145.3 126.2 131.3 165.6 163.8 166.8 146.7 134.9 119.7 75 330.4 317.5 368.8 264.0 384.2 368.2 347.2 273.7 250.5 285.9
Percentage of short-term liabilitiesCash resources and short-term receivables 25 55.7 54.4 36.0 33.6 55.2 44.2 60.9 60.5 67.4 74.2
50 95.9 98.8 66.4 68.6 96.0 120.3 100.2 94.0 125.1 124.1 75 196.6 184.5 152.9 132.0 228.8 210.2 178.6 182.6 202.2 216.3
Percentage of cost of materialsTrade payables 25 3.9 3.6 4.8 4.6 6.0 3.6 2.6 2.8 4.5 3.6
50 7.5 6.5 8.7 7.1 8.3 8.0 5.3 5.0 7.7 7.0 75 10.2 11.9 17.3 15.6 13.2 15.3 9.2 9.1 9.6 8.3

Deutsche BundesbankFinancial statement statistics (ratios - provisional data)May 202168
I. Enterprises by economic sector
4.s) Other manufacturing
All legal formsEnterprises with sales of ... € million
Total Less than 2 2 but less than 10 10 but less than 50 50 and moreCylindered sample 2018/2019
Ratios 2018 2019 2018 2019 2018 2019 2018 2019 2018 2019Income statementIncome Percentage of gross revenueSales 98.3 98.9 99.6 99.3 99.6 99.1 99.0 99.2 98.1 98.8Change in finished goods 1.7 1.1 0.4 0.7 0.4 0.9 1.0 0.8 1.9 1.2Interest and similar income 0.6 0.7 0.1 0.2 0.1 0.1 0.3 0.4 0.7 0.8Other income 4.3 4.8 3.2 3.5 2.5 3.2 2.8 2.8 4.7 5.3
of which: Income from long-term equity investments 1.4 1.4 0.0 0.0 0.1 0.1 0.3 0.2 1.7 1.7Total income 104.9 105.5 103.3 103.7 102.7 103.4 103.2 103.1 105.5 106.2
ExpensesCost of materials 46.6 46.6 29.0 28.4 41.5 41.0 44.7 45.3 47.4 47.4Personnel expenses 24.9 25.3 40.5 40.4 32.7 33.2 30.6 30.0 23.1 23.7Depreciation 5.0 5.3 4.0 4.0 2.8 2.8 3.3 2.9 5.5 6.0
of which: Depreciation of tangible fixed assets 4.5 4.5 4.0 4.0 2.7 2.7 2.9 2.8 4.9 5.0Interest and similar expenses 1.8 1.7 1.2 1.0 0.7 0.7 1.0 1.0 2.0 2.0Operating taxes 0.0 0.0 0.1 0.1 0.1 0.1 0.1 0.1 0.0 0.0Other expenses 19.2 18.2 21.2 20.2 18.4 18.9 18.9 18.8 19.3 18.0Total expenses before taxes on income 97.6 97.2 96.0 94.2 96.2 96.8 98.5 97.9 97.5 97.1Annual result before taxes on income 7.3 8.3 7.3 9.5 6.5 6.6 4.7 5.2 8.0 9.1Taxes on income 1.2 1.2 2.0 2.1 1.7 1.5 1.2 1.3 1.2 1.2Annual result 6.1 7.1 5.3 7.5 4.7 5.0 3.5 3.9 6.8 7.9Profit and loss transfers (parent company) 0.8 1.3 0.0 0.0 0.1 0.0 0.3 0.7 0.9 1.5Profit and loss transfers (subsidiary) 3.0 3.7 - 0.4 0.1 0.0 - 0.1 1.0 1.3 3.6 4.5Profit for the year 3.9 4.7 5.8 7.4 4.8 5.2 2.8 3.3 4.1 5.0
Balance sheetAssets Percentage of the balance sheet totalIntangible fixed assets 2.3 2.2 0.4 0.5 1.8 1.4 1.4 1.4 2.5 2.3Tangible fixed assets 18.2 18.2 29.5 30.2 24.0 24.9 19.6 19.4 17.8 17.9
of which: Land and buildings 5.7 5.6 7.4 6.6 11.2 11.3 8.2 8.2 5.2 5.0Inventories 14.3 14.3 24.7 23.9 29.8 30.4 26.9 26.2 12.1 12.2
of which: Finished goods and merchandise 7.5 7.4 15.2 13.7 13.6 14.6 14.0 13.1 6.4 6.4Cash 6.0 5.6 16.9 16.9 14.3 12.0 8.3 7.5 5.4 5.1Receivables 44.2 43.7 23.6 24.0 26.3 26.7 35.2 36.9 46.0 45.2
Short-term 36.1 36.1 23.0 23.3 25.6 26.1 30.5 32.2 37.3 37.0 of which:
Trade receivables 6.4 6.1 14.2 13.7 13.5 12.4 11.5 11.1 5.4 5.2Receivables from affiliated companies 28.3 28.6 4.5 5.7 9.3 10.6 16.2 18.2 30.6 30.6
Long-term 8.0 7.6 0.6 0.6 0.7 0.6 4.7 4.7 8.7 8.2of which: Loans to affiliated companies 7.7 7.1 0.4 0.3 0.4 0.4 3.3 3.1 8.5 7.9
Securities 0.6 1.1 0.3 0.5 1.0 0.8 0.1 0.1 0.7 1.2Other long-term equity investments 14.2 14.7 3.8 3.3 2.2 3.3 8.1 8.1 15.4 15.9
of which: Goodwill 0.4 0.3 3.6 3.2 0.9 0.9 0.8 0.7 0.3 0.2
CapitalEquity 34.9 35.1 29.8 33.6 47.9 50.9 44.4 43.8 33.2 33.4Liabilities 49.6 49.0 59.0 55.7 42.5 40.0 40.4 40.7 51.0 50.4
Short-term 33.4 34.9 41.9 40.4 29.6 28.3 31.3 32.1 33.8 35.4of which:Liabilities to banks 6.2 7.0 8.6 9.0 6.7 6.4 5.1 5.2 6.4 7.3Trade payables 3.1 3.2 10.4 9.0 5.8 5.5 5.6 5.7 2.7 2.8Liabilities to affiliated companies 21.6 21.7 8.6 14.2 11.0 11.2 16.9 16.6 22.6 22.8
Long-term 16.1 14.2 17.1 15.3 12.8 11.7 9.1 8.6 17.2 15.0 of which:
Liabilities to banks 12.8 10.7 10.1 9.2 6.5 7.9 5.4 5.3 14.0 11.6Liabilities to affiliated companies 2.4 2.5 3.4 2.6 5.7 3.3 2.5 2.1 2.3 2.6
Provisions 14.6 15.0 10.4 9.8 9.2 8.8 14.6 14.9 14.8 15.2of which: Provisions for pensions 9.3 9.7 3.1 3.5 2.9 3.0 8.1 8.2 9.7 10.1
Other ratios Percentage of salesAnnual result before taxes on income 7.5 8.4 7.3 9.6 6.5 6.7 4.7 5.2 8.1 9.2Annual result and depreciation 11.3 12.6 9.4 11.5 7.6 7.9 6.8 6.9 12.6 14.1Trade receivables 7.5 7.2 9.2 8.6 9.2 8.6 9.1 8.8 7.1 6.8
Percentage of the balance sheet totalSales 84.6 84.4 155.0 158.7 146.5 143.6 126.1 126.2 76.8 76.7Annual result and interest paid 6.8 7.5 10.2 13.6 8.0 8.3 5.7 6.2 6.9 7.7
Percentage of liabilities and provisions less cashAnnual result and depreciation 16.2 17.9 27.3 37.0 29.6 30.6 18.2 17.8 15.7 17.6
Percentage of fixed assetsLong-term equity and liabilities 139.6 135.3 145.3 151.2 220.4 215.4 181.8 180.5 133.7 129.1
Percentage of short-term liabilitiesCash resources and short-term receivables 126.3 119.9 95.9 100.8 137.3 136.6 123.8 123.8 126.5 119.1Cash resources, short-term receivables and inventories 169.0 161.1 155.0 159.9 237.9 243.8 209.6 205.4 162.2 153.6
Percentage of cost of materialsTrade payables 7.7 8.1 23.0 19.8 9.6 9.3 9.8 10.0 7.2 7.6
Memo item:Balance sheet total in € billion 22.42 23.49 0.06 0.06 0.52 0.55 2.68 2.84 19.16 20.05Sales in € billion 18.96 19.84 0.09 0.10 0.76 0.79 3.38 3.58 14.72 15.37Number of enterprises 434 434 102 102 130 130 132 132 70 70

Deutsche BundesbankFinancial statement statistics (ratios - provisional data)
May 202169
I. Enterprises by economic sector
cont'd: 4.s) Other manufacturing
cont'd: All legal formsEnterprises with sales of ... € million
Total Less than 2 2 but less than 10 10 but less than 50 50 and moreQuartile Cylindered sample 2018/2019value 2018 2019 2018 2019 2018 2019 2018 2019 2018 2019Of the enterprises captured …
Ratios ... % had a ratio of less than …Percentage of gross revenue
Cost of materials 25 26.7 26.2 15.7 14.7 29.8 29.5 34.6 35.3 33.5 32.1 50 39.2 39.3 23.5 23.2 40.9 40.7 42.4 43.5 42.8 41.9 75 50.9 51.3 38.8 39.8 51.4 52.3 56.6 57.2 52.1 51.3
Personnel expenses 25 21.0 21.4 22.8 22.7 23.6 24.1 19.7 19.9 19.6 19.3 50 31.4 31.6 39.7 42.1 32.5 32.4 31.4 30.5 24.2 26.3 75 42.0 42.2 55.4 56.6 40.4 40.6 39.8 39.0 32.2 32.2
Depreciation 25 1.4 1.3 1.4 1.3 1.0 1.1 1.5 1.5 1.8 1.8 50 2.6 2.4 2.9 2.8 1.9 1.9 2.9 2.5 3.0 2.7 75 4.7 4.7 5.6 5.5 3.7 3.4 4.7 4.6 5.9 6.0
Annual result 25 0.7 1.1 0.2 0.9 1.2 1.4 0.0 0.7 3.0 3.2 50 4.1 4.3 5.2 4.5 4.2 4.5 2.8 3.2 7.1 6.1 75 9.2 9.6 13.0 13.8 8.8 8.2 6.9 7.0 14.4 15.0
Percentage of the balance sheet totalTangible fixed assets 25 6.8 6.9 7.2 7.6 6.1 6.2 6.0 6.6 7.9 8.8
50 16.9 16.8 18.5 21.5 15.0 15.9 17.7 17.1 14.5 13.5 75 32.4 32.2 36.6 41.3 32.0 32.5 31.5 30.0 21.1 24.4
Inventories 25 13.4 12.5 7.0 5.4 17.3 17.0 18.7 17.3 8.9 8.6 50 25.6 24.7 17.7 16.8 33.0 33.9 29.5 28.3 17.9 16.5 75 39.3 40.0 36.1 29.3 47.2 49.3 39.6 41.0 28.6 29.1
Equity 25 18.1 19.1 6.0 9.7 20.8 22.5 20.9 22.5 16.9 15.4 50 39.8 41.6 34.3 41.4 44.4 49.6 39.8 37.9 35.4 35.2 75 63.8 63.9 62.4 63.2 66.9 66.3 61.9 61.9 61.7 57.5
Short-term liabilities 25 12.7 11.0 12.7 11.7 11.7 9.8 13.9 13.4 15.0 11.5 50 28.2 27.4 33.3 29.4 26.0 20.4 29.3 31.6 26.9 30.2 75 49.5 49.5 54.4 49.2 41.0 41.6 51.6 55.5 43.4 47.9
Liabilities to banks 25 0.0 0.0 0.0 0.0 0.0 0.0 0.0 0.0 0.0 0.0 50 5.9 6.1 12.7 10.9 11.0 12.3 3.4 4.4 0.0 0.0 75 25.7 24.8 33.3 33.2 26.6 25.0 24.0 21.7 7.2 3.7
Percentage of salesAnnual result before taxes on income 25 0.9 1.5 0.5 1.4 1.6 1.4 0.3 1.3 3.6 4.2
50 5.4 5.6 5.8 5.8 5.9 6.2 3.7 3.8 7.9 7.6 75 12.0 12.5 15.8 15.5 11.0 11.1 8.5 8.9 16.4 17.0
Annual result and depreciation 25 3.9 4.5 3.3 5.0 4.0 3.9 3.5 3.2 6.6 7.7 50 8.7 8.8 9.4 10.8 8.2 8.2 7.9 7.5 12.0 13.3 75 15.6 15.7 21.0 20.6 14.7 14.4 11.9 11.9 20.4 21.2
Trade receivables 25 3.9 3.5 3.2 2.8 4.0 3.8 4.3 3.7 3.8 4.8 50 7.9 7.6 7.1 6.2 7.6 7.7 8.0 7.6 8.8 9.0 75 12.1 12.0 11.8 11.3 12.7 11.4 11.7 12.1 12.1 12.2
Percentage of the balance sheet totalAnnual result and interest paid 25 2.8 3.6 2.1 4.2 3.9 3.9 1.3 2.6 4.1 4.0
50 7.7 8.1 11.0 12.6 8.1 8.4 5.3 5.8 8.6 8.4 75 15.9 16.6 22.1 25.0 15.9 14.9 11.0 10.8 16.7 19.0
Percentage of liabilities and provisions less cashAnnual result and depreciation 25 3.1 5.1 - 11.2 - 3.4 3.1 4.5 5.6 6.5 9.8 8.3
50 21.8 21.8 16.4 22.3 29.6 24.3 19.1 16.9 24.4 24.1 75 53.5 60.1 72.1 71.9 52.9 56.0 41.1 48.3 53.5 50.4
Percentage of fixed assetsLong-term equity and liabilities 25 116.9 118.7 72.2 82.1 147.5 145.4 120.3 119.5 109.9 103.3
50 197.1 204.9 178.6 193.1 254.9 243.8 195.1 201.7 166.6 163.7 75 375.3 399.5 390.9 403.7 604.5 592.3 317.0 352.0 307.8 285.6
Percentage of short-term liabilitiesCash resources and short-term receivables 25 66.8 64.7 53.6 55.9 67.9 64.6 66.6 60.9 81.1 87.5
50 142.7 132.3 149.9 158.2 153.3 149.7 112.3 113.2 139.9 125.2 75 278.1 335.7 296.2 360.0 262.8 349.8 281.4 273.6 276.4 382.9
Percentage of cost of materialsTrade payables 25 4.5 4.2 4.2 4.4 4.4 3.4 5.1 4.9 4.4 3.9
50 8.5 8.1 10.5 10.7 7.4 7.3 8.7 8.5 8.5 7.9 75 15.0 15.0 26.8 25.7 13.6 12.1 13.8 15.1 11.4 12.7

Deutsche BundesbankFinancial statement statistics (ratios - provisional data)May 202170
I. Enterprises by economic sector
4.t) Repair and installation of machinery and equipment
All legal formsEnterprises with sales of ... € million
Total Less than 2 2 but less than 10 10 but less than 50 50 and moreCylindered sample 2018/2019
Ratios 2018 2019 2018 2019 2018 2019 2018 2019 2018 2019Income statementIncome Percentage of gross revenueSales 90.6 91.5 98.3 97.8 97.1 98.6 100.4 97.9 86.3 88.6Change in finished goods 9.4 8.5 1.7 2.2 2.9 1.4 - 0.4 2.1 13.7 11.4Interest and similar income 0.1 0.1 0.1 0.1 0.1 0.1 0.1 0.1 0.0 0.2Other income 2.6 2.2 2.3 2.7 2.4 2.3 2.6 2.6 2.6 2.0
of which: Income from long-term equity investments 0.1 0.1 0.1 0.1 0.2 0.1 0.2 0.1 0.0 0.0Total income 102.7 102.3 102.5 102.8 102.6 102.5 102.7 102.7 102.7 102.2
ExpensesCost of materials 61.1 61.2 37.4 36.0 46.9 48.8 48.7 47.9 67.4 67.3Personnel expenses 24.6 24.6 37.1 38.1 32.4 31.4 32.3 33.1 20.8 20.9Depreciation 1.6 1.6 2.7 2.4 2.3 2.3 2.0 1.9 1.4 1.5
of which: Depreciation of tangible fixed assets 1.5 1.5 2.4 2.3 2.2 2.1 1.7 1.7 1.4 1.3Interest and similar expenses 1.1 0.7 0.7 0.5 0.7 0.6 0.9 0.9 1.3 0.6Operating taxes 0.0 0.0 0.1 0.1 0.1 0.1 0.1 0.1 0.0 0.0Other expenses 11.6 12.1 18.5 19.2 15.4 15.0 16.1 15.6 9.5 10.5Total expenses before taxes on income 100.0 100.2 96.4 96.3 97.7 98.2 100.0 99.5 100.3 100.8Annual result before taxes on income 2.6 2.1 6.0 6.5 4.8 4.2 2.7 3.2 2.3 1.4Taxes on income 0.8 0.8 1.5 1.5 1.2 1.1 1.2 1.1 0.6 0.6Annual result 1.8 1.3 4.5 5.0 3.6 3.2 1.5 2.1 1.7 0.8Profit and loss transfers (parent company) - 0.1 0.1 0.0 0.0 0.0 0.0 0.0 0.0 - 0.1 0.2Profit and loss transfers (subsidiary) 0.3 - 0.1 0.0 0.1 0.3 0.3 - 0.1 0.4 0.5 - 0.4Profit for the year 1.4 1.5 4.5 4.9 3.2 2.9 1.6 1.7 1.2 1.3
Balance sheetAssets Percentage of the balance sheet totalIntangible fixed assets 0.9 0.8 0.2 0.2 0.4 0.4 2.0 1.8 0.5 0.5Tangible fixed assets 14.9 14.4 22.9 20.4 21.9 22.3 13.8 13.1 14.5 14.0
of which: Land and buildings 5.4 5.5 9.2 7.1 9.7 9.5 6.5 6.2 4.5 4.8Inventories 40.2 39.6 20.9 24.3 29.1 30.7 29.7 33.3 45.7 43.1
of which: Finished goods and merchandise 6.5 8.4 8.9 8.6 8.2 8.6 3.3 3.5 7.5 10.2Cash 6.4 5.8 17.6 15.7 14.6 12.6 10.8 11.2 3.6 3.0Receivables 32.0 34.3 36.8 37.3 30.5 30.9 34.6 32.1 31.1 35.4
Short-term 30.9 33.3 36.3 36.9 28.7 29.1 31.3 29.2 31.0 35.2 of which:
Trade receivables 10.4 9.4 20.1 20.5 17.4 17.9 14.6 12.7 7.9 7.2Receivables from affiliated companies 18.0 21.2 11.5 11.1 6.9 7.7 11.6 11.4 21.7 26.3
Long-term 1.1 0.9 0.5 0.4 1.8 1.7 3.2 2.9 0.2 0.1of which: Loans to affiliated companies 0.8 0.8 0.2 0.0 0.7 0.7 2.9 2.6 0.1 0.1
Securities 0.2 0.2 0.4 0.5 0.6 0.4 0.5 0.6 0.0 0.0Other long-term equity investments 5.2 4.7 0.5 0.9 2.6 2.5 8.0 7.4 4.5 4.0
of which: Goodwill 0.7 0.5 0.4 0.3 0.4 0.3 2.3 1.7 0.1 0.1
CapitalEquity 27.1 26.3 35.0 35.4 33.8 34.9 33.2 31.1 24.0 23.6Liabilities 54.0 55.7 54.7 54.9 56.5 56.4 49.1 51.4 55.6 57.2
Short-term 41.1 41.9 41.8 42.5 46.8 47.8 38.5 43.1 41.5 40.9of which:Liabilities to banks 2.6 2.4 8.5 8.9 6.9 7.5 3.1 2.8 1.9 1.7Trade payables 7.0 6.3 9.3 9.1 10.9 10.3 7.2 6.8 6.5 5.8Liabilities to affiliated companies 12.3 13.2 4.9 4.5 8.9 10.7 8.6 8.8 14.2 15.3
Long-term 12.9 13.7 12.9 12.3 9.7 8.6 10.6 8.3 14.1 16.3 of which:
Liabilities to banks 4.0 3.7 5.9 4.8 6.3 6.2 2.9 2.8 4.1 3.9Liabilities to affiliated companies 8.1 9.3 6.2 6.9 2.4 1.5 5.0 3.3 10.0 12.3
Provisions 18.4 17.6 9.9 9.0 9.6 8.6 17.7 17.5 19.7 18.6of which: Provisions for pensions 7.8 7.7 3.1 2.0 2.5 2.3 9.0 9.2 7.9 7.8
Other ratios Percentage of salesAnnual result before taxes on income 2.9 2.3 6.1 6.7 5.0 4.3 2.6 3.3 2.7 1.6Annual result and depreciation 3.8 3.2 7.3 7.5 6.0 5.6 3.5 4.1 3.6 2.5Trade receivables 7.5 6.9 10.1 10.8 11.7 11.1 10.2 9.7 5.8 5.4
Percentage of the balance sheet totalSales 139.0 135.8 198.6 190.8 149.0 161.6 143.3 130.2 135.3 134.5Annual result and interest paid 4.6 3.0 10.5 10.7 6.6 6.3 3.4 4.1 4.7 2.1
Percentage of liabilities and provisions less cashAnnual result and depreciation 7.9 6.5 30.6 29.3 17.4 17.1 8.9 9.3 6.8 4.7
Percentage of fixed assetsLong-term equity and liabilities 215.9 228.2 207.9 221.8 169.8 169.0 193.5 190.7 234.4 255.9
Percentage of short-term liabilitiesCash resources and short-term receivables 91.0 93.6 129.1 123.6 92.7 87.5 110.2 94.5 83.4 93.4Cash resources, short-term receivables and inventories 188.9 188.1 179.1 180.7 154.8 151.7 187.5 171.9 193.4 198.6
Percentage of cost of materialsTrade payables 7.5 7.0 12.3 13.0 15.1 12.9 10.4 10.6 6.2 5.6
Memo item:Balance sheet total in € billion 5.51 6.01 0.06 0.06 0.38 0.39 1.41 1.51 3.67 4.04Sales in € billion 7.66 8.15 0.11 0.12 0.56 0.63 2.02 1.97 4.97 5.44Number of enterprises 346 346 114 114 128 128 84 84 20 20

Deutsche BundesbankFinancial statement statistics (ratios - provisional data)
May 202171
I. Enterprises by economic sector
cont'd: 4.t) Repair and installation of machinery and equipment
cont'd: All legal formsEnterprises with sales of ... € million
Total Less than 2 2 but less than 10 10 but less than 50 50 and moreQuartile Cylindered sample 2018/2019value 2018 2019 2018 2019 2018 2019 2018 2019 2018 2019Of the enterprises captured …
Ratios ... % had a ratio of less than …Percentage of gross revenue
Cost of materials 25 30.1 29.0 23.7 20.7 30.1 29.7 37.7 36.7 44.2 43.8 50 44.0 43.2 35.3 32.6 46.1 46.8 49.1 46.8 56.1 56.6 75 58.7 59.6 50.1 48.1 61.7 62.5 60.8 63.0 77.6 75.4
Personnel expenses 25 20.5 21.9 25.2 25.0 19.5 20.9 21.1 21.2 10.4 12.0 50 33.6 33.1 36.6 38.2 33.9 31.4 29.5 31.4 21.9 23.5 75 45.8 45.7 50.3 50.2 44.5 43.9 44.7 44.3 36.6 37.2
Depreciation 25 0.8 0.8 0.7 0.9 0.9 0.9 0.8 0.7 0.4 0.5 50 1.5 1.6 1.5 1.6 1.6 1.6 1.4 1.4 0.9 1.3 75 2.7 2.8 3.3 3.0 2.6 2.6 2.2 2.5 2.3 3.0
Annual result 25 0.4 0.7 0.4 1.0 1.0 0.8 - 0.3 0.6 - 0.2 - 1.4 50 2.7 2.6 2.6 3.4 3.4 2.5 2.5 2.5 1.9 0.8 75 6.4 6.5 8.3 9.4 6.9 6.1 5.4 5.9 3.8 4.0
Percentage of the balance sheet totalTangible fixed assets 25 3.3 2.9 3.2 3.1 3.8 3.8 3.2 2.7 1.7 1.4
50 10.4 10.9 11.1 11.7 12.3 13.7 7.5 7.8 9.9 10.8 75 28.1 25.7 30.5 27.5 30.7 32.3 22.5 21.9 20.2 23.6
Inventories 25 6.8 7.2 1.6 1.6 8.9 9.4 11.7 11.5 26.3 23.4 50 19.6 20.4 9.9 10.8 19.5 22.4 27.3 29.0 45.8 34.6 75 38.0 39.3 30.6 26.0 38.0 37.8 45.7 47.7 60.1 55.5
Equity 25 12.4 14.2 12.4 15.4 13.9 16.0 10.7 9.5 11.0 12.0 50 28.3 31.4 27.2 31.8 34.7 34.5 26.0 28.8 21.4 19.9 75 51.8 54.4 53.7 63.0 54.9 55.7 46.1 48.8 29.7 33.8
Short-term liabilities 25 23.1 19.7 23.7 19.6 22.7 18.5 21.1 20.2 27.7 27.6 50 43.6 42.2 42.4 39.5 44.3 43.4 48.1 43.0 42.2 48.4 75 68.1 62.0 70.7 60.7 63.7 61.3 65.9 65.3 73.3 73.6
Liabilities to banks 25 0.0 0.0 0.0 0.0 0.0 0.0 0.0 0.0 0.0 0.0 50 1.1 1.5 2.8 3.5 5.2 8.5 0.0 0.0 0.0 0.0 75 19.4 22.9 30.7 31.6 22.2 24.3 6.4 3.3 8.6 13.2
Percentage of salesAnnual result before taxes on income 25 0.6 0.9 0.6 1.3 1.3 0.9 - 0.1 0.8 0.1 - 1.8
50 3.9 3.7 4.1 4.7 4.6 3.5 3.7 3.5 2.3 0.9 75 8.4 8.6 11.8 11.0 8.3 7.9 6.6 7.5 5.8 4.9
Annual result and depreciation 25 2.2 2.5 2.4 2.9 3.0 2.7 1.5 2.1 1.5 0.6 50 6.0 5.9 6.5 7.0 7.3 6.1 4.9 5.2 4.1 3.1 75 11.3 11.1 15.8 15.0 11.1 10.8 9.2 9.7 6.6 7.2
Trade receivables 25 4.6 4.1 3.8 3.7 5.8 4.6 4.6 4.2 2.6 1.7 50 8.7 8.2 7.9 6.8 9.8 10.4 9.8 10.6 5.5 5.8 75 14.8 14.5 12.8 13.6 15.5 15.4 16.8 14.7 9.8 12.3
Percentage of the balance sheet totalAnnual result and interest paid 25 2.0 2.5 1.9 3.5 2.7 2.7 0.8 2.1 0.6 - 1.1
50 6.3 6.2 8.6 10.6 6.5 5.7 4.3 6.0 3.7 2.6 75 14.1 15.7 22.8 22.4 14.3 14.3 11.1 11.7 7.5 6.5
Percentage of liabilities and provisions less cashAnnual result and depreciation 25 2.6 3.4 2.3 0.8 3.4 4.6 2.1 2.0 4.0 1.4
50 13.8 15.6 16.7 19.3 16.6 18.9 8.2 11.5 9.2 9.5 75 44.4 46.8 71.6 56.0 47.8 50.3 30.8 29.3 12.6 14.9
Percentage of fixed assetsLong-term equity and liabilities 25 100.8 115.7 74.8 100.0 108.4 130.0 108.2 114.9 143.3 143.4
50 217.6 233.4 203.3 263.9 214.3 223.2 258.6 232.4 222.3 247.3 75 587.9 581.1 700.0 671.4 435.5 428.4 626.4 633.1 591.7 429.8
Percentage of short-term liabilitiesCash resources and short-term receivables 25 59.3 62.5 70.0 68.5 54.5 63.1 64.0 55.4 53.5 58.8
50 107.1 111.0 104.9 159.0 113.4 104.7 116.2 97.6 75.3 87.2 75 222.4 257.8 264.6 267.9 229.8 250.6 180.4 264.7 121.5 120.8
Percentage of cost of materialsTrade payables 25 5.6 4.8 3.5 3.8 5.9 5.0 6.0 5.4 4.9 3.5
50 10.5 8.7 9.7 8.7 12.4 8.5 10.2 9.1 8.4 9.6 75 18.7 16.6 21.6 20.0 23.2 16.8 14.1 13.8 13.3 13.7
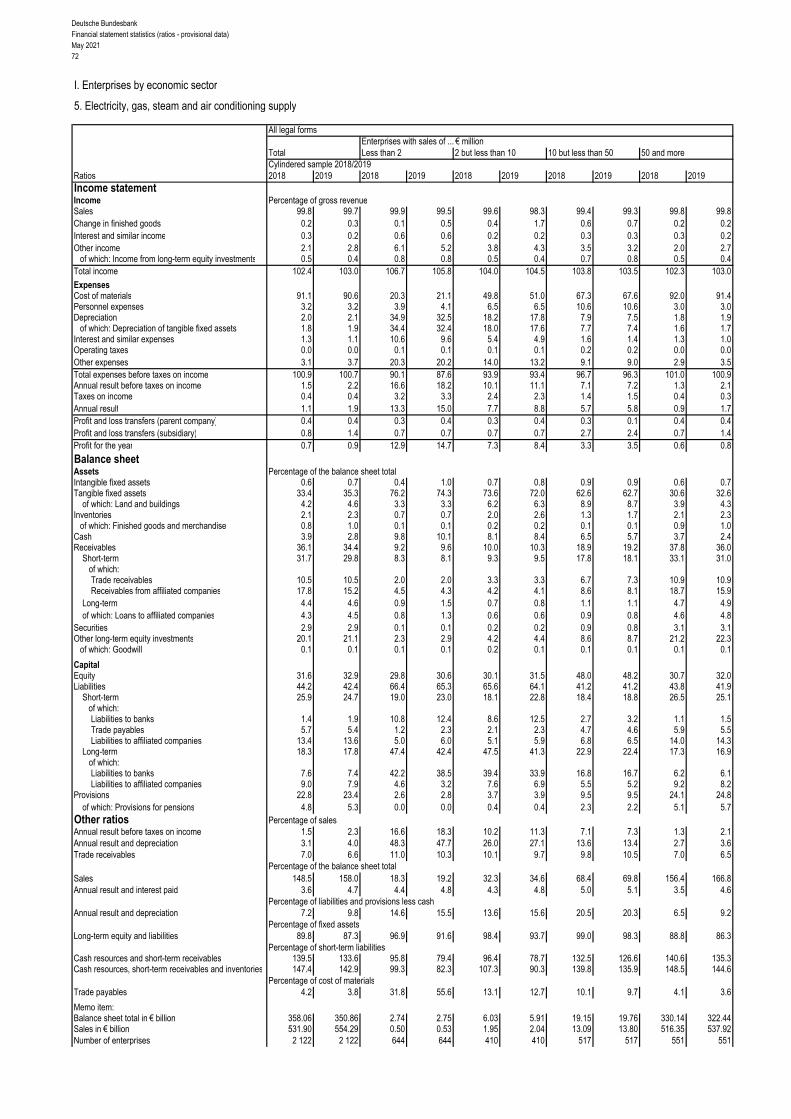
Deutsche BundesbankFinancial statement statistics (ratios - provisional data)May 202172
I. Enterprises by economic sector
5. Electricity, gas, steam and air conditioning supply
All legal formsEnterprises with sales of ... € million
Total Less than 2 2 but less than 10 10 but less than 50 50 and moreCylindered sample 2018/2019
Ratios 2018 2019 2018 2019 2018 2019 2018 2019 2018 2019Income statementIncome Percentage of gross revenueSales 99.8 99.7 99.9 99.5 99.6 98.3 99.4 99.3 99.8 99.8Change in finished goods 0.2 0.3 0.1 0.5 0.4 1.7 0.6 0.7 0.2 0.2Interest and similar income 0.3 0.2 0.6 0.6 0.2 0.2 0.3 0.3 0.3 0.2Other income 2.1 2.8 6.1 5.2 3.8 4.3 3.5 3.2 2.0 2.7
of which: Income from long-term equity investments 0.5 0.4 0.8 0.8 0.5 0.4 0.7 0.8 0.5 0.4Total income 102.4 103.0 106.7 105.8 104.0 104.5 103.8 103.5 102.3 103.0
ExpensesCost of materials 91.1 90.6 20.3 21.1 49.8 51.0 67.3 67.6 92.0 91.4Personnel expenses 3.2 3.2 3.9 4.1 6.5 6.5 10.6 10.6 3.0 3.0Depreciation 2.0 2.1 34.9 32.5 18.2 17.8 7.9 7.5 1.8 1.9
of which: Depreciation of tangible fixed assets 1.8 1.9 34.4 32.4 18.0 17.6 7.7 7.4 1.6 1.7Interest and similar expenses 1.3 1.1 10.6 9.6 5.4 4.9 1.6 1.4 1.3 1.0Operating taxes 0.0 0.0 0.1 0.1 0.1 0.1 0.2 0.2 0.0 0.0Other expenses 3.1 3.7 20.3 20.2 14.0 13.2 9.1 9.0 2.9 3.5Total expenses before taxes on income 100.9 100.7 90.1 87.6 93.9 93.4 96.7 96.3 101.0 100.9Annual result before taxes on income 1.5 2.2 16.6 18.2 10.1 11.1 7.1 7.2 1.3 2.1Taxes on income 0.4 0.4 3.2 3.3 2.4 2.3 1.4 1.5 0.4 0.3Annual result 1.1 1.9 13.3 15.0 7.7 8.8 5.7 5.8 0.9 1.7Profit and loss transfers (parent company) 0.4 0.4 0.3 0.4 0.3 0.4 0.3 0.1 0.4 0.4Profit and loss transfers (subsidiary) 0.8 1.4 0.7 0.7 0.7 0.7 2.7 2.4 0.7 1.4Profit for the year 0.7 0.9 12.9 14.7 7.3 8.4 3.3 3.5 0.6 0.8
Balance sheetAssets Percentage of the balance sheet totalIntangible fixed assets 0.6 0.7 0.4 1.0 0.7 0.8 0.9 0.9 0.6 0.7Tangible fixed assets 33.4 35.3 76.2 74.3 73.6 72.0 62.6 62.7 30.6 32.6
of which: Land and buildings 4.2 4.6 3.3 3.3 6.2 6.3 8.9 8.7 3.9 4.3Inventories 2.1 2.3 0.7 0.7 2.0 2.6 1.3 1.7 2.1 2.3
of which: Finished goods and merchandise 0.8 1.0 0.1 0.1 0.2 0.2 0.1 0.1 0.9 1.0Cash 3.9 2.8 9.8 10.1 8.1 8.4 6.5 5.7 3.7 2.4Receivables 36.1 34.4 9.2 9.6 10.0 10.3 18.9 19.2 37.8 36.0
Short-term 31.7 29.8 8.3 8.1 9.3 9.5 17.8 18.1 33.1 31.0 of which:
Trade receivables 10.5 10.5 2.0 2.0 3.3 3.3 6.7 7.3 10.9 10.9Receivables from affiliated companies 17.8 15.2 4.5 4.3 4.2 4.1 8.6 8.1 18.7 15.9
Long-term 4.4 4.6 0.9 1.5 0.7 0.8 1.1 1.1 4.7 4.9of which: Loans to affiliated companies 4.3 4.5 0.8 1.3 0.6 0.6 0.9 0.8 4.6 4.8
Securities 2.9 2.9 0.1 0.1 0.2 0.2 0.9 0.8 3.1 3.1Other long-term equity investments 20.1 21.1 2.3 2.9 4.2 4.4 8.6 8.7 21.2 22.3
of which: Goodwill 0.1 0.1 0.1 0.1 0.2 0.1 0.1 0.1 0.1 0.1
CapitalEquity 31.6 32.9 29.8 30.6 30.1 31.5 48.0 48.2 30.7 32.0Liabilities 44.2 42.4 66.4 65.3 65.6 64.1 41.2 41.2 43.8 41.9
Short-term 25.9 24.7 19.0 23.0 18.1 22.8 18.4 18.8 26.5 25.1of which:Liabilities to banks 1.4 1.9 10.8 12.4 8.6 12.5 2.7 3.2 1.1 1.5Trade payables 5.7 5.4 1.2 2.3 2.1 2.3 4.7 4.6 5.9 5.5Liabilities to affiliated companies 13.4 13.6 5.0 6.0 5.1 5.9 6.8 6.5 14.0 14.3
Long-term 18.3 17.8 47.4 42.4 47.5 41.3 22.9 22.4 17.3 16.9 of which:
Liabilities to banks 7.6 7.4 42.2 38.5 39.4 33.9 16.8 16.7 6.2 6.1Liabilities to affiliated companies 9.0 7.9 4.6 3.2 7.6 6.9 5.5 5.2 9.2 8.2
Provisions 22.8 23.4 2.6 2.8 3.7 3.9 9.5 9.5 24.1 24.8of which: Provisions for pensions 4.8 5.3 0.0 0.0 0.4 0.4 2.3 2.2 5.1 5.7
Other ratios Percentage of salesAnnual result before taxes on income 1.5 2.3 16.6 18.3 10.2 11.3 7.1 7.3 1.3 2.1Annual result and depreciation 3.1 4.0 48.3 47.7 26.0 27.1 13.6 13.4 2.7 3.6Trade receivables 7.0 6.6 11.0 10.3 10.1 9.7 9.8 10.5 7.0 6.5
Percentage of the balance sheet totalSales 148.5 158.0 18.3 19.2 32.3 34.6 68.4 69.8 156.4 166.8Annual result and interest paid 3.6 4.7 4.4 4.8 4.3 4.8 5.0 5.1 3.5 4.6
Percentage of liabilities and provisions less cashAnnual result and depreciation 7.2 9.8 14.6 15.5 13.6 15.6 20.5 20.3 6.5 9.2
Percentage of fixed assetsLong-term equity and liabilities 89.8 87.3 96.9 91.6 98.4 93.7 99.0 98.3 88.8 86.3
Percentage of short-term liabilitiesCash resources and short-term receivables 139.5 133.6 95.8 79.4 96.4 78.7 132.5 126.6 140.6 135.3Cash resources, short-term receivables and inventories 147.4 142.9 99.3 82.3 107.3 90.3 139.8 135.9 148.5 144.6
Percentage of cost of materialsTrade payables 4.2 3.8 31.8 55.6 13.1 12.7 10.1 9.7 4.1 3.6
Memo item:Balance sheet total in € billion 358.06 350.86 2.74 2.75 6.03 5.91 19.15 19.76 330.14 322.44Sales in € billion 531.90 554.29 0.50 0.53 1.95 2.04 13.09 13.80 516.35 537.92Number of enterprises 2 122 2 122 644 644 410 410 517 517 551 551

Deutsche BundesbankFinancial statement statistics (ratios - provisional data)
May 202173
I. Enterprises by economic sector
cont'd: 5. Electricity, gas, steam and air conditioning supply
cont'd: All legal formsEnterprises with sales of ... € million
Total Less than 2 2 but less than 10 10 but less than 50 50 and moreQuartile Cylindered sample 2018/2019value 2018 2019 2018 2019 2018 2019 2018 2019 2018 2019Of the enterprises captured …
Ratios ... % had a ratio of less than …Percentage of gross revenue
Cost of materials 25 7.8 8.6 0.0 0.0 7.8 8.6 58.7 58.8 65.2 65.2 50 60.0 60.3 0.5 0.6 49.5 50.4 67.3 68.2 76.0 75.4 75 76.1 75.8 21.9 23.6 71.5 73.0 78.0 77.5 88.0 87.0
Personnel expenses 25 0.0 0.0 0.0 0.0 0.0 0.0 2.5 2.3 1.7 1.7 50 1.9 1.9 0.0 0.0 0.0 0.0 9.7 9.6 7.9 8.2 75 11.2 11.3 0.0 0.0 6.5 6.3 14.8 14.2 12.9 13.0
Depreciation 25 3.7 3.5 19.0 18.2 4.4 4.6 3.6 3.3 0.8 0.8 50 8.3 8.0 36.7 36.7 14.6 14.5 6.4 6.3 4.1 4.1 75 32.1 30.8 46.7 45.3 37.8 38.7 8.8 8.8 6.5 6.4
Annual result 25 1.3 1.7 2.9 3.4 1.1 1.4 2.0 1.9 0.6 1.0 50 6.1 6.3 16.8 17.9 7.1 8.4 4.9 5.1 3.9 3.8 75 15.1 16.4 30.7 32.4 15.8 19.2 8.7 8.9 7.4 7.3
Percentage of the balance sheet totalTangible fixed assets 25 35.3 36.5 54.8 52.3 36.2 38.5 38.5 40.1 8.5 8.1
50 68.1 67.7 77.4 76.1 73.1 71.0 68.0 68.1 52.2 52.8 75 81.9 81.4 88.1 87.0 84.6 83.9 78.9 79.0 71.9 72.8
Inventories 25 0.0 0.0 0.0 0.0 0.0 0.0 0.0 0.0 0.1 0.1 50 0.1 0.1 0.0 0.0 0.0 0.0 0.6 0.6 0.9 0.9 75 1.1 1.2 0.0 0.0 1.3 1.4 1.3 1.2 1.8 1.7
Equity 25 16.8 18.4 10.6 12.9 10.5 11.2 29.6 32.0 23.1 23.0 50 35.4 36.5 25.8 27.8 29.0 31.2 45.9 45.9 37.8 37.7 75 53.2 54.1 45.5 48.9 53.5 54.2 60.8 61.2 49.5 50.5
Short-term liabilities 25 9.4 9.9 6.8 7.4 7.9 8.7 12.3 12.4 14.7 13.8 50 17.5 17.9 12.5 12.9 14.5 17.0 18.9 18.4 22.5 21.6 75 32.6 35.1 31.1 37.5 33.4 40.0 29.3 30.1 36.1 36.4
Liabilities to banks 25 0.0 0.0 1.1 0.4 0.0 0.0 0.0 0.0 0.0 0.0 50 19.2 19.1 56.7 53.1 32.3 32.2 12.8 14.5 1.9 1.6 75 50.9 48.7 72.8 70.7 65.8 64.2 30.5 30.1 23.0 23.0
Percentage of salesAnnual result before taxes on income 25 1.9 2.2 3.8 4.7 1.3 1.9 2.3 2.6 1.0 1.3
50 7.7 8.0 20.4 21.3 9.2 10.3 6.3 6.4 5.0 4.8 75 18.3 19.6 35.4 36.9 19.9 23.0 10.7 10.9 8.8 9.2
Annual result and depreciation 25 8.4 8.4 37.9 36.9 10.0 10.7 8.0 8.1 2.7 2.9 50 17.5 17.7 61.1 62.8 25.9 25.7 13.1 13.1 9.5 9.7 75 56.7 58.9 72.6 73.3 60.7 62.8 18.8 18.7 15.4 15.7
Trade receivables 25 2.2 2.8 1.0 1.7 2.6 3.1 5.5 5.9 4.8 5.0 50 8.5 8.9 3.7 4.1 9.2 9.6 9.1 10.1 8.7 8.9 75 13.4 13.2 13.6 12.5 14.9 13.6 12.9 13.7 12.4 12.6
Percentage of the balance sheet totalAnnual result and interest paid 25 2.6 2.7 2.7 2.9 1.9 2.4 2.7 2.8 2.4 2.6
50 5.3 5.3 5.3 5.5 4.7 4.9 5.2 5.3 5.6 5.6 75 8.8 8.7 9.5 9.1 7.8 8.4 8.4 8.4 9.5 9.0
Percentage of liabilities and provisions less cashAnnual result and depreciation 25 8.1 9.3 7.7 9.0 6.9 8.0 11.0 11.9 7.3 9.0
50 17.4 17.8 15.7 16.4 14.3 15.6 22.1 22.7 18.3 17.7 75 30.6 30.6 26.1 27.3 29.9 28.9 39.1 38.5 28.8 29.3
Percentage of fixed assetsLong-term equity and liabilities 25 85.3 83.6 85.7 78.0 92.6 87.8 86.0 85.7 81.0 79.8
50 100.0 99.1 103.2 102.2 104.1 102.6 97.3 97.1 93.7 94.3 75 116.7 117.3 120.0 120.6 120.3 120.2 112.3 110.2 109.1 113.0
Percentage of short-term liabilitiesCash resources and short-term receivables 25 74.5 69.1 54.4 48.2 68.4 59.8 81.4 76.0 81.6 78.9
50 122.5 117.9 131.2 123.5 126.0 120.7 119.1 115.2 117.8 115.4 75 212.2 216.0 271.7 272.3 206.9 202.5 195.8 192.9 189.1 188.1
Percentage of cost of materialsTrade payables 25 4.0 3.5 2.0 1.6 4.8 3.6 5.0 5.1 3.6 2.9
50 8.7 8.5 13.4 14.3 10.3 10.3 9.2 8.8 7.1 6.8 75 15.2 14.6 53.3 50.0 20.4 20.6 13.7 12.9 10.8 10.1
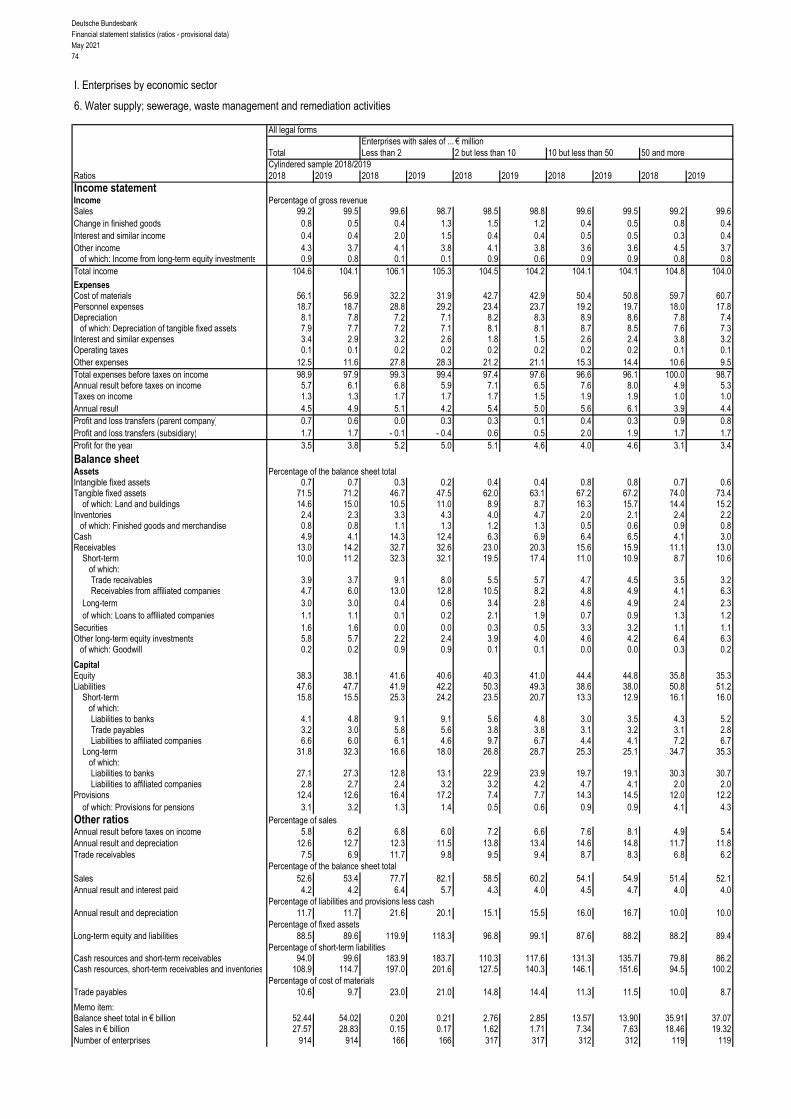
Deutsche BundesbankFinancial statement statistics (ratios - provisional data)May 202174
I. Enterprises by economic sector
6. Water supply; sewerage, waste management and remediation activities
All legal formsEnterprises with sales of ... € million
Total Less than 2 2 but less than 10 10 but less than 50 50 and moreCylindered sample 2018/2019
Ratios 2018 2019 2018 2019 2018 2019 2018 2019 2018 2019Income statementIncome Percentage of gross revenueSales 99.2 99.5 99.6 98.7 98.5 98.8 99.6 99.5 99.2 99.6Change in finished goods 0.8 0.5 0.4 1.3 1.5 1.2 0.4 0.5 0.8 0.4Interest and similar income 0.4 0.4 2.0 1.5 0.4 0.4 0.5 0.5 0.3 0.4Other income 4.3 3.7 4.1 3.8 4.1 3.8 3.6 3.6 4.5 3.7
of which: Income from long-term equity investments 0.9 0.8 0.1 0.1 0.9 0.6 0.9 0.9 0.8 0.8Total income 104.6 104.1 106.1 105.3 104.5 104.2 104.1 104.1 104.8 104.0
ExpensesCost of materials 56.1 56.9 32.2 31.9 42.7 42.9 50.4 50.8 59.7 60.7Personnel expenses 18.7 18.7 28.8 29.2 23.4 23.7 19.2 19.7 18.0 17.8Depreciation 8.1 7.8 7.2 7.1 8.2 8.3 8.9 8.6 7.8 7.4
of which: Depreciation of tangible fixed assets 7.9 7.7 7.2 7.1 8.1 8.1 8.7 8.5 7.6 7.3Interest and similar expenses 3.4 2.9 3.2 2.6 1.8 1.5 2.6 2.4 3.8 3.2Operating taxes 0.1 0.1 0.2 0.2 0.2 0.2 0.2 0.2 0.1 0.1Other expenses 12.5 11.6 27.8 28.3 21.2 21.1 15.3 14.4 10.6 9.5Total expenses before taxes on income 98.9 97.9 99.3 99.4 97.4 97.6 96.6 96.1 100.0 98.7Annual result before taxes on income 5.7 6.1 6.8 5.9 7.1 6.5 7.6 8.0 4.9 5.3Taxes on income 1.3 1.3 1.7 1.7 1.7 1.5 1.9 1.9 1.0 1.0Annual result 4.5 4.9 5.1 4.2 5.4 5.0 5.6 6.1 3.9 4.4Profit and loss transfers (parent company) 0.7 0.6 0.0 0.3 0.3 0.1 0.4 0.3 0.9 0.8Profit and loss transfers (subsidiary) 1.7 1.7 - 0.1 - 0.4 0.6 0.5 2.0 1.9 1.7 1.7Profit for the year 3.5 3.8 5.2 5.0 5.1 4.6 4.0 4.6 3.1 3.4
Balance sheetAssets Percentage of the balance sheet totalIntangible fixed assets 0.7 0.7 0.3 0.2 0.4 0.4 0.8 0.8 0.7 0.6Tangible fixed assets 71.5 71.2 46.7 47.5 62.0 63.1 67.2 67.2 74.0 73.4
of which: Land and buildings 14.6 15.0 10.5 11.0 8.9 8.7 16.3 15.7 14.4 15.2Inventories 2.4 2.3 3.3 4.3 4.0 4.7 2.0 2.1 2.4 2.2
of which: Finished goods and merchandise 0.8 0.8 1.1 1.3 1.2 1.3 0.5 0.6 0.9 0.8Cash 4.9 4.1 14.3 12.4 6.3 6.9 6.4 6.5 4.1 3.0Receivables 13.0 14.2 32.7 32.6 23.0 20.3 15.6 15.9 11.1 13.0
Short-term 10.0 11.2 32.3 32.1 19.5 17.4 11.0 10.9 8.7 10.6 of which:
Trade receivables 3.9 3.7 9.1 8.0 5.5 5.7 4.7 4.5 3.5 3.2Receivables from affiliated companies 4.7 6.0 13.0 12.8 10.5 8.2 4.8 4.9 4.1 6.3
Long-term 3.0 3.0 0.4 0.6 3.4 2.8 4.6 4.9 2.4 2.3of which: Loans to affiliated companies 1.1 1.1 0.1 0.2 2.1 1.9 0.7 0.9 1.3 1.2
Securities 1.6 1.6 0.0 0.0 0.3 0.5 3.3 3.2 1.1 1.1Other long-term equity investments 5.8 5.7 2.2 2.4 3.9 4.0 4.6 4.2 6.4 6.3
of which: Goodwill 0.2 0.2 0.9 0.9 0.1 0.1 0.0 0.0 0.3 0.2
CapitalEquity 38.3 38.1 41.6 40.6 40.3 41.0 44.4 44.8 35.8 35.3Liabilities 47.6 47.7 41.9 42.2 50.3 49.3 38.6 38.0 50.8 51.2
Short-term 15.8 15.5 25.3 24.2 23.5 20.7 13.3 12.9 16.1 16.0of which:Liabilities to banks 4.1 4.8 9.1 9.1 5.6 4.8 3.0 3.5 4.3 5.2Trade payables 3.2 3.0 5.8 5.6 3.8 3.8 3.1 3.2 3.1 2.8Liabilities to affiliated companies 6.6 6.0 6.1 4.6 9.7 6.7 4.4 4.1 7.2 6.7
Long-term 31.8 32.3 16.6 18.0 26.8 28.7 25.3 25.1 34.7 35.3 of which:
Liabilities to banks 27.1 27.3 12.8 13.1 22.9 23.9 19.7 19.1 30.3 30.7Liabilities to affiliated companies 2.8 2.7 2.4 3.2 3.2 4.2 4.7 4.1 2.0 2.0
Provisions 12.4 12.6 16.4 17.2 7.4 7.7 14.3 14.5 12.0 12.2of which: Provisions for pensions 3.1 3.2 1.3 1.4 0.5 0.6 0.9 0.9 4.1 4.3
Other ratios Percentage of salesAnnual result before taxes on income 5.8 6.2 6.8 6.0 7.2 6.6 7.6 8.1 4.9 5.4Annual result and depreciation 12.6 12.7 12.3 11.5 13.8 13.4 14.6 14.8 11.7 11.8Trade receivables 7.5 6.9 11.7 9.8 9.5 9.4 8.7 8.3 6.8 6.2
Percentage of the balance sheet totalSales 52.6 53.4 77.7 82.1 58.5 60.2 54.1 54.9 51.4 52.1Annual result and interest paid 4.2 4.2 6.4 5.7 4.3 4.0 4.5 4.7 4.0 4.0
Percentage of liabilities and provisions less cashAnnual result and depreciation 11.7 11.7 21.6 20.1 15.1 15.5 16.0 16.7 10.0 10.0
Percentage of fixed assetsLong-term equity and liabilities 88.5 89.6 119.9 118.3 96.8 99.1 87.6 88.2 88.2 89.4
Percentage of short-term liabilitiesCash resources and short-term receivables 94.0 99.6 183.9 183.7 110.3 117.6 131.3 135.7 79.8 86.2Cash resources, short-term receivables and inventories 108.9 114.7 197.0 201.6 127.5 140.3 146.1 151.6 94.5 100.2
Percentage of cost of materialsTrade payables 10.6 9.7 23.0 21.0 14.8 14.4 11.3 11.5 10.0 8.7
Memo item:Balance sheet total in € billion 52.44 54.02 0.20 0.21 2.76 2.85 13.57 13.90 35.91 37.07Sales in € billion 27.57 28.83 0.15 0.17 1.62 1.71 7.34 7.63 18.46 19.32Number of enterprises 914 914 166 166 317 317 312 312 119 119
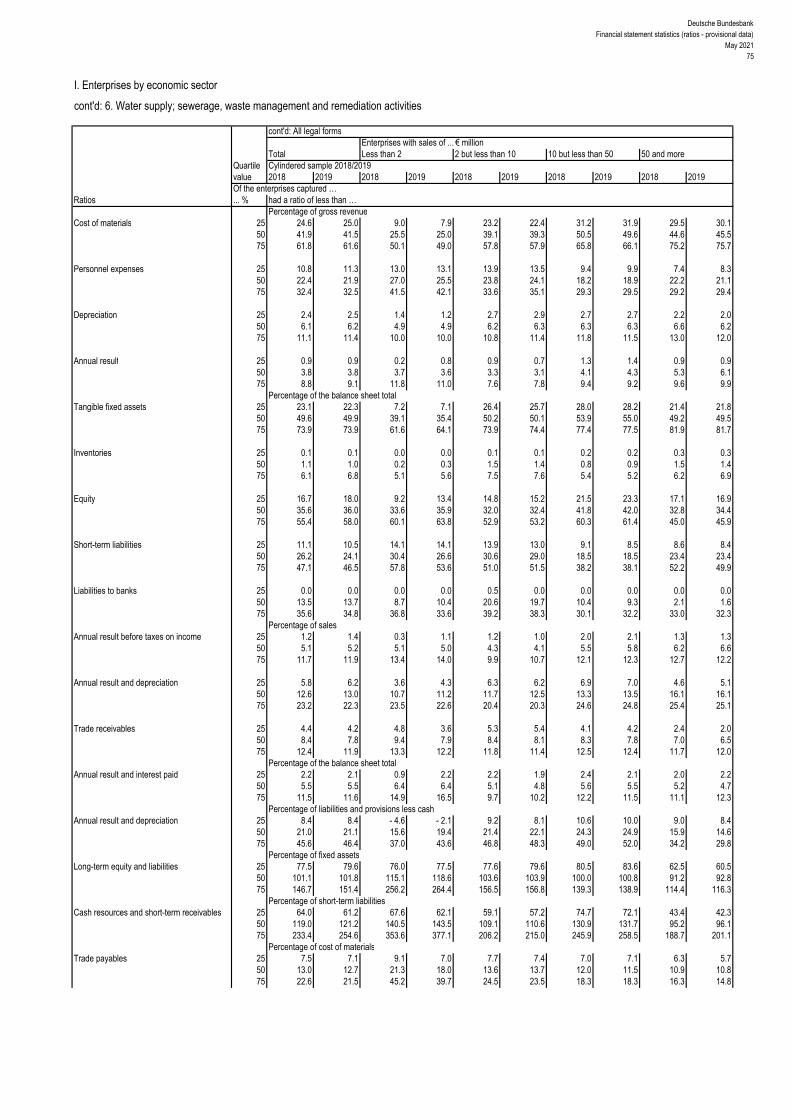
Deutsche BundesbankFinancial statement statistics (ratios - provisional data)
May 202175
I. Enterprises by economic sector
cont'd: 6. Water supply; sewerage, waste management and remediation activities
cont'd: All legal formsEnterprises with sales of ... € million
Total Less than 2 2 but less than 10 10 but less than 50 50 and moreQuartile Cylindered sample 2018/2019value 2018 2019 2018 2019 2018 2019 2018 2019 2018 2019Of the enterprises captured …
Ratios ... % had a ratio of less than …Percentage of gross revenue
Cost of materials 25 24.6 25.0 9.0 7.9 23.2 22.4 31.2 31.9 29.5 30.1 50 41.9 41.5 25.5 25.0 39.1 39.3 50.5 49.6 44.6 45.5 75 61.8 61.6 50.1 49.0 57.8 57.9 65.8 66.1 75.2 75.7
Personnel expenses 25 10.8 11.3 13.0 13.1 13.9 13.5 9.4 9.9 7.4 8.3 50 22.4 21.9 27.0 25.5 23.8 24.1 18.2 18.9 22.2 21.1 75 32.4 32.5 41.5 42.1 33.6 35.1 29.3 29.5 29.2 29.4
Depreciation 25 2.4 2.5 1.4 1.2 2.7 2.9 2.7 2.7 2.2 2.0 50 6.1 6.2 4.9 4.9 6.2 6.3 6.3 6.3 6.6 6.2 75 11.1 11.4 10.0 10.0 10.8 11.4 11.8 11.5 13.0 12.0
Annual result 25 0.9 0.9 0.2 0.8 0.9 0.7 1.3 1.4 0.9 0.9 50 3.8 3.8 3.7 3.6 3.3 3.1 4.1 4.3 5.3 6.1 75 8.8 9.1 11.8 11.0 7.6 7.8 9.4 9.2 9.6 9.9
Percentage of the balance sheet totalTangible fixed assets 25 23.1 22.3 7.2 7.1 26.4 25.7 28.0 28.2 21.4 21.8
50 49.6 49.9 39.1 35.4 50.2 50.1 53.9 55.0 49.2 49.5 75 73.9 73.9 61.6 64.1 73.9 74.4 77.4 77.5 81.9 81.7
Inventories 25 0.1 0.1 0.0 0.0 0.1 0.1 0.2 0.2 0.3 0.3 50 1.1 1.0 0.2 0.3 1.5 1.4 0.8 0.9 1.5 1.4 75 6.1 6.8 5.1 5.6 7.5 7.6 5.4 5.2 6.2 6.9
Equity 25 16.7 18.0 9.2 13.4 14.8 15.2 21.5 23.3 17.1 16.9 50 35.6 36.0 33.6 35.9 32.0 32.4 41.8 42.0 32.8 34.4 75 55.4 58.0 60.1 63.8 52.9 53.2 60.3 61.4 45.0 45.9
Short-term liabilities 25 11.1 10.5 14.1 14.1 13.9 13.0 9.1 8.5 8.6 8.4 50 26.2 24.1 30.4 26.6 30.6 29.0 18.5 18.5 23.4 23.4 75 47.1 46.5 57.8 53.6 51.0 51.5 38.2 38.1 52.2 49.9
Liabilities to banks 25 0.0 0.0 0.0 0.0 0.5 0.0 0.0 0.0 0.0 0.0 50 13.5 13.7 8.7 10.4 20.6 19.7 10.4 9.3 2.1 1.6 75 35.6 34.8 36.8 33.6 39.2 38.3 30.1 32.2 33.0 32.3
Percentage of salesAnnual result before taxes on income 25 1.2 1.4 0.3 1.1 1.2 1.0 2.0 2.1 1.3 1.3
50 5.1 5.2 5.1 5.0 4.3 4.1 5.5 5.8 6.2 6.6 75 11.7 11.9 13.4 14.0 9.9 10.7 12.1 12.3 12.7 12.2
Annual result and depreciation 25 5.8 6.2 3.6 4.3 6.3 6.2 6.9 7.0 4.6 5.1 50 12.6 13.0 10.7 11.2 11.7 12.5 13.3 13.5 16.1 16.1 75 23.2 22.3 23.5 22.6 20.4 20.3 24.6 24.8 25.4 25.1
Trade receivables 25 4.4 4.2 4.8 3.6 5.3 5.4 4.1 4.2 2.4 2.0 50 8.4 7.8 9.4 7.9 8.4 8.1 8.3 7.8 7.0 6.5 75 12.4 11.9 13.3 12.2 11.8 11.4 12.5 12.4 11.7 12.0
Percentage of the balance sheet totalAnnual result and interest paid 25 2.2 2.1 0.9 2.2 2.2 1.9 2.4 2.1 2.0 2.2
50 5.5 5.5 6.4 6.4 5.1 4.8 5.6 5.5 5.2 4.7 75 11.5 11.6 14.9 16.5 9.7 10.2 12.2 11.5 11.1 12.3
Percentage of liabilities and provisions less cashAnnual result and depreciation 25 8.4 8.4 - 4.6 - 2.1 9.2 8.1 10.6 10.0 9.0 8.4
50 21.0 21.1 15.6 19.4 21.4 22.1 24.3 24.9 15.9 14.6 75 45.6 46.4 37.0 43.6 46.8 48.3 49.0 52.0 34.2 29.8
Percentage of fixed assetsLong-term equity and liabilities 25 77.5 79.6 76.0 77.5 77.6 79.6 80.5 83.6 62.5 60.5
50 101.1 101.8 115.1 118.6 103.6 103.9 100.0 100.8 91.2 92.8 75 146.7 151.4 256.2 264.4 156.5 156.8 139.3 138.9 114.4 116.3
Percentage of short-term liabilitiesCash resources and short-term receivables 25 64.0 61.2 67.6 62.1 59.1 57.2 74.7 72.1 43.4 42.3
50 119.0 121.2 140.5 143.5 109.1 110.6 130.9 131.7 95.2 96.1 75 233.4 254.6 353.6 377.1 206.2 215.0 245.9 258.5 188.7 201.1
Percentage of cost of materialsTrade payables 25 7.5 7.1 9.1 7.0 7.7 7.4 7.0 7.1 6.3 5.7
50 13.0 12.7 21.3 18.0 13.6 13.7 12.0 11.5 10.9 10.8 75 22.6 21.5 45.2 39.7 24.5 23.5 18.3 18.3 16.3 14.8

Deutsche BundesbankFinancial statement statistics (ratios - provisional data)May 202176
I. Enterprises by economic sector
7. Construction
All legal formsEnterprises with sales of ... € million
Total Less than 2 2 but less than 10 10 but less than 50 50 and moreCylindered sample 2018/2019
Ratios 2018 2019 2018 2019 2018 2019 2018 2019 2018 2019Income statementIncome Percentage of gross revenueSales 93.9 95.7 95.6 94.4 95.0 95.1 93.6 95.6 93.7 96.0Change in finished goods 6.1 4.3 4.4 5.6 5.0 4.9 6.4 4.4 6.3 4.0Interest and similar income 0.2 0.3 0.1 0.1 0.1 0.1 0.2 0.2 0.3 0.4Other income 2.4 2.5 2.6 2.5 2.2 2.1 2.2 2.1 2.5 2.8
of which: Income from long-term equity investments 0.5 0.4 0.1 0.0 0.1 0.2 0.5 0.4 0.6 0.6Total income 102.6 102.8 102.7 102.6 102.3 102.2 102.4 102.3 102.8 103.2
ExpensesCost of materials 62.3 61.4 41.9 43.1 52.2 51.4 60.5 59.7 66.6 65.7Personnel expenses 22.4 22.4 36.0 34.8 29.1 29.0 23.0 22.9 19.9 19.9Depreciation 2.2 2.2 2.8 2.7 2.4 2.4 2.0 2.1 2.3 2.1
of which: Depreciation of tangible fixed assets 1.8 1.9 2.7 2.6 2.3 2.3 1.8 1.9 1.6 1.7Interest and similar expenses 0.7 0.7 0.7 0.6 0.5 0.5 0.6 0.5 0.8 0.8Operating taxes 0.1 0.1 0.2 0.2 0.1 0.1 0.1 0.1 0.1 0.1Other expenses 10.4 10.4 15.3 14.7 12.7 12.6 10.5 10.4 9.6 9.5Total expenses before taxes on income 98.1 97.1 96.8 96.0 97.0 96.0 96.5 95.7 99.3 98.2Annual result before taxes on income 4.5 5.7 5.9 6.6 5.3 6.2 5.9 6.5 3.5 5.0Taxes on income 1.1 1.2 1.3 1.4 1.4 1.6 1.3 1.5 1.0 0.9Annual result 3.3 4.5 4.6 5.2 4.0 4.6 4.6 5.0 2.5 4.1Profit and loss transfers (parent company) 0.1 0.1 0.1 0.1 0.0 0.0 0.0 0.1 0.1 0.1Profit and loss transfers (subsidiary) 0.2 0.8 0.0 0.0 0.1 0.2 0.6 0.7 0.0 1.0Profit for the year 3.2 3.8 4.7 5.3 3.8 4.5 4.0 4.5 2.6 3.1
Balance sheetAssets Percentage of the balance sheet totalIntangible fixed assets 0.2 0.2 0.2 0.2 0.1 0.1 0.1 0.1 0.2 0.2Tangible fixed assets 10.2 10.2 21.4 20.3 15.7 15.4 11.0 10.9 8.8 8.9
of which: Land and buildings 4.3 4.3 7.0 6.3 5.4 5.3 4.7 4.5 3.9 4.0Inventories 53.2 52.7 37.9 41.1 48.6 49.3 55.2 54.5 53.4 52.7
of which: Finished goods and merchandise 3.6 2.9 3.4 2.9 2.5 2.4 3.1 3.0 4.0 3.0Cash 9.7 10.1 13.8 14.1 13.4 13.7 11.4 12.1 8.3 8.5Receivables 21.7 21.8 23.9 21.9 20.8 20.1 20.0 19.9 22.5 22.9
Short-term 20.8 20.7 23.2 21.4 20.3 19.7 19.2 19.0 21.5 21.7 of which:
Trade receivables 8.5 8.1 13.8 12.8 13.2 12.3 10.5 10.1 6.9 6.4Receivables from affiliated companies 9.8 10.4 4.4 4.2 3.8 4.0 6.2 6.5 12.4 13.2
Long-term 0.9 1.0 0.7 0.5 0.4 0.4 0.8 0.9 1.0 1.2of which: Loans to affiliated companies 0.6 0.8 0.5 0.2 0.2 0.1 0.5 0.6 0.8 1.0
Securities 0.4 0.4 0.4 0.4 0.5 0.4 0.3 0.3 0.4 0.4Other long-term equity investments 4.5 4.5 1.7 1.4 0.5 0.6 1.7 2.0 6.4 6.3
of which: Goodwill 0.1 0.1 0.3 0.2 0.1 0.1 0.1 0.1 0.1 0.1
CapitalEquity 17.7 17.9 22.3 22.6 22.2 22.7 18.9 19.4 16.4 16.4Liabilities 72.4 72.4 70.3 70.5 70.3 70.0 72.2 71.7 72.9 73.1
Short-term 67.3 66.7 57.9 59.2 62.4 62.3 66.8 66.1 68.5 67.8of which:Liabilities to banks 4.0 3.5 7.7 7.4 6.1 5.8 5.1 4.6 3.0 2.6Trade payables 6.0 5.6 8.8 7.6 7.4 6.6 6.0 5.5 5.7 5.5Liabilities to affiliated companies 8.4 8.0 4.4 4.6 4.1 3.7 6.5 6.5 9.9 9.4
Long-term 5.2 5.7 12.4 11.3 7.9 7.6 5.5 5.6 4.4 5.3 of which:
Liabilities to banks 3.6 3.6 8.5 7.9 5.6 5.3 4.1 4.2 3.0 2.9Liabilities to affiliated companies 0.8 1.6 2.2 1.9 1.6 1.6 0.9 0.9 0.6 1.9
Provisions 9.8 9.6 7.3 6.8 7.4 7.2 8.8 8.8 10.7 10.5of which: Provisions for pensions 2.0 1.8 1.6 1.3 1.1 1.1 1.3 1.2 2.4 2.2
Other ratios Percentage of salesAnnual result before taxes on income 4.8 5.9 6.1 7.0 5.6 6.5 6.3 6.8 3.7 5.2Annual result and depreciation 5.9 6.9 7.7 8.4 6.7 7.4 7.0 7.5 5.1 6.5Trade receivables 9.8 9.3 9.1 9.0 10.5 10.1 11.1 10.6 9.0 8.4
Percentage of the balance sheet totalSales 87.1 87.1 150.9 141.3 125.8 122.2 94.6 95.1 76.5 76.9Annual result and interest paid 3.7 4.7 8.3 8.7 5.9 6.5 5.2 5.5 2.7 3.9
Percentage of liabilities and provisions less cashAnnual result and depreciation 7.1 8.4 18.1 18.6 13.0 14.2 9.5 10.4 5.1 6.6
Percentage of fixed assetsLong-term equity and liabilities 155.8 158.3 150.4 156.3 184.2 187.5 186.4 187.7 140.4 143.1
Percentage of short-term liabilitiesCash resources and short-term receivables 45.6 46.6 64.3 60.4 54.6 54.0 46.2 47.4 43.8 44.9Cash resources, short-term receivables and inventories 124.7 125.7 129.7 129.8 132.5 133.0 128.9 129.8 121.8 122.8
Percentage of cost of materialsTrade payables 10.4 10.1 13.2 11.8 10.8 10.0 9.9 9.3 10.5 10.4
Memo item:Balance sheet total in € billion 97.58 106.76 1.44 1.71 8.90 9.86 26.74 29.21 60.50 65.98Sales in € billion 84.96 92.98 2.18 2.42 11.20 12.06 25.30 27.79 46.29 50.72Number of enterprises 6 207 6 207 2 266 2 266 2 445 2 445 1 182 1 182 314 314

Deutsche BundesbankFinancial statement statistics (ratios - provisional data)
May 202177
I. Enterprises by economic sector
cont'd: 7. Construction
cont'd: All legal formsEnterprises with sales of ... € million
Total Less than 2 2 but less than 10 10 but less than 50 50 and moreQuartile Cylindered sample 2018/2019value 2018 2019 2018 2019 2018 2019 2018 2019 2018 2019Of the enterprises captured …
Ratios ... % had a ratio of less than …Percentage of gross revenue
Cost of materials 25 36.6 35.6 29.5 28.9 39.2 38.1 48.0 47.0 53.8 53.5 50 48.5 47.6 39.9 39.7 49.6 48.4 58.4 57.1 65.6 64.1 75 61.5 60.6 50.2 50.4 61.6 60.4 70.4 69.8 77.5 76.7
Personnel expenses 25 20.9 20.8 26.3 26.0 21.7 22.0 15.3 15.4 11.2 11.0 50 30.8 30.8 36.5 36.4 30.8 31.0 24.5 24.4 20.1 19.7 75 40.1 40.4 45.9 45.9 39.0 39.6 32.3 32.3 27.8 27.9
Depreciation 25 0.9 0.8 1.1 1.1 0.8 0.8 0.6 0.6 0.6 0.5 50 1.7 1.7 2.1 2.1 1.6 1.6 1.3 1.3 1.4 1.3 75 3.1 3.1 3.6 3.5 2.8 2.8 2.7 2.8 2.8 2.8
Annual result 25 1.0 1.4 0.6 1.2 1.0 1.3 1.4 1.8 1.2 1.7 50 3.2 3.7 3.3 4.0 3.0 3.4 3.3 4.0 3.4 3.7 75 6.9 7.6 8.5 8.9 6.2 6.9 6.4 7.0 5.7 6.5
Percentage of the balance sheet totalTangible fixed assets 25 3.8 3.8 6.2 5.8 3.9 3.8 2.2 2.3 1.5 1.2
50 10.9 10.6 15.3 14.7 10.4 10.3 7.2 7.2 5.1 5.1 75 23.8 24.0 31.1 31.1 22.4 22.8 16.2 16.5 12.4 12.3
Inventories 25 11.8 11.4 4.2 5.3 13.6 12.6 30.6 29.0 36.4 36.9 50 37.2 37.0 21.2 22.2 39.9 38.3 52.6 51.6 56.3 54.2 75 62.0 61.7 48.8 50.0 63.5 63.2 69.3 67.9 69.6 68.0
Equity 25 6.1 7.3 3.2 5.9 7.1 8.5 6.7 7.5 5.9 6.1 50 18.1 19.7 20.2 22.3 19.6 21.0 15.5 16.6 13.0 13.2 75 38.0 40.5 44.8 46.6 39.1 41.6 29.0 30.8 25.7 25.9
Short-term liabilities 25 36.8 34.8 29.2 25.3 37.3 35.3 50.5 48.9 51.8 51.5 50 61.3 59.7 53.9 51.9 60.8 58.6 68.0 67.0 68.7 68.8 75 80.5 79.2 80.2 77.6 79.6 78.7 81.8 80.5 82.4 82.5
Liabilities to banks 25 0.0 0.0 0.0 0.0 0.0 0.0 0.0 0.0 0.0 0.0 50 4.6 4.2 9.3 8.5 4.6 4.3 1.5 1.0 0.3 0.1 75 18.3 17.9 27.1 27.2 16.7 16.7 9.0 8.7 5.8 4.8
Percentage of salesAnnual result before taxes on income 25 1.4 2.0 0.8 1.6 1.6 2.0 2.2 2.6 2.0 2.2
50 4.4 5.1 4.4 5.3 4.3 4.9 4.8 5.3 4.6 5.2 75 9.3 10.2 11.3 11.8 8.6 9.6 8.8 9.7 7.8 8.5
Annual result and depreciation 25 3.3 3.9 3.0 3.9 3.3 3.8 3.7 4.0 3.3 3.6 50 6.8 7.5 7.1 8.0 6.6 7.2 6.8 7.6 6.6 7.1 75 12.2 13.2 14.4 15.1 11.3 12.5 11.5 12.3 10.8 12.2
Trade receivables 25 4.4 4.0 3.6 3.4 4.8 4.4 5.5 4.9 4.0 4.3 50 8.4 7.9 7.2 6.7 8.9 8.4 9.5 9.1 9.0 8.7 75 13.6 13.0 12.3 11.9 14.0 13.5 15.1 14.0 13.6 13.1
Percentage of the balance sheet totalAnnual result and interest paid 25 2.3 2.9 2.2 3.3 2.5 2.8 2.5 2.8 1.8 2.0
50 5.8 6.5 7.9 8.6 5.7 6.3 4.7 5.4 3.9 4.2 75 12.6 13.8 19.2 20.4 11.3 12.8 8.9 9.8 6.8 7.2
Percentage of liabilities and provisions less cashAnnual result and depreciation 25 4.2 5.2 2.4 4.7 4.7 5.2 4.7 5.5 4.0 4.2
50 13.0 14.7 14.9 18.0 14.1 14.7 11.1 12.5 8.8 9.4 75 34.8 38.9 50.0 54.0 35.3 39.2 23.2 24.1 17.1 18.5
Percentage of fixed assetsLong-term equity and liabilities 25 99.0 106.8 80.3 93.3 108.9 115.8 108.9 113.8 98.9 93.7
50 200.0 211.8 173.6 194.3 213.6 227.4 216.0 225.1 188.8 182.1 75 462.6 498.8 415.4 432.8 477.2 533.3 521.2 518.7 450.8 477.8
Percentage of short-term liabilitiesCash resources and short-term receivables 25 32.0 32.5 37.5 37.8 31.9 32.1 26.9 28.9 28.2 27.5
50 66.4 68.2 86.7 89.8 67.3 70.7 47.8 51.1 44.7 46.8 75 142.3 152.0 190.9 218.6 139.9 148.9 91.6 95.2 77.2 73.6
Percentage of cost of materialsTrade payables 25 5.1 4.7 4.8 4.1 4.9 4.6 5.9 5.6 5.7 5.6
50 9.2 8.3 10.1 8.8 8.9 8.0 8.9 8.4 8.9 8.6 75 15.8 14.6 20.2 18.0 15.1 13.7 13.0 12.5 13.0 12.8

Deutsche BundesbankFinancial statement statistics (ratios - provisional data)May 202178
I. Enterprises by economic sector
cont'd: 7. Construction
CorporationsEnterprises with sales of ... € million
Total Less than 2 2 but less than 10 10 but less than 50 50 and moreCylindered sample 2018/2019
Ratios 2018 2019 2018 2019 2018 2019 2018 2019 2018 2019Income statementIncome Percentage of gross revenueSales 94.1 96.0 95.4 94.9 95.0 95.0 94.1 95.7 93.9 96.4Change in finished goods 5.9 4.0 4.6 5.1 5.0 5.0 5.9 4.3 6.1 3.6Interest and similar income 0.3 0.3 0.1 0.1 0.1 0.1 0.2 0.2 0.3 0.4Other income 2.5 2.5 2.6 2.5 2.2 2.0 2.3 2.0 2.6 2.9
of which: Income from long-term equity investments 0.5 0.5 0.1 0.0 0.1 0.1 0.5 0.4 0.6 0.6Total income 102.7 102.8 102.7 102.6 102.3 102.2 102.5 102.2 102.9 103.3
ExpensesCost of materials 62.6 61.8 42.3 43.2 53.0 52.1 60.7 60.3 67.0 66.0Personnel expenses 22.7 22.5 37.3 36.0 29.0 29.0 22.7 22.5 20.3 20.2Depreciation 2.2 2.1 2.6 2.6 2.2 2.2 1.9 2.0 2.3 2.2
of which: Depreciation of tangible fixed assets 1.8 1.8 2.6 2.5 2.1 2.1 1.7 1.8 1.6 1.7Interest and similar expenses 0.7 0.7 0.6 0.6 0.5 0.4 0.6 0.5 0.9 0.9Operating taxes 0.1 0.1 0.2 0.2 0.1 0.1 0.1 0.1 0.1 0.1Other expenses 10.4 10.2 15.4 14.7 12.6 12.6 10.6 10.4 9.5 9.3Total expenses before taxes on income 98.7 97.5 98.4 97.3 97.5 96.4 96.6 95.8 100.1 98.7Annual result before taxes on income 4.0 5.3 4.3 5.3 4.9 5.8 5.9 6.4 2.9 4.7Taxes on income 1.2 1.3 1.3 1.4 1.4 1.7 1.5 1.7 1.0 1.0Annual result 2.8 4.0 3.1 3.9 3.4 4.1 4.4 4.8 1.8 3.6Profit and loss transfers (parent company) 0.1 0.1 0.1 0.0 0.0 0.0 0.0 0.1 0.1 0.0Profit and loss transfers (subsidiary) 0.2 1.0 0.0 0.0 0.2 0.2 0.8 0.9 0.0 1.3Profit for the year 2.6 3.1 3.1 3.9 3.3 3.9 3.7 4.1 1.9 2.3
Balance sheetAssets Percentage of the balance sheet totalIntangible fixed assets 0.2 0.2 0.1 0.1 0.2 0.1 0.2 0.2 0.2 0.2Tangible fixed assets 9.9 9.9 19.7 18.9 14.8 14.5 10.9 10.6 8.5 8.7
of which: Land and buildings 4.3 4.3 5.9 5.4 5.3 5.2 4.8 4.6 3.8 4.0Inventories 52.3 51.6 38.8 41.4 48.3 49.0 53.9 52.9 52.6 51.8
of which: Finished goods and merchandise 4.0 3.3 3.5 3.0 2.6 2.5 3.3 2.9 4.5 3.5Cash 9.1 9.6 14.4 14.8 14.5 14.5 11.5 12.3 7.2 7.5Receivables 22.7 22.9 23.9 22.1 20.9 20.5 21.1 21.1 23.6 24.0
Short-term 21.8 21.8 23.3 21.5 20.5 20.1 20.1 20.0 22.6 22.8 of which:
Trade receivables 8.2 7.7 13.8 13.0 13.1 12.3 10.7 10.3 6.3 5.8Receivables from affiliated companies 11.2 11.8 4.2 3.9 3.8 4.2 6.9 7.3 14.2 15.0
Long-term 1.0 1.1 0.5 0.5 0.4 0.4 1.0 1.1 1.0 1.2of which: Loans to affiliated companies 0.7 0.9 0.3 0.3 0.2 0.2 0.7 0.7 0.8 1.1
Securities 0.3 0.3 0.5 0.5 0.5 0.5 0.4 0.4 0.2 0.3Other long-term equity investments 5.2 5.3 1.8 1.6 0.5 0.6 2.0 2.3 7.4 7.4
of which: Goodwill 0.1 0.1 0.2 0.2 0.1 0.1 0.1 0.2 0.0 0.0
CapitalEquity 19.4 19.7 25.3 25.6 25.0 25.5 22.4 23.0 17.2 17.3Liabilities 70.3 70.1 67.0 67.3 67.3 67.0 68.4 68.0 71.6 71.5
Short-term 65.0 63.9 56.3 57.2 59.8 59.7 62.8 61.9 67.0 65.6of which:Liabilities to banks 3.8 3.3 7.1 6.9 5.7 5.4 5.3 4.7 2.9 2.4Trade payables 6.0 5.7 8.6 7.5 7.4 6.6 6.1 5.5 5.7 5.6Liabilities to affiliated companies 8.2 7.7 3.4 4.0 2.7 2.5 5.3 5.4 10.3 9.6
Long-term 5.3 6.2 10.7 10.1 7.6 7.3 5.7 6.1 4.6 6.0 of which:
Liabilities to banks 3.6 3.6 7.0 6.8 5.3 5.2 4.4 4.7 2.9 2.9Liabilities to affiliated companies 0.9 1.9 1.8 1.6 1.6 1.5 0.9 0.9 0.7 2.5
Provisions 10.2 10.1 7.6 7.0 7.5 7.3 9.0 8.9 11.2 11.1of which: Provisions for pensions 2.3 2.2 1.9 1.6 1.3 1.3 1.6 1.5 2.8 2.6
Other ratios Percentage of salesAnnual result before taxes on income 4.3 5.6 4.6 5.6 5.1 6.1 6.2 6.7 3.0 4.8Annual result and depreciation 5.3 6.4 6.0 6.9 5.9 6.6 6.7 7.0 4.4 6.0Trade receivables 9.6 9.0 9.4 9.3 10.4 10.1 11.4 10.9 8.5 7.8
Percentage of the balance sheet totalSales 85.2 85.6 147.4 139.7 125.3 121.5 93.8 94.3 74.1 75.0Annual result and interest paid 3.2 4.2 5.8 6.6 5.1 5.8 4.9 5.2 2.2 3.5
Percentage of liabilities and provisions less cashAnnual result and depreciation 6.3 7.8 14.6 16.1 12.2 13.4 9.5 10.3 4.3 6.0
Percentage of fixed assetsLong-term equity and liabilities 164.2 168.8 169.5 174.1 210.5 215.3 210.4 214.0 141.9 146.8
Percentage of short-term liabilitiesCash resources and short-term receivables 47.8 49.4 67.6 63.9 59.0 58.4 50.8 52.6 44.8 46.5Cash resources, short-term receivables and inventories 128.3 130.2 136.5 136.2 139.8 140.4 136.6 138.2 123.3 125.4
Percentage of cost of materialsTrade payables 10.7 10.3 13.2 11.8 10.5 9.9 10.1 9.3 10.9 10.9
Memo item:Balance sheet total in € billion 74.35 81.23 1.16 1.38 7.13 7.90 19.24 21.19 46.82 50.76Sales in € billion 63.37 69.55 1.71 1.92 8.93 9.60 18.05 19.98 34.68 38.05Number of enterprises 4 808 4 808 1 753 1 753 1 964 1 964 859 859 232 232

Deutsche BundesbankFinancial statement statistics (ratios - provisional data)
May 202179
I. Enterprises by economic sector
cont'd: 7. Construction
cont'd: CorporationsEnterprises with sales of ... € million
Total Less than 2 2 but less than 10 10 but less than 50 50 and moreQuartile Cylindered sample 2018/2019value 2018 2019 2018 2019 2018 2019 2018 2019 2018 2019Of the enterprises captured …
Ratios ... % had a ratio of less than …Percentage of gross revenue
Cost of materials 25 37.0 36.0 29.9 29.2 39.9 38.6 48.0 47.4 53.2 53.0 50 48.9 47.9 40.2 39.8 50.3 49.0 59.3 58.2 64.5 63.4 75 61.7 61.2 50.7 50.9 62.2 61.2 71.7 71.2 78.9 77.4
Personnel expenses 25 21.4 21.2 28.9 28.3 21.6 21.9 14.5 14.6 10.3 10.9 50 31.6 31.6 38.2 38.2 31.0 31.2 23.9 23.6 20.3 20.2 75 40.9 41.2 47.4 47.4 39.2 39.7 32.0 32.1 28.2 28.2
Depreciation 25 0.8 0.8 1.0 1.0 0.8 0.8 0.6 0.5 0.5 0.5 50 1.6 1.6 2.0 1.9 1.5 1.5 1.2 1.2 1.2 1.3 75 2.9 2.9 3.4 3.2 2.6 2.6 2.5 2.6 2.7 2.8
Annual result 25 0.7 1.1 0.3 0.9 0.9 1.2 1.3 1.6 0.8 1.5 50 2.7 3.1 2.3 3.0 2.6 3.0 3.1 3.6 3.1 3.5 75 5.6 6.3 5.6 6.5 5.3 6.2 6.0 6.5 5.5 6.1
Percentage of the balance sheet totalTangible fixed assets 25 3.5 3.5 5.5 5.3 3.7 3.6 2.0 2.1 1.3 1.0
50 9.8 9.7 13.5 13.0 9.7 9.6 6.3 6.1 4.1 4.2 75 22.3 22.2 27.5 27.4 21.1 21.4 14.7 15.1 11.0 11.5
Inventories 25 11.8 11.0 4.5 5.4 12.8 11.9 30.6 28.4 34.1 35.0 50 36.9 36.5 22.5 22.6 39.4 37.7 52.4 50.7 53.9 52.7 75 61.8 61.4 49.7 50.3 63.3 63.1 69.9 67.9 69.7 67.4
Equity 25 8.8 10.4 6.7 9.1 10.5 11.8 9.9 10.7 6.8 6.5 50 21.7 23.6 24.0 26.0 23.3 25.5 18.8 20.0 14.1 15.0 75 41.7 44.3 47.1 49.3 43.6 45.9 32.5 36.1 27.9 27.9
Short-term liabilities 25 34.3 31.3 27.5 23.9 33.7 31.0 47.1 43.5 48.3 45.8 50 57.5 55.5 51.1 48.7 56.7 54.8 64.7 63.2 65.9 66.6 75 77.7 75.9 77.0 73.7 76.2 75.5 79.2 77.5 79.9 79.1
Liabilities to banks 25 0.0 0.0 0.0 0.0 0.0 0.0 0.0 0.0 0.0 0.0 50 3.7 3.6 7.5 6.5 4.0 3.9 1.1 0.9 0.0 0.0 75 16.4 16.0 23.8 23.0 15.3 15.1 8.4 8.0 4.3 3.1
Percentage of salesAnnual result before taxes on income 25 1.0 1.6 0.4 1.2 1.3 1.8 2.0 2.3 1.3 2.1
50 3.7 4.5 3.1 4.1 3.8 4.4 4.5 5.2 4.3 5.1 75 8.1 8.9 7.9 8.6 7.9 9.0 9.2 9.4 7.8 7.9
Annual result and depreciation 25 2.8 3.5 2.4 3.4 2.9 3.6 3.4 3.8 2.9 3.3 50 6.0 6.7 5.7 6.6 6.0 6.6 6.5 7.3 6.1 6.6 75 10.9 11.8 11.0 11.7 10.6 11.9 11.3 11.9 10.0 11.5
Trade receivables 25 4.4 4.1 3.7 3.6 4.8 4.6 5.4 4.8 3.6 3.8 50 8.5 8.0 7.6 7.1 8.9 8.4 9.4 9.1 8.8 8.2 75 13.8 13.1 12.8 12.5 13.9 13.5 15.4 14.0 13.5 13.0
Percentage of the balance sheet totalAnnual result and interest paid 25 1.9 2.5 1.5 2.6 2.1 2.5 2.2 2.6 1.4 1.8
50 5.0 5.7 5.7 6.8 5.1 5.5 4.5 5.0 3.5 4.0 75 10.5 11.7 13.2 14.9 10.0 11.3 8.4 9.5 6.4 6.7
Percentage of liabilities and provisions less cashAnnual result and depreciation 25 3.3 4.3 0.7 3.1 4.2 4.4 4.5 5.1 3.4 3.4
50 11.5 13.1 11.0 14.8 13.3 13.2 11.2 12.3 8.6 9.4 75 31.7 36.2 36.8 45.2 35.0 38.8 24.3 25.2 17.1 18.7
Percentage of fixed assetsLong-term equity and liabilities 25 123.3 131.6 106.0 117.4 135.7 143.3 137.0 143.9 112.6 106.9
50 239.1 253.3 217.0 232.7 249.4 267.2 274.1 276.8 210.3 215.1 75 539.3 585.1 485.2 536.8 557.8 610.0 617.2 627.1 549.9 560.9
Percentage of short-term liabilitiesCash resources and short-term receivables 25 34.1 35.1 40.7 42.6 33.9 34.6 27.7 31.0 30.4 28.9
50 73.8 76.0 96.3 100.9 75.2 77.2 51.6 55.7 46.9 49.4 75 162.6 174.4 213.9 255.0 162.1 172.8 105.2 116.1 84.9 80.2
Percentage of cost of materialsTrade payables 25 5.1 4.6 4.8 4.0 4.8 4.5 5.7 5.4 5.8 5.4
50 9.1 8.3 10.0 8.7 8.7 7.9 8.9 8.5 9.2 8.7 75 15.8 14.5 20.2 17.8 14.8 13.6 13.1 12.6 13.8 13.5
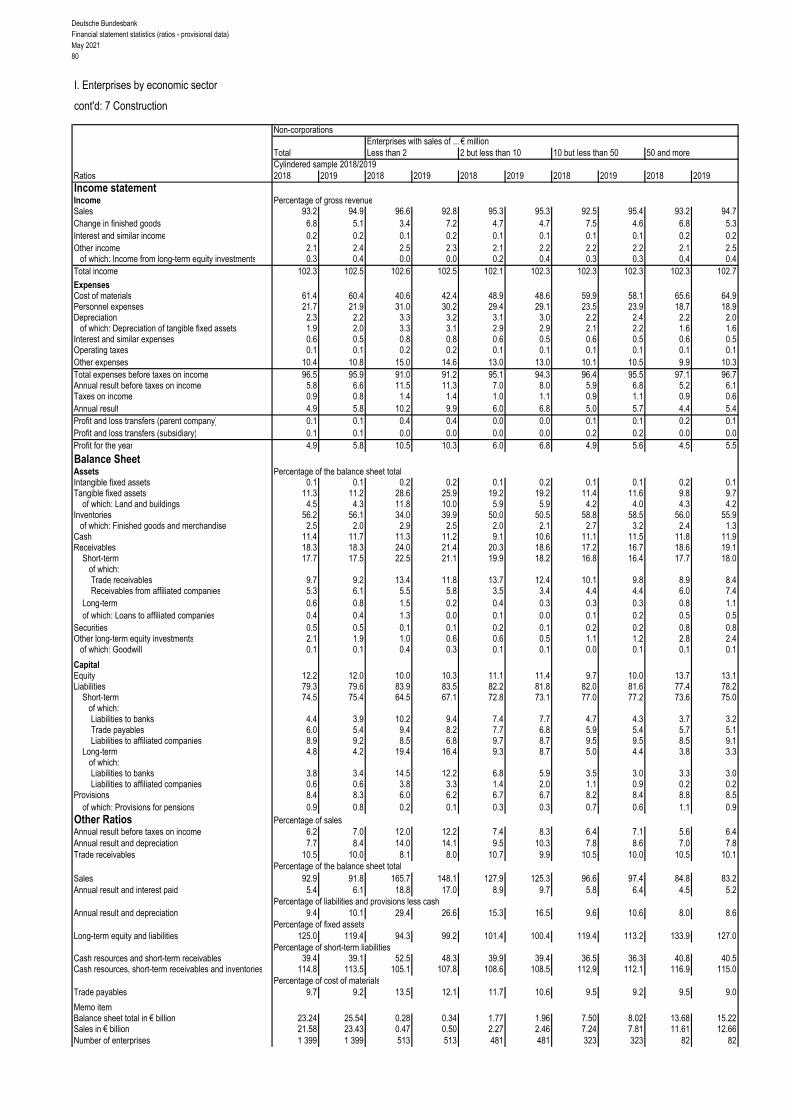
Deutsche BundesbankFinancial statement statistics (ratios - provisional data)May 202180
I. Enterprises by economic sector
cont'd: 7 Construction
Non-corporationsEnterprises with sales of ... € million
Total Less than 2 2 but less than 10 10 but less than 50 50 and moreCylindered sample 2018/2019
Ratios 2018 2019 2018 2019 2018 2019 2018 2019 2018 2019Income statementIncome Percentage of gross revenueSales 93.2 94.9 96.6 92.8 95.3 95.3 92.5 95.4 93.2 94.7Change in finished goods 6.8 5.1 3.4 7.2 4.7 4.7 7.5 4.6 6.8 5.3Interest and similar income 0.2 0.2 0.1 0.2 0.1 0.1 0.1 0.1 0.2 0.2Other income 2.1 2.4 2.5 2.3 2.1 2.2 2.2 2.2 2.1 2.5
of which: Income from long-term equity investments 0.3 0.4 0.0 0.0 0.2 0.4 0.3 0.3 0.4 0.4Total income 102.3 102.5 102.6 102.5 102.1 102.3 102.3 102.3 102.3 102.7
ExpensesCost of materials 61.4 60.4 40.6 42.4 48.9 48.6 59.9 58.1 65.6 64.9Personnel expenses 21.7 21.9 31.0 30.2 29.4 29.1 23.5 23.9 18.7 18.9Depreciation 2.3 2.2 3.3 3.2 3.1 3.0 2.2 2.4 2.2 2.0
of which: Depreciation of tangible fixed assets 1.9 2.0 3.3 3.1 2.9 2.9 2.1 2.2 1.6 1.6Interest and similar expenses 0.6 0.5 0.8 0.8 0.6 0.5 0.6 0.5 0.6 0.5Operating taxes 0.1 0.1 0.2 0.2 0.1 0.1 0.1 0.1 0.1 0.1Other expenses 10.4 10.8 15.0 14.6 13.0 13.0 10.1 10.5 9.9 10.3Total expenses before taxes on income 96.5 95.9 91.0 91.2 95.1 94.3 96.4 95.5 97.1 96.7Annual result before taxes on income 5.8 6.6 11.5 11.3 7.0 8.0 5.9 6.8 5.2 6.1Taxes on income 0.9 0.8 1.4 1.4 1.0 1.1 0.9 1.1 0.9 0.6Annual result 4.9 5.8 10.2 9.9 6.0 6.8 5.0 5.7 4.4 5.4Profit and loss transfers (parent company) 0.1 0.1 0.4 0.4 0.0 0.0 0.1 0.1 0.2 0.1Profit and loss transfers (subsidiary) 0.1 0.1 0.0 0.0 0.0 0.0 0.2 0.2 0.0 0.0Profit for the year 4.9 5.8 10.5 10.3 6.0 6.8 4.9 5.6 4.5 5.5
Balance SheetAssets Percentage of the balance sheet totalIntangible fixed assets 0.1 0.1 0.2 0.2 0.1 0.2 0.1 0.1 0.2 0.1Tangible fixed assets 11.3 11.2 28.6 25.9 19.2 19.2 11.4 11.6 9.8 9.7
of which: Land and buildings 4.5 4.3 11.8 10.0 5.9 5.9 4.2 4.0 4.3 4.2Inventories 56.2 56.1 34.0 39.9 50.0 50.5 58.8 58.5 56.0 55.9
of which: Finished goods and merchandise 2.5 2.0 2.9 2.5 2.0 2.1 2.7 3.2 2.4 1.3Cash 11.4 11.7 11.3 11.2 9.1 10.6 11.1 11.5 11.8 11.9Receivables 18.3 18.3 24.0 21.4 20.3 18.6 17.2 16.7 18.6 19.1
Short-term 17.7 17.5 22.5 21.1 19.9 18.2 16.8 16.4 17.7 18.0 of which:
Trade receivables 9.7 9.2 13.4 11.8 13.7 12.4 10.1 9.8 8.9 8.4Receivables from affiliated companies 5.3 6.1 5.5 5.8 3.5 3.4 4.4 4.4 6.0 7.4
Long-term 0.6 0.8 1.5 0.2 0.4 0.3 0.3 0.3 0.8 1.1of which: Loans to affiliated companies 0.4 0.4 1.3 0.0 0.1 0.0 0.1 0.2 0.5 0.5
Securities 0.5 0.5 0.1 0.1 0.2 0.1 0.2 0.2 0.8 0.8Other long-term equity investments 2.1 1.9 1.0 0.6 0.6 0.5 1.1 1.2 2.8 2.4
of which: Goodwill 0.1 0.1 0.4 0.3 0.1 0.1 0.0 0.1 0.1 0.1
CapitalEquity 12.2 12.0 10.0 10.3 11.1 11.4 9.7 10.0 13.7 13.1Liabilities 79.3 79.6 83.9 83.5 82.2 81.8 82.0 81.6 77.4 78.2
Short-term 74.5 75.4 64.5 67.1 72.8 73.1 77.0 77.2 73.6 75.0of which:Liabilities to banks 4.4 3.9 10.2 9.4 7.4 7.7 4.7 4.3 3.7 3.2Trade payables 6.0 5.4 9.4 8.2 7.7 6.8 5.9 5.4 5.7 5.1Liabilities to affiliated companies 8.9 9.2 8.5 6.8 9.7 8.7 9.5 9.5 8.5 9.1
Long-term 4.8 4.2 19.4 16.4 9.3 8.7 5.0 4.4 3.8 3.3 of which:
Liabilities to banks 3.8 3.4 14.5 12.2 6.8 5.9 3.5 3.0 3.3 3.0Liabilities to affiliated companies 0.6 0.6 3.8 3.3 1.4 2.0 1.1 0.9 0.2 0.2
Provisions 8.4 8.3 6.0 6.2 6.7 6.7 8.2 8.4 8.8 8.5of which: Provisions for pensions 0.9 0.8 0.2 0.1 0.3 0.3 0.7 0.6 1.1 0.9
Other Ratios Percentage of salesAnnual result before taxes on income 6.2 7.0 12.0 12.2 7.4 8.3 6.4 7.1 5.6 6.4Annual result and depreciation 7.7 8.4 14.0 14.1 9.5 10.3 7.8 8.6 7.0 7.8Trade receivables 10.5 10.0 8.1 8.0 10.7 9.9 10.5 10.0 10.5 10.1
Percentage of the balance sheet totalSales 92.9 91.8 165.7 148.1 127.9 125.3 96.6 97.4 84.8 83.2Annual result and interest paid 5.4 6.1 18.8 17.0 8.9 9.7 5.8 6.4 4.5 5.2
Percentage of liabilities and provisions less cashAnnual result and depreciation 9.4 10.1 29.4 26.6 15.3 16.5 9.6 10.6 8.0 8.6
Percentage of fixed assetsLong-term equity and liabilities 125.0 119.4 94.3 99.2 101.4 100.4 119.4 113.2 133.9 127.0
Percentage of short-term liabilitiesCash resources and short-term receivables 39.4 39.1 52.5 48.3 39.9 39.4 36.5 36.3 40.8 40.5Cash resources, short-term receivables and inventories 114.8 113.5 105.1 107.8 108.6 108.5 112.9 112.1 116.9 115.0
Percentage of cost of materialsTrade payables 9.7 9.2 13.5 12.1 11.7 10.6 9.5 9.2 9.5 9.0
Memo itemBalance sheet total in € billion 23.24 25.54 0.28 0.34 1.77 1.96 7.50 8.02 13.68 15.22Sales in € billion 21.58 23.43 0.47 0.50 2.27 2.46 7.24 7.81 11.61 12.66Number of enterprises 1 399 1 399 513 513 481 481 323 323 82 82
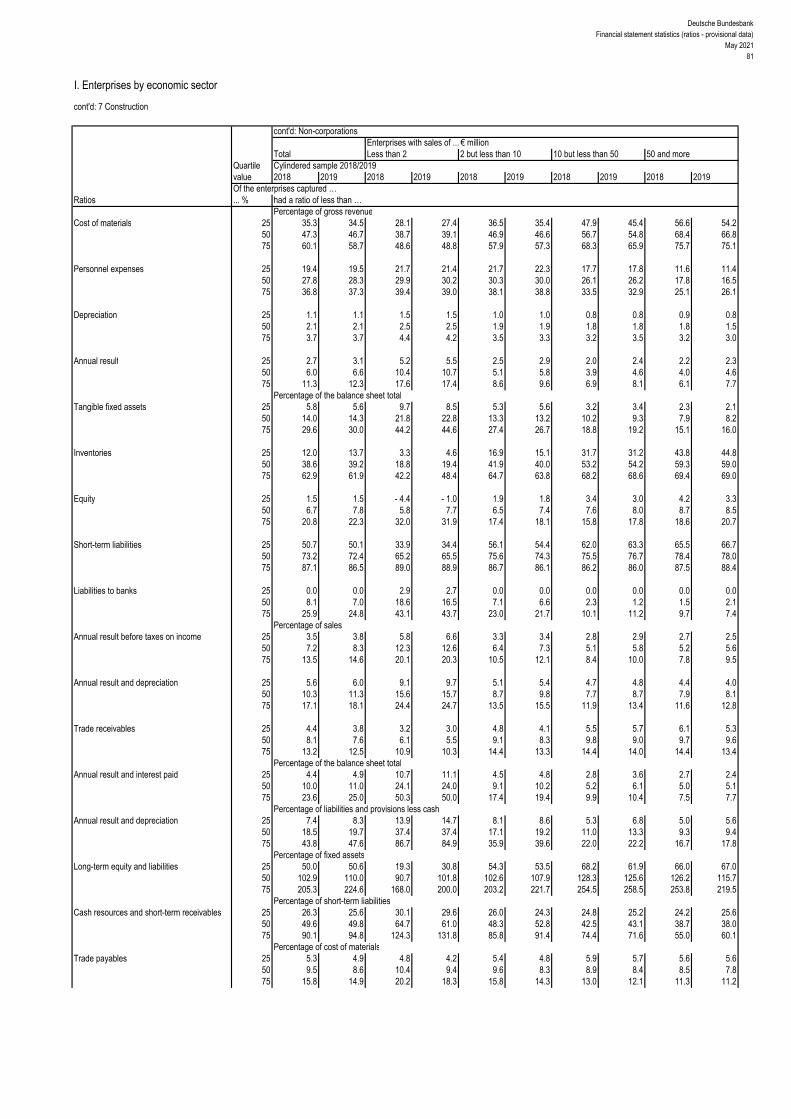
Deutsche BundesbankFinancial statement statistics (ratios - provisional data)
May 202181
I. Enterprises by economic sector
cont'd: 7 Construction
cont'd: Non-corporationsEnterprises with sales of ... € million
Total Less than 2 2 but less than 10 10 but less than 50 50 and moreQuartile Cylindered sample 2018/2019value 2018 2019 2018 2019 2018 2019 2018 2019 2018 2019Of the enterprises captured …
Ratios ... % had a ratio of less than …Percentage of gross revenue
Cost of materials 25 35.3 34.5 28.1 27.4 36.5 35.4 47.9 45.4 56.6 54.2 50 47.3 46.7 38.7 39.1 46.9 46.6 56.7 54.8 68.4 66.8 75 60.1 58.7 48.6 48.8 57.9 57.3 68.3 65.9 75.7 75.1
Personnel expenses 25 19.4 19.5 21.7 21.4 21.7 22.3 17.7 17.8 11.6 11.4 50 27.8 28.3 29.9 30.2 30.3 30.0 26.1 26.2 17.8 16.5 75 36.8 37.3 39.4 39.0 38.1 38.8 33.5 32.9 25.1 26.1
Depreciation 25 1.1 1.1 1.5 1.5 1.0 1.0 0.8 0.8 0.9 0.8 50 2.1 2.1 2.5 2.5 1.9 1.9 1.8 1.8 1.8 1.5 75 3.7 3.7 4.4 4.2 3.5 3.3 3.2 3.5 3.2 3.0
Annual result 25 2.7 3.1 5.2 5.5 2.5 2.9 2.0 2.4 2.2 2.3 50 6.0 6.6 10.4 10.7 5.1 5.8 3.9 4.6 4.0 4.6 75 11.3 12.3 17.6 17.4 8.6 9.6 6.9 8.1 6.1 7.7
Percentage of the balance sheet totalTangible fixed assets 25 5.8 5.6 9.7 8.5 5.3 5.6 3.2 3.4 2.3 2.1
50 14.0 14.3 21.8 22.8 13.3 13.2 10.2 9.3 7.9 8.2 75 29.6 30.0 44.2 44.6 27.4 26.7 18.8 19.2 15.1 16.0
Inventories 25 12.0 13.7 3.3 4.6 16.9 15.1 31.7 31.2 43.8 44.8 50 38.6 39.2 18.8 19.4 41.9 40.0 53.2 54.2 59.3 59.0 75 62.9 61.9 42.2 48.4 64.7 63.8 68.2 68.6 69.4 69.0
Equity 25 1.5 1.5 - 4.4 - 1.0 1.9 1.8 3.4 3.0 4.2 3.3 50 6.7 7.8 5.8 7.7 6.5 7.4 7.6 8.0 8.7 8.5 75 20.8 22.3 32.0 31.9 17.4 18.1 15.8 17.8 18.6 20.7
Short-term liabilities 25 50.7 50.1 33.9 34.4 56.1 54.4 62.0 63.3 65.5 66.7 50 73.2 72.4 65.2 65.5 75.6 74.3 75.5 76.7 78.4 78.0 75 87.1 86.5 89.0 88.9 86.7 86.1 86.2 86.0 87.5 88.4
Liabilities to banks 25 0.0 0.0 2.9 2.7 0.0 0.0 0.0 0.0 0.0 0.0 50 8.1 7.0 18.6 16.5 7.1 6.6 2.3 1.2 1.5 2.1 75 25.9 24.8 43.1 43.7 23.0 21.7 10.1 11.2 9.7 7.4
Percentage of salesAnnual result before taxes on income 25 3.5 3.8 5.8 6.6 3.3 3.4 2.8 2.9 2.7 2.5
50 7.2 8.3 12.3 12.6 6.4 7.3 5.1 5.8 5.2 5.6 75 13.5 14.6 20.1 20.3 10.5 12.1 8.4 10.0 7.8 9.5
Annual result and depreciation 25 5.6 6.0 9.1 9.7 5.1 5.4 4.7 4.8 4.4 4.0 50 10.3 11.3 15.6 15.7 8.7 9.8 7.7 8.7 7.9 8.1 75 17.1 18.1 24.4 24.7 13.5 15.5 11.9 13.4 11.6 12.8
Trade receivables 25 4.4 3.8 3.2 3.0 4.8 4.1 5.5 5.7 6.1 5.3 50 8.1 7.6 6.1 5.5 9.1 8.3 9.8 9.0 9.7 9.6 75 13.2 12.5 10.9 10.3 14.4 13.3 14.4 14.0 14.4 13.4
Percentage of the balance sheet totalAnnual result and interest paid 25 4.4 4.9 10.7 11.1 4.5 4.8 2.8 3.6 2.7 2.4
50 10.0 11.0 24.1 24.0 9.1 10.2 5.2 6.1 5.0 5.1 75 23.6 25.0 50.3 50.0 17.4 19.4 9.9 10.4 7.5 7.7
Percentage of liabilities and provisions less cashAnnual result and depreciation 25 7.4 8.3 13.9 14.7 8.1 8.6 5.3 6.8 5.0 5.6
50 18.5 19.7 37.4 37.4 17.1 19.2 11.0 13.3 9.3 9.4 75 43.8 47.6 86.7 84.9 35.9 39.6 22.0 22.2 16.7 17.8
Percentage of fixed assetsLong-term equity and liabilities 25 50.0 50.6 19.3 30.8 54.3 53.5 68.2 61.9 66.0 67.0
50 102.9 110.0 90.7 101.8 102.6 107.9 128.3 125.6 126.2 115.7 75 205.3 224.6 168.0 200.0 203.2 221.7 254.5 258.5 253.8 219.5
Percentage of short-term liabilitiesCash resources and short-term receivables 25 26.3 25.6 30.1 29.6 26.0 24.3 24.8 25.2 24.2 25.6
50 49.6 49.8 64.7 61.0 48.3 52.8 42.5 43.1 38.7 38.0 75 90.1 94.8 124.3 131.8 85.8 91.4 74.4 71.6 55.0 60.1
Percentage of cost of materialsTrade payables 25 5.3 4.9 4.8 4.2 5.4 4.8 5.9 5.7 5.6 5.6
50 9.5 8.6 10.4 9.4 9.6 8.3 8.9 8.4 8.5 7.8 75 15.8 14.9 20.2 18.3 15.8 14.3 13.0 12.1 11.3 11.2

Deutsche BundesbankFinancial statement statistics (ratios - provisional data)May 202182
I. Enterprises by economic sector
7.a) Construction of buildings
All legal formsEnterprises with sales of ... € million
Total Less than 2 2 but less than 10 10 but less than 50 50 and moreCylindered sample 2018/2019
Ratios 2018 2019 2018 2019 2018 2019 2018 2019 2018 2019Income statementIncome Percentage of gross revenueSales 90.2 94.4 93.2 90.5 91.7 91.4 93.1 95.2 88.9 94.4Change in finished goods 9.8 5.6 6.8 9.5 8.3 8.6 6.9 4.8 11.1 5.6Interest and similar income 0.3 0.4 0.3 0.3 0.2 0.2 0.2 0.3 0.4 0.4Other income 2.3 2.5 3.1 2.5 2.1 2.3 2.2 2.1 2.3 2.6
of which: Income from long-term equity investments 0.5 0.5 0.4 0.2 0.4 0.4 0.6 0.5 0.5 0.6Total income 102.6 102.8 103.4 102.8 102.3 102.5 102.5 102.4 102.7 103.1
ExpensesCost of materials 72.0 71.2 49.9 53.3 63.2 62.7 68.9 68.4 74.5 73.4Personnel expenses 15.4 15.4 30.6 27.8 21.6 21.9 17.0 16.9 14.0 14.0Depreciation 1.8 1.7 2.8 2.8 1.9 1.9 1.6 1.6 1.8 1.6
of which: Depreciation of tangible fixed assets 1.3 1.3 2.8 2.5 1.8 1.8 1.4 1.5 1.2 1.2Interest and similar expenses 0.8 0.8 0.9 0.8 0.7 0.6 0.8 0.7 0.8 0.8Operating taxes 0.1 0.1 0.2 0.2 0.1 0.1 0.1 0.1 0.1 0.1Other expenses 7.8 8.0 14.1 13.0 9.4 9.5 8.1 8.0 7.4 7.8Total expenses before taxes on income 97.8 97.1 98.5 98.0 96.9 96.7 96.4 95.7 98.5 97.7Annual result before taxes on income 4.8 5.7 4.9 4.8 5.3 5.8 6.1 6.7 4.2 5.3Taxes on income 1.1 1.1 1.2 1.1 1.2 1.4 1.2 1.5 1.0 0.8Annual result 3.7 4.6 3.7 3.6 4.1 4.4 4.8 5.1 3.1 4.5Profit and loss transfers (parent company) 0.2 0.2 0.9 0.5 0.1 0.1 0.0 0.3 0.3 0.1Profit and loss transfers (subsidiary) 0.1 0.8 0.1 - 0.1 0.2 0.2 0.5 0.4 0.0 1.0Profit for the year 3.8 4.0 4.5 4.2 4.0 4.3 4.4 5.0 3.4 3.6
Balance sheetAssets Percentage of the balance sheet totalIntangible fixed assets 0.1 0.1 0.1 0.1 0.1 0.1 0.1 0.1 0.1 0.1Tangible fixed assets 8.9 9.0 23.0 19.8 15.0 14.7 9.9 9.8 7.9 8.1
of which: Land and buildings 5.4 5.5 15.2 12.5 9.4 9.4 6.1 5.9 4.7 5.0Inventories 60.3 59.5 39.4 43.9 55.2 57.0 59.4 58.4 61.2 60.3
of which: Finished goods and merchandise 5.1 4.3 3.2 2.0 3.6 3.6 4.5 4.4 5.4 4.4Cash 10.2 10.4 11.1 12.6 13.1 11.9 12.1 12.4 9.2 9.6Receivables 17.5 17.9 20.1 18.6 15.7 15.3 16.3 16.8 18.1 18.6
Short-term 16.4 16.6 18.5 18.2 15.3 15.0 15.6 15.9 16.8 16.9 of which:
Trade receivables 5.4 5.2 6.7 6.8 7.4 6.7 6.7 6.4 4.8 4.7Receivables from affiliated companies 9.0 9.4 7.4 7.3 4.6 5.1 6.6 7.3 10.2 10.6
Long-term 1.1 1.3 1.6 0.4 0.4 0.4 0.7 0.9 1.3 1.6of which: Loans to affiliated companies 0.9 1.1 1.2 0.1 0.2 0.1 0.5 0.6 1.1 1.4
Securities 0.4 0.3 0.4 0.4 0.3 0.3 0.3 0.2 0.5 0.4Other long-term equity investments 2.5 2.6 5.1 4.1 0.4 0.5 1.8 2.2 2.9 2.9
of which: Goodwill 0.0 0.0 0.0 0.1 0.0 0.0 0.0 0.0 0.1 0.0
CapitalEquity 15.5 15.4 21.1 19.3 18.4 18.7 18.2 18.6 14.2 14.0Liabilities 76.7 76.8 74.0 75.7 75.8 75.7 74.1 73.5 77.8 78.1
Short-term 70.5 69.4 57.5 62.3 65.3 65.5 67.3 66.3 72.2 70.9of which:Liabilities to banks 5.3 4.6 7.7 8.6 8.9 8.3 7.8 6.7 4.1 3.5Trade payables 5.6 5.2 5.4 5.6 5.5 5.1 5.0 4.7 5.7 5.4Liabilities to affiliated companies 7.5 6.9 9.1 9.8 3.8 3.6 6.6 7.0 8.1 7.1
Long-term 6.3 7.4 16.5 13.4 10.5 10.2 6.8 7.2 5.6 7.2 of which:
Liabilities to banks 4.8 4.7 10.9 9.0 7.5 7.1 5.6 5.9 4.2 4.1Liabilities to affiliated companies 0.6 2.1 2.2 1.9 2.4 2.2 0.9 0.7 0.4 2.5
Provisions 7.7 7.6 4.8 4.9 5.6 5.2 7.6 7.8 7.9 7.8of which: Provisions for pensions 0.9 0.8 1.0 0.9 0.6 0.6 1.0 0.9 0.8 0.8
Other ratios Percentage of salesAnnual result before taxes on income 5.3 6.0 5.2 5.3 5.8 6.4 6.5 7.0 4.7 5.6Annual result and depreciation 6.0 6.7 7.0 7.1 6.5 6.9 6.9 7.1 5.6 6.4Trade receivables 7.7 7.2 7.6 8.3 8.2 7.9 8.6 8.2 7.3 6.8
Percentage of the balance sheet totalSales 70.2 72.4 87.5 82.1 90.2 85.3 78.0 78.6 65.6 69.0Annual result and interest paid 3.5 4.1 4.4 4.1 4.7 4.7 4.7 4.8 2.9 3.8
Percentage of liabilities and provisions less cashAnnual result and depreciation 5.7 6.5 9.1 8.6 8.6 8.5 7.7 8.1 4.8 5.8
Percentage of fixed assetsLong-term equity and liabilities 177.3 180.0 128.7 136.5 184.1 187.4 207.5 205.3 166.5 170.9
Percentage of short-term liabilitiesCash resources and short-term receivables 38.1 39.2 51.9 49.7 43.7 41.3 41.6 42.9 36.5 37.7Cash resources, short-term receivables and inventories 123.7 125.0 120.5 120.1 128.2 128.3 129.8 130.9 121.3 122.8
Percentage of cost of materialsTrade payables 9.9 9.6 11.6 11.6 8.9 8.7 8.8 8.3 10.4 10.1
Memo item;Balance sheet total in € billion 52.87 57.95 0.34 0.42 2.89 3.23 13.32 14.46 36.32 39.84Sales in € billion 37.11 41.95 0.29 0.35 2.61 2.76 10.38 11.37 23.82 27.48Number of enterprises 1 441 1 441 300 300 542 542 443 443 156 156

Deutsche BundesbankFinancial statement statistics (ratios - provisional data)
May 202183
I. Enterprises by economic sector
cont'd: 7.a) Construction of buildings
cont'd: All legal formsEnterprises with sales of ... € million
Total Less than 2 2 but less than 10 10 but less than 50 50 and moreQuartile Cylindered sample 2018/2019value 2018 2019 2018 2019 2018 2019 2018 2019 2018 2019Of the enterprises captured …
Ratios ... % had a ratio of less than …Percentage of gross revenue
Cost of materials 25 48.9 47.8 35.1 34.2 47.6 46.3 57.3 55.8 65.3 62.1 50 63.2 62.2 46.9 47.5 62.3 60.4 69.0 68.1 75.4 74.7 75 76.4 75.9 61.2 61.0 75.7 74.8 78.1 77.7 82.6 81.1
Personnel expenses 25 10.5 10.4 18.1 16.1 11.1 10.6 9.7 9.3 7.4 7.7 50 20.2 20.3 32.2 31.6 21.5 22.4 16.8 17.1 12.7 12.2 75 31.7 31.8 41.6 42.8 33.1 33.5 26.1 25.7 19.9 18.8
Depreciation 25 0.5 0.5 0.9 0.8 0.5 0.5 0.4 0.4 0.3 0.3 50 1.3 1.3 1.9 1.9 1.2 1.2 1.1 1.1 1.2 1.2 75 2.5 2.5 3.6 3.4 2.3 2.3 2.2 2.3 2.3 2.1
Annual result 25 0.9 1.2 0.2 0.7 0.9 1.1 1.3 1.5 1.3 1.8 50 3.0 3.4 2.7 3.6 2.8 3.0 3.1 3.5 3.5 3.9 75 6.2 7.0 6.6 8.1 5.7 6.7 6.4 6.7 6.2 7.0
Percentage of the balance sheet totalTangible fixed assets 25 1.6 1.7 3.7 3.5 2.2 2.1 1.2 1.2 0.6 0.6
50 7.3 7.1 12.1 11.3 7.4 7.1 6.0 5.9 3.7 3.2 75 16.8 16.9 27.6 25.2 15.9 16.9 12.9 13.0 11.0 10.2
Inventories 25 30.7 28.8 5.5 6.4 31.8 29.6 43.7 42.6 46.8 46.9 50 55.2 56.1 31.1 33.3 56.8 58.2 59.3 58.5 62.2 60.2 75 72.2 72.7 60.6 65.9 74.3 74.6 73.5 72.3 74.1 71.8
Equity 25 4.7 5.5 2.3 3.4 4.1 5.5 6.2 6.1 4.9 5.6 50 12.8 13.4 13.8 14.1 13.1 13.8 12.9 13.6 11.4 11.6 75 28.4 30.1 38.3 41.2 28.8 31.3 24.8 26.8 21.9 23.5
Short-term liabilities 25 49.5 47.0 34.6 31.5 49.6 45.9 54.6 53.2 58.7 59.2 50 71.5 69.9 60.5 62.8 72.7 71.3 72.6 71.3 73.8 71.7 75 85.3 84.4 85.6 84.2 86.4 85.3 84.7 83.5 85.5 84.5
Liabilities to banks 25 0.0 0.0 0.0 0.0 0.0 0.0 0.0 0.0 0.0 0.0 50 3.0 2.9 7.6 6.8 4.1 4.1 1.6 1.1 0.8 0.3 75 15.9 16.0 21.4 19.9 16.2 19.1 11.0 10.1 13.8 10.0
Percentage of salesAnnual result before taxes on income 25 1.4 1.8 0.3 1.1 1.4 1.8 1.9 2.1 1.9 2.3
50 4.3 4.8 3.7 4.8 4.2 4.1 4.6 4.8 4.8 5.6 75 8.8 9.6 9.7 10.4 8.2 9.4 9.2 9.7 9.0 9.1
Annual result and depreciation 25 3.0 3.4 2.3 3.3 2.8 3.2 3.4 3.5 3.2 3.6 50 6.3 6.7 6.6 7.7 5.9 6.1 6.4 6.7 6.7 7.1 75 11.2 12.4 13.0 13.8 10.5 12.1 11.2 11.9 11.2 12.5
Trade receivables 25 2.5 2.3 2.0 1.7 2.2 2.0 3.0 2.7 2.6 2.9 50 6.0 5.5 5.3 5.4 5.5 5.1 6.5 6.3 6.8 5.9 75 11.4 10.6 11.8 10.8 11.0 9.9 11.4 11.1 11.1 10.6
Percentage of the balance sheet totalAnnual result and interest paid 25 1.8 2.0 1.3 1.8 1.8 1.9 2.1 2.3 1.7 2.1
50 4.0 4.4 5.0 5.5 4.1 4.3 3.8 4.4 3.4 3.8 75 8.3 9.3 13.8 13.9 8.5 9.7 7.1 8.0 6.2 6.6
Percentage of liabilities and provisions less cashAnnual result and depreciation 25 3.1 3.6 0.2 2.3 3.3 3.1 3.5 4.7 3.7 4.1
50 8.5 9.0 9.4 10.6 8.6 9.0 8.5 8.4 7.6 8.5 75 19.6 20.8 30.0 38.2 20.8 22.1 17.1 18.6 14.0 15.3
Percentage of fixed assetsLong-term equity and liabilities 25 102.7 106.0 77.6 91.7 112.4 112.2 112.0 115.4 105.8 101.8
50 206.2 209.8 163.2 176.5 210.6 221.0 232.2 226.8 206.1 212.3 75 542.0 568.5 394.9 520.0 552.6 597.0 587.0 565.0 652.8 560.9
Percentage of short-term liabilitiesCash resources and short-term receivables 25 23.5 23.3 29.8 26.9 21.1 20.5 23.4 24.0 23.5 24.3
50 42.7 44.1 64.6 72.9 41.6 40.2 40.0 43.2 36.9 40.4 75 86.2 96.5 156.9 160.5 88.8 99.9 70.0 74.1 54.1 57.0
Percentage of cost of materialsTrade payables 25 4.5 4.3 4.5 3.4 4.0 3.7 5.2 4.8 4.8 5.0
50 8.0 7.4 8.8 8.1 7.5 6.8 8.1 7.6 8.0 7.8 75 13.0 12.1 17.4 16.7 12.6 11.7 11.6 11.0 12.6 12.2

Deutsche BundesbankFinancial statement statistics (ratios - provisional data)May 202184
I. Enterprises by economic sector
7.b) Civil engineering
All legal formsEnterprises with sales of ... € million
Total Less than 2 2 but less than 10 10 but less than 50 50 and moreCylindered sample 2018/2019
Ratios 2018 2019 2018 2019 2018 2019 2018 2019 2018 2019Income statementIncome Percentage of gross revenueSales 97.5 95.7 93.8 93.4 97.2 94.7 93.0 93.7 99.7 96.9Change in finished goods 2.5 4.3 6.2 6.6 2.8 5.3 7.0 6.3 0.3 3.1Interest and similar income 0.2 0.3 0.1 0.1 0.1 0.1 0.2 0.2 0.3 0.3Other income 3.3 3.2 3.7 3.4 3.3 2.4 3.2 2.5 3.3 3.6
of which: Income from long-term equity investments 0.8 0.7 0.0 0.1 0.1 0.2 0.8 0.5 1.0 0.9Total income 103.5 103.4 103.8 103.5 103.4 102.4 103.4 102.6 103.6 104.0
ExpensesCost of materials 54.6 53.0 33.3 34.8 43.5 42.1 51.7 50.5 57.7 56.0Personnel expenses 28.4 28.6 36.2 35.4 33.1 32.8 29.1 28.7 27.3 27.8Depreciation 3.4 3.4 5.3 5.0 4.0 4.0 3.0 3.2 3.5 3.4
of which: Depreciation of tangible fixed assets 2.8 3.0 5.2 5.0 3.8 3.8 2.8 3.1 2.7 2.8Interest and similar expenses 0.8 0.8 0.7 0.7 0.5 0.4 0.5 0.5 1.0 1.0Operating taxes 0.1 0.1 0.2 0.3 0.1 0.1 0.1 0.1 0.1 0.1Other expenses 11.9 11.9 20.6 19.3 16.5 16.0 12.4 12.5 11.0 11.0Total expenses before taxes on income 99.3 97.8 96.4 95.5 97.8 95.6 96.8 95.4 100.7 99.3Annual result before taxes on income 4.2 5.6 7.4 8.0 5.6 6.9 6.5 7.2 2.9 4.6Taxes on income 1.2 1.4 1.7 1.9 1.5 1.7 1.5 1.6 1.0 1.3Annual result 3.0 4.2 5.7 6.2 4.1 5.2 5.1 5.7 1.9 3.3Profit and loss transfers (parent company) - 0.4 0.1 0.0 0.0 0.0 0.0 0.1 0.1 - 0.7 0.1Profit and loss transfers (subsidiary) 0.0 0.6 0.0 0.0 0.0 0.1 0.6 1.0 - 0.3 0.5Profit for the year 2.6 3.7 5.7 6.1 4.1 5.1 4.6 4.8 1.5 3.0
Balance sheetAssets Percentage of the balance sheet totalIntangible fixed assets 0.1 0.1 0.2 0.2 0.3 0.2 0.1 0.1 0.1 0.1Tangible fixed assets 13.0 13.0 34.6 35.4 22.5 22.1 13.4 13.0 11.9 12.0
of which: Land and buildings 3.4 3.3 8.3 8.4 2.9 2.9 3.1 2.9 3.6 3.4Inventories 42.5 42.8 31.1 33.6 41.4 42.5 50.2 50.3 39.7 39.9
of which: Finished goods and merchandise 2.5 1.2 1.3 1.5 1.2 1.1 2.8 2.8 2.5 0.5Cash 8.5 9.1 14.1 13.8 13.8 14.1 11.2 12.6 7.0 7.2Receivables 25.2 24.6 19.1 16.3 20.5 19.5 22.5 21.3 26.7 26.5
Short-term 24.7 24.1 18.7 16.0 20.1 19.0 21.3 20.3 26.4 26.1 of which:
Trade receivables 9.6 8.9 11.2 9.8 14.3 13.1 12.4 12.3 8.2 7.2Receivables from affiliated companies 11.9 12.5 3.1 2.7 2.7 3.0 5.7 5.4 15.1 16.3
Long-term 0.5 0.5 0.4 0.3 0.4 0.5 1.1 1.0 0.3 0.3of which: Loans to affiliated companies 0.3 0.3 0.4 0.3 0.1 0.1 1.0 0.8 0.1 0.1
Securities 0.2 0.4 0.0 0.0 0.4 0.3 0.4 0.5 0.2 0.4Other long-term equity investments 10.2 9.8 0.4 0.3 0.8 1.0 2.0 2.0 14.2 13.8
of which: Goodwill 0.0 0.0 0.3 0.2 0.2 0.2 0.0 0.0 0.0 0.0
CapitalEquity 20.4 20.5 27.1 26.7 24.5 25.3 19.0 19.6 20.5 20.4Liabilities 67.3 67.1 67.4 68.4 68.0 67.4 71.9 71.5 65.4 65.3
Short-term 64.5 64.4 55.1 53.5 60.2 59.9 67.9 68.0 63.6 63.4of which:Liabilities to banks 1.7 1.3 8.2 6.1 5.0 4.8 2.1 1.8 1.2 0.7Trade payables 5.4 4.9 8.1 6.6 7.4 6.6 5.8 5.0 5.1 4.8Liabilities to affiliated companies 12.2 12.0 3.2 3.2 5.7 4.8 6.5 6.3 15.1 15.0
Long-term 2.7 2.7 12.4 14.9 7.7 7.5 4.0 3.5 1.8 1.8 of which:
Liabilities to banks 1.8 1.9 9.5 12.3 5.3 5.1 2.6 2.4 1.2 1.3Liabilities to affiliated companies 0.6 0.5 1.4 1.0 1.7 1.8 1.0 0.7 0.4 0.4
Provisions 12.3 12.4 5.4 4.9 7.4 7.2 9.1 8.9 14.1 14.3of which: Provisions for pensions 3.7 3.6 0.5 0.5 1.0 0.9 1.7 1.6 4.7 4.7
Other ratios Percentage of salesAnnual result before taxes on income 4.3 5.9 7.9 8.6 5.8 7.3 7.0 7.7 2.9 4.8Annual result and depreciation 6.6 8.0 11.7 12.0 8.4 9.7 8.7 9.5 5.5 7.0Trade receivables 11.0 10.7 9.9 9.1 11.1 10.7 13.4 13.4 9.9 9.4
Percentage of the balance sheet totalSales 88.1 83.7 112.3 107.2 128.1 121.8 93.0 92.3 82.5 76.7Annual result and interest paid 3.5 4.4 7.6 7.9 6.1 7.2 5.6 6.1 2.4 3.4
Percentage of liabilities and provisions less cashAnnual result and depreciation 8.2 9.5 22.3 21.5 17.4 19.6 11.6 13.0 6.2 7.4
Percentage of fixed assetsLong-term equity and liabilities 112.1 113.8 112.3 116.1 138.1 141.3 147.6 151.1 101.5 102.4
Percentage of short-term liabilitiesCash resources and short-term receivables 51.8 52.0 59.7 55.7 56.9 55.7 48.3 48.7 52.8 53.1Cash resources, short-term receivables and inventories 117.7 118.5 116.2 118.5 125.5 126.6 122.3 122.7 115.2 116.0
Percentage of cost of materialsTrade payables 11.0 10.6 20.3 16.5 13.0 12.2 11.2 10.0 10.6 10.7
Memo itemBalance sheet total in € billion 21.79 23.64 0.13 0.16 1.25 1.41 5.66 6.26 14.75 15.81Sales in € billion 19.19 19.80 0.15 0.17 1.61 1.72 5.26 5.78 12.17 12.13Number of enterprises 763 763 134 134 322 322 237 237 70 70

Deutsche BundesbankFinancial statement statistics (ratios - provisional data)
May 202185
I. Enterprises by economic sector
cont'd: 7.b) Civil engineering
cont'd: All legal formsEnterprises with sales of ... € million
Total Less than 2 2 but less than 10 10 but less than 50 50 and moreQuartile Cylindered sample 2018/2019value 2018 2019 2018 2019 2018 2019 2018 2019 2018 2019Of the enterprises captured …
Ratios ... % had a ratio of less than …Percentage of gross revenue
Cost of materials 25 33.6 32.8 20.1 20.1 32.7 31.4 41.0 39.2 48.3 47.5 50 44.1 43.3 30.2 32.4 41.9 40.7 49.9 49.6 57.3 57.3 75 54.9 53.6 40.6 41.9 50.6 49.0 58.0 56.6 67.4 64.4
Personnel expenses 25 24.6 24.5 29.3 27.2 25.5 26.6 24.0 23.5 20.2 22.3 50 31.4 31.8 37.4 39.0 32.7 33.7 29.2 29.5 26.2 26.2 75 39.3 39.7 46.0 46.6 40.0 40.9 36.2 36.0 29.8 31.1
Depreciation 25 1.6 1.5 1.7 1.8 1.6 1.7 1.4 1.4 1.5 1.3 50 3.1 3.2 3.7 3.9 3.3 3.3 2.8 2.9 2.8 2.6 75 4.9 5.1 6.8 6.7 5.1 5.3 4.2 4.4 4.2 4.4
Annual result 25 1.5 1.9 1.2 2.1 1.3 1.6 1.8 2.3 2.1 2.2 50 3.8 4.3 5.1 4.8 3.6 3.9 3.9 4.8 3.1 3.4 75 7.6 7.8 9.9 9.2 7.1 7.6 7.9 8.0 5.6 5.7
Percentage of the balance sheet totalTangible fixed assets 25 7.6 7.4 12.2 11.9 9.6 9.7 6.5 5.3 5.2 5.0
50 17.2 17.6 29.2 28.2 20.9 20.5 13.1 13.5 9.1 9.9 75 31.6 31.4 42.8 47.1 35.7 35.2 22.3 24.4 18.3 20.3
Inventories 25 11.1 10.5 0.4 0.3 8.3 9.5 25.8 24.7 29.3 32.4 50 35.5 34.9 12.7 13.6 32.0 31.4 43.8 41.8 50.1 52.3 75 57.3 56.3 35.6 42.3 52.9 53.2 63.5 61.6 60.4 61.0
Equity 25 8.3 9.4 10.1 12.6 8.8 10.1 8.4 9.1 5.6 6.5 50 18.9 19.6 29.9 32.5 20.6 21.2 15.6 17.3 13.9 14.8 75 38.0 41.7 47.1 52.5 40.4 42.7 31.4 35.5 25.3 28.8
Short-term liabilities 25 38.7 36.3 18.7 17.5 36.5 35.8 48.6 44.2 53.2 55.4 50 60.5 58.2 50.1 41.5 58.2 55.7 65.1 64.1 68.9 68.0 75 78.7 78.4 74.6 76.5 76.5 77.1 80.4 79.3 80.8 81.1
Liabilities to banks 25 0.0 0.0 0.0 0.0 0.8 0.5 0.0 0.0 0.0 0.0 50 5.2 4.4 9.0 7.1 8.5 7.6 3.2 1.9 0.3 0.5 75 15.5 14.6 25.7 28.6 20.0 19.1 9.3 8.7 5.5 4.4
Percentage of salesAnnual result before taxes on income 25 2.2 2.7 2.3 2.8 1.7 2.2 2.9 3.4 2.6 2.7
50 5.4 6.0 7.1 6.3 4.9 5.5 5.6 6.9 4.3 5.2 75 10.5 10.9 13.0 11.8 9.8 10.9 11.3 10.9 7.4 8.7
Annual result and depreciation 25 5.1 5.8 6.7 6.7 4.8 5.6 5.7 6.0 4.0 4.9 50 9.2 10.3 11.7 11.2 9.2 10.2 8.9 10.3 8.0 8.1 75 14.5 15.3 17.4 18.4 14.0 15.5 14.1 15.1 11.9 12.6
Trade receivables 25 5.9 5.2 3.4 2.8 5.8 5.0 8.0 7.1 6.8 6.4 50 10.2 9.5 7.3 6.7 9.5 9.0 12.4 11.4 10.2 10.0 75 15.6 15.1 13.6 11.9 14.7 14.7 17.1 17.6 16.2 15.8
Percentage of the balance sheet totalAnnual result and interest paid 25 2.6 3.3 2.8 4.3 2.9 3.1 2.6 3.5 2.2 2.0
50 5.7 6.4 8.1 8.7 5.8 6.6 5.6 6.1 4.3 4.3 75 11.6 12.6 17.8 15.5 11.6 13.2 10.0 10.4 6.7 6.9
Percentage of liabilities and provisions less cashAnnual result and depreciation 25 6.6 7.6 5.2 7.2 7.2 7.8 6.9 8.3 4.9 4.6
50 15.5 17.4 20.4 24.4 17.4 19.3 14.3 15.8 10.1 9.9 75 35.7 40.8 56.4 69.2 39.8 45.9 28.9 30.5 18.1 19.0
Percentage of fixed assetsLong-term equity and liabilities 25 85.2 88.3 73.7 90.6 81.3 84.6 94.2 101.7 85.1 69.6
50 139.7 144.5 148.1 150.2 132.4 135.6 162.0 163.5 121.9 115.3 75 242.0 261.4 308.8 340.0 224.2 228.9 270.5 281.1 180.8 186.8
Percentage of short-term liabilitiesCash resources and short-term receivables 25 31.8 33.4 38.7 37.4 31.9 35.5 30.1 32.9 28.6 28.7
50 62.7 64.7 98.9 121.2 70.6 72.6 54.7 57.6 44.7 43.1 75 133.5 138.3 249.5 240.1 141.8 134.6 102.8 119.8 83.4 71.2
Percentage of cost of materialsTrade payables 25 6.2 5.8 5.2 4.7 6.4 5.8 6.3 5.9 7.4 6.7
50 10.1 9.1 11.7 9.3 11.1 9.2 9.3 8.7 9.5 9.4 75 17.0 15.5 31.2 21.6 18.3 16.5 13.6 12.4 12.2 14.3

Deutsche BundesbankFinancial statement statistics (ratios - provisional data)May 202186
I. Enterprises by economic sector
7.c) Specialised construction activities
All legal formsEnterprises with sales of ... € million
Total Less than 2 2 but less than 10 10 but less than 50 50 and moreCylindered sample 2018/2019
Ratios 2018 2019 2018 2019 2018 2019 2018 2019 2018 2019Income statementIncome Percentage of gross revenueSales 96.6 97.5 96.2 95.3 95.9 96.6 94.6 97.1 99.2 98.9Change in finished goods 3.4 2.5 3.8 4.7 4.1 3.4 5.4 2.9 0.8 1.1Interest and similar income 0.1 0.2 0.1 0.1 0.1 0.1 0.1 0.1 0.2 0.3Other income 1.9 2.0 2.4 2.4 2.0 1.9 1.7 1.8 1.9 2.3
of which: Income from long-term equity investments 0.1 0.1 0.0 0.0 0.0 0.1 0.1 0.1 0.2 0.2Total income 102.0 102.2 102.5 102.5 102.0 102.0 101.8 101.9 102.0 102.6
ExpensesCost of materials 53.9 53.4 41.3 41.9 49.9 49.2 56.2 55.4 56.8 56.4Personnel expenses 28.2 28.0 36.9 36.0 31.1 30.9 26.0 26.1 26.7 26.4Depreciation 2.0 2.0 2.5 2.5 2.2 2.2 1.9 1.9 1.9 1.9
of which: Depreciation of tangible fixed assets 1.8 1.8 2.5 2.4 2.1 2.1 1.8 1.8 1.6 1.5Interest and similar expenses 0.5 0.5 0.6 0.6 0.4 0.4 0.4 0.4 0.8 0.6Operating taxes 0.1 0.1 0.2 0.1 0.1 0.1 0.1 0.1 0.1 0.1Other expenses 13.0 12.6 15.1 14.6 13.2 13.1 11.9 12.0 13.5 12.4Total expenses before taxes on income 97.8 96.6 96.6 95.6 96.8 95.8 96.6 95.9 99.8 98.0Annual result before taxes on income 4.2 5.6 5.9 6.8 5.2 6.2 5.2 6.0 2.2 4.7Taxes on income 1.1 1.2 1.3 1.4 1.4 1.6 1.3 1.4 0.8 0.7Annual result 3.1 4.4 4.7 5.4 3.8 4.6 4.0 4.6 1.4 3.9Profit and loss transfers (parent company) 0.2 - 0.1 0.0 0.0 0.0 0.0 0.0 0.0 0.5 - 0.3Profit and loss transfers (subsidiary) 0.4 0.8 0.0 0.0 0.1 0.1 0.7 0.8 0.2 1.5Profit for the year 2.9 3.5 4.6 5.4 3.7 4.5 3.3 3.8 1.7 2.2
Balance sheetAssets Percentage of the balance sheet totalIntangible fixed assets 0.4 0.3 0.2 0.2 0.2 0.2 0.2 0.2 0.8 0.5Tangible fixed assets 10.7 10.5 19.1 18.4 14.3 14.1 11.2 11.2 7.5 7.3
of which: Land and buildings 2.6 2.6 4.0 3.7 3.7 3.5 3.3 3.2 1.4 1.5Inventories 47.1 46.3 38.3 41.1 46.5 46.3 51.8 50.9 44.5 43.1
of which: Finished goods and merchandise 1.4 1.4 3.8 3.4 2.1 2.0 1.0 0.8 1.2 1.4Cash 9.6 10.3 14.7 14.7 13.5 14.7 10.2 11.3 6.5 6.8Receivables 27.9 28.0 25.9 24.0 23.9 23.2 24.6 24.1 32.8 34.0
Short-term 27.1 27.2 25.4 23.4 23.5 22.8 23.8 23.3 31.9 33.0 of which:
Trade receivables 14.7 13.8 16.6 15.4 16.4 15.6 15.6 14.8 12.8 12.0Receivables from affiliated companies 9.7 10.7 3.6 3.3 3.5 3.7 5.8 6.0 16.6 18.8
Long-term 0.8 0.8 0.5 0.6 0.4 0.4 0.8 0.8 1.0 1.0of which: Loans to affiliated companies 0.4 0.4 0.2 0.3 0.2 0.2 0.3 0.3 0.6 0.6
Securities 0.4 0.4 0.5 0.5 0.6 0.5 0.3 0.4 0.3 0.3Other long-term equity investments 3.6 3.9 0.6 0.5 0.5 0.5 1.4 1.6 7.2 7.7
of which: Goodwill 0.2 0.2 0.3 0.3 0.2 0.1 0.3 0.4 0.2 0.2
CapitalEquity 20.2 21.0 22.1 23.2 23.9 24.5 20.0 20.8 18.3 19.2Liabilities 67.4 67.2 69.4 68.8 67.6 67.1 69.3 68.8 65.6 65.7
Short-term 62.5 62.5 58.5 58.8 61.2 61.1 65.0 64.2 61.6 62.2of which:Liabilities to banks 2.9 3.0 7.6 7.2 4.6 4.5 2.8 2.9 1.6 1.8Trade payables 7.7 7.2 10.0 8.5 8.6 7.6 7.9 7.4 6.7 6.8Liabilities to affiliated companies 6.7 7.0 2.9 2.9 3.8 3.5 6.2 5.9 9.0 10.1
Long-term 4.9 4.7 10.9 10.1 6.4 6.0 4.3 4.5 4.0 3.5 of which:
Liabilities to banks 2.7 2.4 7.5 6.8 4.6 4.2 2.7 2.7 1.1 0.9Liabilities to affiliated companies 1.4 1.6 2.3 2.1 1.1 1.2 1.0 1.3 1.8 2.0
Provisions 12.2 11.7 8.4 7.8 8.4 8.4 10.6 10.4 15.8 14.8of which: Provisions for pensions 2.9 2.5 1.9 1.6 1.4 1.4 1.6 1.5 4.8 3.9
Other ratios Percentage of salesAnnual result before taxes on income 4.4 5.8 6.1 7.1 5.5 6.4 5.5 6.2 2.2 4.7Annual result and depreciation 5.3 6.6 7.4 8.3 6.3 7.0 6.2 6.7 3.4 5.9Trade receivables 11.7 11.1 9.3 9.2 11.2 10.7 12.6 11.8 11.7 11.1
Percentage of the balance sheet totalSales 125.0 124.1 178.1 168.1 146.9 145.2 124.3 125.4 109.1 107.5Annual result and interest paid 4.7 6.2 9.8 10.5 6.6 7.5 5.7 6.4 2.4 5.0
Percentage of liabilities and provisions less cashAnnual result and depreciation 9.4 11.9 21.0 22.3 14.8 16.7 11.1 12.4 4.9 8.5
Percentage of fixed assetsLong-term equity and liabilities 178.9 179.3 170.2 175.8 202.9 206.9 187.9 191.3 162.6 158.6
Percentage of short-term liabilitiesCash resources and short-term receivables 59.0 60.2 69.1 65.3 61.0 61.9 52.6 54.2 62.4 64.0Cash resources, short-term receivables and inventories 134.3 134.3 134.5 135.1 137.1 137.7 132.4 133.5 134.6 133.3
Percentage of cost of materialsTrade payables 11.0 10.6 13.1 11.5 11.2 10.2 10.8 10.3 10.8 11.0
Memo item:Balance sheet total in € billion 22.92 25.17 0.97 1.13 4.75 5.22 7.76 8.48 9.43 10.34Sales in € billion 28.66 31.24 1.73 1.91 6.98 7.58 9.65 10.64 10.29 11.11Number of enterprises 4 003 4 003 1 832 1 832 1 581 1 581 502 502 88 88

Deutsche BundesbankFinancial statement statistics (ratios - provisional data)
May 202187
I. Enterprises by economic sector
cont'd: 7.c) Specialised construction activities
cont'd: All legal formsEnterprises with sales of ... € million
Total Less than 2 2 but less than 10 10 but less than 50 50 and moreQuartile Cylindered sample 2018/2019value 2018 2019 2018 2019 2018 2019 2018 2019 2018 2019Of the enterprises captured …
Ratios ... % had a ratio of less than …Percentage of gross revenue
Cost of materials 25 34.6 33.6 29.8 28.9 38.7 37.7 45.7 44.2 48.6 46.8 50 45.8 44.9 39.5 39.3 48.7 47.7 55.6 54.9 59.5 56.9 75 56.4 55.8 49.3 49.2 58.7 57.6 66.4 64.6 66.2 66.5
Personnel expenses 25 24.6 24.5 27.2 26.8 24.8 24.1 18.7 19.3 19.6 18.9 50 33.4 33.2 36.9 36.8 32.4 32.1 26.7 27.4 25.9 27.0 75 42.0 42.4 46.4 46.4 40.2 40.4 34.3 34.8 31.6 33.3
Depreciation 25 0.9 0.9 1.1 1.1 0.9 0.9 0.6 0.6 0.7 0.6 50 1.7 1.7 2.1 2.0 1.5 1.5 1.2 1.2 1.0 1.1 75 2.9 2.8 3.4 3.3 2.5 2.4 2.2 2.2 2.2 2.2
Annual result 25 0.9 1.4 0.6 1.2 1.0 1.4 1.4 1.9 0.7 0.7 50 3.2 3.7 3.3 4.0 3.0 3.5 3.2 3.9 3.4 3.4 75 7.0 7.7 8.8 9.0 6.1 6.9 5.8 6.6 5.3 5.8
Percentage of the balance sheet totalTangible fixed assets 25 4.2 4.2 6.3 6.0 4.0 4.0 2.3 2.3 1.8 1.7
50 11.3 11.0 15.1 14.6 10.0 9.9 5.7 5.8 3.9 4.0 75 24.4 24.7 30.4 30.4 21.3 21.5 14.1 14.5 9.3 9.8
Inventories 25 9.2 9.1 4.7 5.4 12.0 10.7 25.5 24.0 25.5 24.2 50 30.5 29.6 20.5 21.3 36.2 34.4 48.9 48.8 44.6 45.1 75 57.1 56.5 46.6 47.6 59.7 59.7 67.5 66.2 62.9 59.9
Equity 25 6.3 7.9 3.0 5.9 8.4 10.0 7.7 8.3 7.0 6.4 50 20.3 22.4 20.4 23.2 21.3 23.7 17.1 19.4 16.1 17.7 75 41.4 43.8 45.3 46.9 42.0 44.6 30.7 32.3 31.2 32.4
Short-term liabilities 25 33.1 30.6 28.9 25.1 34.9 32.0 48.6 47.5 41.5 39.4 50 57.5 55.8 53.4 51.0 57.1 55.6 65.8 64.6 57.8 59.8 75 78.1 76.1 79.5 76.0 76.7 75.5 79.4 77.8 74.7 75.2
Liabilities to banks 25 0.0 0.0 0.0 0.0 0.0 0.0 0.0 0.0 0.0 0.0 50 5.3 4.9 9.8 9.0 4.1 3.9 0.7 0.3 0.0 0.0 75 19.7 19.6 28.1 27.9 16.1 15.6 7.6 7.6 2.9 1.9
Percentage of salesAnnual result before taxes on income 25 1.3 1.9 0.9 1.6 1.6 2.0 2.2 2.7 0.7 1.1
50 4.3 5.1 4.4 5.3 4.2 4.9 4.4 5.3 4.5 4.9 75 9.3 10.3 11.3 12.1 8.5 9.5 8.2 8.9 6.8 7.4
Annual result and depreciation 25 3.2 3.8 2.9 3.9 3.2 3.8 3.7 4.0 2.9 2.5 50 6.6 7.3 6.8 7.9 6.4 7.0 6.5 7.2 5.6 6.1 75 12.1 13.0 14.3 15.0 10.9 12.1 10.7 11.2 8.5 9.8
Trade receivables 25 4.9 4.7 4.0 3.6 5.7 5.5 7.1 6.6 8.2 8.0 50 8.9 8.4 7.5 7.0 9.7 9.3 10.8 10.1 12.4 10.6 75 13.8 13.4 12.3 12.1 14.5 14.0 16.2 15.8 16.2 16.0
Percentage of the balance sheet totalAnnual result and interest paid 25 2.5 3.3 2.4 3.6 2.7 3.3 2.6 3.2 1.0 1.6
50 6.7 7.6 8.4 9.3 6.3 6.8 5.3 6.0 4.6 5.1 75 14.5 16.0 20.0 22.4 11.9 13.6 9.9 11.1 7.7 8.4
Percentage of liabilities and provisions less cashAnnual result and depreciation 25 4.3 5.5 2.8 5.3 5.0 5.6 5.5 6.3 3.6 3.5
50 15.0 16.9 15.7 19.3 15.4 16.4 12.9 14.2 10.1 11.2 75 41.4 46.3 53.0 56.8 39.5 44.8 26.6 29.0 19.6 23.1
Percentage of fixed assetsLong-term equity and liabilities 25 103.4 111.9 81.4 94.3 122.9 129.6 118.0 123.5 123.2 111.3
50 216.1 232.2 179.6 200.0 238.5 257.6 270.6 272.2 272.7 234.7 75 483.3 526.4 441.9 431.0 514.5 576.8 608.1 614.7 526.0 623.1
Percentage of short-term liabilitiesCash resources and short-term receivables 25 37.3 38.4 39.6 39.9 37.8 38.9 29.5 33.0 39.7 41.1
50 79.3 81.6 89.6 92.1 77.1 82.1 56.8 59.7 69.1 69.9 75 166.2 178.8 197.4 228.9 159.3 172.3 107.2 109.7 121.3 118.5
Percentage of cost of materialsTrade payables 25 5.2 4.6 4.8 4.1 5.0 4.7 6.3 5.9 6.0 6.4
50 9.6 8.6 10.1 8.8 9.1 8.0 9.8 9.3 9.6 8.9 75 16.7 15.4 20.0 17.7 15.2 13.8 14.1 13.8 14.6 13.1

Deutsche BundesbankFinancial statement statistics (ratios - provisional data)May 202188
I. Enterprises by economic sector
8. Wholesale and retail trade; repair of motor vehicles and motorcycles
All legal formsEnterprises with sales of ... € million
Total Less than 2 2 but less than 10 10 but less than 50 50 and moreCylindered sample 2018/2019
Ratios 2018 2019 2018 2019 2018 2019 2018 2019 2018 2019Income statementIncome Percentage of gross revenueSales 99.9 99.9 99.6 99.5 99.8 99.7 99.9 100.0 100.0 99.9Change in finished goods 0.1 0.1 0.4 0.5 0.2 0.3 0.1 0.0 0.0 0.1Interest and similar income 0.1 0.1 0.1 0.1 0.1 0.1 0.1 0.1 0.1 0.1Other income 1.5 1.6 2.3 2.2 1.7 1.7 1.2 1.2 1.5 1.6
of which: Income from long-term equity investments 0.3 0.4 0.1 0.1 0.1 0.1 0.1 0.2 0.4 0.5Total income 101.6 101.7 102.4 102.3 101.8 101.8 101.3 101.3 101.7 101.8
ExpensesCost of materials 81.5 81.2 57.7 57.5 68.8 68.5 74.4 74.3 82.6 82.4Personnel expenses 7.0 7.1 20.6 20.4 15.2 15.3 11.5 11.6 6.2 6.4Depreciation 0.9 0.9 2.0 2.0 1.6 1.5 1.3 1.3 0.9 0.9
of which: Depreciation of tangible fixed assets 0.8 0.9 2.0 1.9 1.4 1.5 1.1 1.2 0.8 0.8Interest and similar expenses 0.3 0.3 0.7 0.7 0.5 0.5 0.4 0.4 0.3 0.3Operating taxes 0.0 0.0 0.1 0.1 0.1 0.1 0.0 0.0 0.0 0.0Other expenses 9.4 9.6 16.6 16.3 12.0 12.1 10.3 10.5 9.3 9.4Total expenses before taxes on income 99.2 99.2 97.8 96.9 98.2 98.0 97.9 98.1 99.3 99.4Annual result before taxes on income 2.5 2.5 4.6 5.4 3.6 3.8 3.4 3.3 2.4 2.4Taxes on income 0.5 0.5 1.0 1.1 0.9 0.9 0.8 0.8 0.5 0.4Annual result 2.0 2.0 3.6 4.3 2.7 2.9 2.6 2.5 1.9 2.0Profit and loss transfers (parent company) 0.4 0.2 0.0 0.0 0.0 0.0 0.0 0.0 0.5 0.2Profit and loss transfers (subsidiary) 0.8 0.7 0.1 0.1 0.2 0.2 0.5 0.5 0.9 0.7Profit for the year 1.5 1.5 3.5 4.2 2.6 2.7 2.1 2.0 1.4 1.4
Balance sheetAssets Percentage of the balance sheet totalIntangible fixed assets 1.0 1.3 0.6 0.6 0.6 0.6 0.7 0.7 1.1 1.3Tangible fixed assets 14.1 14.4 21.6 20.4 18.8 18.9 16.3 16.6 13.7 14.0
of which: Land and buildings 7.4 7.6 9.0 8.2 8.2 8.1 7.5 7.6 7.3 7.6Inventories 22.8 22.9 30.3 31.8 36.3 36.7 34.3 34.8 21.0 21.1
of which: Finished goods and merchandise 20.2 20.4 26.4 26.7 31.9 31.9 31.3 31.8 18.5 18.7Cash 6.7 6.7 14.6 15.1 12.3 12.2 9.6 9.6 6.2 6.2Receivables 39.2 39.3 29.4 29.0 28.5 28.0 34.4 33.7 40.2 40.3
Short-term 37.6 37.3 28.6 28.3 27.6 27.1 33.3 32.5 38.4 38.2 of which:
Trade receivables 14.1 13.4 15.0 14.6 16.1 15.6 17.4 16.5 13.7 13.0Receivables from affiliated companies 19.0 19.6 7.1 7.0 6.0 6.2 10.4 10.6 20.4 21.1
Long-term 1.7 2.0 0.8 0.7 0.9 0.9 1.1 1.2 1.8 2.1of which: Loans to affiliated companies 1.3 1.6 0.4 0.3 0.4 0.4 0.7 0.8 1.4 1.7
Securities 2.1 1.4 0.5 0.5 0.5 0.5 0.8 0.8 2.3 1.5Other long-term equity investments 13.6 13.5 2.2 1.9 2.5 2.6 3.5 3.5 15.1 15.0
of which: Goodwill 0.4 0.4 0.9 0.7 0.6 0.6 0.4 0.5 0.4 0.3
CapitalEquity 32.7 33.1 27.5 30.1 35.0 35.7 35.0 35.6 32.4 32.7Liabilities 55.9 55.6 65.1 62.6 58.3 57.7 56.2 55.8 55.8 55.5
Short-term 48.2 47.5 47.5 46.3 45.7 45.3 48.1 48.0 48.3 47.5of which:Liabilities to banks 6.4 6.5 11.7 10.9 12.9 13.0 12.6 13.3 5.5 5.5Trade payables 13.9 13.7 15.6 14.9 14.2 13.5 13.9 13.0 13.9 13.8Liabilities to affiliated companies 21.7 20.5 8.2 7.7 9.9 10.0 15.1 15.1 22.9 21.5
Long-term 7.7 8.1 17.6 16.3 12.6 12.4 8.0 7.7 7.5 8.0 of which:
Liabilities to banks 4.6 4.7 10.8 9.9 8.5 8.4 5.3 5.3 4.3 4.5Liabilities to affiliated companies 1.9 2.1 4.1 3.8 2.6 2.5 2.0 1.8 1.8 2.1
Provisions 10.7 10.6 7.0 6.9 6.5 6.3 8.1 8.0 11.1 11.0of which: Provisions for pensions 2.7 2.8 1.8 1.9 1.9 1.9 2.4 2.5 2.8 2.9
Other ratios Percentage of salesAnnual result before taxes on income 2.5 2.5 4.6 5.4 3.6 3.8 3.4 3.3 2.4 2.4Annual result and depreciation 2.9 3.0 5.7 6.3 4.3 4.4 3.9 3.8 2.7 2.8Trade receivables 5.4 5.2 7.2 7.0 7.0 6.9 7.2 6.8 5.2 4.9
Percentage of the balance sheet totalSales 260.1 259.7 207.9 208.2 228.8 226.1 241.9 240.7 263.3 263.1Annual result and interest paid 6.0 6.1 9.1 10.5 7.4 7.7 7.3 7.0 5.8 5.9
Percentage of liabilities and provisions less cashAnnual result and depreciation 12.4 12.8 20.4 24.0 18.5 19.1 16.9 16.5 11.7 12.2
Percentage of fixed assetsLong-term equity and liabilities 136.1 137.1 183.6 201.3 213.1 213.9 207.1 205.1 128.9 130.0
Percentage of short-term liabilitiesCash resources and short-term receivables 93.1 93.5 91.4 94.1 87.7 87.2 90.0 88.5 93.6 94.3Cash resources, short-term receivables and inventories 140.4 141.8 155.2 162.8 167.1 168.1 161.3 161.0 137.1 138.8
Percentage of cost of materialsTrade payables 6.6 6.5 12.9 12.4 9.0 8.7 7.7 7.3 6.4 6.4
Memo item:Balance sheet total in € billion 409.69 425.49 1.18 1.29 9.99 10.54 42.42 44.01 356.10 369.65Sales in € billion 1 065.47 1 104.82 2.45 2.68 22.87 23.84 102.62 105.93 937.54 972.38Number of enterprises 14 381 14 381 2 680 2 680 4 405 4 405 4 372 4 372 2 924 2 924

Deutsche BundesbankFinancial statement statistics (ratios - provisional data)
May 202189
I. Enterprises by economic sector
cont'd: 8. Wholesale and retail trade; repair of motor vehicles and motorcycles
cont'd: All legal formsEnterprises with sales of ... € million
Total Less than 2 2 but less than 10 10 but less than 50 50 and moreQuartile Cylindered sample 2018/2019value 2018 2019 2018 2019 2018 2019 2018 2019 2018 2019Of the enterprises captured …
Ratios ... % had a ratio of less than …Percentage of gross revenue
Cost of materials 25 59.2 59.3 41.1 40.1 57.9 57.7 67.3 67.0 72.4 72.2 50 73.8 73.8 57.7 57.7 71.2 71.3 76.6 76.6 81.4 81.4 75 83.0 82.9 71.3 71.2 80.0 79.9 84.2 84.0 90.3 90.2
Personnel expenses 25 6.2 6.3 9.1 9.4 8.4 8.3 6.2 6.4 3.0 3.1 50 11.5 11.7 18.1 18.4 13.6 13.8 10.2 10.3 7.5 7.6 75 18.6 18.8 29.3 28.9 20.7 20.9 15.2 15.5 12.5 12.6
Depreciation 25 0.4 0.4 0.4 0.4 0.4 0.4 0.4 0.4 0.2 0.2 50 0.9 0.9 1.2 1.2 1.0 1.0 0.8 0.8 0.7 0.7 75 1.7 1.7 2.6 2.6 1.9 1.8 1.5 1.5 1.3 1.3
Annual result 25 0.5 0.5 0.2 0.7 0.6 0.7 0.6 0.5 0.4 0.3 50 1.9 1.9 2.8 3.3 2.1 2.2 1.9 1.7 1.4 1.3 75 4.4 4.3 7.6 7.8 4.6 4.6 3.8 3.6 3.1 2.9
Percentage of the balance sheet totalTangible fixed assets 25 2.5 2.4 1.8 1.6 2.9 2.8 2.7 2.8 1.8 1.9
50 9.3 9.0 8.4 8.3 9.6 9.2 9.6 9.4 9.4 9.2 75 23.9 23.9 25.3 24.4 24.1 24.3 22.9 22.8 24.2 24.3
Inventories 25 13.2 13.1 5.7 5.4 14.8 14.8 18.2 18.0 12.4 12.4 50 32.2 32.2 24.4 24.5 34.0 34.1 35.8 36.2 28.9 28.4 75 51.4 51.9 49.6 51.0 54.7 55.1 52.2 52.6 46.2 46.5
Equity 25 10.5 12.2 1.4 5.8 10.9 12.4 13.4 14.1 12.3 13.6 50 28.2 29.5 23.4 25.6 28.6 29.9 30.2 31.3 27.7 28.5 75 49.9 51.6 51.2 54.3 51.8 53.8 50.3 51.9 45.0 46.3
Short-term liabilities 25 27.3 25.9 21.4 20.3 25.6 23.4 29.0 28.3 32.9 32.2 50 49.5 48.2 46.5 43.7 46.6 45.4 50.9 49.8 52.7 52.0 75 72.2 70.7 75.4 70.8 70.7 69.4 72.0 71.7 72.0 71.0
Liabilities to banks 25 0.0 0.0 0.0 0.0 0.0 0.0 0.0 0.0 0.0 0.0 50 7.5 7.5 7.4 7.3 11.2 10.6 8.4 8.5 1.4 1.3 75 32.0 31.7 34.2 33.0 35.2 34.7 32.4 32.6 24.4 24.0
Percentage of salesAnnual result before taxes on income 25 0.7 0.7 0.3 0.9 0.8 0.9 0.9 0.8 0.5 0.5
50 2.5 2.5 3.4 4.1 2.7 2.8 2.4 2.3 1.8 1.7 75 5.5 5.5 8.8 9.3 5.8 5.8 4.9 4.6 4.0 3.6
Annual result and depreciation 25 1.6 1.7 1.6 2.3 1.9 2.0 1.8 1.7 1.2 1.2 50 3.7 3.7 5.2 5.9 4.2 4.2 3.6 3.4 2.7 2.6 75 7.2 7.1 11.2 11.7 7.5 7.6 6.3 6.1 5.1 4.8
Trade receivables 25 2.4 2.3 1.2 1.2 2.4 2.4 3.2 2.9 2.4 2.4 50 5.4 5.1 4.5 4.3 5.4 5.2 5.7 5.3 5.6 5.2 75 9.3 9.0 9.2 9.0 9.2 8.9 9.4 8.9 9.4 9.1
Percentage of the balance sheet totalAnnual result and interest paid 25 2.7 2.8 2.1 3.0 3.0 3.1 3.0 2.8 2.2 2.1
50 6.5 6.5 8.1 9.5 6.8 7.1 6.4 6.0 5.3 5.0 75 13.0 13.2 20.4 22.6 13.4 13.9 11.9 11.4 10.1 9.7
Percentage of liabilities and provisions less cashAnnual result and depreciation 25 4.6 4.9 - 2.9 2.0 4.4 4.7 6.2 5.7 5.3 5.2
50 14.4 14.7 13.3 16.0 14.8 15.3 15.6 15.2 13.0 12.6 75 34.4 35.3 41.0 49.2 38.0 38.4 34.0 32.7 27.3 27.4
Percentage of fixed assetsLong-term equity and liabilities 25 107.1 110.3 84.9 100.0 116.6 120.4 113.3 113.4 104.1 103.1
50 235.1 243.9 222.7 259.1 265.2 279.8 242.2 246.4 196.2 200.4 75 700.0 731.6 762.5 843.8 764.7 812.9 687.3 688.2 552.5 575.1
Percentage of short-term liabilitiesCash resources and short-term receivables 25 46.1 46.2 40.7 44.7 43.9 43.3 47.8 46.3 51.5 51.0
50 87.5 89.6 92.2 100.0 85.8 88.6 84.3 84.2 89.8 92.3 75 167.4 175.0 210.8 228.9 178.7 185.8 154.9 160.1 144.9 151.6
Percentage of cost of materialsTrade payables 25 2.5 2.3 3.3 2.9 2.9 2.7 2.4 2.1 1.8 1.6
50 6.1 5.7 8.3 7.6 7.0 6.4 5.5 5.1 4.8 4.6 75 11.9 11.3 18.6 16.5 12.8 12.0 10.8 10.3 8.7 8.3
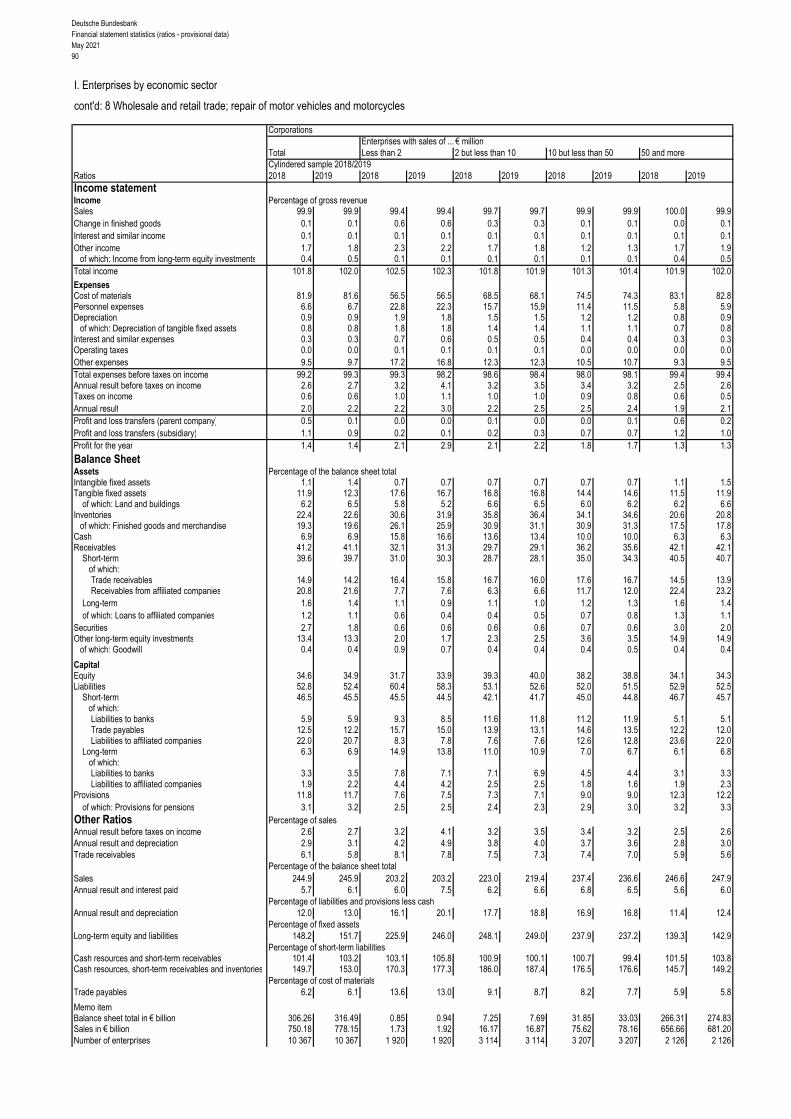
Deutsche BundesbankFinancial statement statistics (ratios - provisional data)May 202190
I. Enterprises by economic sector
cont'd: 8 Wholesale and retail trade; repair of motor vehicles and motorcycles
CorporationsEnterprises with sales of ... € million
Total Less than 2 2 but less than 10 10 but less than 50 50 and moreCylindered sample 2018/2019
Ratios 2018 2019 2018 2019 2018 2019 2018 2019 2018 2019Income statementIncome Percentage of gross revenueSales 99.9 99.9 99.4 99.4 99.7 99.7 99.9 99.9 100.0 99.9Change in finished goods 0.1 0.1 0.6 0.6 0.3 0.3 0.1 0.1 0.0 0.1Interest and similar income 0.1 0.1 0.1 0.1 0.1 0.1 0.1 0.1 0.1 0.1Other income 1.7 1.8 2.3 2.2 1.7 1.8 1.2 1.3 1.7 1.9
of which: Income from long-term equity investments 0.4 0.5 0.1 0.1 0.1 0.1 0.1 0.1 0.4 0.5Total income 101.8 102.0 102.5 102.3 101.8 101.9 101.3 101.4 101.9 102.0
ExpensesCost of materials 81.9 81.6 56.5 56.5 68.5 68.1 74.5 74.3 83.1 82.8Personnel expenses 6.6 6.7 22.8 22.3 15.7 15.9 11.4 11.5 5.8 5.9Depreciation 0.9 0.9 1.9 1.8 1.5 1.5 1.2 1.2 0.8 0.9
of which: Depreciation of tangible fixed assets 0.8 0.8 1.8 1.8 1.4 1.4 1.1 1.1 0.7 0.8Interest and similar expenses 0.3 0.3 0.7 0.6 0.5 0.5 0.4 0.4 0.3 0.3Operating taxes 0.0 0.0 0.1 0.1 0.1 0.1 0.0 0.0 0.0 0.0Other expenses 9.5 9.7 17.2 16.8 12.3 12.3 10.5 10.7 9.3 9.5Total expenses before taxes on income 99.2 99.3 99.3 98.2 98.6 98.4 98.0 98.1 99.4 99.4Annual result before taxes on income 2.6 2.7 3.2 4.1 3.2 3.5 3.4 3.2 2.5 2.6Taxes on income 0.6 0.6 1.0 1.1 1.0 1.0 0.9 0.8 0.6 0.5Annual result 2.0 2.2 2.2 3.0 2.2 2.5 2.5 2.4 1.9 2.1Profit and loss transfers (parent company) 0.5 0.1 0.0 0.0 0.1 0.0 0.0 0.1 0.6 0.2Profit and loss transfers (subsidiary) 1.1 0.9 0.2 0.1 0.2 0.3 0.7 0.7 1.2 1.0Profit for the year 1.4 1.4 2.1 2.9 2.1 2.2 1.8 1.7 1.3 1.3
Balance SheetAssets Percentage of the balance sheet totalIntangible fixed assets 1.1 1.4 0.7 0.7 0.7 0.7 0.7 0.7 1.1 1.5Tangible fixed assets 11.9 12.3 17.6 16.7 16.8 16.8 14.4 14.6 11.5 11.9
of which: Land and buildings 6.2 6.5 5.8 5.2 6.6 6.5 6.0 6.2 6.2 6.6Inventories 22.4 22.6 30.6 31.9 35.8 36.4 34.1 34.6 20.6 20.8
of which: Finished goods and merchandise 19.3 19.6 26.1 25.9 30.9 31.1 30.9 31.3 17.5 17.8Cash 6.9 6.9 15.8 16.6 13.6 13.4 10.0 10.0 6.3 6.3Receivables 41.2 41.1 32.1 31.3 29.7 29.1 36.2 35.6 42.1 42.1
Short-term 39.6 39.7 31.0 30.3 28.7 28.1 35.0 34.3 40.5 40.7 of which:
Trade receivables 14.9 14.2 16.4 15.8 16.7 16.0 17.6 16.7 14.5 13.9Receivables from affiliated companies 20.8 21.6 7.7 7.6 6.3 6.6 11.7 12.0 22.4 23.2
Long-term 1.6 1.4 1.1 0.9 1.1 1.0 1.2 1.3 1.6 1.4of which: Loans to affiliated companies 1.2 1.1 0.6 0.4 0.4 0.5 0.7 0.8 1.3 1.1
Securities 2.7 1.8 0.6 0.6 0.6 0.6 0.7 0.6 3.0 2.0Other long-term equity investments 13.4 13.3 2.0 1.7 2.3 2.5 3.6 3.5 14.9 14.9
of which: Goodwill 0.4 0.4 0.9 0.7 0.4 0.4 0.4 0.5 0.4 0.4
CapitalEquity 34.6 34.9 31.7 33.9 39.3 40.0 38.2 38.8 34.1 34.3Liabilities 52.8 52.4 60.4 58.3 53.1 52.6 52.0 51.5 52.9 52.5
Short-term 46.5 45.5 45.5 44.5 42.1 41.7 45.0 44.8 46.7 45.7of which:Liabilities to banks 5.9 5.9 9.3 8.5 11.6 11.8 11.2 11.9 5.1 5.1Trade payables 12.5 12.2 15.7 15.0 13.9 13.1 14.6 13.5 12.2 12.0Liabilities to affiliated companies 22.0 20.7 8.3 7.8 7.6 7.6 12.6 12.8 23.6 22.0
Long-term 6.3 6.9 14.9 13.8 11.0 10.9 7.0 6.7 6.1 6.8 of which:
Liabilities to banks 3.3 3.5 7.8 7.1 7.1 6.9 4.5 4.4 3.1 3.3Liabilities to affiliated companies 1.9 2.2 4.4 4.2 2.5 2.5 1.8 1.6 1.9 2.3
Provisions 11.8 11.7 7.6 7.5 7.3 7.1 9.0 9.0 12.3 12.2of which: Provisions for pensions 3.1 3.2 2.5 2.5 2.4 2.3 2.9 3.0 3.2 3.3
Other Ratios Percentage of salesAnnual result before taxes on income 2.6 2.7 3.2 4.1 3.2 3.5 3.4 3.2 2.5 2.6Annual result and depreciation 2.9 3.1 4.2 4.9 3.8 4.0 3.7 3.6 2.8 3.0Trade receivables 6.1 5.8 8.1 7.8 7.5 7.3 7.4 7.0 5.9 5.6
Percentage of the balance sheet totalSales 244.9 245.9 203.2 203.2 223.0 219.4 237.4 236.6 246.6 247.9Annual result and interest paid 5.7 6.1 6.0 7.5 6.2 6.6 6.8 6.5 5.6 6.0
Percentage of liabilities and provisions less cashAnnual result and depreciation 12.0 13.0 16.1 20.1 17.7 18.8 16.9 16.8 11.4 12.4
Percentage of fixed assetsLong-term equity and liabilities 148.2 151.7 225.9 246.0 248.1 249.0 237.9 237.2 139.3 142.9
Percentage of short-term liabilitiesCash resources and short-term receivables 101.4 103.2 103.1 105.8 100.9 100.1 100.7 99.4 101.5 103.8Cash resources, short-term receivables and inventories 149.7 153.0 170.3 177.3 186.0 187.4 176.5 176.6 145.7 149.2
Percentage of cost of materialsTrade payables 6.2 6.1 13.6 13.0 9.1 8.7 8.2 7.7 5.9 5.8
Memo itemBalance sheet total in € billion 306.26 316.49 0.85 0.94 7.25 7.69 31.85 33.03 266.31 274.83Sales in € billion 750.18 778.15 1.73 1.92 16.17 16.87 75.62 78.16 656.66 681.20Number of enterprises 10 367 10 367 1 920 1 920 3 114 3 114 3 207 3 207 2 126 2 126

Deutsche BundesbankFinancial statement statistics (ratios - provisional data)
May 202191
I. Enterprises by economic sector
cont'd: 8 Wholesale and retail trade; repair of motor vehicles and motorcycles
cont'd: CorporationsEnterprises with sales of ... € million
Total Less than 2 2 but less than 10 10 but less than 50 50 and moreQuartile Cylindered sample 2018/2019value 2018 2019 2018 2019 2018 2019 2018 2019 2018 2019Of the enterprises captured …
Ratios ... % had a ratio of less than …Percentage of gross revenue
Cost of materials 25 58.8 58.8 40.0 39.5 56.7 56.3 67.0 66.5 72.6 72.3 50 73.9 73.8 57.1 57.2 70.7 70.7 76.9 76.8 82.8 82.6 75 83.6 83.6 70.6 70.4 80.4 80.3 84.7 84.4 90.9 90.8
Personnel expenses 25 6.2 6.3 10.8 10.9 8.7 8.5 6.1 6.3 2.7 2.9 50 11.6 11.9 20.4 20.6 14.1 14.5 10.0 10.0 6.8 6.9 75 19.3 19.7 32.2 31.5 21.8 22.2 15.1 15.4 12.2 12.3
Depreciation 25 0.3 0.3 0.4 0.4 0.4 0.4 0.3 0.3 0.2 0.2 50 0.8 0.8 1.1 1.1 0.9 0.9 0.7 0.7 0.6 0.6 75 1.6 1.6 2.5 2.4 1.8 1.7 1.4 1.4 1.3 1.3
Annual result 25 0.3 0.4 - 0.1 0.4 0.4 0.5 0.5 0.5 0.3 0.3 50 1.6 1.6 1.7 2.3 1.6 1.6 1.7 1.6 1.3 1.2 75 3.7 3.8 5.2 5.6 3.8 3.8 3.6 3.5 2.9 2.7
Percentage of the balance sheet totalTangible fixed assets 25 1.9 1.9 1.2 1.3 2.4 2.3 2.2 2.3 1.3 1.3
50 7.6 7.5 7.0 7.0 7.8 7.6 7.7 7.8 7.5 7.2 75 20.4 20.1 20.5 19.9 20.8 21.0 19.9 19.0 20.5 20.4
Inventories 25 12.1 11.9 3.9 4.2 13.8 14.1 18.0 17.4 10.6 10.3 50 32.1 31.9 22.9 23.1 33.9 34.4 36.1 36.7 28.1 27.8 75 51.5 52.0 50.0 51.1 54.6 54.8 52.6 53.1 46.2 46.5
Equity 25 13.5 15.3 4.2 8.8 14.8 16.8 15.8 17.0 14.3 15.0 50 32.2 33.5 26.9 29.9 33.5 35.4 33.9 34.9 30.5 30.8 75 54.3 55.8 54.9 56.8 56.6 58.4 55.0 56.3 49.0 50.2
Short-term liabilities 25 24.2 23.0 20.3 19.3 22.1 20.3 25.4 24.8 28.1 28.1 50 45.3 44.2 44.7 41.1 42.5 41.0 46.5 45.9 48.2 47.5 75 69.0 67.6 73.0 68.3 66.6 65.3 69.6 69.1 68.8 68.2
Liabilities to banks 25 0.0 0.0 0.0 0.0 0.0 0.0 0.0 0.0 0.0 0.0 50 3.9 4.1 2.8 3.1 7.6 7.3 4.6 4.7 0.1 0.1 75 27.2 26.7 25.7 24.3 29.7 28.8 28.3 28.4 21.7 20.8
Percentage of salesAnnual result before taxes on income 25 0.5 0.6 - 0.1 0.4 0.5 0.6 0.8 0.7 0.5 0.5
50 2.1 2.2 2.2 2.9 2.3 2.3 2.3 2.2 1.8 1.6 75 4.9 5.0 6.6 7.1 5.1 5.2 4.9 4.6 3.9 3.6
Annual result and Depreciation 25 1.4 1.5 0.9 1.7 1.5 1.7 1.6 1.5 1.1 1.1 50 3.3 3.4 3.9 4.8 3.5 3.7 3.4 3.3 2.6 2.5 75 6.5 6.5 8.7 9.4 6.9 6.8 6.2 5.9 4.9 4.7
Trade receivables 25 2.7 2.6 1.7 1.7 2.6 2.5 3.1 2.9 2.7 2.7 50 5.7 5.3 5.1 4.9 5.7 5.3 5.7 5.3 5.9 5.6 75 10.0 9.7 10.3 10.3 10.1 9.6 9.7 9.4 10.2 10.0
Percentage of the balance sheet totalAnnual result and interest paid 25 2.2 2.4 0.9 2.1 2.5 2.7 2.7 2.5 1.9 2.0
50 5.5 5.5 5.8 7.0 5.5 5.7 5.8 5.5 4.8 4.5 75 10.9 11.1 13.4 15.3 10.6 10.9 11.1 10.6 9.5 9.2
Percentage of liabilities and provisions less cashAnnual result and Depreciation 25 3.2 3.6 - 7.9 - 1.5 2.3 3.0 5.4 4.9 4.6 4.6
50 12.7 13.2 8.7 11.5 12.4 13.0 15.1 14.8 12.3 12.1 75 31.9 33.1 29.9 35.7 34.9 36.7 35.2 33.6 27.2 27.6
Percentage of fixed assetsLong-term equity and liabilities 25 128.4 134.0 103.5 122.8 145.9 150.7 133.8 135.0 123.3 122.3
50 286.3 300.0 275.4 315.3 323.4 352.7 294.4 295.8 238.1 234.2 75 853.8 890.4 910.1 1 027.0 947.5 1 018.4 815.6 812.8 727.4 742.1
Percentage of short-term liabilitiesCash resources and short-term receivables 25 53.0 52.8 47.1 53.0 50.2 50.4 53.5 51.9 58.1 56.3
50 100.0 102.5 105.0 111.3 101.1 103.4 94.7 96.1 101.8 102.5 75 196.1 208.0 248.9 266.7 213.5 227.6 179.5 186.5 173.0 177.0
Percentage of cost of materialsTrade payables 25 2.3 2.1 3.2 2.9 2.7 2.6 2.3 2.1 1.5 1.4
50 6.1 5.6 8.4 7.7 6.8 6.2 5.6 5.2 4.3 4.1 75 12.3 11.6 19.9 17.1 12.9 12.2 11.5 11.0 8.6 8.0
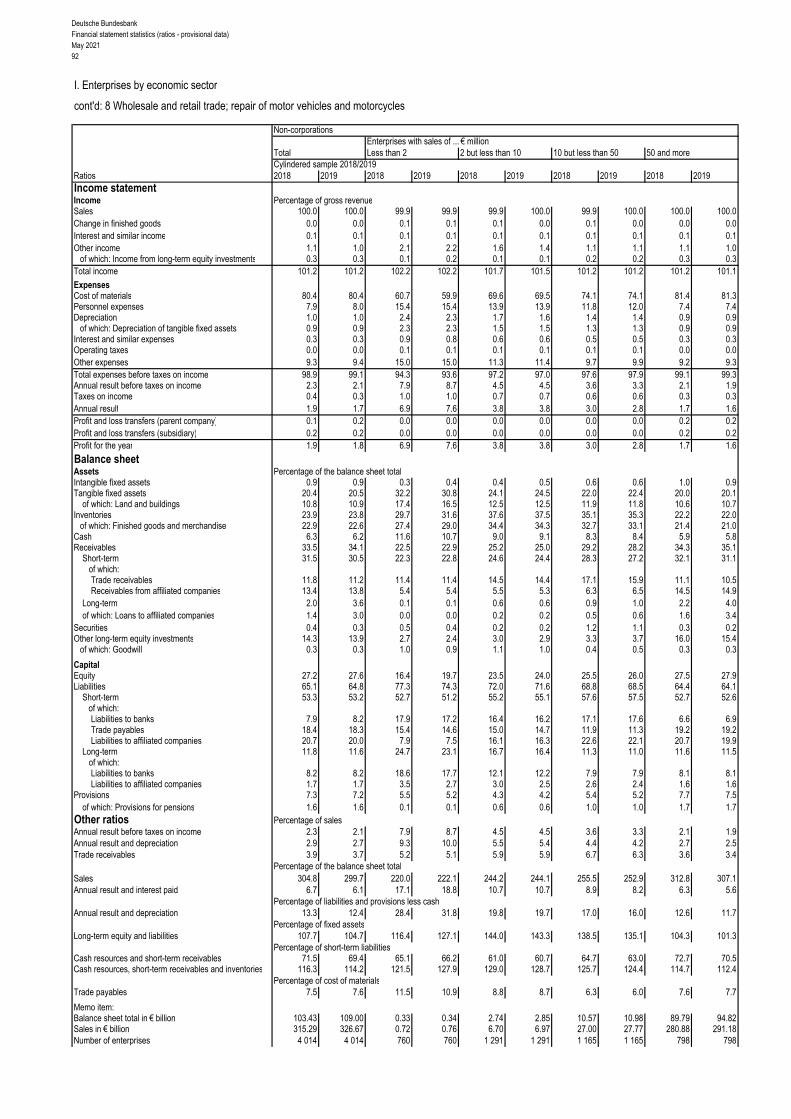
Deutsche BundesbankFinancial statement statistics (ratios - provisional data)May 202192
I. Enterprises by economic sector
cont'd: 8 Wholesale and retail trade; repair of motor vehicles and motorcycles
Non-corporationsEnterprises with sales of ... € million
Total Less than 2 2 but less than 10 10 but less than 50 50 and moreCylindered sample 2018/2019
Ratios 2018 2019 2018 2019 2018 2019 2018 2019 2018 2019Income statementIncome Percentage of gross revenueSales 100.0 100.0 99.9 99.9 99.9 100.0 99.9 100.0 100.0 100.0Change in finished goods 0.0 0.0 0.1 0.1 0.1 0.0 0.1 0.0 0.0 0.0Interest and similar income 0.1 0.1 0.1 0.1 0.1 0.1 0.1 0.1 0.1 0.1Other income 1.1 1.0 2.1 2.2 1.6 1.4 1.1 1.1 1.1 1.0
of which: Income from long-term equity investments 0.3 0.3 0.1 0.2 0.1 0.1 0.2 0.2 0.3 0.3Total income 101.2 101.2 102.2 102.2 101.7 101.5 101.2 101.2 101.2 101.1
ExpensesCost of materials 80.4 80.4 60.7 59.9 69.6 69.5 74.1 74.1 81.4 81.3Personnel expenses 7.9 8.0 15.4 15.4 13.9 13.9 11.8 12.0 7.4 7.4Depreciation 1.0 1.0 2.4 2.3 1.7 1.6 1.4 1.4 0.9 0.9
of which: Depreciation of tangible fixed assets 0.9 0.9 2.3 2.3 1.5 1.5 1.3 1.3 0.9 0.9Interest and similar expenses 0.3 0.3 0.9 0.8 0.6 0.6 0.5 0.5 0.3 0.3Operating taxes 0.0 0.0 0.1 0.1 0.1 0.1 0.1 0.1 0.0 0.0Other expenses 9.3 9.4 15.0 15.0 11.3 11.4 9.7 9.9 9.2 9.3Total expenses before taxes on income 98.9 99.1 94.3 93.6 97.2 97.0 97.6 97.9 99.1 99.3Annual result before taxes on income 2.3 2.1 7.9 8.7 4.5 4.5 3.6 3.3 2.1 1.9Taxes on income 0.4 0.3 1.0 1.0 0.7 0.7 0.6 0.6 0.3 0.3Annual result 1.9 1.7 6.9 7.6 3.8 3.8 3.0 2.8 1.7 1.6Profit and loss transfers (parent company) 0.1 0.2 0.0 0.0 0.0 0.0 0.0 0.0 0.2 0.2Profit and loss transfers (subsidiary) 0.2 0.2 0.0 0.0 0.0 0.0 0.0 0.0 0.2 0.2Profit for the year 1.9 1.8 6.9 7.6 3.8 3.8 3.0 2.8 1.7 1.6
Balance sheetAssets Percentage of the balance sheet totalIntangible fixed assets 0.9 0.9 0.3 0.4 0.4 0.5 0.6 0.6 1.0 0.9Tangible fixed assets 20.4 20.5 32.2 30.8 24.1 24.5 22.0 22.4 20.0 20.1
of which: Land and buildings 10.8 10.9 17.4 16.5 12.5 12.5 11.9 11.8 10.6 10.7Inventories 23.9 23.8 29.7 31.6 37.6 37.5 35.1 35.3 22.2 22.0
of which: Finished goods and merchandise 22.9 22.6 27.4 29.0 34.4 34.3 32.7 33.1 21.4 21.0Cash 6.3 6.2 11.6 10.7 9.0 9.1 8.3 8.4 5.9 5.8Receivables 33.5 34.1 22.5 22.9 25.2 25.0 29.2 28.2 34.3 35.1
Short-term 31.5 30.5 22.3 22.8 24.6 24.4 28.3 27.2 32.1 31.1 of which:
Trade receivables 11.8 11.2 11.4 11.4 14.5 14.4 17.1 15.9 11.1 10.5Receivables from affiliated companies 13.4 13.8 5.4 5.4 5.5 5.3 6.3 6.5 14.5 14.9
Long-term 2.0 3.6 0.1 0.1 0.6 0.6 0.9 1.0 2.2 4.0of which: Loans to affiliated companies 1.4 3.0 0.0 0.0 0.2 0.2 0.5 0.6 1.6 3.4
Securities 0.4 0.3 0.5 0.4 0.2 0.2 1.2 1.1 0.3 0.2Other long-term equity investments 14.3 13.9 2.7 2.4 3.0 2.9 3.3 3.7 16.0 15.4
of which: Goodwill 0.3 0.3 1.0 0.9 1.1 1.0 0.4 0.5 0.3 0.3
CapitalEquity 27.2 27.6 16.4 19.7 23.5 24.0 25.5 26.0 27.5 27.9Liabilities 65.1 64.8 77.3 74.3 72.0 71.6 68.8 68.5 64.4 64.1
Short-term 53.3 53.2 52.7 51.2 55.2 55.1 57.6 57.5 52.7 52.6of which:Liabilities to banks 7.9 8.2 17.9 17.2 16.4 16.2 17.1 17.6 6.6 6.9Trade payables 18.4 18.3 15.4 14.6 15.0 14.7 11.9 11.3 19.2 19.2Liabilities to affiliated companies 20.7 20.0 7.9 7.5 16.1 16.3 22.6 22.1 20.7 19.9
Long-term 11.8 11.6 24.7 23.1 16.7 16.4 11.3 11.0 11.6 11.5 of which:
Liabilities to banks 8.2 8.2 18.6 17.7 12.1 12.2 7.9 7.9 8.1 8.1Liabilities to affiliated companies 1.7 1.7 3.5 2.7 3.0 2.5 2.6 2.4 1.6 1.6
Provisions 7.3 7.2 5.5 5.2 4.3 4.2 5.4 5.2 7.7 7.5of which: Provisions for pensions 1.6 1.6 0.1 0.1 0.6 0.6 1.0 1.0 1.7 1.7
Other ratios Percentage of salesAnnual result before taxes on income 2.3 2.1 7.9 8.7 4.5 4.5 3.6 3.3 2.1 1.9Annual result and depreciation 2.9 2.7 9.3 10.0 5.5 5.4 4.4 4.2 2.7 2.5Trade receivables 3.9 3.7 5.2 5.1 5.9 5.9 6.7 6.3 3.6 3.4
Percentage of the balance sheet totalSales 304.8 299.7 220.0 222.1 244.2 244.1 255.5 252.9 312.8 307.1Annual result and interest paid 6.7 6.1 17.1 18.8 10.7 10.7 8.9 8.2 6.3 5.6
Percentage of liabilities and provisions less cashAnnual result and depreciation 13.3 12.4 28.4 31.8 19.8 19.7 17.0 16.0 12.6 11.7
Percentage of fixed assetsLong-term equity and liabilities 107.7 104.7 116.4 127.1 144.0 143.3 138.5 135.1 104.3 101.3
Percentage of short-term liabilitiesCash resources and short-term receivables 71.5 69.4 65.1 66.2 61.0 60.7 64.7 63.0 72.7 70.5Cash resources, short-term receivables and inventories 116.3 114.2 121.5 127.9 129.0 128.7 125.7 124.4 114.7 112.4
Percentage of cost of materialsTrade payables 7.5 7.6 11.5 10.9 8.8 8.7 6.3 6.0 7.6 7.7
Memo item:Balance sheet total in € billion 103.43 109.00 0.33 0.34 2.74 2.85 10.57 10.98 89.79 94.82Sales in € billion 315.29 326.67 0.72 0.76 6.70 6.97 27.00 27.77 280.88 291.18Number of enterprises 4 014 4 014 760 760 1 291 1 291 1 165 1 165 798 798
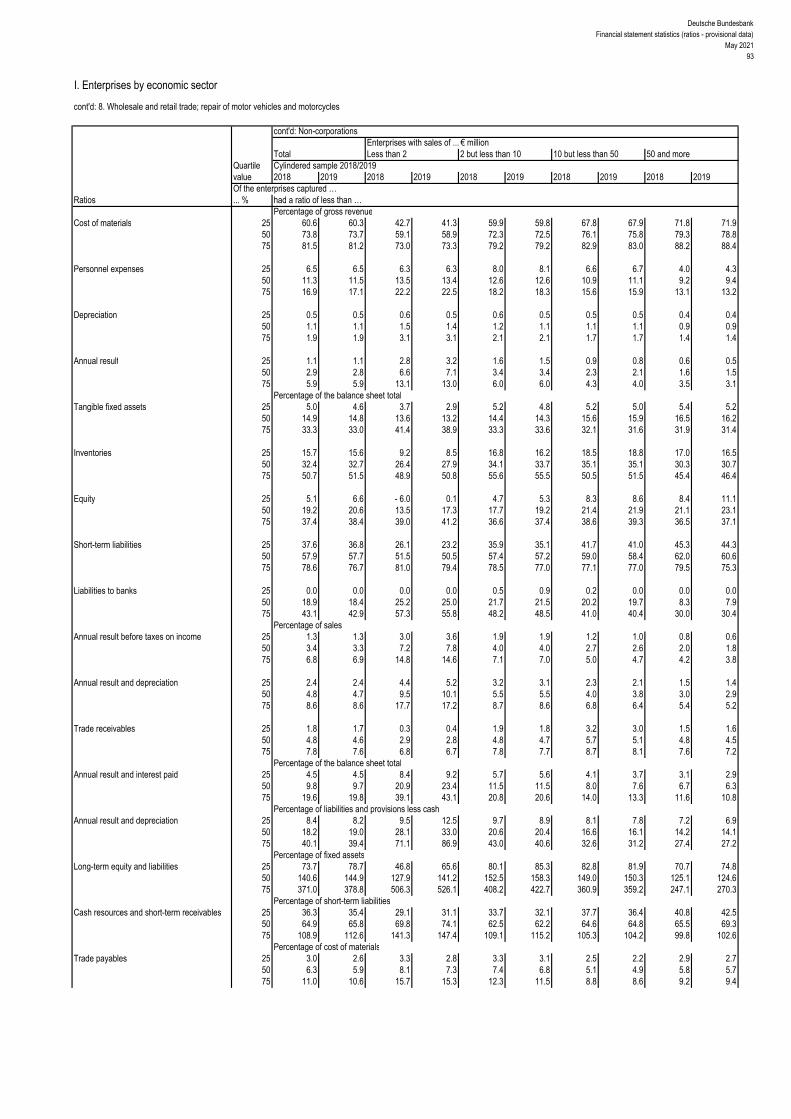
Deutsche BundesbankFinancial statement statistics (ratios - provisional data)
May 202193
I. Enterprises by economic sector
cont'd: 8. Wholesale and retail trade; repair of motor vehicles and motorcycles
cont'd: Non-corporationsEnterprises with sales of ... € million
Total Less than 2 2 but less than 10 10 but less than 50 50 and moreQuartile Cylindered sample 2018/2019value 2018 2019 2018 2019 2018 2019 2018 2019 2018 2019Of the enterprises captured …
Ratios ... % had a ratio of less than …Percentage of gross revenue
Cost of materials 25 60.6 60.3 42.7 41.3 59.9 59.8 67.8 67.9 71.8 71.9 50 73.8 73.7 59.1 58.9 72.3 72.5 76.1 75.8 79.3 78.8 75 81.5 81.2 73.0 73.3 79.2 79.2 82.9 83.0 88.2 88.4
Personnel expenses 25 6.5 6.5 6.3 6.3 8.0 8.1 6.6 6.7 4.0 4.3 50 11.3 11.5 13.5 13.4 12.6 12.6 10.9 11.1 9.2 9.4 75 16.9 17.1 22.2 22.5 18.2 18.3 15.6 15.9 13.1 13.2
Depreciation 25 0.5 0.5 0.6 0.5 0.6 0.5 0.5 0.5 0.4 0.4 50 1.1 1.1 1.5 1.4 1.2 1.1 1.1 1.1 0.9 0.9 75 1.9 1.9 3.1 3.1 2.1 2.1 1.7 1.7 1.4 1.4
Annual result 25 1.1 1.1 2.8 3.2 1.6 1.5 0.9 0.8 0.6 0.5 50 2.9 2.8 6.6 7.1 3.4 3.4 2.3 2.1 1.6 1.5 75 5.9 5.9 13.1 13.0 6.0 6.0 4.3 4.0 3.5 3.1
Percentage of the balance sheet totalTangible fixed assets 25 5.0 4.6 3.7 2.9 5.2 4.8 5.2 5.0 5.4 5.2
50 14.9 14.8 13.6 13.2 14.4 14.3 15.6 15.9 16.5 16.2 75 33.3 33.0 41.4 38.9 33.3 33.6 32.1 31.6 31.9 31.4
Inventories 25 15.7 15.6 9.2 8.5 16.8 16.2 18.5 18.8 17.0 16.5 50 32.4 32.7 26.4 27.9 34.1 33.7 35.1 35.1 30.3 30.7 75 50.7 51.5 48.9 50.8 55.6 55.5 50.5 51.5 45.4 46.4
Equity 25 5.1 6.6 - 6.0 0.1 4.7 5.3 8.3 8.6 8.4 11.1 50 19.2 20.6 13.5 17.3 17.7 19.2 21.4 21.9 21.1 23.1 75 37.4 38.4 39.0 41.2 36.6 37.4 38.6 39.3 36.5 37.1
Short-term liabilities 25 37.6 36.8 26.1 23.2 35.9 35.1 41.7 41.0 45.3 44.3 50 57.9 57.7 51.5 50.5 57.4 57.2 59.0 58.4 62.0 60.6 75 78.6 76.7 81.0 79.4 78.5 77.0 77.1 77.0 79.5 75.3
Liabilities to banks 25 0.0 0.0 0.0 0.0 0.5 0.9 0.2 0.0 0.0 0.0 50 18.9 18.4 25.2 25.0 21.7 21.5 20.2 19.7 8.3 7.9 75 43.1 42.9 57.3 55.8 48.2 48.5 41.0 40.4 30.0 30.4
Percentage of salesAnnual result before taxes on income 25 1.3 1.3 3.0 3.6 1.9 1.9 1.2 1.0 0.8 0.6
50 3.4 3.3 7.2 7.8 4.0 4.0 2.7 2.6 2.0 1.8 75 6.8 6.9 14.8 14.6 7.1 7.0 5.0 4.7 4.2 3.8
Annual result and depreciation 25 2.4 2.4 4.4 5.2 3.2 3.1 2.3 2.1 1.5 1.4 50 4.8 4.7 9.5 10.1 5.5 5.5 4.0 3.8 3.0 2.9 75 8.6 8.6 17.7 17.2 8.7 8.6 6.8 6.4 5.4 5.2
Trade receivables 25 1.8 1.7 0.3 0.4 1.9 1.8 3.2 3.0 1.5 1.6 50 4.8 4.6 2.9 2.8 4.8 4.7 5.7 5.1 4.8 4.5 75 7.8 7.6 6.8 6.7 7.8 7.7 8.7 8.1 7.6 7.2
Percentage of the balance sheet totalAnnual result and interest paid 25 4.5 4.5 8.4 9.2 5.7 5.6 4.1 3.7 3.1 2.9
50 9.8 9.7 20.9 23.4 11.5 11.5 8.0 7.6 6.7 6.3 75 19.6 19.8 39.1 43.1 20.8 20.6 14.0 13.3 11.6 10.8
Percentage of liabilities and provisions less cashAnnual result and depreciation 25 8.4 8.2 9.5 12.5 9.7 8.9 8.1 7.8 7.2 6.9
50 18.2 19.0 28.1 33.0 20.6 20.4 16.6 16.1 14.2 14.1 75 40.1 39.4 71.1 86.9 43.0 40.6 32.6 31.2 27.4 27.2
Percentage of fixed assetsLong-term equity and liabilities 25 73.7 78.7 46.8 65.6 80.1 85.3 82.8 81.9 70.7 74.8
50 140.6 144.9 127.9 141.2 152.5 158.3 149.0 150.3 125.1 124.6 75 371.0 378.8 506.3 526.1 408.2 422.7 360.9 359.2 247.1 270.3
Percentage of short-term liabilitiesCash resources and short-term receivables 25 36.3 35.4 29.1 31.1 33.7 32.1 37.7 36.4 40.8 42.5
50 64.9 65.8 69.8 74.1 62.5 62.2 64.6 64.8 65.5 69.3 75 108.9 112.6 141.3 147.4 109.1 115.2 105.3 104.2 99.8 102.6
Percentage of cost of materialsTrade payables 25 3.0 2.6 3.3 2.8 3.3 3.1 2.5 2.2 2.9 2.7
50 6.3 5.9 8.1 7.3 7.4 6.8 5.1 4.9 5.8 5.7 75 11.0 10.6 15.7 15.3 12.3 11.5 8.8 8.6 9.2 9.4
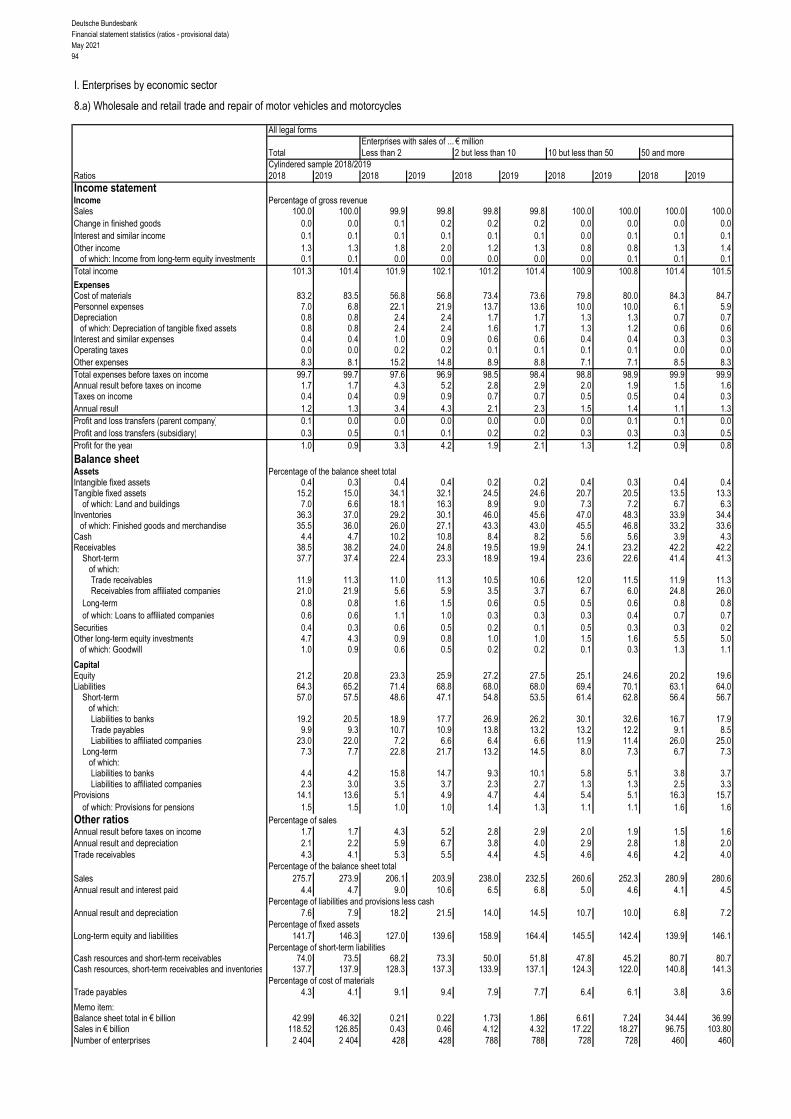
Deutsche BundesbankFinancial statement statistics (ratios - provisional data)May 202194
I. Enterprises by economic sector
8.a) Wholesale and retail trade and repair of motor vehicles and motorcycles
All legal formsEnterprises with sales of ... € million
Total Less than 2 2 but less than 10 10 but less than 50 50 and moreCylindered sample 2018/2019
Ratios 2018 2019 2018 2019 2018 2019 2018 2019 2018 2019Income statementIncome Percentage of gross revenueSales 100.0 100.0 99.9 99.8 99.8 99.8 100.0 100.0 100.0 100.0Change in finished goods 0.0 0.0 0.1 0.2 0.2 0.2 0.0 0.0 0.0 0.0Interest and similar income 0.1 0.1 0.1 0.1 0.1 0.1 0.0 0.1 0.1 0.1Other income 1.3 1.3 1.8 2.0 1.2 1.3 0.8 0.8 1.3 1.4
of which: Income from long-term equity investments 0.1 0.1 0.0 0.0 0.0 0.0 0.0 0.1 0.1 0.1Total income 101.3 101.4 101.9 102.1 101.2 101.4 100.9 100.8 101.4 101.5
ExpensesCost of materials 83.2 83.5 56.8 56.8 73.4 73.6 79.8 80.0 84.3 84.7Personnel expenses 7.0 6.8 22.1 21.9 13.7 13.6 10.0 10.0 6.1 5.9Depreciation 0.8 0.8 2.4 2.4 1.7 1.7 1.3 1.3 0.7 0.7
of which: Depreciation of tangible fixed assets 0.8 0.8 2.4 2.4 1.6 1.7 1.3 1.2 0.6 0.6Interest and similar expenses 0.4 0.4 1.0 0.9 0.6 0.6 0.4 0.4 0.3 0.3Operating taxes 0.0 0.0 0.2 0.2 0.1 0.1 0.1 0.1 0.0 0.0Other expenses 8.3 8.1 15.2 14.8 8.9 8.8 7.1 7.1 8.5 8.3Total expenses before taxes on income 99.7 99.7 97.6 96.9 98.5 98.4 98.8 98.9 99.9 99.9Annual result before taxes on income 1.7 1.7 4.3 5.2 2.8 2.9 2.0 1.9 1.5 1.6Taxes on income 0.4 0.4 0.9 0.9 0.7 0.7 0.5 0.5 0.4 0.3Annual result 1.2 1.3 3.4 4.3 2.1 2.3 1.5 1.4 1.1 1.3Profit and loss transfers (parent company) 0.1 0.0 0.0 0.0 0.0 0.0 0.0 0.1 0.1 0.0Profit and loss transfers (subsidiary) 0.3 0.5 0.1 0.1 0.2 0.2 0.3 0.3 0.3 0.5Profit for the year 1.0 0.9 3.3 4.2 1.9 2.1 1.3 1.2 0.9 0.8
Balance sheetAssets Percentage of the balance sheet totalIntangible fixed assets 0.4 0.3 0.4 0.4 0.2 0.2 0.4 0.3 0.4 0.4Tangible fixed assets 15.2 15.0 34.1 32.1 24.5 24.6 20.7 20.5 13.5 13.3
of which: Land and buildings 7.0 6.6 18.1 16.3 8.9 9.0 7.3 7.2 6.7 6.3Inventories 36.3 37.0 29.2 30.1 46.0 45.6 47.0 48.3 33.9 34.4
of which: Finished goods and merchandise 35.5 36.0 26.0 27.1 43.3 43.0 45.5 46.8 33.2 33.6Cash 4.4 4.7 10.2 10.8 8.4 8.2 5.6 5.6 3.9 4.3Receivables 38.5 38.2 24.0 24.8 19.5 19.9 24.1 23.2 42.2 42.2
Short-term 37.7 37.4 22.4 23.3 18.9 19.4 23.6 22.6 41.4 41.3 of which:
Trade receivables 11.9 11.3 11.0 11.3 10.5 10.6 12.0 11.5 11.9 11.3Receivables from affiliated companies 21.0 21.9 5.6 5.9 3.5 3.7 6.7 6.0 24.8 26.0
Long-term 0.8 0.8 1.6 1.5 0.6 0.5 0.5 0.6 0.8 0.8of which: Loans to affiliated companies 0.6 0.6 1.1 1.0 0.3 0.3 0.3 0.4 0.7 0.7
Securities 0.4 0.3 0.6 0.5 0.2 0.1 0.5 0.3 0.3 0.2Other long-term equity investments 4.7 4.3 0.9 0.8 1.0 1.0 1.5 1.6 5.5 5.0
of which: Goodwill 1.0 0.9 0.6 0.5 0.2 0.2 0.1 0.3 1.3 1.1
CapitalEquity 21.2 20.8 23.3 25.9 27.2 27.5 25.1 24.6 20.2 19.6Liabilities 64.3 65.2 71.4 68.8 68.0 68.0 69.4 70.1 63.1 64.0
Short-term 57.0 57.5 48.6 47.1 54.8 53.5 61.4 62.8 56.4 56.7of which:Liabilities to banks 19.2 20.5 18.9 17.7 26.9 26.2 30.1 32.6 16.7 17.9Trade payables 9.9 9.3 10.7 10.9 13.8 13.2 13.2 12.2 9.1 8.5Liabilities to affiliated companies 23.0 22.0 7.2 6.6 6.4 6.6 11.9 11.4 26.0 25.0
Long-term 7.3 7.7 22.8 21.7 13.2 14.5 8.0 7.3 6.7 7.3 of which:
Liabilities to banks 4.4 4.2 15.8 14.7 9.3 10.1 5.8 5.1 3.8 3.7Liabilities to affiliated companies 2.3 3.0 3.5 3.7 2.3 2.7 1.3 1.3 2.5 3.3
Provisions 14.1 13.6 5.1 4.9 4.7 4.4 5.4 5.1 16.3 15.7of which: Provisions for pensions 1.5 1.5 1.0 1.0 1.4 1.3 1.1 1.1 1.6 1.6
Other ratios Percentage of salesAnnual result before taxes on income 1.7 1.7 4.3 5.2 2.8 2.9 2.0 1.9 1.5 1.6Annual result and depreciation 2.1 2.2 5.9 6.7 3.8 4.0 2.9 2.8 1.8 2.0Trade receivables 4.3 4.1 5.3 5.5 4.4 4.5 4.6 4.6 4.2 4.0
Percentage of the balance sheet totalSales 275.7 273.9 206.1 203.9 238.0 232.5 260.6 252.3 280.9 280.6Annual result and interest paid 4.4 4.7 9.0 10.6 6.5 6.8 5.0 4.6 4.1 4.5
Percentage of liabilities and provisions less cashAnnual result and depreciation 7.6 7.9 18.2 21.5 14.0 14.5 10.7 10.0 6.8 7.2
Percentage of fixed assetsLong-term equity and liabilities 141.7 146.3 127.0 139.6 158.9 164.4 145.5 142.4 139.9 146.1
Percentage of short-term liabilitiesCash resources and short-term receivables 74.0 73.5 68.2 73.3 50.0 51.8 47.8 45.2 80.7 80.7Cash resources, short-term receivables and inventories 137.7 137.9 128.3 137.3 133.9 137.1 124.3 122.0 140.8 141.3
Percentage of cost of materialsTrade payables 4.3 4.1 9.1 9.4 7.9 7.7 6.4 6.1 3.8 3.6
Memo item:Balance sheet total in € billion 42.99 46.32 0.21 0.22 1.73 1.86 6.61 7.24 34.44 36.99Sales in € billion 118.52 126.85 0.43 0.46 4.12 4.32 17.22 18.27 96.75 103.80Number of enterprises 2 404 2 404 428 428 788 788 728 728 460 460
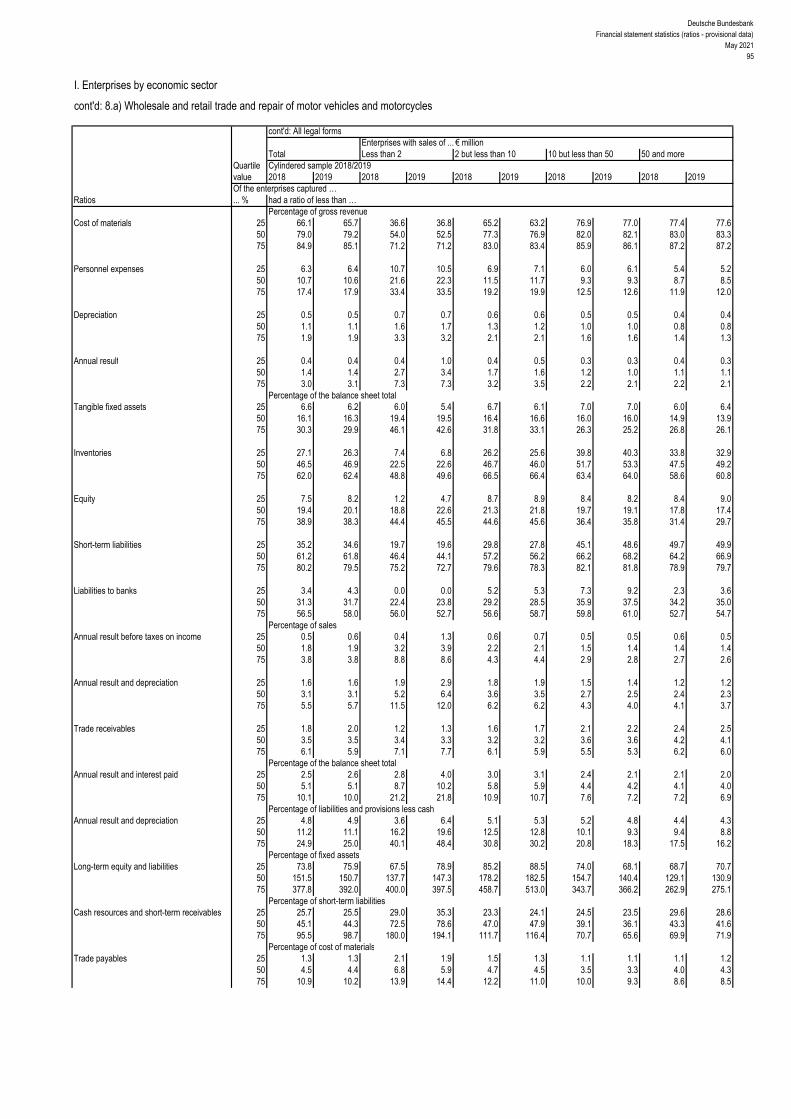
Deutsche BundesbankFinancial statement statistics (ratios - provisional data)
May 202195
I. Enterprises by economic sector
cont'd: 8.a) Wholesale and retail trade and repair of motor vehicles and motorcycles
cont'd: All legal formsEnterprises with sales of ... € million
Total Less than 2 2 but less than 10 10 but less than 50 50 and moreQuartile Cylindered sample 2018/2019value 2018 2019 2018 2019 2018 2019 2018 2019 2018 2019Of the enterprises captured …
Ratios ... % had a ratio of less than …Percentage of gross revenue
Cost of materials 25 66.1 65.7 36.6 36.8 65.2 63.2 76.9 77.0 77.4 77.6 50 79.0 79.2 54.0 52.5 77.3 76.9 82.0 82.1 83.0 83.3 75 84.9 85.1 71.2 71.2 83.0 83.4 85.9 86.1 87.2 87.2
Personnel expenses 25 6.3 6.4 10.7 10.5 6.9 7.1 6.0 6.1 5.4 5.2 50 10.7 10.6 21.6 22.3 11.5 11.7 9.3 9.3 8.7 8.5 75 17.4 17.9 33.4 33.5 19.2 19.9 12.5 12.6 11.9 12.0
Depreciation 25 0.5 0.5 0.7 0.7 0.6 0.6 0.5 0.5 0.4 0.4 50 1.1 1.1 1.6 1.7 1.3 1.2 1.0 1.0 0.8 0.8 75 1.9 1.9 3.3 3.2 2.1 2.1 1.6 1.6 1.4 1.3
Annual result 25 0.4 0.4 0.4 1.0 0.4 0.5 0.3 0.3 0.4 0.3 50 1.4 1.4 2.7 3.4 1.7 1.6 1.2 1.0 1.1 1.1 75 3.0 3.1 7.3 7.3 3.2 3.5 2.2 2.1 2.2 2.1
Percentage of the balance sheet totalTangible fixed assets 25 6.6 6.2 6.0 5.4 6.7 6.1 7.0 7.0 6.0 6.4
50 16.1 16.3 19.4 19.5 16.4 16.6 16.0 16.0 14.9 13.9 75 30.3 29.9 46.1 42.6 31.8 33.1 26.3 25.2 26.8 26.1
Inventories 25 27.1 26.3 7.4 6.8 26.2 25.6 39.8 40.3 33.8 32.9 50 46.5 46.9 22.5 22.6 46.7 46.0 51.7 53.3 47.5 49.2 75 62.0 62.4 48.8 49.6 66.5 66.4 63.4 64.0 58.6 60.8
Equity 25 7.5 8.2 1.2 4.7 8.7 8.9 8.4 8.2 8.4 9.0 50 19.4 20.1 18.8 22.6 21.3 21.8 19.7 19.1 17.8 17.4 75 38.9 38.3 44.4 45.5 44.6 45.6 36.4 35.8 31.4 29.7
Short-term liabilities 25 35.2 34.6 19.7 19.6 29.8 27.8 45.1 48.6 49.7 49.9 50 61.2 61.8 46.4 44.1 57.2 56.2 66.2 68.2 64.2 66.9 75 80.2 79.5 75.2 72.7 79.6 78.3 82.1 81.8 78.9 79.7
Liabilities to banks 25 3.4 4.3 0.0 0.0 5.2 5.3 7.3 9.2 2.3 3.6 50 31.3 31.7 22.4 23.8 29.2 28.5 35.9 37.5 34.2 35.0 75 56.5 58.0 56.0 52.7 56.6 58.7 59.8 61.0 52.7 54.7
Percentage of salesAnnual result before taxes on income 25 0.5 0.6 0.4 1.3 0.6 0.7 0.5 0.5 0.6 0.5
50 1.8 1.9 3.2 3.9 2.2 2.1 1.5 1.4 1.4 1.4 75 3.8 3.8 8.8 8.6 4.3 4.4 2.9 2.8 2.7 2.6
Annual result and depreciation 25 1.6 1.6 1.9 2.9 1.8 1.9 1.5 1.4 1.2 1.2 50 3.1 3.1 5.2 6.4 3.6 3.5 2.7 2.5 2.4 2.3 75 5.5 5.7 11.5 12.0 6.2 6.2 4.3 4.0 4.1 3.7
Trade receivables 25 1.8 2.0 1.2 1.3 1.6 1.7 2.1 2.2 2.4 2.5 50 3.5 3.5 3.4 3.3 3.2 3.2 3.6 3.6 4.2 4.1 75 6.1 5.9 7.1 7.7 6.1 5.9 5.5 5.3 6.2 6.0
Percentage of the balance sheet totalAnnual result and interest paid 25 2.5 2.6 2.8 4.0 3.0 3.1 2.4 2.1 2.1 2.0
50 5.1 5.1 8.7 10.2 5.8 5.9 4.4 4.2 4.1 4.0 75 10.1 10.0 21.2 21.8 10.9 10.7 7.6 7.2 7.2 6.9
Percentage of liabilities and provisions less cashAnnual result and depreciation 25 4.8 4.9 3.6 6.4 5.1 5.3 5.2 4.8 4.4 4.3
50 11.2 11.1 16.2 19.6 12.5 12.8 10.1 9.3 9.4 8.8 75 24.9 25.0 40.1 48.4 30.8 30.2 20.8 18.3 17.5 16.2
Percentage of fixed assetsLong-term equity and liabilities 25 73.8 75.9 67.5 78.9 85.2 88.5 74.0 68.1 68.7 70.7
50 151.5 150.7 137.7 147.3 178.2 182.5 154.7 140.4 129.1 130.9 75 377.8 392.0 400.0 397.5 458.7 513.0 343.7 366.2 262.9 275.1
Percentage of short-term liabilitiesCash resources and short-term receivables 25 25.7 25.5 29.0 35.3 23.3 24.1 24.5 23.5 29.6 28.6
50 45.1 44.3 72.5 78.6 47.0 47.9 39.1 36.1 43.3 41.6 75 95.5 98.7 180.0 194.1 111.7 116.4 70.7 65.6 69.9 71.9
Percentage of cost of materialsTrade payables 25 1.3 1.3 2.1 1.9 1.5 1.3 1.1 1.1 1.1 1.2
50 4.5 4.4 6.8 5.9 4.7 4.5 3.5 3.3 4.0 4.3 75 10.9 10.2 13.9 14.4 12.2 11.0 10.0 9.3 8.6 8.5

Deutsche BundesbankFinancial statement statistics (ratios - provisional data)May 202196
I. Enterprises by economic sector
cont'd: 8a) Wholesale and retail trade and repair of motor vehicles and motorcycles
CorporationsEnterprises with sales of ... € million
Total Less than 2 2 but less than 10 10 but less than 50 50 and moreCylindered sample 2018/2019
Ratios 2018 2019 2018 2019 2018 2019 2018 2019 2018 2019Income statementIncome Percentage of gross revenueSales 100.0 100.0 99.9 99.7 99.9 99.9 100.0 100.0 100.0 100.0Change in finished goods 0.0 0.0 0.1 0.3 0.1 0.1 0.0 0.0 0.0 0.0Interest and similar income 0.1 0.1 0.1 0.1 0.1 0.1 0.1 0.1 0.1 0.1Other income 1.3 1.4 1.6 1.9 1.2 1.2 0.8 0.7 1.4 1.5
of which: Income from long-term equity investments 0.1 0.1 0.0 0.0 0.0 0.0 0.0 0.1 0.1 0.1Total income 101.4 101.5 101.8 102.0 101.3 101.3 100.8 100.8 101.5 101.6
ExpensesCost of materials 84.1 84.5 54.2 54.1 73.1 73.1 79.8 80.0 85.3 85.7Personnel expenses 6.1 6.0 25.6 25.4 14.3 14.3 9.9 9.9 5.2 5.1Depreciation 0.7 0.7 2.1 2.0 1.7 1.7 1.3 1.3 0.6 0.6
of which: Depreciation of tangible fixed assets 0.7 0.7 2.0 2.0 1.6 1.6 1.3 1.2 0.6 0.5Interest and similar expenses 0.3 0.3 0.8 0.7 0.6 0.6 0.4 0.4 0.3 0.3Operating taxes 0.0 0.0 0.1 0.1 0.1 0.1 0.1 0.1 0.0 0.0Other expenses 8.5 8.3 16.4 15.7 8.9 8.9 7.3 7.3 8.6 8.4Total expenses before taxes on income 99.8 99.9 99.1 98.1 98.7 98.7 98.8 98.9 100.0 100.1Annual result before taxes on income 1.6 1.6 2.7 4.0 2.6 2.7 2.0 1.9 1.5 1.6Taxes on income 0.4 0.4 0.9 0.9 0.7 0.7 0.6 0.5 0.4 0.3Annual result 1.1 1.3 1.8 3.0 1.8 1.9 1.4 1.3 1.1 1.2Profit and loss transfers (parent company) 0.0 0.0 0.0 0.0 0.0 0.0 0.1 0.1 0.0 0.0Profit and loss transfers (subsidiary) 0.4 0.6 0.2 0.2 0.3 0.2 0.4 0.4 0.4 0.6Profit for the year 0.8 0.7 1.7 2.9 1.6 1.7 1.1 1.0 0.7 0.6
Balance sheetAssets Percentage of the balance sheet totalIntangible fixed assets 0.3 0.4 0.5 0.6 0.2 0.2 0.4 0.3 0.3 0.4Tangible fixed assets 13.1 12.9 25.9 24.6 22.1 22.2 18.7 18.5 11.7 11.5
of which: Land and buildings 5.8 5.4 9.7 8.3 7.0 7.1 5.8 5.8 5.7 5.2Inventories 34.8 35.4 29.8 30.2 47.1 46.7 47.0 48.4 32.2 32.7
of which: Finished goods and merchandise 33.9 34.4 26.1 26.6 44.1 43.7 45.3 46.6 31.5 31.9Cash 4.4 4.6 12.0 12.9 8.8 8.7 6.0 6.1 3.9 4.2Receivables 41.9 41.7 29.9 30.3 20.1 20.7 25.3 24.4 45.8 45.7
Short-term 41.2 41.0 27.5 28.0 19.4 20.1 24.8 23.8 45.1 44.9 of which:
Trade receivables 12.0 11.3 13.0 13.3 10.6 10.7 12.1 11.7 12.0 11.3Receivables from affiliated companies 24.4 25.4 7.1 7.2 3.5 3.9 7.7 6.8 28.3 29.7
Long-term 0.7 0.8 2.5 2.3 0.7 0.6 0.5 0.7 0.8 0.8of which: Loans to affiliated companies 0.7 0.7 1.8 1.7 0.4 0.4 0.4 0.5 0.7 0.7
Securities 0.3 0.1 0.1 0.1 0.3 0.2 0.6 0.4 0.2 0.1Other long-term equity investments 4.9 4.4 1.1 0.9 1.1 1.1 1.7 1.6 5.6 5.1
of which: Goodwill 1.2 1.1 0.7 0.6 0.2 0.1 0.1 0.1 1.5 1.3
CapitalEquity 21.6 21.2 30.1 32.4 30.0 30.6 28.0 27.4 20.1 19.6Liabilities 61.9 62.7 63.7 61.6 64.7 64.4 66.1 66.9 61.1 61.9
Short-term 55.1 55.3 44.4 44.2 51.3 50.3 58.8 60.2 54.7 54.8of which:Liabilities to banks 16.5 17.7 15.1 14.7 25.2 24.7 27.3 29.8 14.3 15.3Trade payables 9.2 8.6 10.8 11.2 12.8 12.0 13.2 12.4 8.4 7.8Liabilities to affiliated companies 24.6 23.6 7.8 7.3 5.3 5.6 11.7 11.4 27.7 26.6
Long-term 6.8 7.4 19.3 17.4 13.4 14.1 7.3 6.7 6.3 7.1 of which:
Liabilities to banks 3.8 3.7 11.4 10.3 9.4 9.6 4.8 4.2 3.3 3.3Liabilities to affiliated companies 2.4 3.2 5.1 5.1 2.6 3.0 1.5 1.5 2.5 3.5
Provisions 16.0 15.5 6.1 5.9 5.1 4.9 5.8 5.5 18.3 17.8of which: Provisions for pensions 1.7 1.7 1.7 1.7 1.6 1.5 1.3 1.3 1.7 1.7
Other ratios Percentage of salesAnnual result before taxes on income 1.6 1.6 2.7 4.0 2.6 2.7 2.0 1.9 1.5 1.6Annual result and depreciation 1.9 2.0 3.9 5.1 3.5 3.6 2.7 2.7 1.7 1.8Trade receivables 4.3 4.0 6.0 6.2 4.5 4.6 4.6 4.6 4.2 3.9
Percentage of the balance sheet totalSales 281.6 280.2 218.9 214.0 235.9 230.9 262.5 253.6 287.2 287.3Annual result and interest paid 4.1 4.5 5.7 8.1 5.7 5.9 4.7 4.3 4.0 4.5
Percentage of liabilities and provisions less cashAnnual result and depreciation 7.1 7.6 14.6 19.9 13.5 13.7 10.8 10.1 6.3 6.9
Percentage of fixed assetsLong-term equity and liabilities 155.8 162.8 169.8 181.1 185.7 191.2 167.0 165.5 151.7 160.4
Percentage of short-term liabilitiesCash resources and short-term receivables 82.8 82.5 89.0 92.7 55.1 57.3 52.6 49.9 89.5 89.7Cash resources, short-term receivables and inventories 145.8 146.5 156.1 160.9 146.9 150.0 132.5 130.2 148.2 149.5
Percentage of cost of materialsTrade payables 3.9 3.6 9.1 9.7 7.4 7.1 6.3 6.1 3.4 3.2
Memo item:Balance sheet total in € billion 35.06 37.64 0.13 0.14 1.29 1.38 4.92 5.37 28.74 30.76Sales in € billion 98.74 105.47 0.28 0.29 3.03 3.19 12.90 13.61 82.52 88.38Number of enterprises 1 711 1 711 272 272 569 569 531 531 339 339
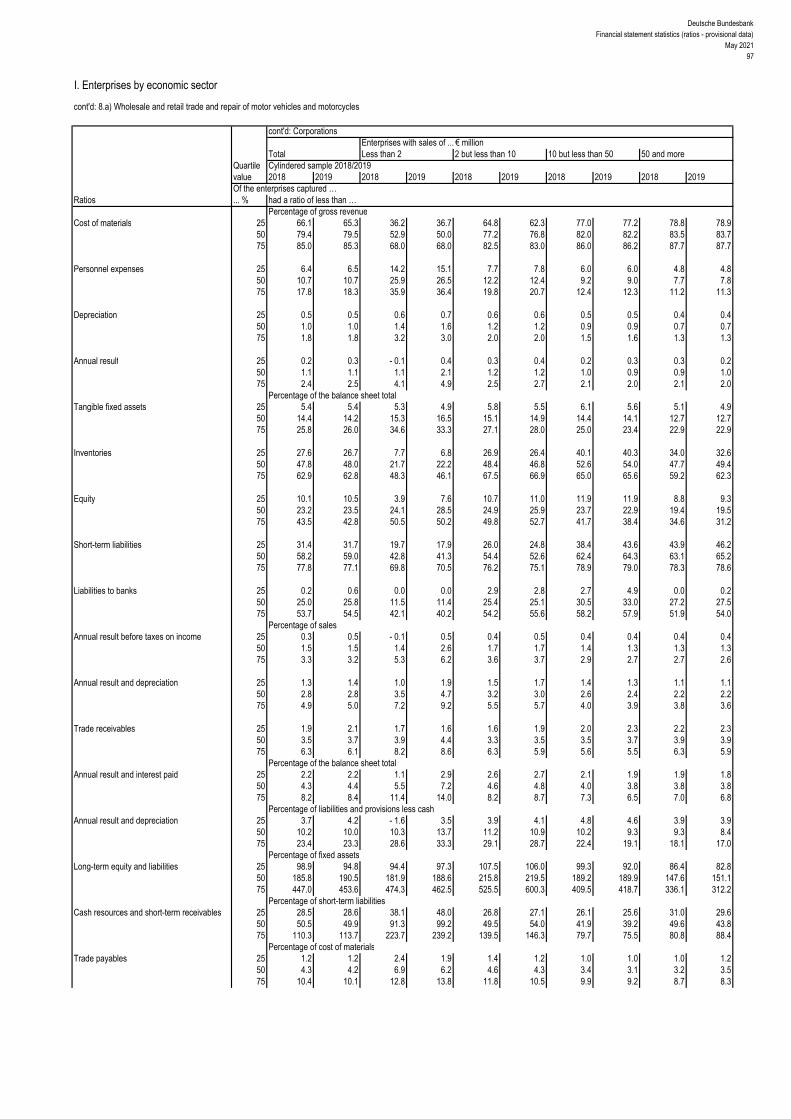
Deutsche BundesbankFinancial statement statistics (ratios - provisional data)
May 202197
I. Enterprises by economic sector
cont'd: 8.a) Wholesale and retail trade and repair of motor vehicles and motorcycles
cont'd: CorporationsEnterprises with sales of ... € million
Total Less than 2 2 but less than 10 10 but less than 50 50 and moreQuartile Cylindered sample 2018/2019value 2018 2019 2018 2019 2018 2019 2018 2019 2018 2019Of the enterprises captured …
Ratios ... % had a ratio of less than …Percentage of gross revenue
Cost of materials 25 66.1 65.3 36.2 36.7 64.8 62.3 77.0 77.2 78.8 78.9 50 79.4 79.5 52.9 50.0 77.2 76.8 82.0 82.2 83.5 83.7 75 85.0 85.3 68.0 68.0 82.5 83.0 86.0 86.2 87.7 87.7
Personnel expenses 25 6.4 6.5 14.2 15.1 7.7 7.8 6.0 6.0 4.8 4.8 50 10.7 10.7 25.9 26.5 12.2 12.4 9.2 9.0 7.7 7.8 75 17.8 18.3 35.9 36.4 19.8 20.7 12.4 12.3 11.2 11.3
Depreciation 25 0.5 0.5 0.6 0.7 0.6 0.6 0.5 0.5 0.4 0.4 50 1.0 1.0 1.4 1.6 1.2 1.2 0.9 0.9 0.7 0.7 75 1.8 1.8 3.2 3.0 2.0 2.0 1.5 1.6 1.3 1.3
Annual result 25 0.2 0.3 - 0.1 0.4 0.3 0.4 0.2 0.3 0.3 0.2 50 1.1 1.1 1.1 2.1 1.2 1.2 1.0 0.9 0.9 1.0 75 2.4 2.5 4.1 4.9 2.5 2.7 2.1 2.0 2.1 2.0
Percentage of the balance sheet totalTangible fixed assets 25 5.4 5.4 5.3 4.9 5.8 5.5 6.1 5.6 5.1 4.9
50 14.4 14.2 15.3 16.5 15.1 14.9 14.4 14.1 12.7 12.7 75 25.8 26.0 34.6 33.3 27.1 28.0 25.0 23.4 22.9 22.9
Inventories 25 27.6 26.7 7.7 6.8 26.9 26.4 40.1 40.3 34.0 32.6 50 47.8 48.0 21.7 22.2 48.4 46.8 52.6 54.0 47.7 49.4 75 62.9 62.8 48.3 46.1 67.5 66.9 65.0 65.6 59.2 62.3
Equity 25 10.1 10.5 3.9 7.6 10.7 11.0 11.9 11.9 8.8 9.3 50 23.2 23.5 24.1 28.5 24.9 25.9 23.7 22.9 19.4 19.5 75 43.5 42.8 50.5 50.2 49.8 52.7 41.7 38.4 34.6 31.2
Short-term liabilities 25 31.4 31.7 19.7 17.9 26.0 24.8 38.4 43.6 43.9 46.2 50 58.2 59.0 42.8 41.3 54.4 52.6 62.4 64.3 63.1 65.2 75 77.8 77.1 69.8 70.5 76.2 75.1 78.9 79.0 78.3 78.6
Liabilities to banks 25 0.2 0.6 0.0 0.0 2.9 2.8 2.7 4.9 0.0 0.2 50 25.0 25.8 11.5 11.4 25.4 25.1 30.5 33.0 27.2 27.5 75 53.7 54.5 42.1 40.2 54.2 55.6 58.2 57.9 51.9 54.0
Percentage of salesAnnual result before taxes on income 25 0.3 0.5 - 0.1 0.5 0.4 0.5 0.4 0.4 0.4 0.4
50 1.5 1.5 1.4 2.6 1.7 1.7 1.4 1.3 1.3 1.3 75 3.3 3.2 5.3 6.2 3.6 3.7 2.9 2.7 2.7 2.6
Annual result and depreciation 25 1.3 1.4 1.0 1.9 1.5 1.7 1.4 1.3 1.1 1.1 50 2.8 2.8 3.5 4.7 3.2 3.0 2.6 2.4 2.2 2.2 75 4.9 5.0 7.2 9.2 5.5 5.7 4.0 3.9 3.8 3.6
Trade receivables 25 1.9 2.1 1.7 1.6 1.6 1.9 2.0 2.3 2.2 2.3 50 3.5 3.7 3.9 4.4 3.3 3.5 3.5 3.7 3.9 3.9 75 6.3 6.1 8.2 8.6 6.3 5.9 5.6 5.5 6.3 5.9
Percentage of the balance sheet totalAnnual result and interest paid 25 2.2 2.2 1.1 2.9 2.6 2.7 2.1 1.9 1.9 1.8
50 4.3 4.4 5.5 7.2 4.6 4.8 4.0 3.8 3.8 3.8 75 8.2 8.4 11.4 14.0 8.2 8.7 7.3 6.5 7.0 6.8
Percentage of liabilities and provisions less cashAnnual result and depreciation 25 3.7 4.2 - 1.6 3.5 3.9 4.1 4.8 4.6 3.9 3.9
50 10.2 10.0 10.3 13.7 11.2 10.9 10.2 9.3 9.3 8.4 75 23.4 23.3 28.6 33.3 29.1 28.7 22.4 19.1 18.1 17.0
Percentage of fixed assetsLong-term equity and liabilities 25 98.9 94.8 94.4 97.3 107.5 106.0 99.3 92.0 86.4 82.8
50 185.8 190.5 181.9 188.6 215.8 219.5 189.2 189.9 147.6 151.1 75 447.0 453.6 474.3 462.5 525.5 600.3 409.5 418.7 336.1 312.2
Percentage of short-term liabilitiesCash resources and short-term receivables 25 28.5 28.6 38.1 48.0 26.8 27.1 26.1 25.6 31.0 29.6
50 50.5 49.9 91.3 99.2 49.5 54.0 41.9 39.2 49.6 43.8 75 110.3 113.7 223.7 239.2 139.5 146.3 79.7 75.5 80.8 88.4
Percentage of cost of materialsTrade payables 25 1.2 1.2 2.4 1.9 1.4 1.2 1.0 1.0 1.0 1.2
50 4.3 4.2 6.9 6.2 4.6 4.3 3.4 3.1 3.2 3.5 75 10.4 10.1 12.8 13.8 11.8 10.5 9.9 9.2 8.7 8.3
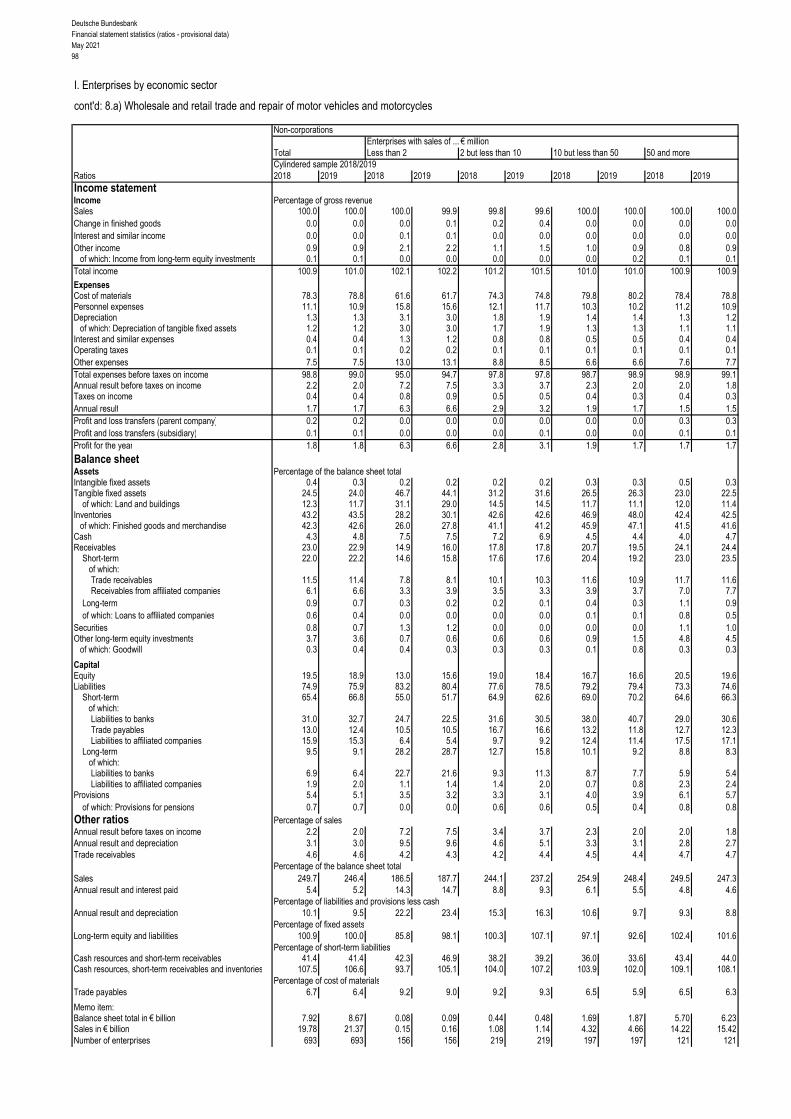
Deutsche BundesbankFinancial statement statistics (ratios - provisional data)May 202198
I. Enterprises by economic sector
cont'd: 8.a) Wholesale and retail trade and repair of motor vehicles and motorcycles
Non-corporationsEnterprises with sales of ... € million
Total Less than 2 2 but less than 10 10 but less than 50 50 and moreCylindered sample 2018/2019
Ratios 2018 2019 2018 2019 2018 2019 2018 2019 2018 2019Income statementIncome Percentage of gross revenueSales 100.0 100.0 100.0 99.9 99.8 99.6 100.0 100.0 100.0 100.0Change in finished goods 0.0 0.0 0.0 0.1 0.2 0.4 0.0 0.0 0.0 0.0Interest and similar income 0.0 0.0 0.1 0.1 0.0 0.0 0.0 0.0 0.0 0.0Other income 0.9 0.9 2.1 2.2 1.1 1.5 1.0 0.9 0.8 0.9
of which: Income from long-term equity investments 0.1 0.1 0.0 0.0 0.0 0.0 0.0 0.2 0.1 0.1Total income 100.9 101.0 102.1 102.2 101.2 101.5 101.0 101.0 100.9 100.9
ExpensesCost of materials 78.3 78.8 61.6 61.7 74.3 74.8 79.8 80.2 78.4 78.8Personnel expenses 11.1 10.9 15.8 15.6 12.1 11.7 10.3 10.2 11.2 10.9Depreciation 1.3 1.3 3.1 3.0 1.8 1.9 1.4 1.4 1.3 1.2
of which: Depreciation of tangible fixed assets 1.2 1.2 3.0 3.0 1.7 1.9 1.3 1.3 1.1 1.1Interest and similar expenses 0.4 0.4 1.3 1.2 0.8 0.8 0.5 0.5 0.4 0.4Operating taxes 0.1 0.1 0.2 0.2 0.1 0.1 0.1 0.1 0.1 0.1Other expenses 7.5 7.5 13.0 13.1 8.8 8.5 6.6 6.6 7.6 7.7Total expenses before taxes on income 98.8 99.0 95.0 94.7 97.8 97.8 98.7 98.9 98.9 99.1Annual result before taxes on income 2.2 2.0 7.2 7.5 3.3 3.7 2.3 2.0 2.0 1.8Taxes on income 0.4 0.4 0.8 0.9 0.5 0.5 0.4 0.3 0.4 0.3Annual result 1.7 1.7 6.3 6.6 2.9 3.2 1.9 1.7 1.5 1.5Profit and loss transfers (parent company) 0.2 0.2 0.0 0.0 0.0 0.0 0.0 0.0 0.3 0.3Profit and loss transfers (subsidiary) 0.1 0.1 0.0 0.0 0.0 0.1 0.0 0.0 0.1 0.1Profit for the year 1.8 1.8 6.3 6.6 2.8 3.1 1.9 1.7 1.7 1.7
Balance sheetAssets Percentage of the balance sheet totalIntangible fixed assets 0.4 0.3 0.2 0.2 0.2 0.2 0.3 0.3 0.5 0.3Tangible fixed assets 24.5 24.0 46.7 44.1 31.2 31.6 26.5 26.3 23.0 22.5
of which: Land and buildings 12.3 11.7 31.1 29.0 14.5 14.5 11.7 11.1 12.0 11.4Inventories 43.2 43.5 28.2 30.1 42.6 42.6 46.9 48.0 42.4 42.5
of which: Finished goods and merchandise 42.3 42.6 26.0 27.8 41.1 41.2 45.9 47.1 41.5 41.6Cash 4.3 4.8 7.5 7.5 7.2 6.9 4.5 4.4 4.0 4.7Receivables 23.0 22.9 14.9 16.0 17.8 17.8 20.7 19.5 24.1 24.4
Short-term 22.0 22.2 14.6 15.8 17.6 17.6 20.4 19.2 23.0 23.5 of which:
Trade receivables 11.5 11.4 7.8 8.1 10.1 10.3 11.6 10.9 11.7 11.6Receivables from affiliated companies 6.1 6.6 3.3 3.9 3.5 3.3 3.9 3.7 7.0 7.7
Long-term 0.9 0.7 0.3 0.2 0.2 0.1 0.4 0.3 1.1 0.9of which: Loans to affiliated companies 0.6 0.4 0.0 0.0 0.0 0.0 0.1 0.1 0.8 0.5
Securities 0.8 0.7 1.3 1.2 0.0 0.0 0.0 0.0 1.1 1.0Other long-term equity investments 3.7 3.6 0.7 0.6 0.6 0.6 0.9 1.5 4.8 4.5
of which: Goodwill 0.3 0.4 0.4 0.3 0.3 0.3 0.1 0.8 0.3 0.3
CapitalEquity 19.5 18.9 13.0 15.6 19.0 18.4 16.7 16.6 20.5 19.6Liabilities 74.9 75.9 83.2 80.4 77.6 78.5 79.2 79.4 73.3 74.6
Short-term 65.4 66.8 55.0 51.7 64.9 62.6 69.0 70.2 64.6 66.3of which:Liabilities to banks 31.0 32.7 24.7 22.5 31.6 30.5 38.0 40.7 29.0 30.6Trade payables 13.0 12.4 10.5 10.5 16.7 16.6 13.2 11.8 12.7 12.3Liabilities to affiliated companies 15.9 15.3 6.4 5.4 9.7 9.2 12.4 11.4 17.5 17.1
Long-term 9.5 9.1 28.2 28.7 12.7 15.8 10.1 9.2 8.8 8.3 of which:
Liabilities to banks 6.9 6.4 22.7 21.6 9.3 11.3 8.7 7.7 5.9 5.4Liabilities to affiliated companies 1.9 2.0 1.1 1.4 1.4 2.0 0.7 0.8 2.3 2.4
Provisions 5.4 5.1 3.5 3.2 3.3 3.1 4.0 3.9 6.1 5.7of which: Provisions for pensions 0.7 0.7 0.0 0.0 0.6 0.6 0.5 0.4 0.8 0.8
Other ratios Percentage of salesAnnual result before taxes on income 2.2 2.0 7.2 7.5 3.4 3.7 2.3 2.0 2.0 1.8Annual result and depreciation 3.1 3.0 9.5 9.6 4.6 5.1 3.3 3.1 2.8 2.7Trade receivables 4.6 4.6 4.2 4.3 4.2 4.4 4.5 4.4 4.7 4.7
Percentage of the balance sheet totalSales 249.7 246.4 186.5 187.7 244.1 237.2 254.9 248.4 249.5 247.3Annual result and interest paid 5.4 5.2 14.3 14.7 8.8 9.3 6.1 5.5 4.8 4.6
Percentage of liabilities and provisions less cashAnnual result and depreciation 10.1 9.5 22.2 23.4 15.3 16.3 10.6 9.7 9.3 8.8
Percentage of fixed assetsLong-term equity and liabilities 100.9 100.0 85.8 98.1 100.3 107.1 97.1 92.6 102.4 101.6
Percentage of short-term liabilitiesCash resources and short-term receivables 41.4 41.4 42.3 46.9 38.2 39.2 36.0 33.6 43.4 44.0Cash resources, short-term receivables and inventories 107.5 106.6 93.7 105.1 104.0 107.2 103.9 102.0 109.1 108.1
Percentage of cost of materialsTrade payables 6.7 6.4 9.2 9.0 9.2 9.3 6.5 5.9 6.5 6.3
Memo item:Balance sheet total in € billion 7.92 8.67 0.08 0.09 0.44 0.48 1.69 1.87 5.70 6.23Sales in € billion 19.78 21.37 0.15 0.16 1.08 1.14 4.32 4.66 14.22 15.42Number of enterprises 693 693 156 156 219 219 197 197 121 121
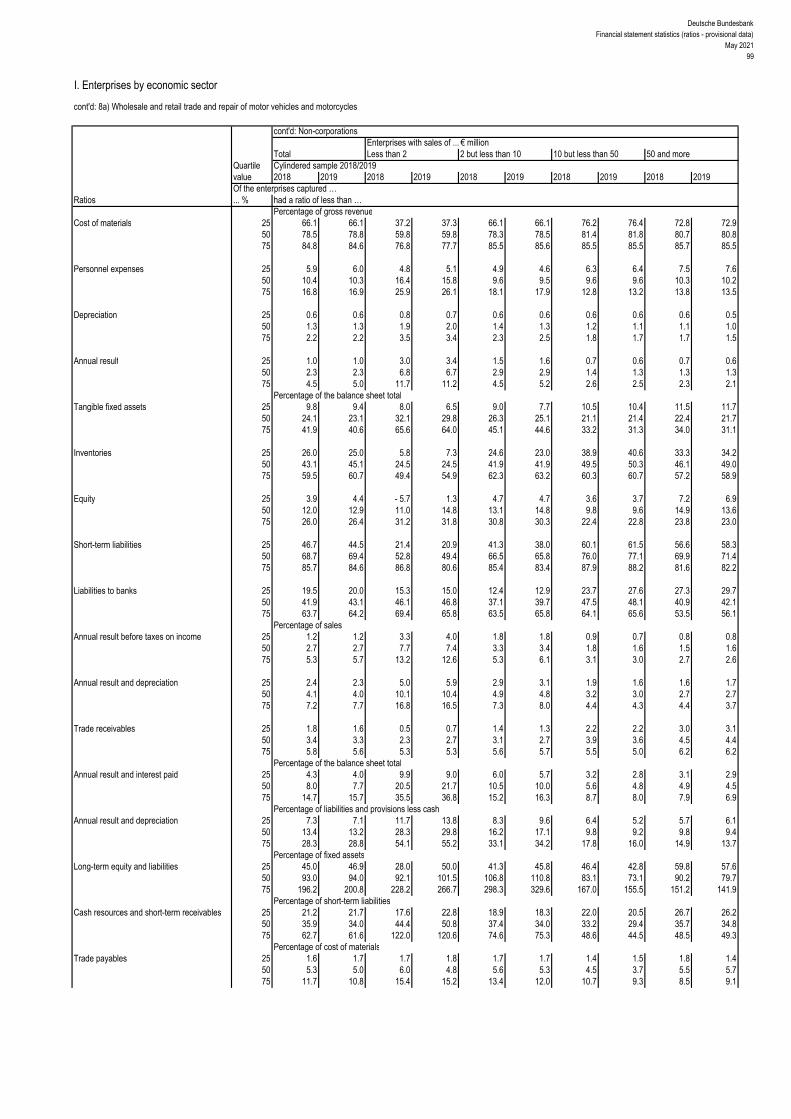
Deutsche BundesbankFinancial statement statistics (ratios - provisional data)
May 202199
I. Enterprises by economic sector
cont'd: 8a) Wholesale and retail trade and repair of motor vehicles and motorcycles
cont'd: Non-corporationsEnterprises with sales of ... € million
Total Less than 2 2 but less than 10 10 but less than 50 50 and moreQuartile Cylindered sample 2018/2019value 2018 2019 2018 2019 2018 2019 2018 2019 2018 2019Of the enterprises captured …
Ratios ... % had a ratio of less than …Percentage of gross revenue
Cost of materials 25 66.1 66.1 37.2 37.3 66.1 66.1 76.2 76.4 72.8 72.9 50 78.5 78.8 59.8 59.8 78.3 78.5 81.4 81.8 80.7 80.8 75 84.8 84.6 76.8 77.7 85.5 85.6 85.5 85.5 85.7 85.5
Personnel expenses 25 5.9 6.0 4.8 5.1 4.9 4.6 6.3 6.4 7.5 7.6 50 10.4 10.3 16.4 15.8 9.6 9.5 9.6 9.6 10.3 10.2 75 16.8 16.9 25.9 26.1 18.1 17.9 12.8 13.2 13.8 13.5
Depreciation 25 0.6 0.6 0.8 0.7 0.6 0.6 0.6 0.6 0.6 0.5 50 1.3 1.3 1.9 2.0 1.4 1.3 1.2 1.1 1.1 1.0 75 2.2 2.2 3.5 3.4 2.3 2.5 1.8 1.7 1.7 1.5
Annual result 25 1.0 1.0 3.0 3.4 1.5 1.6 0.7 0.6 0.7 0.6 50 2.3 2.3 6.8 6.7 2.9 2.9 1.4 1.3 1.3 1.3 75 4.5 5.0 11.7 11.2 4.5 5.2 2.6 2.5 2.3 2.1
Percentage of the balance sheet totalTangible fixed assets 25 9.8 9.4 8.0 6.5 9.0 7.7 10.5 10.4 11.5 11.7
50 24.1 23.1 32.1 29.8 26.3 25.1 21.1 21.4 22.4 21.7 75 41.9 40.6 65.6 64.0 45.1 44.6 33.2 31.3 34.0 31.1
Inventories 25 26.0 25.0 5.8 7.3 24.6 23.0 38.9 40.6 33.3 34.2 50 43.1 45.1 24.5 24.5 41.9 41.9 49.5 50.3 46.1 49.0 75 59.5 60.7 49.4 54.9 62.3 63.2 60.3 60.7 57.2 58.9
Equity 25 3.9 4.4 - 5.7 1.3 4.7 4.7 3.6 3.7 7.2 6.9 50 12.0 12.9 11.0 14.8 13.1 14.8 9.8 9.6 14.9 13.6 75 26.0 26.4 31.2 31.8 30.8 30.3 22.4 22.8 23.8 23.0
Short-term liabilities 25 46.7 44.5 21.4 20.9 41.3 38.0 60.1 61.5 56.6 58.3 50 68.7 69.4 52.8 49.4 66.5 65.8 76.0 77.1 69.9 71.4 75 85.7 84.6 86.8 80.6 85.4 83.4 87.9 88.2 81.6 82.2
Liabilities to banks 25 19.5 20.0 15.3 15.0 12.4 12.9 23.7 27.6 27.3 29.7 50 41.9 43.1 46.1 46.8 37.1 39.7 47.5 48.1 40.9 42.1 75 63.7 64.2 69.4 65.8 63.5 65.8 64.1 65.6 53.5 56.1
Percentage of salesAnnual result before taxes on income 25 1.2 1.2 3.3 4.0 1.8 1.8 0.9 0.7 0.8 0.8
50 2.7 2.7 7.7 7.4 3.3 3.4 1.8 1.6 1.5 1.6 75 5.3 5.7 13.2 12.6 5.3 6.1 3.1 3.0 2.7 2.6
Annual result and depreciation 25 2.4 2.3 5.0 5.9 2.9 3.1 1.9 1.6 1.6 1.7 50 4.1 4.0 10.1 10.4 4.9 4.8 3.2 3.0 2.7 2.7 75 7.2 7.7 16.8 16.5 7.3 8.0 4.4 4.3 4.4 3.7
Trade receivables 25 1.8 1.6 0.5 0.7 1.4 1.3 2.2 2.2 3.0 3.1 50 3.4 3.3 2.3 2.7 3.1 2.7 3.9 3.6 4.5 4.4 75 5.8 5.6 5.3 5.3 5.6 5.7 5.5 5.0 6.2 6.2
Percentage of the balance sheet totalAnnual result and interest paid 25 4.3 4.0 9.9 9.0 6.0 5.7 3.2 2.8 3.1 2.9
50 8.0 7.7 20.5 21.7 10.5 10.0 5.6 4.8 4.9 4.5 75 14.7 15.7 35.5 36.8 15.2 16.3 8.7 8.0 7.9 6.9
Percentage of liabilities and provisions less cashAnnual result and depreciation 25 7.3 7.1 11.7 13.8 8.3 9.6 6.4 5.2 5.7 6.1
50 13.4 13.2 28.3 29.8 16.2 17.1 9.8 9.2 9.8 9.4 75 28.3 28.8 54.1 55.2 33.1 34.2 17.8 16.0 14.9 13.7
Percentage of fixed assetsLong-term equity and liabilities 25 45.0 46.9 28.0 50.0 41.3 45.8 46.4 42.8 59.8 57.6
50 93.0 94.0 92.1 101.5 106.8 110.8 83.1 73.1 90.2 79.7 75 196.2 200.8 228.2 266.7 298.3 329.6 167.0 155.5 151.2 141.9
Percentage of short-term liabilitiesCash resources and short-term receivables 25 21.2 21.7 17.6 22.8 18.9 18.3 22.0 20.5 26.7 26.2
50 35.9 34.0 44.4 50.8 37.4 34.0 33.2 29.4 35.7 34.8 75 62.7 61.6 122.0 120.6 74.6 75.3 48.6 44.5 48.5 49.3
Percentage of cost of materialsTrade payables 25 1.6 1.7 1.7 1.8 1.7 1.7 1.4 1.5 1.8 1.4
50 5.3 5.0 6.0 4.8 5.6 5.3 4.5 3.7 5.5 5.7 75 11.7 10.8 15.4 15.2 13.4 12.0 10.7 9.3 8.5 9.1

Deutsche BundesbankFinancial statement statistics (ratios - provisional data)May 2021100
I. Enterprises by economic sector
8.b) Wholesale trade, except of motor vehicles and motorcycles
All legal formsEnterprises with sales of ... € million
Total Less than 2 2 but less than 10 10 but less than 50 50 and moreCylindered sample 2018/2019
Ratios 2018 2019 2018 2019 2018 2019 2018 2019 2018 2019Income statementIncome Percentage of gross revenueSales 99.9 99.9 99.5 99.3 99.8 99.7 99.9 100.0 100.0 99.9Change in finished goods 0.1 0.1 0.5 0.7 0.2 0.3 0.1 0.0 0.0 0.1Interest and similar income 0.2 0.2 0.2 0.1 0.1 0.1 0.1 0.1 0.2 0.2Other income 1.6 1.8 2.8 2.5 1.9 1.9 1.4 1.4 1.7 1.8
of which: Income from long-term equity investments 0.4 0.5 0.2 0.2 0.2 0.2 0.2 0.2 0.5 0.6Total income 101.8 101.9 102.9 102.6 102.0 102.0 101.5 101.5 101.8 102.0
ExpensesCost of materials 84.9 84.6 58.4 58.3 69.9 69.5 75.1 74.8 86.3 86.0Personnel expenses 5.5 5.7 20.4 20.2 14.6 14.9 11.1 11.4 4.7 4.9Depreciation 0.8 0.8 1.9 1.9 1.5 1.4 1.2 1.2 0.7 0.7
of which: Depreciation of tangible fixed assets 0.7 0.7 1.9 1.8 1.3 1.4 1.1 1.1 0.6 0.6Interest and similar expenses 0.3 0.3 0.7 0.7 0.5 0.5 0.4 0.4 0.3 0.3Operating taxes 0.0 0.0 0.1 0.1 0.1 0.1 0.0 0.0 0.0 0.0Other expenses 7.4 7.5 16.4 15.9 11.6 11.7 9.8 10.0 7.1 7.1Total expenses before taxes on income 99.0 99.0 98.0 97.0 98.2 98.1 97.7 97.9 99.1 99.1Annual result before taxes on income 2.8 2.9 5.0 5.6 3.8 3.9 3.8 3.6 2.7 2.8Taxes on income 0.6 0.5 1.1 1.2 1.0 1.0 0.9 0.9 0.5 0.5Annual result 2.3 2.4 3.8 4.4 2.8 2.9 2.9 2.8 2.2 2.4Profit and loss transfers (parent company) 0.5 0.2 0.0 0.0 0.1 0.0 0.0 0.0 0.6 0.2Profit and loss transfers (subsidiary) 1.0 0.9 0.2 0.2 0.2 0.3 0.4 0.5 1.1 0.9Profit for the year 1.8 1.7 3.6 4.2 2.6 2.7 2.5 2.3 1.7 1.6
Balance sheetAssets Percentage of the balance sheet totalIntangible fixed assets 1.0 1.3 0.6 0.6 0.7 0.7 0.7 0.8 1.0 1.4Tangible fixed assets 10.7 10.9 18.2 17.4 16.4 16.6 14.5 15.0 10.1 10.3
of which: Land and buildings 6.0 6.1 6.9 6.4 7.6 7.6 7.0 7.1 5.8 5.9Inventories 19.9 19.9 25.7 28.5 33.1 33.9 31.6 31.7 18.2 18.2
of which: Finished goods and merchandise 16.5 16.6 21.7 22.4 27.9 28.1 27.9 28.0 14.9 15.0Cash 6.3 6.3 17.2 17.0 13.5 13.4 10.4 10.4 5.6 5.6Receivables 43.1 43.4 34.2 32.6 32.4 31.4 37.4 37.0 44.0 44.5
Short-term 41.5 41.7 33.4 32.1 31.3 30.4 36.2 35.5 42.4 42.7 of which:
Trade receivables 16.6 16.1 17.7 16.5 19.2 18.3 20.2 19.2 16.1 15.7Receivables from affiliated companies 20.8 21.5 9.2 9.1 7.0 7.1 11.1 11.5 22.2 23.1
Long-term 1.6 1.7 0.7 0.5 1.1 1.1 1.3 1.4 1.6 1.8of which: Loans to affiliated companies 1.3 1.5 0.5 0.2 0.4 0.5 0.7 0.9 1.4 1.6
Securities 2.7 1.9 0.6 0.6 0.6 0.6 0.9 0.8 2.9 2.1Other long-term equity investments 15.9 15.7 2.9 2.5 2.8 2.9 4.1 4.0 17.6 17.5
of which: Goodwill 0.2 0.2 0.8 0.7 0.4 0.4 0.4 0.5 0.2 0.2
CapitalEquity 35.4 35.8 32.0 34.6 38.8 39.5 38.6 39.7 35.0 35.3Liabilities 53.6 53.1 59.6 57.4 54.0 53.5 52.2 51.1 53.7 53.3
Short-term 46.3 45.2 45.8 44.9 43.4 42.8 44.3 43.3 46.6 45.5of which:Liabilities to banks 5.4 5.3 9.4 8.6 10.0 10.0 10.2 10.1 4.8 4.6Trade payables 13.1 13.0 15.7 15.1 13.5 12.8 11.8 11.1 13.2 13.2Liabilities to affiliated companies 21.7 20.7 9.9 8.9 11.2 11.1 15.7 15.6 22.7 21.5
Long-term 7.3 7.9 13.8 12.5 10.6 10.7 7.9 7.8 7.1 7.8 of which:
Liabilities to banks 4.3 4.6 7.8 7.2 6.9 6.9 5.0 5.2 4.2 4.4Liabilities to affiliated companies 1.9 2.1 3.8 3.0 2.6 2.6 2.2 2.1 1.8 2.1
Provisions 10.4 10.2 8.1 7.8 7.0 6.8 9.0 9.0 10.6 10.5of which: Provisions for pensions 3.1 3.2 2.6 2.6 2.1 2.2 3.0 3.1 3.1 3.2
Other ratios Percentage of salesAnnual result before taxes on income 2.8 2.9 5.0 5.6 3.8 3.9 3.8 3.6 2.7 2.8Annual result and depreciation 3.0 3.2 5.8 6.3 4.3 4.4 4.1 4.0 2.9 3.1Trade receivables 6.7 6.5 9.4 8.9 8.8 8.5 8.6 8.2 6.5 6.3
Percentage of the balance sheet totalSales 246.9 248.4 187.8 186.0 217.8 214.0 234.2 233.3 249.2 251.1Annual result and interest paid 6.5 6.8 8.6 9.4 7.2 7.4 7.7 7.4 6.3 6.7
Percentage of liabilities and provisions less cashAnnual result and depreciation 12.9 13.7 21.5 24.2 19.5 19.8 18.8 18.7 12.1 13.1
Percentage of fixed assetsLong-term equity and liabilities 147.7 151.0 213.3 232.1 241.9 242.0 235.6 235.4 139.5 142.9
Percentage of short-term liabilitiesCash resources and short-term receivables 104.6 106.9 111.2 109.9 103.8 102.9 106.3 107.1 104.4 107.0Cash resources, short-term receivables and inventories 147.6 151.0 167.2 173.4 180.2 182.0 177.5 180.3 143.6 147.0
Percentage of cost of materialsTrade payables 6.2 6.2 14.2 13.9 8.9 8.6 6.7 6.4 6.1 6.1
Memo item:Balance sheet total in € billion 287.88 294.47 0.58 0.64 6.21 6.49 29.12 29.82 251.97 257.52Sales in € billion 710.76 731.32 1.09 1.20 13.53 13.89 68.19 69.55 627.95 646.68Number of enterprises 8 642 8 642 1 200 1 200 2 510 2 510 2 908 2 908 2 024 2 024

Deutsche BundesbankFinancial statement statistics (ratios - provisional data)
May 2021101
I. Enterprises by economic sector
cont'd: 8.b) Wholesale trade, except of motor vehicles and motorcycles
cont'd: All legal formsEnterprises with sales of ... € million
Total Less than 2 2 but less than 10 10 but less than 50 50 and moreQuartile Cylindered sample 2018/2019value 2018 2019 2018 2019 2018 2019 2018 2019 2018 2019Of the enterprises captured …
Ratios ... % had a ratio of less than …Percentage of gross revenue
Cost of materials 25 63.8 63.6 41.6 40.7 60.7 60.6 67.9 67.5 73.9 73.8 50 75.1 74.9 60.5 60.9 71.8 71.9 76.3 76.1 83.7 83.4 75 85.1 84.8 74.1 73.3 80.9 80.5 84.6 84.5 92.4 92.4
Personnel expenses 25 5.1 5.2 8.0 7.8 7.7 7.8 5.6 5.8 2.3 2.4 50 10.7 10.9 17.5 17.6 13.3 13.4 10.3 10.5 6.0 6.1 75 17.1 17.4 28.5 28.0 20.1 20.4 15.1 15.5 11.3 11.5
Depreciation 25 0.3 0.3 0.3 0.3 0.4 0.4 0.3 0.3 0.1 0.2 50 0.7 0.7 1.0 0.9 0.8 0.8 0.7 0.8 0.5 0.5 75 1.5 1.5 2.5 2.4 1.7 1.7 1.4 1.5 1.2 1.2
Annual result 25 0.5 0.5 0.1 0.6 0.5 0.6 0.7 0.6 0.4 0.4 50 1.9 1.9 2.6 3.0 2.0 2.2 2.0 1.9 1.5 1.4 75 4.4 4.2 7.8 7.7 4.6 4.5 4.0 3.9 3.4 3.2
Percentage of the balance sheet totalTangible fixed assets 25 1.6 1.6 0.8 0.9 1.9 1.8 2.0 2.1 1.1 1.0
50 6.9 7.0 5.9 5.7 6.9 7.2 7.3 7.7 6.4 6.3 75 20.4 20.7 18.2 18.2 20.9 21.0 21.2 21.7 19.6 20.2
Inventories 25 9.4 9.4 0.6 1.5 10.4 10.4 13.9 13.6 8.9 8.8 50 28.0 28.0 18.7 19.0 30.0 30.6 31.4 30.9 24.2 24.1 75 47.0 47.3 44.8 45.8 50.3 50.6 48.1 48.5 41.5 41.5
Equity 25 14.6 16.2 4.0 7.9 14.0 15.9 18.9 19.6 15.0 15.9 50 32.6 33.7 26.7 29.0 32.4 33.8 35.0 36.3 31.2 31.5 75 53.1 55.1 56.6 59.4 55.8 57.4 54.3 56.4 47.4 49.0
Short-term liabilities 25 25.3 23.8 20.0 18.8 23.2 20.7 25.7 24.7 30.5 29.9 50 46.1 44.6 45.3 42.6 43.9 41.9 45.9 44.5 49.0 48.2 75 67.8 66.3 75.3 70.5 68.0 66.8 65.4 63.8 68.6 67.1
Liabilities to banks 25 0.0 0.0 0.0 0.0 0.0 0.0 0.0 0.0 0.0 0.0 50 3.9 3.9 1.6 2.6 6.6 6.4 6.5 6.1 0.1 0.0 75 25.6 25.4 25.5 24.7 27.9 27.7 28.0 27.4 19.4 18.5
Percentage of salesAnnual result before taxes on income 25 0.7 0.8 0.2 0.8 0.7 0.9 1.0 0.9 0.6 0.6
50 2.5 2.5 3.2 3.9 2.7 2.8 2.7 2.5 2.0 1.8 75 5.6 5.5 9.1 9.3 6.0 5.7 5.3 5.1 4.3 4.0
Annual result and depreciation 25 1.6 1.6 1.2 2.0 1.8 1.8 1.8 1.7 1.2 1.1 50 3.6 3.6 5.2 5.6 4.0 4.1 3.8 3.6 2.7 2.6 75 7.2 7.0 11.2 11.3 7.6 7.5 6.9 6.6 5.4 5.1
Trade receivables 25 4.1 3.7 2.7 2.6 4.1 3.7 4.5 4.1 4.0 3.7 50 6.9 6.5 6.2 5.8 7.0 6.4 7.1 6.7 7.0 6.6 75 11.1 10.5 11.7 11.0 11.3 10.7 10.8 10.2 10.9 10.4
Percentage of the balance sheet totalAnnual result and interest paid 25 2.7 2.7 1.7 2.6 2.7 2.9 3.3 3.0 2.5 2.3
50 6.5 6.4 7.0 8.0 6.6 6.7 6.7 6.4 5.7 5.3 75 12.6 12.5 17.3 18.1 12.7 13.1 12.4 11.7 10.8 10.5
Percentage of liabilities and provisions less cashAnnual result and depreciation 25 4.5 4.5 - 8.9 0.0 3.2 3.2 6.4 5.8 5.8 5.5
50 14.7 14.6 10.6 12.6 14.2 14.1 16.9 16.7 13.7 13.3 75 35.9 35.9 38.5 42.2 38.7 38.6 38.8 37.5 30.0 29.9
Percentage of fixed assetsLong-term equity and liabilities 25 129.6 135.0 97.6 118.6 134.0 140.8 146.8 148.6 123.5 124.5
50 294.8 307.9 283.7 328.2 321.2 349.0 315.5 314.2 245.9 249.0 75 935.9 944.8 1 071.4 1 152.3 1 017.4 1 055.6 903.5 879.8 795.5 801.5
Percentage of short-term liabilitiesCash resources and short-term receivables 25 60.2 60.4 52.2 58.0 57.7 56.2 59.5 59.9 67.5 67.6
50 104.2 106.6 111.9 116.9 102.9 106.1 103.5 104.9 103.9 104.0 75 195.9 205.3 277.6 285.5 210.1 224.2 188.4 194.8 167.3 170.7
Percentage of cost of materialsTrade payables 25 2.4 2.1 3.0 2.8 2.6 2.6 2.4 2.1 1.8 1.6
50 5.5 5.2 8.8 7.8 6.5 5.9 5.1 4.7 4.5 4.2 75 10.7 10.0 21.3 19.0 12.5 11.7 9.0 8.6 7.8 7.4

Deutsche BundesbankFinancial statement statistics (ratios - provisional data)May 2021102
I. Enterprises by economic sector
cont'd: 8.b) Wholesale trade, except of motor vehicles and motorcycles
CorporationsEnterprises with sales of ... € million
Total Less than 2 2 but less than 10 10 but less than 50 50 and moreCylindered sample 2018/2019
Ratios 2018 2019 2018 2019 2018 2019 2018 2019 2018 2019Income statementIncome Percentage of gross revenueSales 99.9 99.9 99.4 99.2 99.7 99.5 99.9 99.9 99.9 99.9Change in finished goods 0.1 0.1 0.6 0.8 0.3 0.5 0.1 0.1 0.1 0.1Interest and similar income 0.2 0.2 0.2 0.2 0.1 0.1 0.1 0.1 0.2 0.2Other income 1.9 2.1 2.8 2.4 1.8 1.9 1.5 1.5 2.0 2.2
of which: Income from long-term equity investments 0.5 0.6 0.1 0.1 0.2 0.2 0.2 0.2 0.5 0.7Total income 102.1 102.3 102.9 102.5 101.9 102.0 101.6 101.6 102.1 102.3
ExpensesCost of materials 84.0 83.7 58.3 58.5 69.6 69.2 74.9 74.6 85.4 85.0Personnel expenses 5.8 6.0 21.8 21.3 15.1 15.3 11.2 11.5 4.9 5.2Depreciation 0.8 0.8 1.8 1.7 1.4 1.4 1.2 1.2 0.7 0.7
of which: Depreciation of tangible fixed assets 0.6 0.7 1.7 1.6 1.3 1.3 1.0 1.1 0.6 0.6Interest and similar expenses 0.4 0.3 0.7 0.6 0.5 0.5 0.4 0.4 0.4 0.3Operating taxes 0.1 0.1 0.1 0.1 0.1 0.1 0.0 0.0 0.1 0.1Other expenses 8.1 8.2 16.4 15.7 11.7 11.7 10.1 10.2 7.8 7.9Total expenses before taxes on income 99.1 99.0 99.0 98.0 98.4 98.3 97.8 97.9 99.2 99.2Annual result before taxes on income 3.0 3.2 3.9 4.5 3.5 3.8 3.8 3.7 2.9 3.2Taxes on income 0.6 0.6 1.1 1.2 1.1 1.1 1.0 1.0 0.6 0.6Annual result 2.4 2.6 2.8 3.3 2.5 2.7 2.8 2.7 2.3 2.6Profit and loss transfers (parent company) 0.7 0.2 0.0 0.0 0.1 0.1 0.0 0.1 0.8 0.2Profit and loss transfers (subsidiary) 1.3 1.1 0.3 0.2 0.3 0.3 0.6 0.6 1.5 1.2Profit for the year 1.7 1.7 2.5 3.1 2.3 2.4 2.2 2.1 1.6 1.6
Balance sheetAssets Percentage of the balance sheet totalIntangible fixed assets 1.1 1.6 0.6 0.6 0.7 0.8 0.7 0.7 1.2 1.7Tangible fixed assets 8.4 8.5 15.8 15.1 14.9 15.0 13.2 13.5 7.7 7.8
of which: Land and buildings 4.1 4.2 5.7 5.2 6.6 6.5 5.9 6.1 3.9 4.0Inventories 20.0 20.0 25.8 28.6 32.7 33.7 31.0 31.2 18.4 18.4
of which: Finished goods and merchandise 16.0 16.2 21.4 21.7 27.1 27.4 27.1 27.2 14.5 14.7Cash 6.6 6.6 18.1 18.3 14.5 14.4 11.0 10.9 5.9 5.9Receivables 44.2 44.5 36.0 34.0 33.2 32.1 38.8 38.4 45.1 45.5
Short-term 42.6 43.4 35.1 33.4 32.1 31.0 37.4 36.9 43.4 44.4 of which:
Trade receivables 16.7 16.4 18.7 17.2 19.5 18.4 20.1 19.2 16.2 16.0Receivables from affiliated companies 22.6 23.5 9.5 9.5 7.1 7.4 12.5 12.9 24.1 25.1
Long-term 1.6 1.1 0.9 0.6 1.1 1.1 1.4 1.5 1.7 1.1of which: Loans to affiliated companies 1.4 0.9 0.6 0.3 0.3 0.5 0.8 1.0 1.5 0.9
Securities 3.3 2.3 0.7 0.7 0.8 0.8 0.6 0.6 3.6 2.6Other long-term equity investments 16.0 16.0 2.4 2.1 2.7 2.8 4.3 4.2 17.7 17.7
of which: Goodwill 0.2 0.3 0.8 0.6 0.5 0.4 0.5 0.5 0.2 0.2
CapitalEquity 36.5 37.2 35.6 37.3 42.7 43.3 42.2 43.3 35.8 36.4Liabilities 51.2 50.3 55.6 54.2 49.3 49.0 47.4 46.4 51.6 50.8
Short-term 45.1 43.8 43.6 43.3 39.8 39.3 40.4 39.5 45.8 44.4of which:Liabilities to banks 4.8 4.7 7.4 6.8 8.8 9.0 9.1 9.0 4.2 4.1Trade payables 11.7 11.5 15.8 15.5 13.7 12.9 11.9 11.1 11.6 11.4Liabilities to affiliated companies 22.7 21.3 9.1 8.2 8.4 8.2 12.7 12.7 24.1 22.6
Long-term 6.0 6.6 12.0 10.9 9.6 9.7 7.0 6.9 5.8 6.4 of which:
Liabilities to banks 3.0 3.1 6.2 5.7 6.1 6.0 4.4 4.6 2.8 2.8Liabilities to affiliated companies 1.8 2.1 3.5 2.9 2.4 2.5 2.0 1.8 1.8 2.1
Provisions 11.5 11.5 8.5 8.2 7.7 7.5 10.1 10.0 11.8 11.8of which: Provisions for pensions 3.6 3.8 3.2 3.2 2.6 2.6 3.5 3.7 3.7 3.8
Other ratios Percentage of salesAnnual result before taxes on income 3.0 3.2 3.9 4.5 3.6 3.8 3.8 3.7 2.9 3.2Annual result and depreciation 3.1 3.4 4.6 5.0 3.9 4.1 3.9 3.9 3.0 3.3Trade receivables 7.2 7.0 9.9 9.2 9.1 8.8 8.9 8.6 7.0 6.8
Percentage of the balance sheet totalSales 230.7 232.7 189.3 187.6 214.2 209.9 225.3 224.5 231.8 234.3Annual result and interest paid 6.3 6.9 6.6 7.4 6.4 6.7 7.1 7.0 6.2 6.8
Percentage of liabilities and provisions less cashAnnual result and depreciation 12.7 14.2 18.9 21.2 19.4 20.4 18.9 19.1 12.0 13.6
Percentage of fixed assetsLong-term equity and liabilities 156.5 164.7 252.0 273.0 275.9 276.1 266.5 266.8 146.7 155.0
Percentage of short-term liabilitiesCash resources and short-term receivables 110.3 115.1 122.4 120.0 118.0 116.3 120.8 122.0 109.1 114.4Cash resources, short-term receivables and inventories 154.5 160.9 181.5 186.0 200.2 201.9 197.6 201.0 149.3 155.9
Percentage of cost of materialsTrade payables 6.0 5.9 14.2 14.0 9.1 8.8 7.0 6.6 5.9 5.7
Memo item:Balance sheet total in € billion 227.46 231.36 0.46 0.52 4.75 4.99 22.09 22.67 200.16 203.18Sales in € billion 524.80 538.45 0.87 0.97 10.17 10.48 49.77 50.90 463.98 476.10Number of enterprises 6 547 6 547 974 974 1 918 1 918 2 130 2 130 1 525 1 525

Deutsche BundesbankFinancial statement statistics (ratios - provisional data)
May 2021103
I. Enterprises by economic sector
cont'd: 8.b) Wholesale trade, except of motor vehicles and motorcycles
cont'd: CorporationsEnterprises with sales of ... € million
Total Less than 2 2 but less than 10 10 but less than 50 50 and moreQuartile Cylindered sample 2018/2019value 2018 2019 2018 2019 2018 2019 2018 2019 2018 2019Of the enterprises captured …
Ratios ... % had a ratio of less than …Percentage of gross revenue
Cost of materials 25 62.8 62.7 42.6 41.3 60.0 60.1 67.1 66.7 74.0 73.8 50 75.0 74.8 61.2 61.4 71.7 71.5 76.5 76.3 84.2 84.1 75 85.6 85.3 74.4 73.4 81.0 80.7 85.5 85.3 92.8 92.5
Personnel expenses 25 5.1 5.2 8.9 8.8 7.9 7.9 5.4 5.5 2.3 2.4 50 10.8 11.0 18.6 18.7 13.6 14.0 10.2 10.4 5.7 5.8 75 17.8 18.2 29.4 28.8 20.8 21.0 15.3 15.7 10.9 11.2
Depreciation 25 0.2 0.2 0.3 0.3 0.3 0.3 0.3 0.3 0.1 0.1 50 0.7 0.7 0.9 0.9 0.8 0.8 0.7 0.7 0.4 0.4 75 1.5 1.5 2.3 2.3 1.6 1.6 1.3 1.4 1.1 1.2
Annual result 25 0.4 0.5 0.0 0.4 0.4 0.5 0.6 0.5 0.3 0.3 50 1.7 1.7 1.9 2.5 1.8 1.8 1.9 1.7 1.4 1.3 75 4.0 3.9 5.9 6.1 4.1 4.0 3.9 3.8 3.1 2.9
Percentage of the balance sheet totalTangible fixed assets 25 1.2 1.3 0.6 0.7 1.6 1.5 1.6 1.6 0.9 0.8
50 5.5 5.7 5.1 5.0 5.6 5.9 5.9 6.2 4.9 4.8 75 17.7 17.6 16.2 16.3 17.8 17.5 18.3 17.9 17.7 18.2
Inventories 25 8.7 8.6 0.4 0.9 10.5 10.5 13.1 12.7 7.8 7.3 50 27.4 27.5 18.9 19.4 29.4 29.7 31.2 30.7 23.7 23.5 75 47.2 47.7 45.1 47.0 49.9 50.1 48.7 49.2 41.3 41.1
Equity 25 17.3 19.6 6.1 11.0 17.8 19.8 22.6 23.7 16.5 17.8 50 36.0 37.5 30.1 31.8 37.1 38.8 38.8 40.4 32.9 34.0 75 57.2 58.8 60.0 60.4 58.4 60.8 58.7 61.0 51.4 52.4
Short-term liabilities 25 22.3 20.9 19.3 17.4 20.2 18.3 22.5 21.2 26.8 26.7 50 42.1 40.4 43.7 40.6 39.6 38.4 40.7 39.2 46.1 44.8 75 64.4 62.8 72.1 69.0 63.6 61.8 61.4 59.6 66.1 64.3
Liabilities to banks 25 0.0 0.0 0.0 0.0 0.0 0.0 0.0 0.0 0.0 0.0 50 1.8 1.7 0.3 1.0 4.2 4.2 3.5 3.5 0.0 0.0 75 22.1 21.8 21.4 20.5 24.7 24.9 24.7 24.6 15.6 15.4
Percentage of salesAnnual result before taxes on income 25 0.6 0.7 0.0 0.5 0.6 0.7 0.9 0.8 0.6 0.5
50 2.3 2.3 2.3 3.1 2.5 2.5 2.6 2.4 1.9 1.7 75 5.3 5.3 7.6 7.6 5.6 5.5 5.4 5.2 4.1 3.8
Annual result and depreciation 25 1.4 1.5 1.0 1.7 1.5 1.6 1.7 1.6 1.1 1.0 50 3.4 3.4 4.2 4.8 3.6 3.9 3.6 3.4 2.6 2.5 75 6.8 6.8 9.6 9.4 7.2 7.1 6.8 6.5 5.1 4.8
Trade receivables 25 4.1 3.7 2.9 2.9 4.2 3.7 4.4 4.1 4.1 3.8 50 7.2 6.7 6.5 6.0 7.2 6.5 7.3 6.9 7.3 7.0 75 11.7 11.0 12.2 11.5 11.6 11.0 11.3 10.8 11.9 11.3
Percentage of the balance sheet totalAnnual result and interest paid 25 2.4 2.4 1.1 2.1 2.4 2.5 2.9 2.7 2.1 2.0
50 5.8 5.6 5.8 6.7 6.0 6.0 6.2 5.8 5.2 4.6 75 11.2 11.2 14.0 14.6 10.9 11.4 11.6 10.8 9.8 9.5
Percentage of liabilities and provisions less cashAnnual result and depreciation 25 3.2 3.4 - 12.2 - 2.7 1.6 2.1 5.4 4.6 4.8 4.7
50 13.3 13.5 8.4 10.3 12.3 12.9 16.4 16.2 12.8 12.3 75 34.4 35.2 32.5 33.9 35.3 37.8 40.5 40.5 28.7 28.7
Percentage of fixed assetsLong-term equity and liabilities 25 156.1 160.9 106.6 131.2 167.9 172.0 180.2 179.9 143.7 142.9
50 356.7 375.6 316.8 373.5 396.1 422.4 387.1 397.6 296.4 292.5 75 1 145.3 1 164.9 1 210.0 1 300.0 1 227.4 1 297.3 1 103.5 1 109.0 999.3 988.6
Percentage of short-term liabilitiesCash resources and short-term receivables 25 66.6 67.1 56.5 61.4 63.1 63.5 68.4 67.4 75.5 74.4
50 115.7 120.3 121.8 124.8 114.7 120.4 117.5 121.1 114.6 116.9 75 223.5 237.1 307.7 313.2 238.1 260.2 214.0 235.0 189.9 194.8
Percentage of cost of materialsTrade payables 25 2.3 2.1 2.9 2.9 2.7 2.6 2.3 2.1 1.5 1.4
50 5.6 5.1 8.7 7.9 6.7 5.9 5.2 4.7 4.2 3.8 75 11.1 10.4 21.5 18.4 12.7 12.0 9.5 9.2 7.9 7.4

Deutsche BundesbankFinancial statement statistics (ratios - provisional data)May 2021104
I. Enterprises by economic sector
cont'd: 8.b) Wholesale trade, except of motor vehicles and motorcycles
Non-corporationsEnterprises with sales of ... € million
Total Less than 2 2 but less than 10 10 but less than 50 50 and moreCylindered sample 2018/2019
Ratios 2018 2019 2018 2019 2018 2019 2018 2019 2018 2019Income statementIncome Percentage of gross revenueSales 100.0 100.0 99.9 99.8 99.9 100.0 99.9 100.0 100.0 100.0Change in finished goods 0.0 0.0 0.1 0.2 0.1 0.0 0.1 0.0 0.0 0.0Interest and similar income 0.1 0.1 0.1 0.1 0.1 0.1 0.1 0.1 0.1 0.1Other income 0.9 0.9 2.8 2.9 2.0 1.8 1.1 1.1 0.9 0.8
of which: Income from long-term equity investments 0.3 0.2 0.4 0.5 0.1 0.1 0.2 0.2 0.3 0.2Total income 101.0 101.0 102.9 103.0 102.1 101.9 101.2 101.3 101.0 100.9
ExpensesCost of materials 87.2 87.2 58.7 57.1 70.8 70.2 75.4 75.4 88.9 88.9Personnel expenses 4.9 5.0 14.9 15.3 13.3 13.5 10.9 11.2 4.1 4.2Depreciation 0.8 0.8 2.6 2.9 1.7 1.6 1.4 1.3 0.7 0.7
of which: Depreciation of tangible fixed assets 0.7 0.7 2.5 2.7 1.5 1.5 1.2 1.2 0.6 0.6Interest and similar expenses 0.3 0.3 1.0 1.0 0.6 0.6 0.5 0.5 0.2 0.2Operating taxes 0.0 0.0 0.1 0.1 0.1 0.1 0.1 0.1 0.0 0.0Other expenses 5.5 5.5 16.3 16.4 11.3 11.7 9.2 9.4 4.9 5.0Total expenses before taxes on income 98.7 98.8 93.7 92.8 97.7 97.6 97.4 97.8 98.9 99.0Annual result before taxes on income 2.3 2.1 9.2 10.2 4.5 4.3 3.8 3.5 2.1 1.9Taxes on income 0.3 0.3 1.3 1.3 0.7 0.7 0.6 0.6 0.3 0.2Annual result 2.0 1.8 8.0 9.0 3.7 3.6 3.2 2.9 1.8 1.7Profit and loss transfers (parent company) 0.0 0.1 0.0 0.0 0.0 0.0 0.0 0.0 0.0 0.1Profit and loss transfers (subsidiary) 0.1 0.1 0.0 0.0 0.0 0.0 0.0 0.0 0.1 0.1Profit for the year 2.0 1.9 7.9 9.0 3.7 3.5 3.2 2.9 1.8 1.7
Balance sheetAssets Percentage of the balance sheet totalIntangible fixed assets 0.5 0.5 0.4 0.5 0.6 0.7 0.7 0.8 0.5 0.5Tangible fixed assets 19.4 19.7 27.4 27.0 21.2 21.9 18.9 19.6 19.4 19.6
of which: Land and buildings 13.0 12.8 11.5 11.5 10.8 11.1 10.1 10.4 13.5 13.2Inventories 19.8 19.6 25.4 28.3 34.6 34.4 33.2 33.2 17.5 17.4
of which: Finished goods and merchandise 18.5 18.0 22.7 25.0 30.7 30.2 30.4 30.5 16.6 16.0Cash 5.3 5.0 13.9 11.7 10.1 10.2 8.4 8.7 4.7 4.4Receivables 38.8 39.6 27.3 26.8 29.8 29.1 33.3 32.3 39.8 40.9
Short-term 37.4 35.7 27.2 26.7 28.8 28.2 32.3 31.3 38.4 36.5 of which:
Trade receivables 16.4 15.2 13.9 13.5 18.2 17.9 20.6 19.2 15.8 14.6Receivables from affiliated companies 13.8 14.5 7.9 7.5 6.4 6.1 6.8 7.1 15.0 15.7
Long-term 1.3 3.9 0.1 0.1 1.0 1.0 0.9 1.0 1.4 4.4of which: Loans to affiliated companies 1.1 3.7 0.0 0.0 0.4 0.4 0.6 0.7 1.2 4.2
Securities 0.5 0.4 0.2 0.3 0.2 0.2 1.8 1.5 0.4 0.2Other long-term equity investments 15.4 14.9 4.6 4.5 3.0 3.0 3.4 3.5 17.5 16.7
of which: Goodwill 0.2 0.2 0.9 0.8 0.2 0.2 0.2 0.2 0.2 0.2
CapitalEquity 31.3 30.7 18.4 23.1 26.1 26.8 27.1 28.3 32.0 31.2Liabilities 62.6 63.4 75.0 70.8 69.3 68.7 67.1 66.1 61.8 62.8
Short-term 50.5 50.6 54.1 51.8 55.1 54.4 56.6 55.5 49.6 49.8of which:Liabilities to banks 8.0 7.5 16.9 16.3 14.0 13.4 14.0 13.7 7.0 6.5Trade payables 18.5 18.5 15.1 13.4 13.0 12.4 11.5 11.1 19.6 19.7Liabilities to affiliated companies 18.2 18.3 13.0 12.0 20.3 20.8 25.3 24.7 17.2 17.4
Long-term 12.1 12.8 20.8 19.0 14.2 14.4 10.5 10.6 12.2 13.0 of which:
Liabilities to banks 9.4 10.1 14.2 13.4 9.5 9.9 6.8 7.0 9.7 10.5Liabilities to affiliated companies 2.1 2.1 4.7 3.5 3.0 2.7 3.0 2.9 2.0 2.0
Provisions 5.9 5.7 6.5 5.9 4.5 4.3 5.7 5.6 6.0 5.7of which: Provisions for pensions 1.2 1.2 0.4 0.4 0.6 0.6 1.2 1.2 1.2 1.2
Other ratios Percentage of salesAnnual result before taxes on income 2.3 2.1 9.2 10.3 4.5 4.3 3.8 3.5 2.1 1.9Annual result and depreciation 2.8 2.6 10.6 11.9 5.4 5.1 4.6 4.2 2.5 2.4Trade receivables 5.3 5.0 7.6 7.5 7.9 7.9 7.9 7.4 5.0 4.6
Percentage of the balance sheet totalSales 307.8 305.6 181.9 179.5 229.4 227.6 262.0 261.1 316.5 313.9Annual result and interest paid 7.0 6.4 16.3 17.9 9.9 9.5 9.7 8.9 6.5 6.0
Percentage of liabilities and provisions less cashAnnual result and depreciation 13.4 12.4 28.4 32.8 19.6 18.6 18.5 17.5 12.5 11.5
Percentage of fixed assetsLong-term equity and liabilities 121.1 114.2 121.5 132.5 157.4 156.6 157.7 156.7 117.2 110.0
Percentage of short-term liabilitiesCash resources and short-term receivables 85.3 80.9 76.3 74.7 70.7 70.7 73.8 73.6 87.6 82.4Cash resources, short-term receivables and inventories 124.5 119.7 123.2 129.4 133.5 134.0 132.5 133.5 122.9 117.3
Percentage of cost of materialsTrade payables 6.9 6.9 14.1 13.1 8.0 7.8 5.8 5.6 7.0 7.0
Memo item:Balance sheet total in € billion 60.42 63.11 0.12 0.13 1.46 1.50 7.03 7.14 51.81 54.34Sales in € billion 185.96 192.87 0.22 0.22 3.35 3.41 18.43 18.66 163.96 170.58Number of enterprises 2 095 2 095 226 226 592 592 778 778 499 499

Deutsche BundesbankFinancial statement statistics (ratios - provisional data)
May 2021105
I. Enterprises by economic sector
cont'd: 8.b) Wholesale trade, except of motor vehicles and motorcycles
cont'd: Non-corporationsEnterprises with sales of ... € million
Total Less than 2 2 but less than 10 10 but less than 50 50 and moreQuartile Cylindered sample 2018/2019value 2018 2019 2018 2019 2018 2019 2018 2019 2018 2019Of the enterprises captured …
Ratios ... % had a ratio of less than …Percentage of gross revenue
Cost of materials 25 66.4 66.3 39.3 37.7 62.7 61.4 69.3 69.7 73.8 73.8 50 75.4 75.3 58.3 58.3 72.5 72.7 76.1 75.7 81.5 81.4 75 83.5 83.3 71.9 72.9 80.4 79.8 82.6 82.5 91.4 91.6
Personnel expenses 25 5.1 5.3 3.7 4.2 7.0 7.0 6.3 6.3 2.5 2.5 50 10.3 10.5 12.1 11.1 12.0 12.4 10.5 10.6 7.0 7.3 75 15.2 15.7 22.6 22.9 17.9 18.3 14.7 15.0 11.7 12.1
Depreciation 25 0.4 0.4 0.6 0.6 0.5 0.5 0.5 0.4 0.2 0.2 50 1.0 0.9 1.3 1.5 1.1 1.0 1.0 1.0 0.7 0.7 75 1.7 1.7 3.6 3.2 1.9 2.0 1.6 1.6 1.3 1.3
Annual result 25 1.0 0.9 2.3 2.9 1.2 1.1 1.0 0.9 0.7 0.6 50 2.7 2.6 6.9 8.1 3.0 3.0 2.4 2.2 2.0 1.8 75 5.6 5.4 14.9 14.5 6.3 5.7 4.4 4.1 4.3 4.2
Percentage of the balance sheet totalTangible fixed assets 25 3.6 3.4 2.0 1.8 3.9 3.7 4.1 4.0 3.3 2.8
50 12.5 12.4 10.5 9.2 13.3 13.0 13.4 13.3 10.1 10.4 75 29.1 29.7 31.4 31.9 30.5 31.6 30.1 29.9 25.8 26.0
Inventories 25 11.4 11.8 2.0 1.9 10.3 9.8 15.6 16.1 12.5 12.7 50 29.4 29.4 17.6 18.0 33.1 32.6 31.7 31.2 26.0 25.8 75 46.6 46.7 40.9 40.8 52.4 52.0 46.9 46.9 43.0 42.6
Equity 25 8.7 9.7 0.4 2.2 6.6 8.0 11.1 12.1 11.5 11.7 50 22.5 23.7 14.7 19.4 18.9 20.2 25.1 25.9 25.9 26.5 75 40.0 41.4 40.6 48.5 38.3 41.1 40.6 42.2 39.8 39.8
Short-term liabilities 25 38.7 37.0 23.9 25.0 36.2 34.4 41.2 39.0 43.0 42.1 50 56.7 55.5 51.5 50.1 57.8 56.1 56.5 55.1 56.8 57.4 75 76.4 74.3 84.8 78.9 77.8 77.0 73.4 71.7 76.1 74.3
Liabilities to banks 25 0.0 0.0 0.0 0.0 0.0 0.0 0.0 0.0 0.0 0.0 50 13.5 12.1 14.9 13.7 15.7 14.3 15.1 14.8 8.7 8.8 75 34.8 34.1 46.4 44.9 39.3 37.5 35.2 34.1 26.8 26.0
Percentage of salesAnnual result before taxes on income 25 1.2 1.2 2.6 3.2 1.5 1.4 1.3 1.1 0.9 0.8
50 3.2 3.0 8.1 9.2 3.6 3.6 2.9 2.7 2.4 2.2 75 6.6 6.2 16.5 16.5 7.3 6.6 5.1 4.8 5.1 4.8
Annual result and depreciation 25 2.2 2.2 4.7 5.1 2.8 2.6 2.3 2.2 1.6 1.5 50 4.5 4.3 10.6 11.3 5.1 5.0 4.2 3.9 3.3 3.1 75 8.2 7.9 19.5 19.1 9.0 8.5 7.0 6.6 6.3 6.1
Trade receivables 25 3.9 3.6 2.2 1.6 3.9 3.5 4.5 4.2 3.5 3.5 50 6.4 6.0 4.8 4.4 6.5 6.1 6.7 6.3 6.2 5.8 75 9.5 9.0 9.3 8.9 9.8 9.6 9.7 8.9 9.0 8.5
Percentage of the balance sheet totalAnnual result and interest paid 25 4.4 4.3 5.7 6.9 4.5 4.4 4.5 4.1 4.1 3.7
50 9.0 8.8 17.6 19.9 9.6 9.7 8.6 8.3 7.6 7.3 75 17.6 17.0 34.7 39.7 20.2 18.3 14.9 13.7 13.3 13.2
Percentage of liabilities and provisions less cashAnnual result and depreciation 25 8.3 8.0 3.7 8.2 8.8 6.8 8.8 8.7 8.3 8.0
50 17.8 18.3 22.3 29.7 19.3 18.9 17.6 17.6 15.9 15.5 75 39.8 37.6 64.4 74.4 46.4 39.5 35.5 33.5 34.0 33.2
Percentage of fixed assetsLong-term equity and liabilities 25 92.1 93.4 53.9 75.6 86.2 92.9 96.7 94.4 96.8 96.0
50 171.7 175.6 166.4 200.0 174.6 177.5 178.0 177.7 161.4 166.1 75 458.9 452.3 626.2 630.3 458.9 467.5 467.4 428.3 385.0 389.9
Percentage of short-term liabilitiesCash resources and short-term receivables 25 48.1 48.1 39.4 37.9 41.7 42.7 48.5 48.1 58.8 55.5
50 76.8 76.8 92.1 90.1 71.6 71.3 74.1 75.7 80.0 81.9 75 117.8 122.1 176.7 177.7 121.1 138.3 116.2 120.0 111.1 112.6
Percentage of cost of materialsTrade payables 25 2.7 2.3 3.3 2.1 2.6 2.5 2.5 2.1 2.7 2.6
50 5.4 5.2 9.1 7.3 6.0 5.8 4.9 4.6 5.2 5.2 75 9.3 8.7 21.2 20.1 11.7 10.8 8.1 7.5 7.6 7.5

Deutsche BundesbankFinancial statement statistics (ratios - provisional data)May 2021106
I. Enterprises by economic sector
8.c) Retail trade, except of motor vehicles and motorcycles
All legal formsEnterprises with sales of ... € million
Total Less than 2 2 but less than 10 10 but less than 50 50 and moreCylindered sample 2018/2019
Ratios 2018 2019 2018 2019 2018 2019 2018 2019 2018 2019Income statementIncome Percentage of gross revenueSales 99.9 100.0 99.5 99.7 99.8 99.9 99.9 100.0 100.0 100.0Change in finished goods 0.1 0.0 0.5 0.3 0.2 0.1 0.1 0.0 0.0 0.0Interest and similar income 0.1 0.1 0.1 0.1 0.1 0.1 0.1 0.1 0.1 0.1Other income 1.2 1.2 1.9 1.9 1.5 1.5 1.0 1.1 1.2 1.2
of which: Income from long-term equity investments 0.2 0.2 0.0 0.0 0.1 0.0 0.1 0.1 0.2 0.3Total income 101.3 101.3 102.0 102.0 101.6 101.5 101.1 101.2 101.3 101.3
ExpensesCost of materials 70.4 70.1 57.4 56.8 62.3 62.2 66.4 66.3 70.9 70.7Personnel expenses 11.3 11.3 20.2 19.9 17.8 17.7 14.4 14.2 10.8 10.8Depreciation 1.4 1.4 2.0 1.9 1.7 1.6 1.4 1.4 1.4 1.4
of which: Depreciation of tangible fixed assets 1.4 1.4 1.9 1.8 1.6 1.6 1.3 1.4 1.3 1.4Interest and similar expenses 0.3 0.3 0.7 0.6 0.5 0.5 0.3 0.3 0.3 0.3Operating taxes 0.0 0.0 0.1 0.1 0.1 0.1 0.0 0.0 0.0 0.0Other expenses 16.1 16.5 17.4 17.4 15.5 15.4 15.2 15.8 16.1 16.6Total expenses before taxes on income 99.4 99.6 97.7 96.7 97.8 97.4 97.8 98.1 99.6 99.8Annual result before taxes on income 1.9 1.7 4.3 5.3 3.8 4.1 3.3 3.1 1.7 1.5Taxes on income 0.5 0.4 0.9 1.0 0.9 0.9 0.7 0.6 0.5 0.4Annual result 1.4 1.3 3.4 4.3 2.9 3.2 2.6 2.5 1.3 1.1Profit and loss transfers (parent company) 0.3 0.2 0.0 0.0 0.0 0.0 0.0 0.0 0.3 0.2Profit and loss transfers (subsidiary) 0.5 0.3 0.0 0.0 0.1 0.1 1.1 1.0 0.5 0.3Profit for the year 1.2 1.1 3.4 4.3 2.9 3.1 1.5 1.5 1.1 1.0
Balance sheetAssets Percentage of the balance sheet totalIntangible fixed assets 1.5 1.4 0.8 0.8 0.7 0.6 0.8 0.7 1.6 1.5Tangible fixed assets 25.9 26.3 20.1 18.8 21.3 20.8 19.6 19.3 26.7 27.1
of which: Land and buildings 12.7 13.7 7.3 6.6 9.4 9.0 10.0 10.0 13.1 14.2Inventories 25.9 25.7 38.0 37.7 37.7 37.5 33.9 34.2 24.8 24.5
of which: Finished goods and merchandise 25.3 25.0 33.8 33.3 34.2 34.1 32.4 32.6 24.3 24.0Cash 9.6 9.5 13.0 14.3 12.1 12.1 10.0 10.2 9.4 9.3Receivables 25.6 25.5 25.1 25.8 24.3 24.6 31.5 31.0 25.1 25.0
Short-term 23.1 22.2 24.6 25.1 23.5 24.0 30.5 29.8 22.4 21.4 of which:
Trade receivables 6.2 5.2 13.1 13.6 11.6 11.7 10.8 9.9 5.6 4.6Receivables from affiliated companies 11.2 11.5 4.7 4.4 5.4 5.8 10.6 11.3 11.5 11.8
Long-term 2.5 3.4 0.5 0.7 0.8 0.7 1.0 1.2 2.7 3.6of which: Loans to affiliated companies 1.6 2.5 0.0 0.0 0.3 0.3 0.6 0.7 1.7 2.7
Securities 0.8 0.4 0.5 0.5 0.4 0.5 0.8 0.8 0.9 0.3Other long-term equity investments 10.1 10.6 1.8 1.4 3.0 3.4 2.9 3.4 11.0 11.6
of which: Goodwill 0.6 0.5 1.3 1.0 1.6 1.5 0.6 0.9 0.5 0.4
CapitalEquity 29.2 30.2 22.8 25.5 29.8 31.2 29.5 29.6 29.2 30.2Liabilities 59.8 58.8 70.1 67.2 62.9 61.4 60.5 60.6 59.6 58.5
Short-term 50.3 49.9 49.6 47.9 45.0 45.9 51.8 52.7 50.3 49.8of which:Liabilities to banks 2.9 3.1 11.2 10.6 9.9 10.4 5.8 6.8 2.4 2.5Trade payables 19.2 18.8 18.2 16.6 16.6 16.0 23.8 21.7 18.9 18.7Liabilities to affiliated companies 20.9 19.2 6.1 6.5 9.0 9.6 15.2 16.9 21.9 19.7
Long-term 9.5 8.9 20.5 19.3 17.9 15.5 8.7 7.9 9.3 8.8 of which:
Liabilities to banks 5.5 5.5 12.5 11.6 12.7 11.4 6.3 6.1 5.2 5.2Liabilities to affiliated companies 1.6 1.5 5.0 5.0 3.1 2.1 1.8 1.2 1.6 1.5
Provisions 10.0 10.0 6.4 6.6 6.4 6.4 7.0 7.1 10.4 10.4of which: Provisions for pensions 2.1 2.1 1.1 1.1 1.5 1.4 1.3 1.4 2.2 2.2
Other ratios Percentage of salesAnnual result before taxes on income 1.9 1.7 4.3 5.3 3.8 4.1 3.3 3.1 1.7 1.5Annual result and depreciation 2.8 2.7 5.4 6.2 4.6 4.8 4.0 3.9 2.7 2.5Trade receivables 2.1 1.8 5.5 5.6 4.5 4.6 4.2 3.8 1.8 1.5
Percentage of the balance sheet totalSales 299.7 291.2 239.1 244.7 254.5 256.5 257.2 260.3 305.4 295.3Annual result and interest paid 5.1 4.4 9.8 12.0 8.7 9.4 7.5 7.3 4.7 4.0
Percentage of liabilities and provisions less cashAnnual result and depreciation 13.9 13.0 20.2 25.2 20.2 21.8 17.0 16.9 13.4 12.3
Percentage of fixed assetsLong-term equity and liabilities 101.7 98.5 188.3 208.0 188.1 186.7 159.5 154.4 96.6 93.7
Percentage of short-term liabilitiesCash resources and short-term receivables 66.4 63.9 76.2 82.6 79.3 78.7 79.0 76.5 64.8 62.2Cash resources, short-term receivables and inventories 118.0 115.5 152.7 161.2 163.0 160.4 144.5 141.3 114.0 111.5
Percentage of cost of materialsTrade payables 9.1 9.2 13.2 11.9 10.4 10.0 13.9 12.6 8.7 8.9
Memo item:Balance sheet total in € billion 78.82 84.71 0.39 0.42 2.05 2.19 6.69 6.96 69.69 75.14Sales in € billion 236.20 246.65 0.92 1.02 5.22 5.63 17.21 18.11 212.85 221.90Number of enterprises 3 335 3 335 1 052 1 052 1 107 1 107 736 736 440 440

Deutsche BundesbankFinancial statement statistics (ratios - provisional data)
May 2021107
I. Enterprises by economic sector
cont'd: 8.c) Retail trade, except of motor vehicles and motorcycles
cont'd: All legal formsEnterprises with sales of ... € million
Total Less than 2 2 but less than 10 10 but less than 50 50 and moreQuartile Cylindered sample 2018/2019value 2018 2019 2018 2019 2018 2019 2018 2019 2018 2019Of the enterprises captured …
Ratios ... % had a ratio of less than …Percentage of gross revenue
Cost of materials 25 49.9 49.8 43.2 41.7 52.0 51.6 53.6 53.6 55.1 55.4 50 62.5 62.4 55.9 55.4 63.1 62.7 72.2 71.6 71.0 71.4 75 75.5 75.7 68.7 68.1 74.6 74.9 77.1 77.1 79.0 78.2
Personnel expenses 25 9.3 9.3 10.3 11.0 10.8 11.1 8.6 8.2 8.0 8.1 50 14.9 15.0 17.9 18.0 15.8 15.9 11.6 11.8 12.2 12.5 75 23.0 23.1 27.9 28.0 23.2 23.5 19.2 19.6 17.3 17.1
Depreciation 25 0.5 0.5 0.5 0.5 0.5 0.5 0.5 0.5 0.7 0.7 50 1.1 1.1 1.3 1.2 1.2 1.1 0.8 0.8 1.2 1.3 75 2.1 2.1 2.5 2.4 2.1 2.0 1.7 1.9 1.9 1.9
Annual result 25 0.5 0.7 0.3 0.8 0.7 1.0 0.7 0.7 0.0 0.1 50 2.3 2.5 3.0 3.6 2.6 2.7 2.2 2.2 1.1 1.1 75 5.2 5.4 7.5 8.3 5.4 5.5 4.5 4.2 2.8 2.6
Percentage of the balance sheet totalTangible fixed assets 25 4.0 3.6 2.5 2.0 4.6 3.9 4.8 4.5 8.2 7.4
50 10.9 10.2 8.8 8.5 10.8 10.0 9.9 9.1 22.0 20.8 75 26.6 25.5 24.5 23.6 24.8 23.6 21.9 21.6 36.1 37.2
Inventories 25 16.1 16.2 11.6 11.7 17.3 17.5 22.2 21.7 17.7 16.4 50 32.5 33.3 30.6 30.6 33.2 34.3 35.1 36.9 27.4 27.7 75 52.0 52.8 56.5 56.7 55.8 56.8 46.3 48.5 42.2 41.6
Equity 25 4.3 6.9 - 2.2 3.6 6.6 8.7 4.8 5.1 7.3 14.1 50 23.4 25.7 21.3 24.0 25.7 27.3 21.2 21.3 24.4 28.3 75 46.8 49.2 49.2 52.7 46.0 49.5 44.3 45.3 46.6 49.4
Short-term liabilities 25 28.0 26.7 24.7 22.2 27.4 26.8 32.3 32.9 31.1 28.9 50 50.3 49.6 48.6 44.8 47.2 47.9 56.6 57.7 52.9 51.2 75 75.9 73.0 75.5 70.6 69.4 68.4 79.9 80.5 80.8 70.7
Liabilities to banks 25 0.0 0.0 0.0 0.0 0.0 0.0 0.0 0.0 0.0 0.0 50 5.5 5.4 9.8 9.5 12.0 12.1 0.0 0.0 0.0 0.0 75 29.4 27.7 34.7 34.3 35.4 33.9 19.3 20.5 9.2 9.4
Percentage of salesAnnual result before taxes on income 25 0.7 0.9 0.4 1.0 1.0 1.3 0.9 1.1 0.1 0.2
50 3.0 3.2 3.6 4.4 3.2 3.5 2.9 3.0 1.5 1.6 75 6.3 6.5 8.8 9.6 6.6 6.7 5.4 5.0 3.6 3.4
Annual result and depreciation 25 1.9 2.1 1.9 2.5 2.2 2.5 2.2 2.0 1.1 1.2 50 4.4 4.6 5.2 6.0 4.8 5.0 4.2 4.2 2.9 3.0 75 8.0 8.2 11.2 12.1 8.1 8.1 6.7 6.5 5.3 5.2
Trade receivables 25 0.4 0.5 0.3 0.3 0.6 0.6 1.1 1.1 0.1 0.1 50 2.8 2.5 3.0 2.7 3.1 3.1 3.3 2.6 0.8 0.8 75 6.3 6.2 7.2 7.4 7.1 7.0 5.7 4.9 3.4 3.3
Percentage of the balance sheet totalAnnual result and interest paid 25 2.8 3.1 2.3 3.2 3.6 3.9 3.1 3.0 0.5 0.9
50 7.9 8.6 9.7 12.1 8.7 9.4 7.5 7.4 4.7 5.0 75 16.4 17.6 24.1 27.6 17.1 17.7 14.4 14.3 9.9 9.5
Percentage of liabilities and provisions less cashAnnual result and depreciation 25 4.9 6.1 - 0.4 2.0 6.7 7.1 7.9 8.0 4.7 6.2
50 17.1 18.3 15.5 19.3 19.2 19.7 17.6 17.7 15.2 16.4 75 39.8 43.6 46.3 58.3 42.1 43.1 32.8 35.1 28.9 31.0
Percentage of fixed assetsLong-term equity and liabilities 25 82.1 89.4 80.1 103.7 111.8 109.4 63.8 54.5 41.6 59.7
50 183.1 196.3 215.2 266.7 225.2 231.8 145.3 153.0 129.1 128.9 75 507.4 553.9 700.0 817.7 570.7 629.4 388.1 378.6 223.4 242.5
Percentage of short-term liabilitiesCash resources and short-term receivables 25 40.5 42.0 36.4 38.8 40.0 39.4 50.5 48.8 37.8 41.0
50 76.1 78.1 80.0 88.6 79.0 80.1 73.9 71.8 66.2 72.5 75 141.9 150.4 166.7 195.8 143.5 147.5 114.0 120.6 118.6 127.8
Percentage of cost of materialsTrade payables 25 4.4 4.2 4.0 3.6 4.9 4.6 5.0 4.7 3.5 3.3
50 8.9 8.5 8.7 7.9 8.7 8.5 10.3 10.1 7.9 7.9 75 15.6 14.6 17.6 15.3 13.9 13.0 21.1 18.7 12.2 12.2

Deutsche BundesbankFinancial statement statistics (ratios - provisional data)May 2021108
I. Enterprises by economic sector
cont'd: 8.c) Retail trade, except of motor vehicles and motorcycles
CorporationsEnterprises with sales of ... € million
Total Less than 2 2 but less than 10 10 but less than 50 50 and moreCylindered sample 2018/2019
Ratios 2018 2019 2018 2019 2018 2019 2018 2019 2018 2019Income statementIncome Percentage of gross revenueSales 99.9 99.9 99.3 99.6 99.6 99.9 99.9 99.9 100.0 99.9Change in finished goods 0.1 0.1 0.7 0.4 0.4 0.1 0.1 0.1 0.0 0.1Interest and similar income 0.1 0.1 0.1 0.1 0.1 0.1 0.1 0.1 0.1 0.1Other income 1.0 1.1 2.0 2.0 1.8 1.8 0.9 1.1 1.0 1.0
of which: Income from long-term equity investments 0.1 0.2 0.0 0.0 0.1 0.1 0.1 0.1 0.1 0.2Total income 101.1 101.1 102.1 102.1 101.9 101.9 101.0 101.1 101.1 101.1
ExpensesCost of materials 71.2 71.1 54.9 54.5 59.7 59.4 67.7 67.6 72.0 71.9Personnel expenses 10.3 10.2 23.1 22.5 19.4 19.3 13.4 13.1 9.6 9.5Depreciation 1.5 1.5 2.0 2.0 1.7 1.7 1.3 1.3 1.5 1.5
of which: Depreciation of tangible fixed assets 1.4 1.4 1.9 1.9 1.6 1.6 1.2 1.2 1.5 1.4Interest and similar expenses 0.2 0.2 0.7 0.6 0.5 0.5 0.2 0.2 0.2 0.2Operating taxes 0.0 0.0 0.1 0.1 0.1 0.1 0.0 0.0 0.0 0.0Other expenses 16.1 16.7 18.9 18.8 17.7 17.7 15.2 15.9 16.2 16.7Total expenses before taxes on income 99.4 99.7 99.7 98.5 99.1 98.6 97.9 98.2 99.6 99.9Annual result before taxes on income 1.7 1.5 2.4 3.6 2.8 3.3 3.1 2.9 1.4 1.2Taxes on income 0.6 0.5 0.8 1.0 1.0 1.0 0.7 0.6 0.5 0.4Annual result 1.1 1.0 1.6 2.6 1.9 2.3 2.5 2.3 0.9 0.8Profit and loss transfers (parent company) 0.2 0.0 0.0 0.0 0.0 0.0 0.0 0.0 0.2 0.0Profit and loss transfers (subsidiary) 0.7 0.3 0.0 0.0 0.1 0.2 1.4 1.4 0.6 0.2Profit for the year 0.6 0.6 1.6 2.6 1.8 2.1 1.0 0.9 0.6 0.6
Balance sheetAssets Percentage of the balance sheet totalIntangible fixed assets 1.4 1.4 1.0 1.0 1.1 0.8 0.9 0.8 1.5 1.4Tangible fixed assets 29.7 30.4 16.8 15.7 18.5 17.9 15.7 15.5 32.0 32.7
of which: Land and buildings 17.5 18.6 4.1 3.7 5.9 5.7 6.6 7.0 19.4 20.6Inventories 25.4 25.3 39.5 38.6 36.1 35.9 34.9 35.5 23.7 23.6
of which: Finished goods and merchandise 24.7 24.5 34.4 33.3 31.9 31.7 33.5 34.0 23.2 23.1Cash 10.5 10.3 13.5 15.4 14.8 14.5 9.6 9.8 10.4 10.2Receivables 24.7 24.0 26.2 26.7 26.4 26.5 35.4 34.8 23.2 22.6
Short-term 22.9 21.0 25.6 25.8 25.2 25.6 34.4 33.7 21.3 19.3 of which:
Trade receivables 7.9 6.0 13.9 14.5 12.3 12.4 11.6 10.5 7.3 5.2Receivables from affiliated companies 8.8 9.3 4.7 4.3 5.7 6.2 12.2 13.1 8.5 8.9
Long-term 1.8 3.1 0.6 0.9 1.1 0.9 0.9 1.2 1.9 3.4of which: Loans to affiliated companies 1.1 2.5 0.1 0.0 0.5 0.5 0.6 0.7 1.2 2.8
Securities 1.5 0.6 0.7 0.7 0.6 0.7 1.0 0.9 1.6 0.6Other long-term equity investments 6.3 7.5 1.6 1.3 2.0 2.9 2.0 2.3 7.1 8.3
of which: Goodwill 0.6 0.5 1.1 0.9 0.6 0.6 0.5 0.8 0.6 0.5
CapitalEquity 35.1 34.8 25.7 28.4 35.5 37.2 30.2 30.6 35.8 35.3Liabilities 54.0 54.3 67.3 64.3 55.6 54.0 58.5 58.1 53.2 53.8
Short-term 46.3 46.4 49.5 46.8 41.4 41.7 52.2 52.6 45.7 45.8of which:Liabilities to banks 3.1 2.6 9.7 8.8 8.1 8.5 4.4 5.6 2.7 2.0Trade payables 19.1 18.5 17.8 15.8 15.8 14.9 28.3 25.6 18.1 17.8Liabilities to affiliated companies 16.7 15.3 7.2 7.4 6.9 7.6 12.9 14.5 17.6 15.7
Long-term 7.7 7.9 17.8 17.4 14.2 12.3 6.3 5.6 7.6 8.0 of which:
Liabilities to banks 4.7 5.5 8.9 8.2 8.9 7.8 4.2 3.9 4.6 5.6Liabilities to affiliated companies 2.1 2.0 5.5 6.0 2.8 1.9 1.5 0.9 2.2 2.1
Provisions 9.8 9.8 6.6 6.9 7.8 7.6 7.5 7.7 10.1 10.2of which: Provisions for pensions 1.8 1.9 1.6 1.6 2.2 2.0 1.5 1.6 1.8 1.9
Other ratios Percentage of salesAnnual result before taxes on income 1.7 1.5 2.4 3.6 2.8 3.3 3.1 2.9 1.4 1.2Annual result and depreciation 2.6 2.5 3.6 4.6 3.6 4.0 3.7 3.6 2.5 2.3Trade receivables 2.7 2.1 6.3 6.4 5.1 5.1 4.3 3.8 2.5 1.8
Percentage of the balance sheet totalSales 289.6 282.6 220.2 226.1 243.8 243.5 267.1 273.2 294.5 285.4Annual result and interest paid 3.9 3.4 5.0 7.3 5.7 6.6 7.2 6.9 3.4 2.9
Percentage of liabilities and provisions less cashAnnual result and depreciation 14.0 12.8 13.1 18.5 17.6 20.1 16.5 16.4 13.5 12.0
Percentage of fixed assetsLong-term equity and liabilities 113.1 105.0 219.9 244.5 223.9 223.0 187.8 184.7 106.2 98.3
Percentage of short-term liabilitiesCash resources and short-term receivables 74.8 68.3 79.2 88.2 97.0 96.7 85.1 83.1 72.6 65.2Cash resources, short-term receivables and inventories 129.6 122.8 159.0 170.5 184.2 182.9 152.2 150.6 124.4 116.8
Percentage of cost of materialsTrade payables 9.3 9.2 14.6 12.8 10.8 10.3 15.6 13.9 8.5 8.6
Memo item:Balance sheet total in € billion 43.73 47.49 0.26 0.29 1.22 1.32 4.85 5.00 37.41 40.89Sales in € billion 126.64 134.23 0.58 0.65 2.96 3.21 12.95 13.65 110.15 116.72Number of enterprises 2 109 2 109 674 674 627 627 546 546 262 262

Deutsche BundesbankFinancial statement statistics (ratios - provisional data)
May 2021109
I. Enterprises by economic sector
cont'd: 8.c) Retail trade, except of motor vehicles and motorcycles
cont'd: CorporationsEnterprises with sales of ... € million
Total Less than 2 2 but less than 10 10 but less than 50 50 and moreQuartile Cylindered sample 2018/2019value 2018 2019 2018 2019 2018 2019 2018 2019 2018 2019Of the enterprises captured …
Ratios ... % had a ratio of less than …Percentage of gross revenue
Cost of materials 25 48.1 47.8 39.7 39.6 49.3 48.7 55.0 54.7 54.2 54.3 50 61.3 61.3 53.3 53.3 59.9 59.9 74.5 74.4 70.1 69.6 75 75.1 75.2 65.8 65.4 71.7 72.1 77.2 77.2 77.3 77.1
Personnel expenses 25 9.4 9.0 13.0 13.4 11.8 11.9 8.5 8.1 7.0 7.1 50 16.0 16.2 21.4 21.8 18.3 18.4 10.3 9.9 12.7 12.9 75 24.9 25.2 32.4 31.5 26.1 27.2 17.8 17.5 17.5 17.5
Depreciation 25 0.5 0.5 0.4 0.4 0.5 0.5 0.5 0.4 0.5 0.6 50 1.0 1.0 1.3 1.2 1.1 1.1 0.7 0.7 1.2 1.2 75 2.0 2.0 2.4 2.3 2.0 2.0 1.5 1.6 2.0 2.1
Annual result 25 0.2 0.4 - 0.2 0.3 0.3 0.5 0.6 0.6 0.0 0.2 50 1.7 1.9 1.8 2.4 1.5 1.8 2.0 2.0 1.3 1.2 75 4.2 4.2 4.9 5.7 4.0 4.1 4.4 3.9 3.0 3.0
Percentage of the balance sheet totalTangible fixed assets 25 3.2 3.0 1.8 1.7 3.5 3.3 4.5 4.2 4.5 4.6
50 8.9 8.5 7.6 7.3 8.9 8.3 8.5 8.1 14.3 14.8 75 21.5 20.8 20.7 19.5 21.4 20.8 17.6 16.0 31.8 31.4
Inventories 25 14.9 14.8 9.3 8.6 16.2 16.6 25.0 24.4 12.9 13.4 50 33.2 34.5 30.7 29.8 34.5 35.8 35.8 38.0 26.7 27.2 75 52.1 52.4 58.3 58.7 55.0 56.2 45.8 48.4 42.9 42.4
Equity 25 6.9 8.5 1.8 7.2 12.6 13.8 3.4 4.1 13.0 14.8 50 27.2 29.2 24.8 27.6 31.2 33.3 20.6 20.1 32.1 34.5 75 52.2 53.8 52.1 54.8 54.2 56.7 44.9 47.8 55.1 55.4
Short-term liabilities 25 25.4 24.4 22.5 21.7 24.4 23.1 31.1 30.6 26.5 24.7 50 47.0 45.8 47.3 42.2 43.3 42.9 59.0 59.5 43.0 44.1 75 75.1 71.8 75.0 67.6 64.8 63.3 80.8 81.6 67.7 67.2
Liabilities to banks 25 0.0 0.0 0.0 0.0 0.0 0.0 0.0 0.0 0.0 0.0 50 1.4 1.5 4.3 4.7 6.7 5.6 0.0 0.0 0.0 0.0 75 21.6 20.3 28.1 23.8 26.7 24.6 11.1 12.7 12.2 10.5
Percentage of salesAnnual result before taxes on income 25 0.3 0.6 - 0.2 0.3 0.4 0.7 0.9 0.9 0.1 0.3
50 2.3 2.6 2.2 2.9 2.2 2.5 2.8 2.8 1.7 1.7 75 5.1 5.3 6.1 7.0 5.4 5.4 5.1 4.7 4.1 3.8
Annual result and depreciation 25 1.4 1.8 0.9 1.7 1.5 1.8 1.9 1.8 1.1 1.4 50 3.6 4.0 3.8 4.7 3.6 3.9 3.9 3.9 3.1 3.2 75 6.9 6.9 8.1 9.3 7.3 7.0 6.2 5.9 5.7 5.4
Trade receivables 25 0.7 0.8 0.6 0.6 0.7 0.6 1.8 1.5 0.2 0.3 50 3.2 2.9 3.4 3.4 3.1 3.1 3.7 2.8 1.8 1.6 75 6.7 6.5 8.2 8.6 7.5 7.6 5.7 4.8 4.6 3.9
Percentage of the balance sheet totalAnnual result and interest paid 25 1.9 2.4 0.7 1.9 2.4 2.8 2.9 2.7 0.4 1.3
50 5.8 6.8 5.7 7.4 5.5 6.5 6.9 6.9 4.3 5.1 75 12.5 13.4 13.0 17.1 11.6 11.8 13.8 13.5 10.2 9.7
Percentage of liabilities and provisions less cashAnnual result and depreciation 25 1.8 3.6 - 7.1 - 4.0 2.3 3.7 7.0 7.3 3.9 6.8
50 13.6 15.4 8.7 11.7 13.5 15.7 16.5 17.2 15.5 17.1 75 32.4 37.8 28.5 39.4 39.1 39.9 28.6 31.4 33.0 37.4
Percentage of fixed assetsLong-term equity and liabilities 25 96.9 104.9 100.0 129.1 139.5 147.4 43.0 39.9 90.5 87.0
50 219.1 237.2 275.2 329.1 281.0 308.2 156.7 164.0 169.9 165.1 75 592.9 664.6 800.0 946.7 676.6 792.2 415.5 409.7 294.0 348.4
Percentage of short-term liabilitiesCash resources and short-term receivables 25 47.5 49.7 38.3 43.1 47.9 48.7 56.2 55.9 46.8 49.3
50 83.7 87.1 90.9 100.9 95.0 95.9 75.0 74.0 83.2 86.9 75 162.5 177.0 182.2 226.6 189.5 178.7 122.0 136.0 151.9 155.8
Percentage of cost of materialsTrade payables 25 4.3 4.0 3.8 3.4 4.7 4.3 5.7 5.2 2.7 2.4
50 9.1 8.5 8.6 7.7 8.6 8.3 12.6 12.1 6.8 6.3 75 19.0 17.0 20.0 16.6 15.1 14.6 22.1 19.3 13.4 12.7

Deutsche BundesbankFinancial statement statistics (ratios - provisional data)May 2021110
I. Enterprises by economic sector
cont'd: 8.c) Retail trade, except of motor vehicles and motorcycles
Non-corporationsEnterprises with sales of ... € million
Total Less than 2 2 but less than 10 10 but less than 50 50 and moreCylindered sample 2018/2019
Ratios 2018 2019 2018 2019 2018 2019 2018 2019 2018 2019Income statementIncome Percentage of gross revenueSales 100.0 100.0 99.9 99.8 99.9 100.0 99.9 100.0 100.0 100.0Change in finished goods 0.0 0.0 0.1 0.2 0.1 0.0 0.1 0.0 0.0 0.0Interest and similar income 0.2 0.2 0.0 0.0 0.0 0.0 0.1 0.1 0.2 0.2Other income 1.4 1.4 1.8 1.8 1.2 1.0 1.3 1.4 1.5 1.4
of which: Income from long-term equity investments 0.2 0.3 0.0 0.0 0.0 0.0 0.3 0.3 0.2 0.3Total income 101.6 101.6 101.8 101.8 101.2 101.0 101.3 101.5 101.6 101.6
ExpensesCost of materials 69.4 69.0 61.5 60.9 65.7 65.9 62.5 62.4 69.8 69.4Personnel expenses 12.4 12.5 15.5 15.4 15.7 15.5 17.4 17.4 12.1 12.2Depreciation 1.3 1.3 1.9 1.7 1.6 1.5 1.8 1.8 1.3 1.3
of which: Depreciation of tangible fixed assets 1.3 1.3 1.8 1.7 1.6 1.5 1.7 1.8 1.2 1.3Interest and similar expenses 0.3 0.3 0.6 0.6 0.5 0.5 0.6 0.6 0.3 0.3Operating taxes 0.0 0.0 0.1 0.1 0.1 0.0 0.1 0.1 0.0 0.0Other expenses 16.0 16.4 15.0 15.0 12.6 12.4 15.3 15.4 16.1 16.5Total expenses before taxes on income 99.4 99.6 94.4 93.6 96.1 95.9 97.6 97.7 99.6 99.7Annual result before taxes on income 2.2 2.0 7.4 8.2 5.1 5.2 3.8 3.8 2.1 1.8Taxes on income 0.4 0.4 0.9 1.0 0.8 0.8 0.7 0.7 0.4 0.4Annual result 1.8 1.6 6.5 7.2 4.3 4.4 3.1 3.1 1.6 1.4Profit and loss transfers (parent company) 0.3 0.4 0.0 0.0 0.0 0.0 0.0 0.0 0.4 0.4Profit and loss transfers (subsidiary) 0.3 0.4 0.0 0.0 0.1 0.0 0.0 0.0 0.4 0.4Profit for the year 1.8 1.6 6.5 7.2 4.3 4.4 3.0 3.1 1.6 1.4
Balance sheetAssets Percentage of the balance sheet totalIntangible fixed assets 1.7 1.5 0.3 0.4 0.3 0.3 0.5 0.6 1.8 1.6Tangible fixed assets 21.1 21.1 27.2 25.7 25.5 25.1 29.8 29.0 20.5 20.5
of which: Land and buildings 6.7 7.4 14.0 13.1 14.3 13.8 18.9 17.6 5.8 6.6Inventories 26.7 26.3 34.8 35.7 40.0 39.8 31.2 30.8 26.0 25.7
of which: Finished goods and merchandise 26.1 25.7 32.7 33.5 37.4 37.6 29.6 29.1 25.5 25.2Cash 8.4 8.5 12.0 12.0 8.1 8.4 11.3 11.2 8.2 8.3Receivables 26.9 27.4 22.8 23.8 21.2 21.8 21.5 21.4 27.3 27.9
Short-term 23.5 23.7 22.7 23.6 21.0 21.5 20.1 20.0 23.7 23.9 of which:
Trade receivables 4.1 4.3 11.4 11.7 10.4 10.7 8.9 8.4 3.6 3.9Receivables from affiliated companies 14.3 14.4 4.5 4.5 4.9 5.1 6.4 6.8 15.0 15.1
Long-term 3.4 3.7 0.1 0.1 0.2 0.3 1.3 1.4 3.6 4.0of which: Loans to affiliated companies 2.2 2.5 0.0 0.0 0.0 0.1 0.7 0.8 2.3 2.6
Securities 0.0 0.1 0.1 0.2 0.2 0.2 0.2 0.5 0.0 0.0Other long-term equity investments 14.7 14.6 2.3 1.7 4.4 4.1 5.1 6.1 15.5 15.4
of which: Goodwill 0.5 0.5 1.7 1.3 3.2 2.9 1.0 1.0 0.4 0.4
CapitalEquity 21.8 24.3 16.9 19.1 21.5 22.3 27.6 27.0 21.5 24.2Liabilities 67.1 64.6 75.7 73.7 73.6 72.6 65.8 66.8 66.9 64.3
Short-term 55.3 54.4 49.8 50.2 50.2 52.3 50.7 52.9 55.7 54.6of which:Liabilities to banks 2.7 3.7 14.4 14.7 12.5 13.3 9.7 9.6 2.0 3.1Trade payables 19.4 19.3 18.9 18.4 17.6 17.6 12.0 11.8 19.8 19.7Liabilities to affiliated companies 26.1 24.1 3.9 4.6 12.1 12.7 21.4 23.1 26.9 24.5
Long-term 11.8 10.2 25.9 23.5 23.4 20.3 15.1 13.8 11.2 9.7 of which:
Liabilities to banks 6.6 5.4 20.2 19.2 18.2 16.8 11.7 11.5 5.9 4.7Liabilities to affiliated companies 1.1 0.9 3.8 2.7 3.7 2.5 2.7 1.8 0.9 0.8
Provisions 10.2 10.3 5.9 5.8 4.4 4.5 5.6 5.3 10.6 10.7of which: Provisions for pensions 2.4 2.4 0.0 0.0 0.6 0.5 1.0 0.9 2.6 2.6
Other ratios Percentage of salesAnnual result before taxes on income 2.2 2.0 7.4 8.2 5.1 5.2 3.8 3.8 2.1 1.8Annual result and depreciation 3.1 2.9 8.4 8.9 5.9 5.9 4.9 4.9 2.9 2.8Trade receivables 1.3 1.4 4.1 4.1 3.9 3.9 3.9 3.7 1.1 1.3
Percentage of the balance sheet totalSales 312.3 302.1 278.5 285.4 270.1 276.1 231.1 227.2 318.1 307.1Annual result and interest paid 6.5 5.7 19.8 22.3 13.1 13.4 8.4 8.4 6.2 5.3
Percentage of liabilities and provisions less cashAnnual result and depreciation 13.8 13.2 32.8 37.1 22.8 23.5 18.4 18.1 13.3 12.6
Percentage of fixed assetsLong-term equity and liabilities 88.0 90.0 143.1 152.5 148.7 144.4 118.6 112.1 85.1 87.7
Percentage of short-term liabilitiesCash resources and short-term receivables 57.7 59.2 69.9 71.1 58.0 57.3 62.3 59.7 57.4 59.1Cash resources, short-term receivables and inventories 105.9 107.5 139.6 142.3 137.6 133.4 123.8 117.9 104.1 106.2
Percentage of cost of materialsTrade payables 8.9 9.2 11.0 10.6 9.9 9.7 8.3 8.3 8.9 9.3
Memo item:Balance sheet total in € billion 35.08 37.22 0.13 0.13 0.84 0.88 1.84 1.96 32.28 34.25Sales in € billion 109.56 112.43 0.35 0.37 2.26 2.42 4.25 4.45 102.70 105.18Number of enterprises 1 226 1 226 378 378 480 480 190 190 178 178

Deutsche BundesbankFinancial statement statistics (ratios - provisional data)
May 2021111
I. Enterprises by economic sector
cont'd: 8.c) Retail trade, except of motor vehicles and motorcycles
cont'd: Non-corporationsEnterprises with sales of ... € million
Total Less than 2 2 but less than 10 10 but less than 50 50 and moreQuartile Cylindered sample 2018/2019value 2018 2019 2018 2019 2018 2019 2018 2019 2018 2019Of the enterprises captured …
Ratios ... % had a ratio of less than …Percentage of gross revenue
Cost of materials 25 52.9 52.6 48.9 48.6 56.6 56.8 51.3 51.1 56.3 56.3 50 65.3 65.4 59.6 59.0 69.1 69.6 62.2 62.5 74.1 75.0 75 75.9 76.2 72.4 72.5 75.6 76.0 75.8 75.7 79.3 78.6
Personnel expenses 25 9.2 9.6 8.1 8.3 10.2 10.5 10.0 9.9 9.1 9.4 50 13.6 13.5 13.5 13.5 13.9 13.5 15.7 15.7 11.6 12.3 75 19.6 19.5 20.7 20.0 18.9 18.5 23.5 23.3 16.9 16.9
Depreciation 25 0.6 0.6 0.5 0.5 0.6 0.6 0.7 0.6 0.9 0.9 50 1.2 1.2 1.3 1.2 1.2 1.1 1.2 1.3 1.2 1.3 75 2.3 2.2 2.7 2.5 2.2 2.1 2.2 2.3 1.6 1.6
Annual result 25 1.4 1.4 2.8 3.2 2.1 2.0 0.8 1.1 0.0 - 0.3 50 3.8 4.0 6.3 6.8 4.1 4.3 3.0 2.8 1.0 0.8 75 7.1 7.4 12.6 12.8 6.5 6.5 5.1 5.2 2.1 1.9
Percentage of the balance sheet totalTangible fixed assets 25 5.5 5.1 3.8 2.8 5.5 5.0 7.7 6.8 15.2 14.7
50 16.2 15.3 12.4 11.2 13.7 12.7 18.0 16.9 29.0 29.9 75 35.0 35.1 33.9 32.2 28.7 29.3 40.3 40.9 39.0 40.4
Inventories 25 17.5 18.1 15.5 16.7 18.2 18.2 15.3 15.5 20.5 21.6 50 31.3 31.8 30.5 31.9 31.7 32.6 31.9 32.2 30.4 29.4 75 51.8 53.4 53.0 53.7 56.6 59.4 49.6 49.7 41.8 40.9
Equity 25 0.6 4.1 - 11.0 - 4.6 2.0 3.4 7.6 8.6 2.5 13.5 50 17.9 21.1 14.3 17.7 18.5 20.3 21.8 23.4 13.1 24.2 75 38.2 39.3 40.1 42.6 36.6 36.6 41.1 41.3 32.6 39.4
Short-term liabilities 25 33.2 32.9 27.8 24.9 32.6 34.5 34.3 36.9 48.2 43.0 50 54.9 56.6 51.4 51.8 54.3 54.8 51.6 55.4 69.3 61.1 75 78.1 74.4 77.9 80.5 73.9 72.9 72.3 75.3 85.3 71.3
Liabilities to banks 25 0.0 0.0 0.0 0.0 1.4 2.2 0.0 0.0 0.0 0.0 50 15.7 16.2 20.3 21.4 25.1 22.8 17.9 16.3 0.0 0.0 75 42.4 42.1 56.4 52.7 50.6 50.2 33.3 34.0 6.9 6.4
Percentage of salesAnnual result before taxes on income 25 1.6 1.7 3.1 3.6 2.5 2.5 1.3 1.3 0.2 - 0.2
50 4.4 4.6 6.8 7.2 4.8 5.0 3.7 3.4 1.3 1.2 75 8.0 8.4 13.9 14.4 7.6 7.5 6.2 6.1 2.7 2.5
Annual result and depreciation 25 3.1 3.1 4.2 5.0 3.9 3.6 2.9 2.7 1.0 1.0 50 5.9 6.2 8.8 9.3 6.3 6.3 5.1 5.1 2.6 2.5 75 10.0 10.1 17.3 16.7 9.0 8.8 8.1 7.8 4.1 4.1
Trade receivables 25 0.2 0.2 0.0 0.0 0.5 0.4 0.4 0.4 0.1 0.1 50 1.9 1.7 2.0 1.6 3.1 3.0 1.8 1.7 0.3 0.3 75 5.9 5.8 6.0 5.8 6.8 6.6 5.9 5.7 1.6 1.6
Percentage of the balance sheet totalAnnual result and interest paid 25 5.3 5.7 10.2 11.9 7.2 7.6 3.3 3.9 0.7 - 0.5
50 13.1 13.9 23.3 26.7 14.2 15.1 9.6 9.5 5.3 4.7 75 26.8 28.6 43.5 48.0 25.0 26.0 16.6 16.1 9.0 8.9
Percentage of liabilities and provisions less cashAnnual result and depreciation 25 10.7 10.9 11.2 14.4 12.9 11.9 10.7 9.9 5.8 5.7
50 22.6 24.2 30.6 37.8 24.0 25.8 21.3 20.4 15.2 15.2 75 50.4 55.1 77.7 100.0 45.8 47.1 39.5 38.9 23.0 24.8
Percentage of fixed assetsLong-term equity and liabilities 25 67.7 76.0 53.8 66.4 89.5 94.3 86.9 88.7 15.0 45.8
50 135.6 143.5 140.0 161.4 163.3 164.1 127.3 140.4 65.5 83.4 75 353.5 365.2 507.2 580.0 402.4 430.1 309.1 352.2 142.6 155.4
Percentage of short-term liabilitiesCash resources and short-term receivables 25 32.2 32.1 32.6 33.0 32.8 29.9 35.7 34.7 27.2 31.1
50 63.3 64.5 71.7 77.6 63.7 63.3 64.6 61.4 47.7 60.3 75 107.3 113.9 133.7 138.3 108.1 110.2 102.7 102.9 81.2 91.4
Percentage of cost of materialsTrade payables 25 4.6 4.3 4.3 3.8 5.1 4.8 4.0 3.8 4.8 4.9
50 8.7 8.4 8.8 8.2 8.8 8.7 7.1 6.6 9.4 9.9 75 12.6 12.1 14.6 13.4 12.8 11.7 11.4 11.6 11.9 11.9

Deutsche BundesbankFinancial statement statistics (ratios - provisional data)May 2021112
I. Enterprises by economic sector
9. Transportation and storage
All legal formsEnterprises with sales of ... € million
Total Less than 2 2 but less than 10 10 but less than 50 50 and moreCylindered sample 2018/2019
Ratios 2018 2019 2018 2019 2018 2019 2018 2019 2018 2019Income statementIncome Percentage of gross revenueSales 99.0 99.2 100.0 100.1 99.9 99.9 99.8 99.9 98.9 99.0Change in finished goods 1.0 0.8 0.0 - 0.1 0.1 0.1 0.2 0.1 1.1 1.0Interest and similar income 0.3 0.4 0.1 0.1 0.1 0.1 0.2 0.2 0.3 0.5Other income 5.6 5.8 6.4 7.0 4.8 4.6 3.9 3.9 5.8 6.0
of which: Income from long-term equity investments 0.8 1.0 0.1 0.1 0.3 0.3 0.4 0.4 0.9 1.1Total income 105.9 106.2 106.5 107.1 104.9 104.8 104.2 104.1 106.1 106.5
ExpensesCost of materials 56.2 56.0 19.9 21.2 31.4 30.9 48.8 48.3 58.5 58.4Personnel expenses 25.5 26.0 33.2 34.2 32.0 32.0 27.5 28.3 24.9 25.3Depreciation 5.1 5.0 8.4 8.3 6.3 6.3 5.6 5.5 5.0 4.9
of which: Depreciation of tangible fixed assets 5.0 4.9 8.3 8.3 6.2 6.2 5.4 5.3 4.8 4.8Interest and similar expenses 2.8 1.7 1.2 1.2 0.9 0.8 1.0 1.0 3.1 1.8Operating taxes 0.2 0.1 0.4 0.4 0.3 0.3 0.2 0.2 0.2 0.1Other expenses 14.5 14.7 37.6 35.6 31.0 31.1 19.4 19.4 12.9 13.2Total expenses before taxes on income 104.2 103.5 100.7 100.9 101.8 101.4 102.6 102.6 104.6 103.8Annual result before taxes on income 1.7 2.7 5.8 6.2 3.2 3.4 1.6 1.5 1.6 2.8Taxes on income 0.6 0.6 1.2 1.2 1.0 1.0 0.8 0.9 0.6 0.6Annual result 1.0 2.0 4.6 5.0 2.2 2.4 0.8 0.6 1.0 2.2Profit and loss transfers (parent company) 1.5 1.6 0.1 0.1 0.1 - 0.1 0.0 - 0.1 1.8 1.9Profit and loss transfers (subsidiary) 0.6 0.4 - 0.1 0.1 - 0.2 - 0.4 - 1.0 - 1.1 0.8 0.7Profit for the year 2.0 3.2 4.8 5.0 2.6 2.7 1.7 1.7 1.9 3.4
Balance sheetAssets Percentage of the balance sheet totalIntangible fixed assets 0.7 0.7 0.4 0.4 0.5 0.5 2.2 2.0 0.6 0.6Tangible fixed assets 50.0 49.7 59.2 58.8 55.6 55.2 57.3 57.5 49.2 48.9
of which: Land and buildings 18.2 17.7 22.0 20.9 16.6 16.5 20.5 20.3 18.0 17.5Inventories 3.9 3.7 1.0 1.0 2.1 2.3 1.9 1.9 4.1 3.9
of which: Finished goods and merchandise 2.4 2.4 0.5 0.4 0.6 0.7 0.6 0.5 2.6 2.6Cash 3.5 3.4 11.0 11.9 9.8 9.9 6.8 7.1 3.0 2.9Receivables 26.1 26.7 24.0 23.6 26.7 26.9 25.9 25.7 26.1 26.8
Short-term 19.3 20.2 23.2 22.7 25.4 25.6 24.9 24.4 18.7 19.8 of which:
Trade receivables 5.0 4.8 10.3 10.1 13.0 12.7 10.9 10.7 4.3 4.1Receivables from affiliated companies 12.2 12.9 7.2 6.7 8.8 9.4 11.1 10.7 12.4 13.2
Long-term 6.7 6.5 0.7 0.9 1.3 1.3 1.1 1.3 7.3 7.0of which: Loans to affiliated companies 6.6 6.4 0.3 0.2 0.8 0.8 0.6 0.9 7.2 7.0
Securities 1.5 1.1 0.2 0.2 1.4 1.4 1.0 1.3 1.5 1.1Other long-term equity investments 14.2 14.4 3.5 3.4 3.3 3.3 4.4 4.1 15.3 15.5
of which: Goodwill 0.6 0.5 0.3 0.2 0.2 0.2 0.2 0.2 0.6 0.6
CapitalEquity 37.0 36.6 30.8 32.0 35.7 36.2 39.3 39.0 36.9 36.4Liabilities 48.7 49.7 63.9 63.0 56.2 55.7 50.5 50.8 48.3 49.4
Short-term 25.2 24.5 35.3 33.7 33.5 32.8 28.4 28.0 24.7 24.0of which:Liabilities to banks 2.7 2.5 12.1 12.2 10.1 9.7 5.1 5.0 2.3 2.1Trade payables 4.6 4.4 6.3 6.2 8.4 8.1 7.9 7.4 4.2 4.1Liabilities to affiliated companies 13.6 13.8 9.8 8.5 8.5 8.5 11.9 10.7 13.8 14.2
Long-term 23.5 25.2 28.6 29.3 22.7 22.9 22.1 22.8 23.6 25.4 of which:
Liabilities to banks 8.9 9.7 22.5 23.3 18.6 19.1 14.7 14.4 8.1 9.0Liabilities to affiliated companies 7.2 7.9 3.9 3.8 2.7 2.3 4.0 5.5 7.5 8.3
Provisions 13.5 13.0 5.0 4.8 7.8 7.8 9.1 9.1 14.0 13.4of which: Provisions for pensions 4.2 4.3 0.9 0.9 2.5 2.5 2.8 2.9 4.3 4.5
Other ratios Percentage of salesAnnual result before taxes on income 1.7 2.7 5.8 6.2 3.2 3.4 1.6 1.5 1.6 2.8Annual result and depreciation 6.2 7.1 13.0 13.3 8.5 8.7 6.4 6.1 6.1 7.2Trade receivables 6.6 6.4 8.9 8.7 9.2 8.9 9.3 8.9 6.1 5.9
Percentage of the balance sheet totalSales 75.3 75.0 115.9 116.1 140.7 142.8 117.2 119.5 70.2 69.7Annual result and interest paid 2.9 2.8 6.8 7.2 4.4 4.7 2.1 1.9 2.9 2.8
Percentage of liabilities and provisions less cashAnnual result and depreciation 7.9 8.9 26.0 27.6 21.9 23.1 13.9 13.6 7.1 8.2
Percentage of fixed assetsLong-term equity and liabilities 89.6 92.0 94.4 98.0 98.3 100.1 97.3 97.9 88.8 91.4
Percentage of short-term liabilitiesCash resources and short-term receivables 93.9 98.7 97.3 103.4 105.6 108.6 112.0 112.8 91.8 97.0Cash resources, short-term receivables and inventories 109.3 113.7 100.3 106.3 111.9 115.7 118.8 119.6 108.3 113.2
Percentage of cost of materialsTrade payables 10.7 10.5 27.4 25.1 18.9 18.3 13.7 12.8 10.1 10.0
Memo item:Balance sheet total in € billion 207.12 216.33 0.67 0.72 4.18 4.36 15.52 15.95 186.75 195.30Sales in € billion 155.92 162.23 0.77 0.84 5.88 6.23 18.18 19.06 131.08 136.10Number of enterprises 3 181 3 181 810 810 1 197 1 197 820 820 354 354
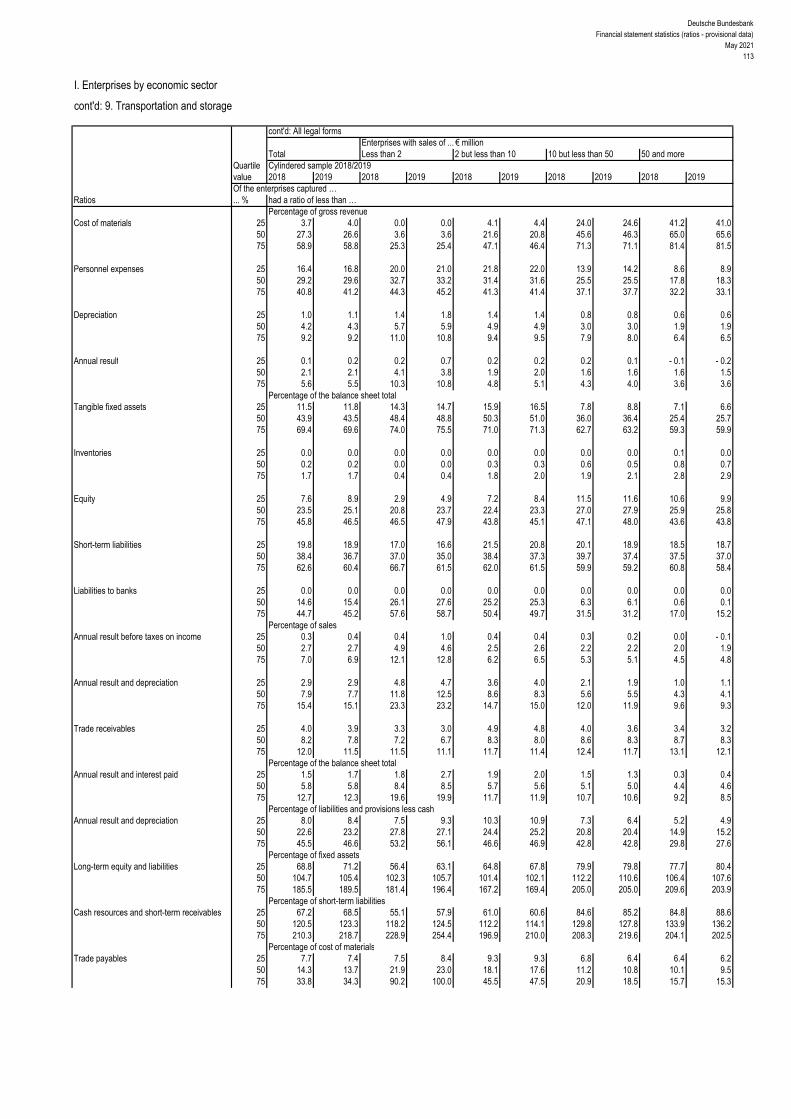
Deutsche BundesbankFinancial statement statistics (ratios - provisional data)
May 2021113
I. Enterprises by economic sector
cont'd: 9. Transportation and storage
cont'd: All legal formsEnterprises with sales of ... € million
Total Less than 2 2 but less than 10 10 but less than 50 50 and moreQuartile Cylindered sample 2018/2019value 2018 2019 2018 2019 2018 2019 2018 2019 2018 2019Of the enterprises captured …
Ratios ... % had a ratio of less than …Percentage of gross revenue
Cost of materials 25 3.7 4.0 0.0 0.0 4.1 4.4 24.0 24.6 41.2 41.0 50 27.3 26.6 3.6 3.6 21.6 20.8 45.6 46.3 65.0 65.6 75 58.9 58.8 25.3 25.4 47.1 46.4 71.3 71.1 81.4 81.5
Personnel expenses 25 16.4 16.8 20.0 21.0 21.8 22.0 13.9 14.2 8.6 8.9 50 29.2 29.6 32.7 33.2 31.4 31.6 25.5 25.5 17.8 18.3 75 40.8 41.2 44.3 45.2 41.3 41.4 37.1 37.7 32.2 33.1
Depreciation 25 1.0 1.1 1.4 1.8 1.4 1.4 0.8 0.8 0.6 0.6 50 4.2 4.3 5.7 5.9 4.9 4.9 3.0 3.0 1.9 1.9 75 9.2 9.2 11.0 10.8 9.4 9.5 7.9 8.0 6.4 6.5
Annual result 25 0.1 0.2 0.2 0.7 0.2 0.2 0.2 0.1 - 0.1 - 0.2 50 2.1 2.1 4.1 3.8 1.9 2.0 1.6 1.6 1.6 1.5 75 5.6 5.5 10.3 10.8 4.8 5.1 4.3 4.0 3.6 3.6
Percentage of the balance sheet totalTangible fixed assets 25 11.5 11.8 14.3 14.7 15.9 16.5 7.8 8.8 7.1 6.6
50 43.9 43.5 48.4 48.8 50.3 51.0 36.0 36.4 25.4 25.7 75 69.4 69.6 74.0 75.5 71.0 71.3 62.7 63.2 59.3 59.9
Inventories 25 0.0 0.0 0.0 0.0 0.0 0.0 0.0 0.0 0.1 0.0 50 0.2 0.2 0.0 0.0 0.3 0.3 0.6 0.5 0.8 0.7 75 1.7 1.7 0.4 0.4 1.8 2.0 1.9 2.1 2.8 2.9
Equity 25 7.6 8.9 2.9 4.9 7.2 8.4 11.5 11.6 10.6 9.9 50 23.5 25.1 20.8 23.7 22.4 23.3 27.0 27.9 25.9 25.8 75 45.8 46.5 46.5 47.9 43.8 45.1 47.1 48.0 43.6 43.8
Short-term liabilities 25 19.8 18.9 17.0 16.6 21.5 20.8 20.1 18.9 18.5 18.7 50 38.4 36.7 37.0 35.0 38.4 37.3 39.7 37.4 37.5 37.0 75 62.6 60.4 66.7 61.5 62.0 61.5 59.9 59.2 60.8 58.4
Liabilities to banks 25 0.0 0.0 0.0 0.0 0.0 0.0 0.0 0.0 0.0 0.0 50 14.6 15.4 26.1 27.6 25.2 25.3 6.3 6.1 0.6 0.1 75 44.7 45.2 57.6 58.7 50.4 49.7 31.5 31.2 17.0 15.2
Percentage of salesAnnual result before taxes on income 25 0.3 0.4 0.4 1.0 0.4 0.4 0.3 0.2 0.0 - 0.1
50 2.7 2.7 4.9 4.6 2.5 2.6 2.2 2.2 2.0 1.9 75 7.0 6.9 12.1 12.8 6.2 6.5 5.3 5.1 4.5 4.8
Annual result and depreciation 25 2.9 2.9 4.8 4.7 3.6 4.0 2.1 1.9 1.0 1.1 50 7.9 7.7 11.8 12.5 8.6 8.3 5.6 5.5 4.3 4.1 75 15.4 15.1 23.3 23.2 14.7 15.0 12.0 11.9 9.6 9.3
Trade receivables 25 4.0 3.9 3.3 3.0 4.9 4.8 4.0 3.6 3.4 3.2 50 8.2 7.8 7.2 6.7 8.3 8.0 8.6 8.3 8.7 8.3 75 12.0 11.5 11.5 11.1 11.7 11.4 12.4 11.7 13.1 12.1
Percentage of the balance sheet totalAnnual result and interest paid 25 1.5 1.7 1.8 2.7 1.9 2.0 1.5 1.3 0.3 0.4
50 5.8 5.8 8.4 8.5 5.7 5.6 5.1 5.0 4.4 4.6 75 12.7 12.3 19.6 19.9 11.7 11.9 10.7 10.6 9.2 8.5
Percentage of liabilities and provisions less cashAnnual result and depreciation 25 8.0 8.4 7.5 9.3 10.3 10.9 7.3 6.4 5.2 4.9
50 22.6 23.2 27.8 27.1 24.4 25.2 20.8 20.4 14.9 15.2 75 45.5 46.6 53.2 56.1 46.6 46.9 42.8 42.8 29.8 27.6
Percentage of fixed assetsLong-term equity and liabilities 25 68.8 71.2 56.4 63.1 64.8 67.8 79.9 79.8 77.7 80.4
50 104.7 105.4 102.3 105.7 101.4 102.1 112.2 110.6 106.4 107.6 75 185.5 189.5 181.4 196.4 167.2 169.4 205.0 205.0 209.6 203.9
Percentage of short-term liabilitiesCash resources and short-term receivables 25 67.2 68.5 55.1 57.9 61.0 60.6 84.6 85.2 84.8 88.6
50 120.5 123.3 118.2 124.5 112.2 114.1 129.8 127.8 133.9 136.2 75 210.3 218.7 228.9 254.4 196.9 210.0 208.3 219.6 204.1 202.5
Percentage of cost of materialsTrade payables 25 7.7 7.4 7.5 8.4 9.3 9.3 6.8 6.4 6.4 6.2
50 14.3 13.7 21.9 23.0 18.1 17.6 11.2 10.8 10.1 9.5 75 33.8 34.3 90.2 100.0 45.5 47.5 20.9 18.5 15.7 15.3

Deutsche BundesbankFinancial statement statistics (ratios - provisional data)May 2021114
I. Enterprises by economic sector
cont'd: 9. Transportation and storage
CorporationsEnterprises with sales of ... € million
Total Less than 2 2 but less than 10 10 but less than 50 50 and moreCylindered sample 2018/2019
Ratios 2018 2019 2018 2019 2018 2019 2018 2019 2018 2019Income statementIncome Percentage of gross revenueSales 98.9 99.0 100.0 100.1 99.9 99.8 99.8 99.9 98.8 98.8Change in finished goods 1.1 1.0 0.0 - 0.1 0.1 0.2 0.2 0.1 1.2 1.2Interest and similar income 0.3 0.5 0.2 0.2 0.2 0.2 0.2 0.2 0.4 0.5Other income 5.8 6.1 7.5 8.4 5.3 5.2 3.9 3.8 6.0 6.5
of which: Income from long-term equity investments 0.9 1.1 0.0 0.0 0.3 0.3 0.4 0.4 1.0 1.2Total income 106.1 106.6 107.6 108.6 105.5 105.4 104.2 104.0 106.4 107.0
ExpensesCost of materials 55.5 55.5 23.5 25.5 34.4 33.8 50.5 50.1 57.1 57.2Personnel expenses 26.5 26.9 34.6 35.6 32.4 32.3 27.8 28.6 26.0 26.4Depreciation 5.3 5.2 6.6 6.6 5.8 5.8 5.2 5.2 5.3 5.2
of which: Depreciation of tangible fixed assets 5.2 5.1 6.5 6.6 5.7 5.7 5.0 5.0 5.2 5.1Interest and similar expenses 3.1 1.9 1.0 1.0 0.8 0.7 0.9 0.8 3.5 2.1Operating taxes 0.2 0.1 0.3 0.4 0.3 0.2 0.2 0.2 0.2 0.1Other expenses 14.0 14.3 38.0 35.4 29.5 29.8 18.5 18.3 12.8 13.1Total expenses before taxes on income 104.6 104.0 104.1 104.5 103.1 102.7 103.1 103.1 104.9 104.1Annual result before taxes on income 1.5 2.6 3.6 4.1 2.4 2.7 1.1 0.9 1.5 2.8Taxes on income 0.6 0.6 1.2 1.2 1.0 1.0 0.9 0.9 0.6 0.6Annual result 0.9 2.0 2.4 2.9 1.4 1.7 0.2 0.0 0.9 2.3Profit and loss transfers (parent company) 1.7 1.8 0.2 0.1 0.2 - 0.1 0.0 - 0.1 2.0 2.2Profit and loss transfers (subsidiary) 0.7 0.5 - 0.1 0.1 - 0.3 - 0.5 - 1.2 - 1.3 1.0 0.8Profit for the year 1.9 3.3 2.7 3.0 1.9 2.0 1.4 1.3 2.0 3.6
Balance sheetAssets Percentage of the balance sheet totalIntangible fixed assets 0.6 0.6 0.5 0.5 0.6 0.6 1.1 1.0 0.6 0.6Tangible fixed assets 49.5 49.4 54.8 53.9 53.2 52.8 55.3 55.8 49.1 48.9
of which: Land and buildings 18.0 17.5 25.1 23.3 17.1 16.9 20.9 20.5 17.8 17.3Inventories 3.9 3.8 1.3 1.2 2.4 2.6 2.2 2.1 4.0 3.9
of which: Finished goods and merchandise 2.6 2.5 0.7 0.5 0.6 0.7 0.6 0.6 2.7 2.6Cash 3.4 3.2 12.4 13.6 9.7 9.7 7.2 7.1 3.0 2.8Receivables 25.9 26.6 26.0 26.0 28.3 28.6 27.6 27.4 25.7 26.5
Short-term 18.8 19.8 24.9 24.7 27.1 27.4 26.6 26.2 18.1 19.3 of which:
Trade receivables 4.2 4.1 11.2 10.9 13.6 13.2 11.5 11.1 3.6 3.5Receivables from affiliated companies 12.5 13.2 8.7 8.3 9.4 10.3 12.0 12.0 12.6 13.4
Long-term 7.0 6.8 1.1 1.3 1.2 1.2 1.0 1.2 7.6 7.3of which: Loans to affiliated companies 6.9 6.7 0.4 0.3 0.6 0.7 0.5 0.8 7.5 7.2
Securities 1.6 1.2 0.3 0.3 1.8 1.7 1.3 1.6 1.6 1.1Other long-term equity investments 14.9 15.0 4.1 3.9 3.5 3.5 5.0 4.6 15.8 15.9
of which: Goodwill 0.6 0.5 0.3 0.2 0.3 0.2 0.2 0.2 0.6 0.6
CapitalEquity 37.6 37.2 36.8 37.1 40.4 40.4 41.7 41.3 37.3 36.8Liabilities 47.9 48.9 56.9 56.9 50.2 50.1 47.7 48.1 47.8 49.0
Short-term 24.5 23.6 30.6 30.0 31.4 31.0 28.7 25.8 24.0 23.3of which:Liabilities to banks 2.5 2.3 7.7 7.7 8.8 8.6 4.2 3.9 2.3 2.1Trade payables 4.0 3.9 6.6 6.5 8.5 8.2 8.4 7.9 3.6 3.5Liabilities to affiliated companies 13.7 13.9 9.0 8.9 7.7 7.9 12.5 10.3 13.9 14.3
Long-term 23.4 25.3 26.4 26.9 18.8 19.2 19.0 22.3 23.8 25.6 of which:
Liabilities to banks 8.5 9.4 19.1 20.0 14.8 15.5 11.6 12.1 8.1 9.1Liabilities to affiliated companies 7.1 7.9 4.7 4.5 2.6 2.1 3.9 6.5 7.5 8.1
Provisions 13.8 13.2 6.1 5.8 9.1 9.1 10.1 10.2 14.1 13.5of which: Provisions for pensions 4.3 4.4 1.4 1.3 3.2 3.2 3.2 3.3 4.4 4.5
Other ratios Percentage of salesAnnual result before taxes on income 1.5 2.7 3.6 4.1 2.4 2.7 1.1 0.9 1.5 2.9Annual result and depreciation 6.3 7.3 8.9 9.5 7.2 7.5 5.5 5.2 6.3 7.6Trade receivables 6.2 6.0 9.6 9.2 9.6 9.2 9.6 9.0 5.6 5.5
Percentage of the balance sheet totalSales 68.8 68.3 117.0 118.0 141.8 143.6 120.1 122.5 63.9 63.2Annual result and interest paid 2.8 2.7 4.0 4.6 3.1 3.5 1.3 1.0 2.8 2.8
Percentage of liabilities and provisions less cashAnnual result and depreciation 7.3 8.4 20.6 22.8 20.4 21.6 12.9 12.3 6.8 8.0
Percentage of fixed assetsLong-term equity and liabilities 89.8 92.6 106.5 109.4 103.8 105.2 100.6 104.3 88.9 91.6
Percentage of short-term liabilitiesCash resources and short-term receivables 94.5 100.1 122.9 128.6 117.6 119.9 118.1 129.0 92.0 97.4Cash resources, short-term receivables and inventories 110.4 116.0 127.2 132.7 125.3 128.3 125.6 137.2 108.8 114.1
Percentage of cost of materialsTrade payables 10.3 10.2 24.0 21.7 17.5 16.8 13.9 12.9 9.7 9.7
Memo item:Balance sheet total in € billion 194.22 202.96 0.43 0.47 3.09 3.24 12.26 12.65 178.44 186.60Sales in € billion 133.62 138.63 0.51 0.56 4.38 4.65 14.72 15.50 114.01 117.92Number of enterprises 2 350 2 350 535 535 877 877 658 658 280 280

Deutsche BundesbankFinancial statement statistics (ratios - provisional data)
May 2021115
I. Enterprises by economic sector
cont'd: 9. Transportation and storage
cont'd: CorporationsEnterprises with sales of ... € million
Total Less than 2 2 but less than 10 10 but less than 50 50 and moreQuartile Cylindered sample 2018/2019value 2018 2019 2018 2019 2018 2019 2018 2019 2018 2019Of the enterprises captured …
Ratios ... % had a ratio of less than …Percentage of gross revenue
Cost of materials 25 6.8 6.4 0.0 0.0 6.0 5.9 27.1 26.5 41.1 41.2 50 32.6 32.1 6.6 6.2 25.1 23.5 49.0 48.3 64.9 65.7 75 64.2 64.1 34.1 31.7 51.5 51.8 72.9 73.1 81.3 81.5
Personnel expenses 25 15.6 16.2 21.2 22.3 20.9 21.1 13.6 13.7 9.1 9.9 50 29.6 29.6 34.0 34.9 31.5 31.9 25.7 25.7 17.6 18.3 75 42.3 42.9 46.8 48.7 42.7 42.9 37.9 38.7 32.9 33.7
Depreciation 25 0.8 0.8 0.9 1.2 1.0 1.0 0.7 0.7 0.6 0.6 50 3.3 3.4 3.9 4.2 4.0 4.0 2.6 2.7 1.9 2.0 75 8.4 8.5 9.5 9.4 8.7 8.8 7.4 7.6 7.1 7.0
Annual result 25 0.0 0.0 - 0.6 0.0 0.1 0.1 0.2 0.1 - 0.3 - 0.5 50 1.6 1.5 2.3 2.2 1.4 1.3 1.5 1.4 1.5 1.4 75 4.4 4.4 6.5 6.6 3.8 4.0 4.1 3.6 3.7 3.5
Percentage of the balance sheet totalTangible fixed assets 25 8.0 8.5 7.5 8.5 11.9 10.8 7.4 7.9 6.3 6.0
50 36.9 37.3 37.0 38.5 41.6 41.2 34.5 35.4 25.7 25.1 75 64.7 64.8 67.5 68.5 66.4 67.1 60.8 61.0 59.9 60.9
Inventories 25 0.0 0.0 0.0 0.0 0.0 0.0 0.0 0.0 0.0 0.0 50 0.2 0.2 0.0 0.0 0.2 0.3 0.5 0.5 0.6 0.6 75 1.8 2.0 0.6 0.7 2.1 2.2 2.0 2.2 2.4 2.7
Equity 25 10.9 11.8 6.0 10.3 11.2 11.7 13.2 12.7 12.4 11.3 50 27.6 29.2 24.9 28.3 26.9 28.3 30.1 30.7 28.5 29.0 75 48.7 49.1 49.3 50.7 48.5 48.6 49.7 50.3 46.5 46.7
Short-term liabilities 25 18.7 18.0 16.7 16.2 20.5 19.9 19.1 17.9 17.1 16.6 50 36.9 34.7 35.1 34.3 37.1 35.5 38.6 34.8 33.2 33.3 75 60.0 57.9 65.6 57.7 60.3 60.3 59.0 57.6 56.7 54.0
Liabilities to banks 25 0.0 0.0 0.0 0.0 0.0 0.0 0.0 0.0 0.0 0.0 50 8.7 9.0 12.9 14.8 15.5 16.8 3.4 2.9 0.2 0.1 75 36.2 38.1 44.7 47.3 42.6 43.3 27.5 27.8 17.2 15.1
Percentage of salesAnnual result before taxes on income 25 0.1 0.1 - 0.6 0.2 0.2 0.2 0.3 0.1 - 0.3 - 0.5
50 2.2 2.2 3.0 2.8 2.0 2.0 2.1 2.0 2.0 1.9 75 5.6 5.6 8.2 8.1 5.4 5.3 5.1 4.9 4.9 4.9
Annual result and depreciation 25 2.1 2.2 2.7 3.0 2.7 2.7 2.0 1.6 0.7 1.0 50 6.4 6.3 8.7 8.5 6.9 7.0 5.1 5.1 4.3 4.0 75 12.7 12.9 16.5 15.8 12.5 13.2 11.4 10.9 9.8 9.4
Trade receivables 25 3.9 3.8 3.3 3.0 4.9 4.6 3.9 3.4 3.3 3.1 50 8.5 8.0 7.7 7.0 8.6 8.2 8.7 8.2 8.2 8.2 75 12.5 11.9 12.9 12.9 12.0 11.6 12.8 11.7 13.2 12.1
Percentage of the balance sheet totalAnnual result and interest paid 25 0.9 1.0 0.0 1.1 1.4 1.3 1.3 0.9 0.2 0.0
50 4.8 4.7 5.8 5.8 4.6 4.5 4.7 4.3 4.2 4.4 75 10.5 10.6 13.2 12.7 9.7 10.0 10.4 10.5 8.7 8.1
Percentage of liabilities and provisions less cashAnnual result and depreciation 25 5.5 6.1 2.2 3.8 7.4 8.3 6.9 5.1 3.6 4.0
50 20.6 20.7 19.7 21.5 22.4 22.7 21.1 19.9 14.7 14.8 75 43.5 44.3 44.6 49.1 45.8 45.1 43.7 44.7 30.9 32.0
Percentage of fixed assetsLong-term equity and liabilities 25 76.9 80.3 71.2 79.3 73.3 74.1 84.7 86.3 81.4 84.6
50 112.9 114.3 110.6 115.7 110.9 112.4 117.6 115.5 113.3 110.4 75 226.2 230.0 225.5 257.1 214.7 216.2 234.0 230.4 224.7 236.2
Percentage of short-term liabilitiesCash resources and short-term receivables 25 77.4 82.4 67.7 76.4 71.4 70.2 94.7 96.1 92.5 92.7
50 134.5 138.9 133.7 139.2 129.2 134.0 135.8 141.6 143.3 147.5 75 234.5 250.5 264.7 285.7 229.5 244.4 221.9 241.2 227.7 218.8
Percentage of cost of materialsTrade payables 25 7.3 7.1 7.1 7.9 8.8 8.6 6.5 6.2 6.2 6.1
50 13.5 12.9 19.3 20.8 16.7 15.9 11.0 10.3 10.2 9.9 75 28.9 28.7 73.9 94.9 38.4 40.7 19.4 17.2 15.9 16.1
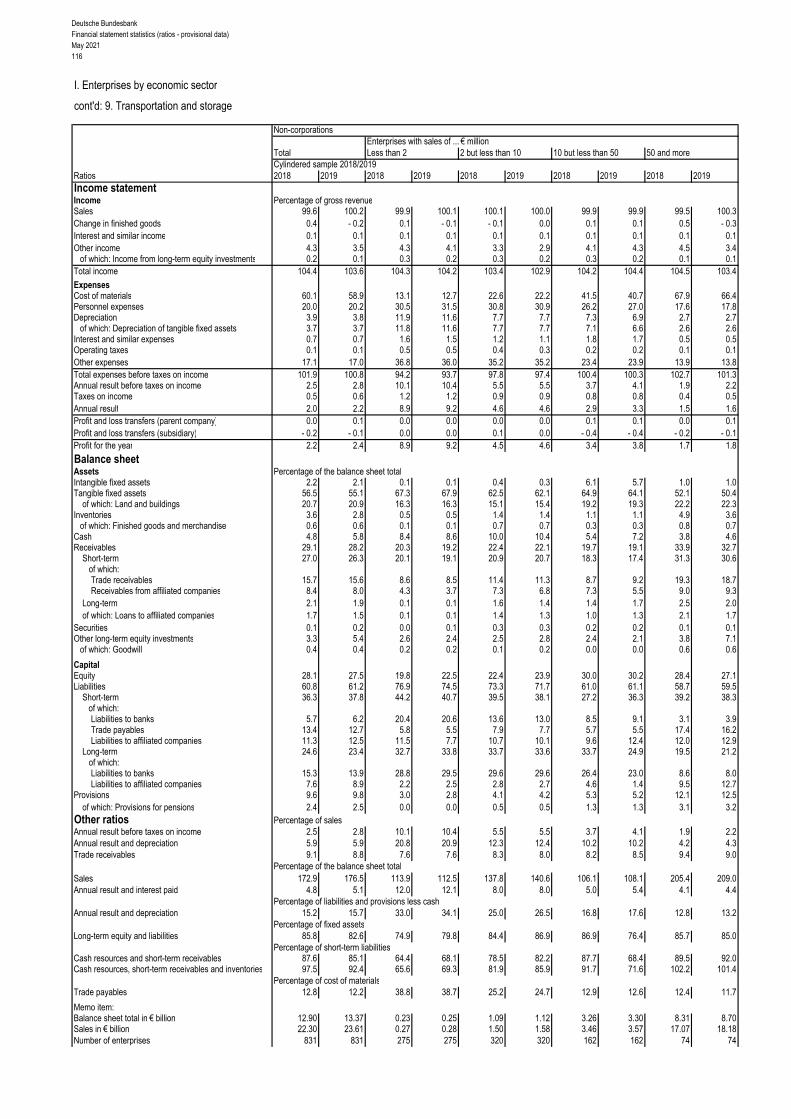
Deutsche BundesbankFinancial statement statistics (ratios - provisional data)May 2021116
I. Enterprises by economic sector
cont'd: 9. Transportation and storage
Non-corporationsEnterprises with sales of ... € million
Total Less than 2 2 but less than 10 10 but less than 50 50 and moreCylindered sample 2018/2019
Ratios 2018 2019 2018 2019 2018 2019 2018 2019 2018 2019Income statementIncome Percentage of gross revenueSales 99.6 100.2 99.9 100.1 100.1 100.0 99.9 99.9 99.5 100.3Change in finished goods 0.4 - 0.2 0.1 - 0.1 - 0.1 0.0 0.1 0.1 0.5 - 0.3Interest and similar income 0.1 0.1 0.1 0.1 0.1 0.1 0.1 0.1 0.1 0.1Other income 4.3 3.5 4.3 4.1 3.3 2.9 4.1 4.3 4.5 3.4
of which: Income from long-term equity investments 0.2 0.1 0.3 0.2 0.3 0.2 0.3 0.2 0.1 0.1Total income 104.4 103.6 104.3 104.2 103.4 102.9 104.2 104.4 104.5 103.4
ExpensesCost of materials 60.1 58.9 13.1 12.7 22.6 22.2 41.5 40.7 67.9 66.4Personnel expenses 20.0 20.2 30.5 31.5 30.8 30.9 26.2 27.0 17.6 17.8Depreciation 3.9 3.8 11.9 11.6 7.7 7.7 7.3 6.9 2.7 2.7
of which: Depreciation of tangible fixed assets 3.7 3.7 11.8 11.6 7.7 7.7 7.1 6.6 2.6 2.6Interest and similar expenses 0.7 0.7 1.6 1.5 1.2 1.1 1.8 1.7 0.5 0.5Operating taxes 0.1 0.1 0.5 0.5 0.4 0.3 0.2 0.2 0.1 0.1Other expenses 17.1 17.0 36.8 36.0 35.2 35.2 23.4 23.9 13.9 13.8Total expenses before taxes on income 101.9 100.8 94.2 93.7 97.8 97.4 100.4 100.3 102.7 101.3Annual result before taxes on income 2.5 2.8 10.1 10.4 5.5 5.5 3.7 4.1 1.9 2.2Taxes on income 0.5 0.6 1.2 1.2 0.9 0.9 0.8 0.8 0.4 0.5Annual result 2.0 2.2 8.9 9.2 4.6 4.6 2.9 3.3 1.5 1.6Profit and loss transfers (parent company) 0.0 0.1 0.0 0.0 0.0 0.0 0.1 0.1 0.0 0.1Profit and loss transfers (subsidiary) - 0.2 - 0.1 0.0 0.0 0.1 0.0 - 0.4 - 0.4 - 0.2 - 0.1Profit for the year 2.2 2.4 8.9 9.2 4.5 4.6 3.4 3.8 1.7 1.8
Balance sheetAssets Percentage of the balance sheet totalIntangible fixed assets 2.2 2.1 0.1 0.1 0.4 0.3 6.1 5.7 1.0 1.0Tangible fixed assets 56.5 55.1 67.3 67.9 62.5 62.1 64.9 64.1 52.1 50.4
of which: Land and buildings 20.7 20.9 16.3 16.3 15.1 15.4 19.2 19.3 22.2 22.3Inventories 3.6 2.8 0.5 0.5 1.4 1.4 1.1 1.1 4.9 3.6
of which: Finished goods and merchandise 0.6 0.6 0.1 0.1 0.7 0.7 0.3 0.3 0.8 0.7Cash 4.8 5.8 8.4 8.6 10.0 10.4 5.4 7.2 3.8 4.6Receivables 29.1 28.2 20.3 19.2 22.4 22.1 19.7 19.1 33.9 32.7
Short-term 27.0 26.3 20.1 19.1 20.9 20.7 18.3 17.4 31.3 30.6 of which:
Trade receivables 15.7 15.6 8.6 8.5 11.4 11.3 8.7 9.2 19.3 18.7Receivables from affiliated companies 8.4 8.0 4.3 3.7 7.3 6.8 7.3 5.5 9.0 9.3
Long-term 2.1 1.9 0.1 0.1 1.6 1.4 1.4 1.7 2.5 2.0of which: Loans to affiliated companies 1.7 1.5 0.1 0.1 1.4 1.3 1.0 1.3 2.1 1.7
Securities 0.1 0.2 0.0 0.1 0.3 0.3 0.2 0.2 0.1 0.1Other long-term equity investments 3.3 5.4 2.6 2.4 2.5 2.8 2.4 2.1 3.8 7.1
of which: Goodwill 0.4 0.4 0.2 0.2 0.1 0.2 0.0 0.0 0.6 0.6
CapitalEquity 28.1 27.5 19.8 22.5 22.4 23.9 30.0 30.2 28.4 27.1Liabilities 60.8 61.2 76.9 74.5 73.3 71.7 61.0 61.1 58.7 59.5
Short-term 36.3 37.8 44.2 40.7 39.5 38.1 27.2 36.3 39.2 38.3of which:Liabilities to banks 5.7 6.2 20.4 20.6 13.6 13.0 8.5 9.1 3.1 3.9Trade payables 13.4 12.7 5.8 5.5 7.9 7.7 5.7 5.5 17.4 16.2Liabilities to affiliated companies 11.3 12.5 11.5 7.7 10.7 10.1 9.6 12.4 12.0 12.9
Long-term 24.6 23.4 32.7 33.8 33.7 33.6 33.7 24.9 19.5 21.2 of which:
Liabilities to banks 15.3 13.9 28.8 29.5 29.6 29.6 26.4 23.0 8.6 8.0Liabilities to affiliated companies 7.6 8.9 2.2 2.5 2.8 2.7 4.6 1.4 9.5 12.7
Provisions 9.6 9.8 3.0 2.8 4.1 4.2 5.3 5.2 12.1 12.5of which: Provisions for pensions 2.4 2.5 0.0 0.0 0.5 0.5 1.3 1.3 3.1 3.2
Other ratios Percentage of salesAnnual result before taxes on income 2.5 2.8 10.1 10.4 5.5 5.5 3.7 4.1 1.9 2.2Annual result and depreciation 5.9 5.9 20.8 20.9 12.3 12.4 10.2 10.2 4.2 4.3Trade receivables 9.1 8.8 7.6 7.6 8.3 8.0 8.2 8.5 9.4 9.0
Percentage of the balance sheet totalSales 172.9 176.5 113.9 112.5 137.8 140.6 106.1 108.1 205.4 209.0Annual result and interest paid 4.8 5.1 12.0 12.1 8.0 8.0 5.0 5.4 4.1 4.4
Percentage of liabilities and provisions less cashAnnual result and depreciation 15.2 15.7 33.0 34.1 25.0 26.5 16.8 17.6 12.8 13.2
Percentage of fixed assetsLong-term equity and liabilities 85.8 82.6 74.9 79.8 84.4 86.9 86.9 76.4 85.7 85.0
Percentage of short-term liabilitiesCash resources and short-term receivables 87.6 85.1 64.4 68.1 78.5 82.2 87.7 68.4 89.5 92.0Cash resources, short-term receivables and inventories 97.5 92.4 65.6 69.3 81.9 85.9 91.7 71.6 102.2 101.4
Percentage of cost of materialsTrade payables 12.8 12.2 38.8 38.7 25.2 24.7 12.9 12.6 12.4 11.7
Memo item:Balance sheet total in € billion 12.90 13.37 0.23 0.25 1.09 1.12 3.26 3.30 8.31 8.70Sales in € billion 22.30 23.61 0.27 0.28 1.50 1.58 3.46 3.57 17.07 18.18Number of enterprises 831 831 275 275 320 320 162 162 74 74
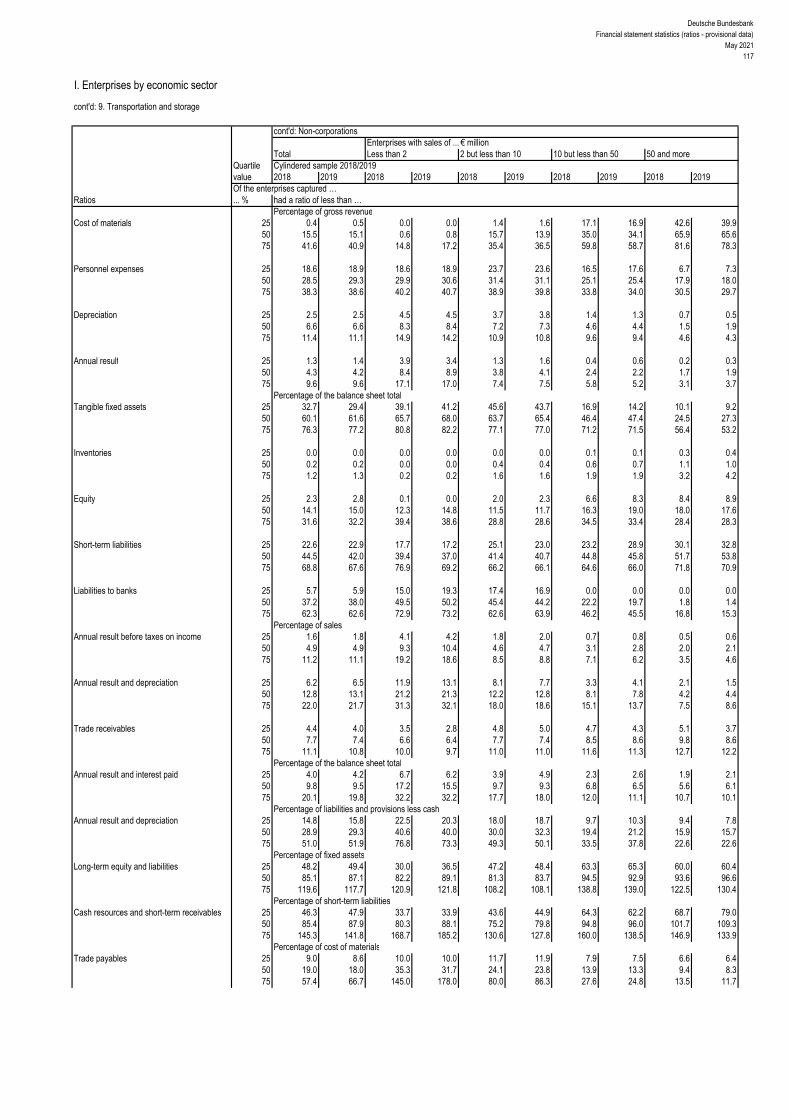
Deutsche BundesbankFinancial statement statistics (ratios - provisional data)
May 2021117
I. Enterprises by economic sector
cont'd: 9. Transportation and storage
cont'd: Non-corporationsEnterprises with sales of ... € million
Total Less than 2 2 but less than 10 10 but less than 50 50 and moreQuartile Cylindered sample 2018/2019value 2018 2019 2018 2019 2018 2019 2018 2019 2018 2019Of the enterprises captured …
Ratios ... % had a ratio of less than …Percentage of gross revenue
Cost of materials 25 0.4 0.5 0.0 0.0 1.4 1.6 17.1 16.9 42.6 39.9 50 15.5 15.1 0.6 0.8 15.7 13.9 35.0 34.1 65.9 65.6 75 41.6 40.9 14.8 17.2 35.4 36.5 59.8 58.7 81.6 78.3
Personnel expenses 25 18.6 18.9 18.6 18.9 23.7 23.6 16.5 17.6 6.7 7.3 50 28.5 29.3 29.9 30.6 31.4 31.1 25.1 25.4 17.9 18.0 75 38.3 38.6 40.2 40.7 38.9 39.8 33.8 34.0 30.5 29.7
Depreciation 25 2.5 2.5 4.5 4.5 3.7 3.8 1.4 1.3 0.7 0.5 50 6.6 6.6 8.3 8.4 7.2 7.3 4.6 4.4 1.5 1.9 75 11.4 11.1 14.9 14.2 10.9 10.8 9.6 9.4 4.6 4.3
Annual result 25 1.3 1.4 3.9 3.4 1.3 1.6 0.4 0.6 0.2 0.3 50 4.3 4.2 8.4 8.9 3.8 4.1 2.4 2.2 1.7 1.9 75 9.6 9.6 17.1 17.0 7.4 7.5 5.8 5.2 3.1 3.7
Percentage of the balance sheet totalTangible fixed assets 25 32.7 29.4 39.1 41.2 45.6 43.7 16.9 14.2 10.1 9.2
50 60.1 61.6 65.7 68.0 63.7 65.4 46.4 47.4 24.5 27.3 75 76.3 77.2 80.8 82.2 77.1 77.0 71.2 71.5 56.4 53.2
Inventories 25 0.0 0.0 0.0 0.0 0.0 0.0 0.1 0.1 0.3 0.4 50 0.2 0.2 0.0 0.0 0.4 0.4 0.6 0.7 1.1 1.0 75 1.2 1.3 0.2 0.2 1.6 1.6 1.9 1.9 3.2 4.2
Equity 25 2.3 2.8 0.1 0.0 2.0 2.3 6.6 8.3 8.4 8.9 50 14.1 15.0 12.3 14.8 11.5 11.7 16.3 19.0 18.0 17.6 75 31.6 32.2 39.4 38.6 28.8 28.6 34.5 33.4 28.4 28.3
Short-term liabilities 25 22.6 22.9 17.7 17.2 25.1 23.0 23.2 28.9 30.1 32.8 50 44.5 42.0 39.4 37.0 41.4 40.7 44.8 45.8 51.7 53.8 75 68.8 67.6 76.9 69.2 66.2 66.1 64.6 66.0 71.8 70.9
Liabilities to banks 25 5.7 5.9 15.0 19.3 17.4 16.9 0.0 0.0 0.0 0.0 50 37.2 38.0 49.5 50.2 45.4 44.2 22.2 19.7 1.8 1.4 75 62.3 62.6 72.9 73.2 62.6 63.9 46.2 45.5 16.8 15.3
Percentage of salesAnnual result before taxes on income 25 1.6 1.8 4.1 4.2 1.8 2.0 0.7 0.8 0.5 0.6
50 4.9 4.9 9.3 10.4 4.6 4.7 3.1 2.8 2.0 2.1 75 11.2 11.1 19.2 18.6 8.5 8.8 7.1 6.2 3.5 4.6
Annual result and depreciation 25 6.2 6.5 11.9 13.1 8.1 7.7 3.3 4.1 2.1 1.5 50 12.8 13.1 21.2 21.3 12.2 12.8 8.1 7.8 4.2 4.4 75 22.0 21.7 31.3 32.1 18.0 18.6 15.1 13.7 7.5 8.6
Trade receivables 25 4.4 4.0 3.5 2.8 4.8 5.0 4.7 4.3 5.1 3.7 50 7.7 7.4 6.6 6.4 7.7 7.4 8.5 8.6 9.8 8.6 75 11.1 10.8 10.0 9.7 11.0 11.0 11.6 11.3 12.7 12.2
Percentage of the balance sheet totalAnnual result and interest paid 25 4.0 4.2 6.7 6.2 3.9 4.9 2.3 2.6 1.9 2.1
50 9.8 9.5 17.2 15.5 9.7 9.3 6.8 6.5 5.6 6.1 75 20.1 19.8 32.2 32.2 17.7 18.0 12.0 11.1 10.7 10.1
Percentage of liabilities and provisions less cashAnnual result and depreciation 25 14.8 15.8 22.5 20.3 18.0 18.7 9.7 10.3 9.4 7.8
50 28.9 29.3 40.6 40.0 30.0 32.3 19.4 21.2 15.9 15.7 75 51.0 51.9 76.8 73.3 49.3 50.1 33.5 37.8 22.6 22.6
Percentage of fixed assetsLong-term equity and liabilities 25 48.2 49.4 30.0 36.5 47.2 48.4 63.3 65.3 60.0 60.4
50 85.1 87.1 82.2 89.1 81.3 83.7 94.5 92.9 93.6 96.6 75 119.6 117.7 120.9 121.8 108.2 108.1 138.8 139.0 122.5 130.4
Percentage of short-term liabilitiesCash resources and short-term receivables 25 46.3 47.9 33.7 33.9 43.6 44.9 64.3 62.2 68.7 79.0
50 85.4 87.9 80.3 88.1 75.2 79.8 94.8 96.0 101.7 109.3 75 145.3 141.8 168.7 185.2 130.6 127.8 160.0 138.5 146.9 133.9
Percentage of cost of materialsTrade payables 25 9.0 8.6 10.0 10.0 11.7 11.9 7.9 7.5 6.6 6.4
50 19.0 18.0 35.3 31.7 24.1 23.8 13.9 13.3 9.4 8.3 75 57.4 66.7 145.0 178.0 80.0 86.3 27.6 24.8 13.5 11.7

Deutsche BundesbankFinancial statement statistics (ratios - provisional data)May 2021118
I. Enterprises by economic sector
9.a) Land transport and transport via pipelines
All legal formsEnterprises with sales of ... € million
Total Less than 2 2 but less than 10 10 but less than 50 50 and moreCylindered sample 2018/2019
Ratios 2018 2019 2018 2019 2018 2019 2018 2019 2018 2019Income statementIncome Percentage of gross revenueSales 99.1 99.2 99.9 100.0 100.0 100.0 99.8 99.7 99.0 99.0Change in finished goods 0.9 0.8 0.1 0.0 0.0 0.0 0.2 0.3 1.0 1.0Interest and similar income 0.2 0.2 0.1 0.1 0.1 0.1 0.4 0.3 0.2 0.2Other income 5.5 5.9 9.2 10.2 6.1 6.0 7.3 7.2 5.1 5.6
of which: Income from long-term equity investments 0.5 0.4 0.1 0.1 0.2 0.2 0.6 0.4 0.5 0.4Total income 105.7 106.1 109.3 110.3 106.1 106.0 107.7 107.6 105.2 105.8
ExpensesCost of materials 53.4 53.4 15.2 19.0 25.5 24.5 45.2 45.1 57.5 57.7Personnel expenses 29.9 31.0 36.0 36.5 36.1 36.2 35.9 36.6 28.3 29.5Depreciation 8.1 8.1 9.2 9.1 8.4 8.4 8.8 8.6 8.0 8.0
of which: Depreciation of tangible fixed assets 7.9 8.0 9.1 9.1 8.4 8.4 8.5 8.6 7.7 7.9Interest and similar expenses 1.5 1.3 1.0 1.0 0.9 0.9 1.0 1.0 1.6 1.4Operating taxes 0.1 0.1 0.4 0.4 0.3 0.3 0.2 0.2 0.0 0.1Other expenses 13.2 13.5 42.2 38.6 32.2 33.0 18.8 18.6 10.3 10.6Total expenses before taxes on income 106.2 107.4 104.0 104.5 103.5 103.3 109.9 110.1 105.8 107.3Annual result before taxes on income - 0.5 - 1.3 5.3 5.8 2.7 2.8 - 2.1 - 2.5 - 0.6 - 1.5Taxes on income 0.7 0.6 0.9 1.0 0.9 0.9 0.7 0.7 0.6 0.5Annual result - 1.2 - 1.9 4.4 4.8 1.8 1.8 - 2.9 - 3.2 - 1.2 - 2.1Profit and loss transfers (parent company) 0.5 0.3 0.0 0.0 0.0 - 0.4 - 0.3 - 0.4 0.7 0.5Profit and loss transfers (subsidiary) - 1.5 - 2.1 - 0.7 - 0.5 - 0.8 - 1.4 - 5.1 - 5.3 - 0.9 - 1.7Profit for the year 0.8 0.6 5.1 5.3 2.6 2.8 1.9 1.7 0.4 0.1
Balance sheetAssets Percentage of the balance sheet totalIntangible fixed assets 0.5 0.6 0.6 0.5 0.3 0.3 0.5 0.5 0.5 0.6Tangible fixed assets 69.9 69.0 56.5 57.3 62.5 62.1 65.0 65.6 70.9 69.8
of which: Land and buildings 12.3 12.3 9.2 8.9 12.5 12.2 12.6 12.9 12.3 12.2Inventories 2.6 3.0 1.0 1.0 2.0 1.9 2.1 2.2 2.7 3.2
of which: Finished goods and merchandise 0.1 0.1 0.2 0.3 0.6 0.5 0.2 0.2 0.1 0.1Cash 2.5 2.9 12.9 14.3 8.3 8.7 6.8 7.2 1.6 2.0Receivables 14.7 14.7 27.0 25.0 23.6 23.8 18.6 17.6 13.7 13.9
Short-term 14.0 14.0 26.5 24.6 23.0 23.4 18.0 16.6 13.0 13.2 of which:
Trade receivables 4.2 4.2 11.7 10.7 11.3 10.9 6.3 5.9 3.6 3.7Receivables from affiliated companies 7.4 7.3 9.5 8.5 7.6 8.3 9.0 7.7 7.2 7.2
Long-term 0.7 0.7 0.6 0.4 0.7 0.4 0.7 1.0 0.7 0.6of which: Loans to affiliated companies 0.5 0.6 0.5 0.3 0.3 0.2 0.4 0.6 0.6 0.6
Securities 1.9 1.7 0.0 0.1 0.1 0.2 2.6 3.3 1.8 1.5Other long-term equity investments 7.9 8.0 1.0 0.9 2.4 2.4 4.0 3.3 8.7 8.9
of which: Goodwill 0.0 0.0 0.2 0.2 0.1 0.2 0.0 0.0 0.0 0.0
CapitalEquity 41.6 40.2 27.0 28.0 36.0 35.5 44.4 43.4 41.6 40.1Liabilities 43.0 45.2 66.9 66.1 57.3 57.5 44.4 46.0 42.1 44.4
Short-term 19.7 19.6 37.2 34.6 32.0 30.8 26.2 23.2 18.2 18.6of which:Liabilities to banks 2.8 3.1 14.9 14.3 12.7 11.3 4.5 4.1 2.1 2.5Trade payables 4.1 4.3 6.9 7.0 7.6 7.3 5.5 4.9 3.7 4.0Liabilities to affiliated companies 9.4 8.8 7.2 5.9 5.9 6.3 13.1 10.5 9.1 8.7
Long-term 23.3 25.5 29.7 31.5 25.3 26.7 18.2 22.9 23.9 25.8 of which:
Liabilities to banks 12.5 12.6 25.8 27.4 22.5 24.3 13.6 14.1 11.8 11.8Liabilities to affiliated companies 9.5 11.5 1.5 1.3 1.8 1.5 3.3 6.7 10.7 12.7
Provisions 13.8 13.1 5.9 5.7 6.3 6.6 10.7 10.2 14.5 13.8of which: Provisions for pensions 4.3 4.3 0.9 0.9 1.4 1.5 3.7 3.7 4.6 4.5
Other ratios Percentage of salesAnnual result before taxes on income - 0.6 - 1.3 5.3 5.8 2.7 2.8 - 2.1 - 2.5 - 0.6 - 1.5Annual result and depreciation 7.0 6.3 13.6 13.9 10.2 10.3 5.9 5.4 6.8 6.0Trade receivables 5.7 6.0 8.4 7.7 8.5 8.2 7.2 6.8 5.2 5.6
Percentage of the balance sheet totalSales 72.9 70.5 140.0 138.2 133.0 134.0 87.7 87.3 68.0 65.3Annual result and interest paid 0.2 - 0.4 7.6 8.0 3.6 3.6 - 1.6 - 2.0 0.3 - 0.4
Percentage of liabilities and provisions less cashAnnual result and depreciation 9.1 7.8 31.6 33.2 24.4 24.7 10.6 9.5 8.2 6.7
Percentage of fixed assetsLong-term equity and liabilities 86.1 88.0 98.2 102.0 95.1 97.6 91.3 95.1 85.1 86.8
Percentage of short-term liabilitiesCash resources and short-term receivables 84.9 87.6 105.9 112.7 97.9 104.5 95.1 103.3 81.7 83.6Cash resources, short-term receivables and inventories 98.0 102.9 108.6 115.6 104.3 110.7 103.2 112.6 96.4 100.7
Percentage of cost of materialsTrade payables 10.4 11.2 32.7 26.7 22.4 22.2 13.9 12.5 9.5 10.6
Memo item:Balance sheet total in € billion 48.84 52.23 0.27 0.30 1.69 1.79 5.55 5.88 41.34 44.27Sales in € billion 35.59 36.84 0.38 0.41 2.24 2.39 4.87 5.13 28.10 28.90Number of enterprises 1 193 1 193 390 390 488 488 224 224 91 91

Deutsche BundesbankFinancial statement statistics (ratios - provisional data)
May 2021119
I. Enterprises by economic sector
cont'd: 9.a) Land transport and transport via pipelines
cont'd: All legal formsEnterprises with sales of ... € million
Total Less than 2 2 but less than 10 10 but less than 50 50 and moreQuartile Cylindered sample 2018/2019value 2018 2019 2018 2019 2018 2019 2018 2019 2018 2019Of the enterprises captured …
Ratios ... % had a ratio of less than …Percentage of gross revenue
Cost of materials 25 0.8 0.9 0.0 0.0 2.6 2.7 24.5 24.9 40.5 41.0 50 19.0 18.4 1.1 1.2 17.0 16.0 39.7 40.5 60.6 61.9 75 43.3 43.0 15.7 17.2 37.0 35.6 60.1 61.0 76.2 74.8
Personnel expenses 25 24.2 24.9 24.5 25.5 26.1 26.1 22.7 22.8 13.2 14.4 50 33.6 34.1 34.6 35.0 34.0 35.1 32.9 33.1 24.0 25.7 75 45.4 45.6 44.5 44.2 44.7 45.3 48.9 48.8 51.8 55.2
Depreciation 25 3.4 3.4 3.8 4.1 3.6 3.7 2.9 2.9 1.9 1.9 50 7.2 7.4 7.7 7.7 7.4 7.4 6.9 7.2 5.9 6.0 75 11.6 11.4 12.0 11.3 11.4 11.6 11.6 11.2 12.4 11.8
Annual result 25 0.1 0.3 0.6 1.0 0.3 0.4 - 0.5 - 1.7 - 12.6 - 15.9 50 2.3 2.4 4.6 4.6 2.0 2.2 1.2 0.9 0.6 0.9 75 6.2 6.2 10.9 11.8 4.8 5.2 4.1 3.6 3.9 3.3
Percentage of the balance sheet totalTangible fixed assets 25 34.9 34.9 34.3 35.1 38.6 36.6 34.1 34.0 19.4 21.5
50 58.0 59.4 59.5 59.5 59.6 61.5 53.6 55.9 54.8 55.8 75 75.1 75.3 76.1 77.8 74.8 74.4 73.0 73.8 76.6 75.2
Inventories 25 0.0 0.0 0.0 0.0 0.0 0.0 0.3 0.3 0.4 0.6 50 0.4 0.4 0.0 0.0 0.6 0.6 0.9 1.0 1.9 1.8 75 1.9 2.0 0.4 0.5 2.3 2.3 2.6 2.6 3.5 4.1
Equity 25 6.8 8.4 1.1 1.9 7.4 8.4 13.3 13.7 14.6 13.6 50 22.5 23.9 16.8 18.1 22.3 22.4 29.9 30.8 26.8 26.5 75 45.6 45.5 42.9 44.0 44.3 44.5 53.1 50.7 47.1 46.7
Short-term liabilities 25 16.7 16.4 16.7 16.2 19.7 18.8 14.2 14.5 11.1 11.5 50 33.0 31.1 34.8 33.3 35.3 33.6 27.8 27.2 23.6 23.7 75 58.1 55.8 66.0 59.7 58.3 57.6 49.1 48.1 41.9 49.1
Liabilities to banks 25 3.0 4.1 7.1 13.2 7.9 7.5 0.0 0.0 0.0 0.0 50 32.2 31.7 41.7 43.9 36.9 38.3 14.2 16.0 12.2 9.9 75 55.9 57.0 65.6 65.9 58.0 58.5 36.7 38.2 28.0 29.0
Percentage of salesAnnual result before taxes on income 25 0.2 0.4 0.8 1.4 0.5 0.7 - 0.4 - 1.7 - 12.7 - 15.9
50 2.8 3.2 5.5 5.4 2.5 2.9 1.6 1.3 1.1 0.9 75 7.6 7.5 12.3 14.1 6.0 6.4 4.9 4.7 5.3 5.0
Annual result and depreciation 25 4.6 4.8 7.2 7.4 5.1 5.5 1.9 1.7 - 4.5 - 8.3 50 10.7 10.9 14.8 14.6 10.4 10.8 7.3 7.5 5.3 3.9 75 18.2 18.2 24.0 24.2 16.7 16.6 14.5 13.8 11.7 11.7
Trade receivables 25 3.8 3.5 3.7 3.1 4.6 4.4 2.7 2.6 2.5 2.3 50 7.2 6.9 6.8 6.5 7.9 7.6 7.0 6.3 5.0 4.9 75 10.7 10.1 10.6 9.6 11.0 10.7 10.7 9.9 9.1 8.6
Percentage of the balance sheet totalAnnual result and interest paid 25 1.3 1.7 2.7 3.6 1.9 2.3 - 0.2 - 1.8 - 6.2 - 6.8
50 5.7 5.8 9.8 9.9 5.4 5.7 3.6 3.6 1.4 1.3 75 13.0 12.7 21.4 22.7 11.7 11.4 8.6 7.2 8.1 6.5
Percentage of liabilities and provisions less cashAnnual result and depreciation 25 10.9 12.3 12.4 18.4 14.7 15.7 6.0 2.3 - 3.6 - 5.4
50 25.8 26.1 33.6 32.4 26.5 26.8 22.1 18.7 12.3 7.1 75 49.1 49.1 56.9 58.4 49.4 46.0 41.4 37.5 30.0 27.1
Percentage of fixed assetsLong-term equity and liabilities 25 63.6 68.8 42.3 58.9 62.8 68.4 79.2 78.0 79.0 71.0
50 96.4 98.7 95.0 101.1 93.6 96.2 104.2 100.9 96.8 95.8 75 134.3 136.5 137.6 145.4 133.6 134.7 138.5 133.8 118.8 122.0
Percentage of short-term liabilitiesCash resources and short-term receivables 25 57.0 59.8 48.3 51.4 54.2 54.9 75.9 74.2 67.6 72.7
50 106.0 111.1 103.3 108.7 95.5 104.4 120.9 120.3 120.9 123.5 75 210.7 210.2 221.3 259.4 185.6 201.5 238.5 223.5 192.3 180.8
Percentage of cost of materialsTrade payables 25 8.0 7.7 7.5 8.9 10.1 10.1 6.4 6.1 6.7 6.6
50 17.0 16.6 24.2 26.3 21.9 21.7 11.3 10.2 11.4 11.0 75 49.8 52.9 146.2 176.7 62.0 68.6 22.3 19.4 19.9 19.7

Deutsche BundesbankFinancial statement statistics (ratios - provisional data)May 2021120
I. Enterprises by economic sector
9.b) Warehousing and support activities for transportation
All legal formsEnterprises with sales of ... € million
Total Less than 2 2 but less than 10 10 but less than 50 50 and moreCylindered sample 2018/2019
Ratios 2018 2019 2018 2019 2018 2019 2018 2019 2018 2019Income statementIncome Percentage of gross revenueSales 98.4 98.5 100.0 100.2 99.9 99.8 99.9 100.0 97.9 98.0Change in finished goods 1.6 1.5 0.0 - 0.2 0.1 0.2 0.1 0.0 2.1 2.0Interest and similar income 0.2 0.3 0.1 0.2 0.2 0.2 0.1 0.1 0.2 0.4Other income 4.6 4.3 3.5 3.7 4.0 3.9 2.4 2.4 5.2 4.8
of which: Income from long-term equity investments 0.5 0.8 0.0 0.0 0.2 0.2 0.3 0.3 0.5 1.0Total income 104.8 104.6 103.7 103.9 104.2 104.0 102.5 102.5 105.4 105.2
ExpensesCost of materials 53.5 52.9 23.9 23.1 34.5 34.2 50.7 49.8 55.6 55.0Personnel expenses 24.3 25.0 29.7 31.3 29.9 30.0 24.2 25.0 23.9 24.7Depreciation 5.1 4.9 7.7 7.7 4.7 4.7 4.2 4.2 5.3 5.0
of which: Depreciation of tangible fixed assets 5.0 4.7 7.7 7.6 4.6 4.6 4.0 4.0 5.2 4.9Interest and similar expenses 1.6 1.3 1.4 1.3 0.8 0.7 1.0 0.9 1.8 1.4Operating taxes 0.1 0.2 0.4 0.4 0.3 0.3 0.2 0.2 0.1 0.1Other expenses 15.6 15.8 33.8 33.5 30.5 30.4 19.5 19.6 13.7 13.8Total expenses before taxes on income 100.3 100.0 96.9 97.3 100.7 100.2 99.6 99.6 100.4 100.1Annual result before taxes on income 4.5 4.6 6.8 6.6 3.5 3.8 2.9 2.9 5.0 5.1Taxes on income 0.9 0.9 1.6 1.5 1.0 1.0 0.9 0.9 0.9 0.9Annual result 3.6 3.7 5.2 5.1 2.5 2.8 2.0 1.9 4.1 4.2Profit and loss transfers (parent company) 0.2 0.2 0.3 0.2 0.2 0.1 0.1 0.1 0.2 0.3Profit and loss transfers (subsidiary) 2.1 2.0 0.6 0.6 0.2 0.3 0.5 0.4 2.5 2.5Profit for the year 1.8 1.9 4.9 4.7 2.5 2.6 1.6 1.6 1.8 2.0
Balance sheetAssets Percentage of the balance sheet totalIntangible fixed assets 1.0 1.0 0.3 0.3 0.5 0.5 3.4 3.2 0.7 0.7Tangible fixed assets 63.9 63.5 60.9 59.8 48.8 48.5 51.8 51.5 66.0 65.5
of which: Land and buildings 38.0 37.0 34.1 32.5 21.4 21.4 26.8 26.5 40.1 38.8Inventories 7.2 7.0 1.1 1.0 2.4 2.8 1.9 1.9 8.1 7.8
of which: Finished goods and merchandise 6.3 6.1 0.7 0.5 0.7 0.9 0.8 0.8 7.2 7.0Cash 3.4 3.4 9.5 10.2 11.6 11.4 6.8 7.0 2.6 2.6Receivables 17.6 18.0 22.0 22.3 30.2 30.2 31.2 31.6 15.3 15.8
Short-term 16.4 16.8 21.7 21.9 29.1 28.9 29.8 30.1 14.2 14.7 of which:
Trade receivables 7.8 7.4 9.4 9.8 15.3 14.9 14.4 14.3 6.7 6.3Receivables from affiliated companies 6.9 7.0 5.9 5.6 10.2 10.6 12.4 12.5 6.0 6.2
Long-term 1.2 1.2 0.3 0.4 1.1 1.3 1.3 1.6 1.1 1.1of which: Loans to affiliated companies 0.9 1.0 0.2 0.1 0.5 0.6 0.8 1.0 1.0 1.0
Securities 1.7 1.7 0.2 0.3 2.6 2.5 0.2 0.2 1.8 1.9Other long-term equity investments 5.0 5.3 5.6 5.4 3.4 3.6 4.3 4.2 5.1 5.5
of which: Goodwill 0.1 0.1 0.3 0.2 0.3 0.2 0.3 0.3 0.0 0.1
CapitalEquity 38.4 37.7 33.6 34.5 35.6 36.6 36.8 36.7 38.7 37.9Liabilities 50.8 51.2 61.5 61.0 54.4 53.6 53.2 53.0 50.3 50.9
Short-term 26.6 22.2 34.2 33.7 35.5 35.1 30.4 30.6 25.7 20.6of which:Liabilities to banks 3.8 2.7 10.4 10.8 8.5 9.0 5.0 5.3 3.5 2.1Trade payables 6.1 5.7 5.9 5.6 9.6 9.2 9.5 9.1 5.5 5.2Liabilities to affiliated companies 10.1 10.3 11.7 11.0 9.6 9.4 12.0 11.6 9.8 10.1
Long-term 24.2 29.1 27.3 27.3 18.9 18.5 22.8 22.4 24.6 30.3 of which:
Liabilities to banks 9.1 11.5 19.7 19.8 14.2 14.0 13.5 13.5 8.3 11.1Liabilities to affiliated companies 11.3 12.0 5.7 5.9 3.1 2.6 4.7 5.1 12.4 13.3
Provisions 9.8 10.1 4.6 4.4 9.7 9.4 8.5 8.8 10.0 10.3of which: Provisions for pensions 2.7 3.1 1.0 0.9 3.7 3.6 2.3 2.5 2.7 3.1
Other ratios Percentage of salesAnnual result before taxes on income 4.6 4.7 6.8 6.6 3.5 3.8 2.9 2.9 5.1 5.2Annual result and depreciation 8.9 8.7 12.9 12.8 7.2 7.5 6.2 6.1 9.6 9.4Trade receivables 8.9 8.5 9.5 9.9 9.8 9.5 10.4 10.0 8.5 8.1
Percentage of the balance sheet totalSales 87.1 87.2 98.3 99.1 155.8 157.4 137.7 142.9 78.1 77.7Annual result and interest paid 4.7 4.4 6.5 6.3 5.1 5.5 4.1 4.0 4.7 4.4
Percentage of liabilities and provisions less cashAnnual result and depreciation 13.3 12.9 22.3 23.0 21.1 22.9 15.2 15.4 12.7 12.2
Percentage of fixed assetsLong-term equity and liabilities 91.2 97.8 92.3 95.1 103.6 104.6 101.5 101.6 89.7 97.2
Percentage of short-term liabilitiesCash resources and short-term receivables 78.9 96.3 91.8 96.2 115.1 115.3 121.0 121.2 70.5 90.5Cash resources, short-term receivables and inventories 106.1 127.8 95.1 99.1 121.9 123.3 127.4 127.3 102.1 128.3
Percentage of cost of materialsTrade payables 12.9 12.2 25.2 24.5 17.9 17.0 13.5 12.7 12.5 11.9
Memo item:Balance sheet total in € billion 78.36 81.22 0.35 0.38 2.16 2.25 8.90 8.96 66.94 69.63Sales in € billion 68.25 70.84 0.35 0.38 3.37 3.54 12.26 12.81 52.28 54.11Number of enterprises 1 797 1 797 367 367 654 654 544 544 232 232

Deutsche BundesbankFinancial statement statistics (ratios - provisional data)
May 2021121
I. Enterprises by economic sector
cont'd: 9.c) Warehousing and support activities for transportation
cont'd: All legal formsEnterprises with sales of ... € million
Total Less than 2 2 but less than 10 10 but less than 50 50 and moreQuartile Cylindered sample 2018/2019value 2018 2019 2018 2019 2018 2019 2018 2019 2018 2019Of the enterprises captured …
Ratios ... % had a ratio of less than …Percentage of gross revenue
Cost of materials 25 7.9 7.2 0.0 0.0 5.5 5.8 24.6 24.9 38.3 37.1 50 34.1 32.8 7.0 7.2 25.2 24.4 49.7 48.8 65.7 65.6 75 66.5 65.8 36.2 31.7 53.6 53.1 75.0 74.0 82.4 82.2
Personnel expenses 25 13.8 14.1 14.1 13.8 18.5 18.4 11.8 12.2 8.5 8.3 50 26.1 26.5 28.5 29.9 29.6 29.9 22.1 23.1 17.3 18.0 75 37.4 38.0 43.9 45.7 39.1 39.7 32.4 33.3 31.1 31.5
Depreciation 25 0.7 0.7 0.7 0.9 0.9 0.9 0.6 0.6 0.5 0.5 50 2.4 2.5 3.0 3.3 3.1 3.3 2.1 2.1 1.3 1.3 75 6.9 7.0 9.5 9.8 7.3 7.3 5.8 5.8 4.7 4.6
Annual result 25 0.2 0.2 0.2 0.4 0.1 0.1 0.4 0.3 0.1 0.2 50 2.0 1.9 3.7 3.1 1.8 1.7 1.7 1.7 1.8 1.6 75 5.1 5.2 10.0 9.1 4.8 5.1 4.2 4.0 3.4 3.5
Percentage of the balance sheet totalTangible fixed assets 25 6.3 6.6 4.6 5.2 9.0 9.3 5.9 6.3 5.9 5.7
50 30.9 30.8 32.2 28.5 38.5 39.2 27.3 26.1 18.8 17.0 75 62.1 62.7 68.8 70.3 66.2 65.9 57.2 56.1 50.7 47.2
Inventories 25 0.0 0.0 0.0 0.0 0.0 0.0 0.0 0.0 0.0 0.0 50 0.1 0.1 0.0 0.0 0.1 0.1 0.4 0.4 0.5 0.4 75 1.5 1.6 0.5 0.3 1.6 1.9 1.8 1.9 1.9 1.8
Equity 25 8.6 9.7 6.2 10.3 7.3 9.0 10.3 11.1 9.7 9.6 50 24.2 25.8 24.7 28.3 22.8 23.7 25.0 26.1 26.6 26.1 75 46.4 47.1 50.0 51.8 43.7 46.5 45.6 46.4 44.0 44.9
Short-term liabilities 25 22.2 21.4 16.7 17.2 23.5 23.2 24.2 22.2 23.2 22.4 50 41.7 39.9 37.6 34.7 40.0 39.6 44.8 42.5 44.3 42.8 75 64.7 63.4 66.3 61.0 65.4 65.4 62.9 62.2 65.4 63.9
Liabilities to banks 25 0.0 0.0 0.0 0.0 0.0 0.0 0.0 0.0 0.0 0.0 50 6.1 6.2 8.3 9.3 13.0 13.2 3.0 2.5 0.0 0.0 75 34.4 35.6 41.8 45.2 41.3 43.1 29.0 28.5 13.6 11.6
Percentage of salesAnnual result before taxes on income 25 0.4 0.4 0.4 0.5 0.3 0.2 0.6 0.5 0.3 0.3
50 2.7 2.5 4.6 4.0 2.5 2.3 2.4 2.4 2.2 2.2 75 6.7 6.4 12.7 11.0 6.4 6.5 5.3 5.1 4.5 4.8
Annual result and depreciation 25 2.4 2.3 3.4 2.9 2.6 2.6 2.3 2.1 1.5 1.5 50 6.3 6.3 9.6 9.5 7.1 7.0 5.1 5.1 4.3 4.2 75 12.7 12.8 22.6 22.2 12.3 13.1 10.9 10.4 9.6 9.2
Trade receivables 25 4.7 4.5 3.1 3.0 5.2 5.0 5.3 5.0 5.3 4.5 50 9.0 8.6 7.8 7.9 8.9 8.3 9.6 9.1 10.3 9.7 75 13.3 12.7 13.3 13.2 12.7 12.3 13.4 12.6 14.1 13.3
Percentage of the balance sheet totalAnnual result and interest paid 25 1.9 1.7 1.6 1.9 2.0 1.7 2.0 1.9 1.1 1.5
50 5.8 5.7 7.6 6.6 5.7 5.6 5.5 5.8 5.2 5.2 75 12.1 11.8 17.7 15.9 11.6 11.6 11.5 11.2 9.9 8.8
Percentage of liabilities and provisions less cashAnnual result and depreciation 25 6.9 7.3 2.8 3.1 7.4 8.0 8.2 8.0 7.9 8.3
50 21.1 21.1 22.3 20.0 23.5 23.8 20.6 22.1 15.9 15.9 75 43.2 45.1 48.5 52.4 44.2 46.5 43.3 43.8 31.0 31.1
Percentage of fixed assetsLong-term equity and liabilities 25 72.4 73.8 70.5 76.2 66.6 66.6 79.8 82.5 75.3 80.6
50 112.8 113.2 111.5 118.8 107.9 106.2 119.4 116.1 119.1 118.0 75 244.4 248.1 243.9 305.6 226.0 214.9 271.1 246.9 286.0 255.2
Percentage of short-term liabilitiesCash resources and short-term receivables 25 75.0 79.0 64.0 77.8 68.7 64.4 88.5 89.2 91.8 94.4
50 130.4 132.1 135.8 142.3 120.5 117.5 130.4 133.0 138.7 141.8 75 213.5 223.7 248.4 261.8 207.3 216.9 202.7 218.3 214.7 212.3
Percentage of cost of materialsTrade payables 25 7.7 7.5 7.7 8.6 9.2 9.2 7.0 6.7 6.5 6.4
50 13.7 13.3 19.0 21.7 17.3 16.2 11.1 11.0 10.1 9.3 75 27.6 27.5 66.0 89.2 37.8 40.5 20.5 18.1 15.1 14.1

Deutsche BundesbankFinancial statement statistics (ratios - provisional data)May 2021122
I. Enterprises by economic sector
10. Accommodation and food service activities
All legal formsEnterprises with sales of ... € million
Total Less than 2 2 but less than 10 10 but less than 50 50 and moreCylindered sample 2018/2019
Ratios 2018 2019 2018 2019 2018 2019 2018 2019 2018 2019Income statementIncome Percentage of gross revenueSales 100.0 100.0 100.0 99.9 100.0 100.0 100.0 100.0 100.0 99.9Change in finished goods 0.0 0.0 0.0 0.1 0.0 0.0 0.0 0.0 0.0 0.1Interest and similar income 0.2 0.2 0.1 0.1 0.2 0.1 0.1 0.1 0.2 0.2Other income 2.5 2.8 2.9 3.3 3.2 3.6 3.0 3.1 2.1 2.4
of which: Income from long-term equity investments 0.2 0.2 0.0 0.0 0.0 0.1 0.0 0.0 0.3 0.3Total income 102.7 103.0 103.0 103.3 103.4 103.7 103.1 103.2 102.3 102.6
ExpensesCost of materials 30.0 30.3 23.9 23.9 22.6 22.5 27.4 27.2 33.4 34.1Personnel expenses 31.1 31.2 37.0 36.6 35.2 34.6 33.2 33.7 28.7 28.7Depreciation 3.1 3.1 4.1 4.0 3.9 3.8 3.8 3.6 2.5 2.6
of which: Depreciation of tangible fixed assets 3.1 3.0 4.1 4.0 3.8 3.8 3.7 3.5 2.5 2.5Interest and similar expenses 0.6 0.5 1.0 0.9 0.9 0.7 1.0 0.9 0.3 0.3Operating taxes 0.2 0.1 0.2 0.2 0.1 0.1 0.2 0.1 0.2 0.1Other expenses 32.5 32.7 31.9 30.9 35.6 35.6 34.0 33.9 31.1 31.6Total expenses before taxes on income 97.6 97.9 98.1 96.5 98.3 97.3 99.6 99.3 96.3 97.4Annual result before taxes on income 5.1 5.0 4.8 6.9 5.1 6.4 3.5 3.9 6.0 5.2Taxes on income 1.0 1.0 1.2 1.4 1.3 1.4 0.9 0.9 0.9 0.9Annual result 4.1 4.1 3.6 5.4 3.8 5.0 2.5 3.0 5.1 4.3Profit and loss transfers (parent company) 0.0 0.0 0.1 0.0 0.3 0.1 0.1 0.1 - 0.1 0.0Profit and loss transfers (subsidiary) 2.3 2.0 - 0.1 - 0.1 1.0 1.0 1.3 1.7 3.3 2.5Profit for the year 1.8 2.1 3.8 5.6 3.1 4.1 1.4 1.4 1.7 1.8
Balance sheetAssets Percentage of the balance sheet totalIntangible fixed assets 2.0 1.8 0.6 0.5 1.1 1.1 3.0 2.5 1.6 1.5Tangible fixed assets 39.5 40.0 61.3 60.1 54.3 53.5 47.2 45.9 26.7 28.6
of which: Land and buildings 21.7 21.6 36.0 36.1 32.9 32.1 30.2 28.5 10.1 10.8Inventories 2.7 2.9 2.7 3.0 2.8 3.4 2.4 2.4 2.9 3.2
of which: Finished goods and merchandise 1.5 1.6 2.2 2.2 1.5 1.5 1.1 1.1 1.9 1.9Cash 11.7 11.8 14.7 14.5 12.3 12.0 14.1 13.9 9.4 9.5Receivables 36.2 34.9 18.9 20.1 25.9 25.4 24.5 27.1 50.3 46.4
Short-term 32.2 30.2 18.7 20.0 24.6 23.6 23.2 25.1 43.0 37.8 of which:
Trade receivables 8.5 9.2 5.1 5.5 5.2 5.4 5.8 5.7 12.0 13.9Receivables from affiliated companies 18.5 16.1 5.9 6.6 11.6 12.6 12.2 14.9 26.8 19.1
Long-term 4.0 4.7 0.3 0.2 1.3 1.8 1.3 2.0 7.3 8.6of which: Loans to affiliated companies 3.5 4.2 0.0 0.0 0.5 0.5 0.8 1.4 7.0 8.3
Securities 0.5 0.5 0.1 0.1 0.4 0.5 1.1 1.1 0.0 0.0Other long-term equity investments 6.5 7.0 0.8 0.9 2.6 3.4 6.7 6.1 8.0 9.6
of which: Goodwill 2.6 2.7 0.5 0.5 1.9 2.0 4.0 3.5 1.8 2.5
CapitalEquity 29.9 30.4 21.1 24.1 29.0 32.5 28.1 26.2 32.3 34.2Liabilities 54.3 55.7 73.2 70.4 63.7 60.2 60.9 63.0 44.4 46.4
Short-term 34.3 36.7 39.7 39.5 34.5 33.9 30.8 34.5 36.5 39.2of which:Liabilities to banks 2.7 3.5 11.1 10.2 5.1 5.2 2.3 4.1 1.5 1.8Trade payables 10.8 10.6 8.7 8.4 8.3 8.0 7.5 6.7 14.5 15.1Liabilities to affiliated companies 12.5 14.1 7.3 7.7 10.6 11.2 12.9 16.1 13.3 14.0
Long-term 20.0 19.1 33.5 30.9 29.2 26.2 30.0 28.5 7.8 7.2 of which:
Liabilities to banks 12.1 11.5 24.0 24.4 22.5 20.7 17.0 17.1 3.8 2.4Liabilities to affiliated companies 6.1 5.8 5.2 4.1 4.3 2.7 10.7 9.3 2.9 3.9
Provisions 14.4 12.3 5.3 5.2 6.5 6.6 9.3 9.0 21.9 17.9of which: Provisions for pensions 1.3 1.3 0.2 0.2 0.8 0.7 1.2 1.1 1.7 1.7
Other ratios Percentage of salesAnnual result before taxes on income 5.1 5.0 4.8 6.9 5.1 6.4 3.5 3.9 6.0 5.2Annual result and depreciation 7.2 7.1 7.7 9.4 7.7 8.8 6.3 6.5 7.6 6.9Trade receivables 4.2 4.4 2.7 2.8 3.0 3.0 3.6 3.6 5.0 5.3
Percentage of the balance sheet totalSales 200.6 208.3 187.4 191.9 172.7 179.2 161.2 159.5 242.4 262.7Annual result and interest paid 9.5 9.6 8.6 12.2 8.2 10.4 5.7 6.1 13.1 12.2
Percentage of liabilities and provisions less cashAnnual result and depreciation 24.8 25.6 22.6 29.5 22.5 28.5 17.5 17.4 31.7 32.2
Percentage of fixed assetsLong-term equity and liabilities 97.7 93.9 86.9 89.5 98.9 98.4 100.0 97.1 96.0 89.3
Percentage of short-term liabilitiesCash resources and short-term receivables 128.2 114.6 84.2 87.4 106.9 104.8 120.8 113.5 143.5 120.8Cash resources, short-term receivables and inventories 136.0 122.5 91.0 95.0 115.2 114.9 128.5 120.5 151.5 128.8
Percentage of cost of materialsTrade payables 18.0 16.8 19.4 18.4 21.2 19.8 17.1 15.5 17.8 16.9
Memo item:Balance sheet total in € billion 5.58 5.70 0.21 0.23 0.79 0.80 2.05 2.20 2.53 2.47Sales in € billion 11.19 11.87 0.40 0.44 1.37 1.43 3.30 3.51 6.12 6.48Number of enterprises 949 949 454 454 298 298 161 161 36 36

Deutsche BundesbankFinancial statement statistics (ratios - provisional data)
May 2021123
I. Enterprises by economic sector
cont'd: 10. Accommodation and food service activities
cont'd: All legal formsEnterprises with sales of ... € million
Total Less than 2 2 but less than 10 10 but less than 50 50 and moreQuartile Cylindered sample 2018/2019value 2018 2019 2018 2019 2018 2019 2018 2019 2018 2019Of the enterprises captured …
Ratios ... % had a ratio of less than …Percentage of gross revenue
Cost of materials 25 15.7 15.1 17.3 16.4 13.5 13.2 16.2 17.4 25.4 25.0 50 25.4 25.1 26.3 25.7 23.3 22.8 26.2 25.9 35.4 36.0 75 31.9 30.8 32.0 30.9 29.0 28.7 33.9 35.0 44.4 45.0
Personnel expenses 25 26.8 26.6 27.7 27.8 28.5 28.0 24.2 24.2 21.6 21.5 50 34.8 34.8 35.8 35.6 35.4 35.0 31.3 32.9 30.8 31.2 75 41.6 41.9 42.5 42.0 41.4 41.9 41.2 42.3 35.8 36.4
Depreciation 25 1.4 1.3 1.7 1.6 1.4 1.2 0.7 0.7 0.8 0.8 50 2.9 2.7 3.1 2.9 2.8 2.7 2.1 2.2 1.9 2.2 75 5.3 5.2 5.7 5.3 5.2 5.3 5.2 5.1 3.3 3.3
Annual result 25 0.1 0.5 - 0.1 0.7 0.3 1.0 0.0 0.0 1.1 0.2 50 3.3 4.0 3.8 5.0 3.3 4.3 2.0 2.0 3.8 2.8 75 8.3 9.1 9.9 10.8 7.7 9.0 5.5 5.7 6.8 6.0
Percentage of the balance sheet totalTangible fixed assets 25 13.8 13.6 17.8 16.2 12.9 12.9 7.4 7.3 9.1 11.3
50 36.1 35.6 42.1 40.9 34.5 34.5 25.5 26.8 20.6 21.2 75 66.3 63.1 72.1 69.4 64.5 61.1 61.2 57.9 43.2 38.2
Inventories 25 0.8 0.8 0.5 0.5 0.9 1.0 0.9 0.9 1.3 1.5 50 2.5 2.6 2.5 2.6 2.6 2.6 2.4 2.4 4.4 4.4 75 5.9 6.0 6.4 6.7 5.1 5.3 5.9 5.5 6.6 6.4
Equity 25 0.7 2.1 - 12.9 0.0 2.6 4.3 2.2 1.6 3.6 6.5 50 17.6 20.8 13.9 19.8 20.7 24.6 19.5 18.6 14.8 16.2 75 44.4 47.6 44.4 48.3 46.5 48.8 39.7 41.3 38.8 37.9
Short-term liabilities 25 19.5 19.6 18.9 19.8 19.5 19.6 19.3 18.9 25.8 29.1 50 38.9 38.0 40.0 39.7 35.7 34.3 38.0 37.5 53.3 55.9 75 72.3 66.5 80.7 74.9 65.1 57.1 62.2 66.0 65.3 67.2
Liabilities to banks 25 0.0 0.0 0.0 0.0 0.0 0.0 0.0 0.0 0.0 0.0 50 3.2 2.9 8.0 9.5 5.0 4.5 0.0 0.0 0.0 0.0 75 38.0 35.6 47.3 42.4 37.3 35.1 19.8 24.4 5.4 1.6
Percentage of salesAnnual result before taxes on income 25 0.1 0.7 - 0.1 0.8 0.4 1.5 0.0 0.1 1.2 0.3
50 4.1 5.1 4.5 6.0 4.2 5.4 2.6 2.8 4.5 3.8 75 10.4 11.3 11.7 13.6 9.8 10.9 7.4 7.2 8.2 8.8
Annual result and depreciation 25 2.5 3.7 2.5 3.8 3.2 4.3 1.5 2.3 3.4 1.8 50 7.6 8.5 8.3 10.0 7.8 8.7 5.9 5.9 6.4 6.3 75 14.3 15.3 16.2 17.2 14.7 14.8 11.3 11.1 11.1 10.0
Trade receivables 25 0.1 0.2 0.0 0.0 0.5 0.4 1.2 1.2 1.2 1.4 50 1.4 1.4 0.7 0.6 1.8 1.8 3.1 2.9 3.4 4.0 75 3.6 3.6 2.5 2.8 3.6 3.8 4.9 4.6 7.9 9.1
Percentage of the balance sheet totalAnnual result and interest paid 25 1.4 2.9 0.9 3.4 2.0 4.2 1.1 0.9 5.2 1.6
50 8.6 10.9 10.5 14.7 9.1 10.9 5.7 5.8 14.1 9.8 75 22.9 26.9 28.6 34.9 22.2 25.2 15.0 14.0 23.0 19.8
Percentage of liabilities and provisions less cashAnnual result and depreciation 25 3.5 7.2 - 5.5 3.4 8.2 10.9 7.6 7.7 13.9 9.6
50 21.7 26.3 20.6 26.6 22.7 28.8 20.6 23.7 29.4 24.6 75 59.1 66.7 59.1 74.3 62.9 75.3 55.5 42.9 63.4 48.6
Percentage of fixed assetsLong-term equity and liabilities 25 44.4 49.9 25.7 38.2 66.4 73.9 61.0 48.3 38.5 39.2
50 98.4 101.1 95.5 100.0 104.1 106.4 96.1 100.3 79.9 79.9 75 183.2 203.6 176.9 206.2 219.6 209.8 194.2 208.4 120.4 116.2
Percentage of short-term liabilitiesCash resources and short-term receivables 25 51.9 57.0 39.3 44.7 56.6 67.9 71.0 71.6 65.2 77.0
50 106.7 113.4 97.3 106.8 110.4 123.0 122.3 111.5 102.9 116.0 75 229.2 226.4 241.1 239.8 228.4 218.4 224.0 230.9 171.9 172.7
Percentage of cost of materialsTrade payables 25 7.5 7.0 5.7 5.3 10.1 9.6 8.1 8.3 10.4 9.3
50 14.6 13.4 12.8 10.8 16.9 15.1 14.9 13.0 16.2 16.1 75 28.6 26.2 25.3 22.4 33.5 32.3 34.1 25.6 21.6 20.6

Deutsche BundesbankFinancial statement statistics (ratios - provisional data)May 2021124
I. Enterprises by economic sector
11. Information and communication
All legal formsEnterprises with sales of ... € million
Total Less than 2 2 but less than 10 10 but less than 50 50 and moreCylindered sample 2018/2019
Ratios 2018 2019 2018 2019 2018 2019 2018 2019 2018 2019Income statementIncome Percentage of gross revenueSales 99.6 99.7 98.4 97.7 98.6 98.7 99.3 99.5 99.7 99.8Change in finished goods 0.4 0.3 1.6 2.3 1.4 1.3 0.7 0.5 0.3 0.2Interest and similar income 0.8 0.8 0.1 0.1 0.2 0.2 0.2 0.2 0.9 0.9Other income 7.3 6.9 4.2 4.4 3.7 3.7 3.0 3.0 7.9 7.5
of which: Income from long-term equity investments 1.6 2.1 0.2 0.2 0.5 0.4 0.5 0.5 1.8 2.4Total income 108.0 107.6 104.4 104.5 103.8 103.9 103.2 103.2 108.8 108.4
ExpensesCost of materials 45.4 45.4 26.8 27.7 32.0 32.0 35.1 35.1 47.2 47.3Personnel expenses 23.7 24.3 44.2 44.4 42.3 42.1 37.2 37.2 21.4 21.9Depreciation 10.3 8.2 3.9 3.8 3.9 4.2 4.1 4.4 11.3 8.8
of which: Depreciation of tangible fixed assets 9.5 7.8 3.6 3.5 3.8 4.0 3.8 3.8 10.5 8.4Interest and similar expenses 2.9 2.6 0.8 0.7 0.7 0.7 0.8 0.7 3.2 2.9Operating taxes 0.1 0.0 0.1 0.1 0.0 0.0 0.1 0.0 0.1 0.0Other expenses 21.1 20.4 22.5 22.0 19.0 19.2 20.0 19.9 21.3 20.5Total expenses before taxes on income 103.5 101.0 98.4 98.6 97.9 98.3 97.3 97.4 104.5 101.6Annual result before taxes on income 4.5 6.6 6.0 5.8 5.9 5.6 5.9 5.9 4.3 6.8Taxes on income 1.8 1.5 1.9 1.7 1.7 1.6 1.8 1.8 1.8 1.5Annual result 2.7 5.1 4.1 4.2 4.3 4.0 4.1 4.1 2.4 5.3Profit and loss transfers (parent company) 3.8 0.8 - 0.2 0.0 0.4 0.5 0.3 0.3 4.4 0.9Profit and loss transfers (subsidiary) 2.0 2.8 0.5 0.4 1.0 1.3 1.8 1.8 2.0 3.0Profit for the year 4.6 3.1 3.4 3.8 3.6 3.2 2.6 2.6 4.8 3.2
Balance sheetAssets Percentage of the balance sheet totalIntangible fixed assets 4.5 4.2 6.2 5.9 3.7 3.6 4.0 4.0 4.6 4.2Tangible fixed assets 12.6 12.7 15.6 14.8 21.3 22.0 15.0 15.6 12.4 12.5
of which: Land and buildings 3.1 3.1 3.3 2.8 6.2 5.9 3.5 3.5 3.1 3.1Inventories 1.3 1.3 7.3 7.6 7.9 7.2 6.0 5.3 1.0 1.1
of which: Finished goods and merchandise 0.5 0.5 4.1 3.3 2.4 2.2 1.4 1.6 0.4 0.4Cash 4.4 3.1 25.4 26.2 18.0 18.2 17.5 16.0 3.8 2.4Receivables 30.9 29.9 37.8 37.2 39.8 38.5 40.3 41.8 30.5 29.3
Short-term 22.7 16.9 36.5 35.8 38.3 36.9 37.7 39.2 22.0 15.7 of which:
Trade receivables 3.7 3.9 20.4 19.5 20.5 19.9 16.5 16.5 3.1 3.2Receivables from affiliated companies 17.6 11.4 10.4 10.8 13.2 12.0 17.7 19.2 17.6 11.1
Long-term 8.2 13.0 1.3 1.4 1.6 1.7 2.6 2.6 8.4 13.5of which: Loans to affiliated companies 7.7 10.5 0.2 0.2 1.2 1.3 2.1 2.2 7.9 11.0
Securities 1.2 1.2 1.4 1.3 0.8 0.6 2.0 1.8 1.2 1.2Other long-term equity investments 44.2 46.0 4.6 5.4 6.9 8.1 13.2 13.1 45.7 47.8
of which: Goodwill 0.8 0.6 0.6 0.6 1.0 0.7 2.1 1.6 0.7 0.6
CapitalEquity 36.3 35.1 33.9 37.3 33.6 33.3 35.6 35.5 36.3 35.1Liabilities 53.1 53.7 51.7 49.6 50.1 50.3 42.4 42.9 53.6 54.2
Short-term 24.4 26.7 36.8 36.6 36.7 35.6 31.8 32.9 24.0 26.3of which:Liabilities to banks 1.0 1.5 4.3 4.3 4.7 4.3 2.4 3.1 0.9 1.4Trade payables 2.6 2.6 8.7 8.7 8.7 8.4 6.5 6.5 2.4 2.4Liabilities to affiliated companies 17.0 18.4 9.2 8.1 13.5 13.2 15.2 16.1 17.1 18.5
Long-term 28.7 27.0 14.9 13.1 13.3 14.8 10.6 10.0 29.6 27.9 of which:
Liabilities to banks 2.2 3.1 7.9 7.1 6.8 7.5 5.0 4.3 2.1 3.0Liabilities to affiliated companies 22.3 18.7 4.0 3.8 4.5 5.7 4.6 4.7 23.2 19.5
Provisions 9.3 9.8 10.4 9.3 12.0 11.8 16.7 16.2 9.0 9.5of which: Provisions for pensions 4.2 4.5 1.8 1.3 2.1 2.0 4.5 4.4 4.2 4.5
Other ratios Percentage of salesAnnual result before taxes on income 4.5 6.7 6.1 6.0 6.0 5.7 6.0 5.9 4.3 6.8Annual result and depreciation 13.0 13.3 8.1 8.1 8.3 8.3 8.3 8.5 13.8 14.2Trade receivables 8.4 8.4 12.2 12.1 13.6 13.3 12.6 12.4 7.6 7.7
Percentage of the balance sheet totalSales 44.5 46.5 167.3 160.6 150.2 150.0 130.9 132.6 40.1 41.9Annual result and interest paid 2.5 3.6 8.3 8.0 7.5 7.2 6.4 6.4 2.3 3.5
Percentage of liabilities and provisions less cashAnnual result and depreciation 9.8 10.0 33.3 35.7 25.7 25.8 23.3 23.3 9.3 9.5
Percentage of fixed assetsLong-term equity and liabilities 98.2 86.5 179.2 185.0 145.5 140.3 140.0 135.7 97.2 85.3
Percentage of short-term liabilitiesCash resources and short-term receivables 112.0 75.5 170.7 171.9 154.6 155.9 175.4 168.8 108.1 69.5Cash resources, short-term receivables and inventories 117.3 80.4 190.6 192.6 176.1 176.1 194.2 184.9 112.5 73.6
Percentage of cost of materialsTrade payables 12.7 12.4 19.0 19.2 17.8 17.4 14.1 13.9 12.4 12.1
Memo item:Balance sheet total in € billion 298.77 300.88 0.36 0.43 2.03 2.27 11.35 12.13 285.03 286.05Sales in € billion 132.86 139.89 0.61 0.69 3.04 3.41 14.86 16.08 114.35 119.71Number of enterprises 2 399 2 399 802 802 633 633 657 657 307 307

Deutsche BundesbankFinancial statement statistics (ratios - provisional data)
May 2021125
I. Enterprises by economic sector
cont'd: 11. Information and communication
cont'd: All legal formsEnterprises with sales of ... € million
Total Less than 2 2 but less than 10 10 but less than 50 50 and moreQuartile Cylindered sample 2018/2019value 2018 2019 2018 2019 2018 2019 2018 2019 2018 2019Of the enterprises captured …
Ratios ... % had a ratio of less than …Percentage of gross revenue
Cost of materials 25 10.1 10.3 2.3 3.7 11.8 11.8 14.3 14.0 25.1 24.9 50 28.7 29.0 19.9 21.4 28.2 28.2 30.9 31.8 43.7 43.5 75 49.2 49.1 43.6 43.0 47.4 47.3 51.9 53.1 62.1 63.4
Personnel expenses 25 22.1 22.0 22.3 23.6 27.1 26.5 21.1 20.8 13.4 13.7 50 39.0 39.5 42.0 42.6 43.2 42.7 37.4 36.9 28.6 28.8 75 57.2 57.1 62.0 61.4 59.7 58.4 54.8 54.2 45.8 45.3
Depreciation 25 0.8 0.8 0.7 0.7 0.8 0.8 0.8 0.8 0.8 0.7 50 1.8 1.8 1.8 1.8 1.7 1.7 1.8 1.9 2.4 2.3 75 4.3 4.2 3.9 3.6 3.7 3.6 4.8 4.6 6.0 5.8
Annual result 25 0.4 0.7 - 0.2 0.9 0.9 1.2 0.8 0.6 0.2 0.2 50 3.8 4.0 4.0 4.8 3.7 4.1 4.0 3.7 3.0 2.9 75 9.3 9.4 12.3 12.3 8.2 8.2 9.0 8.8 6.6 7.0
Percentage of the balance sheet totalTangible fixed assets 25 1.6 1.5 1.0 1.1 2.2 2.0 1.6 1.6 1.7 1.6
50 5.2 5.1 5.3 4.6 5.5 5.4 4.9 5.1 5.4 5.1 75 16.3 15.2 17.4 14.7 15.2 15.2 16.8 15.4 16.2 15.4
Inventories 25 0.0 0.0 0.0 0.0 0.0 0.0 0.0 0.0 0.0 0.0 50 0.4 0.5 0.0 0.0 1.2 1.1 0.6 0.7 0.9 0.8 75 6.9 7.4 4.8 7.1 9.3 9.1 6.8 5.8 7.6 6.8
Equity 25 11.5 11.9 6.4 10.2 14.5 15.9 13.3 12.3 11.6 9.4 50 32.4 34.9 33.7 37.5 33.6 36.0 33.3 34.9 29.2 29.1 75 55.6 57.1 60.0 64.5 55.7 55.6 53.2 54.7 47.0 46.3
Short-term liabilities 25 14.8 14.2 14.8 14.3 16.0 16.5 13.9 13.4 13.7 13.1 50 31.1 30.1 33.3 30.8 31.4 31.1 28.2 29.0 30.2 29.8 75 55.4 54.1 62.4 58.8 54.7 54.7 52.0 50.9 51.7 49.6
Liabilities to banks 25 0.0 0.0 0.0 0.0 0.0 0.0 0.0 0.0 0.0 0.0 50 0.0 0.0 0.0 0.0 0.0 0.0 0.0 0.0 0.0 0.0 75 7.5 8.1 13.1 13.0 10.1 11.2 4.4 3.5 0.4 0.1
Percentage of salesAnnual result before taxes on income 25 0.8 1.1 0.0 1.0 1.5 1.6 1.2 1.0 0.3 0.4
50 5.1 5.3 5.3 6.3 5.2 5.4 5.5 5.3 4.1 3.6 75 12.0 12.1 15.7 14.9 10.9 11.2 11.6 11.4 8.4 8.8
Annual result and depreciation 25 3.0 3.4 1.8 3.3 3.6 3.7 3.6 3.7 2.8 2.9 50 8.3 8.6 8.4 9.1 8.1 8.4 8.9 8.6 7.9 7.4 75 16.6 16.7 20.6 19.1 15.3 15.9 15.8 15.6 15.1 15.0
Trade receivables 25 4.4 4.2 3.7 3.5 5.9 5.9 4.2 4.3 3.4 3.2 50 10.2 10.0 8.9 9.0 11.3 11.4 10.8 11.0 8.8 9.0 75 16.8 16.4 16.4 15.8 17.1 16.6 17.2 16.6 16.8 16.2
Percentage of the balance sheet totalAnnual result and interest paid 25 1.9 2.5 0.3 2.7 3.0 3.3 2.3 2.3 1.3 1.6
50 8.3 8.9 10.1 10.7 9.5 10.1 7.8 7.9 5.7 5.7 75 19.2 20.1 26.3 27.1 18.7 19.6 16.4 16.2 12.8 12.2
Percentage of liabilities and provisions less cashAnnual result and depreciation 25 - 3.2 - 0.7 - 32.6 - 25.7 1.0 - 1.1 4.5 5.3 6.5 6.8
50 19.7 22.7 12.6 18.9 23.7 24.8 22.7 24.6 20.8 20.8 75 61.8 63.1 65.6 66.7 68.2 85.0 58.5 59.7 44.0 43.4
Percentage of fixed assetsLong-term equity and liabilities 25 93.9 96.1 89.2 97.3 101.2 100.3 98.8 97.9 87.0 89.3
50 221.0 227.5 261.3 285.7 270.1 282.8 190.4 192.8 147.4 161.7 75 701.7 733.9 800.0 906.7 831.3 881.5 554.5 575.3 478.0 466.6
Percentage of short-term liabilitiesCash resources and short-term receivables 25 106.4 108.4 101.4 101.1 106.8 108.9 116.3 113.6 104.3 109.9
50 200.0 207.1 202.2 218.9 206.0 211.8 204.1 203.9 171.0 184.7 75 449.8 459.1 496.2 503.5 441.9 423.0 441.1 448.3 387.2 423.5
Percentage of cost of materialsTrade payables 25 5.9 5.8 5.0 5.5 7.9 7.8 5.7 5.4 4.2 4.1
50 12.6 11.8 13.0 12.3 15.1 13.9 11.9 11.2 9.8 8.9 75 24.8 23.1 30.4 29.8 28.5 25.4 21.4 21.5 16.3 15.7

Deutsche BundesbankFinancial statement statistics (ratios - provisional data)May 2021126
I. Enterprises by economic sector
11.a) Publishing activities
All legal formsEnterprises with sales of ... € million
Total Less than 2 2 but less than 10 10 but less than 50 50 and moreCylindered sample 2018/2019
Ratios 2018 2019 2018 2019 2018 2019 2018 2019 2018 2019Income statementIncome Percentage of gross revenueSales 99.8 100.0 99.6 99.7 98.4 99.0 99.7 99.9 99.9 100.1Change in finished goods 0.2 0.0 0.4 0.3 1.6 1.0 0.3 0.1 0.1 - 0.1Interest and similar income 0.5 0.8 0.2 0.2 0.3 0.2 0.3 0.3 0.5 0.9Other income 8.0 6.7 5.0 2.5 2.3 2.8 3.7 3.0 9.6 8.0
of which: Income from long-term equity investments 2.6 2.6 0.0 0.0 0.1 0.2 1.4 1.5 3.1 3.1Total income 108.5 107.4 105.2 102.7 102.6 103.0 104.0 103.4 110.2 109.0
ExpensesCost of materials 41.8 42.8 33.8 33.3 35.0 35.7 36.2 38.0 43.9 44.7Personnel expenses 23.5 24.9 31.7 31.1 32.5 32.0 26.2 25.1 22.3 24.5Depreciation 6.0 4.0 1.6 1.7 3.3 3.4 4.2 4.4 6.7 3.9
of which: Depreciation of tangible fixed assets 2.6 2.6 1.5 1.6 3.1 2.6 3.7 3.4 2.2 2.3Interest and similar expenses 1.5 1.5 1.2 1.3 0.6 1.0 0.8 0.9 1.8 1.7Operating taxes 0.1 0.2 0.0 0.0 0.0 0.0 0.1 0.1 0.1 0.2Other expenses 28.1 28.2 38.3 32.8 25.2 25.4 28.2 26.7 28.1 28.7Total expenses before taxes on income 101.1 101.5 106.6 100.3 96.5 97.4 95.7 95.3 102.9 103.7Annual result before taxes on income 7.4 5.9 - 1.4 2.4 6.1 5.6 8.2 8.1 7.2 5.2Taxes on income 2.3 1.4 0.6 0.7 1.3 1.3 1.8 2.2 2.5 1.2Annual result 5.1 4.5 - 2.1 1.7 4.8 4.3 6.4 5.9 4.7 4.0Profit and loss transfers (parent company) 8.1 6.0 - 3.3 0.0 0.0 0.0 0.2 0.3 10.9 8.1Profit and loss transfers (subsidiary) 0.7 1.1 0.3 0.2 0.5 0.5 1.0 1.9 0.6 0.9Profit for the year 12.4 9.3 - 5.6 1.5 4.3 3.8 5.6 4.3 15.0 11.3
Balance sheetAssets Percentage of the balance sheet totalIntangible fixed assets 1.4 1.3 1.9 2.4 4.7 5.0 4.0 3.7 1.1 1.0Tangible fixed assets 5.2 5.4 6.3 5.3 2.8 2.7 9.7 8.8 4.8 5.1
of which: Land and buildings 2.8 2.6 1.5 1.2 0.2 0.1 5.9 6.0 2.5 2.3Inventories 2.4 2.3 20.5 17.4 13.0 12.6 7.3 7.1 1.8 1.8
of which: Finished goods and merchandise 1.2 1.2 19.2 16.1 10.8 10.6 4.5 4.7 0.7 0.7Cash 6.0 5.6 15.5 11.2 22.3 24.3 19.4 18.3 4.5 4.2Receivables 14.3 18.0 47.7 55.7 40.3 38.7 27.6 30.8 12.7 16.5
Short-term 11.4 13.2 47.5 55.5 37.5 37.4 27.0 30.3 9.5 11.2 of which:
Trade receivables 2.8 3.2 18.2 14.6 22.9 23.5 10.9 11.5 1.8 2.1Receivables from affiliated companies 7.5 8.5 24.1 37.6 10.3 8.2 12.5 15.1 7.0 7.7
Long-term 2.9 4.8 0.2 0.2 2.8 1.4 0.7 0.4 3.1 5.3of which: Loans to affiliated companies 2.8 4.7 0.2 0.1 1.3 0.5 0.6 0.4 3.0 5.2
Securities 4.4 4.4 0.0 0.0 0.7 0.5 6.5 7.1 4.2 4.2Other long-term equity investments 66.0 62.6 6.0 5.8 15.3 15.2 25.0 23.3 70.7 67.0
of which: Goodwill 1.0 0.9 2.3 2.5 11.8 9.7 9.3 8.2 0.1 0.1
CapitalEquity 50.2 45.4 18.7 17.7 36.9 39.5 44.7 44.0 50.9 45.6Liabilities 39.8 44.2 68.4 71.0 43.0 39.1 35.5 36.0 40.2 45.0
Short-term 29.0 30.6 43.8 44.7 32.6 30.4 26.7 28.6 29.2 30.8of which:Liabilities to banks 0.7 1.7 2.3 4.1 2.0 4.6 2.6 3.2 0.4 1.5Trade payables 1.6 1.7 12.5 10.1 11.1 11.4 4.7 4.4 1.2 1.3Liabilities to affiliated companies 21.6 23.0 15.2 17.4 12.0 9.1 14.1 16.3 22.5 23.8
Long-term 10.8 13.6 24.7 26.3 10.4 8.7 8.9 7.5 11.0 14.2 of which:
Liabilities to banks 10.4 13.1 3.6 2.8 2.1 2.8 6.9 5.2 10.8 14.0Liabilities to affiliated companies 0.4 0.4 15.8 20.1 7.6 5.1 1.8 2.1 0.2 0.2
Provisions 8.8 9.3 5.8 4.9 15.6 17.2 16.5 16.4 8.0 8.5of which: Provisions for pensions 4.9 4.9 0.8 0.4 2.2 2.3 6.7 6.8 4.8 4.8
Other ratios Percentage of salesAnnual result before taxes on income 7.4 5.9 - 1.4 2.4 6.2 5.6 8.3 8.1 7.2 5.2Annual result and depreciation 11.1 8.4 - 0.5 3.5 8.2 7.8 10.7 10.4 11.5 7.9Trade receivables 6.6 7.6 12.3 12.0 13.1 13.2 10.2 10.5 5.2 6.3
Percentage of the balance sheet totalSales 43.1 41.8 148.0 122.0 174.6 177.7 106.8 109.4 35.4 33.8Annual result and interest paid 2.9 2.5 - 1.2 3.7 9.6 9.6 7.7 7.5 2.3 1.9
Percentage of liabilities and provisions less cashAnnual result and depreciation 10.9 7.2 - 1.1 5.9 35.1 38.1 31.7 30.1 9.1 5.3
Percentage of fixed assetsLong-term equity and liabilities 82.7 81.6 307.2 324.3 188.6 204.0 134.3 137.3 79.6 78.4
Percentage of short-term liabilitiesCash resources and short-term receivables 60.6 62.2 143.8 149.3 183.4 202.9 177.7 173.9 48.5 50.5Cash resources, short-term receivables and inventories 68.8 69.8 190.7 188.1 223.2 244.4 205.1 198.9 54.5 56.2
Percentage of cost of materialsTrade payables 9.1 9.3 24.9 24.8 17.8 17.8 12.1 10.5 7.9 8.5
Memo item:Balance sheet total in € billion 14.93 15.41 0.02 0.03 0.12 0.12 1.34 1.36 13.45 13.89Sales in € billion 6.43 6.44 0.03 0.03 0.20 0.22 1.44 1.49 4.76 4.69Number of enterprises 169 169 46 46 42 42 48 48 33 33
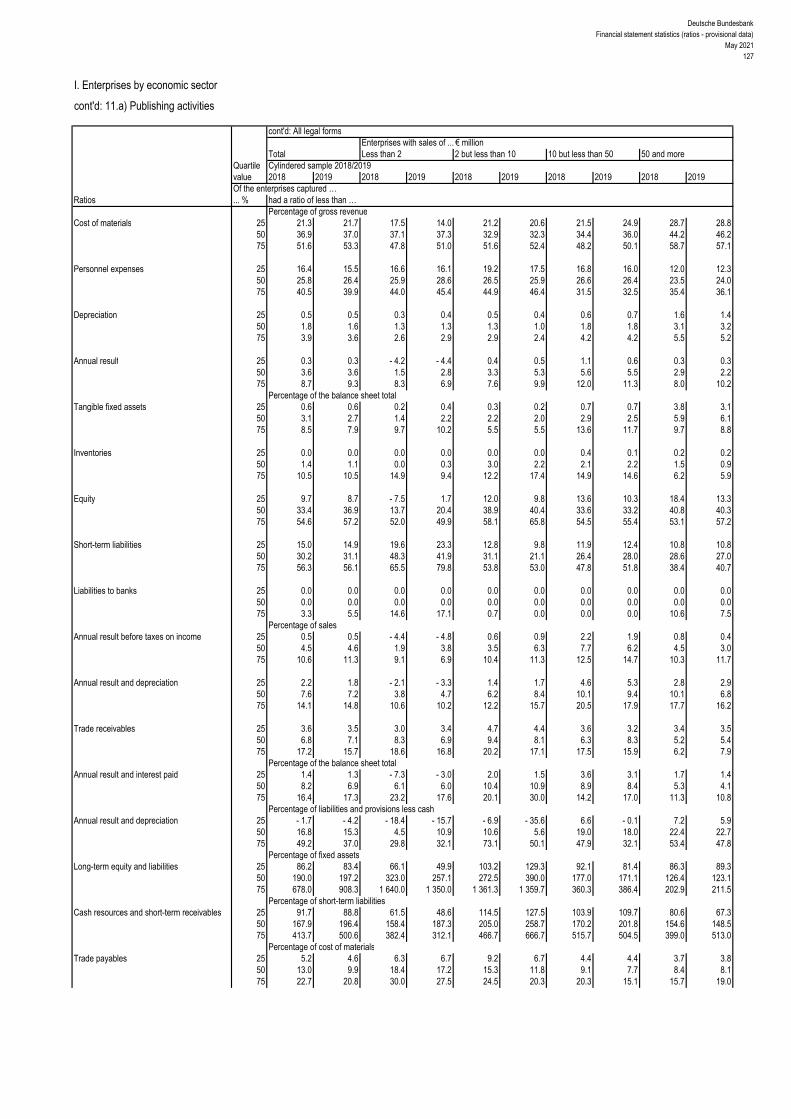
Deutsche BundesbankFinancial statement statistics (ratios - provisional data)
May 2021127
I. Enterprises by economic sector
cont'd: 11.a) Publishing activities
cont'd: All legal formsEnterprises with sales of ... € million
Total Less than 2 2 but less than 10 10 but less than 50 50 and moreQuartile Cylindered sample 2018/2019value 2018 2019 2018 2019 2018 2019 2018 2019 2018 2019Of the enterprises captured …
Ratios ... % had a ratio of less than …Percentage of gross revenue
Cost of materials 25 21.3 21.7 17.5 14.0 21.2 20.6 21.5 24.9 28.7 28.8 50 36.9 37.0 37.1 37.3 32.9 32.3 34.4 36.0 44.2 46.2 75 51.6 53.3 47.8 51.0 51.6 52.4 48.2 50.1 58.7 57.1
Personnel expenses 25 16.4 15.5 16.6 16.1 19.2 17.5 16.8 16.0 12.0 12.3 50 25.8 26.4 25.9 28.6 26.5 25.9 26.6 26.4 23.5 24.0 75 40.5 39.9 44.0 45.4 44.9 46.4 31.5 32.5 35.4 36.1
Depreciation 25 0.5 0.5 0.3 0.4 0.5 0.4 0.6 0.7 1.6 1.4 50 1.8 1.6 1.3 1.3 1.3 1.0 1.8 1.8 3.1 3.2 75 3.9 3.6 2.6 2.9 2.9 2.4 4.2 4.2 5.5 5.2
Annual result 25 0.3 0.3 - 4.2 - 4.4 0.4 0.5 1.1 0.6 0.3 0.3 50 3.6 3.6 1.5 2.8 3.3 5.3 5.6 5.5 2.9 2.2 75 8.7 9.3 8.3 6.9 7.6 9.9 12.0 11.3 8.0 10.2
Percentage of the balance sheet totalTangible fixed assets 25 0.6 0.6 0.2 0.4 0.3 0.2 0.7 0.7 3.8 3.1
50 3.1 2.7 1.4 2.2 2.2 2.0 2.9 2.5 5.9 6.1 75 8.5 7.9 9.7 10.2 5.5 5.5 13.6 11.7 9.7 8.8
Inventories 25 0.0 0.0 0.0 0.0 0.0 0.0 0.4 0.1 0.2 0.2 50 1.4 1.1 0.0 0.3 3.0 2.2 2.1 2.2 1.5 0.9 75 10.5 10.5 14.9 9.4 12.2 17.4 14.9 14.6 6.2 5.9
Equity 25 9.7 8.7 - 7.5 1.7 12.0 9.8 13.6 10.3 18.4 13.3 50 33.4 36.9 13.7 20.4 38.9 40.4 33.6 33.2 40.8 40.3 75 54.6 57.2 52.0 49.9 58.1 65.8 54.5 55.4 53.1 57.2
Short-term liabilities 25 15.0 14.9 19.6 23.3 12.8 9.8 11.9 12.4 10.8 10.8 50 30.2 31.1 48.3 41.9 31.1 21.1 26.4 28.0 28.6 27.0 75 56.3 56.1 65.5 79.8 53.8 53.0 47.8 51.8 38.4 40.7
Liabilities to banks 25 0.0 0.0 0.0 0.0 0.0 0.0 0.0 0.0 0.0 0.0 50 0.0 0.0 0.0 0.0 0.0 0.0 0.0 0.0 0.0 0.0 75 3.3 5.5 14.6 17.1 0.7 0.0 0.0 0.0 10.6 7.5
Percentage of salesAnnual result before taxes on income 25 0.5 0.5 - 4.4 - 4.8 0.6 0.9 2.2 1.9 0.8 0.4
50 4.5 4.6 1.9 3.8 3.5 6.3 7.7 6.2 4.5 3.0 75 10.6 11.3 9.1 6.9 10.4 11.3 12.5 14.7 10.3 11.7
Annual result and depreciation 25 2.2 1.8 - 2.1 - 3.3 1.4 1.7 4.6 5.3 2.8 2.9 50 7.6 7.2 3.8 4.7 6.2 8.4 10.1 9.4 10.1 6.8 75 14.1 14.8 10.6 10.2 12.2 15.7 20.5 17.9 17.7 16.2
Trade receivables 25 3.6 3.5 3.0 3.4 4.7 4.4 3.6 3.2 3.4 3.5 50 6.8 7.1 8.3 6.9 9.4 8.1 6.3 8.3 5.2 5.4 75 17.2 15.7 18.6 16.8 20.2 17.1 17.5 15.9 6.2 7.9
Percentage of the balance sheet totalAnnual result and interest paid 25 1.4 1.3 - 7.3 - 3.0 2.0 1.5 3.6 3.1 1.7 1.4
50 8.2 6.9 6.1 6.0 10.4 10.9 8.9 8.4 5.3 4.1 75 16.4 17.3 23.2 17.6 20.1 30.0 14.2 17.0 11.3 10.8
Percentage of liabilities and provisions less cashAnnual result and depreciation 25 - 1.7 - 4.2 - 18.4 - 15.7 - 6.9 - 35.6 6.6 - 0.1 7.2 5.9
50 16.8 15.3 4.5 10.9 10.6 5.6 19.0 18.0 22.4 22.7 75 49.2 37.0 29.8 32.1 73.1 50.1 47.9 32.1 53.4 47.8
Percentage of fixed assetsLong-term equity and liabilities 25 86.2 83.4 66.1 49.9 103.2 129.3 92.1 81.4 86.3 89.3
50 190.0 197.2 323.0 257.1 272.5 390.0 177.0 171.1 126.4 123.1 75 678.0 908.3 1 640.0 1 350.0 1 361.3 1 359.7 360.3 386.4 202.9 211.5
Percentage of short-term liabilitiesCash resources and short-term receivables 25 91.7 88.8 61.5 48.6 114.5 127.5 103.9 109.7 80.6 67.3
50 167.9 196.4 158.4 187.3 205.0 258.7 170.2 201.8 154.6 148.5 75 413.7 500.6 382.4 312.1 466.7 666.7 515.7 504.5 399.0 513.0
Percentage of cost of materialsTrade payables 25 5.2 4.6 6.3 6.7 9.2 6.7 4.4 4.4 3.7 3.8
50 13.0 9.9 18.4 17.2 15.3 11.8 9.1 7.7 8.4 8.1 75 22.7 20.8 30.0 27.5 24.5 20.3 20.3 15.1 15.7 19.0

Deutsche BundesbankFinancial statement statistics (ratios - provisional data)May 2021128
I. Enterprises by economic sector
11.b) Motion picture, video and television programme production, sound recording and music publishing activities; programming and broadcasting activities
All legal formsEnterprises with sales of ... € million
Total Less than 2 2 but less than 10 10 but less than 50 50 and moreCylindered sample 2018/2019
Ratios 2018 2019 2018 2019 2018 2019 2018 2019 2018 2019Income statementIncome Percentage of gross revenueSales 98.7 100.1 95.0 95.8 98.5 100.8 98.7 100.6 98.7 100.0Change in finished goods 1.3 - 0.1 5.0 4.2 1.5 - 0.8 1.3 - 0.6 1.3 0.0Interest and similar income 0.4 0.5 0.5 0.3 0.2 0.2 0.3 0.2 0.4 0.6Other income 4.2 4.0 4.5 4.7 7.9 6.8 3.9 3.2 4.2 4.0
of which: Income from long-term equity investments 0.4 0.4 0.1 0.1 0.3 0.2 1.2 0.7 0.4 0.4Total income 104.6 104.5 105.0 104.9 108.1 107.0 104.2 103.4 104.6 104.6
ExpensesCost of materials 60.9 59.8 32.4 36.4 46.7 47.5 40.0 43.4 63.2 61.8Personnel expenses 14.9 15.9 31.3 27.5 24.5 24.1 24.1 23.3 13.8 14.9Depreciation 2.7 2.7 5.1 6.8 5.0 5.6 6.5 7.1 2.3 2.2
of which: Depreciation of tangible fixed assets 2.5 2.5 4.4 4.1 4.8 5.6 5.6 6.4 2.2 2.0Interest and similar expenses 1.4 1.3 0.8 0.7 0.9 0.8 1.0 0.8 1.4 1.3Operating taxes 0.0 0.0 0.0 0.0 0.1 0.1 0.0 0.0 0.0 0.0Other expenses 15.9 16.6 27.7 25.2 23.3 20.9 22.0 21.7 15.1 16.0Total expenses before taxes on income 95.7 96.3 97.4 96.6 100.5 99.0 93.6 96.3 95.8 96.3Annual result before taxes on income 8.9 8.2 7.6 8.4 7.6 8.0 10.6 7.0 8.8 8.3Taxes on income 0.7 0.5 1.9 1.4 1.8 2.0 1.2 1.2 0.6 0.4Annual result 8.2 7.7 5.7 7.0 5.8 6.0 9.3 5.8 8.2 7.9Profit and loss transfers (parent company) 5.1 5.0 0.0 0.0 0.1 0.0 0.7 0.5 5.6 5.6Profit and loss transfers (subsidiary) 13.5 13.9 - 0.2 0.2 0.9 1.1 7.0 6.0 14.4 15.0Profit for the year - 0.2 - 1.2 6.0 6.8 4.9 4.9 3.0 0.2 - 0.7 - 1.5
Balance sheetAssets Percentage of the balance sheet totalIntangible fixed assets 2.1 2.2 11.8 10.3 4.8 5.7 6.8 7.2 1.7 1.8Tangible fixed assets 15.0 14.9 14.0 13.7 24.4 27.4 10.3 11.7 15.2 14.9
of which: Land and buildings 3.1 3.3 6.5 6.8 16.4 18.2 0.4 0.4 3.0 3.2Inventories 4.2 4.3 10.3 14.1 12.6 9.5 8.3 6.1 3.8 4.1
of which: Finished goods and merchandise 2.7 2.5 1.4 1.1 4.8 3.1 1.0 0.7 2.8 2.6Cash 6.2 5.3 18.5 16.0 10.0 12.4 10.6 11.0 5.9 4.8Receivables 45.8 47.7 35.8 37.0 44.1 40.1 45.6 49.4 45.9 47.7
Short-term 37.7 39.8 34.3 36.2 42.0 38.1 43.7 46.3 37.3 39.4 of which:
Trade receivables 8.7 8.5 12.6 15.2 19.2 17.9 15.0 16.9 8.2 7.8Receivables from affiliated companies 27.7 30.1 17.8 17.0 15.6 13.7 24.0 23.6 28.1 30.7
Long-term 8.1 7.9 1.5 0.8 2.1 2.0 1.9 3.1 8.6 8.3of which: Loans to affiliated companies 0.1 0.1 0.2 0.2 0.5 0.7 0.8 1.4 0.1 0.1
Securities 14.2 13.7 0.0 0.0 0.4 0.4 4.3 3.2 15.1 14.6Other long-term equity investments 12.2 11.6 8.7 8.2 3.1 4.0 13.6 10.7 12.2 11.8
of which: Goodwill 0.1 0.0 0.1 0.3 0.0 0.0 2.0 0.1 0.0 0.0
CapitalEquity 19.8 17.1 40.5 36.4 36.4 35.0 26.4 27.5 19.0 16.2Liabilities 43.8 44.7 53.0 58.1 50.8 49.9 48.9 46.4 43.4 44.5
Short-term 35.3 41.5 38.6 45.0 42.4 40.7 42.0 39.0 34.8 41.6of which:Liabilities to banks 0.3 0.6 5.8 5.0 5.7 5.3 2.2 3.4 0.1 0.3Trade payables 3.5 3.8 6.6 9.6 10.5 12.2 7.2 7.5 3.1 3.4Liabilities to affiliated companies 28.5 34.2 6.8 5.6 13.6 12.8 21.9 20.0 29.2 35.4
Long-term 8.5 3.3 14.4 13.1 8.5 9.2 6.9 7.4 8.6 2.9 of which:
Liabilities to banks 0.5 0.6 7.5 6.7 3.5 5.3 1.0 1.2 0.4 0.4Liabilities to affiliated companies 5.9 0.7 3.5 2.8 2.2 2.0 5.1 5.5 6.0 0.4
Provisions 34.2 34.4 4.5 4.0 12.6 13.1 23.8 25.3 35.3 35.3of which: Provisions for pensions 23.4 24.8 0.0 0.0 4.1 3.8 3.5 4.2 25.0 26.4
Other ratios Percentage of salesAnnual result before taxes on income 9.0 8.2 8.0 8.7 7.7 7.9 10.7 7.0 8.9 8.3Annual result and depreciation 11.1 10.4 11.4 14.3 10.9 11.5 16.1 12.8 10.6 10.1Trade receivables 10.7 10.6 12.9 15.7 19.0 17.4 13.0 13.2 10.3 10.1
Percentage of the balance sheet totalSales 81.5 80.1 97.7 96.5 101.0 103.0 115.4 128.4 79.1 76.9Annual result and interest paid 7.9 7.2 6.8 7.7 6.8 7.0 12.1 8.4 7.7 7.1
Percentage of liabilities and provisions less cashAnnual result and depreciation 12.2 10.8 27.2 29.0 20.5 22.5 29.4 26.7 11.2 9.9
Percentage of fixed assetsLong-term equity and liabilities 101.4 90.8 152.3 149.9 141.1 121.8 100.4 108.6 101.0 89.5
Percentage of short-term liabilitiesCash resources and short-term receivables 126.3 110.2 136.8 116.0 123.1 124.1 129.6 147.1 126.1 107.9Cash resources, short-term receivables and inventories 138.3 120.6 163.4 147.3 152.9 147.4 149.3 162.8 137.1 117.8
Percentage of cost of materialsTrade payables 6.9 7.9 19.8 26.1 21.9 25.2 15.3 13.5 6.2 7.2
Memo item:Balance sheet total in € billion 13.64 14.14 0.04 0.04 0.19 0.21 0.80 0.76 12.62 13.13Sales in € billion 11.12 11.33 0.03 0.04 0.19 0.22 0.92 0.98 9.98 10.10Number of enterprises 173 173 58 58 39 39 46 46 30 30

Deutsche BundesbankFinancial statement statistics (ratios - provisional data)
May 2021129
I. Enterprises by economic sector
cont'd: 11.b) Motion picture, video and television programme production, sound recording and music publishing activities; programming and broadcasting a
cont'd: All legal formsEnterprises with sales of ... € million
Total Less than 2 2 but less than 10 10 but less than 50 50 and moreQuartile Cylindered sample 2018/2019value 2018 2019 2018 2019 2018 2019 2018 2019 2018 2019Of the enterprises captured …
Ratios ... % had a ratio of less than …Percentage of gross revenue
Cost of materials 25 19.5 19.3 1.4 2.9 31.5 30.1 30.0 30.6 43.9 43.2 50 39.2 39.5 19.7 18.7 44.2 41.8 37.0 39.7 59.8 56.8 75 61.4 59.9 54.9 46.2 64.8 67.2 55.4 56.9 70.0 70.0
Personnel expenses 25 10.3 10.2 17.1 14.4 12.8 12.1 11.3 11.5 5.4 5.6 50 19.2 20.8 29.8 23.7 18.8 21.4 17.6 19.1 9.8 9.8 75 37.0 34.1 43.9 38.2 35.1 35.9 29.3 29.1 21.8 23.3
Depreciation 25 0.6 0.5 1.3 0.7 0.4 0.4 0.8 0.6 0.2 0.2 50 2.6 2.3 3.2 2.8 2.6 2.2 1.8 1.9 2.7 2.3 75 7.0 6.6 7.5 6.8 7.0 7.1 6.8 5.5 5.6 4.4
Annual result 25 0.4 0.6 - 6.8 1.4 0.4 1.0 1.7 0.1 1.5 0.2 50 3.1 3.8 1.6 5.4 3.2 3.3 3.9 2.1 4.7 4.5 75 8.5 12.6 7.2 17.3 7.0 9.4 8.6 7.6 13.7 14.0
Percentage of the balance sheet totalTangible fixed assets 25 0.5 0.7 0.5 0.7 0.5 0.4 0.8 0.8 0.5 0.6
50 4.4 4.7 7.5 7.0 4.4 3.0 4.0 6.3 3.5 3.9 75 23.9 21.8 31.6 30.1 37.2 24.8 15.7 15.1 16.8 21.8
Inventories 25 0.0 0.0 0.0 0.0 0.0 0.0 0.0 0.0 0.0 0.0 50 0.4 0.5 0.0 0.4 1.1 0.7 1.2 0.6 0.0 0.0 75 13.4 14.0 13.4 19.8 20.8 21.7 14.7 12.6 2.9 3.5
Equity 25 4.8 5.1 - 12.4 2.2 9.9 13.1 2.1 1.8 5.6 4.8 50 17.4 18.9 12.2 12.8 25.8 23.0 16.4 18.8 14.3 9.0 75 45.5 46.6 54.8 54.8 54.5 45.7 36.4 41.9 45.4 40.7
Short-term liabilities 25 18.9 17.6 18.7 16.5 18.0 22.5 32.8 24.2 9.6 8.7 50 43.9 42.7 48.7 46.2 45.8 46.2 46.8 43.4 30.1 33.5 75 70.9 73.2 82.0 79.8 70.9 71.7 70.7 68.3 47.9 58.2
Liabilities to banks 25 0.0 0.0 0.0 0.0 0.0 0.0 0.0 0.0 0.0 0.0 50 0.0 0.0 0.9 1.9 2.6 1.0 0.0 0.0 0.0 0.0 75 14.3 14.8 30.6 28.0 18.6 18.2 4.9 0.7 0.0 0.0
Percentage of salesAnnual result before taxes on income 25 0.5 0.9 - 7.3 1.9 0.7 0.9 2.1 0.4 2.0 0.2
50 3.9 4.9 2.2 6.3 4.4 4.9 5.0 3.4 5.0 5.2 75 10.8 14.8 10.0 18.9 9.0 11.2 11.1 10.3 15.1 15.4
Annual result and depreciation 25 2.4 3.0 - 1.6 4.3 2.3 1.9 4.5 2.6 3.4 1.8 50 8.1 9.0 5.0 12.6 8.4 11.8 9.2 6.8 8.2 7.3 75 18.8 22.6 16.6 23.2 21.6 25.5 17.4 18.2 20.3 21.3
Trade receivables 25 2.9 2.4 3.3 2.0 4.7 3.0 2.3 2.3 2.4 2.4 50 8.9 8.6 8.8 9.4 13.6 11.3 5.6 6.4 9.1 9.7 75 17.7 18.4 21.2 21.3 27.0 30.0 11.5 12.3 17.7 18.6
Percentage of the balance sheet totalAnnual result and interest paid 25 1.4 1.8 - 4.7 2.3 1.4 2.2 3.1 0.8 3.6 1.6
50 5.7 7.1 4.3 7.8 4.3 6.1 8.5 5.7 6.6 7.0 75 14.0 16.5 15.1 30.6 12.4 11.1 14.0 14.9 14.6 16.7
Percentage of liabilities and provisions less cashAnnual result and depreciation 25 5.5 4.4 - 8.2 2.9 6.0 7.0 12.2 9.1 4.4 2.4
50 18.6 21.5 12.1 18.8 20.5 32.6 31.0 19.8 19.7 19.3 75 52.9 58.2 48.1 53.5 52.9 101.4 58.3 76.5 41.8 38.6
Percentage of fixed assetsLong-term equity and liabilities 25 66.7 78.6 56.2 56.8 108.0 87.6 56.2 67.9 66.5 64.2
50 138.6 146.2 122.6 136.9 164.5 161.5 130.2 135.0 114.5 130.0 75 363.7 421.7 318.3 421.7 573.1 553.7 363.7 262.6 452.0 465.7
Percentage of short-term liabilitiesCash resources and short-term receivables 25 80.2 72.8 64.3 57.5 84.4 70.7 64.2 91.8 100.2 86.4
50 132.3 136.8 123.0 135.6 130.2 128.6 119.3 137.7 204.6 174.9 75 242.7 317.4 202.4 320.0 259.9 262.4 182.8 270.8 476.3 511.9
Percentage of cost of materialsTrade payables 25 4.1 4.4 4.1 8.1 8.1 6.6 5.3 4.2 2.5 2.5
50 10.7 11.7 13.0 17.4 12.4 15.1 10.6 10.3 3.8 5.9 75 20.8 28.3 36.5 41.2 30.1 43.1 18.7 22.9 8.6 10.6

Deutsche BundesbankFinancial statement statistics (ratios - provisional data)May 2021130
I. Enterprises by economic sector
11.c) Telecommunications
All legal formsEnterprises with sales of ... € million
Total Less than 2 2 but less than 10 10 but less than 50 50 and moreCylindered sample 2018/2019
Ratios 2018 2019 2018 2019 2018 2019 2018 2019 2018 2019Income statementIncome Percentage of gross revenueSales 99.9 99.8 99.1 97.8 96.5 100.0 99.8 99.4 99.9 99.8Change in finished goods 0.1 0.2 0.9 2.2 3.5 0.0 0.2 0.6 0.1 0.2Interest and similar income 1.4 1.5 0.1 0.1 0.1 0.4 0.2 0.2 1.5 1.5Other income 11.1 9.2 1.5 1.5 4.2 8.4 3.6 3.7 11.4 9.4
of which: Income from long-term equity investments 1.4 1.0 0.0 0.0 0.0 0.2 0.1 0.1 1.5 1.0Total income 112.5 110.7 101.6 101.5 104.4 108.8 103.8 103.9 112.8 110.9
ExpensesCost of materials 41.9 41.7 32.7 34.1 50.9 47.8 42.8 42.4 41.8 41.7Personnel expenses 16.1 16.2 31.8 34.5 23.8 24.5 28.3 28.1 15.7 15.7Depreciation 20.6 15.7 6.2 7.7 7.1 7.5 6.9 7.2 21.1 16.0
of which: Depreciation of tangible fixed assets 20.3 15.5 6.2 6.6 7.1 7.4 6.6 7.0 20.9 15.9Interest and similar expenses 6.1 5.6 1.5 1.3 2.0 2.1 1.3 1.3 6.3 5.8Operating taxes 0.1 0.0 0.1 0.1 0.0 0.0 0.0 0.0 0.1 0.0Other expenses 28.0 26.2 26.9 23.0 11.2 12.1 17.6 18.3 28.4 26.5Total expenses before taxes on income 112.7 105.4 99.2 100.6 95.1 93.9 96.8 97.4 113.3 105.7Annual result before taxes on income - 0.2 5.3 2.4 0.9 9.3 14.8 7.0 6.5 - 0.5 5.2Taxes on income 1.4 1.4 0.8 0.9 1.9 0.7 2.2 1.7 1.4 1.4Annual result - 1.6 3.9 1.6 - 0.1 7.4 14.2 4.8 4.8 - 1.8 3.8Profit and loss transfers (parent company) 7.6 - 0.7 0.0 0.0 0.0 0.0 0.0 0.0 7.9 - 0.7Profit and loss transfers (subsidiary) 1.0 1.0 1.2 - 0.8 3.1 4.8 1.7 1.9 0.9 0.9Profit for the year 5.0 2.2 0.4 0.7 4.2 9.4 3.1 2.9 5.1 2.2
Balance sheetAssets Percentage of the balance sheet totalIntangible fixed assets 5.5 5.0 2.0 1.9 0.7 0.5 2.7 2.3 5.5 5.1Tangible fixed assets 15.0 15.3 71.1 73.4 57.8 60.6 44.0 47.4 14.7 14.9
of which: Land and buildings 3.3 3.4 0.0 0.0 0.9 0.8 2.1 2.6 3.3 3.4Inventories 0.4 0.3 2.7 3.1 6.0 4.8 6.0 5.2 0.3 0.3
of which: Finished goods and merchandise 0.2 0.2 1.3 1.2 0.6 0.6 0.4 1.6 0.2 0.2Cash 0.7 1.1 3.7 5.5 4.6 4.8 12.2 9.9 0.6 1.0Receivables 31.1 29.5 19.7 15.6 20.7 20.1 30.2 28.9 31.1 29.5
Short-term 19.3 9.1 18.8 14.9 20.6 20.1 28.4 27.4 19.2 8.9 of which:
Trade receivables 1.8 2.0 10.9 7.5 6.8 6.3 11.1 10.3 1.8 2.0Receivables from affiliated companies 16.3 6.0 5.7 5.0 12.4 11.7 15.9 15.5 16.4 5.9
Long-term 11.8 20.4 0.9 0.7 0.0 0.0 1.7 1.5 11.9 20.6of which: Loans to affiliated companies 11.8 17.0 0.8 0.0 0.0 0.0 1.4 1.1 11.9 17.2
Securities 0.0 0.0 0.0 0.0 0.0 0.0 0.1 0.1 0.0 0.0Other long-term equity investments 46.7 48.1 0.2 0.1 8.0 6.9 3.6 4.4 47.1 48.6
of which: Goodwill 0.3 0.2 0.0 0.0 0.0 0.0 0.6 0.4 0.3 0.2
CapitalEquity 38.3 38.3 34.4 45.0 36.3 38.7 34.0 34.9 38.4 38.3Liabilities 56.7 56.3 61.1 50.5 53.2 51.5 50.1 49.8 56.8 56.4
Short-term 17.7 19.5 29.2 27.3 35.6 38.5 31.8 34.5 17.6 19.3of which:Liabilities to banks 1.1 1.3 5.1 3.3 4.6 5.1 3.6 8.7 1.1 1.2Trade payables 1.7 1.7 5.3 8.1 4.4 4.0 4.8 5.2 1.7 1.7Liabilities to affiliated companies 11.7 13.2 15.8 12.9 23.4 27.0 18.1 15.3 11.6 13.1
Long-term 39.0 36.8 31.9 23.2 17.6 13.0 18.3 15.3 39.2 37.0 of which:
Liabilities to banks 2.1 2.3 30.0 21.9 8.5 6.6 12.4 8.3 2.0 2.2Liabilities to affiliated companies 35.4 30.6 1.2 0.2 9.1 6.4 5.8 6.7 35.7 30.9
Provisions 4.6 5.0 3.3 3.3 4.9 4.6 14.0 12.9 4.5 4.9of which: Provisions for pensions 1.3 1.3 0.0 0.0 0.7 0.6 3.6 4.1 1.2 1.3
Other ratios Percentage of salesAnnual result before taxes on income - 0.2 5.3 2.5 0.9 9.6 14.8 7.0 6.6 - 0.5 5.2Annual result and depreciation 19.0 19.6 7.9 7.8 15.0 21.6 11.7 12.1 19.3 19.9Trade receivables 7.4 7.8 11.1 8.3 10.1 9.5 10.8 10.0 7.3 7.7
Percentage of the balance sheet totalSales 24.9 26.1 98.2 90.1 67.5 65.9 102.5 103.0 24.2 25.4Annual result and interest paid 1.1 2.5 3.0 1.1 6.6 10.7 6.2 6.4 1.1 2.4
Percentage of liabilities and provisions less cashAnnual result and depreciation 7.8 8.5 12.6 14.2 17.1 25.3 22.3 22.6 7.6 8.3
Percentage of fixed assetsLong-term equity and liabilities 99.5 86.0 89.3 89.6 82.1 76.9 107.2 97.6 99.5 86.0
Percentage of short-term liabilitiesCash resources and short-term receivables 113.0 51.9 77.1 74.3 71.0 64.7 128.2 108.5 112.9 51.0Cash resources, short-term receivables and inventories 115.1 53.6 86.5 85.5 87.9 77.1 147.0 123.4 114.7 52.5
Percentage of cost of materialsTrade payables 16.4 15.6 16.3 25.8 12.5 12.6 11.0 11.8 16.6 15.7
Memo item:Balance sheet total in € billion 179.99 174.22 0.02 0.03 0.24 0.27 1.39 1.49 178.34 172.43Sales in € billion 44.79 45.55 0.02 0.02 0.16 0.18 1.43 1.54 43.18 43.81Number of enterprises 143 143 23 23 31 31 60 60 29 29

Deutsche BundesbankFinancial statement statistics (ratios - provisional data)
May 2021131
I. Enterprises by economic sector
cont'd: 11.c) Telecommunications
cont'd: All legal formsEnterprises with sales of ... € million
Total Less than 2 2 but less than 10 10 but less than 50 50 and moreQuartile Cylindered sample 2018/2019value 2018 2019 2018 2019 2018 2019 2018 2019 2018 2019Of the enterprises captured …
Ratios ... % had a ratio of less than …Percentage of gross revenue
Cost of materials 25 31.0 29.1 9.4 16.4 37.2 31.2 31.0 31.9 39.5 40.7 50 44.4 44.4 30.4 29.6 44.9 45.1 40.7 44.0 50.9 50.5 75 59.8 60.7 54.6 47.6 60.4 64.6 60.2 57.1 71.7 67.1
Personnel expenses 25 10.1 10.3 28.4 24.1 10.3 11.0 11.8 13.5 5.1 4.2 50 23.8 23.4 31.2 33.0 29.8 26.4 23.6 22.8 14.9 16.1 75 37.5 35.8 50.3 47.6 41.1 41.4 36.5 35.1 23.1 23.0
Depreciation 25 1.1 1.1 0.8 0.8 1.1 1.2 1.4 0.9 4.5 5.6 50 4.9 5.4 2.8 2.8 4.0 4.3 5.4 6.0 8.7 8.2 75 11.6 11.9 3.6 8.0 10.3 8.4 10.2 10.3 14.4 16.6
Annual result 25 0.1 0.5 - 4.4 - 0.8 1.8 1.7 0.2 0.3 - 4.6 0.0 50 3.9 4.1 1.5 2.2 5.3 7.3 5.4 4.6 2.2 2.1 75 10.5 10.2 10.4 8.3 11.1 16.9 12.6 11.4 4.6 5.5
Percentage of the balance sheet totalTangible fixed assets 25 3.9 3.1 3.1 2.6 5.0 7.1 3.4 3.5 7.1 5.9
50 26.2 22.9 13.8 8.0 26.2 15.2 27.8 30.2 26.3 26.8 75 58.8 60.6 48.2 58.1 67.5 60.6 54.7 62.2 59.9 57.5
Inventories 25 0.0 0.0 0.0 0.0 0.1 0.0 0.0 0.0 0.0 0.0 50 0.2 0.3 0.0 0.0 1.8 2.5 0.0 0.3 0.1 0.2 75 4.1 3.9 2.3 2.4 12.3 9.4 6.7 5.4 1.2 1.1
Equity 25 8.1 11.2 0.5 0.5 8.1 16.5 12.5 12.5 9.5 11.2 50 31.9 32.0 27.9 19.3 38.5 41.1 31.2 33.2 34.8 29.7 75 50.7 54.3 55.8 62.7 58.8 64.0 51.7 52.7 46.5 45.7
Short-term liabilities 25 13.3 12.3 22.8 18.2 12.8 17.6 11.6 11.1 11.2 12.7 50 28.8 30.1 38.2 33.6 21.7 29.6 27.4 32.4 30.2 20.2 75 66.4 56.4 79.0 72.3 47.3 50.7 69.2 58.0 66.4 46.2
Liabilities to banks 25 0.0 0.0 0.0 0.0 0.0 0.0 0.0 0.0 0.0 0.0 50 0.0 0.0 0.0 0.0 0.0 0.0 0.0 0.0 0.0 0.0 75 15.8 11.9 22.0 12.2 21.2 13.4 17.6 16.0 2.1 0.0
Percentage of salesAnnual result before taxes on income 25 0.4 0.9 - 4.4 - 0.8 2.0 2.5 1.4 1.1 - 4.6 0.0
50 5.3 5.3 1.7 3.1 7.6 11.5 6.8 6.7 2.7 3.0 75 14.1 13.6 10.4 10.6 16.0 18.4 16.1 16.5 6.7 7.2
Annual result and depreciation 25 3.5 4.0 - 0.7 0.3 5.9 6.5 3.8 4.4 3.9 4.8 50 11.6 12.3 4.6 7.3 17.1 18.8 12.2 12.7 10.0 12.3 75 21.4 24.1 14.0 14.7 21.9 28.9 24.0 24.8 19.3 20.2
Trade receivables 25 5.7 4.7 8.5 4.5 5.1 4.9 4.1 3.8 6.9 4.8 50 9.6 9.2 11.6 9.7 8.8 9.1 8.7 9.7 9.3 9.2 75 15.6 14.7 17.5 12.5 14.8 14.8 14.2 14.4 16.1 16.0
Percentage of the balance sheet totalAnnual result and interest paid 25 1.6 2.2 - 4.7 0.8 3.1 4.0 1.7 2.1 - 5.0 0.9
50 6.8 6.6 6.8 6.8 8.7 10.9 9.3 8.7 3.8 3.7 75 15.4 18.6 24.2 20.7 17.8 29.6 15.5 18.1 7.2 6.0
Percentage of liabilities and provisions less cashAnnual result and depreciation 25 2.6 6.7 - 11.2 - 18.1 7.8 7.3 1.8 6.3 8.2 8.8
50 19.8 24.1 8.5 17.3 22.1 37.4 27.5 29.7 15.6 18.6 75 49.7 57.6 62.7 45.9 63.5 131.9 53.1 54.7 34.1 35.6
Percentage of fixed assetsLong-term equity and liabilities 25 61.7 68.0 49.0 5.8 67.8 67.0 61.7 75.5 52.4 61.5
50 108.8 106.8 103.1 98.3 126.2 159.2 109.4 106.4 99.1 103.5 75 300.6 262.4 467.6 698.4 605.0 622.3 210.9 191.4 143.1 209.3
Percentage of short-term liabilitiesCash resources and short-term receivables 25 72.1 76.3 73.2 76.3 73.5 44.7 72.3 78.6 62.7 70.1
50 128.5 139.7 151.4 123.1 128.5 145.6 140.9 143.5 108.9 125.0 75 314.4 352.1 245.9 365.5 415.2 352.1 348.7 288.1 226.5 411.7
Percentage of cost of materialsTrade payables 25 5.4 4.8 7.1 4.8 4.9 4.7 3.1 3.4 8.1 7.8
50 11.3 10.5 16.3 13.8 9.3 10.4 8.5 9.9 12.4 14.0 75 20.3 21.1 20.8 34.6 20.3 21.6 19.0 18.2 16.7 20.5

Deutsche BundesbankFinancial statement statistics (ratios - provisional data)May 2021132
I. Enterprises by economic sector
11.d) Computer programming, consultancy and related activities; information service activities
All legal formsEnterprises with sales of ... € million
Total Less than 2 2 but less than 10 10 but less than 50 50 and moreCylindered sample 2018/2019
Ratios 2018 2019 2018 2019 2018 2019 2018 2019 2018 2019Income statementIncome Percentage of gross revenueSales 99.6 99.6 98.6 97.8 98.7 98.5 99.2 99.3 99.7 99.7Change in finished goods 0.4 0.4 1.4 2.2 1.3 1.5 0.8 0.7 0.3 0.3Interest and similar income 0.5 0.4 0.1 0.1 0.2 0.2 0.2 0.2 0.6 0.4Other income 5.2 5.9 4.3 4.6 3.4 3.3 2.7 2.9 5.8 6.7
of which: Income from long-term equity investments 1.8 3.0 0.2 0.2 0.5 0.5 0.4 0.4 2.1 3.6Total income 105.7 106.3 104.4 104.7 103.6 103.4 102.9 103.1 106.4 107.1
ExpensesCost of materials 45.5 45.8 25.7 26.5 29.5 29.6 33.6 33.2 48.7 49.2Personnel expenses 30.0 30.3 46.5 46.8 45.6 45.4 40.8 41.0 27.0 27.3Depreciation 5.4 4.9 3.9 3.5 3.7 4.0 3.6 3.9 5.9 5.2
of which: Depreciation of tangible fixed assets 4.4 4.4 3.6 3.5 3.6 3.7 3.3 3.3 4.7 4.6Interest and similar expenses 1.2 1.1 0.8 0.6 0.6 0.6 0.7 0.7 1.4 1.3Operating taxes 0.1 0.0 0.1 0.1 0.0 0.0 0.1 0.0 0.1 0.0Other expenses 17.0 16.9 20.9 21.1 18.6 19.0 19.1 19.1 16.5 16.4Total expenses before taxes on income 99.2 99.0 97.9 98.6 98.0 98.6 97.8 97.7 99.5 99.3Annual result before taxes on income 6.5 7.3 6.5 6.1 5.6 4.8 5.1 5.4 6.9 7.8Taxes on income 2.2 1.8 2.0 1.8 1.7 1.7 1.8 1.8 2.3 1.8Annual result 4.3 5.5 4.5 4.3 3.9 3.2 3.3 3.6 4.5 6.0Profit and loss transfers (parent company) 0.9 0.6 0.0 0.0 0.5 0.6 0.3 0.4 1.0 0.7Profit and loss transfers (subsidiary) 0.9 2.3 0.5 0.5 0.9 1.2 1.5 1.4 0.8 2.6Profit for the year 4.3 3.8 4.0 3.8 3.4 2.6 2.1 2.6 4.8 4.1
Balance sheetAssets Percentage of the balance sheet totalIntangible fixed assets 3.5 3.5 6.1 5.9 4.0 3.7 3.9 4.1 3.5 3.5Tangible fixed assets 8.7 8.9 12.3 10.9 16.6 16.5 11.3 11.5 8.2 8.5
of which: Land and buildings 2.8 2.8 3.3 2.7 6.2 5.6 3.7 3.6 2.6 2.7Inventories 2.5 2.5 6.2 6.3 7.2 6.9 5.5 5.0 2.1 2.1
of which: Finished goods and merchandise 0.5 0.5 3.4 2.6 1.8 1.7 1.1 1.2 0.4 0.4Cash 11.3 6.0 28.9 30.5 20.8 20.6 18.9 17.1 10.3 4.5Receivables 31.0 29.8 38.6 37.4 42.3 41.3 43.8 45.2 29.5 28.0
Short-term 29.2 28.1 37.2 35.7 40.7 39.4 40.6 42.1 27.8 26.5 of which:
Trade receivables 6.8 6.8 22.3 21.4 22.6 22.1 18.6 18.3 5.3 5.3Receivables from affiliated companies 20.2 18.9 8.6 8.1 13.2 12.1 18.2 20.1 20.6 19.0
Long-term 1.8 1.7 1.4 1.7 1.7 1.9 3.2 3.1 1.7 1.6of which: Loans to affiliated companies 1.4 1.3 0.2 0.2 1.4 1.6 2.6 2.7 1.3 1.2
Securities 1.0 1.1 1.8 1.6 1.0 0.8 1.3 1.1 1.0 1.1Other long-term equity investments 40.4 44.7 4.4 5.5 6.5 8.3 12.8 13.1 43.8 48.6
of which: Goodwill 1.8 1.4 0.5 0.5 0.4 0.3 1.2 0.9 1.8 1.4
CapitalEquity 32.4 30.6 34.3 38.4 32.6 31.7 35.3 35.0 32.1 30.1Liabilities 49.6 51.7 49.4 46.7 50.0 51.0 41.5 42.5 50.4 52.7
Short-term 35.3 36.6 36.7 35.6 36.6 34.8 31.6 32.8 35.6 37.1of which:Liabilities to banks 0.8 1.9 4.3 4.4 4.8 4.0 2.1 2.0 0.6 1.8Trade payables 4.3 4.3 8.9 8.6 9.0 8.5 7.1 7.0 3.9 3.9Liabilities to affiliated companies 25.1 24.7 8.6 7.3 12.1 11.3 14.2 15.9 26.5 25.8
Long-term 14.3 15.1 12.7 11.1 13.4 16.2 9.9 9.6 14.8 15.6 of which:
Liabilities to banks 1.5 3.5 6.6 6.3 7.3 8.3 3.8 3.7 1.1 3.3Liabilities to affiliated companies 2.4 3.0 3.2 2.8 3.7 6.1 4.8 4.6 2.1 2.8
Provisions 15.1 14.8 12.1 10.8 12.7 12.4 16.5 15.9 15.1 14.8of which: Provisions for pensions 7.1 7.1 2.3 1.6 2.1 2.0 4.4 4.0 7.5 7.5
Other ratios Percentage of salesAnnual result before taxes on income 6.6 7.3 6.6 6.2 5.7 4.9 5.1 5.4 6.9 7.8Annual result and depreciation 9.7 10.5 8.5 8.0 7.7 7.3 6.9 7.5 10.4 11.2Trade receivables 8.7 8.6 12.2 12.0 13.5 13.2 13.1 12.9 7.6 7.5
Percentage of the balance sheet totalSales 78.2 78.8 183.1 177.9 167.5 167.4 141.7 141.8 70.0 70.6Annual result and interest paid 4.3 5.3 9.7 9.0 7.6 6.5 5.7 6.1 4.1 5.1
Percentage of liabilities and provisions less cashAnnual result and depreciation 13.5 13.0 42.1 45.7 27.5 25.6 21.4 22.2 12.7 12.1
Percentage of fixed assetsLong-term equity and liabilities 97.7 88.6 198.5 208.5 165.6 162.1 155.6 149.5 93.8 84.6
Percentage of short-term liabilitiesCash resources and short-term receivables 115.9 94.1 183.3 189.3 169.5 173.8 189.8 181.5 108.2 84.7Cash resources, short-term receivables and inventories 122.9 100.9 200.1 206.9 189.1 193.5 207.2 196.7 114.1 90.5
Percentage of cost of materialsTrade payables 12.0 11.8 18.6 17.8 17.9 16.8 14.8 14.8 11.4 11.2
Memo item:Balance sheet total in € billion 90.21 97.12 0.28 0.33 1.49 1.67 7.81 8.51 80.62 86.61Sales in € billion 70.52 76.57 0.52 0.59 2.49 2.80 11.08 12.07 56.44 61.11Number of enterprises 1 914 1 914 675 675 521 521 503 503 215 215
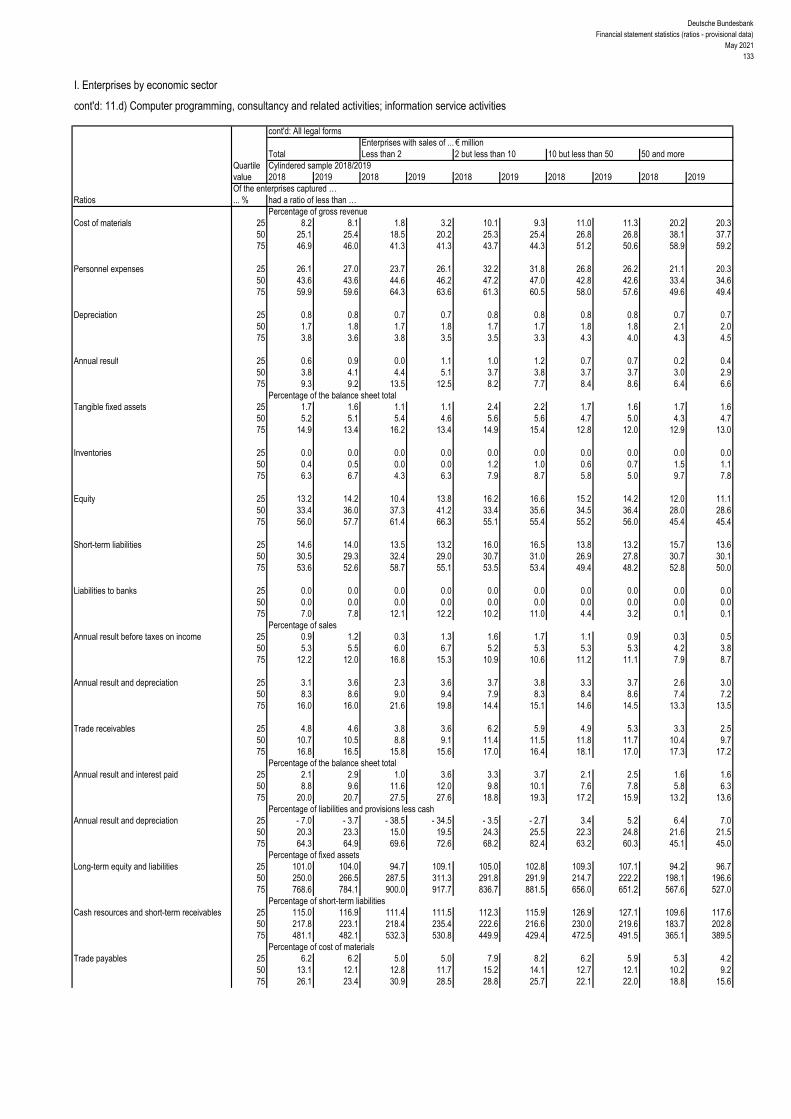
Deutsche BundesbankFinancial statement statistics (ratios - provisional data)
May 2021133
I. Enterprises by economic sector
cont'd: 11.d) Computer programming, consultancy and related activities; information service activities
cont'd: All legal formsEnterprises with sales of ... € million
Total Less than 2 2 but less than 10 10 but less than 50 50 and moreQuartile Cylindered sample 2018/2019value 2018 2019 2018 2019 2018 2019 2018 2019 2018 2019Of the enterprises captured …
Ratios ... % had a ratio of less than …Percentage of gross revenue
Cost of materials 25 8.2 8.1 1.8 3.2 10.1 9.3 11.0 11.3 20.2 20.3 50 25.1 25.4 18.5 20.2 25.3 25.4 26.8 26.8 38.1 37.7 75 46.9 46.0 41.3 41.3 43.7 44.3 51.2 50.6 58.9 59.2
Personnel expenses 25 26.1 27.0 23.7 26.1 32.2 31.8 26.8 26.2 21.1 20.3 50 43.6 43.6 44.6 46.2 47.2 47.0 42.8 42.6 33.4 34.6 75 59.9 59.6 64.3 63.6 61.3 60.5 58.0 57.6 49.6 49.4
Depreciation 25 0.8 0.8 0.7 0.7 0.8 0.8 0.8 0.8 0.7 0.7 50 1.7 1.8 1.7 1.8 1.7 1.7 1.8 1.8 2.1 2.0 75 3.8 3.6 3.8 3.5 3.5 3.3 4.3 4.0 4.3 4.5
Annual result 25 0.6 0.9 0.0 1.1 1.0 1.2 0.7 0.7 0.2 0.4 50 3.8 4.1 4.4 5.1 3.7 3.8 3.7 3.7 3.0 2.9 75 9.3 9.2 13.5 12.5 8.2 7.7 8.4 8.6 6.4 6.6
Percentage of the balance sheet totalTangible fixed assets 25 1.7 1.6 1.1 1.1 2.4 2.2 1.7 1.6 1.7 1.6
50 5.2 5.1 5.4 4.6 5.6 5.6 4.7 5.0 4.3 4.7 75 14.9 13.4 16.2 13.4 14.9 15.4 12.8 12.0 12.9 13.0
Inventories 25 0.0 0.0 0.0 0.0 0.0 0.0 0.0 0.0 0.0 0.0 50 0.4 0.5 0.0 0.0 1.2 1.0 0.6 0.7 1.5 1.1 75 6.3 6.7 4.3 6.3 7.9 8.7 5.8 5.0 9.7 7.8
Equity 25 13.2 14.2 10.4 13.8 16.2 16.6 15.2 14.2 12.0 11.1 50 33.4 36.0 37.3 41.2 33.4 35.6 34.5 36.4 28.0 28.6 75 56.0 57.7 61.4 66.3 55.1 55.4 55.2 56.0 45.4 45.4
Short-term liabilities 25 14.6 14.0 13.5 13.2 16.0 16.5 13.8 13.2 15.7 13.6 50 30.5 29.3 32.4 29.0 30.7 31.0 26.9 27.8 30.7 30.1 75 53.6 52.6 58.7 55.1 53.5 53.4 49.4 48.2 52.8 50.0
Liabilities to banks 25 0.0 0.0 0.0 0.0 0.0 0.0 0.0 0.0 0.0 0.0 50 0.0 0.0 0.0 0.0 0.0 0.0 0.0 0.0 0.0 0.0 75 7.0 7.8 12.1 12.2 10.2 11.0 4.4 3.2 0.1 0.1
Percentage of salesAnnual result before taxes on income 25 0.9 1.2 0.3 1.3 1.6 1.7 1.1 0.9 0.3 0.5
50 5.3 5.5 6.0 6.7 5.2 5.3 5.3 5.3 4.2 3.8 75 12.2 12.0 16.8 15.3 10.9 10.6 11.2 11.1 7.9 8.7
Annual result and depreciation 25 3.1 3.6 2.3 3.6 3.7 3.8 3.3 3.7 2.6 3.0 50 8.3 8.6 9.0 9.4 7.9 8.3 8.4 8.6 7.4 7.2 75 16.0 16.0 21.6 19.8 14.4 15.1 14.6 14.5 13.3 13.5
Trade receivables 25 4.8 4.6 3.8 3.6 6.2 5.9 4.9 5.3 3.3 2.5 50 10.7 10.5 8.8 9.1 11.4 11.5 11.8 11.7 10.4 9.7 75 16.8 16.5 15.8 15.6 17.0 16.4 18.1 17.0 17.3 17.2
Percentage of the balance sheet totalAnnual result and interest paid 25 2.1 2.9 1.0 3.6 3.3 3.7 2.1 2.5 1.6 1.6
50 8.8 9.6 11.6 12.0 9.8 10.1 7.6 7.8 5.8 6.3 75 20.0 20.7 27.5 27.6 18.8 19.3 17.2 15.9 13.2 13.6
Percentage of liabilities and provisions less cashAnnual result and depreciation 25 - 7.0 - 3.7 - 38.5 - 34.5 - 3.5 - 2.7 3.4 5.2 6.4 7.0
50 20.3 23.3 15.0 19.5 24.3 25.5 22.3 24.8 21.6 21.5 75 64.3 64.9 69.6 72.6 68.2 82.4 63.2 60.3 45.1 45.0
Percentage of fixed assetsLong-term equity and liabilities 25 101.0 104.0 94.7 109.1 105.0 102.8 109.3 107.1 94.2 96.7
50 250.0 266.5 287.5 311.3 291.8 291.9 214.7 222.2 198.1 196.6 75 768.6 784.1 900.0 917.7 836.7 881.5 656.0 651.2 567.6 527.0
Percentage of short-term liabilitiesCash resources and short-term receivables 25 115.0 116.9 111.4 111.5 112.3 115.9 126.9 127.1 109.6 117.6
50 217.8 223.1 218.4 235.4 222.6 216.6 230.0 219.6 183.7 202.8 75 481.1 482.1 532.3 530.8 449.9 429.4 472.5 491.5 365.1 389.5
Percentage of cost of materialsTrade payables 25 6.2 6.2 5.0 5.0 7.9 8.2 6.2 5.9 5.3 4.2
50 13.1 12.1 12.8 11.7 15.2 14.1 12.7 12.1 10.2 9.2 75 26.1 23.4 30.9 28.5 28.8 25.7 22.1 22.0 18.8 15.6
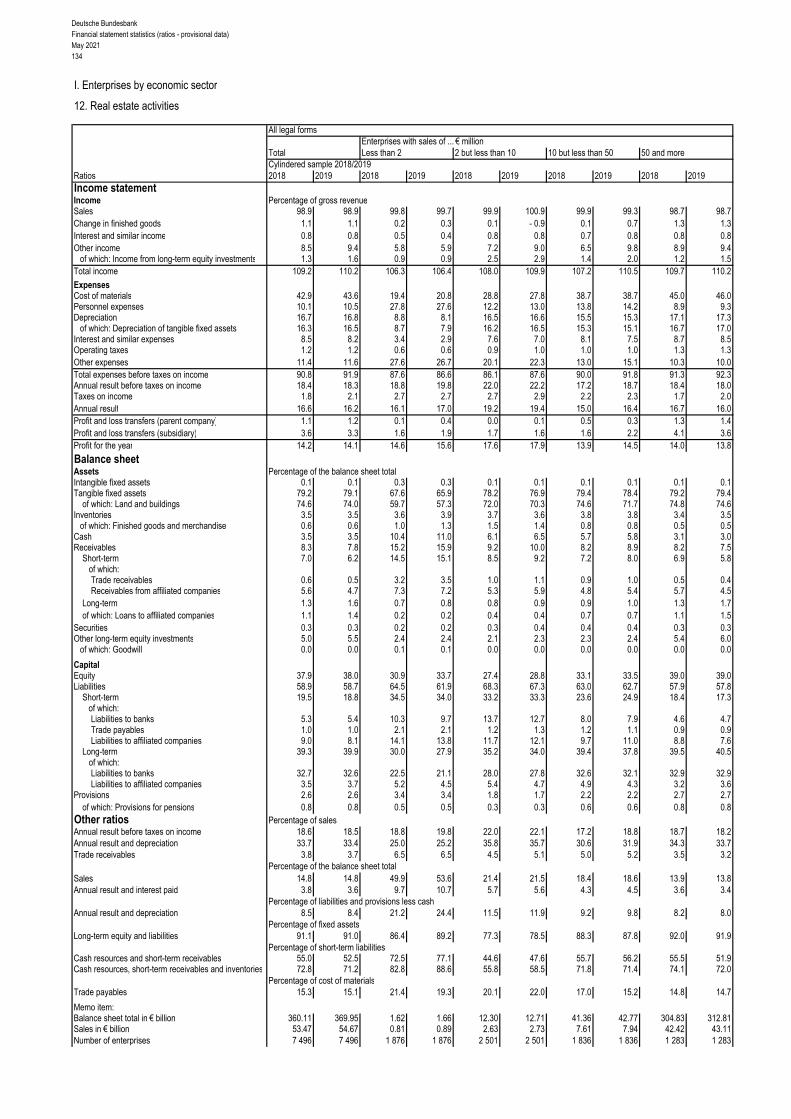
Deutsche BundesbankFinancial statement statistics (ratios - provisional data)May 2021134
I. Enterprises by economic sector
12. Real estate activities
All legal formsEnterprises with sales of ... € million
Total Less than 2 2 but less than 10 10 but less than 50 50 and moreCylindered sample 2018/2019
Ratios 2018 2019 2018 2019 2018 2019 2018 2019 2018 2019Income statementIncome Percentage of gross revenueSales 98.9 98.9 99.8 99.7 99.9 100.9 99.9 99.3 98.7 98.7Change in finished goods 1.1 1.1 0.2 0.3 0.1 - 0.9 0.1 0.7 1.3 1.3Interest and similar income 0.8 0.8 0.5 0.4 0.8 0.8 0.7 0.8 0.8 0.8Other income 8.5 9.4 5.8 5.9 7.2 9.0 6.5 9.8 8.9 9.4
of which: Income from long-term equity investments 1.3 1.6 0.9 0.9 2.5 2.9 1.4 2.0 1.2 1.5Total income 109.2 110.2 106.3 106.4 108.0 109.9 107.2 110.5 109.7 110.2
ExpensesCost of materials 42.9 43.6 19.4 20.8 28.8 27.8 38.7 38.7 45.0 46.0Personnel expenses 10.1 10.5 27.8 27.6 12.2 13.0 13.8 14.2 8.9 9.3Depreciation 16.7 16.8 8.8 8.1 16.5 16.6 15.5 15.3 17.1 17.3
of which: Depreciation of tangible fixed assets 16.3 16.5 8.7 7.9 16.2 16.5 15.3 15.1 16.7 17.0Interest and similar expenses 8.5 8.2 3.4 2.9 7.6 7.0 8.1 7.5 8.7 8.5Operating taxes 1.2 1.2 0.6 0.6 0.9 1.0 1.0 1.0 1.3 1.3Other expenses 11.4 11.6 27.6 26.7 20.1 22.3 13.0 15.1 10.3 10.0Total expenses before taxes on income 90.8 91.9 87.6 86.6 86.1 87.6 90.0 91.8 91.3 92.3Annual result before taxes on income 18.4 18.3 18.8 19.8 22.0 22.2 17.2 18.7 18.4 18.0Taxes on income 1.8 2.1 2.7 2.7 2.7 2.9 2.2 2.3 1.7 2.0Annual result 16.6 16.2 16.1 17.0 19.2 19.4 15.0 16.4 16.7 16.0Profit and loss transfers (parent company) 1.1 1.2 0.1 0.4 0.0 0.1 0.5 0.3 1.3 1.4Profit and loss transfers (subsidiary) 3.6 3.3 1.6 1.9 1.7 1.6 1.6 2.2 4.1 3.6Profit for the year 14.2 14.1 14.6 15.6 17.6 17.9 13.9 14.5 14.0 13.8
Balance sheetAssets Percentage of the balance sheet totalIntangible fixed assets 0.1 0.1 0.3 0.3 0.1 0.1 0.1 0.1 0.1 0.1Tangible fixed assets 79.2 79.1 67.6 65.9 78.2 76.9 79.4 78.4 79.2 79.4
of which: Land and buildings 74.6 74.0 59.7 57.3 72.0 70.3 74.6 71.7 74.8 74.6Inventories 3.5 3.5 3.6 3.9 3.7 3.6 3.8 3.8 3.4 3.5
of which: Finished goods and merchandise 0.6 0.6 1.0 1.3 1.5 1.4 0.8 0.8 0.5 0.5Cash 3.5 3.5 10.4 11.0 6.1 6.5 5.7 5.8 3.1 3.0Receivables 8.3 7.8 15.2 15.9 9.2 10.0 8.2 8.9 8.2 7.5
Short-term 7.0 6.2 14.5 15.1 8.5 9.2 7.2 8.0 6.9 5.8 of which:
Trade receivables 0.6 0.5 3.2 3.5 1.0 1.1 0.9 1.0 0.5 0.4Receivables from affiliated companies 5.6 4.7 7.3 7.2 5.3 5.9 4.8 5.4 5.7 4.5
Long-term 1.3 1.6 0.7 0.8 0.8 0.9 0.9 1.0 1.3 1.7of which: Loans to affiliated companies 1.1 1.4 0.2 0.2 0.4 0.4 0.7 0.7 1.1 1.5
Securities 0.3 0.3 0.2 0.2 0.3 0.4 0.4 0.4 0.3 0.3Other long-term equity investments 5.0 5.5 2.4 2.4 2.1 2.3 2.3 2.4 5.4 6.0
of which: Goodwill 0.0 0.0 0.1 0.1 0.0 0.0 0.0 0.0 0.0 0.0
CapitalEquity 37.9 38.0 30.9 33.7 27.4 28.8 33.1 33.5 39.0 39.0Liabilities 58.9 58.7 64.5 61.9 68.3 67.3 63.0 62.7 57.9 57.8
Short-term 19.5 18.8 34.5 34.0 33.2 33.3 23.6 24.9 18.4 17.3of which:Liabilities to banks 5.3 5.4 10.3 9.7 13.7 12.7 8.0 7.9 4.6 4.7Trade payables 1.0 1.0 2.1 2.1 1.2 1.3 1.2 1.1 0.9 0.9Liabilities to affiliated companies 9.0 8.1 14.1 13.8 11.7 12.1 9.7 11.0 8.8 7.6
Long-term 39.3 39.9 30.0 27.9 35.2 34.0 39.4 37.8 39.5 40.5 of which:
Liabilities to banks 32.7 32.6 22.5 21.1 28.0 27.8 32.6 32.1 32.9 32.9Liabilities to affiliated companies 3.5 3.7 5.2 4.5 5.4 4.7 4.9 4.3 3.2 3.6
Provisions 2.6 2.6 3.4 3.4 1.8 1.7 2.2 2.2 2.7 2.7of which: Provisions for pensions 0.8 0.8 0.5 0.5 0.3 0.3 0.6 0.6 0.8 0.8
Other ratios Percentage of salesAnnual result before taxes on income 18.6 18.5 18.8 19.8 22.0 22.1 17.2 18.8 18.7 18.2Annual result and depreciation 33.7 33.4 25.0 25.2 35.8 35.7 30.6 31.9 34.3 33.7Trade receivables 3.8 3.7 6.5 6.5 4.5 5.1 5.0 5.2 3.5 3.2
Percentage of the balance sheet totalSales 14.8 14.8 49.9 53.6 21.4 21.5 18.4 18.6 13.9 13.8Annual result and interest paid 3.8 3.6 9.7 10.7 5.7 5.6 4.3 4.5 3.6 3.4
Percentage of liabilities and provisions less cashAnnual result and depreciation 8.5 8.4 21.2 24.4 11.5 11.9 9.2 9.8 8.2 8.0
Percentage of fixed assetsLong-term equity and liabilities 91.1 91.0 86.4 89.2 77.3 78.5 88.3 87.8 92.0 91.9
Percentage of short-term liabilitiesCash resources and short-term receivables 55.0 52.5 72.5 77.1 44.6 47.6 55.7 56.2 55.5 51.9Cash resources, short-term receivables and inventories 72.8 71.2 82.8 88.6 55.8 58.5 71.8 71.4 74.1 72.0
Percentage of cost of materialsTrade payables 15.3 15.1 21.4 19.3 20.1 22.0 17.0 15.2 14.8 14.7
Memo item:Balance sheet total in € billion 360.11 369.95 1.62 1.66 12.30 12.71 41.36 42.77 304.83 312.81Sales in € billion 53.47 54.67 0.81 0.89 2.63 2.73 7.61 7.94 42.42 43.11Number of enterprises 7 496 7 496 1 876 1 876 2 501 2 501 1 836 1 836 1 283 1 283

Deutsche BundesbankFinancial statement statistics (ratios - provisional data)
May 2021135
I. Enterprises by economic sector
cont'd: 12. Real estate activities
cont'd: All legal formsEnterprises with sales of ... € million
Total Less than 2 2 but less than 10 10 but less than 50 50 and moreQuartile Cylindered sample 2018/2019value 2018 2019 2018 2019 2018 2019 2018 2019 2018 2019Of the enterprises captured …
Ratios ... % had a ratio of less than …Percentage of gross revenue
Cost of materials 25 0.0 0.0 0.0 0.0 0.0 0.0 0.0 0.0 25.1 25.9 50 4.1 4.1 0.0 0.0 0.0 0.0 20.1 20.6 44.3 44.7 75 41.9 42.3 7.8 8.0 16.5 16.1 47.2 47.8 53.1 53.6
Personnel expenses 25 0.0 0.0 0.0 0.0 0.0 0.0 0.0 0.0 0.0 0.0 50 0.0 0.0 0.0 0.0 0.0 0.0 0.2 0.2 8.4 8.7 75 11.1 11.3 22.6 21.7 4.7 5.0 11.2 11.4 12.3 12.4
Depreciation 25 11.3 11.1 2.0 1.9 14.4 14.5 14.6 14.8 14.3 14.2 50 19.8 19.9 11.8 11.1 23.9 23.9 21.7 21.8 18.2 18.3 75 31.9 31.7 26.7 25.9 37.7 38.0 32.6 32.9 24.7 24.4
Annual result 25 3.3 3.6 2.7 3.4 2.7 2.9 2.8 3.0 5.1 5.2 50 15.4 16.1 19.4 20.8 19.7 21.0 12.5 13.9 11.5 11.4 75 36.8 37.9 44.4 46.0 40.7 41.9 30.6 33.1 22.1 22.2
Percentage of the balance sheet totalTangible fixed assets 25 62.2 60.5 16.0 14.2 70.1 67.7 74.8 74.0 80.4 80.1
50 87.6 87.2 68.4 66.9 90.4 89.3 89.1 88.8 89.4 89.6 75 95.5 95.1 92.0 91.6 97.6 97.4 95.6 95.4 93.4 93.4
Inventories 25 0.0 0.0 0.0 0.0 0.0 0.0 0.0 0.0 0.0 0.0 50 0.0 0.0 0.0 0.0 0.0 0.0 0.0 0.0 3.2 3.2 75 2.7 2.7 0.0 0.0 0.0 0.0 3.9 4.0 4.5 4.5
Equity 25 4.4 5.7 3.9 5.9 1.5 2.0 4.2 4.9 23.3 23.6 50 27.9 29.8 27.6 31.3 17.3 19.1 29.3 30.4 37.7 38.2 75 53.5 55.6 60.2 64.7 48.0 51.4 52.3 54.3 53.6 54.4
Short-term liabilities 25 6.4 6.5 6.7 6.2 6.1 6.3 6.0 6.3 7.1 7.2 50 13.5 13.4 22.3 21.9 19.8 18.9 10.6 11.2 9.6 9.7 75 45.8 45.9 57.6 55.2 58.3 57.9 34.7 35.6 17.0 17.6
Liabilities to banks 25 3.5 2.2 0.0 0.0 9.5 8.1 13.2 13.3 21.6 19.8 50 36.7 35.0 11.1 10.7 40.2 38.3 40.3 39.0 43.2 42.0 75 60.5 59.0 52.8 50.0 67.8 65.0 62.1 61.6 57.1 56.7
Percentage of salesAnnual result before taxes on income 25 4.0 4.3 3.5 4.4 3.4 3.6 3.6 3.6 5.7 5.9
50 17.1 18.3 22.6 24.3 22.6 23.2 14.0 15.7 12.5 12.4 75 41.0 42.4 50.0 51.1 46.3 47.3 34.6 36.9 24.0 25.0
Annual result and depreciation 25 23.5 24.4 12.0 13.2 30.7 31.5 24.0 25.6 24.1 24.1 50 42.7 44.1 43.4 45.3 54.6 55.2 39.8 41.5 31.8 32.2 75 70.8 71.7 73.8 74.9 76.2 77.6 66.3 68.4 47.2 48.0
Trade receivables 25 0.0 0.0 0.0 0.0 0.0 0.0 0.0 0.0 0.3 0.3 50 0.4 0.3 0.0 0.0 0.0 0.0 0.5 0.5 0.7 0.7 75 2.1 2.1 4.0 4.1 1.8 1.9 2.0 1.9 1.6 1.5
Percentage of the balance sheet totalAnnual result and interest paid 25 2.1 2.1 2.7 3.0 2.2 2.1 1.9 1.8 2.0 1.9
50 3.9 4.0 7.1 7.6 4.4 4.4 3.3 3.3 2.9 2.8 75 7.7 7.9 15.4 16.7 7.7 7.9 5.6 5.7 4.2 4.1
Percentage of liabilities and provisions less cashAnnual result and depreciation 25 3.7 3.8 1.4 1.8 3.5 3.6 3.7 4.0 4.9 4.9
50 8.5 8.9 12.1 13.6 8.6 8.8 7.9 8.2 7.5 7.7 75 18.8 20.7 37.9 38.8 18.8 20.6 14.4 15.2 12.3 12.7
Percentage of fixed assetsLong-term equity and liabilities 25 63.0 64.4 58.6 60.5 45.6 47.4 71.2 70.0 91.5 91.3
50 96.4 96.7 97.9 99.1 89.7 90.6 97.1 97.1 98.5 98.1 75 107.7 109.0 146.3 162.5 105.2 107.9 105.3 105.0 103.1 103.0
Percentage of short-term liabilitiesCash resources and short-term receivables 25 12.7 13.5 20.7 21.8 6.3 6.3 14.0 13.5 21.5 22.6
50 52.9 53.6 95.7 98.0 36.0 39.2 54.0 51.3 51.9 49.3 75 171.0 182.7 335.5 358.3 155.3 179.6 143.3 142.8 107.7 108.2
Percentage of cost of materialsTrade payables 25 3.2 2.7 0.0 0.1 0.0 0.0 4.7 3.6 6.9 6.9
50 10.0 9.4 8.8 8.5 6.3 6.1 10.3 9.4 12.3 11.8 75 22.6 21.6 38.5 42.8 19.3 21.6 20.6 18.7 21.3 20.7
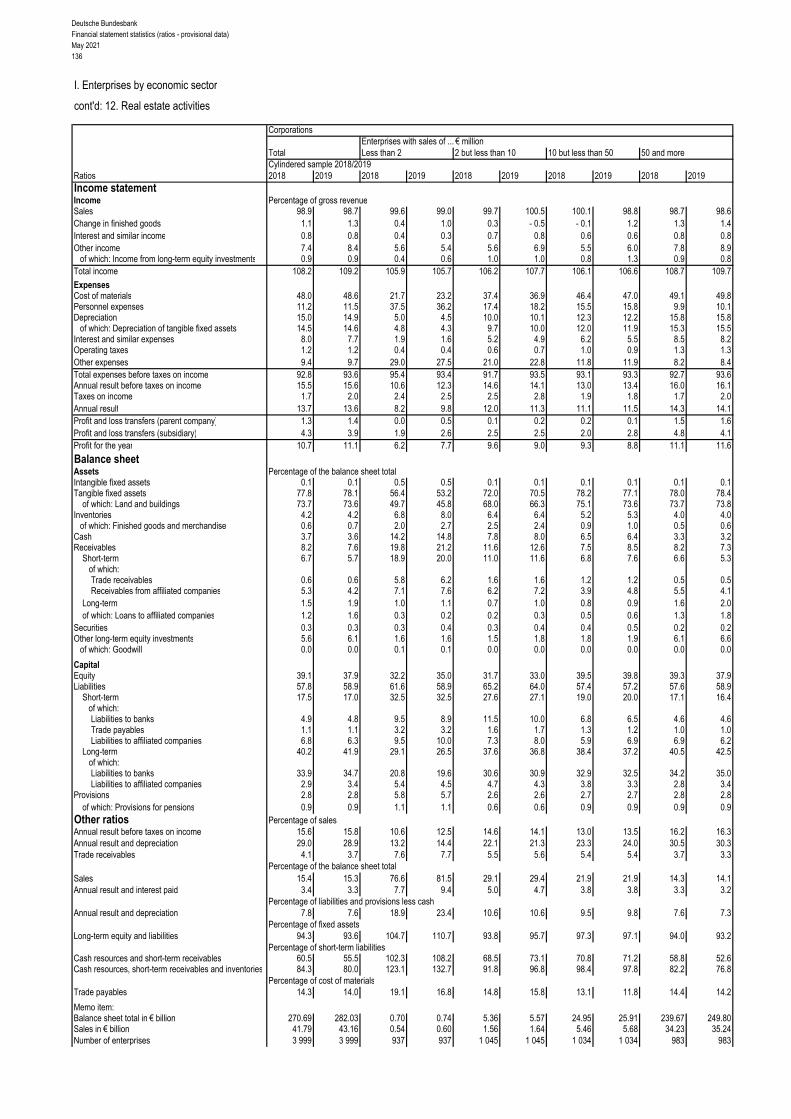
Deutsche BundesbankFinancial statement statistics (ratios - provisional data)May 2021136
I. Enterprises by economic sector
cont'd: 12. Real estate activities
CorporationsEnterprises with sales of ... € million
Total Less than 2 2 but less than 10 10 but less than 50 50 and moreCylindered sample 2018/2019
Ratios 2018 2019 2018 2019 2018 2019 2018 2019 2018 2019Income statementIncome Percentage of gross revenueSales 98.9 98.7 99.6 99.0 99.7 100.5 100.1 98.8 98.7 98.6Change in finished goods 1.1 1.3 0.4 1.0 0.3 - 0.5 - 0.1 1.2 1.3 1.4Interest and similar income 0.8 0.8 0.4 0.3 0.7 0.8 0.6 0.6 0.8 0.8Other income 7.4 8.4 5.6 5.4 5.6 6.9 5.5 6.0 7.8 8.9
of which: Income from long-term equity investments 0.9 0.9 0.4 0.6 1.0 1.0 0.8 1.3 0.9 0.8Total income 108.2 109.2 105.9 105.7 106.2 107.7 106.1 106.6 108.7 109.7
ExpensesCost of materials 48.0 48.6 21.7 23.2 37.4 36.9 46.4 47.0 49.1 49.8Personnel expenses 11.2 11.5 37.5 36.2 17.4 18.2 15.5 15.8 9.9 10.1Depreciation 15.0 14.9 5.0 4.5 10.0 10.1 12.3 12.2 15.8 15.8
of which: Depreciation of tangible fixed assets 14.5 14.6 4.8 4.3 9.7 10.0 12.0 11.9 15.3 15.5Interest and similar expenses 8.0 7.7 1.9 1.6 5.2 4.9 6.2 5.5 8.5 8.2Operating taxes 1.2 1.2 0.4 0.4 0.6 0.7 1.0 0.9 1.3 1.3Other expenses 9.4 9.7 29.0 27.5 21.0 22.8 11.8 11.9 8.2 8.4Total expenses before taxes on income 92.8 93.6 95.4 93.4 91.7 93.5 93.1 93.3 92.7 93.6Annual result before taxes on income 15.5 15.6 10.6 12.3 14.6 14.1 13.0 13.4 16.0 16.1Taxes on income 1.7 2.0 2.4 2.5 2.5 2.8 1.9 1.8 1.7 2.0Annual result 13.7 13.6 8.2 9.8 12.0 11.3 11.1 11.5 14.3 14.1Profit and loss transfers (parent company) 1.3 1.4 0.0 0.5 0.1 0.2 0.2 0.1 1.5 1.6Profit and loss transfers (subsidiary) 4.3 3.9 1.9 2.6 2.5 2.5 2.0 2.8 4.8 4.1Profit for the year 10.7 11.1 6.2 7.7 9.6 9.0 9.3 8.8 11.1 11.6
Balance sheetAssets Percentage of the balance sheet totalIntangible fixed assets 0.1 0.1 0.5 0.5 0.1 0.1 0.1 0.1 0.1 0.1Tangible fixed assets 77.8 78.1 56.4 53.2 72.0 70.5 78.2 77.1 78.0 78.4
of which: Land and buildings 73.7 73.6 49.7 45.8 68.0 66.3 75.1 73.6 73.7 73.8Inventories 4.2 4.2 6.8 8.0 6.4 6.4 5.2 5.3 4.0 4.0
of which: Finished goods and merchandise 0.6 0.7 2.0 2.7 2.5 2.4 0.9 1.0 0.5 0.6Cash 3.7 3.6 14.2 14.8 7.8 8.0 6.5 6.4 3.3 3.2Receivables 8.2 7.6 19.8 21.2 11.6 12.6 7.5 8.5 8.2 7.3
Short-term 6.7 5.7 18.9 20.0 11.0 11.6 6.8 7.6 6.6 5.3 of which:
Trade receivables 0.6 0.6 5.8 6.2 1.6 1.6 1.2 1.2 0.5 0.5Receivables from affiliated companies 5.3 4.2 7.1 7.6 6.2 7.2 3.9 4.8 5.5 4.1
Long-term 1.5 1.9 1.0 1.1 0.7 1.0 0.8 0.9 1.6 2.0of which: Loans to affiliated companies 1.2 1.6 0.3 0.2 0.2 0.3 0.5 0.6 1.3 1.8
Securities 0.3 0.3 0.3 0.4 0.3 0.4 0.4 0.5 0.2 0.2Other long-term equity investments 5.6 6.1 1.6 1.6 1.5 1.8 1.8 1.9 6.1 6.6
of which: Goodwill 0.0 0.0 0.1 0.1 0.0 0.0 0.0 0.0 0.0 0.0
CapitalEquity 39.1 37.9 32.2 35.0 31.7 33.0 39.5 39.8 39.3 37.9Liabilities 57.8 58.9 61.6 58.9 65.2 64.0 57.4 57.2 57.6 58.9
Short-term 17.5 17.0 32.5 32.5 27.6 27.1 19.0 20.0 17.1 16.4of which:Liabilities to banks 4.9 4.8 9.5 8.9 11.5 10.0 6.8 6.5 4.6 4.6Trade payables 1.1 1.1 3.2 3.2 1.6 1.7 1.3 1.2 1.0 1.0Liabilities to affiliated companies 6.8 6.3 9.5 10.0 7.3 8.0 5.9 6.9 6.9 6.2
Long-term 40.2 41.9 29.1 26.5 37.6 36.8 38.4 37.2 40.5 42.5 of which:
Liabilities to banks 33.9 34.7 20.8 19.6 30.6 30.9 32.9 32.5 34.2 35.0Liabilities to affiliated companies 2.9 3.4 5.4 4.5 4.7 4.3 3.8 3.3 2.8 3.4
Provisions 2.8 2.8 5.8 5.7 2.6 2.6 2.7 2.7 2.8 2.8of which: Provisions for pensions 0.9 0.9 1.1 1.1 0.6 0.6 0.9 0.9 0.9 0.9
Other ratios Percentage of salesAnnual result before taxes on income 15.6 15.8 10.6 12.5 14.6 14.1 13.0 13.5 16.2 16.3Annual result and depreciation 29.0 28.9 13.2 14.4 22.1 21.3 23.3 24.0 30.5 30.3Trade receivables 4.1 3.7 7.6 7.7 5.5 5.6 5.4 5.4 3.7 3.3
Percentage of the balance sheet totalSales 15.4 15.3 76.6 81.5 29.1 29.4 21.9 21.9 14.3 14.1Annual result and interest paid 3.4 3.3 7.7 9.4 5.0 4.7 3.8 3.8 3.3 3.2
Percentage of liabilities and provisions less cashAnnual result and depreciation 7.8 7.6 18.9 23.4 10.6 10.6 9.5 9.8 7.6 7.3
Percentage of fixed assetsLong-term equity and liabilities 94.3 93.6 104.7 110.7 93.8 95.7 97.3 97.1 94.0 93.2
Percentage of short-term liabilitiesCash resources and short-term receivables 60.5 55.5 102.3 108.2 68.5 73.1 70.8 71.2 58.8 52.6Cash resources, short-term receivables and inventories 84.3 80.0 123.1 132.7 91.8 96.8 98.4 97.8 82.2 76.8
Percentage of cost of materialsTrade payables 14.3 14.0 19.1 16.8 14.8 15.8 13.1 11.8 14.4 14.2
Memo item:Balance sheet total in € billion 270.69 282.03 0.70 0.74 5.36 5.57 24.95 25.91 239.67 249.80Sales in € billion 41.79 43.16 0.54 0.60 1.56 1.64 5.46 5.68 34.23 35.24Number of enterprises 3 999 3 999 937 937 1 045 1 045 1 034 1 034 983 983

Deutsche BundesbankFinancial statement statistics (ratios - provisional data)
May 2021137
I. Enterprises by economic sector
cont'd: 12 Real estate activities
cont'd: CorporationsEnterprises with sales of ... € million
Total Less than 2 2 but less than 10 10 but less than 50 50 and moreQuartile Cylindered sample 2018/2019value 2018 2019 2018 2019 2018 2019 2018 2019 2018 2019Of the enterprises captured …
Ratios ... % had a ratio of less than …Percentage of gross revenue
Cost of materials 25 0.0 0.0 0.0 0.0 0.0 0.0 12.0 13.7 40.0 40.1 50 31.9 32.7 0.0 0.0 5.9 5.9 42.5 43.1 47.4 47.8 75 50.4 51.0 19.4 21.1 43.2 43.6 52.8 54.2 54.8 55.6
Personnel expenses 25 0.0 0.0 0.0 0.0 0.0 0.0 0.0 0.0 4.0 4.5 50 8.6 8.7 13.3 13.0 1.8 1.8 8.6 8.6 9.9 10.1 75 15.7 15.7 46.2 46.3 13.2 13.6 13.7 13.8 13.0 13.2
Depreciation 25 7.7 7.5 0.9 0.9 9.4 8.9 12.7 13.0 13.8 13.8 50 16.5 16.5 4.4 3.9 18.7 18.6 18.5 18.7 17.3 17.4 75 23.4 23.6 16.4 15.8 29.0 28.3 24.8 25.2 21.3 21.5
Annual result 25 2.6 2.7 0.3 1.2 1.5 1.6 3.2 2.8 5.0 5.2 50 10.3 11.0 8.3 9.0 13.5 14.1 10.0 11.1 10.2 10.3 75 23.5 24.3 25.5 27.2 32.0 32.3 21.9 22.0 17.9 17.3
Percentage of the balance sheet totalTangible fixed assets 25 50.4 47.1 4.4 4.0 55.4 53.4 74.6 73.2 81.2 81.8
50 85.7 85.1 32.6 30.3 86.0 84.7 87.1 87.3 89.3 89.4 75 92.8 92.6 86.1 83.9 95.7 95.1 92.5 92.6 92.7 92.7
Inventories 25 0.0 0.0 0.0 0.0 0.0 0.0 0.0 0.0 2.6 2.5 50 1.0 0.9 0.0 0.0 0.0 0.0 3.1 3.3 3.8 3.8 75 4.5 4.5 0.1 0.1 3.4 3.1 5.0 5.0 4.8 4.9
Equity 25 12.5 14.0 5.3 8.7 4.5 6.3 16.6 17.4 25.6 26.1 50 34.5 36.3 30.1 33.9 22.4 26.0 39.3 39.8 38.0 38.6 75 56.4 58.1 62.0 67.7 53.8 55.1 58.1 58.6 52.3 53.2
Short-term liabilities 25 6.8 6.7 7.1 6.4 4.8 5.0 6.6 6.8 7.6 7.5 50 10.5 10.6 20.6 20.0 11.2 11.1 9.4 9.6 9.5 9.5 75 32.4 30.2 55.2 53.9 48.0 44.3 19.0 18.5 13.8 13.7
Liabilities to banks 25 4.7 4.0 0.0 0.0 10.9 9.0 16.2 16.3 27.2 26.3 50 37.5 36.2 0.0 0.0 42.3 40.0 39.4 37.8 44.5 43.6 75 58.5 57.3 47.0 42.9 67.0 64.5 58.6 57.1 56.9 56.7
Percentage of salesAnnual result before taxes on income 25 3.2 3.2 0.7 1.6 1.6 2.0 3.8 3.3 5.5 5.8
50 11.5 12.4 10.2 12.0 15.2 15.6 11.0 12.2 11.2 11.3 75 27.5 28.6 31.7 34.2 37.4 38.6 24.6 26.0 19.0 19.0
Annual result and depreciation 25 16.3 17.3 4.7 5.7 16.3 17.3 20.8 21.0 23.0 23.1 50 30.0 30.6 19.5 21.4 38.8 38.6 30.3 32.0 29.4 29.8 75 48.5 51.2 48.6 50.7 63.8 64.5 46.3 50.2 37.7 37.3
Trade receivables 25 0.0 0.0 0.0 0.0 0.0 0.0 0.2 0.2 0.3 0.3 50 0.7 0.7 1.0 0.9 0.5 0.5 0.7 0.7 0.7 0.7 75 2.7 2.7 7.2 8.0 3.1 3.3 2.1 1.9 1.5 1.4
Percentage of the balance sheet totalAnnual result and interest paid 25 1.9 1.9 1.5 2.1 1.9 1.8 1.8 1.6 2.0 2.0
50 3.3 3.3 6.1 6.5 3.8 3.9 3.0 2.9 2.8 2.8 75 6.2 6.3 14.0 16.1 6.9 6.7 4.7 4.6 3.8 3.7
Percentage of liabilities and provisions less cashAnnual result and depreciation 25 3.6 3.9 - 5.1 - 4.4 2.9 3.2 4.4 4.7 5.2 5.1
50 7.9 8.2 8.3 10.6 7.5 7.8 8.6 8.7 7.5 7.6 75 16.3 17.7 32.0 34.8 17.5 18.8 15.2 16.2 11.5 11.7
Percentage of fixed assetsLong-term equity and liabilities 25 87.4 89.1 75.3 83.1 72.7 79.6 92.7 92.0 94.0 94.4
50 99.7 99.7 107.7 112.7 99.6 100.3 100.2 99.6 98.6 98.4 75 113.7 116.5 302.6 363.5 117.6 122.1 109.3 108.6 102.8 102.7
Percentage of short-term liabilitiesCash resources and short-term receivables 25 24.2 26.4 36.9 45.1 14.4 19.3 27.0 27.3 22.9 25.3
50 69.3 71.8 136.8 147.7 68.7 81.3 69.1 66.3 49.2 48.5 75 203.3 216.7 442.9 492.1 275.9 289.4 163.2 161.9 89.8 92.6
Percentage of cost of materialsTrade payables 25 5.2 4.7 1.0 1.5 2.0 2.5 6.2 5.2 7.5 7.3
50 10.9 10.3 10.6 9.9 7.8 7.9 10.7 10.1 12.8 12.0 75 21.1 20.5 38.9 40.0 19.1 21.5 17.9 16.4 20.7 20.4
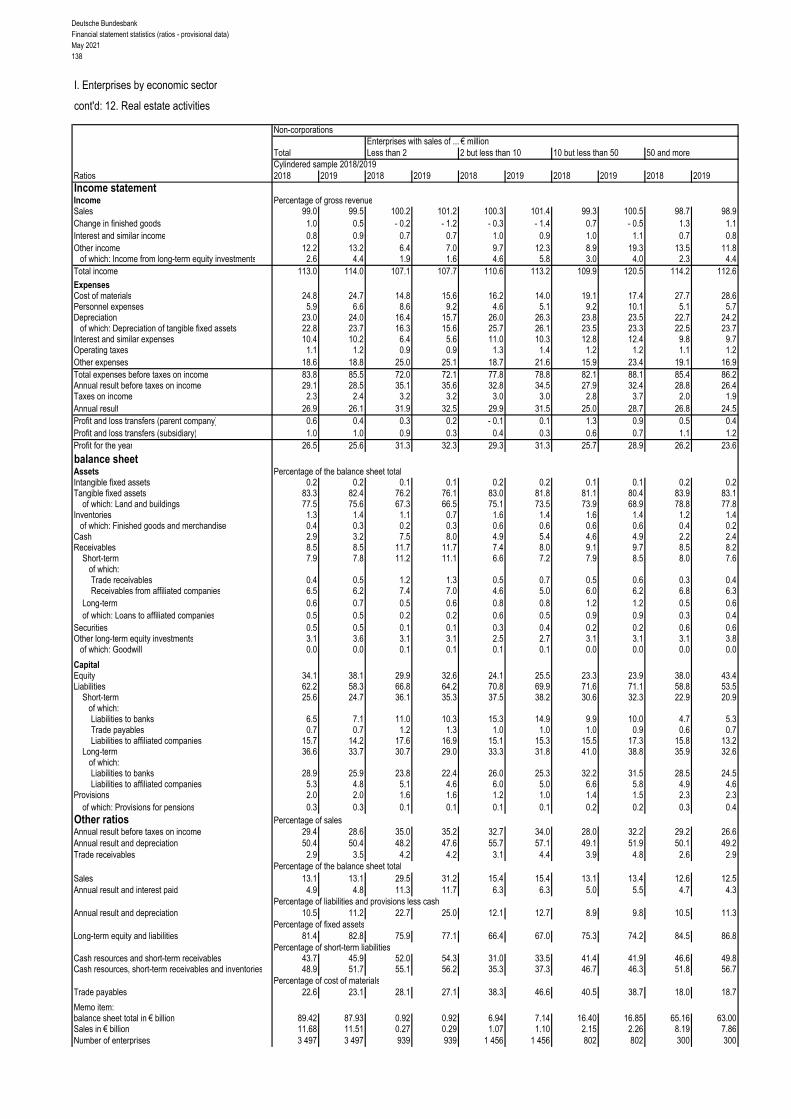
Deutsche BundesbankFinancial statement statistics (ratios - provisional data)May 2021138
I. Enterprises by economic sector
cont'd: 12. Real estate activities
Non-corporationsEnterprises with sales of ... € million
Total Less than 2 2 but less than 10 10 but less than 50 50 and moreCylindered sample 2018/2019
Ratios 2018 2019 2018 2019 2018 2019 2018 2019 2018 2019Income statementIncome Percentage of gross revenueSales 99.0 99.5 100.2 101.2 100.3 101.4 99.3 100.5 98.7 98.9Change in finished goods 1.0 0.5 - 0.2 - 1.2 - 0.3 - 1.4 0.7 - 0.5 1.3 1.1Interest and similar income 0.8 0.9 0.7 0.7 1.0 0.9 1.0 1.1 0.7 0.8Other income 12.2 13.2 6.4 7.0 9.7 12.3 8.9 19.3 13.5 11.8
of which: Income from long-term equity investments 2.6 4.4 1.9 1.6 4.6 5.8 3.0 4.0 2.3 4.4Total income 113.0 114.0 107.1 107.7 110.6 113.2 109.9 120.5 114.2 112.6
ExpensesCost of materials 24.8 24.7 14.8 15.6 16.2 14.0 19.1 17.4 27.7 28.6Personnel expenses 5.9 6.6 8.6 9.2 4.6 5.1 9.2 10.1 5.1 5.7Depreciation 23.0 24.0 16.4 15.7 26.0 26.3 23.8 23.5 22.7 24.2
of which: Depreciation of tangible fixed assets 22.8 23.7 16.3 15.6 25.7 26.1 23.5 23.3 22.5 23.7Interest and similar expenses 10.4 10.2 6.4 5.6 11.0 10.3 12.8 12.4 9.8 9.7Operating taxes 1.1 1.2 0.9 0.9 1.3 1.4 1.2 1.2 1.1 1.2Other expenses 18.6 18.8 25.0 25.1 18.7 21.6 15.9 23.4 19.1 16.9Total expenses before taxes on income 83.8 85.5 72.0 72.1 77.8 78.8 82.1 88.1 85.4 86.2Annual result before taxes on income 29.1 28.5 35.1 35.6 32.8 34.5 27.9 32.4 28.8 26.4Taxes on income 2.3 2.4 3.2 3.2 3.0 3.0 2.8 3.7 2.0 1.9Annual result 26.9 26.1 31.9 32.5 29.9 31.5 25.0 28.7 26.8 24.5Profit and loss transfers (parent company) 0.6 0.4 0.3 0.2 - 0.1 0.1 1.3 0.9 0.5 0.4Profit and loss transfers (subsidiary) 1.0 1.0 0.9 0.3 0.4 0.3 0.6 0.7 1.1 1.2Profit for the year 26.5 25.6 31.3 32.3 29.3 31.3 25.7 28.9 26.2 23.6
balance sheetAssets Percentage of the balance sheet totalIntangible fixed assets 0.2 0.2 0.1 0.1 0.2 0.2 0.1 0.1 0.2 0.2Tangible fixed assets 83.3 82.4 76.2 76.1 83.0 81.8 81.1 80.4 83.9 83.1
of which: Land and buildings 77.5 75.6 67.3 66.5 75.1 73.5 73.9 68.9 78.8 77.8Inventories 1.3 1.4 1.1 0.7 1.6 1.4 1.6 1.4 1.2 1.4
of which: Finished goods and merchandise 0.4 0.3 0.2 0.3 0.6 0.6 0.6 0.6 0.4 0.2Cash 2.9 3.2 7.5 8.0 4.9 5.4 4.6 4.9 2.2 2.4Receivables 8.5 8.5 11.7 11.7 7.4 8.0 9.1 9.7 8.5 8.2
Short-term 7.9 7.8 11.2 11.1 6.6 7.2 7.9 8.5 8.0 7.6 of which:
Trade receivables 0.4 0.5 1.2 1.3 0.5 0.7 0.5 0.6 0.3 0.4Receivables from affiliated companies 6.5 6.2 7.4 7.0 4.6 5.0 6.0 6.2 6.8 6.3
Long-term 0.6 0.7 0.5 0.6 0.8 0.8 1.2 1.2 0.5 0.6of which: Loans to affiliated companies 0.5 0.5 0.2 0.2 0.6 0.5 0.9 0.9 0.3 0.4
Securities 0.5 0.5 0.1 0.1 0.3 0.4 0.2 0.2 0.6 0.6Other long-term equity investments 3.1 3.6 3.1 3.1 2.5 2.7 3.1 3.1 3.1 3.8
of which: Goodwill 0.0 0.0 0.1 0.1 0.1 0.1 0.0 0.0 0.0 0.0
CapitalEquity 34.1 38.1 29.9 32.6 24.1 25.5 23.3 23.9 38.0 43.4Liabilities 62.2 58.3 66.8 64.2 70.8 69.9 71.6 71.1 58.8 53.5
Short-term 25.6 24.7 36.1 35.3 37.5 38.2 30.6 32.3 22.9 20.9of which:Liabilities to banks 6.5 7.1 11.0 10.3 15.3 14.9 9.9 10.0 4.7 5.3Trade payables 0.7 0.7 1.2 1.3 1.0 1.0 1.0 0.9 0.6 0.7Liabilities to affiliated companies 15.7 14.2 17.6 16.9 15.1 15.3 15.5 17.3 15.8 13.2
Long-term 36.6 33.7 30.7 29.0 33.3 31.8 41.0 38.8 35.9 32.6 of which:
Liabilities to banks 28.9 25.9 23.8 22.4 26.0 25.3 32.2 31.5 28.5 24.5Liabilities to affiliated companies 5.3 4.8 5.1 4.6 6.0 5.0 6.6 5.8 4.9 4.6
Provisions 2.0 2.0 1.6 1.6 1.2 1.0 1.4 1.5 2.3 2.3of which: Provisions for pensions 0.3 0.3 0.1 0.1 0.1 0.1 0.2 0.2 0.3 0.4
Other ratios Percentage of salesAnnual result before taxes on income 29.4 28.6 35.0 35.2 32.7 34.0 28.0 32.2 29.2 26.6Annual result and depreciation 50.4 50.4 48.2 47.6 55.7 57.1 49.1 51.9 50.1 49.2Trade receivables 2.9 3.5 4.2 4.2 3.1 4.4 3.9 4.8 2.6 2.9
Percentage of the balance sheet totalSales 13.1 13.1 29.5 31.2 15.4 15.4 13.1 13.4 12.6 12.5Annual result and interest paid 4.9 4.8 11.3 11.7 6.3 6.3 5.0 5.5 4.7 4.3
Percentage of liabilities and provisions less cashAnnual result and depreciation 10.5 11.2 22.7 25.0 12.1 12.7 8.9 9.8 10.5 11.3
Percentage of fixed assetsLong-term equity and liabilities 81.4 82.8 75.9 77.1 66.4 67.0 75.3 74.2 84.5 86.8
Percentage of short-term liabilitiesCash resources and short-term receivables 43.7 45.9 52.0 54.3 31.0 33.5 41.4 41.9 46.6 49.8Cash resources, short-term receivables and inventories 48.9 51.7 55.1 56.2 35.3 37.3 46.7 46.3 51.8 56.7
Percentage of cost of materialsTrade payables 22.6 23.1 28.1 27.1 38.3 46.6 40.5 38.7 18.0 18.7
Memo item:balance sheet total in € billion 89.42 87.93 0.92 0.92 6.94 7.14 16.40 16.85 65.16 63.00Sales in € billion 11.68 11.51 0.27 0.29 1.07 1.10 2.15 2.26 8.19 7.86Number of enterprises 3 497 3 497 939 939 1 456 1 456 802 802 300 300
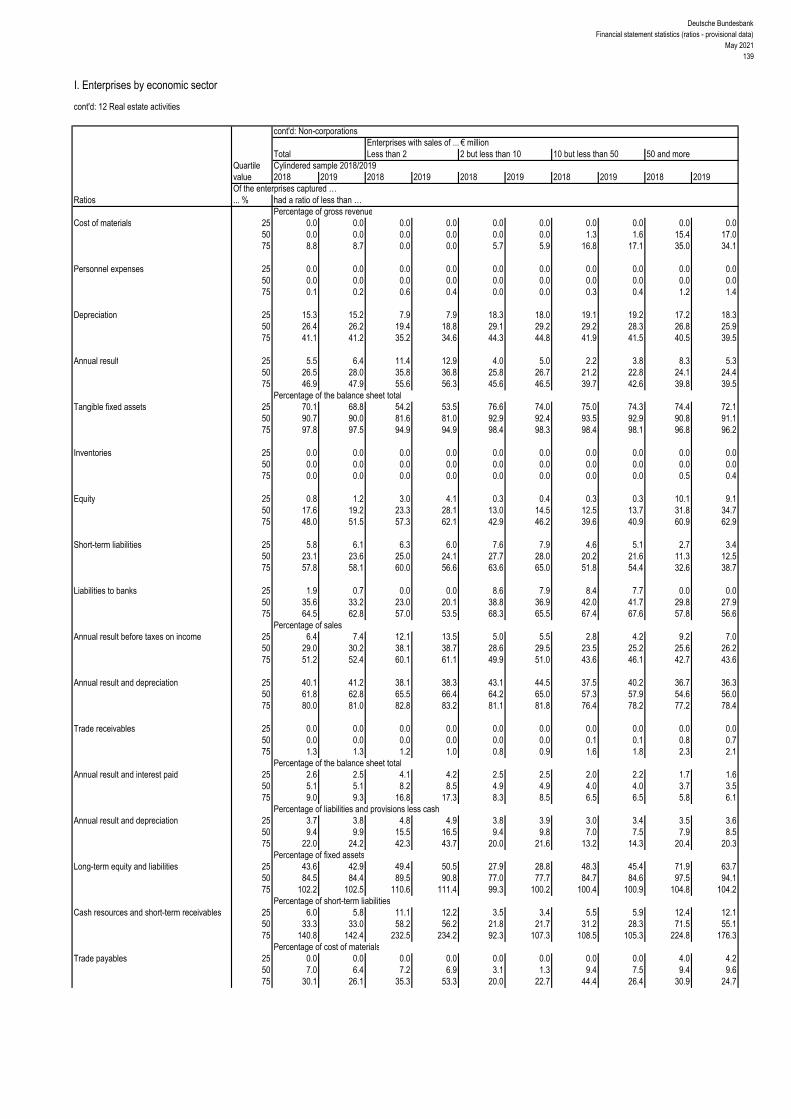
Deutsche BundesbankFinancial statement statistics (ratios - provisional data)
May 2021139
I. Enterprises by economic sector
cont'd: 12 Real estate activities
cont'd: Non-corporationsEnterprises with sales of ... € million
Total Less than 2 2 but less than 10 10 but less than 50 50 and moreQuartile Cylindered sample 2018/2019value 2018 2019 2018 2019 2018 2019 2018 2019 2018 2019Of the enterprises captured …
Ratios ... % had a ratio of less than …Percentage of gross revenue
Cost of materials 25 0.0 0.0 0.0 0.0 0.0 0.0 0.0 0.0 0.0 0.0 50 0.0 0.0 0.0 0.0 0.0 0.0 1.3 1.6 15.4 17.0 75 8.8 8.7 0.0 0.0 5.7 5.9 16.8 17.1 35.0 34.1
Personnel expenses 25 0.0 0.0 0.0 0.0 0.0 0.0 0.0 0.0 0.0 0.0 50 0.0 0.0 0.0 0.0 0.0 0.0 0.0 0.0 0.0 0.0 75 0.1 0.2 0.6 0.4 0.0 0.0 0.3 0.4 1.2 1.4
Depreciation 25 15.3 15.2 7.9 7.9 18.3 18.0 19.1 19.2 17.2 18.3 50 26.4 26.2 19.4 18.8 29.1 29.2 29.2 28.3 26.8 25.9 75 41.1 41.2 35.2 34.6 44.3 44.8 41.9 41.5 40.5 39.5
Annual result 25 5.5 6.4 11.4 12.9 4.0 5.0 2.2 3.8 8.3 5.3 50 26.5 28.0 35.8 36.8 25.8 26.7 21.2 22.8 24.1 24.4 75 46.9 47.9 55.6 56.3 45.6 46.5 39.7 42.6 39.8 39.5
Percentage of the balance sheet totalTangible fixed assets 25 70.1 68.8 54.2 53.5 76.6 74.0 75.0 74.3 74.4 72.1
50 90.7 90.0 81.6 81.0 92.9 92.4 93.5 92.9 90.8 91.1 75 97.8 97.5 94.9 94.9 98.4 98.3 98.4 98.1 96.8 96.2
Inventories 25 0.0 0.0 0.0 0.0 0.0 0.0 0.0 0.0 0.0 0.0 50 0.0 0.0 0.0 0.0 0.0 0.0 0.0 0.0 0.0 0.0 75 0.0 0.0 0.0 0.0 0.0 0.0 0.0 0.0 0.5 0.4
Equity 25 0.8 1.2 3.0 4.1 0.3 0.4 0.3 0.3 10.1 9.1 50 17.6 19.2 23.3 28.1 13.0 14.5 12.5 13.7 31.8 34.7 75 48.0 51.5 57.3 62.1 42.9 46.2 39.6 40.9 60.9 62.9
Short-term liabilities 25 5.8 6.1 6.3 6.0 7.6 7.9 4.6 5.1 2.7 3.4 50 23.1 23.6 25.0 24.1 27.7 28.0 20.2 21.6 11.3 12.5 75 57.8 58.1 60.0 56.6 63.6 65.0 51.8 54.4 32.6 38.7
Liabilities to banks 25 1.9 0.7 0.0 0.0 8.6 7.9 8.4 7.7 0.0 0.0 50 35.6 33.2 23.0 20.1 38.8 36.9 42.0 41.7 29.8 27.9 75 64.5 62.8 57.0 53.5 68.3 65.5 67.4 67.6 57.8 56.6
Percentage of salesAnnual result before taxes on income 25 6.4 7.4 12.1 13.5 5.0 5.5 2.8 4.2 9.2 7.0
50 29.0 30.2 38.1 38.7 28.6 29.5 23.5 25.2 25.6 26.2 75 51.2 52.4 60.1 61.1 49.9 51.0 43.6 46.1 42.7 43.6
Annual result and depreciation 25 40.1 41.2 38.1 38.3 43.1 44.5 37.5 40.2 36.7 36.3 50 61.8 62.8 65.5 66.4 64.2 65.0 57.3 57.9 54.6 56.0 75 80.0 81.0 82.8 83.2 81.1 81.8 76.4 78.2 77.2 78.4
Trade receivables 25 0.0 0.0 0.0 0.0 0.0 0.0 0.0 0.0 0.0 0.0 50 0.0 0.0 0.0 0.0 0.0 0.0 0.1 0.1 0.8 0.7 75 1.3 1.3 1.2 1.0 0.8 0.9 1.6 1.8 2.3 2.1
Percentage of the balance sheet totalAnnual result and interest paid 25 2.6 2.5 4.1 4.2 2.5 2.5 2.0 2.2 1.7 1.6
50 5.1 5.1 8.2 8.5 4.9 4.9 4.0 4.0 3.7 3.5 75 9.0 9.3 16.8 17.3 8.3 8.5 6.5 6.5 5.8 6.1
Percentage of liabilities and provisions less cashAnnual result and depreciation 25 3.7 3.8 4.8 4.9 3.8 3.9 3.0 3.4 3.5 3.6
50 9.4 9.9 15.5 16.5 9.4 9.8 7.0 7.5 7.9 8.5 75 22.0 24.2 42.3 43.7 20.0 21.6 13.2 14.3 20.4 20.3
Percentage of fixed assetsLong-term equity and liabilities 25 43.6 42.9 49.4 50.5 27.9 28.8 48.3 45.4 71.9 63.7
50 84.5 84.4 89.5 90.8 77.0 77.7 84.7 84.6 97.5 94.1 75 102.2 102.5 110.6 111.4 99.3 100.2 100.4 100.9 104.8 104.2
Percentage of short-term liabilitiesCash resources and short-term receivables 25 6.0 5.8 11.1 12.2 3.5 3.4 5.5 5.9 12.4 12.1
50 33.3 33.0 58.2 56.2 21.8 21.7 31.2 28.3 71.5 55.1 75 140.8 142.4 232.5 234.2 92.3 107.3 108.5 105.3 224.8 176.3
Percentage of cost of materialsTrade payables 25 0.0 0.0 0.0 0.0 0.0 0.0 0.0 0.0 4.0 4.2
50 7.0 6.4 7.2 6.9 3.1 1.3 9.4 7.5 9.4 9.6 75 30.1 26.1 35.3 53.3 20.0 22.7 44.4 26.4 30.9 24.7
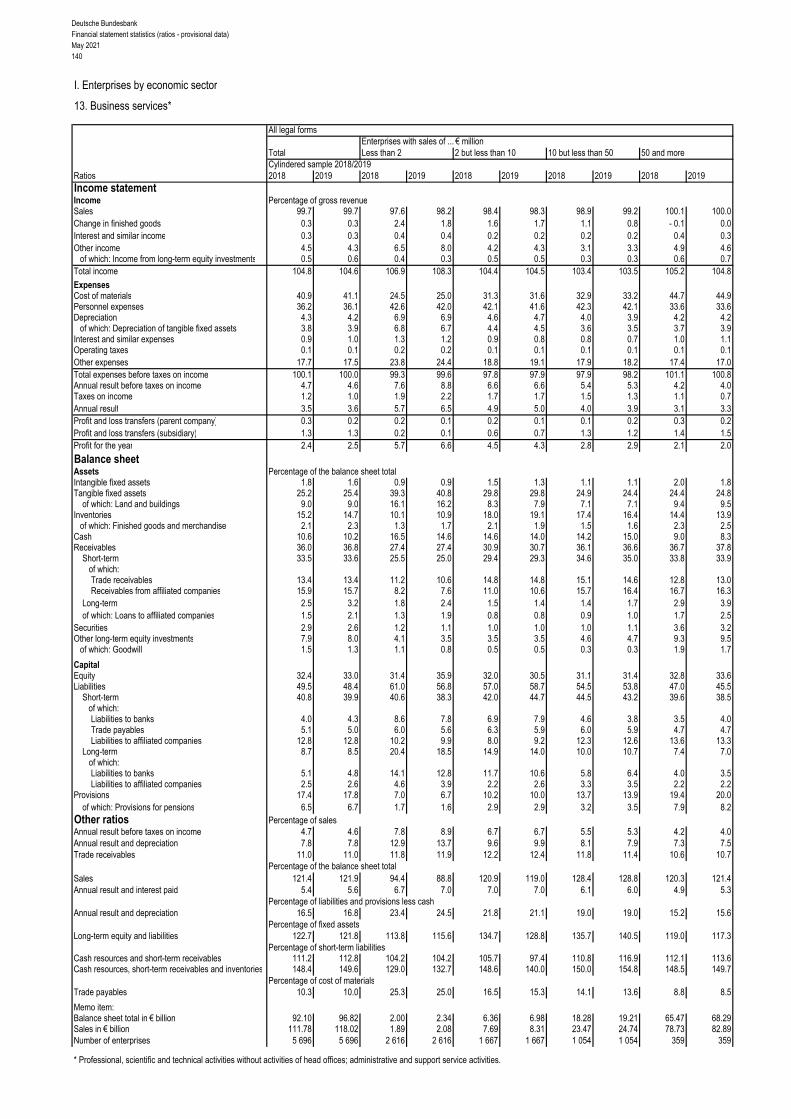
Deutsche BundesbankFinancial statement statistics (ratios - provisional data)May 2021140
I. Enterprises by economic sector
13. Business services*
All legal formsEnterprises with sales of ... € million
Total Less than 2 2 but less than 10 10 but less than 50 50 and moreCylindered sample 2018/2019
Ratios 2018 2019 2018 2019 2018 2019 2018 2019 2018 2019Income statementIncome Percentage of gross revenueSales 99.7 99.7 97.6 98.2 98.4 98.3 98.9 99.2 100.1 100.0Change in finished goods 0.3 0.3 2.4 1.8 1.6 1.7 1.1 0.8 - 0.1 0.0Interest and similar income 0.3 0.3 0.4 0.4 0.2 0.2 0.2 0.2 0.4 0.3Other income 4.5 4.3 6.5 8.0 4.2 4.3 3.1 3.3 4.9 4.6
of which: Income from long-term equity investments 0.5 0.6 0.4 0.3 0.5 0.5 0.3 0.3 0.6 0.7Total income 104.8 104.6 106.9 108.3 104.4 104.5 103.4 103.5 105.2 104.8
ExpensesCost of materials 40.9 41.1 24.5 25.0 31.3 31.6 32.9 33.2 44.7 44.9Personnel expenses 36.2 36.1 42.6 42.0 42.1 41.6 42.3 42.1 33.6 33.6Depreciation 4.3 4.2 6.9 6.9 4.6 4.7 4.0 3.9 4.2 4.2
of which: Depreciation of tangible fixed assets 3.8 3.9 6.8 6.7 4.4 4.5 3.6 3.5 3.7 3.9Interest and similar expenses 0.9 1.0 1.3 1.2 0.9 0.8 0.8 0.7 1.0 1.1Operating taxes 0.1 0.1 0.2 0.2 0.1 0.1 0.1 0.1 0.1 0.1Other expenses 17.7 17.5 23.8 24.4 18.8 19.1 17.9 18.2 17.4 17.0Total expenses before taxes on income 100.1 100.0 99.3 99.6 97.8 97.9 97.9 98.2 101.1 100.8Annual result before taxes on income 4.7 4.6 7.6 8.8 6.6 6.6 5.4 5.3 4.2 4.0Taxes on income 1.2 1.0 1.9 2.2 1.7 1.7 1.5 1.3 1.1 0.7Annual result 3.5 3.6 5.7 6.5 4.9 5.0 4.0 3.9 3.1 3.3Profit and loss transfers (parent company) 0.3 0.2 0.2 0.1 0.2 0.1 0.1 0.2 0.3 0.2Profit and loss transfers (subsidiary) 1.3 1.3 0.2 0.1 0.6 0.7 1.3 1.2 1.4 1.5Profit for the year 2.4 2.5 5.7 6.6 4.5 4.3 2.8 2.9 2.1 2.0
Balance sheetAssets Percentage of the balance sheet totalIntangible fixed assets 1.8 1.6 0.9 0.9 1.5 1.3 1.1 1.1 2.0 1.8Tangible fixed assets 25.2 25.4 39.3 40.8 29.8 29.8 24.9 24.4 24.4 24.8
of which: Land and buildings 9.0 9.0 16.1 16.2 8.3 7.9 7.1 7.1 9.4 9.5Inventories 15.2 14.7 10.1 10.9 18.0 19.1 17.4 16.4 14.4 13.9
of which: Finished goods and merchandise 2.1 2.3 1.3 1.7 2.1 1.9 1.5 1.6 2.3 2.5Cash 10.6 10.2 16.5 14.6 14.6 14.0 14.2 15.0 9.0 8.3Receivables 36.0 36.8 27.4 27.4 30.9 30.7 36.1 36.6 36.7 37.8
Short-term 33.5 33.6 25.5 25.0 29.4 29.3 34.6 35.0 33.8 33.9 of which:
Trade receivables 13.4 13.4 11.2 10.6 14.8 14.8 15.1 14.6 12.8 13.0Receivables from affiliated companies 15.9 15.7 8.2 7.6 11.0 10.6 15.7 16.4 16.7 16.3
Long-term 2.5 3.2 1.8 2.4 1.5 1.4 1.4 1.7 2.9 3.9of which: Loans to affiliated companies 1.5 2.1 1.3 1.9 0.8 0.8 0.9 1.0 1.7 2.5
Securities 2.9 2.6 1.2 1.1 1.0 1.0 1.0 1.1 3.6 3.2Other long-term equity investments 7.9 8.0 4.1 3.5 3.5 3.5 4.6 4.7 9.3 9.5
of which: Goodwill 1.5 1.3 1.1 0.8 0.5 0.5 0.3 0.3 1.9 1.7
CapitalEquity 32.4 33.0 31.4 35.9 32.0 30.5 31.1 31.4 32.8 33.6Liabilities 49.5 48.4 61.0 56.8 57.0 58.7 54.5 53.8 47.0 45.5
Short-term 40.8 39.9 40.6 38.3 42.0 44.7 44.5 43.2 39.6 38.5of which:Liabilities to banks 4.0 4.3 8.6 7.8 6.9 7.9 4.6 3.8 3.5 4.0Trade payables 5.1 5.0 6.0 5.6 6.3 5.9 6.0 5.9 4.7 4.7Liabilities to affiliated companies 12.8 12.8 10.2 9.9 8.0 9.2 12.3 12.6 13.6 13.3
Long-term 8.7 8.5 20.4 18.5 14.9 14.0 10.0 10.7 7.4 7.0 of which:
Liabilities to banks 5.1 4.8 14.1 12.8 11.7 10.6 5.8 6.4 4.0 3.5Liabilities to affiliated companies 2.5 2.6 4.6 3.9 2.2 2.6 3.3 3.5 2.2 2.2
Provisions 17.4 17.8 7.0 6.7 10.2 10.0 13.7 13.9 19.4 20.0of which: Provisions for pensions 6.5 6.7 1.7 1.6 2.9 2.9 3.2 3.5 7.9 8.2
Other ratios Percentage of salesAnnual result before taxes on income 4.7 4.6 7.8 8.9 6.7 6.7 5.5 5.3 4.2 4.0Annual result and depreciation 7.8 7.8 12.9 13.7 9.6 9.9 8.1 7.9 7.3 7.5Trade receivables 11.0 11.0 11.8 11.9 12.2 12.4 11.8 11.4 10.6 10.7
Percentage of the balance sheet totalSales 121.4 121.9 94.4 88.8 120.9 119.0 128.4 128.8 120.3 121.4Annual result and interest paid 5.4 5.6 6.7 7.0 7.0 7.0 6.1 6.0 4.9 5.3
Percentage of liabilities and provisions less cashAnnual result and depreciation 16.5 16.8 23.4 24.5 21.8 21.1 19.0 19.0 15.2 15.6
Percentage of fixed assetsLong-term equity and liabilities 122.7 121.8 113.8 115.6 134.7 128.8 135.7 140.5 119.0 117.3
Percentage of short-term liabilitiesCash resources and short-term receivables 111.2 112.8 104.2 104.2 105.7 97.4 110.8 116.9 112.1 113.6Cash resources, short-term receivables and inventories 148.4 149.6 129.0 132.7 148.6 140.0 150.0 154.8 148.5 149.7
Percentage of cost of materialsTrade payables 10.3 10.0 25.3 25.0 16.5 15.3 14.1 13.6 8.8 8.5
Memo item:Balance sheet total in € billion 92.10 96.82 2.00 2.34 6.36 6.98 18.28 19.21 65.47 68.29Sales in € billion 111.78 118.02 1.89 2.08 7.69 8.31 23.47 24.74 78.73 82.89Number of enterprises 5 696 5 696 2 616 2 616 1 667 1 667 1 054 1 054 359 359
* Professional, scientific and technical activities without activities of head offices; administrative and support service activities.
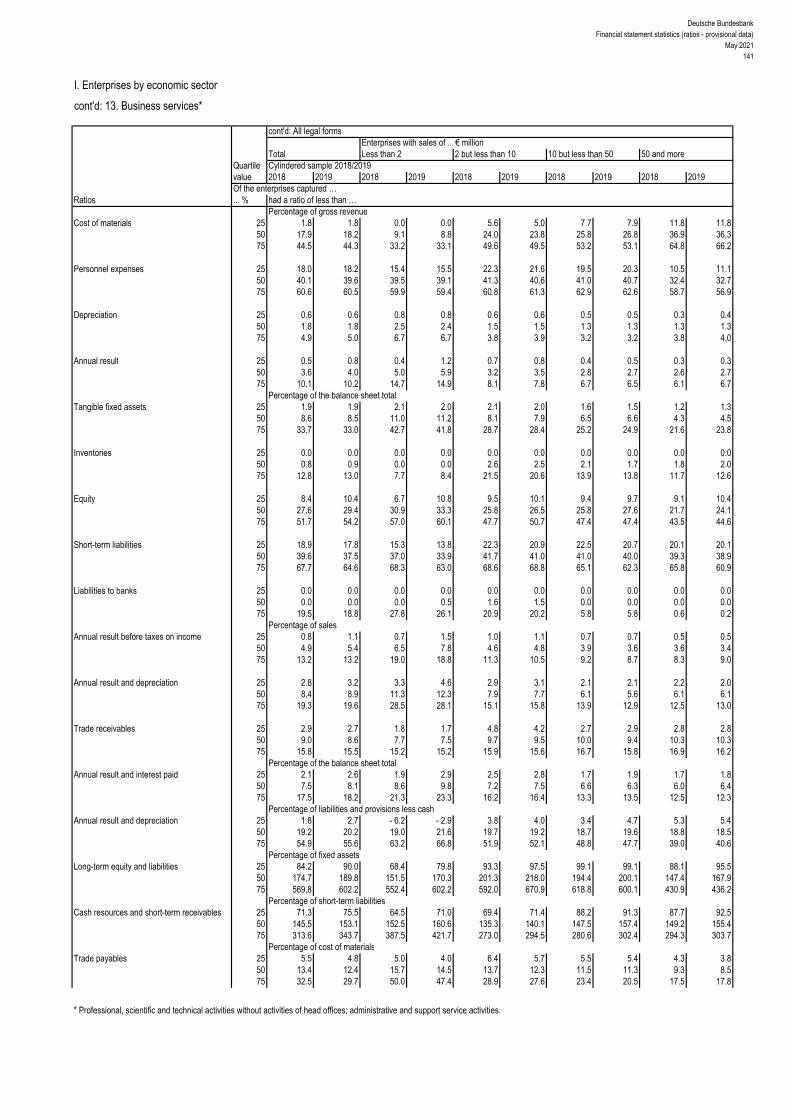
Deutsche BundesbankFinancial statement statistics (ratios - provisional data)
May 2021141
I. Enterprises by economic sector
cont'd: 13. Business services*
cont'd: All legal formsEnterprises with sales of ... € million
Total Less than 2 2 but less than 10 10 but less than 50 50 and moreQuartile Cylindered sample 2018/2019value 2018 2019 2018 2019 2018 2019 2018 2019 2018 2019Of the enterprises captured …
Ratios ... % had a ratio of less than …Percentage of gross revenue
Cost of materials 25 1.8 1.8 0.0 0.0 5.6 5.0 7.7 7.9 11.8 11.8 50 17.9 18.2 9.1 8.8 24.0 23.8 25.8 26.8 36.9 36.3 75 44.5 44.3 33.2 33.1 49.6 49.5 53.2 53.1 64.8 66.2
Personnel expenses 25 18.0 18.2 15.4 15.5 22.3 21.6 19.5 20.3 10.5 11.1 50 40.1 39.6 39.5 39.1 41.3 40.6 41.0 40.7 32.4 32.7 75 60.6 60.5 59.9 59.4 60.8 61.3 62.9 62.6 58.7 56.9
Depreciation 25 0.6 0.6 0.8 0.8 0.6 0.6 0.5 0.5 0.3 0.4 50 1.8 1.8 2.5 2.4 1.5 1.5 1.3 1.3 1.3 1.3 75 4.9 5.0 6.7 6.7 3.8 3.9 3.2 3.2 3.8 4.0
Annual result 25 0.5 0.8 0.4 1.2 0.7 0.8 0.4 0.5 0.3 0.3 50 3.6 4.0 5.0 5.9 3.2 3.5 2.8 2.7 2.6 2.7 75 10.1 10.2 14.7 14.9 8.1 7.8 6.7 6.5 6.1 6.7
Percentage of the balance sheet totalTangible fixed assets 25 1.9 1.9 2.1 2.0 2.1 2.0 1.6 1.5 1.2 1.3
50 8.6 8.5 11.0 11.2 8.1 7.9 6.5 6.6 4.3 4.5 75 33.7 33.0 42.7 41.8 28.7 28.4 25.2 24.9 21.6 23.8
Inventories 25 0.0 0.0 0.0 0.0 0.0 0.0 0.0 0.0 0.0 0.0 50 0.8 0.9 0.0 0.0 2.6 2.5 2.1 1.7 1.8 2.0 75 12.8 13.0 7.7 8.4 21.5 20.6 13.9 13.8 11.7 12.6
Equity 25 8.4 10.4 6.7 10.8 9.5 10.1 9.4 9.7 9.1 10.4 50 27.6 29.4 30.9 33.3 25.8 26.5 25.8 27.6 21.7 24.1 75 51.7 54.2 57.0 60.1 47.7 50.7 47.4 47.4 43.5 44.6
Short-term liabilities 25 18.9 17.8 15.3 13.8 22.3 20.9 22.5 20.7 20.1 20.1 50 39.6 37.5 37.0 33.9 41.7 41.0 41.0 40.0 39.3 38.9 75 67.7 64.6 68.3 63.0 68.6 68.8 65.1 62.3 65.8 60.9
Liabilities to banks 25 0.0 0.0 0.0 0.0 0.0 0.0 0.0 0.0 0.0 0.0 50 0.0 0.0 0.0 0.5 1.6 1.5 0.0 0.0 0.0 0.0 75 19.5 18.8 27.8 26.1 20.9 20.2 5.8 5.8 0.6 0.2
Percentage of salesAnnual result before taxes on income 25 0.8 1.1 0.7 1.5 1.0 1.1 0.7 0.7 0.5 0.5
50 4.9 5.4 6.5 7.8 4.6 4.8 3.9 3.6 3.6 3.4 75 13.2 13.2 19.0 18.8 11.3 10.5 9.2 8.7 8.3 9.0
Annual result and depreciation 25 2.8 3.2 3.3 4.6 2.9 3.1 2.1 2.1 2.2 2.0 50 8.4 8.9 11.3 12.3 7.9 7.7 6.1 5.6 6.1 6.1 75 19.3 19.6 28.5 28.1 15.1 15.8 13.9 12.9 12.5 13.0
Trade receivables 25 2.9 2.7 1.8 1.7 4.8 4.2 2.7 2.9 2.8 2.8 50 9.0 8.6 7.7 7.5 9.7 9.5 10.0 9.4 10.3 10.3 75 15.8 15.5 15.2 15.2 15.9 15.6 16.7 15.8 16.9 16.2
Percentage of the balance sheet totalAnnual result and interest paid 25 2.1 2.6 1.9 2.9 2.5 2.8 1.7 1.9 1.7 1.8
50 7.5 8.1 8.6 9.8 7.2 7.5 6.6 6.3 6.0 6.4 75 17.5 18.2 21.3 23.3 16.2 16.4 13.3 13.5 12.5 12.3
Percentage of liabilities and provisions less cashAnnual result and depreciation 25 1.8 2.7 - 6.2 - 2.9 3.8 4.0 3.4 4.7 5.3 5.4
50 19.2 20.2 19.0 21.6 19.7 19.2 18.7 19.6 18.8 18.5 75 54.9 55.6 63.2 66.8 51.9 52.1 48.8 47.7 39.0 40.6
Percentage of fixed assetsLong-term equity and liabilities 25 84.2 90.0 68.4 79.8 93.3 97.5 99.1 99.1 88.1 95.5
50 174.7 189.8 151.5 170.3 201.3 218.0 194.4 200.1 147.4 167.9 75 569.8 602.2 552.4 602.2 592.0 670.9 618.8 600.1 430.9 436.2
Percentage of short-term liabilitiesCash resources and short-term receivables 25 71.3 75.5 64.5 71.0 69.4 71.4 88.2 91.3 87.7 92.5
50 145.5 153.1 152.5 160.6 135.3 140.1 147.5 157.4 149.2 155.4 75 313.6 343.7 387.5 421.7 273.0 294.5 280.6 302.4 294.3 303.7
Percentage of cost of materialsTrade payables 25 5.5 4.8 5.0 4.0 6.4 5.7 5.5 5.4 4.3 3.8
50 13.4 12.4 15.7 14.5 13.7 12.3 11.5 11.3 9.3 8.5 75 32.5 29.7 50.0 47.4 28.9 27.6 23.4 20.5 17.5 17.8
* Professional, scientific and technical activities without activities of head offices; administrative and support service activities.
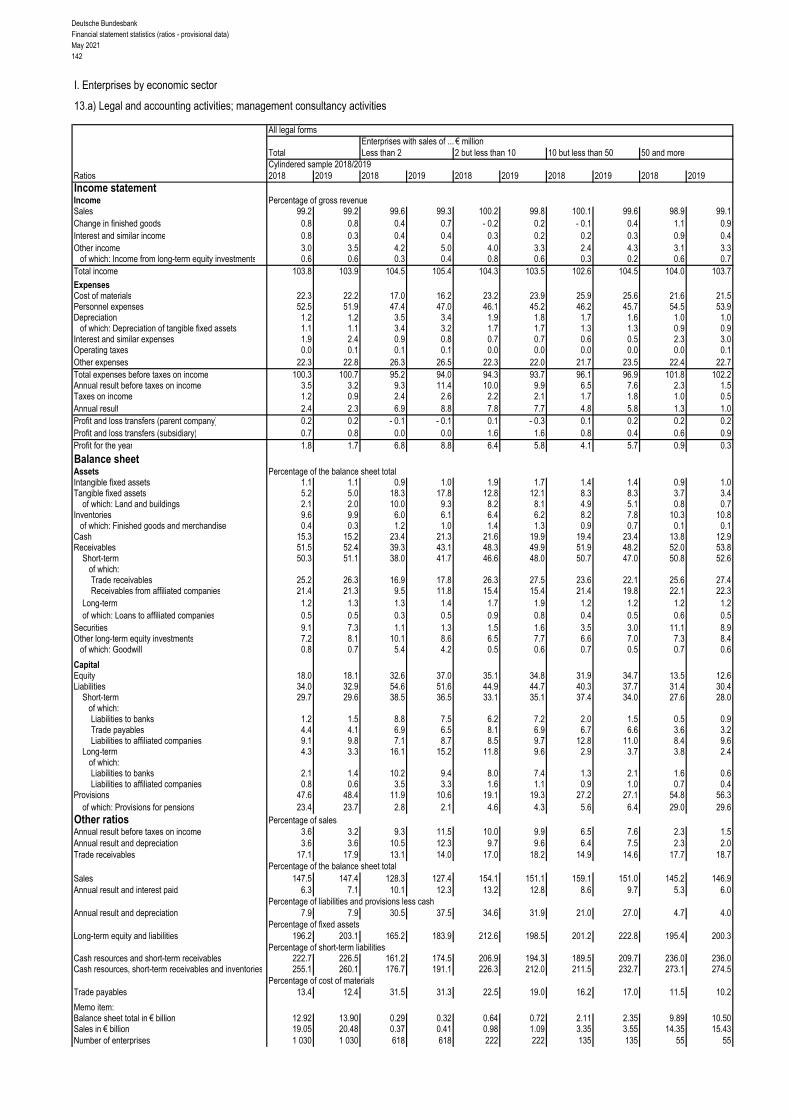
Deutsche BundesbankFinancial statement statistics (ratios - provisional data)May 2021142
I. Enterprises by economic sector
13.a) Legal and accounting activities; management consultancy activities
All legal formsEnterprises with sales of ... € million
Total Less than 2 2 but less than 10 10 but less than 50 50 and moreCylindered sample 2018/2019
Ratios 2018 2019 2018 2019 2018 2019 2018 2019 2018 2019Income statementIncome Percentage of gross revenueSales 99.2 99.2 99.6 99.3 100.2 99.8 100.1 99.6 98.9 99.1Change in finished goods 0.8 0.8 0.4 0.7 - 0.2 0.2 - 0.1 0.4 1.1 0.9Interest and similar income 0.8 0.3 0.4 0.4 0.3 0.2 0.2 0.3 0.9 0.4Other income 3.0 3.5 4.2 5.0 4.0 3.3 2.4 4.3 3.1 3.3
of which: Income from long-term equity investments 0.6 0.6 0.3 0.4 0.8 0.6 0.3 0.2 0.6 0.7Total income 103.8 103.9 104.5 105.4 104.3 103.5 102.6 104.5 104.0 103.7
ExpensesCost of materials 22.3 22.2 17.0 16.2 23.2 23.9 25.9 25.6 21.6 21.5Personnel expenses 52.5 51.9 47.4 47.0 46.1 45.2 46.2 45.7 54.5 53.9Depreciation 1.2 1.2 3.5 3.4 1.9 1.8 1.7 1.6 1.0 1.0
of which: Depreciation of tangible fixed assets 1.1 1.1 3.4 3.2 1.7 1.7 1.3 1.3 0.9 0.9Interest and similar expenses 1.9 2.4 0.9 0.8 0.7 0.7 0.6 0.5 2.3 3.0Operating taxes 0.0 0.1 0.1 0.1 0.0 0.0 0.0 0.0 0.0 0.1Other expenses 22.3 22.8 26.3 26.5 22.3 22.0 21.7 23.5 22.4 22.7Total expenses before taxes on income 100.3 100.7 95.2 94.0 94.3 93.7 96.1 96.9 101.8 102.2Annual result before taxes on income 3.5 3.2 9.3 11.4 10.0 9.9 6.5 7.6 2.3 1.5Taxes on income 1.2 0.9 2.4 2.6 2.2 2.1 1.7 1.8 1.0 0.5Annual result 2.4 2.3 6.9 8.8 7.8 7.7 4.8 5.8 1.3 1.0Profit and loss transfers (parent company) 0.2 0.2 - 0.1 - 0.1 0.1 - 0.3 0.1 0.2 0.2 0.2Profit and loss transfers (subsidiary) 0.7 0.8 0.0 0.0 1.6 1.6 0.8 0.4 0.6 0.9Profit for the year 1.8 1.7 6.8 8.8 6.4 5.8 4.1 5.7 0.9 0.3
Balance sheetAssets Percentage of the balance sheet totalIntangible fixed assets 1.1 1.1 0.9 1.0 1.9 1.7 1.4 1.4 0.9 1.0Tangible fixed assets 5.2 5.0 18.3 17.8 12.8 12.1 8.3 8.3 3.7 3.4
of which: Land and buildings 2.1 2.0 10.0 9.3 8.2 8.1 4.9 5.1 0.8 0.7Inventories 9.6 9.9 6.0 6.1 6.4 6.2 8.2 7.8 10.3 10.8
of which: Finished goods and merchandise 0.4 0.3 1.2 1.0 1.4 1.3 0.9 0.7 0.1 0.1Cash 15.3 15.2 23.4 21.3 21.6 19.9 19.4 23.4 13.8 12.9Receivables 51.5 52.4 39.3 43.1 48.3 49.9 51.9 48.2 52.0 53.8
Short-term 50.3 51.1 38.0 41.7 46.6 48.0 50.7 47.0 50.8 52.6 of which:
Trade receivables 25.2 26.3 16.9 17.8 26.3 27.5 23.6 22.1 25.6 27.4Receivables from affiliated companies 21.4 21.3 9.5 11.8 15.4 15.4 21.4 19.8 22.1 22.3
Long-term 1.2 1.3 1.3 1.4 1.7 1.9 1.2 1.2 1.2 1.2of which: Loans to affiliated companies 0.5 0.5 0.3 0.5 0.9 0.8 0.4 0.5 0.6 0.5
Securities 9.1 7.3 1.1 1.3 1.5 1.6 3.5 3.0 11.1 8.9Other long-term equity investments 7.2 8.1 10.1 8.6 6.5 7.7 6.6 7.0 7.3 8.4
of which: Goodwill 0.8 0.7 5.4 4.2 0.5 0.6 0.7 0.5 0.7 0.6
CapitalEquity 18.0 18.1 32.6 37.0 35.1 34.8 31.9 34.7 13.5 12.6Liabilities 34.0 32.9 54.6 51.6 44.9 44.7 40.3 37.7 31.4 30.4
Short-term 29.7 29.6 38.5 36.5 33.1 35.1 37.4 34.0 27.6 28.0of which:Liabilities to banks 1.2 1.5 8.8 7.5 6.2 7.2 2.0 1.5 0.5 0.9Trade payables 4.4 4.1 6.9 6.5 8.1 6.9 6.7 6.6 3.6 3.2Liabilities to affiliated companies 9.1 9.8 7.1 8.7 8.5 9.7 12.8 11.0 8.4 9.6
Long-term 4.3 3.3 16.1 15.2 11.8 9.6 2.9 3.7 3.8 2.4 of which:
Liabilities to banks 2.1 1.4 10.2 9.4 8.0 7.4 1.3 2.1 1.6 0.6Liabilities to affiliated companies 0.8 0.6 3.5 3.3 1.6 1.1 0.9 1.0 0.7 0.4
Provisions 47.6 48.4 11.9 10.6 19.1 19.3 27.2 27.1 54.8 56.3of which: Provisions for pensions 23.4 23.7 2.8 2.1 4.6 4.3 5.6 6.4 29.0 29.6
Other ratios Percentage of salesAnnual result before taxes on income 3.6 3.2 9.3 11.5 10.0 9.9 6.5 7.6 2.3 1.5Annual result and depreciation 3.6 3.6 10.5 12.3 9.7 9.6 6.4 7.5 2.3 2.0Trade receivables 17.1 17.9 13.1 14.0 17.0 18.2 14.9 14.6 17.7 18.7
Percentage of the balance sheet totalSales 147.5 147.4 128.3 127.4 154.1 151.1 159.1 151.0 145.2 146.9Annual result and interest paid 6.3 7.1 10.1 12.3 13.2 12.8 8.6 9.7 5.3 6.0
Percentage of liabilities and provisions less cashAnnual result and depreciation 7.9 7.9 30.5 37.5 34.6 31.9 21.0 27.0 4.7 4.0
Percentage of fixed assetsLong-term equity and liabilities 196.2 203.1 165.2 183.9 212.6 198.5 201.2 222.8 195.4 200.3
Percentage of short-term liabilitiesCash resources and short-term receivables 222.7 226.5 161.2 174.5 206.9 194.3 189.5 209.7 236.0 236.0Cash resources, short-term receivables and inventories 255.1 260.1 176.7 191.1 226.3 212.0 211.5 232.7 273.1 274.5
Percentage of cost of materialsTrade payables 13.4 12.4 31.5 31.3 22.5 19.0 16.2 17.0 11.5 10.2
Memo item:Balance sheet total in € billion 12.92 13.90 0.29 0.32 0.64 0.72 2.11 2.35 9.89 10.50Sales in € billion 19.05 20.48 0.37 0.41 0.98 1.09 3.35 3.55 14.35 15.43Number of enterprises 1 030 1 030 618 618 222 222 135 135 55 55

Deutsche BundesbankFinancial statement statistics (ratios - provisional data)
May 2021143
I. Enterprises by economic sector
cont'd: 13.a) Legal and accounting activities; management consultancy activities
cont'd: All legal formsEnterprises with sales of ... € million
Total Less than 2 2 but less than 10 10 but less than 50 50 and moreQuartile Cylindered sample 2018/2019value 2018 2019 2018 2019 2018 2019 2018 2019 2018 2019Of the enterprises captured …
Ratios ... % had a ratio of less than …Percentage of gross revenue
Cost of materials 25 0.0 0.0 0.0 0.0 2.3 0.7 3.0 2.8 7.4 7.8 50 7.5 7.1 2.4 2.7 14.5 14.3 17.2 16.0 15.8 18.8 75 29.8 29.3 19.8 20.9 35.7 36.6 41.4 41.7 48.5 47.2
Personnel expenses 25 27.0 26.7 23.1 22.3 32.7 31.8 31.7 33.6 27.8 29.4 50 47.5 48.8 45.8 47.3 48.7 50.4 50.3 50.3 50.0 51.5 75 62.2 61.9 62.3 62.3 60.5 60.6 62.8 61.7 68.0 68.3
Depreciation 25 0.5 0.5 0.6 0.6 0.5 0.4 0.3 0.3 0.2 0.3 50 1.3 1.4 1.9 1.9 1.0 1.0 0.9 1.0 0.8 0.8 75 3.5 3.2 4.4 4.3 2.2 2.1 1.7 1.9 1.9 2.1
Annual result 25 0.7 1.2 0.7 1.4 1.3 1.8 0.7 0.6 0.4 0.4 50 4.8 5.7 5.8 7.8 4.9 5.1 3.5 3.1 1.7 3.2 75 12.8 14.0 16.7 18.1 11.9 11.0 7.3 6.5 5.3 6.5
Percentage of the balance sheet totalTangible fixed assets 25 1.1 1.0 1.2 1.1 1.1 1.0 0.9 0.8 0.8 0.8
50 3.8 3.7 5.0 5.0 3.3 3.1 2.4 2.5 2.2 2.4 75 12.0 12.3 17.2 17.1 9.1 8.1 5.4 5.6 5.5 5.7
Inventories 25 0.0 0.0 0.0 0.0 0.0 0.0 0.0 0.0 0.0 0.0 50 0.0 0.0 0.0 0.0 0.6 0.3 1.4 1.0 1.5 1.2 75 5.8 6.3 4.0 4.2 8.5 8.3 6.8 8.1 11.6 9.1
Equity 25 10.2 13.9 10.5 16.6 12.2 13.1 8.6 11.4 7.0 9.1 50 34.0 36.4 40.1 42.7 32.5 33.8 25.8 27.1 13.9 21.2 75 58.1 61.0 64.1 66.5 54.9 58.2 51.3 47.9 28.8 32.7
Short-term liabilities 25 14.2 13.0 12.5 11.6 17.9 16.9 16.2 14.2 15.8 18.1 50 29.7 27.8 27.6 25.6 31.0 31.4 31.2 33.3 28.8 25.7 75 56.6 52.5 56.7 51.7 60.6 54.4 58.3 54.2 45.2 48.5
Liabilities to banks 25 0.0 0.0 0.0 0.0 0.0 0.0 0.0 0.0 0.0 0.0 50 0.0 0.0 0.0 0.0 0.0 0.0 0.0 0.0 0.0 0.0 75 12.1 11.9 19.2 18.2 11.3 10.9 0.0 0.0 0.0 0.0
Percentage of salesAnnual result before taxes on income 25 1.2 1.6 1.1 1.9 1.9 2.2 1.2 1.0 0.5 0.4
50 6.4 7.6 7.9 9.9 7.1 7.2 5.1 3.7 2.7 3.8 75 17.3 18.2 21.3 23.0 16.4 14.8 9.4 9.1 7.5 9.2
Annual result and depreciation 25 3.1 3.7 3.4 4.8 3.3 4.1 2.1 2.1 1.9 1.1 50 9.2 10.3 11.5 13.6 9.0 9.2 6.6 5.4 4.7 5.2 75 20.8 21.4 25.4 27.4 17.5 16.3 12.3 10.7 9.0 10.6
Trade receivables 25 4.0 4.4 3.6 3.5 6.7 6.8 3.0 3.6 8.5 9.0 50 10.9 11.2 9.8 9.6 13.5 13.2 12.3 12.6 15.1 15.3 75 19.5 19.4 17.5 17.7 21.5 20.7 22.5 21.5 21.0 22.0
Percentage of the balance sheet totalAnnual result and interest paid 25 2.7 3.7 2.3 3.8 4.1 4.8 2.6 2.2 2.7 2.9
50 9.9 10.7 10.3 12.0 12.0 12.3 7.3 6.9 5.8 6.4 75 24.0 23.6 26.4 28.4 25.7 22.3 15.6 14.3 9.2 12.8
Percentage of liabilities and provisions less cashAnnual result and depreciation 25 - 8.0 - 2.9 - 20.3 - 19.2 - 1.1 3.9 1.9 2.3 3.9 2.5
50 17.8 20.4 16.4 20.1 25.3 26.2 17.3 17.9 8.3 15.2 75 66.1 75.1 70.7 82.3 70.1 84.1 58.5 48.3 21.5 42.8
Percentage of fixed assetsLong-term equity and liabilities 25 112.0 126.3 101.5 116.1 152.8 148.6 130.4 138.8 134.4 155.0
50 299.2 327.0 252.5 296.8 471.4 491.6 315.1 302.5 226.6 255.1 75 1 026.4 1 118.5 900.0 1 013.3 1 195.3 1 268.0 1 223.9 1 400.5 871.1 641.4
Percentage of short-term liabilitiesCash resources and short-term receivables 25 112.5 127.1 104.0 120.3 115.8 128.2 122.9 136.4 154.4 156.3
50 224.0 251.6 218.1 260.0 229.1 230.1 243.8 220.7 243.2 287.0 75 496.1 550.4 545.5 608.7 447.6 441.7 453.4 502.2 429.9 418.1
Percentage of cost of materialsTrade payables 25 6.1 5.5 6.0 4.8 8.2 8.3 5.5 6.1 3.0 2.3
50 17.3 15.8 20.0 19.3 20.4 14.9 12.5 13.6 8.2 6.8 75 44.2 38.6 64.3 56.5 39.4 35.3 27.9 25.2 15.3 15.9

Deutsche BundesbankFinancial statement statistics (ratios - provisional data)May 2021144
I. Enterprises by economic sector
13.b) Architectural and engineering activities; technical testing and analysis
All legal formsEnterprises with sales of ... € million
Total Less than 2 2 but less than 10 10 but less than 50 50 and moreCylindered sample 2018/2019
Ratios 2018 2019 2018 2019 2018 2019 2018 2019 2018 2019Income statementIncome Percentage of gross revenueSales 98.5 99.1 93.3 95.5 96.0 94.8 96.1 96.7 100.2 101.2Change in finished goods 1.5 0.9 6.7 4.5 4.0 5.2 3.9 3.3 - 0.2 - 1.2Interest and similar income 0.3 0.2 0.2 0.2 0.3 0.2 0.2 0.2 0.4 0.3Other income 3.0 2.8 3.8 4.6 2.9 3.6 3.2 2.7 2.9 2.7
of which: Income from long-term equity investments 0.7 0.6 0.3 0.3 0.5 0.6 0.4 0.4 0.8 0.7Total income 103.3 103.1 104.0 104.9 103.2 103.8 103.4 102.9 103.3 103.0
ExpensesCost of materials 39.2 39.6 29.0 28.7 34.3 34.4 35.9 36.3 41.9 42.5Personnel expenses 40.0 40.2 43.5 43.3 41.9 42.0 42.1 41.8 38.6 39.0Depreciation 3.4 3.2 2.7 2.6 2.7 3.1 2.8 2.8 3.9 3.4
of which: Depreciation of tangible fixed assets 2.7 2.6 2.7 2.6 2.5 2.6 2.2 2.2 2.9 2.8Interest and similar expenses 0.9 0.8 0.7 0.7 0.8 0.7 0.6 0.6 1.0 0.9Operating taxes 0.1 0.1 0.1 0.1 0.2 0.1 0.1 0.1 0.0 0.0Other expenses 15.1 14.8 19.1 19.4 15.7 16.2 16.2 16.1 14.3 13.8Total expenses before taxes on income 98.7 98.6 95.1 94.8 95.6 96.5 97.6 97.6 99.8 99.6Annual result before taxes on income 4.6 4.5 8.9 10.0 7.5 7.3 5.7 5.3 3.5 3.4Taxes on income 1.4 1.3 2.2 2.5 2.1 1.9 1.6 1.4 1.2 1.1Annual result 3.3 3.2 6.7 7.6 5.5 5.4 4.1 3.8 2.3 2.3Profit and loss transfers (parent company) 0.1 0.1 0.3 0.2 0.1 0.0 0.3 0.4 0.1 0.0Profit and loss transfers (subsidiary) 0.7 0.7 0.7 0.3 0.2 0.6 1.0 1.4 0.7 0.4Profit for the year 2.7 2.6 6.3 7.4 5.4 4.9 3.4 2.8 1.7 1.9
Balance sheetAssets Percentage of the balance sheet totalIntangible fixed assets 1.8 1.6 0.7 1.0 1.0 0.9 0.6 0.7 2.3 2.2Tangible fixed assets 9.2 10.1 16.3 14.5 17.8 17.4 11.2 11.8 7.0 8.0
of which: Land and buildings 3.1 3.3 7.4 6.3 6.1 5.8 4.5 4.7 2.0 2.3Inventories 36.7 34.9 31.7 34.6 36.0 38.5 40.1 38.2 35.6 33.0
of which: Finished goods and merchandise 1.1 1.2 1.9 3.4 2.7 1.9 1.5 1.5 0.7 0.8Cash 9.2 9.3 18.3 19.0 13.0 12.2 13.0 12.7 7.0 7.1Receivables 30.4 31.3 28.0 26.2 27.8 26.8 28.9 30.5 31.3 32.4
Short-term 29.0 29.7 26.4 24.5 26.8 25.8 27.4 28.5 30.1 31.0 of which:
Trade receivables 12.8 12.8 14.5 14.0 13.2 12.3 13.8 14.0 12.2 12.4Receivables from affiliated companies 14.3 14.9 7.9 7.0 10.3 9.7 11.4 12.1 16.2 17.1
Long-term 1.3 1.5 1.5 1.7 1.0 1.0 1.5 2.0 1.3 1.4of which: Loans to affiliated companies 0.9 1.0 0.9 0.9 0.4 0.5 1.1 1.3 0.9 0.9
Securities 1.4 1.5 0.7 0.6 1.6 1.7 0.8 0.9 1.5 1.8Other long-term equity investments 11.1 10.9 3.7 3.4 2.2 2.0 4.8 4.7 15.0 15.1
of which: Goodwill 4.7 4.4 0.3 0.2 0.3 0.3 0.4 0.3 7.1 6.8
CapitalEquity 26.4 27.1 28.8 29.6 29.5 27.9 24.8 24.2 26.5 28.1Liabilities 60.5 58.9 61.7 61.4 60.5 62.6 62.1 62.3 59.9 56.8
Short-term 55.4 53.2 51.4 51.6 52.7 54.8 58.0 57.7 54.9 51.2of which:Liabilities to banks 1.4 1.6 4.3 5.7 4.1 3.9 1.8 2.0 0.8 0.9Trade payables 5.2 5.2 6.1 5.9 5.3 5.1 5.0 5.0 5.2 5.2Liabilities to affiliated companies 10.5 9.5 7.3 6.4 6.7 7.3 9.4 10.4 11.6 9.6
Long-term 5.1 5.7 10.3 9.8 7.8 7.8 4.1 4.6 5.0 5.7 of which:
Liabilities to banks 3.2 3.5 5.9 5.5 4.8 4.2 2.3 2.4 3.3 3.8Liabilities to affiliated companies 1.5 1.7 3.0 2.1 2.5 3.1 1.6 1.9 1.3 1.4
Provisions 13.0 13.7 8.9 8.6 9.9 9.3 12.9 13.2 13.6 14.8of which: Provisions for pensions 4.3 4.4 2.6 2.3 2.3 2.3 3.5 3.8 5.0 5.1
Other ratios Percentage of salesAnnual result before taxes on income 4.7 4.5 9.6 10.5 7.9 7.7 6.0 5.4 3.5 3.4Annual result and depreciation 6.8 6.4 10.1 10.7 8.5 9.0 7.2 6.9 6.2 5.7Trade receivables 14.1 13.3 13.5 13.5 13.5 13.2 14.2 13.7 14.2 13.1
Percentage of the balance sheet totalSales 90.4 96.4 107.8 103.7 97.8 93.0 97.5 102.5 86.1 94.3Annual result and interest paid 3.8 3.8 8.6 8.9 6.4 6.0 4.9 4.7 2.8 3.0
Percentage of liabilities and provisions less cashAnnual result and depreciation 9.5 9.7 20.6 21.6 14.5 14.0 11.3 11.1 8.0 8.2
Percentage of fixed assetsLong-term equity and liabilities 150.8 151.0 185.4 200.3 170.3 169.3 176.0 167.0 140.5 142.7
Percentage of short-term liabilitiesCash resources and short-term receivables 70.7 75.1 88.0 85.0 76.5 70.4 70.8 72.3 69.5 76.8Cash resources, short-term receivables and inventories 137.0 140.7 149.7 152.0 144.7 140.6 140.0 138.6 134.3 141.3
Percentage of cost of materialsTrade payables 14.3 13.4 18.2 18.7 15.1 15.1 13.7 13.0 14.4 13.2
Memo item:Balance sheet total in € billion 22.71 22.78 0.41 0.47 2.04 2.30 5.69 5.79 14.57 14.23Sales in € billion 20.52 21.97 0.44 0.49 1.99 2.14 5.55 5.93 12.54 13.41Number of enterprises 1 304 1 304 533 533 421 421 264 264 86 86

Deutsche BundesbankFinancial statement statistics (ratios - provisional data)
May 2021145
I. Enterprises by economic sector
cont'd: 13.b) Architectural and engineering activities; technical testing and analysis
cont'd: All legal formsEnterprises with sales of ... € million
Total Less than 2 2 but less than 10 10 but less than 50 50 and moreQuartile Cylindered sample 2018/2019value 2018 2019 2018 2019 2018 2019 2018 2019 2018 2019Of the enterprises captured …
Ratios ... % had a ratio of less than …Percentage of gross revenue
Cost of materials 25 7.8 7.0 2.2 1.8 10.3 9.4 14.0 15.3 15.3 15.3 50 23.2 22.6 14.9 14.0 26.0 26.9 30.2 28.5 33.5 36.0 75 50.2 49.6 38.0 38.7 56.4 57.7 56.5 52.7 62.6 66.2
Personnel expenses 25 24.9 24.7 26.7 27.5 24.5 24.3 24.8 24.1 18.2 20.4 50 44.8 45.4 46.6 47.7 44.8 44.8 43.6 44.8 39.1 39.8 75 60.4 60.3 62.3 62.5 59.6 60.1 56.8 59.2 55.8 55.9
Depreciation 25 0.7 0.7 0.8 0.8 0.7 0.8 0.5 0.6 0.8 0.9 50 1.7 1.7 2.0 1.9 1.5 1.5 1.3 1.4 1.6 1.8 75 3.4 3.3 3.9 3.7 2.7 2.8 3.1 2.9 3.4 3.5
Annual result 25 0.9 1.1 0.7 1.3 1.5 1.2 0.8 0.7 0.1 0.2 50 4.1 4.2 4.7 5.6 4.2 4.1 3.4 3.0 3.6 3.3 75 9.4 9.6 11.6 12.8 8.9 8.0 7.3 7.7 6.0 7.0
Percentage of the balance sheet totalTangible fixed assets 25 1.6 1.6 1.6 1.7 1.9 1.9 1.3 1.5 1.1 1.3
50 5.4 5.7 6.3 6.6 5.5 5.5 4.5 5.5 3.4 3.7 75 17.8 18.2 22.5 20.6 13.9 15.7 18.0 19.9 12.8 11.1
Inventories 25 0.6 0.7 0.0 0.0 3.0 3.5 3.3 2.5 4.3 4.6 50 12.9 12.9 5.4 6.1 20.3 19.1 16.0 17.8 17.3 14.5 75 43.8 42.7 35.6 33.0 49.1 50.6 50.9 46.9 42.7 42.2
Equity 25 10.1 11.6 10.9 14.1 9.7 11.3 10.1 8.1 12.5 12.6 50 28.5 29.8 32.8 35.4 27.5 27.4 23.9 25.0 21.7 28.0 75 52.3 54.1 57.8 60.8 50.7 53.2 45.6 44.9 45.1 45.9
Short-term liabilities 25 19.2 19.2 15.7 14.3 21.2 22.8 24.3 22.7 19.3 20.5 50 43.5 42.1 39.4 37.1 45.5 46.6 47.7 48.1 46.5 41.6 75 75.0 71.4 75.2 68.4 77.6 74.2 71.0 72.2 72.2 63.6
Liabilities to banks 25 0.0 0.0 0.0 0.0 0.0 0.0 0.0 0.0 0.0 0.0 50 0.0 0.0 0.0 0.0 0.0 0.0 0.0 0.0 0.0 0.0 75 8.0 8.5 13.5 11.7 8.5 9.2 4.0 3.8 0.1 0.2
Percentage of salesAnnual result before taxes on income 25 1.4 1.5 1.1 1.7 2.4 1.7 1.3 0.9 0.4 0.4
50 6.0 6.0 7.1 7.8 6.0 6.0 4.7 4.4 4.7 4.6 75 13.2 13.0 16.9 17.6 13.0 11.1 10.1 9.4 8.6 9.5
Annual result and depreciation 25 3.5 3.3 3.3 4.1 4.1 3.8 3.0 2.7 2.3 2.3 50 8.3 8.6 9.6 10.9 8.4 8.1 7.0 6.6 6.3 6.5 75 16.4 16.7 21.0 21.5 15.4 15.0 13.4 12.6 11.1 12.0
Trade receivables 25 5.5 4.8 3.8 3.0 6.3 6.0 7.5 6.6 5.5 5.7 50 11.3 10.8 10.5 9.8 11.5 11.1 12.5 11.3 13.9 12.3 75 18.3 18.3 18.0 18.7 18.3 18.0 18.3 18.7 19.0 17.7
Percentage of the balance sheet totalAnnual result and interest paid 25 2.2 2.0 2.3 2.5 2.8 2.5 1.6 1.3 1.3 0.9
50 6.6 6.8 7.8 9.2 6.6 6.6 5.9 5.3 4.3 4.9 75 15.6 16.1 20.5 22.1 15.2 12.8 12.0 12.6 8.9 10.3
Percentage of liabilities and provisions less cashAnnual result and depreciation 25 1.5 1.7 - 11.5 - 14.1 3.6 3.5 2.1 2.3 2.7 3.8
50 14.2 14.1 13.4 12.5 15.0 16.3 13.8 13.6 14.7 12.4 75 46.4 44.1 54.6 59.4 52.4 41.2 40.1 37.3 27.4 25.8
Percentage of fixed assetsLong-term equity and liabilities 25 111.6 119.6 102.1 117.6 128.1 132.4 110.1 108.9 110.9 115.6
50 255.2 257.1 256.6 284.1 300.0 296.7 210.6 208.5 212.5 203.5 75 709.2 728.1 874.1 908.2 641.0 772.3 719.6 665.1 445.7 417.1
Percentage of short-term liabilitiesCash resources and short-term receivables 25 53.7 59.7 58.8 69.7 50.2 49.6 52.1 55.1 64.9 75.4
50 130.4 128.0 153.8 149.8 121.4 116.2 120.4 116.8 123.5 126.2 75 317.4 316.9 412.5 434.2 279.9 280.3 249.1 251.1 287.7 277.2
Percentage of cost of materialsTrade payables 25 6.2 5.7 5.0 4.4 6.6 7.0 5.9 6.0 7.4 5.1
50 13.9 13.0 15.4 13.9 13.8 13.4 12.4 12.3 12.9 10.7 75 28.4 29.0 41.0 50.0 26.2 25.9 23.1 20.4 18.8 18.9
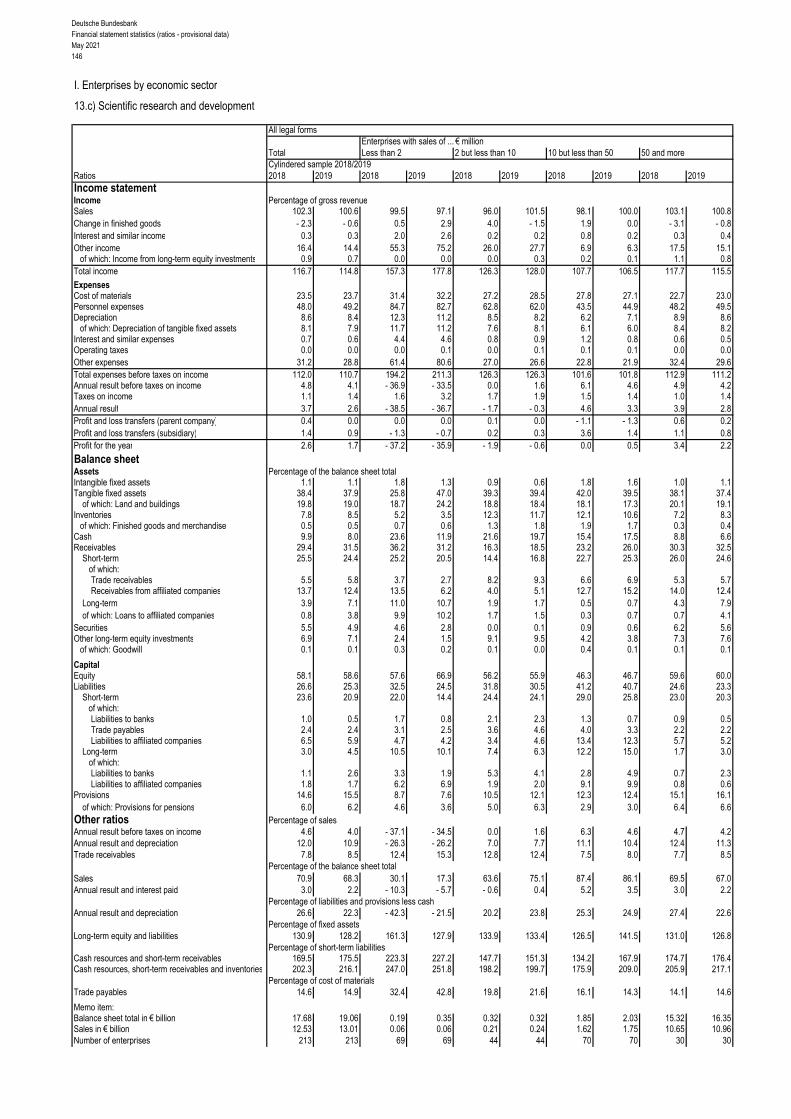
Deutsche BundesbankFinancial statement statistics (ratios - provisional data)May 2021146
I. Enterprises by economic sector
13.c) Scientific research and development
All legal formsEnterprises with sales of ... € million
Total Less than 2 2 but less than 10 10 but less than 50 50 and moreCylindered sample 2018/2019
Ratios 2018 2019 2018 2019 2018 2019 2018 2019 2018 2019Income statementIncome Percentage of gross revenueSales 102.3 100.6 99.5 97.1 96.0 101.5 98.1 100.0 103.1 100.8Change in finished goods - 2.3 - 0.6 0.5 2.9 4.0 - 1.5 1.9 0.0 - 3.1 - 0.8Interest and similar income 0.3 0.3 2.0 2.6 0.2 0.2 0.8 0.2 0.3 0.4Other income 16.4 14.4 55.3 75.2 26.0 27.7 6.9 6.3 17.5 15.1
of which: Income from long-term equity investments 0.9 0.7 0.0 0.0 0.0 0.3 0.2 0.1 1.1 0.8Total income 116.7 114.8 157.3 177.8 126.3 128.0 107.7 106.5 117.7 115.5
ExpensesCost of materials 23.5 23.7 31.4 32.2 27.2 28.5 27.8 27.1 22.7 23.0Personnel expenses 48.0 49.2 84.7 82.7 62.8 62.0 43.5 44.9 48.2 49.5Depreciation 8.6 8.4 12.3 11.2 8.5 8.2 6.2 7.1 8.9 8.6
of which: Depreciation of tangible fixed assets 8.1 7.9 11.7 11.2 7.6 8.1 6.1 6.0 8.4 8.2Interest and similar expenses 0.7 0.6 4.4 4.6 0.8 0.9 1.2 0.8 0.6 0.5Operating taxes 0.0 0.0 0.0 0.1 0.0 0.1 0.1 0.1 0.0 0.0Other expenses 31.2 28.8 61.4 80.6 27.0 26.6 22.8 21.9 32.4 29.6Total expenses before taxes on income 112.0 110.7 194.2 211.3 126.3 126.3 101.6 101.8 112.9 111.2Annual result before taxes on income 4.8 4.1 - 36.9 - 33.5 0.0 1.6 6.1 4.6 4.9 4.2Taxes on income 1.1 1.4 1.6 3.2 1.7 1.9 1.5 1.4 1.0 1.4Annual result 3.7 2.6 - 38.5 - 36.7 - 1.7 - 0.3 4.6 3.3 3.9 2.8Profit and loss transfers (parent company) 0.4 0.0 0.0 0.0 0.1 0.0 - 1.1 - 1.3 0.6 0.2Profit and loss transfers (subsidiary) 1.4 0.9 - 1.3 - 0.7 0.2 0.3 3.6 1.4 1.1 0.8Profit for the year 2.6 1.7 - 37.2 - 35.9 - 1.9 - 0.6 0.0 0.5 3.4 2.2
Balance sheetAssets Percentage of the balance sheet totalIntangible fixed assets 1.1 1.1 1.8 1.3 0.9 0.6 1.8 1.6 1.0 1.1Tangible fixed assets 38.4 37.9 25.8 47.0 39.3 39.4 42.0 39.5 38.1 37.4
of which: Land and buildings 19.8 19.0 18.7 24.2 18.8 18.4 18.1 17.3 20.1 19.1Inventories 7.8 8.5 5.2 3.5 12.3 11.7 12.1 10.6 7.2 8.3
of which: Finished goods and merchandise 0.5 0.5 0.7 0.6 1.3 1.8 1.9 1.7 0.3 0.4Cash 9.9 8.0 23.6 11.9 21.6 19.7 15.4 17.5 8.8 6.6Receivables 29.4 31.5 36.2 31.2 16.3 18.5 23.2 26.0 30.3 32.5
Short-term 25.5 24.4 25.2 20.5 14.4 16.8 22.7 25.3 26.0 24.6 of which:
Trade receivables 5.5 5.8 3.7 2.7 8.2 9.3 6.6 6.9 5.3 5.7Receivables from affiliated companies 13.7 12.4 13.5 6.2 4.0 5.1 12.7 15.2 14.0 12.4
Long-term 3.9 7.1 11.0 10.7 1.9 1.7 0.5 0.7 4.3 7.9of which: Loans to affiliated companies 0.8 3.8 9.9 10.2 1.7 1.5 0.3 0.7 0.7 4.1
Securities 5.5 4.9 4.6 2.8 0.0 0.1 0.9 0.6 6.2 5.6Other long-term equity investments 6.9 7.1 2.4 1.5 9.1 9.5 4.2 3.8 7.3 7.6
of which: Goodwill 0.1 0.1 0.3 0.2 0.1 0.0 0.4 0.1 0.1 0.1
CapitalEquity 58.1 58.6 57.6 66.9 56.2 55.9 46.3 46.7 59.6 60.0Liabilities 26.6 25.3 32.5 24.5 31.8 30.5 41.2 40.7 24.6 23.3
Short-term 23.6 20.9 22.0 14.4 24.4 24.1 29.0 25.8 23.0 20.3of which:Liabilities to banks 1.0 0.5 1.7 0.8 2.1 2.3 1.3 0.7 0.9 0.5Trade payables 2.4 2.4 3.1 2.5 3.6 4.6 4.0 3.3 2.2 2.2Liabilities to affiliated companies 6.5 5.9 4.7 4.2 3.4 4.6 13.4 12.3 5.7 5.2
Long-term 3.0 4.5 10.5 10.1 7.4 6.3 12.2 15.0 1.7 3.0 of which:
Liabilities to banks 1.1 2.6 3.3 1.9 5.3 4.1 2.8 4.9 0.7 2.3Liabilities to affiliated companies 1.8 1.7 6.2 6.9 1.9 2.0 9.1 9.9 0.8 0.6
Provisions 14.6 15.5 8.7 7.6 10.5 12.1 12.3 12.4 15.1 16.1of which: Provisions for pensions 6.0 6.2 4.6 3.6 5.0 6.3 2.9 3.0 6.4 6.6
Other ratios Percentage of salesAnnual result before taxes on income 4.6 4.0 - 37.1 - 34.5 0.0 1.6 6.3 4.6 4.7 4.2Annual result and depreciation 12.0 10.9 - 26.3 - 26.2 7.0 7.7 11.1 10.4 12.4 11.3Trade receivables 7.8 8.5 12.4 15.3 12.8 12.4 7.5 8.0 7.7 8.5
Percentage of the balance sheet totalSales 70.9 68.3 30.1 17.3 63.6 75.1 87.4 86.1 69.5 67.0Annual result and interest paid 3.0 2.2 - 10.3 - 5.7 - 0.6 0.4 5.2 3.5 3.0 2.2
Percentage of liabilities and provisions less cashAnnual result and depreciation 26.6 22.3 - 42.3 - 21.5 20.2 23.8 25.3 24.9 27.4 22.6
Percentage of fixed assetsLong-term equity and liabilities 130.9 128.2 161.3 127.9 133.9 133.4 126.5 141.5 131.0 126.8
Percentage of short-term liabilitiesCash resources and short-term receivables 169.5 175.5 223.3 227.2 147.7 151.3 134.2 167.9 174.7 176.4Cash resources, short-term receivables and inventories 202.3 216.1 247.0 251.8 198.2 199.7 175.9 209.0 205.9 217.1
Percentage of cost of materialsTrade payables 14.6 14.9 32.4 42.8 19.8 21.6 16.1 14.3 14.1 14.6
Memo item:Balance sheet total in € billion 17.68 19.06 0.19 0.35 0.32 0.32 1.85 2.03 15.32 16.35Sales in € billion 12.53 13.01 0.06 0.06 0.21 0.24 1.62 1.75 10.65 10.96Number of enterprises 213 213 69 69 44 44 70 70 30 30

Deutsche BundesbankFinancial statement statistics (ratios - provisional data)
May 2021147
I. Enterprises by economic sector
cont'd: 13.c) Scientific research and development
cont'd: All legal formsEnterprises with sales of ... € million
Total Less than 2 2 but less than 10 10 but less than 50 50 and moreQuartile Cylindered sample 2018/2019value 2018 2019 2018 2019 2018 2019 2018 2019 2018 2019Of the enterprises captured …
Ratios ... % had a ratio of less than …Percentage of gross revenue
Cost of materials 25 9.2 9.8 2.1 2.5 12.7 13.2 12.9 12.0 11.9 11.6 50 21.5 21.1 17.5 17.9 23.9 23.9 21.2 21.8 24.1 22.4 75 43.7 39.9 44.6 39.2 44.4 40.8 36.2 39.1 42.0 39.9
Personnel expenses 25 33.8 32.1 30.4 34.6 38.7 37.5 31.9 30.4 30.1 25.5 50 49.4 49.4 58.3 58.5 50.0 51.9 44.1 45.4 47.5 45.1 75 67.9 68.6 83.4 82.7 69.5 70.4 59.4 59.4 56.3 56.7
Depreciation 25 1.4 1.2 1.0 1.1 1.1 1.0 1.4 1.3 1.7 1.5 50 3.6 3.7 3.6 4.0 2.8 2.4 3.4 3.3 4.1 4.2 75 9.2 10.1 13.3 12.9 6.5 7.3 8.6 9.3 7.0 7.9
Annual result 25 - 0.3 0.0 - 19.3 - 5.5 0.7 0.6 0.0 0.8 0.1 0.0 50 2.5 3.3 0.5 2.7 2.9 3.9 2.5 3.3 3.2 3.0 75 8.6 9.0 11.6 9.2 6.0 10.3 8.6 7.5 6.8 12.3
Percentage of the balance sheet totalTangible fixed assets 25 2.7 3.3 1.1 1.9 6.7 4.9 4.9 4.8 2.3 2.2
50 13.5 13.6 8.9 10.7 15.3 17.8 22.1 18.4 10.4 11.6 75 43.8 41.4 33.3 37.5 51.0 51.3 46.5 44.8 40.7 38.5
Inventories 25 0.0 0.0 0.0 0.0 0.8 0.8 0.5 0.5 0.0 0.0 50 4.5 3.5 2.0 1.3 8.1 8.0 6.1 4.9 0.4 0.5 75 19.1 15.1 11.6 13.3 27.4 21.5 26.3 17.1 11.4 11.4
Equity 25 12.3 16.8 2.7 6.8 23.9 34.0 17.6 20.6 21.3 24.8 50 43.0 43.1 32.4 28.5 43.7 45.4 43.3 50.5 48.8 45.9 75 69.4 65.3 67.6 60.0 69.8 62.4 68.6 67.4 71.7 69.3
Short-term liabilities 25 12.8 9.2 8.8 7.0 14.9 12.1 14.1 9.9 11.6 4.9 50 26.6 24.2 25.8 25.0 28.9 30.3 27.9 22.0 20.7 19.8 75 49.5 44.9 73.2 50.8 46.8 46.6 49.5 41.7 47.4 41.3
Liabilities to banks 25 0.0 0.0 0.0 0.0 0.0 0.0 0.0 0.0 0.0 0.0 50 0.0 0.0 0.0 0.0 0.0 0.8 0.0 0.0 0.0 0.0 75 5.4 3.0 10.5 6.0 14.0 13.3 0.3 0.0 0.1 0.0
Percentage of salesAnnual result before taxes on income 25 - 0.6 0.0 - 20.5 - 5.5 1.2 1.0 0.3 0.3 0.1 0.4
50 3.6 4.0 0.5 3.9 4.4 5.1 3.4 3.5 4.3 4.5 75 10.9 10.6 13.6 10.0 9.6 11.8 10.9 9.2 10.8 15.4
Annual result and depreciation 25 2.1 3.3 - 11.8 0.0 2.9 2.3 3.3 4.0 6.6 6.1 50 8.7 8.9 5.7 7.5 8.2 8.3 10.4 10.0 10.3 11.0 75 21.9 18.5 29.5 18.9 17.2 18.2 24.3 18.5 16.2 16.1
Trade receivables 25 1.1 1.3 1.3 1.6 5.6 5.4 0.4 0.6 0.4 0.2 50 8.1 7.5 8.7 8.4 11.9 12.3 5.0 6.6 5.7 3.3 75 15.2 16.0 15.2 17.9 19.0 17.0 16.8 14.5 12.5 10.8
Percentage of the balance sheet totalAnnual result and interest paid 25 0.0 0.0 - 11.5 - 2.9 0.7 1.3 0.1 1.1 0.6 0.2
50 3.8 5.4 0.8 3.7 4.2 4.5 4.2 5.9 6.2 6.1 75 10.8 12.8 14.1 14.9 10.9 14.3 9.7 11.8 9.8 11.1
Percentage of liabilities and provisions less cashAnnual result and depreciation 25 - 2.1 1.1 - 13.5 0.0 0.2 - 88.0 - 0.4 2.9 18.8 15.4
50 18.8 19.0 11.2 11.4 16.7 9.0 19.2 25.8 26.9 33.8 75 45.2 54.0 55.4 41.5 52.4 52.1 44.7 81.2 40.2 52.3
Percentage of fixed assetsLong-term equity and liabilities 25 100.0 102.6 49.5 42.4 118.3 112.2 102.5 107.2 102.3 103.2
50 155.8 165.7 140.3 128.2 192.0 294.6 164.7 186.8 136.5 138.6 75 412.1 443.8 555.7 439.8 504.1 580.1 339.8 420.0 326.9 256.3
Percentage of short-term liabilitiesCash resources and short-term receivables 25 87.7 111.8 74.3 110.7 92.8 87.1 93.4 120.3 104.3 118.0
50 170.4 215.9 197.7 230.9 145.8 193.2 182.2 214.1 168.9 258.3 75 405.0 489.2 538.3 693.2 364.5 405.4 299.7 419.0 650.7 994.1
Percentage of cost of materialsTrade payables 25 8.0 8.5 7.0 9.5 9.6 8.5 7.7 8.2 7.1 8.8
50 14.9 16.8 17.9 26.7 15.1 19.8 13.8 14.9 15.6 17.1 75 34.1 34.5 61.0 71.2 25.5 31.0 27.7 24.1 28.8 27.2
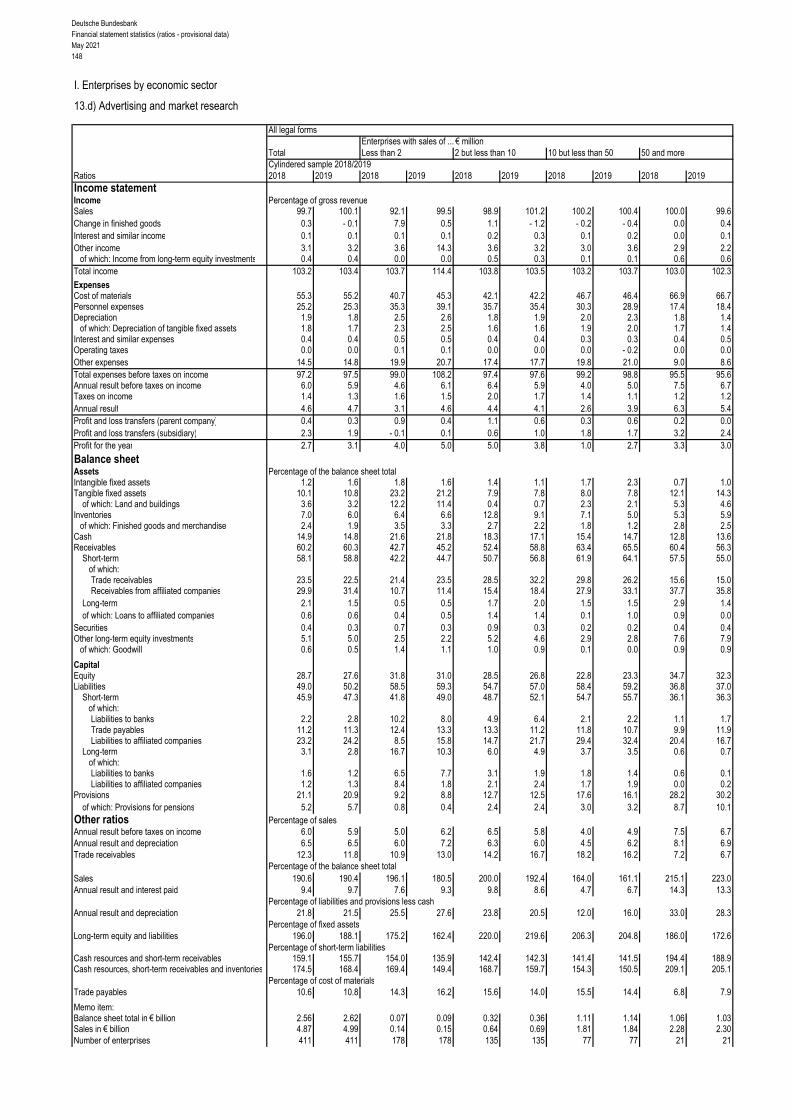
Deutsche BundesbankFinancial statement statistics (ratios - provisional data)May 2021148
I. Enterprises by economic sector
13.d) Advertising and market research
All legal formsEnterprises with sales of ... € million
Total Less than 2 2 but less than 10 10 but less than 50 50 and moreCylindered sample 2018/2019
Ratios 2018 2019 2018 2019 2018 2019 2018 2019 2018 2019Income statementIncome Percentage of gross revenueSales 99.7 100.1 92.1 99.5 98.9 101.2 100.2 100.4 100.0 99.6Change in finished goods 0.3 - 0.1 7.9 0.5 1.1 - 1.2 - 0.2 - 0.4 0.0 0.4Interest and similar income 0.1 0.1 0.1 0.1 0.2 0.3 0.1 0.2 0.0 0.1Other income 3.1 3.2 3.6 14.3 3.6 3.2 3.0 3.6 2.9 2.2
of which: Income from long-term equity investments 0.4 0.4 0.0 0.0 0.5 0.3 0.1 0.1 0.6 0.6Total income 103.2 103.4 103.7 114.4 103.8 103.5 103.2 103.7 103.0 102.3
ExpensesCost of materials 55.3 55.2 40.7 45.3 42.1 42.2 46.7 46.4 66.9 66.7Personnel expenses 25.2 25.3 35.3 39.1 35.7 35.4 30.3 28.9 17.4 18.4Depreciation 1.9 1.8 2.5 2.6 1.8 1.9 2.0 2.3 1.8 1.4
of which: Depreciation of tangible fixed assets 1.8 1.7 2.3 2.5 1.6 1.6 1.9 2.0 1.7 1.4Interest and similar expenses 0.4 0.4 0.5 0.5 0.4 0.4 0.3 0.3 0.4 0.5Operating taxes 0.0 0.0 0.1 0.1 0.0 0.0 0.0 - 0.2 0.0 0.0Other expenses 14.5 14.8 19.9 20.7 17.4 17.7 19.8 21.0 9.0 8.6Total expenses before taxes on income 97.2 97.5 99.0 108.2 97.4 97.6 99.2 98.8 95.5 95.6Annual result before taxes on income 6.0 5.9 4.6 6.1 6.4 5.9 4.0 5.0 7.5 6.7Taxes on income 1.4 1.3 1.6 1.5 2.0 1.7 1.4 1.1 1.2 1.2Annual result 4.6 4.7 3.1 4.6 4.4 4.1 2.6 3.9 6.3 5.4Profit and loss transfers (parent company) 0.4 0.3 0.9 0.4 1.1 0.6 0.3 0.6 0.2 0.0Profit and loss transfers (subsidiary) 2.3 1.9 - 0.1 0.1 0.6 1.0 1.8 1.7 3.2 2.4Profit for the year 2.7 3.1 4.0 5.0 5.0 3.8 1.0 2.7 3.3 3.0
Balance sheetAssets Percentage of the balance sheet totalIntangible fixed assets 1.2 1.6 1.8 1.6 1.4 1.1 1.7 2.3 0.7 1.0Tangible fixed assets 10.1 10.8 23.2 21.2 7.9 7.8 8.0 7.8 12.1 14.3
of which: Land and buildings 3.6 3.2 12.2 11.4 0.4 0.7 2.3 2.1 5.3 4.6Inventories 7.0 6.0 6.4 6.6 12.8 9.1 7.1 5.0 5.3 5.9
of which: Finished goods and merchandise 2.4 1.9 3.5 3.3 2.7 2.2 1.8 1.2 2.8 2.5Cash 14.9 14.8 21.6 21.8 18.3 17.1 15.4 14.7 12.8 13.6Receivables 60.2 60.3 42.7 45.2 52.4 58.8 63.4 65.5 60.4 56.3
Short-term 58.1 58.8 42.2 44.7 50.7 56.8 61.9 64.1 57.5 55.0 of which:
Trade receivables 23.5 22.5 21.4 23.5 28.5 32.2 29.8 26.2 15.6 15.0Receivables from affiliated companies 29.9 31.4 10.7 11.4 15.4 18.4 27.9 33.1 37.7 35.8
Long-term 2.1 1.5 0.5 0.5 1.7 2.0 1.5 1.5 2.9 1.4of which: Loans to affiliated companies 0.6 0.6 0.4 0.5 1.4 1.4 0.1 1.0 0.9 0.0
Securities 0.4 0.3 0.7 0.3 0.9 0.3 0.2 0.2 0.4 0.4Other long-term equity investments 5.1 5.0 2.5 2.2 5.2 4.6 2.9 2.8 7.6 7.9
of which: Goodwill 0.6 0.5 1.4 1.1 1.0 0.9 0.1 0.0 0.9 0.9
CapitalEquity 28.7 27.6 31.8 31.0 28.5 26.8 22.8 23.3 34.7 32.3Liabilities 49.0 50.2 58.5 59.3 54.7 57.0 58.4 59.2 36.8 37.0
Short-term 45.9 47.3 41.8 49.0 48.7 52.1 54.7 55.7 36.1 36.3of which:Liabilities to banks 2.2 2.8 10.2 8.0 4.9 6.4 2.1 2.2 1.1 1.7Trade payables 11.2 11.3 12.4 13.3 13.3 11.2 11.8 10.7 9.9 11.9Liabilities to affiliated companies 23.2 24.2 8.5 15.8 14.7 21.7 29.4 32.4 20.4 16.7
Long-term 3.1 2.8 16.7 10.3 6.0 4.9 3.7 3.5 0.6 0.7 of which:
Liabilities to banks 1.6 1.2 6.5 7.7 3.1 1.9 1.8 1.4 0.6 0.1Liabilities to affiliated companies 1.2 1.3 8.4 1.8 2.1 2.4 1.7 1.9 0.0 0.2
Provisions 21.1 20.9 9.2 8.8 12.7 12.5 17.6 16.1 28.2 30.2of which: Provisions for pensions 5.2 5.7 0.8 0.4 2.4 2.4 3.0 3.2 8.7 10.1
Other ratios Percentage of salesAnnual result before taxes on income 6.0 5.9 5.0 6.2 6.5 5.8 4.0 4.9 7.5 6.7Annual result and depreciation 6.5 6.5 6.0 7.2 6.3 6.0 4.5 6.2 8.1 6.9Trade receivables 12.3 11.8 10.9 13.0 14.2 16.7 18.2 16.2 7.2 6.7
Percentage of the balance sheet totalSales 190.6 190.4 196.1 180.5 200.0 192.4 164.0 161.1 215.1 223.0Annual result and interest paid 9.4 9.7 7.6 9.3 9.8 8.6 4.7 6.7 14.3 13.3
Percentage of liabilities and provisions less cashAnnual result and depreciation 21.8 21.5 25.5 27.6 23.8 20.5 12.0 16.0 33.0 28.3
Percentage of fixed assetsLong-term equity and liabilities 196.0 188.1 175.2 162.4 220.0 219.6 206.3 204.8 186.0 172.6
Percentage of short-term liabilitiesCash resources and short-term receivables 159.1 155.7 154.0 135.9 142.4 142.3 141.4 141.5 194.4 188.9Cash resources, short-term receivables and inventories 174.5 168.4 169.4 149.4 168.7 159.7 154.3 150.5 209.1 205.1
Percentage of cost of materialsTrade payables 10.6 10.8 14.3 16.2 15.6 14.0 15.5 14.4 6.8 7.9
Memo item:Balance sheet total in € billion 2.56 2.62 0.07 0.09 0.32 0.36 1.11 1.14 1.06 1.03Sales in € billion 4.87 4.99 0.14 0.15 0.64 0.69 1.81 1.84 2.28 2.30Number of enterprises 411 411 178 178 135 135 77 77 21 21
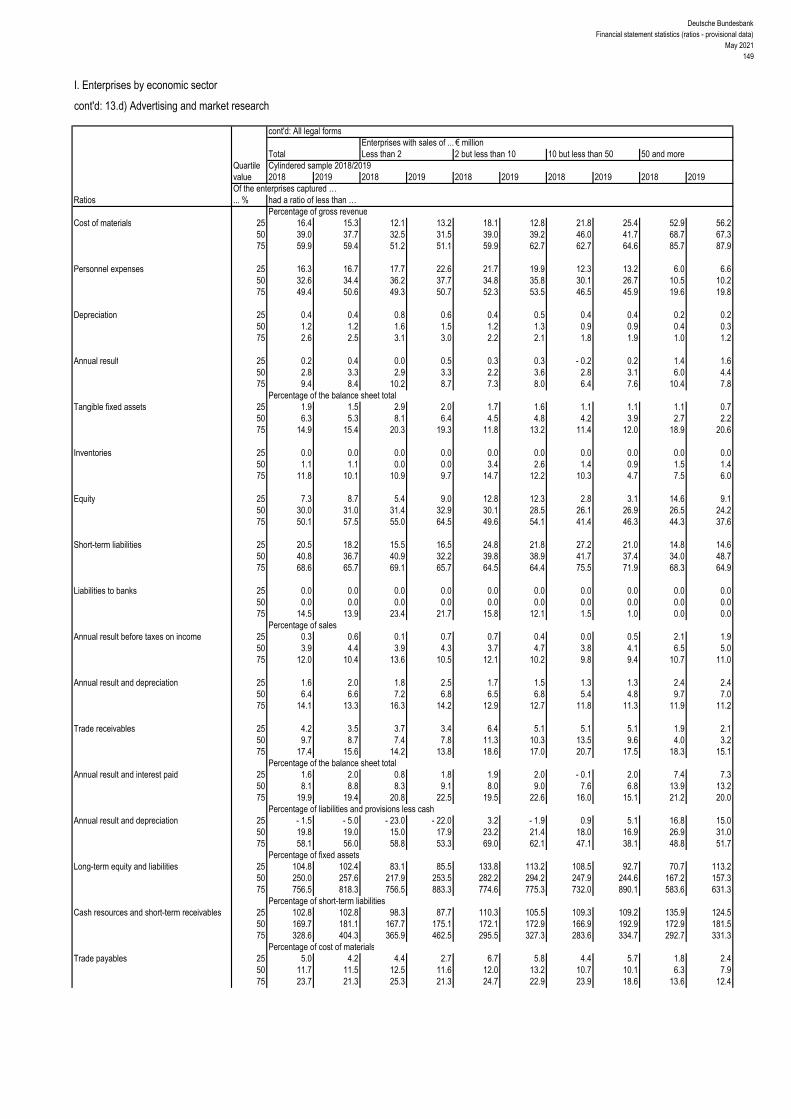
Deutsche BundesbankFinancial statement statistics (ratios - provisional data)
May 2021149
I. Enterprises by economic sector
cont'd: 13.d) Advertising and market research
cont'd: All legal formsEnterprises with sales of ... € million
Total Less than 2 2 but less than 10 10 but less than 50 50 and moreQuartile Cylindered sample 2018/2019value 2018 2019 2018 2019 2018 2019 2018 2019 2018 2019Of the enterprises captured …
Ratios ... % had a ratio of less than …Percentage of gross revenue
Cost of materials 25 16.4 15.3 12.1 13.2 18.1 12.8 21.8 25.4 52.9 56.2 50 39.0 37.7 32.5 31.5 39.0 39.2 46.0 41.7 68.7 67.3 75 59.9 59.4 51.2 51.1 59.9 62.7 62.7 64.6 85.7 87.9
Personnel expenses 25 16.3 16.7 17.7 22.6 21.7 19.9 12.3 13.2 6.0 6.6 50 32.6 34.4 36.2 37.7 34.8 35.8 30.1 26.7 10.5 10.2 75 49.4 50.6 49.3 50.7 52.3 53.5 46.5 45.9 19.6 19.8
Depreciation 25 0.4 0.4 0.8 0.6 0.4 0.5 0.4 0.4 0.2 0.2 50 1.2 1.2 1.6 1.5 1.2 1.3 0.9 0.9 0.4 0.3 75 2.6 2.5 3.1 3.0 2.2 2.1 1.8 1.9 1.0 1.2
Annual result 25 0.2 0.4 0.0 0.5 0.3 0.3 - 0.2 0.2 1.4 1.6 50 2.8 3.3 2.9 3.3 2.2 3.6 2.8 3.1 6.0 4.4 75 9.4 8.4 10.2 8.7 7.3 8.0 6.4 7.6 10.4 7.8
Percentage of the balance sheet totalTangible fixed assets 25 1.9 1.5 2.9 2.0 1.7 1.6 1.1 1.1 1.1 0.7
50 6.3 5.3 8.1 6.4 4.5 4.8 4.2 3.9 2.7 2.2 75 14.9 15.4 20.3 19.3 11.8 13.2 11.4 12.0 18.9 20.6
Inventories 25 0.0 0.0 0.0 0.0 0.0 0.0 0.0 0.0 0.0 0.0 50 1.1 1.1 0.0 0.0 3.4 2.6 1.4 0.9 1.5 1.4 75 11.8 10.1 10.9 9.7 14.7 12.2 10.3 4.7 7.5 6.0
Equity 25 7.3 8.7 5.4 9.0 12.8 12.3 2.8 3.1 14.6 9.1 50 30.0 31.0 31.4 32.9 30.1 28.5 26.1 26.9 26.5 24.2 75 50.1 57.5 55.0 64.5 49.6 54.1 41.4 46.3 44.3 37.6
Short-term liabilities 25 20.5 18.2 15.5 16.5 24.8 21.8 27.2 21.0 14.8 14.6 50 40.8 36.7 40.9 32.2 39.8 38.9 41.7 37.4 34.0 48.7 75 68.6 65.7 69.1 65.7 64.5 64.4 75.5 71.9 68.3 64.9
Liabilities to banks 25 0.0 0.0 0.0 0.0 0.0 0.0 0.0 0.0 0.0 0.0 50 0.0 0.0 0.0 0.0 0.0 0.0 0.0 0.0 0.0 0.0 75 14.5 13.9 23.4 21.7 15.8 12.1 1.5 1.0 0.0 0.0
Percentage of salesAnnual result before taxes on income 25 0.3 0.6 0.1 0.7 0.7 0.4 0.0 0.5 2.1 1.9
50 3.9 4.4 3.9 4.3 3.7 4.7 3.8 4.1 6.5 5.0 75 12.0 10.4 13.6 10.5 12.1 10.2 9.8 9.4 10.7 11.0
Annual result and depreciation 25 1.6 2.0 1.8 2.5 1.7 1.5 1.3 1.3 2.4 2.4 50 6.4 6.6 7.2 6.8 6.5 6.8 5.4 4.8 9.7 7.0 75 14.1 13.3 16.3 14.2 12.9 12.7 11.8 11.3 11.9 11.2
Trade receivables 25 4.2 3.5 3.7 3.4 6.4 5.1 5.1 5.1 1.9 2.1 50 9.7 8.7 7.4 7.8 11.3 10.3 13.5 9.6 4.0 3.2 75 17.4 15.6 14.2 13.8 18.6 17.0 20.7 17.5 18.3 15.1
Percentage of the balance sheet totalAnnual result and interest paid 25 1.6 2.0 0.8 1.8 1.9 2.0 - 0.1 2.0 7.4 7.3
50 8.1 8.8 8.3 9.1 8.0 9.0 7.6 6.8 13.9 13.2 75 19.9 19.4 20.8 22.5 19.5 22.6 16.0 15.1 21.2 20.0
Percentage of liabilities and provisions less cashAnnual result and depreciation 25 - 1.5 - 5.0 - 23.0 - 22.0 3.2 - 1.9 0.9 5.1 16.8 15.0
50 19.8 19.0 15.0 17.9 23.2 21.4 18.0 16.9 26.9 31.0 75 58.1 56.0 58.8 53.3 69.0 62.1 47.1 38.1 48.8 51.7
Percentage of fixed assetsLong-term equity and liabilities 25 104.8 102.4 83.1 85.5 133.8 113.2 108.5 92.7 70.7 113.2
50 250.0 257.6 217.9 253.5 282.2 294.2 247.9 244.6 167.2 157.3 75 756.5 818.3 756.5 883.3 774.6 775.3 732.0 890.1 583.6 631.3
Percentage of short-term liabilitiesCash resources and short-term receivables 25 102.8 102.8 98.3 87.7 110.3 105.5 109.3 109.2 135.9 124.5
50 169.7 181.1 167.7 175.1 172.1 172.9 166.9 192.9 172.9 181.5 75 328.6 404.3 365.9 462.5 295.5 327.3 283.6 334.7 292.7 331.3
Percentage of cost of materialsTrade payables 25 5.0 4.2 4.4 2.7 6.7 5.8 4.4 5.7 1.8 2.4
50 11.7 11.5 12.5 11.6 12.0 13.2 10.7 10.1 6.3 7.9 75 23.7 21.3 25.3 21.3 24.7 22.9 23.9 18.6 13.6 12.4
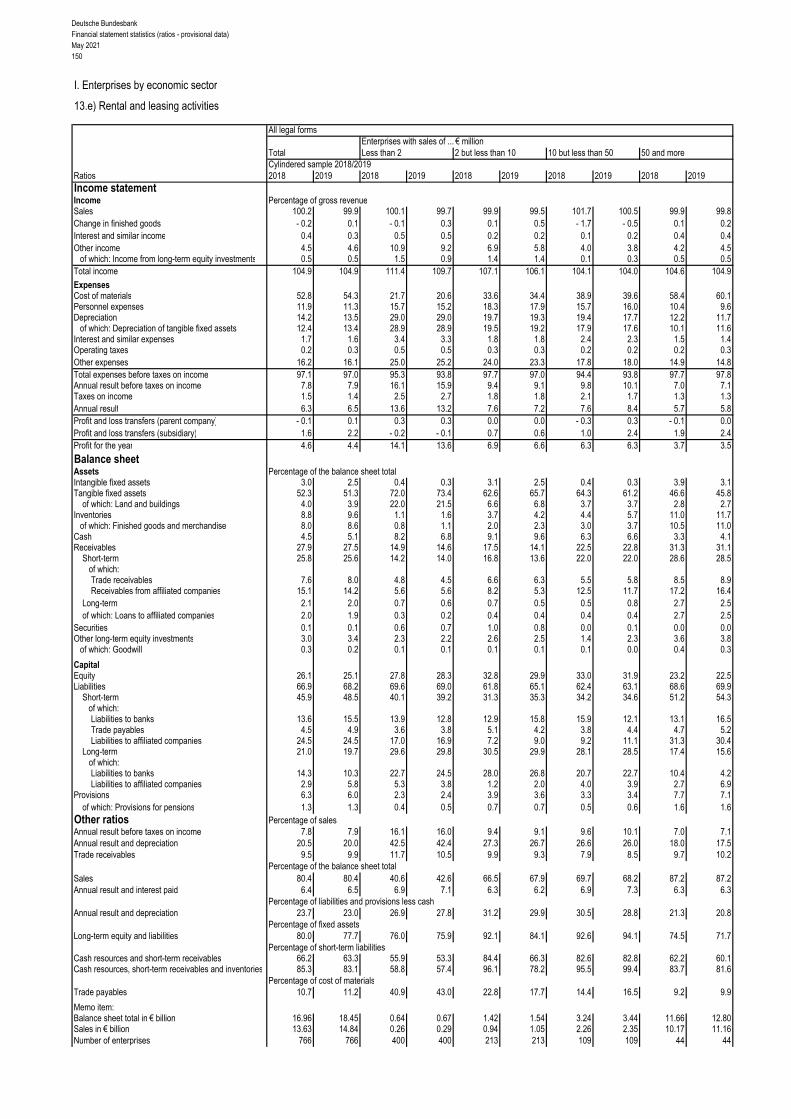
Deutsche BundesbankFinancial statement statistics (ratios - provisional data)May 2021150
I. Enterprises by economic sector
13.e) Rental and leasing activities
All legal formsEnterprises with sales of ... € million
Total Less than 2 2 but less than 10 10 but less than 50 50 and moreCylindered sample 2018/2019
Ratios 2018 2019 2018 2019 2018 2019 2018 2019 2018 2019Income statementIncome Percentage of gross revenueSales 100.2 99.9 100.1 99.7 99.9 99.5 101.7 100.5 99.9 99.8Change in finished goods - 0.2 0.1 - 0.1 0.3 0.1 0.5 - 1.7 - 0.5 0.1 0.2Interest and similar income 0.4 0.3 0.5 0.5 0.2 0.2 0.1 0.2 0.4 0.4Other income 4.5 4.6 10.9 9.2 6.9 5.8 4.0 3.8 4.2 4.5
of which: Income from long-term equity investments 0.5 0.5 1.5 0.9 1.4 1.4 0.1 0.3 0.5 0.5Total income 104.9 104.9 111.4 109.7 107.1 106.1 104.1 104.0 104.6 104.9
ExpensesCost of materials 52.8 54.3 21.7 20.6 33.6 34.4 38.9 39.6 58.4 60.1Personnel expenses 11.9 11.3 15.7 15.2 18.3 17.9 15.7 16.0 10.4 9.6Depreciation 14.2 13.5 29.0 29.0 19.7 19.3 19.4 17.7 12.2 11.7
of which: Depreciation of tangible fixed assets 12.4 13.4 28.9 28.9 19.5 19.2 17.9 17.6 10.1 11.6Interest and similar expenses 1.7 1.6 3.4 3.3 1.8 1.8 2.4 2.3 1.5 1.4Operating taxes 0.2 0.3 0.5 0.5 0.3 0.3 0.2 0.2 0.2 0.3Other expenses 16.2 16.1 25.0 25.2 24.0 23.3 17.8 18.0 14.9 14.8Total expenses before taxes on income 97.1 97.0 95.3 93.8 97.7 97.0 94.4 93.8 97.7 97.8Annual result before taxes on income 7.8 7.9 16.1 15.9 9.4 9.1 9.8 10.1 7.0 7.1Taxes on income 1.5 1.4 2.5 2.7 1.8 1.8 2.1 1.7 1.3 1.3Annual result 6.3 6.5 13.6 13.2 7.6 7.2 7.6 8.4 5.7 5.8Profit and loss transfers (parent company) - 0.1 0.1 0.3 0.3 0.0 0.0 - 0.3 0.3 - 0.1 0.0Profit and loss transfers (subsidiary) 1.6 2.2 - 0.2 - 0.1 0.7 0.6 1.0 2.4 1.9 2.4Profit for the year 4.6 4.4 14.1 13.6 6.9 6.6 6.3 6.3 3.7 3.5
Balance sheetAssets Percentage of the balance sheet totalIntangible fixed assets 3.0 2.5 0.4 0.3 3.1 2.5 0.4 0.3 3.9 3.1Tangible fixed assets 52.3 51.3 72.0 73.4 62.6 65.7 64.3 61.2 46.6 45.8
of which: Land and buildings 4.0 3.9 22.0 21.5 6.6 6.8 3.7 3.7 2.8 2.7Inventories 8.8 9.6 1.1 1.6 3.7 4.2 4.4 5.7 11.0 11.7
of which: Finished goods and merchandise 8.0 8.6 0.8 1.1 2.0 2.3 3.0 3.7 10.5 11.0Cash 4.5 5.1 8.2 6.8 9.1 9.6 6.3 6.6 3.3 4.1Receivables 27.9 27.5 14.9 14.6 17.5 14.1 22.5 22.8 31.3 31.1
Short-term 25.8 25.6 14.2 14.0 16.8 13.6 22.0 22.0 28.6 28.5 of which:
Trade receivables 7.6 8.0 4.8 4.5 6.6 6.3 5.5 5.8 8.5 8.9Receivables from affiliated companies 15.1 14.2 5.6 5.6 8.2 5.3 12.5 11.7 17.2 16.4
Long-term 2.1 2.0 0.7 0.6 0.7 0.5 0.5 0.8 2.7 2.5of which: Loans to affiliated companies 2.0 1.9 0.3 0.2 0.4 0.4 0.4 0.4 2.7 2.5
Securities 0.1 0.1 0.6 0.7 1.0 0.8 0.0 0.1 0.0 0.0Other long-term equity investments 3.0 3.4 2.3 2.2 2.6 2.5 1.4 2.3 3.6 3.8
of which: Goodwill 0.3 0.2 0.1 0.1 0.1 0.1 0.1 0.0 0.4 0.3
CapitalEquity 26.1 25.1 27.8 28.3 32.8 29.9 33.0 31.9 23.2 22.5Liabilities 66.9 68.2 69.6 69.0 61.8 65.1 62.4 63.1 68.6 69.9
Short-term 45.9 48.5 40.1 39.2 31.3 35.3 34.2 34.6 51.2 54.3of which:Liabilities to banks 13.6 15.5 13.9 12.8 12.9 15.8 15.9 12.1 13.1 16.5Trade payables 4.5 4.9 3.6 3.8 5.1 4.2 3.8 4.4 4.7 5.2Liabilities to affiliated companies 24.5 24.5 17.0 16.9 7.2 9.0 9.2 11.1 31.3 30.4
Long-term 21.0 19.7 29.6 29.8 30.5 29.9 28.1 28.5 17.4 15.6 of which:
Liabilities to banks 14.3 10.3 22.7 24.5 28.0 26.8 20.7 22.7 10.4 4.2Liabilities to affiliated companies 2.9 5.8 5.3 3.8 1.2 2.0 4.0 3.9 2.7 6.9
Provisions 6.3 6.0 2.3 2.4 3.9 3.6 3.3 3.4 7.7 7.1of which: Provisions for pensions 1.3 1.3 0.4 0.5 0.7 0.7 0.5 0.6 1.6 1.6
Other ratios Percentage of salesAnnual result before taxes on income 7.8 7.9 16.1 16.0 9.4 9.1 9.6 10.1 7.0 7.1Annual result and depreciation 20.5 20.0 42.5 42.4 27.3 26.7 26.6 26.0 18.0 17.5Trade receivables 9.5 9.9 11.7 10.5 9.9 9.3 7.9 8.5 9.7 10.2
Percentage of the balance sheet totalSales 80.4 80.4 40.6 42.6 66.5 67.9 69.7 68.2 87.2 87.2Annual result and interest paid 6.4 6.5 6.9 7.1 6.3 6.2 6.9 7.3 6.3 6.3
Percentage of liabilities and provisions less cashAnnual result and depreciation 23.7 23.0 26.9 27.8 31.2 29.9 30.5 28.8 21.3 20.8
Percentage of fixed assetsLong-term equity and liabilities 80.0 77.7 76.0 75.9 92.1 84.1 92.6 94.1 74.5 71.7
Percentage of short-term liabilitiesCash resources and short-term receivables 66.2 63.3 55.9 53.3 84.4 66.3 82.6 82.8 62.2 60.1Cash resources, short-term receivables and inventories 85.3 83.1 58.8 57.4 96.1 78.2 95.5 99.4 83.7 81.6
Percentage of cost of materialsTrade payables 10.7 11.2 40.9 43.0 22.8 17.7 14.4 16.5 9.2 9.9
Memo item:Balance sheet total in € billion 16.96 18.45 0.64 0.67 1.42 1.54 3.24 3.44 11.66 12.80Sales in € billion 13.63 14.84 0.26 0.29 0.94 1.05 2.26 2.35 10.17 11.16Number of enterprises 766 766 400 400 213 213 109 109 44 44

Deutsche BundesbankFinancial statement statistics (ratios - provisional data)
May 2021151
I. Enterprises by economic sector
cont'd: 13.e) Rental and leasing activities
cont'd: All legal formsEnterprises with sales of ... € million
Total Less than 2 2 but less than 10 10 but less than 50 50 and moreQuartile Cylindered sample 2018/2019value 2018 2019 2018 2019 2018 2019 2018 2019 2018 2019Of the enterprises captured …
Ratios ... % had a ratio of less than …Percentage of gross revenue
Cost of materials 25 0.0 0.0 0.0 0.0 5.7 7.0 10.7 9.3 29.3 30.0 50 12.5 12.5 0.0 0.3 26.8 28.0 37.4 39.1 47.5 47.7 75 43.3 43.8 19.2 19.5 51.5 49.0 57.0 58.2 66.5 69.1
Personnel expenses 25 0.0 0.0 0.0 0.0 6.5 7.3 2.2 1.8 5.9 5.0 50 10.4 10.2 2.5 2.3 17.1 17.3 12.8 13.6 8.9 8.7 75 24.7 24.4 22.4 20.7 29.3 27.3 21.9 23.4 21.0 21.7
Depreciation 25 6.6 7.0 8.7 9.9 5.7 6.3 5.7 4.7 3.7 4.2 50 18.2 18.4 29.7 28.6 13.4 14.1 13.8 13.2 17.2 13.3 75 43.7 42.1 53.2 55.7 25.3 23.8 24.7 24.1 23.2 24.4
Annual result 25 1.4 1.4 1.8 2.4 1.0 1.1 1.5 1.7 0.9 0.4 50 6.2 6.1 10.1 9.9 3.4 3.9 5.0 4.8 4.0 4.5 75 18.8 18.2 28.9 25.6 11.2 9.8 10.2 11.9 9.3 8.8
Percentage of the balance sheet totalTangible fixed assets 25 37.7 37.4 40.9 44.2 37.1 38.8 26.6 27.2 9.7 12.1
50 67.7 67.7 73.6 73.3 64.1 65.9 62.2 58.9 57.3 54.7 75 84.4 84.3 87.4 88.0 78.1 80.1 81.2 81.5 81.5 76.1
Inventories 25 0.0 0.0 0.0 0.0 0.0 0.0 0.0 0.0 0.1 0.2 50 0.0 0.0 0.0 0.0 0.6 0.8 1.1 1.1 1.2 1.3 75 2.2 2.2 0.0 0.0 5.8 5.3 6.4 7.9 6.0 6.0
Equity 25 8.2 8.9 5.4 7.8 10.4 10.1 9.0 9.7 11.1 10.2 50 25.2 24.9 24.6 24.5 23.3 24.0 27.0 27.5 29.4 26.0 75 48.8 47.6 51.1 50.5 42.2 43.1 48.7 47.5 49.7 49.9
Short-term liabilities 25 15.6 15.0 13.0 11.3 17.8 17.4 20.5 20.5 15.8 22.7 50 33.3 33.4 33.8 34.8 31.4 32.6 29.7 31.9 35.8 39.6 75 60.7 61.7 64.1 63.2 57.3 60.3 55.1 56.6 66.4 69.3
Liabilities to banks 25 0.5 0.5 0.0 0.0 10.8 12.3 0.0 0.0 0.0 0.0 50 29.6 29.9 28.5 30.4 35.6 35.9 27.6 26.6 1.7 0.2 75 57.2 59.0 56.2 60.3 59.3 59.6 55.8 52.9 52.7 48.8
Percentage of salesAnnual result before taxes on income 25 1.9 1.9 2.7 3.1 1.6 1.5 2.2 2.5 1.0 1.0
50 7.4 8.1 12.1 12.5 5.0 5.1 6.2 6.3 5.7 5.5 75 21.9 21.7 32.4 30.0 13.4 12.8 13.3 12.7 13.2 11.5
Annual result and depreciation 25 12.5 12.6 19.3 19.2 9.1 9.9 11.8 10.5 10.0 10.4 50 30.3 30.2 51.0 49.7 19.2 19.9 22.4 23.0 23.0 24.8 75 67.8 69.7 82.1 82.4 41.1 41.0 43.2 41.1 35.3 34.9
Trade receivables 25 0.1 0.2 0.0 0.0 3.5 2.8 1.0 1.6 5.3 4.9 50 6.3 5.5 3.4 2.5 7.7 6.8 6.8 6.7 10.3 9.6 75 12.0 11.7 11.8 10.7 11.5 11.7 10.7 12.0 14.9 13.2
Percentage of the balance sheet totalAnnual result and interest paid 25 2.4 2.8 2.3 2.8 2.6 2.9 3.1 3.4 1.8 1.2
50 6.4 6.2 7.2 6.8 5.7 5.9 6.9 6.3 4.5 3.4 75 12.5 12.5 13.7 14.2 10.5 10.8 10.9 11.8 10.3 9.9
Percentage of liabilities and provisions less cashAnnual result and depreciation 25 13.6 14.5 12.9 15.2 15.4 14.1 16.9 15.9 13.1 10.1
50 29.3 29.2 27.5 29.8 27.7 26.1 33.6 33.3 30.1 24.9 75 59.3 57.3 62.3 60.7 46.7 46.6 61.6 71.4 59.0 49.3
Percentage of fixed assetsLong-term equity and liabilities 25 54.2 51.9 44.9 41.5 64.1 64.0 69.1 56.6 55.7 55.5
50 89.9 89.2 87.0 83.9 94.0 94.8 95.3 93.7 85.5 83.2 75 125.0 121.9 119.3 115.8 121.8 117.6 148.3 147.9 133.1 150.0
Percentage of short-term liabilitiesCash resources and short-term receivables 25 31.2 29.8 22.2 21.9 39.8 41.2 40.2 38.5 32.4 28.6
50 74.5 74.6 69.4 71.6 80.3 78.5 83.7 85.9 66.3 54.9 75 179.0 176.1 202.9 195.7 161.2 159.9 149.3 153.8 221.3 159.1
Percentage of cost of materialsTrade payables 25 5.2 4.3 3.7 2.8 7.0 5.3 4.2 4.4 5.4 4.9
50 14.0 14.0 21.5 21.1 15.7 13.4 9.3 10.7 7.7 9.0 75 51.0 49.7 104.0 131.0 45.8 38.0 25.1 18.4 15.7 16.6

Deutsche BundesbankFinancial statement statistics (ratios - provisional data)May 2021152
I. Enterprises by economic sector
13.f) Employment activities
All legal formsEnterprises with sales of ... € million
Total Less than 2 2 but less than 10 10 but less than 50 50 and moreCylindered sample 2018/2019
Ratios 2018 2019 2018 2019 2018 2019 2018 2019 2018 2019Income statementIncome Percentage of gross revenueSales 100.0 100.0 99.9 100.0 99.9 99.9 99.9 99.8 100.0 100.0Change in finished goods 0.0 0.0 0.1 0.0 0.1 0.1 0.1 0.2 0.0 0.0Interest and similar income 0.1 0.1 1.5 0.6 0.3 0.3 0.1 0.1 0.0 0.0Other income 1.7 2.0 3.7 3.7 3.8 3.7 1.8 2.1 1.5 1.7
of which: Income from long-term equity investments 0.0 0.1 0.2 0.1 0.1 0.1 0.1 0.1 0.0 0.0Total income 101.8 102.0 105.2 104.4 104.1 104.0 101.8 102.2 101.5 101.8
ExpensesCost of materials 32.1 30.5 10.6 12.5 17.7 17.5 14.6 15.0 38.6 36.4Personnel expenses 53.0 55.1 69.5 66.9 68.8 68.8 71.9 72.0 46.1 48.9Depreciation 0.4 0.4 2.0 2.0 0.7 0.7 0.5 0.5 0.3 0.3
of which: Depreciation of tangible fixed assets 0.3 0.3 2.0 2.0 0.7 0.7 0.4 0.5 0.2 0.3Interest and similar expenses 0.2 0.2 0.6 0.6 0.8 0.8 0.3 0.3 0.1 0.1Operating taxes 0.1 0.0 0.1 0.1 0.0 0.0 0.0 0.0 0.1 0.0Other expenses 12.9 13.3 17.6 18.3 12.9 13.4 11.3 11.9 13.2 13.6Total expenses before taxes on income 98.6 99.5 100.4 100.3 100.9 101.1 98.6 99.6 98.3 99.3Annual result before taxes on income 3.2 2.5 4.8 4.0 3.1 2.9 3.2 2.5 3.2 2.5Taxes on income 0.6 0.4 1.0 1.2 0.9 0.9 1.0 1.0 0.5 0.2Annual result 2.6 2.1 3.8 2.9 2.2 2.0 2.2 1.5 2.7 2.3Profit and loss transfers (parent company) 0.0 0.0 0.3 - 0.1 0.1 0.2 0.2 0.2 0.0 0.0Profit and loss transfers (subsidiary) 1.7 1.5 - 0.5 - 0.4 0.3 0.3 0.5 - 0.1 2.3 2.1Profit for the year 0.9 0.7 4.6 3.2 2.0 1.9 1.9 1.8 0.4 0.2
Balance sheetAssets Percentage of the balance sheet totalIntangible fixed assets 1.0 1.1 0.8 0.7 0.4 0.4 1.2 1.0 1.0 1.3Tangible fixed assets 4.5 4.7 23.1 22.3 8.1 7.5 5.4 6.0 2.9 3.0
of which: Land and buildings 1.8 1.7 11.7 10.8 3.5 2.8 3.1 3.3 0.6 0.7Inventories 0.5 0.7 1.3 1.7 1.5 1.7 0.9 1.5 0.2 0.2
of which: Finished goods and merchandise 0.1 0.1 0.1 0.4 0.1 0.1 0.1 0.0 0.1 0.1Cash 12.0 12.5 20.9 21.6 26.7 26.0 15.4 15.1 8.0 8.9Receivables 76.3 75.2 35.6 34.7 60.6 61.3 65.6 65.6 84.6 82.6
Short-term 74.9 73.9 35.4 34.7 52.6 52.8 65.4 65.2 83.8 82.1 of which:
Trade receivables 56.0 53.0 14.5 14.7 28.8 26.5 36.7 37.8 69.4 64.6Receivables from affiliated companies 15.3 16.1 14.8 13.1 19.0 21.1 24.1 21.2 11.3 13.5
Long-term 1.4 1.3 0.2 0.0 8.0 8.5 0.2 0.3 0.8 0.5of which: Loans to affiliated companies 1.1 0.9 0.0 0.0 7.1 7.5 0.0 0.2 0.6 0.0
Securities 0.3 0.3 2.5 2.5 0.2 0.2 0.6 0.7 0.2 0.2Other long-term equity investments 3.9 4.0 14.9 15.9 2.1 2.4 10.6 9.6 1.3 1.7
of which: Goodwill 0.2 0.3 0.1 0.1 0.2 0.3 0.0 0.1 0.3 0.4
CapitalEquity 26.6 28.0 42.8 40.5 26.6 28.5 32.5 34.6 23.8 25.0Liabilities 51.8 51.1 44.6 48.6 37.8 36.1 47.2 43.7 56.1 56.5
Short-term 47.9 44.4 36.8 37.2 33.6 30.7 38.4 33.9 54.3 50.8of which:Liabilities to banks 1.5 1.2 4.4 4.2 3.4 3.6 2.1 2.1 0.8 0.4Trade payables 13.3 13.4 5.3 4.4 4.2 4.8 3.7 5.0 18.7 18.3Liabilities to affiliated companies 16.1 13.0 14.5 16.4 7.4 5.6 15.8 10.6 17.8 15.1
Long-term 3.9 6.8 7.9 11.4 4.2 5.4 8.8 9.8 1.9 5.7 of which:
Liabilities to banks 0.8 0.8 2.7 3.1 1.9 2.6 1.4 1.5 0.2 0.2Liabilities to affiliated companies 1.8 4.2 1.1 4.3 2.0 2.4 6.2 8.1 0.2 3.1
Provisions 20.3 19.6 12.5 10.8 35.1 34.7 19.9 21.2 18.2 16.7of which: Provisions for pensions 2.8 3.2 0.8 0.0 21.1 22.7 1.8 2.4 0.2 0.2
Other ratios Percentage of salesAnnual result before taxes on income 3.2 2.5 4.8 4.0 3.1 2.9 3.2 2.5 3.2 2.5Annual result and depreciation 2.9 2.5 5.8 4.8 2.9 2.7 2.7 2.0 2.9 2.6Trade receivables 14.4 14.0 7.9 8.2 10.5 9.9 11.8 11.8 15.6 15.1
Percentage of the balance sheet totalSales 388.7 378.9 183.9 180.1 275.4 268.6 311.9 320.0 444.5 427.0Annual result and interest paid 10.9 8.8 8.1 6.2 8.2 7.4 7.7 5.7 12.6 10.3
Percentage of liabilities and provisions less cashAnnual result and depreciation 18.5 16.0 29.5 23.1 17.4 15.8 16.1 12.8 19.2 16.8
Percentage of fixed assetsLong-term equity and liabilities 306.3 339.8 124.1 125.3 278.1 300.1 248.1 276.1 433.9 471.6
Percentage of short-term liabilitiesCash resources and short-term receivables 182.2 195.3 153.3 151.6 236.6 257.3 211.7 238.9 169.4 179.6Cash resources, short-term receivables and inventories 183.3 196.9 156.9 156.2 241.0 262.9 214.1 243.3 169.7 179.9
Percentage of cost of materialsTrade payables 10.6 11.6 27.2 19.5 8.6 10.1 8.2 10.3 10.9 11.8
Memo item:Balance sheet total in € billion 2.13 2.10 0.05 0.05 0.23 0.23 0.51 0.48 1.35 1.34Sales in € billion 8.29 7.96 0.10 0.09 0.62 0.62 1.58 1.54 5.99 5.71Number of enterprises 321 321 94 94 129 129 70 70 28 28

Deutsche BundesbankFinancial statement statistics (ratios - provisional data)
May 2021153
I. Enterprises by economic sector
cont'd: 13.f) Employment activities
cont'd: All legal formsEnterprises with sales of ... € million
Total Less than 2 2 but less than 10 10 but less than 50 50 and moreQuartile Cylindered sample 2018/2019value 2018 2019 2018 2019 2018 2019 2018 2019 2018 2019Of the enterprises captured …
Ratios ... % had a ratio of less than …Percentage of gross revenue
Cost of materials 25 0.0 0.0 0.0 0.0 0.0 0.0 0.0 0.0 0.0 0.0 50 0.1 0.2 0.0 0.0 0.3 0.3 0.4 0.3 0.0 0.0 75 9.0 8.5 8.5 7.9 13.0 12.3 13.0 13.1 0.4 0.6
Personnel expenses 25 54.5 56.1 46.6 48.1 63.6 63.9 54.9 57.1 84.1 83.5 50 82.4 82.4 76.9 76.9 80.7 80.7 85.8 86.5 87.9 89.0 75 89.9 90.1 88.8 89.1 89.1 89.7 90.6 90.7 90.2 91.3
Depreciation 25 0.1 0.1 0.1 0.1 0.2 0.1 0.1 0.1 0.1 0.1 50 0.4 0.3 0.5 0.5 0.4 0.3 0.3 0.3 0.2 0.2 75 0.9 0.8 1.6 1.5 0.8 0.8 0.7 0.6 0.5 0.6
Annual result 25 0.3 0.0 0.0 - 1.1 0.1 0.0 0.7 0.3 0.3 0.3 50 2.2 1.5 3.2 2.8 1.9 1.5 1.9 1.4 2.6 1.1 75 5.2 4.5 10.4 7.4 4.8 4.1 3.7 3.0 4.5 3.4
Percentage of the balance sheet totalTangible fixed assets 25 0.7 0.6 0.0 0.0 0.8 0.7 0.7 0.5 1.3 1.0
50 2.5 2.6 2.4 2.1 3.1 3.1 1.9 2.2 2.6 3.2 75 7.9 7.2 10.6 10.9 9.0 7.9 6.3 6.1 4.6 5.1
Inventories 25 0.0 0.0 0.0 0.0 0.0 0.0 0.0 0.0 0.0 0.0 50 0.0 0.0 0.0 0.0 0.0 0.0 0.0 0.0 0.0 0.0 75 0.1 0.1 0.0 0.0 0.2 0.0 0.2 0.2 0.1 0.1
Equity 25 8.8 9.6 6.5 6.6 9.3 10.7 9.2 16.7 6.4 8.6 50 24.4 25.4 27.7 28.0 19.8 24.8 28.2 28.0 17.0 20.0 75 41.8 43.6 48.3 54.0 37.6 42.3 39.2 40.6 44.2 44.2
Short-term liabilities 25 27.7 24.2 19.1 20.4 31.3 28.4 26.0 23.9 29.6 23.6 50 45.5 43.7 45.6 45.8 49.7 45.4 43.4 40.2 46.3 37.6 75 64.0 61.5 70.2 72.5 65.7 65.2 59.7 57.8 62.1 49.8
Liabilities to banks 25 0.0 0.0 0.0 0.0 0.0 0.0 0.0 0.0 0.0 0.0 50 0.0 0.0 0.0 0.0 0.0 0.0 0.0 0.0 0.0 0.0 75 6.2 5.8 11.2 4.8 10.7 8.8 0.5 2.6 0.0 0.0
Percentage of salesAnnual result before taxes on income 25 0.3 0.1 0.0 - 1.3 0.2 0.2 0.9 0.4 0.7 0.3
50 2.8 2.0 4.3 4.1 2.4 2.0 2.5 1.9 2.9 1.3 75 6.5 6.0 12.5 9.3 5.6 5.4 5.2 4.3 5.1 4.3
Annual result and depreciation 25 1.0 0.4 0.6 - 0.9 1.1 0.5 1.1 0.5 1.0 0.4 50 3.5 2.8 5.1 5.0 3.2 2.8 3.2 2.3 3.5 1.9 75 7.4 6.6 12.6 11.2 6.3 6.5 5.9 4.6 5.1 4.9
Trade receivables 25 5.9 5.1 1.7 1.8 6.1 5.3 7.9 7.0 11.0 10.9 50 10.0 9.3 7.2 6.6 9.3 9.0 12.2 11.5 12.9 13.8 75 14.1 14.1 12.4 12.9 13.2 12.9 16.2 15.9 18.2 18.0
Percentage of the balance sheet totalAnnual result and interest paid 25 2.3 1.2 0.7 - 3.2 2.3 1.9 3.8 1.5 1.8 1.7
50 9.0 6.0 9.1 5.6 9.4 7.1 7.2 5.7 12.5 6.5 75 19.5 14.9 26.0 18.8 19.9 15.1 14.1 12.8 20.0 13.8
Percentage of liabilities and provisions less cashAnnual result and depreciation 25 0.0 - 4.5 - 19.7 - 25.1 2.9 - 1.0 4.8 0.2 10.6 5.5
50 19.2 14.0 10.5 9.3 21.0 13.1 19.4 14.5 26.0 20.3 75 53.0 42.0 44.5 53.1 64.4 46.9 46.4 41.3 42.5 30.7
Percentage of fixed assetsLong-term equity and liabilities 25 120.5 120.2 54.9 39.1 120.5 143.2 180.6 198.1 182.4 191.5
50 381.8 428.1 244.7 252.2 409.1 430.7 535.8 526.0 430.9 475.1 75 1 192.3 1 175.0 792.3 833.3 1 192.3 1 214.8 2 668.8 2 097.9 640.2 878.0
Percentage of short-term liabilitiesCash resources and short-term receivables 25 123.5 128.3 94.8 83.8 125.0 130.5 154.0 160.5 159.4 180.0
50 181.2 191.8 181.9 169.4 172.0 190.9 199.9 197.0 205.0 249.0 75 311.4 349.2 400.0 434.6 279.9 294.9 320.6 349.2 298.3 363.4
Percentage of cost of materialsTrade payables 25 3.8 2.5 3.7 1.4 2.9 2.8 5.6 6.4 4.9 7.3
50 16.1 13.9 25.0 12.1 14.0 17.1 16.1 11.6 58.3 29.2 75 100.9 58.3 200.0 50.0 48.9 71.0 81.4 54.6 293.8 111.6
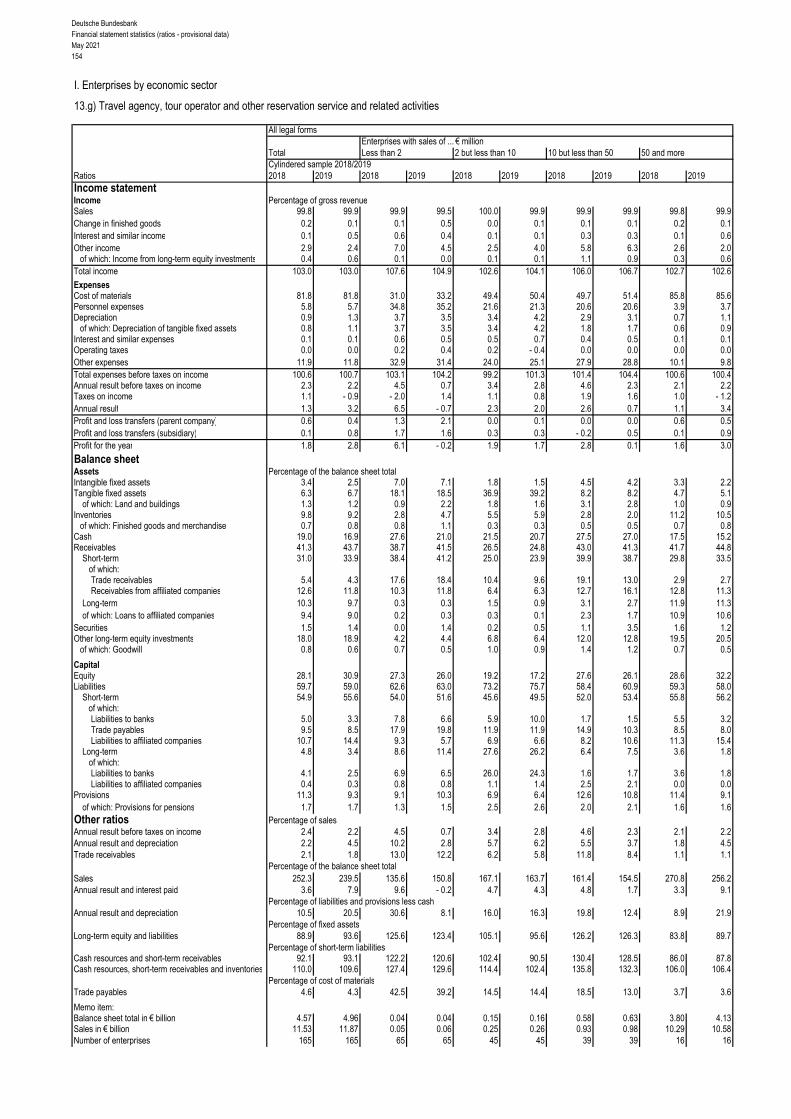
Deutsche BundesbankFinancial statement statistics (ratios - provisional data)May 2021154
I. Enterprises by economic sector
13.g) Travel agency, tour operator and other reservation service and related activities
All legal formsEnterprises with sales of ... € million
Total Less than 2 2 but less than 10 10 but less than 50 50 and moreCylindered sample 2018/2019
Ratios 2018 2019 2018 2019 2018 2019 2018 2019 2018 2019Income statementIncome Percentage of gross revenueSales 99.8 99.9 99.9 99.5 100.0 99.9 99.9 99.9 99.8 99.9Change in finished goods 0.2 0.1 0.1 0.5 0.0 0.1 0.1 0.1 0.2 0.1Interest and similar income 0.1 0.5 0.6 0.4 0.1 0.1 0.3 0.3 0.1 0.6Other income 2.9 2.4 7.0 4.5 2.5 4.0 5.8 6.3 2.6 2.0
of which: Income from long-term equity investments 0.4 0.6 0.1 0.0 0.1 0.1 1.1 0.9 0.3 0.6Total income 103.0 103.0 107.6 104.9 102.6 104.1 106.0 106.7 102.7 102.6
ExpensesCost of materials 81.8 81.8 31.0 33.2 49.4 50.4 49.7 51.4 85.8 85.6Personnel expenses 5.8 5.7 34.8 35.2 21.6 21.3 20.6 20.6 3.9 3.7Depreciation 0.9 1.3 3.7 3.5 3.4 4.2 2.9 3.1 0.7 1.1
of which: Depreciation of tangible fixed assets 0.8 1.1 3.7 3.5 3.4 4.2 1.8 1.7 0.6 0.9Interest and similar expenses 0.1 0.1 0.6 0.5 0.5 0.7 0.4 0.5 0.1 0.1Operating taxes 0.0 0.0 0.2 0.4 0.2 - 0.4 0.0 0.0 0.0 0.0Other expenses 11.9 11.8 32.9 31.4 24.0 25.1 27.9 28.8 10.1 9.8Total expenses before taxes on income 100.6 100.7 103.1 104.2 99.2 101.3 101.4 104.4 100.6 100.4Annual result before taxes on income 2.3 2.2 4.5 0.7 3.4 2.8 4.6 2.3 2.1 2.2Taxes on income 1.1 - 0.9 - 2.0 1.4 1.1 0.8 1.9 1.6 1.0 - 1.2Annual result 1.3 3.2 6.5 - 0.7 2.3 2.0 2.6 0.7 1.1 3.4Profit and loss transfers (parent company) 0.6 0.4 1.3 2.1 0.0 0.1 0.0 0.0 0.6 0.5Profit and loss transfers (subsidiary) 0.1 0.8 1.7 1.6 0.3 0.3 - 0.2 0.5 0.1 0.9Profit for the year 1.8 2.8 6.1 - 0.2 1.9 1.7 2.8 0.1 1.6 3.0
Balance sheetAssets Percentage of the balance sheet totalIntangible fixed assets 3.4 2.5 7.0 7.1 1.8 1.5 4.5 4.2 3.3 2.2Tangible fixed assets 6.3 6.7 18.1 18.5 36.9 39.2 8.2 8.2 4.7 5.1
of which: Land and buildings 1.3 1.2 0.9 2.2 1.8 1.6 3.1 2.8 1.0 0.9Inventories 9.8 9.2 2.8 4.7 5.5 5.9 2.8 2.0 11.2 10.5
of which: Finished goods and merchandise 0.7 0.8 0.8 1.1 0.3 0.3 0.5 0.5 0.7 0.8Cash 19.0 16.9 27.6 21.0 21.5 20.7 27.5 27.0 17.5 15.2Receivables 41.3 43.7 38.7 41.5 26.5 24.8 43.0 41.3 41.7 44.8
Short-term 31.0 33.9 38.4 41.2 25.0 23.9 39.9 38.7 29.8 33.5 of which:
Trade receivables 5.4 4.3 17.6 18.4 10.4 9.6 19.1 13.0 2.9 2.7Receivables from affiliated companies 12.6 11.8 10.3 11.8 6.4 6.3 12.7 16.1 12.8 11.3
Long-term 10.3 9.7 0.3 0.3 1.5 0.9 3.1 2.7 11.9 11.3of which: Loans to affiliated companies 9.4 9.0 0.2 0.3 0.3 0.1 2.3 1.7 10.9 10.6
Securities 1.5 1.4 0.0 1.4 0.2 0.5 1.1 3.5 1.6 1.2Other long-term equity investments 18.0 18.9 4.2 4.4 6.8 6.4 12.0 12.8 19.5 20.5
of which: Goodwill 0.8 0.6 0.7 0.5 1.0 0.9 1.4 1.2 0.7 0.5
CapitalEquity 28.1 30.9 27.3 26.0 19.2 17.2 27.6 26.1 28.6 32.2Liabilities 59.7 59.0 62.6 63.0 73.2 75.7 58.4 60.9 59.3 58.0
Short-term 54.9 55.6 54.0 51.6 45.6 49.5 52.0 53.4 55.8 56.2of which:Liabilities to banks 5.0 3.3 7.8 6.6 5.9 10.0 1.7 1.5 5.5 3.2Trade payables 9.5 8.5 17.9 19.8 11.9 11.9 14.9 10.3 8.5 8.0Liabilities to affiliated companies 10.7 14.4 9.3 5.7 6.9 6.6 8.2 10.6 11.3 15.4
Long-term 4.8 3.4 8.6 11.4 27.6 26.2 6.4 7.5 3.6 1.8 of which:
Liabilities to banks 4.1 2.5 6.9 6.5 26.0 24.3 1.6 1.7 3.6 1.8Liabilities to affiliated companies 0.4 0.3 0.8 0.8 1.1 1.4 2.5 2.1 0.0 0.0
Provisions 11.3 9.3 9.1 10.3 6.9 6.4 12.6 10.8 11.4 9.1of which: Provisions for pensions 1.7 1.7 1.3 1.5 2.5 2.6 2.0 2.1 1.6 1.6
Other ratios Percentage of salesAnnual result before taxes on income 2.4 2.2 4.5 0.7 3.4 2.8 4.6 2.3 2.1 2.2Annual result and depreciation 2.2 4.5 10.2 2.8 5.7 6.2 5.5 3.7 1.8 4.5Trade receivables 2.1 1.8 13.0 12.2 6.2 5.8 11.8 8.4 1.1 1.1
Percentage of the balance sheet totalSales 252.3 239.5 135.6 150.8 167.1 163.7 161.4 154.5 270.8 256.2Annual result and interest paid 3.6 7.9 9.6 - 0.2 4.7 4.3 4.8 1.7 3.3 9.1
Percentage of liabilities and provisions less cashAnnual result and depreciation 10.5 20.5 30.6 8.1 16.0 16.3 19.8 12.4 8.9 21.9
Percentage of fixed assetsLong-term equity and liabilities 88.9 93.6 125.6 123.4 105.1 95.6 126.2 126.3 83.8 89.7
Percentage of short-term liabilitiesCash resources and short-term receivables 92.1 93.1 122.2 120.6 102.4 90.5 130.4 128.5 86.0 87.8Cash resources, short-term receivables and inventories 110.0 109.6 127.4 129.6 114.4 102.4 135.8 132.3 106.0 106.4
Percentage of cost of materialsTrade payables 4.6 4.3 42.5 39.2 14.5 14.4 18.5 13.0 3.7 3.6
Memo item:Balance sheet total in € billion 4.57 4.96 0.04 0.04 0.15 0.16 0.58 0.63 3.80 4.13Sales in € billion 11.53 11.87 0.05 0.06 0.25 0.26 0.93 0.98 10.29 10.58Number of enterprises 165 165 65 65 45 45 39 39 16 16

Deutsche BundesbankFinancial statement statistics (ratios - provisional data)
May 2021155
I. Enterprises by economic sector
cont'd: 13.g) Travel agency, tour operator and other reservation service and related activities
cont'd: All legal formsEnterprises with sales of ... € million
Total Less than 2 2 but less than 10 10 but less than 50 50 and moreQuartile Cylindered sample 2018/2019value 2018 2019 2018 2019 2018 2019 2018 2019 2018 2019Of the enterprises captured …
Ratios ... % had a ratio of less than …Percentage of gross revenue
Cost of materials 25 0.0 0.0 0.0 0.0 6.3 7.5 0.2 4.8 75.5 75.7 50 42.2 42.6 0.6 1.3 57.3 55.7 68.2 67.3 82.0 82.7 75 77.0 77.2 49.9 52.1 79.2 80.2 75.8 74.5 90.4 89.9
Personnel expenses 25 8.2 8.8 15.5 14.7 7.9 8.9 8.8 8.6 1.5 1.5 50 19.6 21.6 39.4 41.3 14.6 13.3 18.0 17.8 2.9 3.2 75 45.2 44.9 55.0 57.2 38.1 37.1 34.3 33.2 5.7 5.4
Depreciation 25 0.3 0.3 0.5 0.7 0.2 0.2 0.4 0.5 0.1 0.1 50 1.1 1.1 1.7 1.8 0.8 0.8 1.1 1.2 0.2 0.2 75 3.3 3.2 4.1 3.5 3.6 4.8 2.5 2.2 0.6 1.1
Annual result 25 0.0 0.2 - 0.2 - 1.3 - 0.8 0.2 0.4 0.6 0.1 0.3 50 1.9 2.3 3.4 2.6 1.3 1.3 2.1 2.9 0.9 2.9 75 8.6 6.8 13.9 10.9 4.6 3.6 8.7 8.0 5.4 5.5
Percentage of the balance sheet totalTangible fixed assets 25 1.0 0.7 1.3 0.8 1.0 0.8 1.7 1.4 0.5 0.4
50 3.3 3.4 4.2 6.3 3.2 3.3 4.0 5.4 0.8 0.7 75 17.9 14.5 32.5 29.8 8.8 9.7 9.8 10.6 2.5 1.8
Inventories 25 0.0 0.0 0.0 0.0 0.0 0.0 0.0 0.0 0.4 0.1 50 0.3 0.3 0.0 0.0 1.0 1.1 0.5 0.4 5.0 1.5 75 4.8 5.9 3.1 4.1 4.7 6.2 4.8 4.6 32.4 22.2
Equity 25 7.1 9.0 7.1 9.1 2.5 6.3 10.0 11.4 10.8 11.7 50 18.8 20.2 22.1 23.3 15.3 15.4 20.4 24.3 15.9 15.6 75 39.9 43.5 45.3 51.8 26.1 28.6 37.0 41.1 40.5 47.0
Short-term liabilities 25 35.6 31.6 33.3 25.3 36.9 44.9 35.1 31.6 45.6 43.4 50 57.3 58.4 55.8 58.3 59.1 62.1 53.5 55.4 60.3 63.6 75 76.9 76.4 81.0 79.9 82.6 79.6 69.6 65.4 80.9 80.7
Liabilities to banks 25 0.0 0.0 0.0 0.0 0.0 0.0 0.0 0.0 0.0 0.0 50 0.0 0.0 0.0 0.0 0.0 0.0 0.0 0.0 0.0 0.0 75 8.5 6.3 11.6 11.6 9.9 15.2 2.2 0.8 9.3 6.2
Percentage of salesAnnual result before taxes on income 25 0.0 0.3 - 0.2 - 0.6 - 0.5 0.3 0.6 0.9 0.3 0.3
50 2.6 2.4 4.0 3.7 1.9 1.9 2.9 3.9 1.6 1.5 75 10.5 8.8 14.4 14.6 6.5 5.0 12.0 11.2 8.0 7.1
Annual result and depreciation 25 1.7 1.5 3.3 1.8 1.1 1.1 1.9 2.4 0.5 0.5 50 5.7 5.1 7.4 7.5 4.1 3.9 5.7 5.0 1.7 1.9 75 14.8 14.0 18.7 15.4 10.7 10.2 16.0 12.1 8.4 7.7
Trade receivables 25 0.3 0.3 0.0 0.0 0.1 0.2 0.5 0.5 0.3 0.3 50 2.0 2.0 5.1 3.1 3.1 2.7 1.2 1.1 0.5 0.7 75 10.2 9.2 11.3 11.8 10.2 8.6 10.3 6.9 1.2 1.4
Percentage of the balance sheet totalAnnual result and interest paid 25 0.6 1.7 0.0 0.0 - 0.9 1.5 2.1 2.3 1.0 2.5
50 5.0 5.3 7.7 6.0 4.2 3.8 6.8 8.1 4.3 6.5 75 14.6 15.0 24.2 23.7 11.3 9.8 12.0 15.4 9.3 13.6
Percentage of liabilities and provisions less cashAnnual result and depreciation 25 - 0.2 0.2 - 11.7 - 28.0 3.2 3.1 2.0 10.2 3.2 0.5
50 17.5 15.9 15.7 12.9 17.1 15.6 26.1 29.7 10.2 6.2 75 50.3 43.1 49.2 36.8 30.2 36.5 79.3 76.3 47.7 16.0
Percentage of fixed assetsLong-term equity and liabilities 25 72.7 84.7 64.3 75.6 72.8 89.6 67.9 75.2 85.5 86.4
50 139.1 155.0 140.0 150.0 176.2 204.6 138.3 137.2 131.7 205.8 75 451.7 522.1 551.5 537.5 505.1 860.1 280.0 227.1 408.6 382.3
Percentage of short-term liabilitiesCash resources and short-term receivables 25 78.8 85.2 87.0 93.2 71.3 62.6 97.4 96.8 51.0 75.3
50 118.7 110.8 122.6 113.5 104.7 103.0 127.4 139.0 99.0 92.3 75 173.2 203.9 177.3 221.7 147.7 142.6 208.3 219.8 131.2 129.6
Percentage of cost of materialsTrade payables 25 3.1 2.5 5.3 2.7 4.4 3.7 1.7 1.8 2.2 3.7
50 8.1 7.8 13.4 11.8 11.6 11.1 6.9 7.2 4.6 4.1 75 26.5 24.4 126.5 63.2 24.1 19.6 17.9 17.3 5.7 6.0

Deutsche BundesbankFinancial statement statistics (ratios - provisional data)May 2021156
I. Enterprises by economic sector
13.h) Services to buildings and landscape activities
All legal formsEnterprises with sales of ... € million
Total Less than 2 2 but less than 10 10 but less than 50 50 and moreCylindered sample 2018/2019
Ratios 2018 2019 2018 2019 2018 2019 2018 2019 2018 2019Income statementIncome Percentage of gross revenueSales 99.1 99.8 100.0 98.0 98.0 98.0 98.7 100.5 99.7 99.9Change in finished goods 0.9 0.2 0.0 2.0 2.0 2.0 1.3 - 0.5 0.3 0.1Interest and similar income 0.1 0.1 0.1 0.1 0.1 0.1 0.1 0.1 0.0 0.1Other income 1.7 1.7 3.3 3.4 2.0 1.8 1.7 1.5 1.5 1.8
of which: Income from long-term equity investments 0.2 0.2 0.0 0.0 0.2 0.0 0.2 0.2 0.3 0.3Total income 101.8 101.8 103.4 103.4 102.1 101.9 101.7 101.6 101.6 101.8
ExpensesCost of materials 30.6 30.7 22.3 24.1 28.9 29.7 27.1 27.2 34.6 34.6Personnel expenses 53.3 53.1 49.8 48.4 49.5 48.6 57.8 57.5 51.0 51.2Depreciation 1.7 1.7 3.6 3.6 2.8 2.7 1.7 1.7 1.3 1.2
of which: Depreciation of tangible fixed assets 1.7 1.6 3.6 3.5 2.6 2.6 1.7 1.6 1.2 1.1Interest and similar expenses 0.3 0.3 0.6 0.5 0.6 0.5 0.4 0.4 0.2 0.2Operating taxes 0.1 0.1 0.2 0.2 0.1 0.1 0.1 0.1 0.1 0.1Other expenses 12.5 12.2 19.7 18.5 15.7 15.0 11.5 11.3 11.7 11.7Total expenses before taxes on income 98.5 98.1 96.2 95.3 97.5 96.5 98.6 98.0 98.9 98.8Annual result before taxes on income 3.3 3.7 7.2 8.1 4.6 5.4 3.2 3.6 2.7 3.0Taxes on income 0.6 0.7 1.4 1.6 1.2 1.2 0.8 0.9 0.2 0.2Annual result 2.7 3.1 5.8 6.6 3.4 4.1 2.4 2.7 2.5 2.8Profit and loss transfers (parent company) 0.3 0.2 0.0 0.0 0.1 0.1 0.2 0.2 0.4 0.3Profit and loss transfers (subsidiary) 0.9 1.1 0.3 0.3 0.6 0.7 0.7 0.7 1.3 1.7Profit for the year 2.0 2.1 5.5 6.3 3.0 3.6 1.9 2.2 1.6 1.3
Balance sheetAssets Percentage of the balance sheet totalIntangible fixed assets 0.5 0.5 0.3 0.3 0.3 0.3 0.7 0.7 0.5 0.6Tangible fixed assets 21.2 20.6 32.7 31.8 25.1 24.1 23.5 23.2 14.4 13.7
of which: Land and buildings 7.7 7.6 6.4 5.8 8.5 7.5 10.4 11.1 4.0 3.5Inventories 16.5 16.2 15.9 18.3 29.3 30.6 16.6 14.7 8.6 8.5
of which: Finished goods and merchandise 1.3 1.2 1.1 1.2 1.6 1.2 0.4 0.4 2.4 2.1Cash 9.3 11.3 17.3 18.2 12.3 13.1 10.9 14.0 4.5 6.1Receivables 46.5 44.9 31.3 29.2 30.4 29.4 42.8 42.0 62.7 60.3
Short-term 46.0 44.4 30.9 28.8 29.8 28.8 42.3 41.5 62.3 60.0 of which:
Trade receivables 26.0 24.8 19.2 17.1 18.8 18.0 23.9 23.2 33.7 32.2Receivables from affiliated companies 16.9 16.1 5.6 5.9 7.4 7.3 15.5 14.6 25.9 25.0
Long-term 0.5 0.5 0.4 0.4 0.6 0.6 0.5 0.6 0.4 0.3of which: Loans to affiliated companies 0.3 0.3 0.1 0.1 0.2 0.3 0.4 0.4 0.4 0.3
Securities 0.1 0.1 0.1 0.1 0.3 0.4 0.1 0.1 0.1 0.0Other long-term equity investments 5.5 5.9 1.6 1.4 1.7 1.5 5.1 5.0 8.8 10.5
of which: Goodwill 0.8 0.8 1.2 1.0 0.4 0.3 0.4 0.7 1.5 1.3
CapitalEquity 23.4 24.9 25.4 29.5 23.2 24.0 24.8 28.0 21.4 20.9Liabilities 60.6 59.1 66.1 62.0 67.4 67.3 60.5 56.5 55.9 56.8
Short-term 50.2 48.9 49.9 46.8 54.8 55.5 47.9 45.1 50.4 49.6of which:Liabilities to banks 4.2 3.5 9.3 8.3 6.9 5.8 3.6 3.6 2.5 1.3Trade payables 8.6 8.0 10.2 8.5 7.4 6.6 7.6 7.6 10.5 9.4Liabilities to affiliated companies 15.5 15.6 5.0 3.9 6.2 6.4 11.4 11.0 27.5 28.6
Long-term 10.4 10.3 16.2 15.2 12.6 11.8 12.6 11.4 5.5 7.2 of which:
Liabilities to banks 4.8 4.5 12.6 11.4 6.9 7.1 5.8 5.4 1.1 0.7Liabilities to affiliated companies 4.3 4.6 1.7 1.6 3.3 2.6 5.9 5.5 3.4 5.2
Provisions 15.4 15.5 8.4 8.3 9.2 8.6 13.8 14.7 22.1 21.9of which: Provisions for pensions 2.4 2.5 0.4 0.4 1.8 1.7 2.9 3.1 2.4 2.6
Other ratios Percentage of salesAnnual result before taxes on income 3.3 3.8 7.2 8.3 4.7 5.5 3.2 3.5 2.7 3.0Annual result and depreciation 4.5 4.7 9.4 10.3 6.3 6.9 4.1 4.3 3.8 3.9Trade receivables 9.3 9.0 8.9 8.1 9.8 9.7 9.5 8.9 9.0 8.8
Percentage of the balance sheet totalSales 279.1 277.2 214.6 210.2 192.0 186.0 251.5 260.3 374.0 365.1Annual result and interest paid 8.5 9.4 13.7 15.2 7.8 8.8 7.1 7.9 10.0 10.7
Percentage of liabilities and provisions less cashAnnual result and depreciation 18.5 20.6 35.1 41.5 18.8 20.5 16.1 19.3 19.3 19.7
Percentage of fixed assetsLong-term equity and liabilities 130.1 136.0 119.8 133.3 134.7 140.1 134.7 143.9 121.9 122.4
Percentage of short-term liabilitiesCash resources and short-term receivables 110.2 114.1 96.8 100.4 76.8 75.7 111.1 123.1 132.6 133.2Cash resources, short-term receivables and inventories 142.9 147.2 128.7 139.5 130.3 130.9 145.7 155.6 149.7 150.4
Percentage of cost of materialsTrade payables 10.0 9.4 21.3 16.4 13.0 11.7 11.1 10.7 8.1 7.4
Memo item:Balance sheet total in € billion 2.82 3.03 0.12 0.14 0.58 0.64 1.17 1.23 0.95 1.01Sales in € billion 7.88 8.39 0.26 0.29 1.10 1.20 2.95 3.21 3.56 3.69Number of enterprises 736 736 324 324 253 253 139 139 20 20

Deutsche BundesbankFinancial statement statistics (ratios - provisional data)
May 2021157
I. Enterprises by economic sector
cont'd: 13.i) Services to buildings and landscape activities
cont'd: All legal formsEnterprises with sales of ... € million
Total Less than 2 2 but less than 10 10 but less than 50 50 and moreQuartile Cylindered sample 2018/2019value 2018 2019 2018 2019 2018 2019 2018 2019 2018 2019Of the enterprises captured …
Ratios ... % had a ratio of less than …Percentage of gross revenue
Cost of materials 25 7.7 7.7 6.0 6.5 9.0 9.1 7.9 7.4 7.9 7.1 50 20.7 21.2 17.1 18.4 27.4 27.9 20.7 21.4 21.4 21.0 75 38.8 39.2 32.7 33.8 42.3 42.6 44.4 43.1 49.4 51.1
Personnel expenses 25 33.4 33.1 33.5 32.4 33.4 33.8 32.5 33.6 37.0 37.1 50 49.8 49.0 47.6 46.3 49.0 47.2 62.9 63.9 51.4 52.2 75 69.2 69.1 65.8 63.9 67.3 66.9 78.2 78.1 74.3 76.6
Depreciation 25 0.9 0.9 1.4 1.5 1.0 0.8 0.6 0.6 0.6 0.6 50 2.2 2.1 3.1 3.1 2.0 1.9 1.2 1.0 1.2 1.2 75 4.2 4.1 5.4 5.2 3.7 3.7 2.4 2.3 1.9 1.8
Annual result 25 0.6 1.0 1.0 2.2 0.4 1.0 0.2 0.2 1.6 1.7 50 2.7 3.4 4.0 5.1 2.3 2.8 1.6 1.5 2.5 2.3 75 6.7 7.4 10.1 10.1 5.8 6.2 3.9 4.1 3.7 4.0
Percentage of the balance sheet totalTangible fixed assets 25 7.5 7.9 10.3 9.6 7.0 6.5 6.5 7.4 3.9 3.4
50 19.6 19.2 26.8 27.1 15.5 17.1 14.8 14.6 13.8 13.2 75 39.5 37.3 48.5 46.3 35.3 34.0 28.2 28.0 29.6 26.6
Inventories 25 0.0 0.0 0.0 0.0 0.4 0.5 0.2 0.2 0.4 0.4 50 1.7 1.9 0.9 1.4 4.3 4.5 1.3 1.3 1.5 2.0 75 13.5 14.8 9.3 9.6 34.8 33.3 5.6 4.9 5.8 7.4
Equity 25 6.5 8.8 5.1 11.1 6.7 7.7 8.7 9.2 6.6 9.1 50 23.5 26.4 27.2 31.2 22.0 24.2 22.3 26.4 15.7 13.3 75 43.9 47.2 49.6 53.1 42.4 45.6 41.5 45.3 28.0 20.8
Short-term liabilities 25 28.3 25.5 23.3 19.7 31.5 28.7 33.3 31.7 41.7 36.1 50 46.7 45.1 42.2 39.2 51.7 50.4 48.4 47.2 46.8 50.9 75 69.5 65.3 70.3 62.7 69.9 70.6 67.2 63.5 66.8 67.3
Liabilities to banks 25 0.0 0.0 0.0 0.0 0.0 0.0 0.0 0.0 0.0 0.0 50 5.6 5.1 11.7 9.6 6.9 6.6 0.0 0.0 0.0 0.0 75 24.3 21.8 35.3 32.7 20.8 20.5 7.7 8.1 0.1 0.0
Percentage of salesAnnual result before taxes on income 25 0.7 1.4 1.4 3.1 0.6 1.1 0.3 0.4 1.8 1.8
50 3.5 4.5 5.1 6.2 3.1 3.8 2.3 2.1 2.9 2.7 75 8.7 9.6 11.5 13.1 7.3 8.0 5.6 5.6 3.8 4.7
Annual result and depreciation 25 2.5 3.4 3.6 5.7 2.8 3.4 1.4 1.7 2.3 2.7 50 6.3 7.2 8.9 10.3 5.9 6.5 3.9 3.4 4.4 3.9 75 12.5 13.6 16.6 17.5 10.7 11.6 6.6 7.2 6.0 6.3
Trade receivables 25 3.2 2.8 3.2 2.9 3.9 3.4 0.9 1.2 4.9 5.0 50 8.1 7.8 7.0 6.9 8.9 8.3 9.7 8.8 11.6 12.1 75 12.8 12.7 11.2 11.5 13.3 13.0 13.3 13.1 13.8 13.2
Percentage of the balance sheet totalAnnual result and interest paid 25 2.8 3.9 4.4 5.7 2.4 3.2 1.5 2.2 5.5 5.9
50 7.7 9.8 10.3 13.7 6.4 7.8 6.2 7.1 12.3 10.9 75 17.0 19.0 23.1 25.2 13.4 14.5 12.3 12.4 17.9 16.8
Percentage of liabilities and provisions less cashAnnual result and depreciation 25 7.0 9.0 7.4 8.9 5.1 9.3 7.7 8.4 17.3 14.8
50 21.8 25.9 26.6 35.7 17.6 21.1 16.4 20.1 25.3 24.6 75 52.5 61.2 84.4 85.5 40.6 52.0 34.2 39.3 30.9 34.7
Percentage of fixed assetsLong-term equity and liabilities 25 76.8 85.0 60.9 77.6 89.4 91.8 95.9 98.1 33.7 39.5
50 137.8 156.1 112.2 141.7 152.8 168.3 155.0 193.0 108.2 131.2 75 274.1 323.9 245.8 298.0 320.9 378.9 278.3 323.0 203.1 209.9
Percentage of short-term liabilitiesCash resources and short-term receivables 25 66.1 70.8 63.9 65.0 51.0 54.9 94.4 101.4 100.2 100.4
50 125.0 131.5 127.8 144.0 116.3 114.5 139.0 151.3 121.0 122.9 75 228.2 246.8 268.1 306.3 198.3 200.9 214.3 235.5 164.7 199.4
Percentage of cost of materialsTrade payables 25 6.3 5.3 5.2 4.3 6.8 5.7 7.1 5.3 6.9 6.7
50 12.4 10.8 13.2 11.6 12.9 9.7 11.1 10.6 10.0 9.0 75 24.9 22.0 40.0 29.8 21.9 19.4 17.0 17.6 15.8 16.1
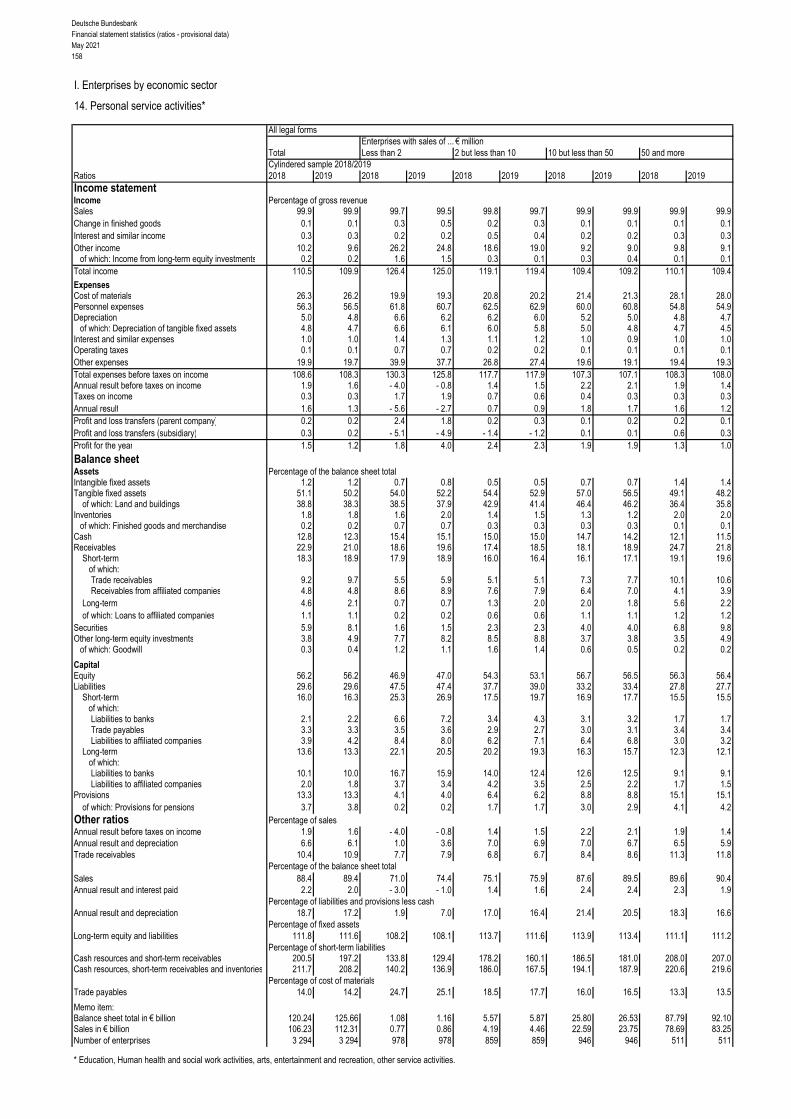
Deutsche BundesbankFinancial statement statistics (ratios - provisional data)May 2021158
I. Enterprises by economic sector
14. Personal service activities*
All legal formsEnterprises with sales of ... € million
Total Less than 2 2 but less than 10 10 but less than 50 50 and moreCylindered sample 2018/2019
Ratios 2018 2019 2018 2019 2018 2019 2018 2019 2018 2019Income statementIncome Percentage of gross revenueSales 99.9 99.9 99.7 99.5 99.8 99.7 99.9 99.9 99.9 99.9Change in finished goods 0.1 0.1 0.3 0.5 0.2 0.3 0.1 0.1 0.1 0.1Interest and similar income 0.3 0.3 0.2 0.2 0.5 0.4 0.2 0.2 0.3 0.3Other income 10.2 9.6 26.2 24.8 18.6 19.0 9.2 9.0 9.8 9.1
of which: Income from long-term equity investments 0.2 0.2 1.6 1.5 0.3 0.1 0.3 0.4 0.1 0.1Total income 110.5 109.9 126.4 125.0 119.1 119.4 109.4 109.2 110.1 109.4
ExpensesCost of materials 26.3 26.2 19.9 19.3 20.8 20.2 21.4 21.3 28.1 28.0Personnel expenses 56.3 56.5 61.8 60.7 62.5 62.9 60.0 60.8 54.8 54.9Depreciation 5.0 4.8 6.6 6.2 6.2 6.0 5.2 5.0 4.8 4.7
of which: Depreciation of tangible fixed assets 4.8 4.7 6.6 6.1 6.0 5.8 5.0 4.8 4.7 4.5Interest and similar expenses 1.0 1.0 1.4 1.3 1.1 1.2 1.0 0.9 1.0 1.0Operating taxes 0.1 0.1 0.7 0.7 0.2 0.2 0.1 0.1 0.1 0.1Other expenses 19.9 19.7 39.9 37.7 26.8 27.4 19.6 19.1 19.4 19.3Total expenses before taxes on income 108.6 108.3 130.3 125.8 117.7 117.9 107.3 107.1 108.3 108.0Annual result before taxes on income 1.9 1.6 - 4.0 - 0.8 1.4 1.5 2.2 2.1 1.9 1.4Taxes on income 0.3 0.3 1.7 1.9 0.7 0.6 0.4 0.3 0.3 0.3Annual result 1.6 1.3 - 5.6 - 2.7 0.7 0.9 1.8 1.7 1.6 1.2Profit and loss transfers (parent company) 0.2 0.2 2.4 1.8 0.2 0.3 0.1 0.2 0.2 0.1Profit and loss transfers (subsidiary) 0.3 0.2 - 5.1 - 4.9 - 1.4 - 1.2 0.1 0.1 0.6 0.3Profit for the year 1.5 1.2 1.8 4.0 2.4 2.3 1.9 1.9 1.3 1.0
Balance sheetAssets Percentage of the balance sheet totalIntangible fixed assets 1.2 1.2 0.7 0.8 0.5 0.5 0.7 0.7 1.4 1.4Tangible fixed assets 51.1 50.2 54.0 52.2 54.4 52.9 57.0 56.5 49.1 48.2
of which: Land and buildings 38.8 38.3 38.5 37.9 42.9 41.4 46.4 46.2 36.4 35.8Inventories 1.8 1.8 1.6 2.0 1.4 1.5 1.3 1.2 2.0 2.0
of which: Finished goods and merchandise 0.2 0.2 0.7 0.7 0.3 0.3 0.3 0.3 0.1 0.1Cash 12.8 12.3 15.4 15.1 15.0 15.0 14.7 14.2 12.1 11.5Receivables 22.9 21.0 18.6 19.6 17.4 18.5 18.1 18.9 24.7 21.8
Short-term 18.3 18.9 17.9 18.9 16.0 16.4 16.1 17.1 19.1 19.6 of which:
Trade receivables 9.2 9.7 5.5 5.9 5.1 5.1 7.3 7.7 10.1 10.6Receivables from affiliated companies 4.8 4.8 8.6 8.9 7.6 7.9 6.4 7.0 4.1 3.9
Long-term 4.6 2.1 0.7 0.7 1.3 2.0 2.0 1.8 5.6 2.2of which: Loans to affiliated companies 1.1 1.1 0.2 0.2 0.6 0.6 1.1 1.1 1.2 1.2
Securities 5.9 8.1 1.6 1.5 2.3 2.3 4.0 4.0 6.8 9.8Other long-term equity investments 3.8 4.9 7.7 8.2 8.5 8.8 3.7 3.8 3.5 4.9
of which: Goodwill 0.3 0.4 1.2 1.1 1.6 1.4 0.6 0.5 0.2 0.2
CapitalEquity 56.2 56.2 46.9 47.0 54.3 53.1 56.7 56.5 56.3 56.4Liabilities 29.6 29.6 47.5 47.4 37.7 39.0 33.2 33.4 27.8 27.7
Short-term 16.0 16.3 25.3 26.9 17.5 19.7 16.9 17.7 15.5 15.5of which:Liabilities to banks 2.1 2.2 6.6 7.2 3.4 4.3 3.1 3.2 1.7 1.7Trade payables 3.3 3.3 3.5 3.6 2.9 2.7 3.0 3.1 3.4 3.4Liabilities to affiliated companies 3.9 4.2 8.4 8.0 6.2 7.1 6.4 6.8 3.0 3.2
Long-term 13.6 13.3 22.1 20.5 20.2 19.3 16.3 15.7 12.3 12.1 of which:
Liabilities to banks 10.1 10.0 16.7 15.9 14.0 12.4 12.6 12.5 9.1 9.1Liabilities to affiliated companies 2.0 1.8 3.7 3.4 4.2 3.5 2.5 2.2 1.7 1.5
Provisions 13.3 13.3 4.1 4.0 6.4 6.2 8.8 8.8 15.1 15.1of which: Provisions for pensions 3.7 3.8 0.2 0.2 1.7 1.7 3.0 2.9 4.1 4.2
Other ratios Percentage of salesAnnual result before taxes on income 1.9 1.6 - 4.0 - 0.8 1.4 1.5 2.2 2.1 1.9 1.4Annual result and depreciation 6.6 6.1 1.0 3.6 7.0 6.9 7.0 6.7 6.5 5.9Trade receivables 10.4 10.9 7.7 7.9 6.8 6.7 8.4 8.6 11.3 11.8
Percentage of the balance sheet totalSales 88.4 89.4 71.0 74.4 75.1 75.9 87.6 89.5 89.6 90.4Annual result and interest paid 2.2 2.0 - 3.0 - 1.0 1.4 1.6 2.4 2.4 2.3 1.9
Percentage of liabilities and provisions less cashAnnual result and depreciation 18.7 17.2 1.9 7.0 17.0 16.4 21.4 20.5 18.3 16.6
Percentage of fixed assetsLong-term equity and liabilities 111.8 111.6 108.2 108.1 113.7 111.6 113.9 113.4 111.1 111.2
Percentage of short-term liabilitiesCash resources and short-term receivables 200.5 197.2 133.8 129.4 178.2 160.1 186.5 181.0 208.0 207.0Cash resources, short-term receivables and inventories 211.7 208.2 140.2 136.9 186.0 167.5 194.1 187.9 220.6 219.6
Percentage of cost of materialsTrade payables 14.0 14.2 24.7 25.1 18.5 17.7 16.0 16.5 13.3 13.5
Memo item:Balance sheet total in € billion 120.24 125.66 1.08 1.16 5.57 5.87 25.80 26.53 87.79 92.10Sales in € billion 106.23 112.31 0.77 0.86 4.19 4.46 22.59 23.75 78.69 83.25Number of enterprises 3 294 3 294 978 978 859 859 946 946 511 511
* Education, Human health and social work activities, arts, entertainment and recreation, other service activities.

Deutsche BundesbankFinancial statement statistics (ratios - provisional data)
May 2021159
I. Enterprises by economic sector
cont'd: 14. Personal service activities*
cont'd: All legal formsEnterprises with sales of ... € million
Total Less than 2 2 but less than 10 10 but less than 50 50 and moreQuartile Cylindered sample 2018/2019value 2018 2019 2018 2019 2018 2019 2018 2019 2018 2019Of the enterprises captured …
Ratios ... % had a ratio of less than …Percentage of gross revenue
Cost of materials 25 5.6 5.3 1.0 1.1 5.8 6.0 9.9 10.0 16.2 16.0 50 15.6 15.3 7.3 6.7 14.3 13.6 17.1 17.1 23.9 24.1 75 27.6 27.1 22.7 23.2 27.8 27.0 26.1 25.9 29.7 30.3
Personnel expenses 25 39.4 39.1 26.1 25.5 40.0 40.4 49.7 50.9 53.1 53.0 50 57.8 58.7 45.1 43.9 56.9 57.7 62.4 63.1 61.0 61.8 75 69.6 70.3 66.2 66.1 70.6 71.6 71.6 72.7 68.5 68.8
Depreciation 25 1.5 1.4 1.0 1.0 1.0 1.0 1.9 1.9 2.6 2.4 50 3.6 3.5 2.8 2.8 2.9 2.8 3.9 3.8 4.3 4.2 75 6.6 6.3 7.4 6.9 7.0 6.7 6.4 6.1 6.1 6.1
Annual result 25 - 0.6 0.0 - 3.8 0.0 - 0.1 0.0 0.0 0.0 - 0.1 - 0.4 50 1.7 2.0 2.5 4.5 1.9 2.0 1.7 1.7 1.0 0.9 75 6.1 6.6 9.9 11.9 6.9 6.6 4.9 4.8 2.9 2.5
Percentage of the balance sheet totalTangible fixed assets 25 10.4 10.4 4.6 4.4 7.3 7.2 19.2 19.1 29.7 30.8
50 36.2 35.5 18.8 19.1 26.5 25.0 49.5 49.9 52.9 52.9 75 66.3 65.0 52.0 50.0 64.6 63.6 71.4 70.4 68.8 68.4
Inventories 25 0.0 0.0 0.0 0.0 0.0 0.0 0.1 0.1 0.3 0.3 50 0.3 0.3 0.0 0.0 0.2 0.2 0.4 0.4 1.8 1.7 75 2.2 2.2 2.2 2.3 1.4 1.4 1.7 1.7 3.3 3.3
Equity 25 18.8 20.2 1.0 5.7 16.5 16.3 33.2 32.6 38.6 38.6 50 47.2 48.5 30.0 34.8 44.4 45.4 54.4 55.3 55.8 56.6 75 69.8 69.8 62.1 64.5 70.6 71.2 72.6 72.7 70.3 69.9
Short-term liabilities 25 8.1 8.3 11.8 12.5 7.8 8.1 6.6 6.8 8.5 8.8 50 17.3 17.6 31.5 28.4 18.0 18.6 12.1 12.5 14.4 15.0 75 40.0 40.0 64.4 60.0 39.7 43.1 26.8 28.0 24.2 24.9
Liabilities to banks 25 0.0 0.0 0.0 0.0 0.0 0.0 0.0 0.0 0.0 0.0 50 2.0 2.0 0.0 0.0 0.1 0.0 3.3 3.3 5.4 5.2 75 22.8 22.2 33.9 32.4 22.6 20.3 22.1 21.3 16.5 16.7
Percentage of salesAnnual result before taxes on income 25 - 0.5 0.0 - 3.6 0.1 - 0.1 0.0 0.0 0.0 - 0.1 - 0.4
50 1.9 2.2 3.0 5.4 2.3 2.6 1.9 1.8 1.0 0.9 75 6.8 7.6 12.0 13.6 7.8 7.9 5.3 5.2 3.0 2.7
Annual result and depreciation 25 1.9 2.4 0.0 2.5 1.8 1.8 2.8 2.8 2.8 2.4 50 6.3 6.6 7.2 9.6 6.7 6.7 6.2 6.1 5.8 5.2 75 12.7 13.2 17.8 19.7 13.9 13.5 10.8 10.7 8.2 7.9
Trade receivables 25 1.6 1.6 0.4 0.3 1.4 1.3 2.5 2.4 6.1 6.3 50 6.1 6.1 3.8 3.9 4.8 4.6 6.6 6.8 11.5 12.0 75 12.2 12.5 10.7 10.9 10.3 10.1 11.8 12.4 15.5 16.4
Percentage of the balance sheet totalAnnual result and interest paid 25 - 0.1 0.4 - 5.4 0.8 0.1 0.4 0.4 0.4 0.3 0.1
50 2.9 3.4 5.0 9.0 3.4 4.1 2.6 2.6 1.7 1.6 75 9.8 11.4 20.3 25.5 12.1 12.4 6.6 6.4 4.0 3.6
Percentage of liabilities and provisions less cashAnnual result and depreciation 25 - 11.0 - 8.3 - 26.1 - 18.8 - 15.1 - 14.3 - 6.3 - 9.3 6.8 5.5
50 12.4 14.1 8.7 17.0 10.8 11.7 13.4 13.3 16.5 16.2 75 40.4 45.1 47.5 59.7 37.7 46.1 40.3 39.4 34.9 33.7
Percentage of fixed assetsLong-term equity and liabilities 25 92.6 94.8 59.7 72.1 94.4 94.6 99.1 99.0 100.2 100.3
50 121.1 122.7 123.2 137.1 132.2 136.3 123.6 121.1 114.6 114.9 75 225.0 240.2 390.9 466.7 321.9 342.0 185.2 180.2 140.4 142.4
Percentage of short-term liabilitiesCash resources and short-term receivables 25 104.5 110.6 62.5 69.6 111.9 109.1 128.7 132.0 143.3 146.9
50 215.7 219.9 145.5 168.3 234.1 229.0 270.2 269.0 223.7 220.7 75 490.5 471.3 410.1 438.5 557.1 572.2 548.4 503.1 357.9 355.9
Percentage of cost of materialsTrade payables 25 7.3 7.2 5.9 5.8 7.2 6.8 7.7 7.7 8.2 8.1
50 14.0 13.9 17.1 17.7 14.7 13.8 13.0 13.4 12.2 12.9 75 30.8 30.1 57.7 58.3 30.8 30.0 25.3 25.1 19.8 21.0
* Education, Human health and social work activities, arts, entertainment and recreation, other service activities.

Deutsche BundesbankFinancial statement statistics (ratios - provisional data)May 2021160
I. Enterprises by economic sector
14.a) Education
All legal formsEnterprises with sales of ... € million
Total Less than 2 2 but less than 10 10 but less than 50 50 and moreCylindered sample 2018/2019
Ratios 2018 2019 2018 2019 2018 2019 2018 2019 2018 2019Income statementIncome Percentage of gross revenueSales 99.7 99.9 100.1 99.2 99.8 99.6 99.7 99.9 99.7 100.1Change in finished goods 0.3 0.1 - 0.1 0.8 0.2 0.4 0.3 0.1 0.3 - 0.1Interest and similar income 0.3 0.3 0.4 0.3 0.2 0.1 0.3 0.3 0.3 0.2Other income 15.8 6.9 41.8 40.0 21.4 24.0 8.4 5.1 21.1 3.6
of which: Income from long-term equity investments 0.0 0.1 0.0 0.3 0.0 0.0 0.1 0.2 0.0 0.1Total income 116.1 107.2 142.3 140.3 121.6 124.2 108.7 105.4 121.4 103.8
ExpensesCost of materials 16.0 14.5 15.0 15.1 16.1 16.3 16.8 16.3 15.3 12.6Personnel expenses 63.8 59.6 71.2 71.5 69.9 71.2 57.3 57.1 68.8 58.9Depreciation 4.6 4.1 4.4 3.7 5.2 5.1 4.8 4.5 4.3 3.6
of which: Depreciation of tangible fixed assets 4.5 4.0 4.2 3.6 5.2 5.0 4.7 4.4 4.2 3.5Interest and similar expenses 4.7 4.3 0.7 0.7 0.5 0.5 1.2 1.0 9.6 8.3Operating taxes 0.0 0.0 0.1 0.1 0.2 0.1 0.0 0.0 0.0 0.0Other expenses 24.4 22.3 49.2 44.5 27.0 28.2 24.2 22.9 22.7 19.6Total expenses before taxes on income 113.6 104.9 140.6 135.7 118.9 121.4 104.4 101.9 120.7 103.0Annual result before taxes on income 2.5 2.2 1.7 4.7 2.7 2.8 4.3 3.5 0.6 0.8Taxes on income 0.4 0.4 1.2 1.4 0.6 0.8 0.6 0.6 0.1 0.1Annual result 2.2 1.8 0.5 3.3 2.1 2.0 3.7 2.9 0.6 0.8Profit and loss transfers (parent company) 0.0 0.0 0.0 0.0 0.0 0.0 0.0 0.0 0.0 0.0Profit and loss transfers (subsidiary) 0.0 - 0.2 - 0.1 0.0 0.2 0.1 0.2 - 0.4 - 0.2 - 0.1Profit for the year 2.1 2.1 0.6 3.3 1.9 1.9 3.6 3.3 0.8 0.9
Balance sheetAssets Percentage of the balance sheet totalIntangible fixed assets 1.0 1.0 1.0 1.2 0.6 0.6 1.6 1.5 0.4 0.4Tangible fixed assets 43.4 42.7 26.8 24.3 56.5 54.9 47.7 47.3 33.7 33.3
of which: Land and buildings 29.7 29.8 15.7 13.2 46.5 44.1 37.5 38.4 13.6 14.0Inventories 1.5 1.5 0.9 2.7 2.0 2.2 0.8 0.7 2.5 2.3
of which: Finished goods and merchandise 0.3 0.3 0.3 1.5 0.1 0.1 0.1 0.1 0.6 0.7Cash 23.0 22.4 26.0 25.9 20.4 20.2 21.6 20.2 25.8 26.0Receivables 21.9 22.8 31.9 32.5 16.4 17.7 22.9 24.4 21.8 22.0
Short-term 18.8 20.4 30.5 30.3 15.0 16.4 17.5 20.1 21.4 21.7 of which:
Trade receivables 7.5 7.7 10.5 11.0 5.2 5.7 7.0 7.6 8.7 8.5Receivables from affiliated companies 6.4 7.5 9.2 7.5 5.2 5.7 8.3 10.3 4.1 4.3
Long-term 3.1 2.4 1.4 2.2 1.4 1.2 5.4 4.3 0.5 0.3of which: Loans to affiliated companies 0.7 1.1 0.1 1.0 0.6 0.4 1.1 2.0 0.3 0.1
Securities 7.0 7.1 7.3 7.1 1.8 1.9 4.2 4.4 12.7 12.7Other long-term equity investments 1.4 1.6 5.0 4.8 1.9 2.0 0.5 0.8 2.4 2.4
of which: Goodwill 0.1 0.0 0.5 0.2 0.0 0.0 0.1 0.1 0.0 0.0
CapitalEquity 60.3 59.6 52.4 50.1 60.7 59.3 64.5 63.7 54.7 54.7Liabilities 20.8 21.1 38.1 39.7 28.9 29.8 16.6 17.4 22.8 22.0
Short-term 14.9 15.3 23.8 27.1 18.8 18.8 11.4 11.8 17.9 18.0of which:Liabilities to banks 2.1 1.7 5.3 5.8 2.9 2.5 2.7 2.1 0.8 0.7Trade payables 2.7 2.6 5.9 8.9 2.5 2.4 2.4 2.3 3.0 2.8Liabilities to affiliated companies 2.0 2.1 5.3 4.5 4.7 4.4 1.4 1.9 1.6 1.4
Long-term 5.9 5.9 14.3 12.7 10.1 11.0 5.2 5.6 4.9 4.0 of which:
Liabilities to banks 4.0 4.1 9.4 6.9 4.5 5.3 4.2 4.6 3.2 2.8Liabilities to affiliated companies 1.2 1.1 3.5 4.6 2.6 3.0 0.5 0.4 1.5 1.1
Provisions 16.7 16.8 5.6 5.7 7.0 7.3 16.1 15.9 21.5 22.1of which: Provisions for pensions 8.5 8.5 0.3 0.2 1.4 1.5 9.9 9.8 9.6 9.8
Other ratios Percentage of salesAnnual result before taxes on income 2.5 2.2 1.7 4.7 2.7 2.8 4.3 3.5 0.6 0.8Annual result and depreciation 6.8 6.0 4.9 7.0 7.3 7.1 8.6 7.4 4.9 4.3Trade receivables 7.3 6.8 9.6 9.7 6.3 6.7 7.5 7.8 7.2 5.8
Percentage of the balance sheet totalSales 102.5 114.0 109.6 112.8 82.6 84.8 93.5 97.5 121.5 146.8Annual result and interest paid 7.0 7.1 1.3 4.6 2.2 2.1 4.7 3.8 12.4 13.3
Percentage of liabilities and provisions less cashAnnual result and depreciation 41.7 37.7 24.8 33.0 31.8 29.6 57.7 44.8 30.4 32.9
Percentage of fixed assetsLong-term equity and liabilities 135.6 136.8 195.9 193.7 117.9 120.1 135.6 137.4 141.2 140.8
Percentage of short-term liabilitiesCash resources and short-term receivables 286.4 285.6 267.6 233.5 192.9 200.2 348.6 345.4 267.5 267.9Cash resources, short-term receivables and inventories 296.7 295.4 271.2 243.6 203.6 212.1 355.4 351.3 281.3 280.5
Percentage of cost of materialsTrade payables 16.6 16.0 36.0 51.9 19.1 17.1 15.5 14.6 16.3 15.4
Memo item:Balance sheet total in € billion 4.34 4.47 0.08 0.09 0.55 0.57 2.15 2.19 1.55 1.61Sales in € billion 4.45 5.09 0.09 0.10 0.45 0.48 2.01 2.14 1.89 2.37Number of enterprises 321 321 117 117 98 98 93 93 13 13
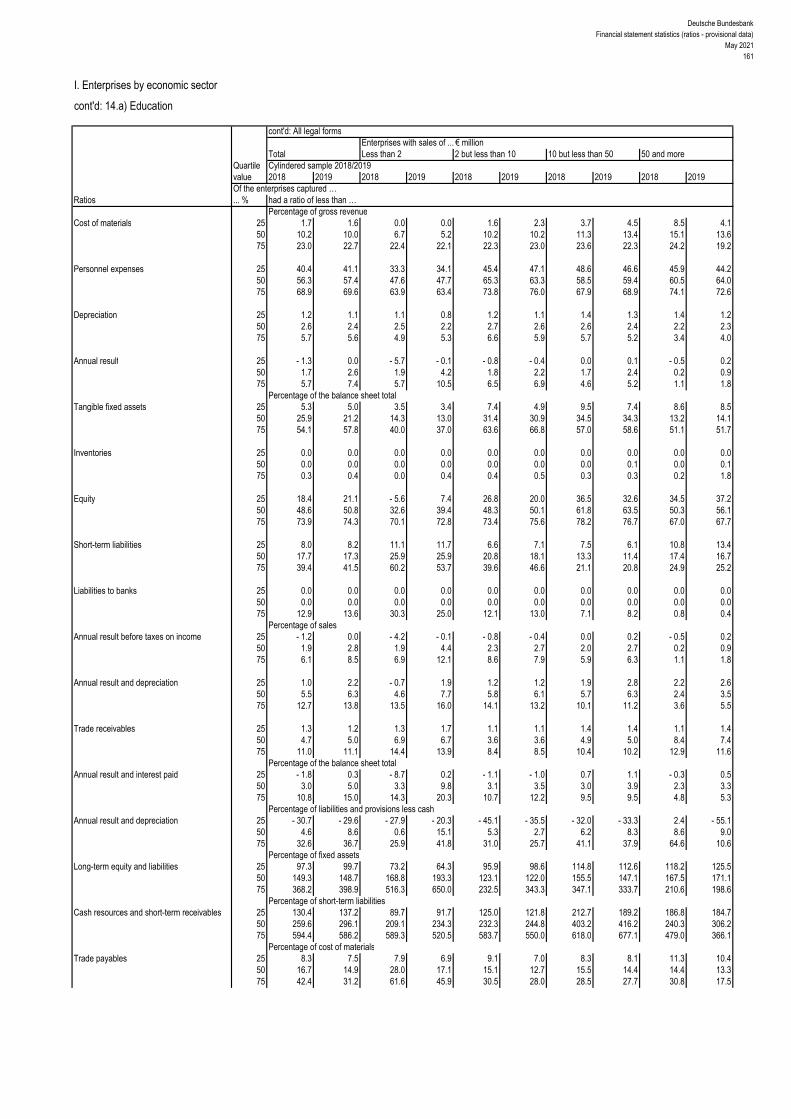
Deutsche BundesbankFinancial statement statistics (ratios - provisional data)
May 2021161
I. Enterprises by economic sector
cont'd: 14.a) Education
cont'd: All legal formsEnterprises with sales of ... € million
Total Less than 2 2 but less than 10 10 but less than 50 50 and moreQuartile Cylindered sample 2018/2019value 2018 2019 2018 2019 2018 2019 2018 2019 2018 2019Of the enterprises captured …
Ratios ... % had a ratio of less than …Percentage of gross revenue
Cost of materials 25 1.7 1.6 0.0 0.0 1.6 2.3 3.7 4.5 8.5 4.1 50 10.2 10.0 6.7 5.2 10.2 10.2 11.3 13.4 15.1 13.6 75 23.0 22.7 22.4 22.1 22.3 23.0 23.6 22.3 24.2 19.2
Personnel expenses 25 40.4 41.1 33.3 34.1 45.4 47.1 48.6 46.6 45.9 44.2 50 56.3 57.4 47.6 47.7 65.3 63.3 58.5 59.4 60.5 64.0 75 68.9 69.6 63.9 63.4 73.8 76.0 67.9 68.9 74.1 72.6
Depreciation 25 1.2 1.1 1.1 0.8 1.2 1.1 1.4 1.3 1.4 1.2 50 2.6 2.4 2.5 2.2 2.7 2.6 2.6 2.4 2.2 2.3 75 5.7 5.6 4.9 5.3 6.6 5.9 5.7 5.2 3.4 4.0
Annual result 25 - 1.3 0.0 - 5.7 - 0.1 - 0.8 - 0.4 0.0 0.1 - 0.5 0.2 50 1.7 2.6 1.9 4.2 1.8 2.2 1.7 2.4 0.2 0.9 75 5.7 7.4 5.7 10.5 6.5 6.9 4.6 5.2 1.1 1.8
Percentage of the balance sheet totalTangible fixed assets 25 5.3 5.0 3.5 3.4 7.4 4.9 9.5 7.4 8.6 8.5
50 25.9 21.2 14.3 13.0 31.4 30.9 34.5 34.3 13.2 14.1 75 54.1 57.8 40.0 37.0 63.6 66.8 57.0 58.6 51.1 51.7
Inventories 25 0.0 0.0 0.0 0.0 0.0 0.0 0.0 0.0 0.0 0.0 50 0.0 0.0 0.0 0.0 0.0 0.0 0.0 0.1 0.0 0.1 75 0.3 0.4 0.0 0.4 0.4 0.5 0.3 0.3 0.2 1.8
Equity 25 18.4 21.1 - 5.6 7.4 26.8 20.0 36.5 32.6 34.5 37.2 50 48.6 50.8 32.6 39.4 48.3 50.1 61.8 63.5 50.3 56.1 75 73.9 74.3 70.1 72.8 73.4 75.6 78.2 76.7 67.0 67.7
Short-term liabilities 25 8.0 8.2 11.1 11.7 6.6 7.1 7.5 6.1 10.8 13.4 50 17.7 17.3 25.9 25.9 20.8 18.1 13.3 11.4 17.4 16.7 75 39.4 41.5 60.2 53.7 39.6 46.6 21.1 20.8 24.9 25.2
Liabilities to banks 25 0.0 0.0 0.0 0.0 0.0 0.0 0.0 0.0 0.0 0.0 50 0.0 0.0 0.0 0.0 0.0 0.0 0.0 0.0 0.0 0.0 75 12.9 13.6 30.3 25.0 12.1 13.0 7.1 8.2 0.8 0.4
Percentage of salesAnnual result before taxes on income 25 - 1.2 0.0 - 4.2 - 0.1 - 0.8 - 0.4 0.0 0.2 - 0.5 0.2
50 1.9 2.8 1.9 4.4 2.3 2.7 2.0 2.7 0.2 0.9 75 6.1 8.5 6.9 12.1 8.6 7.9 5.9 6.3 1.1 1.8
Annual result and depreciation 25 1.0 2.2 - 0.7 1.9 1.2 1.2 1.9 2.8 2.2 2.6 50 5.5 6.3 4.6 7.7 5.8 6.1 5.7 6.3 2.4 3.5 75 12.7 13.8 13.5 16.0 14.1 13.2 10.1 11.2 3.6 5.5
Trade receivables 25 1.3 1.2 1.3 1.7 1.1 1.1 1.4 1.4 1.1 1.4 50 4.7 5.0 6.9 6.7 3.6 3.6 4.9 5.0 8.4 7.4 75 11.0 11.1 14.4 13.9 8.4 8.5 10.4 10.2 12.9 11.6
Percentage of the balance sheet totalAnnual result and interest paid 25 - 1.8 0.3 - 8.7 0.2 - 1.1 - 1.0 0.7 1.1 - 0.3 0.5
50 3.0 5.0 3.3 9.8 3.1 3.5 3.0 3.9 2.3 3.3 75 10.8 15.0 14.3 20.3 10.7 12.2 9.5 9.5 4.8 5.3
Percentage of liabilities and provisions less cashAnnual result and depreciation 25 - 30.7 - 29.6 - 27.9 - 20.3 - 45.1 - 35.5 - 32.0 - 33.3 2.4 - 55.1
50 4.6 8.6 0.6 15.1 5.3 2.7 6.2 8.3 8.6 9.0 75 32.6 36.7 25.9 41.8 31.0 25.7 41.1 37.9 64.6 10.6
Percentage of fixed assetsLong-term equity and liabilities 25 97.3 99.7 73.2 64.3 95.9 98.6 114.8 112.6 118.2 125.5
50 149.3 148.7 168.8 193.3 123.1 122.0 155.5 147.1 167.5 171.1 75 368.2 398.9 516.3 650.0 232.5 343.3 347.1 333.7 210.6 198.6
Percentage of short-term liabilitiesCash resources and short-term receivables 25 130.4 137.2 89.7 91.7 125.0 121.8 212.7 189.2 186.8 184.7
50 259.6 296.1 209.1 234.3 232.3 244.8 403.2 416.2 240.3 306.2 75 594.4 586.2 589.3 520.5 583.7 550.0 618.0 677.1 479.0 366.1
Percentage of cost of materialsTrade payables 25 8.3 7.5 7.9 6.9 9.1 7.0 8.3 8.1 11.3 10.4
50 16.7 14.9 28.0 17.1 15.1 12.7 15.5 14.4 14.4 13.3 75 42.4 31.2 61.6 45.9 30.5 28.0 28.5 27.7 30.8 17.5

Deutsche BundesbankFinancial statement statistics (ratios - provisional data)May 2021162
I. Enterprises by economic sector
14.b) Human health activities
All legal formsEnterprises with sales of ... € million
Total Less than 2 2 but less than 10 10 but less than 50 50 and moreCylindered sample 2018/2019
Ratios 2018 2019 2018 2019 2018 2019 2018 2019 2018 2019Income statementIncome Percentage of gross revenueSales 99.9 99.9 99.9 99.9 99.9 100.0 99.9 100.0 99.9 99.9Change in finished goods 0.1 0.1 0.1 0.1 0.1 0.0 0.1 0.0 0.1 0.1Interest and similar income 0.2 0.2 0.2 0.2 1.5 1.0 0.2 0.2 0.1 0.1Other income 11.2 10.7 4.6 5.2 5.2 6.4 8.2 7.5 11.8 11.4
of which: Income from long-term equity investments 0.1 0.1 1.1 1.0 0.7 0.0 0.3 0.3 0.1 0.1Total income 111.3 110.9 104.8 105.4 106.7 107.4 108.4 107.7 112.0 111.5
ExpensesCost of materials 27.7 27.9 11.5 10.7 19.9 19.0 23.9 23.7 28.6 28.9Personnel expenses 59.6 59.8 56.4 56.8 52.0 52.7 57.2 57.8 60.2 60.3Depreciation 5.3 5.2 5.1 5.3 6.7 6.4 5.8 5.5 5.2 5.1
of which: Depreciation of tangible fixed assets 5.2 5.0 5.1 5.1 5.8 5.7 5.5 5.2 5.1 4.9Interest and similar expenses 0.6 0.7 1.0 1.0 1.4 1.9 0.8 0.8 0.6 0.6Operating taxes 0.0 0.0 0.1 0.0 0.1 0.1 0.0 0.0 0.0 0.0Other expenses 16.7 16.5 28.7 27.7 21.8 22.5 18.0 17.5 16.4 16.1Total expenses before taxes on income 110.0 110.0 102.7 101.4 101.9 102.5 105.7 105.3 111.0 111.1Annual result before taxes on income 1.3 0.8 2.1 4.0 4.8 4.9 2.8 2.4 1.0 0.5Taxes on income 0.2 0.2 1.3 1.6 1.1 0.9 0.4 0.4 0.2 0.2Annual result 1.1 0.6 0.8 2.4 3.7 4.0 2.4 2.0 0.8 0.3Profit and loss transfers (parent company) 0.0 0.1 0.4 0.4 0.0 0.3 - 0.2 0.0 0.1 0.1Profit and loss transfers (subsidiary) 0.1 0.1 - 0.5 - 0.6 0.2 0.9 0.3 0.2 0.0 0.1Profit for the year 1.1 0.6 1.7 3.3 3.6 3.4 1.9 1.8 0.9 0.3
Balance sheetAssets Percentage of the balance sheet totalIntangible fixed assets 0.6 0.6 2.7 3.6 1.1 1.0 0.7 0.7 0.6 0.6Tangible fixed assets 58.5 57.8 29.2 29.5 44.3 40.0 56.7 55.8 59.1 58.6
of which: Land and buildings 42.0 41.7 13.5 14.2 31.5 28.3 44.1 43.1 41.9 41.8Inventories 2.8 2.8 2.1 2.2 1.2 1.1 1.8 1.8 3.0 3.0
of which: Finished goods and merchandise 0.1 0.1 0.5 0.5 0.3 0.3 0.2 0.2 0.1 0.1Cash 9.8 9.2 14.9 16.5 13.6 13.6 10.5 9.9 9.6 8.9Receivables 23.7 24.7 37.8 36.5 24.2 26.9 22.9 24.1 23.8 24.7
Short-term 21.7 22.9 35.5 34.7 22.1 21.4 21.1 22.6 21.8 23.0 of which:
Trade receivables 13.4 14.3 15.0 16.2 10.6 10.1 12.0 12.8 13.7 14.7Receivables from affiliated companies 4.1 4.2 15.9 12.5 8.4 8.5 5.9 6.8 3.7 3.7
Long-term 1.9 1.8 2.3 1.8 2.1 5.5 1.8 1.6 1.9 1.8of which: Loans to affiliated companies 1.4 1.3 0.8 0.7 0.5 0.5 1.5 1.2 1.4 1.4
Securities 1.5 1.4 0.6 0.5 3.5 3.2 1.3 1.4 1.5 1.3Other long-term equity investments 3.0 3.2 12.3 10.7 11.8 13.8 5.8 5.9 2.3 2.5
of which: Goodwill 0.5 0.4 6.6 6.0 7.4 6.2 1.5 1.2 0.1 0.2
CapitalEquity 57.4 56.8 31.7 30.3 40.1 37.0 53.4 53.0 58.5 58.0Liabilities 31.5 32.1 61.9 63.7 53.2 57.0 37.7 37.9 29.9 30.5
Short-term 17.6 18.2 38.5 39.0 26.1 29.4 21.2 22.9 16.7 17.1of which:Liabilities to banks 2.2 2.3 7.1 5.6 3.4 4.9 2.9 3.6 2.1 2.0Trade payables 3.8 4.0 5.5 3.4 3.7 3.1 3.6 4.0 3.8 4.1Liabilities to affiliated companies 4.4 5.0 20.1 21.9 14.9 15.9 9.9 10.4 3.2 3.7
Long-term 13.9 13.9 23.4 24.6 27.1 27.6 16.4 14.9 13.2 13.4 of which:
Liabilities to banks 10.2 10.5 15.6 18.6 14.7 11.0 11.0 10.6 10.0 10.4Liabilities to affiliated companies 2.6 2.4 5.1 4.4 7.6 5.9 4.7 3.7 2.1 2.1
Provisions 10.9 10.9 5.5 5.7 6.6 5.8 8.4 8.4 11.4 11.4of which: Provisions for pensions 2.2 2.1 0.0 0.0 1.1 1.0 1.1 1.1 2.4 2.3
Other ratios Percentage of salesAnnual result before taxes on income 1.3 0.8 2.1 4.0 4.8 4.9 2.8 2.4 1.0 0.5Annual result and depreciation 6.5 5.8 5.9 7.7 10.4 10.3 8.2 7.5 6.1 5.4Trade receivables 14.6 15.3 10.9 12.4 11.0 11.0 12.8 13.4 15.0 15.7
Percentage of the balance sheet totalSales 92.1 93.8 137.1 130.7 96.0 91.8 94.1 95.7 91.6 93.4Annual result and interest paid 1.6 1.2 2.4 4.4 4.9 5.3 3.0 2.6 1.3 0.8
Percentage of liabilities and provisions less cashAnnual result and depreciation 18.1 16.0 15.2 18.8 21.5 19.2 21.3 19.4 17.4 15.2
Percentage of fixed assetsLong-term equity and liabilities 113.0 113.0 117.2 119.3 108.8 103.4 107.3 105.7 114.1 114.4
Percentage of short-term liabilitiesCash resources and short-term receivables 181.6 178.2 131.0 131.5 136.8 119.5 149.5 142.0 190.3 189.1Cash resources, short-term receivables and inventories 197.4 193.7 136.4 137.2 141.3 123.1 157.9 149.6 208.1 206.8
Percentage of cost of materialsTrade payables 14.9 15.4 34.6 24.3 19.3 17.9 16.2 17.7 14.6 15.0
Memo item:Balance sheet total in € billion 62.17 64.70 0.10 0.12 1.04 1.17 9.00 9.31 52.02 54.09Sales in € billion 57.27 60.65 0.14 0.16 1.00 1.08 8.47 8.90 47.66 50.51Number of enterprises 1 001 1 001 161 161 197 197 336 336 307 307

Deutsche BundesbankFinancial statement statistics (ratios - provisional data)
May 2021163
I. Enterprises by economic sector
cont'd: 14.b) Human health activities
cont'd: All legal formsEnterprises with sales of ... € million
Total Less than 2 2 but less than 10 10 but less than 50 50 and moreQuartile Cylindered sample 2018/2019value 2018 2019 2018 2019 2018 2019 2018 2019 2018 2019Of the enterprises captured …
Ratios ... % had a ratio of less than …Percentage of gross revenue
Cost of materials 25 11.4 10.7 0.6 0.6 6.3 7.0 13.7 13.6 22.7 22.6 50 21.7 21.5 5.8 4.9 14.5 14.3 21.1 21.2 26.8 26.7 75 28.8 28.8 16.1 14.3 28.4 27.3 28.6 28.1 30.8 31.5
Personnel expenses 25 49.0 49.8 37.5 40.0 38.0 38.1 49.4 50.5 55.5 56.1 50 59.3 60.1 59.2 57.2 54.1 55.8 59.3 60.1 61.1 61.8 75 67.0 67.6 70.4 70.2 67.9 68.5 66.0 66.9 66.2 66.6
Depreciation 25 2.4 2.3 1.3 1.3 1.2 1.2 2.6 2.8 3.7 3.5 50 4.4 4.3 3.1 3.1 2.8 3.1 4.7 4.6 4.8 4.7 75 6.5 6.4 7.4 7.1 6.4 6.0 7.0 6.6 6.3 6.3
Annual result 25 - 1.1 - 1.1 - 7.8 - 0.1 - 0.4 - 0.4 - 0.6 - 1.2 - 0.8 - 1.3 50 1.3 1.3 1.5 4.3 1.9 2.3 1.6 1.2 0.8 0.7 75 5.3 5.4 9.1 10.4 10.8 10.4 5.7 6.1 2.8 2.3
Percentage of the balance sheet totalTangible fixed assets 25 16.8 16.8 4.3 3.9 7.4 7.5 22.9 20.8 45.3 44.3
50 45.6 44.8 12.5 17.7 19.5 18.4 50.9 51.4 59.6 58.6 75 66.6 65.3 39.7 36.6 46.7 43.1 70.1 69.9 69.5 68.7
Inventories 25 0.2 0.2 0.0 0.0 0.0 0.0 0.4 0.4 1.7 1.7 50 1.5 1.5 0.0 0.0 0.3 0.3 1.5 1.3 2.7 2.7 75 3.4 3.4 1.5 1.7 2.2 2.3 3.1 3.1 4.2 4.3
Equity 25 26.1 26.4 1.0 0.1 7.2 10.2 29.2 29.2 47.5 45.4 50 51.7 52.0 32.3 29.7 35.3 37.2 51.3 52.3 60.6 60.6 75 69.8 68.7 70.8 66.8 64.1 65.7 69.1 69.3 72.0 71.0
Short-term liabilities 25 8.9 9.5 9.9 13.4 10.2 10.0 8.6 9.3 8.5 9.2 50 16.4 16.9 26.9 25.9 18.7 20.2 16.0 16.9 13.9 14.5 75 33.1 34.7 62.7 66.0 40.2 48.3 32.6 34.0 22.4 22.5
Liabilities to banks 25 0.0 0.0 0.0 0.0 0.0 0.0 0.0 0.0 0.0 0.0 50 2.7 2.2 0.0 0.0 0.0 0.0 1.8 2.1 6.5 6.4 75 21.1 20.0 34.1 33.2 25.6 24.1 22.5 21.1 16.6 17.4
Percentage of salesAnnual result before taxes on income 25 - 1.0 - 1.1 - 7.8 0.0 - 0.4 - 0.3 - 0.6 - 1.2 - 0.8 - 1.2
50 1.5 1.4 1.9 5.2 2.4 2.7 1.9 1.3 0.9 0.8 75 6.0 6.4 9.8 12.3 12.5 11.4 6.5 6.6 2.8 2.4
Annual result and depreciation 25 2.5 2.7 - 2.0 2.5 2.1 1.9 2.8 2.8 3.4 2.8 50 6.2 6.2 6.3 8.5 6.1 7.3 6.5 6.4 6.0 5.4 75 11.5 12.0 14.2 18.2 17.8 16.7 12.8 12.1 8.3 7.6
Trade receivables 25 8.5 8.7 3.6 4.8 5.5 5.8 8.6 8.8 11.4 11.8 50 12.2 12.7 9.3 9.5 10.5 10.3 11.7 12.2 13.8 15.1 75 16.5 17.2 15.4 16.8 16.0 15.8 16.3 16.9 17.2 18.4
Percentage of the balance sheet totalAnnual result and interest paid 25 - 0.7 - 0.4 - 9.4 0.3 0.0 0.4 - 0.5 - 0.7 - 0.3 - 0.7
50 2.2 2.3 5.2 9.1 4.7 5.9 2.7 2.1 1.3 1.2 75 8.0 8.6 20.3 22.4 17.4 18.3 7.6 7.1 3.4 3.1
Percentage of liabilities and provisions less cashAnnual result and depreciation 25 - 0.1 0.7 - 26.5 - 17.8 - 4.4 - 1.3 2.2 - 0.8 6.5 5.0
50 14.3 16.2 4.7 16.1 16.3 18.7 15.5 13.8 15.5 16.3 75 42.3 43.0 36.4 49.1 57.0 63.2 49.0 42.8 32.7 32.6
Percentage of fixed assetsLong-term equity and liabilities 25 96.9 96.8 77.9 56.6 97.2 94.8 92.6 93.6 102.1 102.5
50 118.6 118.7 128.5 136.5 149.9 161.0 115.3 116.0 115.5 115.6 75 184.1 180.5 409.7 330.2 287.7 336.5 176.2 167.5 134.9 134.3
Percentage of short-term liabilitiesCash resources and short-term receivables 25 116.7 120.3 77.1 88.2 110.6 110.1 106.1 110.4 143.5 146.9
50 210.3 215.9 165.4 179.1 233.3 228.9 209.3 203.6 219.7 221.4 75 405.9 394.6 570.0 428.1 504.6 574.7 415.0 379.4 341.5 342.4
Percentage of cost of materialsTrade payables 25 8.1 8.0 6.8 7.1 7.1 6.2 8.3 8.2 8.9 8.9
50 13.8 13.9 17.1 18.4 16.0 13.1 13.9 14.3 12.4 13.0 75 26.0 27.0 65.1 66.7 34.3 30.4 26.5 27.6 18.6 20.5

Deutsche BundesbankFinancial statement statistics (ratios - provisional data)May 2021164
I. Enterprises by economic sector
14.c) Residential care activities
All legal formsEnterprises with sales of ... € million
Total Less than 2 2 but less than 10 10 but less than 50 50 and moreCylindered sample 2018/2019
Ratios 2018 2019 2018 2019 2018 2019 2018 2019 2018 2019Income statementIncome Percentage of gross revenueSales 100.0 100.0 100.1 99.5 100.0 100.0 100.0 100.0 100.0 100.0Change in finished goods 0.0 0.0 - 0.1 0.5 0.0 0.0 0.0 0.0 0.0 0.0Interest and similar income 0.3 0.3 0.1 0.9 0.2 0.2 0.2 0.2 0.5 0.4Other income 6.7 6.4 38.6 35.8 8.8 8.2 7.2 7.7 5.9 5.1
of which: Income from long-term equity investments 0.1 0.1 0.0 0.0 0.0 0.0 0.0 0.0 0.1 0.1Total income 107.0 106.7 138.7 136.7 109.0 108.4 107.4 107.9 106.3 105.5
ExpensesCost of materials 19.1 19.1 14.8 15.0 17.1 16.7 16.9 17.0 20.9 21.0Personnel expenses 63.7 64.5 77.9 75.6 62.7 63.5 66.8 67.9 61.6 62.2Depreciation 4.1 4.1 8.2 7.1 3.7 3.7 4.2 4.1 4.2 4.1
of which: Depreciation of tangible fixed assets 4.1 4.0 8.2 6.8 3.7 3.6 4.1 4.0 4.1 4.1Interest and similar expenses 0.9 0.8 2.8 2.8 0.7 0.6 0.8 0.7 0.9 1.0Operating taxes 0.1 0.1 0.1 0.1 0.1 0.0 0.1 0.1 0.1 0.1Other expenses 16.6 16.1 29.6 28.0 21.8 21.3 16.7 15.9 15.8 15.5Total expenses before taxes on income 104.4 104.7 133.5 128.5 105.9 105.8 105.3 105.6 103.5 103.8Annual result before taxes on income 2.6 2.0 5.2 8.2 3.0 2.6 2.1 2.3 2.9 1.7Taxes on income 0.1 0.1 0.6 0.4 0.1 0.1 0.1 0.1 0.1 0.1Annual result 2.5 2.0 4.6 7.7 3.0 2.5 2.0 2.3 2.8 1.6Profit and loss transfers (parent company) 0.3 0.3 0.0 0.0 0.0 0.0 0.6 0.5 0.2 0.1Profit and loss transfers (subsidiary) 1.1 0.6 - 0.4 1.0 0.4 0.5 0.7 0.8 1.4 0.4Profit for the year 1.8 1.7 5.0 6.8 2.6 2.1 1.8 2.0 1.6 1.3
Balance sheetAssets Percentage of the balance sheet totalIntangible fixed assets 0.5 0.4 0.0 0.1 0.1 0.1 0.2 0.2 0.8 0.6Tangible fixed assets 62.2 62.0 77.4 75.9 56.8 56.5 65.0 64.7 60.3 60.2
of which: Land and buildings 53.5 53.2 71.8 69.0 50.7 50.2 56.7 56.1 50.8 50.9Inventories 0.6 0.6 0.4 0.6 0.4 0.4 0.7 0.6 0.6 0.5
of which: Finished goods and merchandise 0.1 0.1 0.0 0.0 0.1 0.1 0.2 0.2 0.1 0.1Cash 12.6 12.7 9.9 10.4 16.8 16.1 15.0 14.6 9.8 10.4Receivables 18.8 19.0 10.2 11.0 22.2 23.0 13.6 14.3 23.1 22.8
Short-term 16.1 16.3 10.2 11.0 20.3 21.2 12.8 13.2 18.7 18.4 of which:
Trade receivables 5.2 5.1 3.2 3.0 4.5 4.6 4.1 4.2 6.4 6.2Receivables from affiliated companies 8.9 8.8 5.7 5.4 10.2 10.6 7.3 7.4 10.1 9.9
Long-term 2.6 2.7 0.0 0.0 2.0 1.9 0.9 1.1 4.5 4.3of which: Loans to affiliated companies 1.0 1.1 0.0 0.0 1.3 1.2 0.5 0.8 1.4 1.3
Securities 2.9 2.9 0.0 0.0 2.0 2.3 3.7 3.5 2.4 2.4Other long-term equity investments 1.9 1.9 1.9 1.7 0.7 0.7 1.5 1.7 2.3 2.3
of which: Goodwill 0.1 0.1 1.0 0.9 0.2 0.1 0.0 0.0 0.1 0.1
CapitalEquity 53.7 53.9 39.8 40.9 61.9 62.8 58.1 58.1 48.5 48.7Liabilities 37.4 37.3 56.5 55.0 32.5 31.6 35.7 35.8 39.5 39.2
Short-term 12.6 13.2 17.9 21.3 12.3 14.7 12.3 12.3 12.8 13.7of which:Liabilities to banks 2.6 3.2 9.8 10.4 3.5 6.1 2.2 2.1 2.7 3.7Trade payables 2.1 2.0 1.7 2.9 2.0 2.0 1.8 1.7 2.4 2.2Liabilities to affiliated companies 4.3 4.5 3.5 2.7 3.1 3.1 5.4 5.6 3.5 3.8
Long-term 24.8 24.0 38.6 33.7 20.2 16.9 23.4 23.5 26.7 25.5 of which:
Liabilities to banks 20.7 20.3 33.9 31.9 15.9 13.0 20.1 20.2 21.8 21.3Liabilities to affiliated companies 1.5 1.2 4.4 1.6 3.0 2.5 1.4 1.4 1.2 0.8
Provisions 7.6 7.6 2.6 3.0 4.6 4.6 5.0 4.9 10.5 10.6of which: Provisions for pensions 2.4 2.4 0.1 0.1 0.3 0.3 0.8 0.7 4.2 4.3
Other ratios Percentage of salesAnnual result before taxes on income 2.6 2.0 5.2 8.2 3.0 2.6 2.1 2.3 2.9 1.7Annual result and depreciation 6.7 6.0 12.8 14.9 6.7 6.2 6.2 6.4 7.0 5.7Trade receivables 5.1 5.0 6.5 5.6 4.8 4.8 4.7 4.7 5.5 5.2
Percentage of the balance sheet totalSales 101.3 102.8 49.7 53.4 92.7 96.1 87.0 88.2 116.8 118.3Annual result and interest paid 3.4 2.9 3.7 5.6 3.4 3.0 2.4 2.7 4.3 3.0
Percentage of liabilities and provisions less cashAnnual result and depreciation 20.0 18.6 12.7 16.4 29.0 28.3 19.9 20.6 19.4 16.5
Percentage of fixed assetsLong-term equity and liabilities 116.2 115.8 98.9 96.1 134.4 131.0 116.2 116.5 113.8 113.4
Percentage of short-term liabilitiesCash resources and short-term receivables 233.1 223.0 112.3 100.7 303.4 256.1 230.5 229.7 226.8 214.4Cash resources, short-term receivables and inventories 237.8 227.3 114.3 103.6 306.7 258.8 235.8 234.6 231.2 218.4
Percentage of cost of materialsTrade payables 10.8 10.2 23.7 36.1 12.4 12.6 12.3 11.7 9.7 8.9
Memo item:Balance sheet total in € billion 13.90 14.32 0.09 0.10 1.08 1.09 6.17 6.36 6.57 6.77Sales in € billion 14.09 14.72 0.05 0.05 1.00 1.05 5.37 5.61 7.67 8.02Number of enterprises 534 534 38 38 188 188 231 231 77 77
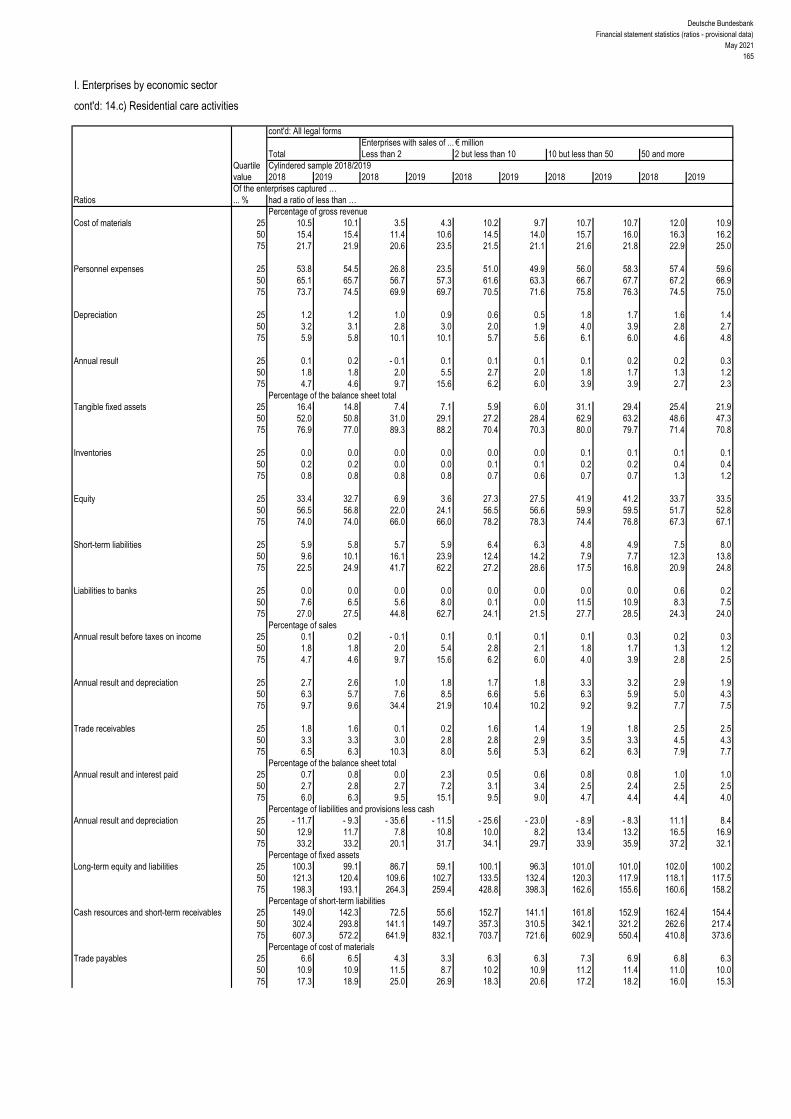
Deutsche BundesbankFinancial statement statistics (ratios - provisional data)
May 2021165
I. Enterprises by economic sector
cont'd: 14.c) Residential care activities
cont'd: All legal formsEnterprises with sales of ... € million
Total Less than 2 2 but less than 10 10 but less than 50 50 and moreQuartile Cylindered sample 2018/2019value 2018 2019 2018 2019 2018 2019 2018 2019 2018 2019Of the enterprises captured …
Ratios ... % had a ratio of less than …Percentage of gross revenue
Cost of materials 25 10.5 10.1 3.5 4.3 10.2 9.7 10.7 10.7 12.0 10.9 50 15.4 15.4 11.4 10.6 14.5 14.0 15.7 16.0 16.3 16.2 75 21.7 21.9 20.6 23.5 21.5 21.1 21.6 21.8 22.9 25.0
Personnel expenses 25 53.8 54.5 26.8 23.5 51.0 49.9 56.0 58.3 57.4 59.6 50 65.1 65.7 56.7 57.3 61.6 63.3 66.7 67.7 67.2 66.9 75 73.7 74.5 69.9 69.7 70.5 71.6 75.8 76.3 74.5 75.0
Depreciation 25 1.2 1.2 1.0 0.9 0.6 0.5 1.8 1.7 1.6 1.4 50 3.2 3.1 2.8 3.0 2.0 1.9 4.0 3.9 2.8 2.7 75 5.9 5.8 10.1 10.1 5.7 5.6 6.1 6.0 4.6 4.8
Annual result 25 0.1 0.2 - 0.1 0.1 0.1 0.1 0.1 0.2 0.2 0.3 50 1.8 1.8 2.0 5.5 2.7 2.0 1.8 1.7 1.3 1.2 75 4.7 4.6 9.7 15.6 6.2 6.0 3.9 3.9 2.7 2.3
Percentage of the balance sheet totalTangible fixed assets 25 16.4 14.8 7.4 7.1 5.9 6.0 31.1 29.4 25.4 21.9
50 52.0 50.8 31.0 29.1 27.2 28.4 62.9 63.2 48.6 47.3 75 76.9 77.0 89.3 88.2 70.4 70.3 80.0 79.7 71.4 70.8
Inventories 25 0.0 0.0 0.0 0.0 0.0 0.0 0.1 0.1 0.1 0.1 50 0.2 0.2 0.0 0.0 0.1 0.1 0.2 0.2 0.4 0.4 75 0.8 0.8 0.8 0.8 0.7 0.6 0.7 0.7 1.3 1.2
Equity 25 33.4 32.7 6.9 3.6 27.3 27.5 41.9 41.2 33.7 33.5 50 56.5 56.8 22.0 24.1 56.5 56.6 59.9 59.5 51.7 52.8 75 74.0 74.0 66.0 66.0 78.2 78.3 74.4 76.8 67.3 67.1
Short-term liabilities 25 5.9 5.8 5.7 5.9 6.4 6.3 4.8 4.9 7.5 8.0 50 9.6 10.1 16.1 23.9 12.4 14.2 7.9 7.7 12.3 13.8 75 22.5 24.9 41.7 62.2 27.2 28.6 17.5 16.8 20.9 24.8
Liabilities to banks 25 0.0 0.0 0.0 0.0 0.0 0.0 0.0 0.0 0.6 0.2 50 7.6 6.5 5.6 8.0 0.1 0.0 11.5 10.9 8.3 7.5 75 27.0 27.5 44.8 62.7 24.1 21.5 27.7 28.5 24.3 24.0
Percentage of salesAnnual result before taxes on income 25 0.1 0.2 - 0.1 0.1 0.1 0.1 0.1 0.3 0.2 0.3
50 1.8 1.8 2.0 5.4 2.8 2.1 1.8 1.7 1.3 1.2 75 4.7 4.6 9.7 15.6 6.2 6.0 4.0 3.9 2.8 2.5
Annual result and depreciation 25 2.7 2.6 1.0 1.8 1.7 1.8 3.3 3.2 2.9 1.9 50 6.3 5.7 7.6 8.5 6.6 5.6 6.3 5.9 5.0 4.3 75 9.7 9.6 34.4 21.9 10.4 10.2 9.2 9.2 7.7 7.5
Trade receivables 25 1.8 1.6 0.1 0.2 1.6 1.4 1.9 1.8 2.5 2.5 50 3.3 3.3 3.0 2.8 2.8 2.9 3.5 3.3 4.5 4.3 75 6.5 6.3 10.3 8.0 5.6 5.3 6.2 6.3 7.9 7.7
Percentage of the balance sheet totalAnnual result and interest paid 25 0.7 0.8 0.0 2.3 0.5 0.6 0.8 0.8 1.0 1.0
50 2.7 2.8 2.7 7.2 3.1 3.4 2.5 2.4 2.5 2.5 75 6.0 6.3 9.5 15.1 9.5 9.0 4.7 4.4 4.4 4.0
Percentage of liabilities and provisions less cashAnnual result and depreciation 25 - 11.7 - 9.3 - 35.6 - 11.5 - 25.6 - 23.0 - 8.9 - 8.3 11.1 8.4
50 12.9 11.7 7.8 10.8 10.0 8.2 13.4 13.2 16.5 16.9 75 33.2 33.2 20.1 31.7 34.1 29.7 33.9 35.9 37.2 32.1
Percentage of fixed assetsLong-term equity and liabilities 25 100.3 99.1 86.7 59.1 100.1 96.3 101.0 101.0 102.0 100.2
50 121.3 120.4 109.6 102.7 133.5 132.4 120.3 117.9 118.1 117.5 75 198.3 193.1 264.3 259.4 428.8 398.3 162.6 155.6 160.6 158.2
Percentage of short-term liabilitiesCash resources and short-term receivables 25 149.0 142.3 72.5 55.6 152.7 141.1 161.8 152.9 162.4 154.4
50 302.4 293.8 141.1 149.7 357.3 310.5 342.1 321.2 262.6 217.4 75 607.3 572.2 641.9 832.1 703.7 721.6 602.9 550.4 410.8 373.6
Percentage of cost of materialsTrade payables 25 6.6 6.5 4.3 3.3 6.3 6.3 7.3 6.9 6.8 6.3
50 10.9 10.9 11.5 8.7 10.2 10.9 11.2 11.4 11.0 10.0 75 17.3 18.9 25.0 26.9 18.3 20.6 17.2 18.2 16.0 15.3

Deutsche BundesbankFinancial statement statistics (ratios - provisional data)May 2021166
I. Enterprises by economic sector
14.d) Social work activities without accommodation
All legal formsEnterprises with sales of ... € million
Total Less than 2 2 but less than 10 10 but less than 50 50 and moreCylindered sample 2018/2019
Ratios 2018 2019 2018 2019 2018 2019 2018 2019 2018 2019Income statementIncome Percentage of gross revenueSales 100.0 100.0 100.0 100.0 100.0 100.0 100.0 100.0 99.9 100.0Change in finished goods 0.0 0.0 0.0 0.0 0.0 0.0 0.0 0.0 0.1 0.0Interest and similar income 0.4 0.3 0.2 0.2 0.2 0.2 0.2 0.2 0.5 0.4Other income 10.6 10.6 28.5 33.8 19.2 18.6 11.9 11.5 9.0 9.1
of which: Income from long-term equity investments 0.2 0.2 0.0 0.0 0.0 0.0 0.5 0.5 0.0 0.0Total income 110.9 110.9 128.7 133.9 119.4 118.8 112.0 111.6 109.5 109.6
ExpensesCost of materials 19.4 19.6 13.2 12.4 18.4 15.6 13.9 13.7 22.2 22.8Personnel expenses 69.5 69.7 73.5 71.9 71.4 71.6 73.9 74.7 67.2 67.1Depreciation 3.7 3.5 3.1 2.8 5.2 4.7 3.7 3.6 3.7 3.4
of which: Depreciation of tangible fixed assets 3.5 3.4 3.0 2.7 5.1 4.6 3.6 3.5 3.4 3.3Interest and similar expenses 0.8 0.8 1.0 0.6 1.0 1.0 0.6 0.6 0.8 0.8Operating taxes 0.1 0.0 0.1 0.0 0.1 0.1 0.1 0.0 0.0 0.0Other expenses 16.1 15.8 34.6 41.2 19.9 22.5 17.6 17.0 14.8 14.4Total expenses before taxes on income 109.5 109.5 125.4 128.8 116.0 115.4 109.7 109.6 108.7 108.6Annual result before taxes on income 1.4 1.4 3.3 5.1 3.4 3.4 2.3 2.0 0.8 1.0Taxes on income 0.1 0.1 0.5 0.7 0.2 0.2 0.1 0.1 0.1 0.0Annual result 1.3 1.4 2.8 4.4 3.1 3.2 2.2 1.9 0.7 0.9Profit and loss transfers (parent company) 0.0 0.0 0.0 0.0 0.0 0.0 0.1 0.1 0.0 0.0Profit and loss transfers (subsidiary) 0.0 0.1 - 0.4 - 0.5 0.0 0.2 0.0 0.3 0.0 0.0Profit for the year 1.3 1.3 3.2 4.9 3.1 3.0 2.2 1.7 0.7 0.9
Balance sheetAssets Percentage of the balance sheet totalIntangible fixed assets 0.4 0.3 0.5 0.5 0.4 0.4 0.3 0.3 0.4 0.4Tangible fixed assets 51.9 52.0 43.5 44.3 57.7 57.1 55.1 55.7 50.0 49.8
of which: Land and buildings 42.7 43.0 38.0 38.3 49.9 50.9 45.7 47.1 40.6 40.4Inventories 0.6 0.5 0.9 0.9 0.3 0.3 1.0 0.9 0.4 0.4
of which: Finished goods and merchandise 0.1 0.1 0.0 0.0 0.1 0.1 0.3 0.3 0.0 0.0Cash 14.0 13.3 29.5 28.0 20.0 20.5 21.1 19.3 9.8 9.6Receivables 20.7 21.1 21.2 22.1 13.3 13.8 13.4 14.0 24.8 25.1
Short-term 16.3 17.2 19.5 20.4 12.2 12.6 11.9 12.7 18.7 19.7 of which:
Trade receivables 8.2 8.4 10.3 11.1 5.2 5.5 7.5 7.6 8.8 9.1Receivables from affiliated companies 5.5 5.8 6.0 5.7 5.2 5.1 2.9 3.0 6.7 7.2
Long-term 4.4 3.9 1.7 1.7 1.1 1.2 1.4 1.3 6.1 5.4of which: Loans to affiliated companies 1.0 1.1 0.0 0.0 0.9 0.8 0.9 1.0 1.1 1.1
Securities 10.3 10.3 2.9 2.6 4.8 4.4 5.4 6.0 13.2 13.1Other long-term equity investments 1.9 2.0 1.2 1.1 3.1 3.1 3.4 3.3 1.1 1.3
of which: Goodwill 0.1 0.1 0.8 0.7 0.4 0.3 0.0 0.0 0.1 0.1
CapitalEquity 59.3 58.6 48.8 51.6 61.8 61.3 64.4 64.6 56.9 55.7Liabilities 25.3 25.8 45.5 42.1 31.8 32.2 26.2 25.4 24.0 25.1
Short-term 11.9 11.9 33.3 29.5 12.0 12.3 12.8 12.5 11.1 11.3of which:Liabilities to banks 1.9 1.8 10.7 9.9 3.2 3.4 2.3 2.3 1.4 1.2Trade payables 2.3 2.3 1.9 2.1 2.2 1.9 2.3 2.3 2.3 2.4Liabilities to affiliated companies 2.3 2.1 6.6 7.1 3.5 3.8 4.6 3.9 1.1 1.0
Long-term 13.5 13.9 12.2 12.6 19.8 19.9 13.4 12.9 12.8 13.8 of which:
Liabilities to banks 10.6 10.6 6.4 7.3 16.5 16.3 11.6 11.3 9.5 9.8Liabilities to affiliated companies 0.4 0.6 2.7 3.1 2.9 3.3 0.4 0.3 0.1 0.4
Provisions 14.2 14.5 4.3 4.8 5.6 5.6 8.0 8.5 18.1 18.4of which: Provisions for pensions 4.1 4.3 0.2 0.3 0.7 0.7 2.3 2.6 5.3 5.6
Other ratios Percentage of salesAnnual result before taxes on income 1.4 1.4 3.3 5.1 3.4 3.4 2.3 2.0 0.8 1.0Annual result and depreciation 5.1 4.9 5.8 7.2 8.3 7.9 5.9 5.5 4.4 4.3Trade receivables 8.0 8.1 9.3 8.9 7.1 7.3 7.1 7.0 8.5 8.7
Percentage of the balance sheet totalSales 101.8 104.4 111.2 125.1 72.7 75.2 105.9 109.6 103.0 105.0Annual result and interest paid 2.1 2.2 4.1 6.3 3.0 3.2 2.9 2.7 1.6 1.8
Percentage of liabilities and provisions less cashAnnual result and depreciation 19.3 18.2 29.8 44.3 33.2 32.6 42.9 37.6 13.6 13.1
Percentage of fixed assetsLong-term equity and liabilities 117.9 118.7 123.1 128.5 123.0 124.1 125.6 125.0 113.9 115.3
Percentage of short-term liabilitiesCash resources and short-term receivables 285.8 289.2 147.2 164.2 270.5 270.3 272.3 275.9 300.4 302.4Cash resources, short-term receivables and inventories 290.5 293.6 149.9 167.3 273.4 273.1 279.9 283.2 303.9 305.6
Percentage of cost of materialsTrade payables 11.5 11.3 12.9 13.4 16.3 15.9 15.4 15.5 10.0 9.8
Memo item:Balance sheet total in € billion 11.01 11.31 0.10 0.10 0.76 0.79 3.19 3.25 6.96 7.17Sales in € billion 11.21 11.81 0.11 0.12 0.56 0.59 3.38 3.57 7.17 7.53Number of enterprises 420 420 112 112 113 113 143 143 52 52

Deutsche BundesbankFinancial statement statistics (ratios - provisional data)
May 2021167
I. Enterprises by economic sector
cont'd: 14.d) Social work activities without accommodation
cont'd: All legal formsEnterprises with sales of ... € million
Total Less than 2 2 but less than 10 10 but less than 50 50 and moreQuartile Cylindered sample 2018/2019value 2018 2019 2018 2019 2018 2019 2018 2019 2018 2019Of the enterprises captured …
Ratios ... % had a ratio of less than …Percentage of gross revenue
Cost of materials 25 4.3 4.5 0.3 0.3 4.9 6.0 6.0 6.1 9.6 8.7 50 11.7 11.5 6.5 7.3 12.0 11.5 12.3 12.5 15.6 15.7 75 19.4 19.0 17.5 16.5 19.8 19.8 17.6 17.4 20.8 20.9
Personnel expenses 25 60.1 62.0 58.8 60.9 57.0 55.9 67.1 67.5 63.9 65.9 50 72.8 72.6 73.6 72.5 69.1 69.5 74.6 75.3 71.6 72.5 75 81.9 81.9 82.8 80.1 82.7 82.6 81.7 83.7 76.5 76.6
Depreciation 25 1.2 1.2 0.7 0.7 1.1 1.0 1.5 1.6 1.3 1.2 50 2.4 2.4 1.5 1.4 2.6 2.6 2.9 2.7 2.7 2.7 75 4.6 4.4 3.5 3.3 5.8 5.1 4.3 4.1 5.2 5.1
Annual result 25 0.0 0.1 - 3.2 - 0.4 0.2 0.2 0.1 0.2 0.1 0.1 50 1.8 1.9 2.8 2.8 2.2 2.3 1.6 1.6 1.2 1.0 75 5.4 4.9 9.1 9.1 6.0 6.5 3.6 3.9 2.3 2.1
Percentage of the balance sheet totalTangible fixed assets 25 9.5 8.6 3.1 2.8 7.3 7.0 23.3 23.6 16.9 17.9
50 30.7 30.2 9.9 9.8 26.5 24.1 49.7 49.0 47.9 45.7 75 63.2 63.2 31.6 32.9 64.5 64.9 67.3 67.2 70.1 70.8
Inventories 25 0.0 0.0 0.0 0.0 0.0 0.0 0.0 0.0 0.0 0.0 50 0.0 0.0 0.0 0.0 0.0 0.1 0.2 0.1 0.2 0.2 75 0.4 0.4 0.0 0.0 0.4 0.3 0.8 0.8 0.5 0.4
Equity 25 29.5 30.6 7.9 12.7 28.5 28.4 45.4 43.9 36.0 36.1 50 56.2 56.8 42.2 42.4 57.8 58.3 61.8 61.0 53.2 51.7 75 74.8 75.2 70.1 73.4 79.0 82.8 74.8 74.4 71.1 71.8
Short-term liabilities 25 6.6 6.1 9.8 10.3 5.4 4.9 5.7 5.5 7.0 6.5 50 11.9 12.8 24.4 26.2 12.8 12.2 9.6 9.6 13.8 10.6 75 31.7 32.9 60.0 52.5 30.1 32.0 18.0 18.9 26.7 24.9
Liabilities to banks 25 0.0 0.0 0.0 0.0 0.0 0.0 0.0 0.0 0.0 0.0 50 3.9 3.9 0.0 0.0 1.2 1.5 7.2 6.6 7.9 8.1 75 20.3 20.7 28.8 27.6 20.1 18.6 18.6 19.0 17.2 20.9
Percentage of salesAnnual result before taxes on income 25 0.1 0.1 - 3.0 - 0.1 0.2 0.2 0.2 0.2 0.2 0.1
50 1.9 1.9 3.1 2.8 2.6 2.6 1.7 1.8 1.2 1.0 75 5.5 5.1 9.9 9.6 6.2 6.5 3.6 3.9 2.6 2.1
Annual result and depreciation 25 2.0 1.9 - 0.5 1.3 2.2 2.6 2.6 2.2 1.6 1.5 50 5.4 5.2 5.1 5.5 6.4 6.4 5.1 4.7 5.0 4.0 75 9.4 9.8 12.5 13.1 10.9 12.3 8.1 7.9 7.2 6.7
Trade receivables 25 2.7 2.8 3.1 2.8 1.4 2.0 2.9 3.0 3.5 3.2 50 7.0 6.9 8.9 9.1 6.6 6.6 6.1 5.7 7.1 6.7 75 11.4 11.2 13.9 13.6 11.4 11.3 9.8 9.9 10.5 10.0
Percentage of the balance sheet totalAnnual result and interest paid 25 0.6 0.9 - 5.8 0.0 0.9 1.2 0.8 0.9 1.0 0.9
50 3.1 2.9 6.2 6.3 3.5 3.9 2.5 2.6 2.4 2.2 75 8.6 8.6 25.5 28.0 9.9 10.4 5.3 5.1 5.3 3.7
Percentage of liabilities and provisions less cashAnnual result and depreciation 25 - 26.2 - 17.8 - 44.6 - 19.5 - 26.2 - 14.7 - 24.5 - 23.6 6.9 6.2
50 9.9 11.4 7.5 14.2 6.7 9.3 14.8 12.6 17.5 13.9 75 34.7 43.2 62.8 73.1 31.8 46.3 41.7 40.0 27.5 23.1
Percentage of fixed assetsLong-term equity and liabilities 25 106.0 107.9 91.1 108.9 105.2 110.0 111.8 111.2 100.9 101.5
50 143.0 147.3 250.2 280.9 180.8 184.6 131.6 132.0 113.7 118.5 75 351.3 350.3 829.2 1 043.8 448.9 498.7 213.9 205.3 151.4 156.1
Percentage of short-term liabilitiesCash resources and short-term receivables 25 164.0 173.1 108.6 140.3 164.0 171.9 218.9 220.7 159.1 158.1
50 356.6 331.7 270.7 275.0 359.8 331.7 421.0 395.0 264.8 271.0 75 671.9 681.0 678.7 688.7 1 133.1 1 073.5 638.6 596.5 430.0 389.1
Percentage of cost of materialsTrade payables 25 6.5 6.5 2.4 3.4 7.1 7.1 7.7 7.5 7.4 8.1
50 11.6 12.5 7.7 7.7 13.2 13.9 11.8 12.9 12.7 13.7 75 24.0 23.7 20.0 22.2 27.8 25.4 25.0 24.7 20.4 21.2

Deutsche BundesbankFinancial statement statistics (ratios - provisional data)May 2021168
I. Enterprises by economic sector
15. Activities of head offices
All legal formsEnterprises with sales of ... € million
Total Less than 2 2 but less than 10 10 but less than 50 50 and moreCylindered sample 2018/2019
Ratios 2018 2019 2018 2019 2018 2019 2018 2019 2018 2019Income statementIncome Percentage of gross revenueSales 99.9 99.5 99.6 100.5 102.6 100.9 100.1 99.4 99.8 99.5Change in finished goods 0.1 0.5 0.4 - 0.5 - 2.6 - 0.9 - 0.1 0.6 0.2 0.5Interest and similar income 15.7 15.4 2.2 1.6 2.7 1.8 4.4 3.7 17.2 17.2Other income 120.1 121.8 19.1 21.5 24.2 23.8 46.8 40.8 130.6 134.4
of which: Income from long-term equity investments 59.2 59.5 9.4 11.4 15.1 16.2 31.8 28.6 63.4 64.6Total income 235.8 237.3 121.3 123.0 126.9 125.7 151.2 144.5 247.8 251.6
ExpensesCost of materials 31.9 32.2 14.2 17.1 40.0 41.6 28.4 34.6 32.1 31.7Personnel expenses 34.0 34.8 59.9 56.9 31.4 32.0 36.0 32.6 33.8 35.0Depreciation 32.4 28.0 12.6 6.6 5.7 5.2 11.7 11.9 35.4 30.6
of which: Depreciation of tangible fixed assets 5.0 5.5 3.1 2.9 3.1 3.1 6.8 5.9 4.8 5.5Interest and similar expenses 25.6 24.0 2.0 1.7 3.2 2.9 7.0 6.1 28.2 26.7Operating taxes 0.1 0.1 0.3 0.3 0.2 0.1 0.3 0.3 0.1 0.1Other expenses 75.0 62.5 25.0 25.1 24.5 22.1 29.3 27.6 81.2 67.9Total expenses before taxes on income 199.2 181.7 114.1 107.8 105.0 104.0 112.6 113.0 210.8 192.1Annual result before taxes on income 36.6 55.6 7.2 15.3 21.9 21.6 38.6 31.5 37.1 59.5Taxes on income 16.8 14.8 3.2 3.0 3.3 3.3 7.6 6.8 18.1 16.1Annual result 19.9 40.8 4.0 12.2 18.6 18.3 31.0 24.7 18.9 43.4Profit and loss transfers (parent company) 75.9 71.5 0.7 1.6 4.8 4.7 18.8 14.4 84.0 80.2Profit and loss transfers (subsidiary) 6.0 16.9 1.5 1.0 1.3 0.5 3.3 5.1 6.4 18.8Profit for the year 89.8 95.4 3.2 12.8 22.2 22.4 46.5 33.9 96.5 104.9
Balance sheetAssets Percentage of the balance sheet totalIntangible fixed assets 0.3 0.2 0.7 0.6 0.4 0.4 0.6 0.6 0.2 0.2Tangible fixed assets 1.5 1.5 14.4 13.5 15.1 15.3 11.7 11.6 1.3 1.3
of which: Land and buildings 1.1 1.1 8.8 8.2 12.1 12.5 9.1 8.9 0.9 0.9Inventories 0.1 0.1 1.6 1.4 1.0 1.2 0.4 0.6 0.1 0.1
of which: Finished goods and merchandise 0.0 0.0 0.9 1.2 0.4 0.4 0.1 0.1 0.0 0.0Cash 3.9 3.7 14.0 13.9 8.9 8.7 6.0 5.6 3.8 3.6Receivables 30.2 29.3 41.1 42.0 34.1 34.8 37.8 38.2 30.0 29.1
Short-term 23.8 22.7 36.6 37.2 29.7 30.5 32.2 32.8 23.6 22.5 of which:
Trade receivables 0.2 0.1 2.4 2.4 1.5 1.6 0.7 0.8 0.2 0.1Receivables from affiliated companies 22.5 21.4 28.8 29.8 24.1 24.6 26.0 26.6 22.4 21.3
Long-term 6.4 6.6 4.5 4.7 4.4 4.3 5.5 5.4 6.4 6.6of which: Loans to affiliated companies 6.1 6.2 4.0 4.1 2.8 3.0 4.7 4.5 6.1 6.2
Securities 2.0 2.6 1.2 1.2 1.5 1.5 1.5 1.6 2.0 2.6Other long-term equity investments 62.0 62.5 26.8 27.1 38.8 37.8 41.9 41.7 62.5 63.0
of which: Goodwill 0.0 0.0 0.1 0.1 0.2 0.1 0.2 0.2 0.0 0.0
CapitalEquity 49.7 48.8 50.6 52.6 50.9 51.1 53.2 53.9 49.6 48.7Liabilities 46.9 47.9 42.0 40.0 43.2 42.8 42.5 41.8 47.0 48.1
Short-term 28.8 30.3 26.5 25.3 26.8 27.1 29.1 28.8 28.8 30.3of which:Liabilities to banks 1.5 1.9 2.9 3.3 4.7 4.6 7.5 7.5 1.4 1.8Trade payables 0.2 0.2 1.8 2.1 1.4 1.4 0.7 0.7 0.2 0.2Liabilities to affiliated companies 25.4 25.9 14.6 13.9 16.2 16.9 18.0 17.7 25.6 26.1
Long-term 18.1 17.7 15.5 14.7 16.4 15.7 13.4 13.0 18.2 17.8 of which:
Liabilities to banks 5.2 5.3 7.4 7.0 9.7 9.4 7.0 6.9 5.1 5.2Liabilities to affiliated companies 8.2 7.1 6.3 5.3 5.3 4.9 5.1 4.6 8.3 7.2
Provisions 3.3 3.2 7.2 7.3 5.7 5.7 4.2 4.3 3.3 3.2of which: Provisions for pensions 1.5 1.5 3.0 3.0 2.3 2.4 1.8 1.9 1.4 1.5
Other ratios Percentage of salesAnnual result before taxes on income 36.7 55.8 7.2 15.2 21.4 21.4 38.6 31.7 37.2 59.8Annual result and depreciation 52.4 69.1 16.7 18.8 23.7 23.3 42.7 36.8 54.4 74.4Trade receivables 4.9 3.9 4.3 4.0 3.7 3.9 5.0 4.8 4.9 3.8
Percentage of the balance sheet totalSales 3.5 3.6 55.6 59.3 40.5 40.3 14.7 16.5 3.2 3.2Annual result and interest paid 1.6 2.3 3.4 8.3 8.6 8.5 5.6 5.1 1.5 2.2
Percentage of liabilities and provisions less cashAnnual result and depreciation 4.0 5.2 26.3 33.2 23.9 23.4 15.4 15.0 3.7 5.0
Percentage of fixed assetsLong-term equity and liabilities 97.4 93.9 146.0 149.6 116.0 116.8 113.1 114.3 97.1 93.5
Percentage of short-term liabilitiesCash resources and short-term receivables 99.6 90.3 191.4 202.7 144.6 145.2 133.6 135.9 98.7 89.3Cash resources, short-term receivables and inventories 100.0 90.8 197.5 208.2 148.5 149.7 135.1 137.8 99.1 89.7
Percentage of cost of materialsTrade payables 20.1 19.3 22.7 21.1 9.0 8.2 18.0 12.9 20.7 20.5
Memo item:Balance sheet total in € billion 1 326.61 1 375.13 0.38 0.40 3.47 3.68 26.11 27.54 1 296.65 1 343.50Sales in € billion 46.81 48.90 0.21 0.24 1.40 1.48 3.84 4.54 41.35 42.63Number of enterprises 4 194 4 194 954 954 685 685 1 073 1 073 1 482 1 482

Deutsche BundesbankFinancial statement statistics (ratios - provisional data)
May 2021169
I. Enterprises by economic sector
cont'd: 15. Activities of head offices
cont'd: All legal formsEnterprises with sales of ... € million
Total Less than 2 2 but less than 10 10 but less than 50 50 and moreQuartile Cylindered sample 2018/2019value 2018 2019 2018 2019 2018 2019 2018 2019 2018 2019Of the enterprises captured …
Ratios ... % had a ratio of less than …Percentage of gross revenue
Cost of materials 25 0.0 0.0 0.0 0.0 0.0 0.0 0.0 0.0 0.0 0.0 50 0.0 0.0 0.0 0.0 0.0 0.0 0.0 0.0 0.4 0.4 75 10.6 10.3 0.0 0.0 1.9 2.1 11.3 11.5 28.0 27.4
Personnel expenses 25 0.0 0.0 0.0 0.0 0.0 0.0 0.0 0.0 11.0 11.8 50 32.0 32.3 0.0 0.0 26.2 27.0 31.5 30.9 45.7 46.8 75 70.7 70.8 63.3 63.2 67.2 66.7 65.1 64.9 81.0 81.6
Depreciation 25 0.0 0.0 0.0 0.0 0.0 0.1 0.4 0.3 0.5 0.5 50 3.0 3.2 0.0 0.0 3.1 4.2 7.2 6.7 6.1 6.0 75 20.0 20.1 0.1 0.4 19.9 20.1 26.2 25.0 27.5 28.5
Annual result 25 - 13.9 - 15.9 0.5 0.4 0.1 - 1.9 - 22.2 - 22.6 - 69.6 - 61.8 50 16.8 16.8 15.0 17.0 21.6 15.9 19.6 20.6 11.3 13.0 75 90.0 91.9 66.7 66.7 92.5 84.2 94.5 92.8 100.5 116.6
Percentage of the balance sheet totalTangible fixed assets 25 0.0 0.0 0.0 0.0 0.0 0.0 0.0 0.0 0.0 0.0
50 0.1 0.1 0.0 0.0 0.7 0.6 0.6 0.6 0.2 0.2 75 4.5 4.3 0.0 0.0 15.8 16.5 18.5 18.4 2.2 2.0
Inventories 25 0.0 0.0 0.0 0.0 0.0 0.0 0.0 0.0 0.0 0.0 50 0.0 0.0 0.0 0.0 0.0 0.0 0.0 0.0 0.0 0.0 75 0.0 0.0 0.0 0.0 0.0 0.0 0.0 0.0 0.0 0.0
Equity 25 29.4 29.7 46.8 50.0 16.8 18.2 25.5 26.2 31.1 30.7 50 60.8 61.2 87.3 88.0 54.8 52.5 55.2 56.2 55.9 55.9 75 88.6 88.9 96.1 95.9 82.8 84.2 83.3 83.9 79.9 80.5
Short-term liabilities 25 2.7 2.7 0.0 0.0 2.8 2.8 4.3 4.6 5.2 5.4 50 13.5 13.6 4.0 4.3 15.8 14.6 19.1 17.8 16.1 17.3 75 37.6 37.9 20.6 19.6 42.4 44.8 45.0 45.3 37.2 38.1
Liabilities to banks 25 0.0 0.0 0.0 0.0 0.0 0.0 0.0 0.0 0.0 0.0 50 0.0 0.0 0.0 0.0 0.0 0.0 0.7 0.7 0.1 0.0 75 14.1 14.9 0.0 0.0 20.4 21.9 22.0 22.6 17.5 18.5
Percentage of salesAnnual result before taxes on income 25 - 4.6 - 6.0 0.6 0.6 0.6 0.2 - 8.3 - 6.1 - 33.1 - 34.1
50 25.0 24.2 20.0 20.1 29.2 24.1 30.9 31.2 21.4 21.5 75 99.5 100.0 71.4 75.3 98.5 96.5 99.0 99.0 124.0 134.0
Annual result and depreciation 25 0.7 0.9 1.2 1.2 6.1 5.2 3.3 3.3 - 10.5 - 7.5 50 39.9 40.9 23.8 29.1 46.6 45.3 54.9 49.7 39.3 42.5 75 107.6 114.3 80.0 84.8 106.7 113.0 114.0 120.1 183.5 179.0
Trade receivables 25 0.0 0.0 0.0 0.0 0.0 0.0 0.0 0.0 0.0 0.0 50 0.0 0.0 0.0 0.0 0.0 0.0 0.0 0.0 0.0 0.0 75 1.0 0.9 0.0 0.0 2.5 2.3 1.1 1.1 0.9 1.0
Percentage of the balance sheet totalAnnual result and interest paid 25 - 0.1 - 0.1 0.4 0.4 0.5 0.6 - 0.4 - 0.4 - 0.7 - 0.8
50 2.9 2.8 3.5 3.6 4.8 4.3 2.8 2.6 1.5 1.6 75 8.1 7.9 7.6 7.6 12.9 12.7 9.6 8.7 5.9 5.7
Percentage of liabilities and provisions less cashAnnual result and depreciation 25 - 3.3 - 3.3 - 8.8 - 8.6 - 2.6 - 2.9 - 2.6 - 2.4 - 2.3 - 2.2
50 4.4 4.7 2.8 2.3 7.6 8.0 5.5 5.8 3.1 3.6 75 27.9 28.3 41.2 50.0 39.8 36.6 28.3 27.6 20.1 18.9
Percentage of fixed assetsLong-term equity and liabilities 25 84.3 85.0 84.6 89.4 78.0 79.5 82.3 83.5 87.2 86.9
50 108.0 108.3 122.3 124.5 108.1 110.7 107.9 108.6 106.2 106.0 75 163.9 163.9 329.4 345.1 189.3 178.5 162.8 161.6 144.8 143.9
Percentage of short-term liabilitiesCash resources and short-term receivables 25 68.4 68.2 119.8 123.7 51.9 53.9 61.6 59.5 70.2 68.2
50 167.8 169.0 640.0 575.0 149.3 146.7 136.3 146.2 151.7 143.9 75 818.7 763.3 2 600.0 2 200.0 828.4 828.0 597.7 547.8 496.4 449.5
Percentage of cost of materialsTrade payables 25 5.0 5.0 0.0 0.0 4.0 4.5 5.2 5.3 6.2 6.0
50 19.6 19.2 5.0 7.9 25.4 18.3 20.1 20.1 20.6 20.8 75 85.6 83.6 52.0 48.8 103.7 87.2 75.7 92.9 90.3 83.0

Deutsche BundesbankFinancial statement statistics (ratios - provisional data)May 2021170
I. Enterprises by economic sector
cont'd: 15. Activities of head offices
CorporationsEnterprises with sales of ... € million
Total Less than 2 2 but less than 10 10 but less than 50 50 and moreCylindered sample 2018/2019
Ratios 2018 2019 2018 2019 2018 2019 2018 2019 2018 2019Income statementIncome Percentage of gross revenueSales 99.8 99.6 99.3 100.5 103.3 101.0 99.6 99.1 99.7 99.6Change in finished goods 0.2 0.4 0.7 - 0.5 - 3.3 - 1.0 0.4 0.9 0.3 0.4Interest and similar income 17.3 16.6 2.3 1.6 2.2 1.4 4.9 3.9 18.9 18.4Other income 129.3 131.2 16.2 16.8 19.2 17.3 45.6 39.1 140.6 144.8
of which: Income from long-term equity investments 60.8 57.9 7.6 8.1 10.3 10.6 27.6 24.9 65.6 63.1Total income 246.7 247.8 118.5 118.3 121.3 118.8 150.5 143.0 259.5 263.2
ExpensesCost of materials 35.0 34.7 15.3 18.3 44.4 46.5 34.0 42.1 34.8 33.6Personnel expenses 35.2 35.4 63.0 59.3 30.5 30.9 35.1 30.5 35.2 35.9Depreciation 29.6 32.2 12.8 6.1 5.1 4.3 11.7 12.0 32.0 35.3
of which: Depreciation of tangible fixed assets 5.0 5.5 2.0 2.0 2.1 2.1 6.0 4.9 5.0 5.7Interest and similar expenses 28.3 25.9 1.8 1.6 2.4 2.3 6.9 5.8 31.0 28.8Operating taxes 0.1 0.1 0.2 0.2 0.1 0.1 0.3 0.3 0.1 0.1Other expenses 85.1 68.2 23.1 23.2 23.4 20.8 31.6 27.9 92.0 74.0Total expenses before taxes on income 213.3 196.4 116.2 108.7 105.9 105.0 119.5 118.6 225.1 207.7Annual result before taxes on income 33.4 51.3 2.3 9.6 15.5 13.8 31.0 24.4 34.4 55.5Taxes on income 20.3 17.1 2.3 2.5 3.4 3.5 9.3 8.0 21.8 18.6Annual result 13.1 34.2 0.0 7.1 12.1 10.3 21.7 16.3 12.5 37.0Profit and loss transfers (parent company) 87.7 85.8 0.1 1.4 4.9 4.9 23.1 17.1 96.3 95.8Profit and loss transfers (subsidiary) 7.5 20.8 1.7 1.2 1.7 0.6 4.4 6.9 8.0 23.0Profit for the year 93.3 99.3 - 1.6 7.3 15.3 14.6 40.3 26.5 100.8 109.8
Balance sheetAssets Percentage of the balance sheet totalIntangible fixed assets 0.3 0.3 0.8 0.7 0.5 0.5 0.5 0.5 0.3 0.2Tangible fixed assets 1.2 1.3 9.4 8.9 9.6 9.7 9.2 9.1 1.1 1.1
of which: Land and buildings 0.8 0.9 5.2 4.9 7.2 7.5 7.3 7.0 0.7 0.8Inventories 0.1 0.1 2.0 1.7 1.1 1.2 0.5 0.7 0.1 0.1
of which: Finished goods and merchandise 0.0 0.0 1.1 1.4 0.3 0.4 0.1 0.1 0.0 0.0Cash 4.0 3.8 15.1 14.4 9.6 9.2 6.6 6.1 3.9 3.7Receivables 29.7 28.9 44.4 46.4 37.1 38.3 37.2 37.8 29.6 28.7
Short-term 23.4 22.4 39.3 41.2 32.2 33.4 31.2 32.1 23.2 22.2 of which:
Trade receivables 0.2 0.1 2.6 2.6 1.6 1.7 0.8 0.9 0.1 0.1Receivables from affiliated companies 22.1 21.0 31.2 33.1 26.1 26.9 27.0 27.8 22.0 20.9
Long-term 6.4 6.5 5.1 5.2 4.9 4.9 6.0 5.7 6.4 6.5of which: Loans to affiliated companies 6.1 6.2 4.4 4.5 3.1 3.5 5.2 4.7 6.1 6.2
Securities 1.9 2.6 1.4 1.4 1.7 1.8 1.7 1.7 1.9 2.6Other long-term equity investments 62.7 63.0 26.7 26.1 40.2 39.0 44.2 43.9 63.1 63.4
of which: Goodwill 0.0 0.0 0.1 0.1 0.2 0.2 0.2 0.2 0.0 0.0
CapitalEquity 49.6 48.8 52.9 54.1 54.6 54.9 59.6 59.6 49.5 48.6Liabilities 46.8 47.9 39.0 37.7 38.4 38.1 35.7 35.6 47.1 48.1
Short-term 28.5 30.2 24.9 23.3 22.6 23.2 23.0 23.2 28.6 30.3of which:Liabilities to banks 1.3 1.7 2.6 2.9 4.3 3.8 5.2 5.4 1.2 1.6Trade payables 0.2 0.2 2.0 2.4 1.6 1.6 0.8 0.8 0.2 0.2Liabilities to affiliated companies 25.3 25.9 13.2 11.8 12.7 13.7 14.3 14.3 25.5 26.1
Long-term 18.4 17.7 14.1 14.4 15.8 14.9 12.7 12.4 18.5 17.8 of which:
Liabilities to banks 5.1 5.1 6.5 6.7 9.8 9.2 6.7 6.6 5.0 5.1Liabilities to affiliated companies 8.4 7.1 6.0 5.6 4.7 4.2 4.7 4.3 8.5 7.2
Provisions 3.5 3.3 7.9 8.0 6.8 6.8 4.7 4.7 3.4 3.3of which: Provisions for pensions 1.5 1.5 3.4 3.4 2.9 2.9 2.0 2.1 1.5 1.5
Other ratios Percentage of salesAnnual result before taxes on income 33.4 51.5 2.3 9.6 15.0 13.7 31.1 24.6 34.5 55.7Annual result and depreciation 42.8 66.6 12.9 13.1 16.6 14.5 33.5 28.6 44.7 72.5Trade receivables 5.1 3.9 4.3 4.1 3.3 3.6 5.8 5.4 5.1 3.8
Percentage of the balance sheet totalSales 3.2 3.3 60.2 64.4 47.5 47.0 14.2 16.7 2.9 2.9Annual result and interest paid 1.3 2.0 1.1 5.6 6.7 5.9 4.1 3.7 1.3 1.9
Percentage of liabilities and provisions less cashAnnual result and depreciation 2.9 4.6 24.3 26.9 22.1 18.9 14.1 13.9 2.8 4.5
Percentage of fixed assetsLong-term equity and liabilities 97.0 93.4 163.1 170.5 129.3 130.4 122.2 123.3 96.5 92.9
Percentage of short-term liabilitiesCash resources and short-term receivables 98.9 89.2 218.7 239.5 185.9 184.4 167.8 168.1 97.8 88.0Cash resources, short-term receivables and inventories 99.2 89.5 226.6 246.7 190.6 189.8 170.0 171.2 98.0 88.3
Percentage of cost of materialsTrade payables 19.8 18.8 22.0 20.6 8.0 7.2 15.6 10.9 20.6 20.4
Memo item:Balance sheet total in € billion 1 172.07 1 212.05 0.31 0.33 2.53 2.69 18.87 19.95 1 150.36 1 189.08Sales in € billion 37.38 39.72 0.18 0.21 1.20 1.27 2.69 3.32 33.31 34.92Number of enterprises 3 334 3 334 880 880 510 510 770 770 1 174 1 174

Deutsche BundesbankFinancial statement statistics (ratios - provisional data)
May 2021171
I. Enterprises by economic sector
cont'd: 15. Activities of head offices
cont'd: CorporationsEnterprises with sales of ... € million
Total Less than 2 2 but less than 10 10 but less than 50 50 and moreQuartile Cylindered sample 2018/2019value 2018 2019 2018 2019 2018 2019 2018 2019 2018 2019Of the enterprises captured …
Ratios ... % had a ratio of less than …Percentage of gross revenue
Cost of materials 25 0.0 0.0 0.0 0.0 0.0 0.0 0.0 0.0 0.0 0.0 50 0.0 0.0 0.0 0.0 0.0 0.0 0.0 0.0 0.9 0.8 75 12.5 12.5 0.0 0.0 2.7 3.0 14.9 14.4 30.7 30.1
Personnel expenses 25 0.0 0.0 0.0 0.0 0.0 0.0 3.3 2.2 14.8 15.3 50 38.9 38.5 0.0 0.0 38.0 39.6 43.1 39.6 49.0 50.6 75 77.3 76.9 66.2 65.9 70.7 71.1 70.8 74.1 90.3 91.3
Depreciation 25 0.0 0.0 0.0 0.0 0.0 0.0 0.3 0.2 0.6 0.6 50 2.1 2.2 0.0 0.0 1.8 2.2 5.4 4.8 6.7 6.9 75 16.5 17.4 0.0 0.0 10.5 14.2 23.7 23.4 27.9 30.5
Annual result 25 - 27.0 - 28.9 0.4 0.3 - 1.8 - 7.6 - 43.4 - 50.9 - 110.8 - 100.0 50 8.3 8.9 13.6 13.4 14.0 10.2 7.4 6.3 2.4 4.4 75 75.7 80.1 66.7 66.7 80.7 68.5 73.1 77.7 92.0 108.9
Percentage of the balance sheet totalTangible fixed assets 25 0.0 0.0 0.0 0.0 0.0 0.0 0.0 0.0 0.0 0.0
50 0.0 0.0 0.0 0.0 0.2 0.2 0.3 0.3 0.2 0.2 75 2.3 2.1 0.0 0.0 6.6 7.0 10.2 10.2 1.9 1.9
Inventories 25 0.0 0.0 0.0 0.0 0.0 0.0 0.0 0.0 0.0 0.0 50 0.0 0.0 0.0 0.0 0.0 0.0 0.0 0.0 0.0 0.0 75 0.0 0.0 0.0 0.0 0.0 0.0 0.0 0.0 0.0 0.0
Equity 25 36.1 36.0 54.8 56.4 23.0 23.0 34.0 34.8 34.6 34.0 50 66.9 67.8 88.8 88.9 59.0 58.8 63.3 65.3 58.6 58.2 75 91.3 90.8 96.3 96.0 87.1 88.1 88.5 88.1 81.2 81.3
Short-term liabilities 25 1.8 1.9 0.0 0.0 2.2 1.9 3.2 3.0 4.3 4.3 50 10.3 10.4 3.5 3.6 11.4 11.2 12.7 12.3 14.4 15.4 75 30.0 30.1 17.6 16.9 33.7 36.0 32.7 32.0 31.8 34.2
Liabilities to banks 25 0.0 0.0 0.0 0.0 0.0 0.0 0.0 0.0 0.0 0.0 50 0.0 0.0 0.0 0.0 0.0 0.0 0.0 0.0 0.1 0.0 75 11.1 11.3 0.0 0.0 19.0 18.7 18.4 19.0 16.1 17.1
Percentage of salesAnnual result before taxes on income 25 - 11.0 - 13.5 0.6 0.5 0.0 - 2.6 - 19.3 - 24.7 - 60.5 - 52.3
50 14.4 15.0 17.1 16.2 19.6 15.9 15.0 13.9 10.3 13.8 75 95.9 97.2 70.0 75.3 88.3 89.2 96.2 97.5 117.3 129.4
Annual result and depreciation 25 0.0 - 0.3 0.8 0.8 2.6 2.0 - 5.8 - 6.6 - 24.5 - 16.9 50 28.2 29.2 20.0 23.6 33.2 29.6 33.2 29.1 29.3 34.2 75 100.0 104.7 75.0 84.1 98.8 97.9 105.3 112.4 168.9 188.9
Trade receivables 25 0.0 0.0 0.0 0.0 0.0 0.0 0.0 0.0 0.0 0.0 50 0.0 0.0 0.0 0.0 0.0 0.0 0.0 0.0 0.0 0.0 75 1.1 0.9 0.0 0.0 2.7 2.3 1.7 1.6 1.0 1.0
Percentage of the balance sheet totalAnnual result and interest paid 25 - 0.5 - 0.6 0.3 0.2 0.0 - 0.3 - 1.3 - 1.6 - 1.2 - 1.3
50 2.3 2.2 3.3 3.3 4.4 3.3 1.9 1.8 1.0 1.1 75 7.0 6.6 7.1 6.9 10.9 11.0 7.9 7.1 5.0 4.9
Percentage of liabilities and provisions less cashAnnual result and depreciation 25 - 4.7 - 5.0 - 9.5 - 10.3 - 4.5 - 5.8 - 6.0 - 5.7 - 3.0 - 2.9
50 2.7 2.8 0.8 0.8 6.1 5.6 3.1 3.2 2.0 2.2 75 27.3 27.1 43.8 50.0 37.2 31.9 27.4 27.6 18.6 17.3
Percentage of fixed assetsLong-term equity and liabilities 25 91.0 91.2 91.9 92.7 90.8 92.4 93.6 93.5 89.8 89.3
50 114.4 114.2 133.8 140.6 119.3 121.8 118.9 117.6 108.7 107.9 75 179.2 179.6 396.1 514.2 233.4 216.3 183.4 178.0 149.0 147.8
Percentage of short-term liabilitiesCash resources and short-term receivables 25 83.2 84.4 138.7 155.8 69.9 77.4 82.8 82.9 74.6 71.8
50 230.9 229.8 766.7 700.0 209.9 217.1 200.5 207.5 173.7 159.3 75 1 097.9 1 044.4 2 700.0 2 400.0 1 352.1 1 202.7 881.6 824.2 572.1 517.1
Percentage of cost of materialsTrade payables 25 5.0 5.0 0.0 0.0 7.8 5.0 5.5 5.0 5.9 6.0
50 19.5 18.3 4.7 7.5 28.5 17.8 20.7 19.3 19.7 19.9 75 74.7 67.9 39.0 33.3 107.1 67.5 74.0 85.2 73.7 68.8

Deutsche BundesbankFinancial statement statistics (ratios - provisional data)May 2021172
I. Enterprises by economic sector
cont'd: 15. Activities of head offices
Non-corporationsEnterprises with sales of ... € million
Total Less than 2 2 but less than 10 10 but less than 50 50 and moreCylindered sample 2018/2019
Ratios 2018 2019 2018 2019 2018 2019 2018 2019 2018 2019Income statementIncome Percentage of gross revenueSales 100.1 99.2 101.7 100.0 98.7 100.3 101.2 100.0 100.0 99.0Change in finished goods - 0.1 0.8 - 1.7 0.0 1.3 - 0.3 - 1.2 0.0 0.0 1.0Interest and similar income 9.2 10.5 1.3 1.7 6.0 4.1 3.2 3.2 10.2 11.8Other income 83.5 81.5 39.5 58.5 52.4 61.7 49.7 45.5 89.2 87.7
of which: Income from long-term equity investments 52.6 66.6 21.8 37.6 42.1 49.2 41.9 38.8 54.4 71.5Total income 192.7 191.9 140.8 160.3 158.4 165.9 153.0 148.7 199.4 199.5
ExpensesCost of materials 19.9 21.6 6.7 7.7 14.8 12.9 15.0 13.8 20.8 23.1Personnel expenses 29.4 32.3 38.1 37.6 36.5 38.2 38.2 38.6 27.9 31.1Depreciation 43.8 10.1 11.3 10.9 9.4 10.5 11.5 11.5 49.3 9.9
of which: Depreciation of tangible fixed assets 4.9 5.4 10.6 10.2 8.4 8.9 8.8 8.7 4.2 4.8Interest and similar expenses 15.2 15.8 3.4 3.1 7.8 6.5 7.2 6.8 16.6 17.5Operating taxes 0.2 0.3 1.4 1.4 0.4 0.4 0.3 0.3 0.1 0.2Other expenses 34.7 38.1 38.2 39.5 31.1 30.1 24.0 26.6 36.3 40.2Total expenses before taxes on income 143.2 118.2 99.1 100.2 100.0 98.6 96.2 97.6 151.1 122.0Annual result before taxes on income 49.5 73.7 41.7 60.0 58.4 67.3 56.7 51.1 48.3 77.5Taxes on income 2.9 4.7 9.7 7.1 2.9 2.3 3.5 3.5 2.8 4.9Annual result 46.6 69.1 32.0 53.0 55.5 64.9 53.2 47.6 45.5 72.6Profit and loss transfers (parent company) 29.3 9.5 4.6 3.7 4.5 3.4 8.5 6.9 33.0 10.1Profit and loss transfers (subsidiary) - 0.2 - 0.2 0.1 0.0 - 0.7 0.2 0.6 0.2 - 0.3 - 0.2Profit for the year 76.2 78.8 36.5 56.7 60.7 68.1 61.1 54.3 78.9 83.0
Balance sheetAssets Percentage of the balance sheet totalIntangible fixed assets 0.2 0.2 0.2 0.1 0.2 0.2 0.7 0.9 0.2 0.2Tangible fixed assets 3.4 3.3 35.1 34.3 30.1 30.7 18.1 18.1 2.5 2.4
of which: Land and buildings 2.6 2.5 23.7 23.1 25.1 26.0 13.7 13.8 1.9 1.8Inventories 0.3 0.3 0.2 0.1 1.0 1.2 0.3 0.2 0.3 0.3
of which: Finished goods and merchandise 0.1 0.1 0.1 0.1 0.7 0.4 0.2 0.0 0.1 0.1Cash 3.2 3.0 9.6 11.3 6.9 7.3 4.6 4.4 3.1 2.9Receivables 33.8 32.6 27.4 22.0 26.0 25.4 39.2 39.3 33.6 32.3
Short-term 27.3 25.5 25.5 19.5 23.0 22.7 34.8 34.6 27.0 25.1 of which:
Trade receivables 0.2 0.2 1.7 1.1 1.4 1.3 0.5 0.5 0.2 0.2Receivables from affiliated companies 25.4 24.0 18.8 14.6 18.5 18.4 23.5 23.3 25.5 24.0
Long-term 6.5 7.1 1.9 2.4 3.0 2.7 4.4 4.7 6.6 7.2of which: Loans to affiliated companies 6.2 6.4 1.9 2.4 2.2 1.9 3.5 4.0 6.4 6.5
Securities 2.2 2.2 0.0 0.0 0.7 0.6 1.1 1.1 2.3 2.2Other long-term equity investments 56.7 58.3 27.3 31.9 35.1 34.4 35.9 35.8 57.9 59.6
of which: Goodwill 0.0 0.0 0.0 0.0 0.0 0.0 0.1 0.1 0.0 0.0
CapitalEquity 50.0 49.1 40.8 45.7 40.8 40.5 36.7 38.9 50.8 49.7Liabilities 47.5 48.4 54.6 50.3 56.2 56.0 60.3 58.1 46.8 47.8
Short-term 31.2 30.9 33.1 34.3 38.3 38.0 45.2 43.5 30.5 30.2of which:Liabilities to banks 3.6 3.5 4.2 4.8 5.9 7.0 13.6 12.9 3.0 3.0Trade payables 0.3 0.3 0.8 0.9 0.9 0.9 0.7 0.7 0.2 0.2Liabilities to affiliated companies 26.1 25.9 20.1 23.4 25.6 25.9 27.4 26.6 26.1 25.8
Long-term 16.3 17.4 21.5 16.0 17.9 18.0 15.1 14.6 16.3 17.6 of which:
Liabilities to banks 6.1 6.5 10.9 8.5 9.3 9.9 7.8 7.8 6.0 6.4Liabilities to affiliated companies 6.5 7.2 7.4 4.4 6.8 7.0 6.0 5.4 6.5 7.3
Provisions 2.4 2.5 4.5 3.9 2.7 2.4 2.9 3.0 2.4 2.5of which: Provisions for pensions 1.2 1.3 1.5 1.5 0.8 0.8 1.2 1.2 1.2 1.3
Other ratios Percentage of salesAnnual result before taxes on income 49.5 74.3 41.0 60.0 59.2 67.1 56.1 51.1 48.3 78.3Annual result and depreciation 90.3 79.8 42.6 63.8 65.8 75.2 64.0 59.0 94.8 83.3Trade receivables 3.9 3.7 4.7 3.0 6.3 5.9 3.1 3.2 4.0 3.7
Percentage of the balance sheet totalSales 6.1 5.6 36.8 36.4 21.7 22.0 15.9 16.0 5.5 5.0Annual result and interest paid 3.8 4.8 12.8 20.4 13.9 15.7 9.5 8.7 3.4 4.5
Percentage of liabilities and provisions less cashAnnual result and depreciation 11.8 9.4 31.6 54.1 27.3 31.7 17.3 16.7 11.3 8.8
Percentage of fixed assetsLong-term equity and liabilities 100.8 98.2 98.7 91.9 86.5 86.5 88.8 90.7 101.4 98.6
Percentage of short-term liabilitiesCash resources and short-term receivables 104.4 98.8 106.0 90.1 78.6 79.4 88.3 90.7 105.8 99.5Cash resources, short-term receivables and inventories 105.3 99.8 106.5 90.6 81.1 82.5 88.9 91.0 106.7 100.6
Percentage of cost of materialsTrade payables 22.5 22.2 34.0 31.2 26.7 30.2 31.1 29.4 21.5 21.4
Memo item:Balance sheet total in € billion 154.55 163.08 0.07 0.07 0.94 0.98 7.25 7.60 146.29 154.42Sales in € billion 9.42 9.17 0.03 0.03 0.20 0.22 1.15 1.22 8.04 7.71Number of enterprises 860 860 74 74 175 175 303 303 308 308
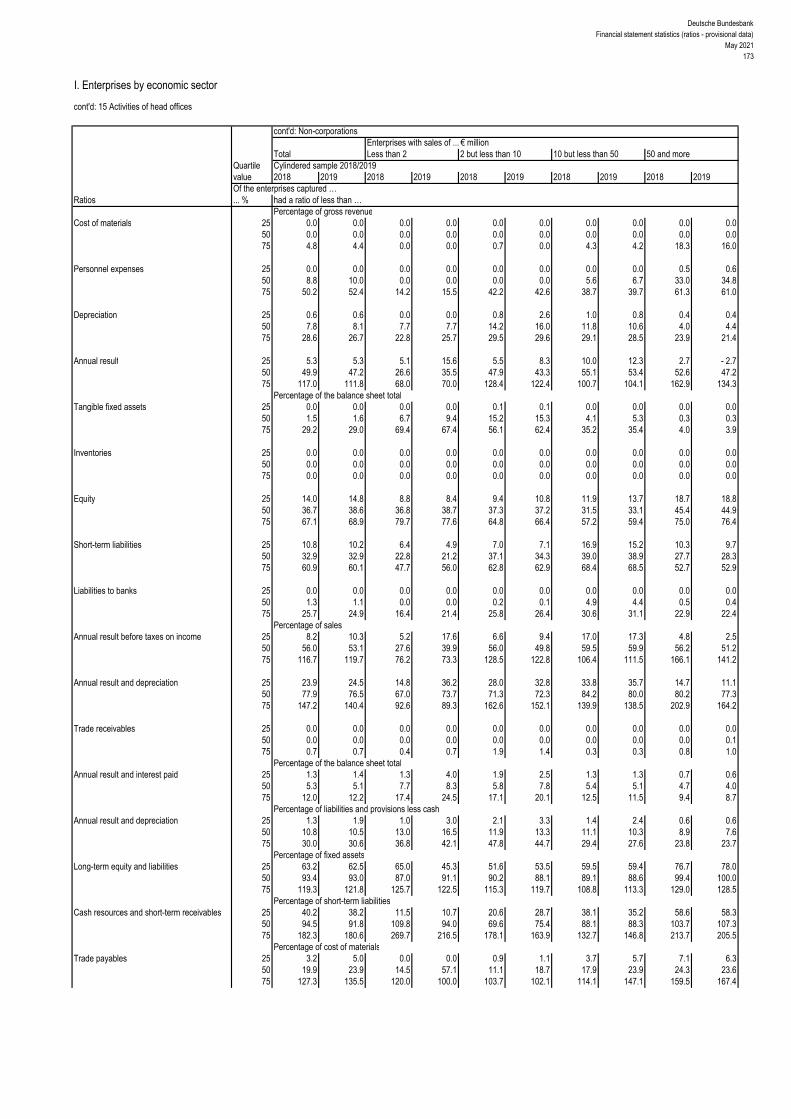
Deutsche BundesbankFinancial statement statistics (ratios - provisional data)
May 2021173
I. Enterprises by economic sector
cont'd: 15 Activities of head offices
cont'd: Non-corporationsEnterprises with sales of ... € million
Total Less than 2 2 but less than 10 10 but less than 50 50 and moreQuartile Cylindered sample 2018/2019value 2018 2019 2018 2019 2018 2019 2018 2019 2018 2019Of the enterprises captured …
Ratios ... % had a ratio of less than …Percentage of gross revenue
Cost of materials 25 0.0 0.0 0.0 0.0 0.0 0.0 0.0 0.0 0.0 0.0 50 0.0 0.0 0.0 0.0 0.0 0.0 0.0 0.0 0.0 0.0 75 4.8 4.4 0.0 0.0 0.7 0.0 4.3 4.2 18.3 16.0
Personnel expenses 25 0.0 0.0 0.0 0.0 0.0 0.0 0.0 0.0 0.5 0.6 50 8.8 10.0 0.0 0.0 0.0 0.0 5.6 6.7 33.0 34.8 75 50.2 52.4 14.2 15.5 42.2 42.6 38.7 39.7 61.3 61.0
Depreciation 25 0.6 0.6 0.0 0.0 0.8 2.6 1.0 0.8 0.4 0.4 50 7.8 8.1 7.7 7.7 14.2 16.0 11.8 10.6 4.0 4.4 75 28.6 26.7 22.8 25.7 29.5 29.6 29.1 28.5 23.9 21.4
Annual result 25 5.3 5.3 5.1 15.6 5.5 8.3 10.0 12.3 2.7 - 2.7 50 49.9 47.2 26.6 35.5 47.9 43.3 55.1 53.4 52.6 47.2 75 117.0 111.8 68.0 70.0 128.4 122.4 100.7 104.1 162.9 134.3
Percentage of the balance sheet totalTangible fixed assets 25 0.0 0.0 0.0 0.0 0.1 0.1 0.0 0.0 0.0 0.0
50 1.5 1.6 6.7 9.4 15.2 15.3 4.1 5.3 0.3 0.3 75 29.2 29.0 69.4 67.4 56.1 62.4 35.2 35.4 4.0 3.9
Inventories 25 0.0 0.0 0.0 0.0 0.0 0.0 0.0 0.0 0.0 0.0 50 0.0 0.0 0.0 0.0 0.0 0.0 0.0 0.0 0.0 0.0 75 0.0 0.0 0.0 0.0 0.0 0.0 0.0 0.0 0.0 0.0
Equity 25 14.0 14.8 8.8 8.4 9.4 10.8 11.9 13.7 18.7 18.8 50 36.7 38.6 36.8 38.7 37.3 37.2 31.5 33.1 45.4 44.9 75 67.1 68.9 79.7 77.6 64.8 66.4 57.2 59.4 75.0 76.4
Short-term liabilities 25 10.8 10.2 6.4 4.9 7.0 7.1 16.9 15.2 10.3 9.7 50 32.9 32.9 22.8 21.2 37.1 34.3 39.0 38.9 27.7 28.3 75 60.9 60.1 47.7 56.0 62.8 62.9 68.4 68.5 52.7 52.9
Liabilities to banks 25 0.0 0.0 0.0 0.0 0.0 0.0 0.0 0.0 0.0 0.0 50 1.3 1.1 0.0 0.0 0.2 0.1 4.9 4.4 0.5 0.4 75 25.7 24.9 16.4 21.4 25.8 26.4 30.6 31.1 22.9 22.4
Percentage of salesAnnual result before taxes on income 25 8.2 10.3 5.2 17.6 6.6 9.4 17.0 17.3 4.8 2.5
50 56.0 53.1 27.6 39.9 56.0 49.8 59.5 59.9 56.2 51.2 75 116.7 119.7 76.2 73.3 128.5 122.8 106.4 111.5 166.1 141.2
Annual result and depreciation 25 23.9 24.5 14.8 36.2 28.0 32.8 33.8 35.7 14.7 11.1 50 77.9 76.5 67.0 73.7 71.3 72.3 84.2 80.0 80.2 77.3 75 147.2 140.4 92.6 89.3 162.6 152.1 139.9 138.5 202.9 164.2
Trade receivables 25 0.0 0.0 0.0 0.0 0.0 0.0 0.0 0.0 0.0 0.0 50 0.0 0.0 0.0 0.0 0.0 0.0 0.0 0.0 0.0 0.1 75 0.7 0.7 0.4 0.7 1.9 1.4 0.3 0.3 0.8 1.0
Percentage of the balance sheet totalAnnual result and interest paid 25 1.3 1.4 1.3 4.0 1.9 2.5 1.3 1.3 0.7 0.6
50 5.3 5.1 7.7 8.3 5.8 7.8 5.4 5.1 4.7 4.0 75 12.0 12.2 17.4 24.5 17.1 20.1 12.5 11.5 9.4 8.7
Percentage of liabilities and provisions less cashAnnual result and depreciation 25 1.3 1.9 1.0 3.0 2.1 3.3 1.4 2.4 0.6 0.6
50 10.8 10.5 13.0 16.5 11.9 13.3 11.1 10.3 8.9 7.6 75 30.0 30.6 36.8 42.1 47.8 44.7 29.4 27.6 23.8 23.7
Percentage of fixed assetsLong-term equity and liabilities 25 63.2 62.5 65.0 45.3 51.6 53.5 59.5 59.4 76.7 78.0
50 93.4 93.0 87.0 91.1 90.2 88.1 89.1 88.6 99.4 100.0 75 119.3 121.8 125.7 122.5 115.3 119.7 108.8 113.3 129.0 128.5
Percentage of short-term liabilitiesCash resources and short-term receivables 25 40.2 38.2 11.5 10.7 20.6 28.7 38.1 35.2 58.6 58.3
50 94.5 91.8 109.8 94.0 69.6 75.4 88.1 88.3 103.7 107.3 75 182.3 180.6 269.7 216.5 178.1 163.9 132.7 146.8 213.7 205.5
Percentage of cost of materialsTrade payables 25 3.2 5.0 0.0 0.0 0.9 1.1 3.7 5.7 7.1 6.3
50 19.9 23.9 14.5 57.1 11.1 18.7 17.9 23.9 24.3 23.6 75 127.3 135.5 120.0 100.0 103.7 102.1 114.1 147.1 159.5 167.4

Deutsche BundesbankFinancial statement statistics (ratios - provisional data)May 2021174
II. Enterprises by selected legal form
1. Public limited companies
All legal formsEnterprises with sales of ... € million
Total Less than 2 2 but less than 10 10 but less than 50 50 and moreCylindered sample 2018/2019
Ratios 2018 2019 2018 2019 2018 2019 2018 2019 2018 2019Income statementIncome Percentage of gross revenueSales 99.5 99.7 99.5 98.2 98.8 98.7 98.6 98.9 99.6 99.8Change in finished goods 0.5 0.3 0.5 1.8 1.2 1.3 1.4 1.1 0.4 0.2Interest and similar income 0.7 0.8 2.3 2.5 0.4 0.3 0.3 0.4 0.7 0.8Other income 7.4 8.1 32.7 41.1 6.2 6.0 4.3 4.3 7.4 8.1
of which: Income from long-term equity investments 3.0 2.8 0.4 0.3 1.5 1.1 1.0 0.9 3.0 2.8Total income 108.1 108.9 135.0 143.6 106.6 106.3 104.6 104.7 108.1 108.9
ExpensesCost of materials 71.4 72.0 28.3 29.6 37.4 36.0 43.4 43.1 71.8 72.4Personnel expenses 14.1 14.1 45.8 43.8 38.5 39.1 33.4 33.9 13.9 13.8Depreciation 3.3 3.6 9.7 10.5 4.0 4.2 4.1 4.2 3.3 3.6
of which: Depreciation of tangible fixed assets 2.9 3.1 8.6 8.3 3.5 3.7 3.5 3.6 2.9 3.1Interest and similar expenses 2.4 2.0 4.6 3.7 1.2 1.2 0.8 0.8 2.5 2.0Operating taxes 0.0 0.0 0.3 0.3 0.1 0.1 0.1 0.1 0.0 0.0Other expenses 13.4 13.5 54.5 63.9 19.1 20.6 17.8 17.7 13.3 13.4Total expenses before taxes on income 104.7 105.3 143.3 151.8 100.3 101.1 99.6 99.8 104.8 105.3Annual result before taxes on income 3.3 3.6 - 8.3 - 8.2 6.2 5.2 5.0 4.9 3.3 3.6Taxes on income 1.1 1.0 0.0 1.4 2.1 1.8 1.5 1.5 1.1 1.0Annual result 2.2 2.7 - 8.3 - 9.6 4.2 3.4 3.5 3.4 2.2 2.7Profit and loss transfers (parent company) 2.7 2.4 1.4 0.0 0.8 1.0 0.0 0.0 2.7 2.4Profit and loss transfers (subsidiary) 0.8 1.0 1.5 1.1 0.6 0.6 0.5 0.5 0.8 1.0Profit for the year 4.2 4.0 - 8.4 - 10.7 4.4 3.7 3.0 3.0 4.2 4.0
Balance sheetAssets Percentage of the balance sheet totalIntangible fixed assets 1.4 1.4 2.8 2.5 1.6 1.4 1.2 1.3 1.4 1.4Tangible fixed assets 13.8 13.7 28.4 29.1 27.4 26.8 28.3 28.5 13.7 13.6
of which: Land and buildings 4.3 4.3 17.8 17.3 15.5 15.5 13.0 13.1 4.2 4.2Inventories 6.1 6.0 4.4 4.0 13.7 12.9 20.0 18.9 6.0 5.9
of which: Finished goods and merchandise 3.1 3.0 2.4 2.0 4.9 4.7 4.7 4.8 3.0 3.0Cash 4.8 3.9 20.3 14.9 16.7 15.3 13.2 13.1 4.7 3.8Receivables 28.4 29.0 34.6 40.3 26.4 26.7 24.3 24.7 28.5 29.0
Short-term 22.3 22.3 25.7 26.1 24.9 25.1 21.4 21.7 22.3 22.3 of which:
Trade receivables 3.4 3.1 4.3 4.7 12.2 12.6 10.5 10.3 3.3 3.0Receivables from affiliated companies 17.2 17.4 17.5 16.9 8.6 8.5 8.3 8.5 17.3 17.4
Long-term 6.1 6.6 8.9 14.2 1.5 1.6 3.0 3.0 6.1 6.7of which: Loans to affiliated companies 5.9 6.5 7.3 12.9 1.1 1.2 2.3 2.5 5.9 6.5
Securities 3.6 3.6 1.7 1.6 2.6 2.4 2.6 2.5 3.6 3.6Other long-term equity investments 41.5 42.0 7.2 7.1 10.8 13.7 9.5 10.2 41.7 42.3
of which: Goodwill 0.3 0.3 0.1 0.1 0.3 0.2 0.1 0.1 0.3 0.3
CapitalEquity 33.7 33.2 55.7 52.4 44.4 42.6 48.4 49.0 33.5 33.1Liabilities 50.3 50.8 37.8 40.5 42.7 44.6 39.5 38.8 50.4 50.9
Short-term 30.5 31.1 23.8 21.9 28.0 30.1 29.7 28.5 30.5 31.2of which:Liabilities to banks 1.2 1.5 2.5 2.2 7.1 7.2 5.1 5.4 1.2 1.5Trade payables 3.6 3.4 3.4 3.5 4.7 4.8 4.5 4.4 3.6 3.4Liabilities to affiliated companies 21.1 22.0 7.5 8.5 5.7 7.3 6.1 6.0 21.2 22.1
Long-term 19.8 19.6 14.0 18.6 14.7 14.5 9.9 10.3 19.9 19.7 of which:
Liabilities to banks 3.0 3.1 7.4 8.0 9.9 10.4 7.6 7.8 3.0 3.1Liabilities to affiliated companies 11.3 10.5 1.4 5.9 2.5 2.0 1.2 1.4 11.4 10.6
Provisions 15.3 15.3 5.5 5.7 11.0 10.4 10.5 10.5 15.3 15.3of which: Provisions for pensions 5.2 5.3 1.5 1.5 3.1 3.2 3.2 3.3 5.2 5.3
Other ratios Percentage of salesAnnual result before taxes on income 3.3 3.6 - 8.4 - 8.3 6.3 5.2 5.1 5.0 3.3 3.6Annual result and depreciation 5.6 6.3 1.4 1.0 8.3 7.7 7.7 7.7 5.6 6.2Trade receivables 4.8 4.5 11.7 12.6 12.3 13.1 11.2 10.8 4.7 4.4
Percentage of the balance sheet totalSales 71.0 69.2 36.4 37.0 99.6 95.5 93.8 95.1 70.8 69.0Annual result and interest paid 3.3 3.2 - 1.4 - 2.2 5.4 4.4 4.1 4.1 3.3 3.2
Percentage of liabilities and provisions less cashAnnual result and depreciation 6.5 6.9 2.1 1.1 21.3 17.4 18.8 19.4 6.4 6.8
Percentage of fixed assetsLong-term equity and liabilities 90.8 88.8 146.9 134.5 142.6 132.2 140.3 140.1 90.5 88.5
Percentage of short-term liabilitiesCash resources and short-term receivables 94.5 89.6 195.5 189.7 149.8 135.1 119.4 124.7 94.3 89.3Cash resources, short-term receivables and inventories 114.6 109.0 213.9 208.1 198.9 177.9 186.8 191.0 113.9 108.3
Percentage of cost of materialsTrade payables 7.2 6.8 32.7 31.4 12.6 13.8 10.8 10.6 7.1 6.7
Memo item:Balance sheet total in € billion 1 398.18 1 468.32 0.28 0.30 1.47 1.64 11.05 11.29 1 385.37 1 455.10Sales in € billion 992.78 1 015.87 0.10 0.11 1.47 1.56 10.37 10.74 980.84 1 003.46Number of enterprises 1 419 1 419 103 103 269 269 414 414 633 633
* Agriculture, forestry and fishing, mining and quarrying, manufacturing, electricity, gas and water supply, construction, trade, transportation and storage,accommodation and food service activities, information and communication, business services, personal service activities
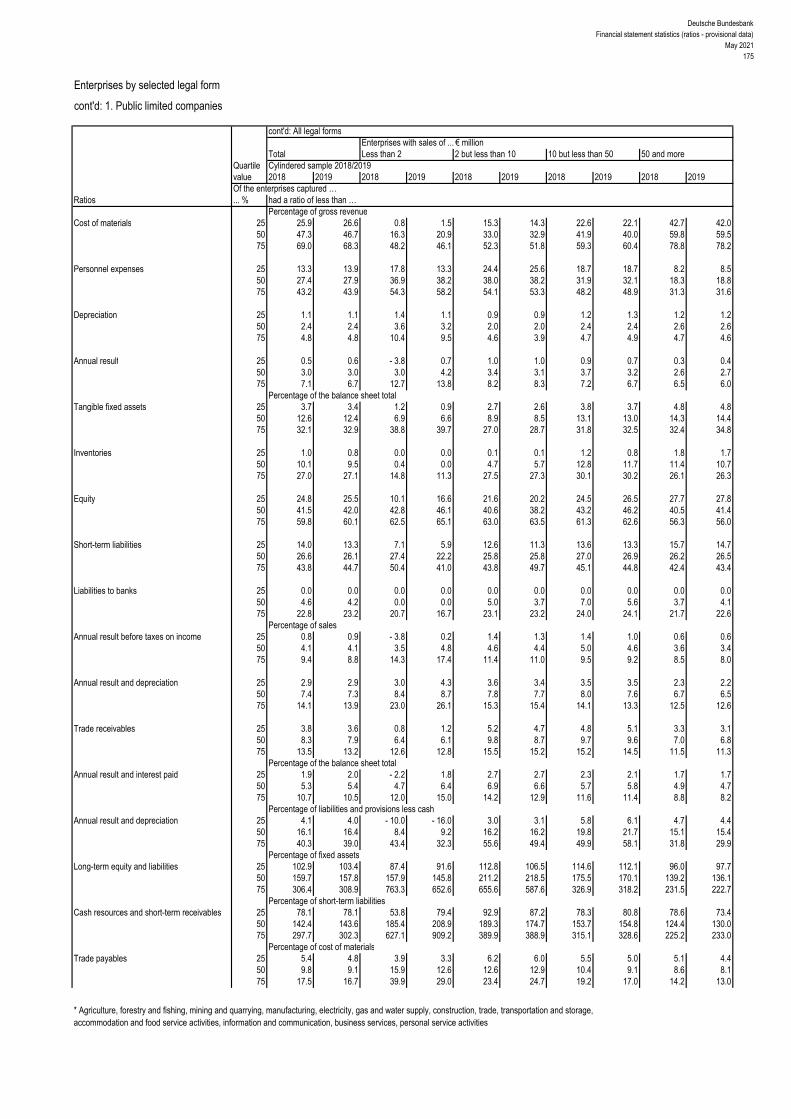
Deutsche BundesbankFinancial statement statistics (ratios - provisional data)
May 2021175
Enterprises by selected legal form
cont'd: 1. Public limited companies
cont'd: All legal formsEnterprises with sales of ... € million
Total Less than 2 2 but less than 10 10 but less than 50 50 and moreQuartile Cylindered sample 2018/2019value 2018 2019 2018 2019 2018 2019 2018 2019 2018 2019Of the enterprises captured …
Ratios ... % had a ratio of less than …Percentage of gross revenue
Cost of materials 25 25.9 26.6 0.8 1.5 15.3 14.3 22.6 22.1 42.7 42.0 50 47.3 46.7 16.3 20.9 33.0 32.9 41.9 40.0 59.8 59.5 75 69.0 68.3 48.2 46.1 52.3 51.8 59.3 60.4 78.8 78.2
Personnel expenses 25 13.3 13.9 17.8 13.3 24.4 25.6 18.7 18.7 8.2 8.5 50 27.4 27.9 36.9 38.2 38.0 38.2 31.9 32.1 18.3 18.8 75 43.2 43.9 54.3 58.2 54.1 53.3 48.2 48.9 31.3 31.6
Depreciation 25 1.1 1.1 1.4 1.1 0.9 0.9 1.2 1.3 1.2 1.2 50 2.4 2.4 3.6 3.2 2.0 2.0 2.4 2.4 2.6 2.6 75 4.8 4.8 10.4 9.5 4.6 3.9 4.7 4.9 4.7 4.6
Annual result 25 0.5 0.6 - 3.8 0.7 1.0 1.0 0.9 0.7 0.3 0.4 50 3.0 3.0 3.0 4.2 3.4 3.1 3.7 3.2 2.6 2.7 75 7.1 6.7 12.7 13.8 8.2 8.3 7.2 6.7 6.5 6.0
Percentage of the balance sheet totalTangible fixed assets 25 3.7 3.4 1.2 0.9 2.7 2.6 3.8 3.7 4.8 4.8
50 12.6 12.4 6.9 6.6 8.9 8.5 13.1 13.0 14.3 14.4 75 32.1 32.9 38.8 39.7 27.0 28.7 31.8 32.5 32.4 34.8
Inventories 25 1.0 0.8 0.0 0.0 0.1 0.1 1.2 0.8 1.8 1.7 50 10.1 9.5 0.4 0.0 4.7 5.7 12.8 11.7 11.4 10.7 75 27.0 27.1 14.8 11.3 27.5 27.3 30.1 30.2 26.1 26.3
Equity 25 24.8 25.5 10.1 16.6 21.6 20.2 24.5 26.5 27.7 27.8 50 41.5 42.0 42.8 46.1 40.6 38.2 43.2 46.2 40.5 41.4 75 59.8 60.1 62.5 65.1 63.0 63.5 61.3 62.6 56.3 56.0
Short-term liabilities 25 14.0 13.3 7.1 5.9 12.6 11.3 13.6 13.3 15.7 14.7 50 26.6 26.1 27.4 22.2 25.8 25.8 27.0 26.9 26.2 26.5 75 43.8 44.7 50.4 41.0 43.8 49.7 45.1 44.8 42.4 43.4
Liabilities to banks 25 0.0 0.0 0.0 0.0 0.0 0.0 0.0 0.0 0.0 0.0 50 4.6 4.2 0.0 0.0 5.0 3.7 7.0 5.6 3.7 4.1 75 22.8 23.2 20.7 16.7 23.1 23.2 24.0 24.1 21.7 22.6
Percentage of salesAnnual result before taxes on income 25 0.8 0.9 - 3.8 0.2 1.4 1.3 1.4 1.0 0.6 0.6
50 4.1 4.1 3.5 4.8 4.6 4.4 5.0 4.6 3.6 3.4 75 9.4 8.8 14.3 17.4 11.4 11.0 9.5 9.2 8.5 8.0
Annual result and depreciation 25 2.9 2.9 3.0 4.3 3.6 3.4 3.5 3.5 2.3 2.2 50 7.4 7.3 8.4 8.7 7.8 7.7 8.0 7.6 6.7 6.5 75 14.1 13.9 23.0 26.1 15.3 15.4 14.1 13.3 12.5 12.6
Trade receivables 25 3.8 3.6 0.8 1.2 5.2 4.7 4.8 5.1 3.3 3.1 50 8.3 7.9 6.4 6.1 9.8 8.7 9.7 9.6 7.0 6.8 75 13.5 13.2 12.6 12.8 15.5 15.2 15.2 14.5 11.5 11.3
Percentage of the balance sheet totalAnnual result and interest paid 25 1.9 2.0 - 2.2 1.8 2.7 2.7 2.3 2.1 1.7 1.7
50 5.3 5.4 4.7 6.4 6.9 6.6 5.7 5.8 4.9 4.7 75 10.7 10.5 12.0 15.0 14.2 12.9 11.6 11.4 8.8 8.2
Percentage of liabilities and provisions less cashAnnual result and depreciation 25 4.1 4.0 - 10.0 - 16.0 3.0 3.1 5.8 6.1 4.7 4.4
50 16.1 16.4 8.4 9.2 16.2 16.2 19.8 21.7 15.1 15.4 75 40.3 39.0 43.4 32.3 55.6 49.4 49.9 58.1 31.8 29.9
Percentage of fixed assetsLong-term equity and liabilities 25 102.9 103.4 87.4 91.6 112.8 106.5 114.6 112.1 96.0 97.7
50 159.7 157.8 157.9 145.8 211.2 218.5 175.5 170.1 139.2 136.1 75 306.4 308.9 763.3 652.6 655.6 587.6 326.9 318.2 231.5 222.7
Percentage of short-term liabilitiesCash resources and short-term receivables 25 78.1 78.1 53.8 79.4 92.9 87.2 78.3 80.8 78.6 73.4
50 142.4 143.6 185.4 208.9 189.3 174.7 153.7 154.8 124.4 130.0 75 297.7 302.3 627.1 909.2 389.9 388.9 315.1 328.6 225.2 233.0
Percentage of cost of materialsTrade payables 25 5.4 4.8 3.9 3.3 6.2 6.0 5.5 5.0 5.1 4.4
50 9.8 9.1 15.9 12.6 12.6 12.9 10.4 9.1 8.6 8.1 75 17.5 16.7 39.9 29.0 23.4 24.7 19.2 17.0 14.2 13.0
* Agriculture, forestry and fishing, mining and quarrying, manufacturing, electricity, gas and water supply, construction, trade, transportation and storage,accommodation and food service activities, information and communication, business services, personal service activities

Deutsche BundesbankFinancial statement statistics (ratios - provisional data)May 2021176
II. Enterprises by selected legal form
2. Private limited companies
All legal formsEnterprises with sales of ... € million
Total Less than 2 2 but less than 10 10 but less than 50 50 and moreCylindered sample 2018/2019
Ratios 2018 2019 2018 2019 2018 2019 2018 2019 2018 2019Income statementIncome Percentage of gross revenueSales 99.5 99.6 98.0 97.8 98.5 98.5 99.0 99.4 99.6 99.7Change in finished goods 0.5 0.4 2.0 2.2 1.5 1.5 1.0 0.6 0.4 0.3Interest and similar income 0.2 0.2 0.2 0.2 0.2 0.2 0.2 0.2 0.2 0.2Other income 2.8 2.9 5.7 5.9 3.6 3.7 2.7 2.7 2.7 2.8
of which: Income from long-term equity investments 0.5 0.6 0.3 0.2 0.2 0.2 0.3 0.3 0.5 0.6Total income 103.0 103.1 105.9 106.1 103.8 103.9 102.8 102.8 102.9 103.1
ExpensesCost of materials 70.2 70.0 37.4 37.8 48.6 48.2 55.0 54.7 73.5 73.3Personnel expenses 14.9 15.2 37.7 37.2 29.9 30.2 25.3 25.7 12.6 13.0Depreciation 2.5 2.5 4.2 4.1 3.3 3.4 3.1 3.1 2.4 2.4
of which: Depreciation of tangible fixed assets 2.4 2.3 4.1 4.0 3.2 3.3 2.9 2.9 2.2 2.2Interest and similar expenses 0.9 0.8 1.0 1.0 0.7 0.7 0.7 0.7 0.9 0.8Operating taxes 0.1 0.1 0.2 0.2 0.1 0.1 0.1 0.1 0.1 0.1Other expenses 11.3 11.5 22.1 21.4 17.0 17.1 14.5 14.5 10.6 10.8Total expenses before taxes on income 99.9 100.1 102.6 101.7 99.7 99.7 98.7 98.9 100.1 100.3Annual result before taxes on income 3.1 3.0 3.3 4.4 4.1 4.2 4.1 4.0 2.9 2.8Taxes on income 0.7 0.7 1.4 1.5 1.3 1.3 1.1 1.1 0.6 0.6Annual result 2.4 2.3 1.8 2.8 2.8 2.9 3.0 2.9 2.3 2.2Profit and loss transfers (parent company) 0.5 0.7 0.3 0.2 0.1 0.1 0.1 0.1 0.6 0.8Profit and loss transfers (subsidiary) 1.6 1.6 - 0.3 - 0.3 0.2 0.2 1.0 0.9 1.8 1.8Profit for the year 1.3 1.4 2.4 3.4 2.7 2.7 2.2 2.1 1.1 1.2
Balance sheetAssets Percentage of the balance sheet totalIntangible fixed assets 1.8 1.7 0.8 0.9 0.8 0.7 1.0 1.0 2.0 1.8Tangible fixed assets 24.3 24.8 36.4 35.3 32.2 31.5 31.3 31.2 22.7 23.3
of which: Land and buildings 8.3 8.4 13.9 13.3 12.7 12.2 12.6 12.4 7.3 7.5Inventories 16.8 16.8 16.9 18.3 24.1 24.9 22.2 22.2 15.6 15.5
of which: Finished goods and merchandise 6.5 6.5 5.8 5.6 8.1 8.1 8.1 8.1 6.2 6.2Cash 6.1 5.9 15.0 14.9 12.8 12.8 10.2 10.3 5.0 4.8Receivables 35.4 35.6 25.7 25.4 25.5 25.3 28.5 28.5 37.0 37.3
Short-term 32.8 32.9 24.9 24.4 24.3 24.1 26.8 26.7 34.2 34.4 of which:
Trade receivables 10.9 10.6 11.6 11.2 12.8 12.3 12.4 12.0 10.6 10.3Receivables from affiliated companies 19.0 19.2 7.7 7.4 7.7 7.9 11.2 11.4 20.8 21.1
Long-term 2.6 2.7 0.9 1.1 1.1 1.2 1.7 1.8 2.8 2.9of which: Loans to affiliated companies 2.2 1.9 0.4 0.6 0.6 0.6 1.0 1.1 2.5 2.1
Securities 2.0 1.8 0.8 0.8 0.9 0.8 1.1 1.1 2.2 2.0Other long-term equity investments 13.1 12.9 3.6 3.7 3.2 3.4 5.1 5.1 14.9 14.7
of which: Goodwill 0.7 0.6 0.7 0.6 0.5 0.5 0.6 0.5 0.8 0.7
CapitalEquity 34.0 34.5 33.4 35.3 37.4 37.4 39.7 39.8 32.9 33.5Liabilities 48.3 47.7 58.6 57.1 53.5 53.8 48.0 48.0 48.1 47.3
Short-term 36.9 36.9 38.8 39.3 38.2 38.7 36.1 35.9 37.0 37.0of which:Liabilities to banks 3.0 3.1 7.9 7.7 7.2 7.3 5.4 5.4 2.4 2.5Trade payables 7.7 7.3 7.6 7.5 7.9 7.3 7.6 7.1 7.8 7.4Liabilities to affiliated companies 16.6 16.8 7.8 7.7 6.9 7.1 10.6 10.6 18.1 18.3
Long-term 11.4 10.8 19.8 17.7 15.4 15.1 12.0 12.1 11.1 10.3 of which:
Liabilities to banks 4.9 4.9 12.8 11.7 10.6 10.2 7.6 7.7 4.1 4.1Liabilities to affiliated companies 5.5 4.9 5.2 4.3 3.6 3.6 3.4 3.4 6.0 5.3
Provisions 16.8 16.8 7.3 7.0 8.3 8.1 11.3 11.3 18.1 18.2of which: Provisions for pensions 6.0 6.3 1.7 1.6 2.1 2.1 3.2 3.3 6.7 7.0
Other ratios Percentage of salesAnnual result before taxes on income 3.1 3.0 3.3 4.5 4.1 4.3 4.2 4.0 2.9 2.8Annual result and depreciation 4.9 4.9 6.2 7.1 6.2 6.4 6.2 6.0 4.7 4.6Trade receivables 7.3 7.1 9.7 9.5 9.2 9.0 9.1 8.8 6.9 6.7
Percentage of the balance sheet totalSales 150.2 150.0 120.4 117.9 138.9 137.1 136.8 136.4 153.1 153.1Annual result and interest paid 4.9 4.6 3.5 4.6 5.0 5.1 5.1 4.9 4.9 4.6
Percentage of liabilities and provisions less cashAnnual result and depreciation 12.4 12.3 14.4 16.7 17.3 17.7 16.9 16.5 11.6 11.5
Percentage of fixed assetsLong-term equity and liabilities 118.5 118.4 130.1 131.7 144.9 145.7 137.0 137.8 114.7 114.4
Percentage of short-term liabilitiesCash resources and short-term receivables 106.4 106.1 103.5 100.6 98.2 96.1 103.4 103.8 107.2 107.0Cash resources, short-term receivables and inventories 151.9 151.6 147.2 147.1 161.5 160.4 164.8 165.5 149.5 149.0
Percentage of cost of materialsTrade payables 7.3 7.0 16.5 16.4 11.5 10.9 9.9 9.5 6.9 6.6
Memo item:Balance sheet total in € billion 1 340.68 1 380.46 7.07 7.98 42.78 45.70 185.34 193.77 1 105.50 1 133.01Sales in € billion 2 013.69 2 070.87 8.51 9.41 59.40 62.65 253.56 264.30 1 692.22 1 734.51Number of enterprises 38 448 38 448 9 627 9 627 11 999 11 999 10 837 10 837 5 985 5 985
* Agriculture, forestry and fishing, mining and quarrying, manufacturing, electricity, gas and water supply, construction, trade, transportation and storage,accommodation and food service activities, information and communication, business services, personal service activities
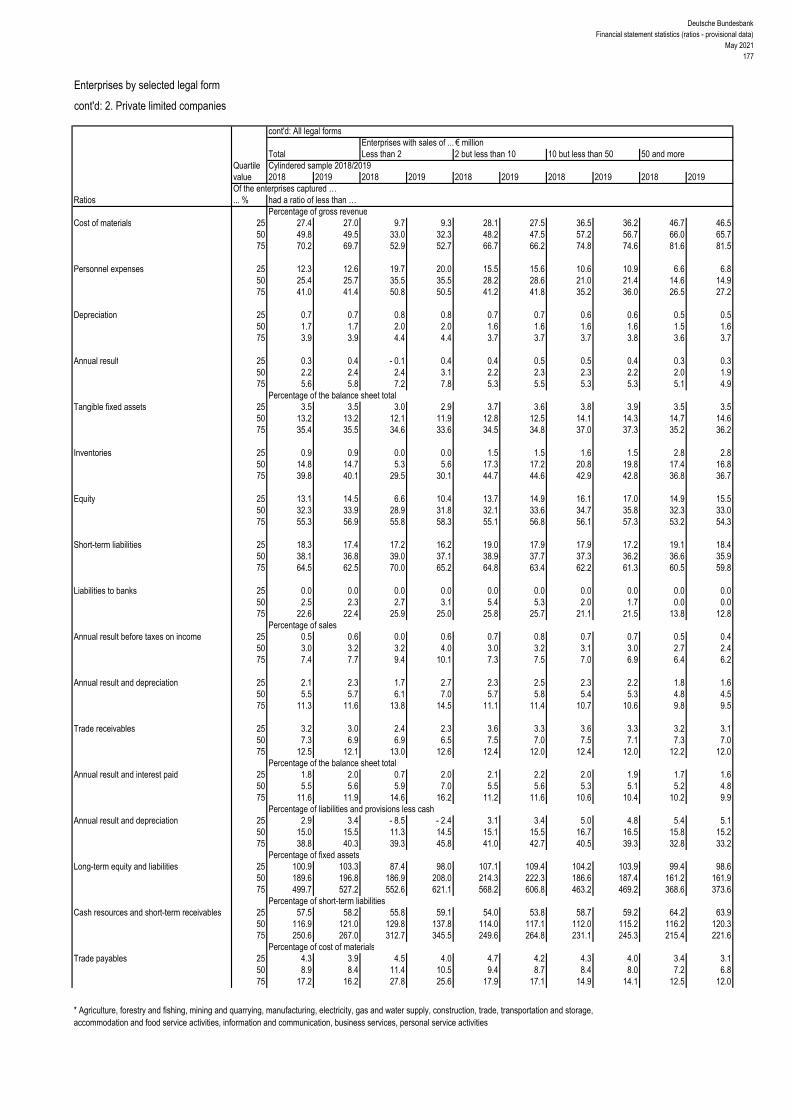
Deutsche BundesbankFinancial statement statistics (ratios - provisional data)
May 2021177
Enterprises by selected legal form
cont'd: 2. Private limited companies
cont'd: All legal formsEnterprises with sales of ... € million
Total Less than 2 2 but less than 10 10 but less than 50 50 and moreQuartile Cylindered sample 2018/2019value 2018 2019 2018 2019 2018 2019 2018 2019 2018 2019Of the enterprises captured …
Ratios ... % had a ratio of less than …Percentage of gross revenue
Cost of materials 25 27.4 27.0 9.7 9.3 28.1 27.5 36.5 36.2 46.7 46.5 50 49.8 49.5 33.0 32.3 48.2 47.5 57.2 56.7 66.0 65.7 75 70.2 69.7 52.9 52.7 66.7 66.2 74.8 74.6 81.6 81.5
Personnel expenses 25 12.3 12.6 19.7 20.0 15.5 15.6 10.6 10.9 6.6 6.8 50 25.4 25.7 35.5 35.5 28.2 28.6 21.0 21.4 14.6 14.9 75 41.0 41.4 50.8 50.5 41.2 41.8 35.2 36.0 26.5 27.2
Depreciation 25 0.7 0.7 0.8 0.8 0.7 0.7 0.6 0.6 0.5 0.5 50 1.7 1.7 2.0 2.0 1.6 1.6 1.6 1.6 1.5 1.6 75 3.9 3.9 4.4 4.4 3.7 3.7 3.7 3.8 3.6 3.7
Annual result 25 0.3 0.4 - 0.1 0.4 0.4 0.5 0.5 0.4 0.3 0.3 50 2.2 2.4 2.4 3.1 2.2 2.3 2.3 2.2 2.0 1.9 75 5.6 5.8 7.2 7.8 5.3 5.5 5.3 5.3 5.1 4.9
Percentage of the balance sheet totalTangible fixed assets 25 3.5 3.5 3.0 2.9 3.7 3.6 3.8 3.9 3.5 3.5
50 13.2 13.2 12.1 11.9 12.8 12.5 14.1 14.3 14.7 14.6 75 35.4 35.5 34.6 33.6 34.5 34.8 37.0 37.3 35.2 36.2
Inventories 25 0.9 0.9 0.0 0.0 1.5 1.5 1.6 1.5 2.8 2.8 50 14.8 14.7 5.3 5.6 17.3 17.2 20.8 19.8 17.4 16.8 75 39.8 40.1 29.5 30.1 44.7 44.6 42.9 42.8 36.8 36.7
Equity 25 13.1 14.5 6.6 10.4 13.7 14.9 16.1 17.0 14.9 15.5 50 32.3 33.9 28.9 31.8 32.1 33.6 34.7 35.8 32.3 33.0 75 55.3 56.9 55.8 58.3 55.1 56.8 56.1 57.3 53.2 54.3
Short-term liabilities 25 18.3 17.4 17.2 16.2 19.0 17.9 17.9 17.2 19.1 18.4 50 38.1 36.8 39.0 37.1 38.9 37.7 37.3 36.2 36.6 35.9 75 64.5 62.5 70.0 65.2 64.8 63.4 62.2 61.3 60.5 59.8
Liabilities to banks 25 0.0 0.0 0.0 0.0 0.0 0.0 0.0 0.0 0.0 0.0 50 2.5 2.3 2.7 3.1 5.4 5.3 2.0 1.7 0.0 0.0 75 22.6 22.4 25.9 25.0 25.8 25.7 21.1 21.5 13.8 12.8
Percentage of salesAnnual result before taxes on income 25 0.5 0.6 0.0 0.6 0.7 0.8 0.7 0.7 0.5 0.4
50 3.0 3.2 3.2 4.0 3.0 3.2 3.1 3.0 2.7 2.4 75 7.4 7.7 9.4 10.1 7.3 7.5 7.0 6.9 6.4 6.2
Annual result and depreciation 25 2.1 2.3 1.7 2.7 2.3 2.5 2.3 2.2 1.8 1.6 50 5.5 5.7 6.1 7.0 5.7 5.8 5.4 5.3 4.8 4.5 75 11.3 11.6 13.8 14.5 11.1 11.4 10.7 10.6 9.8 9.5
Trade receivables 25 3.2 3.0 2.4 2.3 3.6 3.3 3.6 3.3 3.2 3.1 50 7.3 6.9 6.9 6.5 7.5 7.0 7.5 7.1 7.3 7.0 75 12.5 12.1 13.0 12.6 12.4 12.0 12.4 12.0 12.2 12.0
Percentage of the balance sheet totalAnnual result and interest paid 25 1.8 2.0 0.7 2.0 2.1 2.2 2.0 1.9 1.7 1.6
50 5.5 5.6 5.9 7.0 5.5 5.6 5.3 5.1 5.2 4.8 75 11.6 11.9 14.6 16.2 11.2 11.6 10.6 10.4 10.2 9.9
Percentage of liabilities and provisions less cashAnnual result and depreciation 25 2.9 3.4 - 8.5 - 2.4 3.1 3.4 5.0 4.8 5.4 5.1
50 15.0 15.5 11.3 14.5 15.1 15.5 16.7 16.5 15.8 15.2 75 38.8 40.3 39.3 45.8 41.0 42.7 40.5 39.3 32.8 33.2
Percentage of fixed assetsLong-term equity and liabilities 25 100.9 103.3 87.4 98.0 107.1 109.4 104.2 103.9 99.4 98.6
50 189.6 196.8 186.9 208.0 214.3 222.3 186.6 187.4 161.2 161.9 75 499.7 527.2 552.6 621.1 568.2 606.8 463.2 469.2 368.6 373.6
Percentage of short-term liabilitiesCash resources and short-term receivables 25 57.5 58.2 55.8 59.1 54.0 53.8 58.7 59.2 64.2 63.9
50 116.9 121.0 129.8 137.8 114.0 117.1 112.0 115.2 116.2 120.3 75 250.6 267.0 312.7 345.5 249.6 264.8 231.1 245.3 215.4 221.6
Percentage of cost of materialsTrade payables 25 4.3 3.9 4.5 4.0 4.7 4.2 4.3 4.0 3.4 3.1
50 8.9 8.4 11.4 10.5 9.4 8.7 8.4 8.0 7.2 6.8 75 17.2 16.2 27.8 25.6 17.9 17.1 14.9 14.1 12.5 12.0
* Agriculture, forestry and fishing, mining and quarrying, manufacturing, electricity, gas and water supply, construction, trade, transportation and storage,accommodation and food service activities, information and communication, business services, personal service activities

Deutsche BundesbankFinancial statement statistics (ratios - provisional data)May 2021178
II. Enterprises by selected legal form
3. Cooperative societies
All legal formsEnterprises with sales of ... € million
Total Less than 2 2 but less than 10 10 but less than 50 50 and moreCylindered sample 2018/2019
Ratios 2018 2019 2018 2019 2018 2019 2018 2019 2018 2019Income statementIncome Percentage of gross revenueSales 99.9 99.9 101.0 101.1 100.9 100.1 99.9 99.9 99.9 99.9Change in finished goods 0.1 0.1 - 1.0 - 1.1 - 0.9 - 0.1 0.1 0.1 0.1 0.1Interest and similar income 0.1 0.1 0.9 0.6 0.3 0.3 0.1 0.1 0.1 0.1Other income 1.2 1.1 20.0 22.1 13.7 14.1 1.9 2.0 0.8 0.8
of which: Income from long-term equity investments 0.2 0.2 0.2 0.3 0.5 0.7 0.4 0.3 0.2 0.2Total income 101.3 101.2 120.8 122.6 114.0 114.4 102.0 102.1 101.0 100.9
ExpensesCost of materials 85.6 85.5 55.3 55.5 57.9 56.8 79.2 78.4 86.7 86.6Personnel expenses 7.5 7.6 25.2 25.5 24.5 25.0 11.1 11.6 6.9 6.9Depreciation 1.4 1.5 12.9 13.3 9.3 9.6 2.3 2.2 1.2 1.3
of which: Depreciation of tangible fixed assets 1.4 1.4 12.6 13.2 9.2 9.5 2.1 2.1 1.1 1.2Interest and similar expenses 0.3 0.3 3.6 3.4 1.8 1.8 0.4 0.3 0.3 0.3Operating taxes 0.1 0.1 0.6 0.6 0.5 0.6 0.2 0.2 0.0 0.0Other expenses 5.3 5.3 20.7 22.9 17.1 17.3 7.2 7.4 4.9 4.9Total expenses before taxes on income 100.2 100.2 118.3 121.1 111.2 111.1 100.2 100.1 99.9 100.0Annual result before taxes on income 1.1 1.0 2.5 1.5 2.9 3.2 1.8 2.0 1.0 0.9Taxes on income 0.3 0.2 1.2 1.0 0.9 0.8 0.4 0.4 0.2 0.2Annual result 0.9 0.7 1.3 0.5 2.0 2.4 1.4 1.6 0.8 0.6Profit and loss transfers (parent company) 0.2 0.1 0.0 0.0 0.2 0.2 0.0 0.0 0.2 0.1Profit and loss transfers (subsidiary) 0.0 0.0 - 1.0 0.0 0.0 0.0 0.0 0.0 0.0 0.0Profit for the year 1.0 0.9 2.4 0.5 2.2 2.5 1.4 1.6 1.0 0.8
Balance sheetAssets Percentage of the balance sheet totalIntangible fixed assets 0.6 0.8 0.1 0.1 0.2 0.2 0.4 0.4 0.7 0.9Tangible fixed assets 32.8 32.9 63.2 64.3 64.5 65.1 35.9 36.7 28.2 28.2
of which: Land and buildings 18.8 19.1 32.8 34.9 45.8 46.3 25.8 26.3 14.3 14.7Inventories 15.4 15.9 7.9 7.6 10.6 10.4 13.7 13.6 16.3 17.0
of which: Finished goods and merchandise 13.6 14.1 4.0 3.5 5.0 4.8 11.2 11.2 15.2 15.8Cash 8.3 7.6 8.6 7.9 7.5 7.1 16.2 15.6 7.2 6.4Receivables 32.5 32.2 11.6 10.8 12.1 12.2 25.2 24.4 36.4 36.0
Short-term 30.1 29.8 9.4 8.8 10.4 10.5 22.8 22.3 33.9 33.5 of which:
Trade receivables 15.1 14.8 2.3 2.6 3.2 2.9 10.7 10.5 17.4 17.0Receivables from affiliated companies 7.5 7.6 5.1 3.8 4.1 4.2 2.0 2.3 8.8 8.8
Long-term 2.5 2.3 2.2 2.1 1.6 1.6 2.4 2.1 2.6 2.5of which: Loans to affiliated companies 1.4 1.3 0.1 0.7 0.7 0.8 0.5 0.5 1.6 1.5
Securities 1.3 1.3 1.4 1.4 1.5 1.4 4.5 4.7 0.8 0.7Other long-term equity investments 8.6 9.0 7.0 7.7 3.4 3.4 4.0 4.3 10.0 10.5
of which: Goodwill 0.2 0.2 0.0 0.0 0.0 0.0 0.0 0.1 0.2 0.2
CapitalEquity 45.2 45.9 52.7 53.1 59.6 59.9 49.6 51.7 42.7 43.2Liabilities 46.6 46.1 44.8 44.0 37.1 36.9 43.3 41.6 48.3 47.9
Short-term 32.7 32.5 19.4 21.0 15.6 14.8 30.5 29.2 35.3 35.2of which:Liabilities to banks 6.3 6.2 6.6 8.7 7.2 7.4 3.7 3.8 6.6 6.3Trade payables 13.5 14.1 3.2 3.3 3.0 2.9 10.3 9.8 15.4 16.2Liabilities to affiliated companies 2.1 2.2 1.9 1.5 1.0 0.9 2.3 2.2 2.2 2.3
Long-term 13.9 13.6 25.4 23.0 21.5 22.1 12.8 12.4 13.0 12.7 of which:
Liabilities to banks 9.7 9.8 18.4 17.0 19.9 20.2 12.0 12.0 8.0 8.2Liabilities to affiliated companies 0.5 0.5 3.6 1.6 0.3 0.2 0.1 0.0 0.6 0.6
Provisions 8.0 7.9 1.9 1.6 2.7 2.6 7.0 6.5 8.9 8.8of which: Provisions for pensions 2.6 2.8 0.2 0.1 0.1 0.2 1.9 2.0 3.0 3.3
Other ratios Percentage of salesAnnual result before taxes on income 1.1 1.0 2.5 1.5 2.8 3.2 1.8 2.0 1.0 0.9Annual result and depreciation 2.3 2.2 14.1 13.7 11.1 12.0 3.7 3.8 2.0 1.9Trade receivables 6.2 6.1 7.3 8.4 7.2 6.8 6.9 6.8 6.1 6.0
Percentage of the balance sheet totalSales 242.3 244.3 31.3 30.7 44.5 43.2 154.9 155.1 282.7 284.5Annual result and interest paid 2.8 2.5 1.5 1.2 1.7 1.8 2.7 3.0 3.0 2.6
Percentage of liabilities and provisions less cashAnnual result and depreciation 11.9 11.8 11.4 10.8 15.0 15.7 16.7 18.0 11.2 10.9
Percentage of fixed assetsLong-term equity and liabilities 136.8 136.2 106.2 101.0 115.8 116.1 140.7 140.4 141.1 140.2
Percentage of short-term liabilitiesCash resources and short-term receivables 119.9 117.1 93.7 80.0 121.7 125.7 132.8 133.9 118.2 114.9Cash resources, short-term receivables and inventories 167.0 166.1 134.6 116.1 189.5 195.9 177.8 180.6 164.6 163.3
Percentage of cost of materialsTrade payables 6.5 6.7 18.5 19.6 11.8 12.0 8.4 8.0 6.3 6.6
Memo item:Balance sheet total in € billion 14.97 15.33 0.19 0.20 1.32 1.34 1.88 1.89 11.57 11.91Sales in € billion 36.27 37.46 0.06 0.06 0.59 0.58 2.92 2.93 32.70 33.89Number of enterprises 440 440 64 64 117 117 116 116 143 143
* Agriculture, forestry and fishing, mining and quarrying, manufacturing, electricity, gas and water supply, construction, trade, transportation and storage,accommodation and food service activities, information and communication, business services, personal service activities

Deutsche BundesbankFinancial statement statistics (ratios - provisional data)
May 2021179
Enterprises by selected legal form
cont'd: 3. Cooperative societies
cont'd: All legal formsEnterprises with sales of ... € million
Total Less than 2 2 but less than 10 10 but less than 50 50 and moreQuartile Cylindered sample 2018/2019value 2018 2019 2018 2019 2018 2019 2018 2019 2018 2019Of the enterprises captured …
Ratios ... % had a ratio of less than …Percentage of gross revenue
Cost of materials 25 56.1 54.7 12.7 14.0 48.7 45.2 67.6 68.0 83.0 83.5 50 78.2 77.5 50.9 53.4 57.4 54.1 82.2 81.4 88.3 88.5 75 88.5 88.6 74.5 73.8 68.3 68.2 89.0 88.9 93.6 93.4
Personnel expenses 25 5.5 5.5 4.7 6.3 16.4 16.2 5.8 5.8 3.1 3.1 50 10.7 11.5 22.3 24.7 24.0 24.2 10.0 10.0 6.1 5.9 75 22.8 23.7 35.2 38.2 31.0 31.4 16.1 16.8 8.7 8.7
Depreciation 25 0.9 1.0 2.7 3.4 3.9 4.4 0.8 0.9 0.4 0.4 50 2.0 2.0 11.9 12.1 10.2 10.5 1.4 1.5 1.2 1.2 75 8.9 9.3 22.4 22.6 15.0 15.2 3.1 3.0 1.7 1.7
Annual result 25 0.1 0.0 - 4.6 - 3.6 - 1.0 - 0.2 0.1 0.1 0.1 0.1 50 0.6 0.6 1.7 2.4 0.9 1.8 0.6 0.7 0.4 0.4 75 2.6 2.7 9.6 8.6 5.5 6.5 1.9 1.7 1.1 0.9
Percentage of the balance sheet totalTangible fixed assets 25 22.2 21.9 24.0 26.9 44.3 45.5 15.5 15.2 15.9 15.0
50 37.5 39.0 59.7 62.4 67.3 67.7 31.3 32.7 28.9 30.1 75 64.2 63.6 75.5 73.6 77.3 78.2 40.9 40.7 42.5 42.0
Inventories 25 3.3 3.1 0.0 0.0 6.9 6.5 1.7 2.8 4.2 3.3 50 11.3 11.2 3.6 3.7 9.9 9.8 15.5 14.6 16.8 16.4 75 22.6 21.7 12.0 11.8 14.6 13.9 28.3 28.3 24.6 24.4
Equity 25 39.0 39.4 44.6 42.0 45.4 46.6 39.1 42.6 30.7 29.7 50 52.6 51.7 60.2 57.8 60.9 60.6 53.6 54.0 43.5 44.2 75 68.1 68.6 79.6 81.1 75.5 74.1 67.8 68.6 58.5 57.6
Short-term liabilities 25 10.7 10.4 5.8 6.8 7.3 7.0 15.0 13.5 23.4 22.6 50 23.4 22.3 11.8 14.4 11.1 10.7 27.1 26.9 36.9 36.8 75 40.3 41.0 27.5 36.3 20.0 19.9 40.9 41.5 48.0 49.1
Liabilities to banks 25 0.0 0.0 0.0 0.0 9.4 9.5 0.0 0.0 0.0 0.0 50 12.4 12.2 8.4 10.4 24.1 27.4 7.2 8.8 10.3 10.9 75 29.9 30.2 29.9 32.1 37.7 38.6 21.7 20.9 24.2 25.3
Percentage of salesAnnual result before taxes on income 25 0.1 0.0 - 3.6 - 3.4 - 0.5 - 0.2 0.2 0.2 0.2 0.1
50 0.8 0.9 2.0 3.0 1.2 2.3 0.9 0.9 0.6 0.5 75 3.1 3.5 12.2 9.4 6.3 7.4 2.4 2.2 1.4 1.2
Annual result and depreciation 25 1.4 1.3 2.6 1.5 3.9 4.5 1.4 1.4 0.8 0.9 50 3.1 3.1 13.1 10.9 10.7 11.3 2.8 2.8 1.9 1.9 75 10.7 11.1 28.6 35.9 18.9 20.1 4.7 4.9 2.8 2.8
Trade receivables 25 3.5 3.5 2.2 2.3 3.6 3.6 3.3 2.5 4.0 3.9 50 5.7 5.8 5.5 5.6 5.8 6.0 5.1 5.0 6.2 6.1 75 9.1 9.1 11.9 15.0 8.6 8.7 8.5 8.2 9.0 8.9
Percentage of the balance sheet totalAnnual result and interest paid 25 0.6 0.5 - 0.3 - 1.2 0.2 0.3 0.6 0.7 1.2 1.0
50 2.0 2.0 2.3 1.9 1.7 1.8 2.3 2.6 2.2 1.9 75 4.1 3.8 4.8 4.2 3.7 3.2 4.6 4.3 4.0 3.4
Percentage of liabilities and provisions less cashAnnual result and depreciation 25 2.7 3.3 - 14.9 - 14.6 6.2 5.7 0.8 3.1 3.7 4.4
50 11.0 10.7 6.4 4.4 14.5 15.3 11.4 11.9 10.3 10.3 75 26.1 24.8 21.5 16.9 36.6 29.9 29.0 36.0 19.6 19.1
Percentage of fixed assetsLong-term equity and liabilities 25 109.1 107.2 103.5 94.6 106.9 105.1 120.5 118.8 112.4 112.7
50 131.5 131.3 122.1 108.3 118.6 118.9 162.1 161.0 142.4 138.6 75 187.3 194.3 183.2 150.3 137.9 137.2 210.6 210.5 200.5 203.7
Percentage of short-term liabilitiesCash resources and short-term receivables 25 79.7 78.4 64.6 60.8 67.8 64.1 86.3 89.5 80.8 85.1
50 125.4 125.0 196.9 169.9 136.9 146.9 124.7 125.7 112.9 109.1 75 227.8 227.7 477.3 372.1 266.8 258.2 220.8 238.1 175.2 175.2
Percentage of cost of materialsTrade payables 25 3.6 3.5 2.9 4.2 4.4 5.1 3.0 2.8 3.9 3.8
50 6.2 6.4 8.9 12.1 7.9 9.0 5.6 4.7 5.3 5.6 75 11.1 11.3 28.4 30.3 14.9 15.5 9.8 9.3 8.5 8.1
* Agriculture, forestry and fishing, mining and quarrying, manufacturing, electricity, gas and water supply, construction, trade, transportation and storage,accommodation and food service activities, information and communication, business services, personal service activities

Deutsche BundesbankFinancial statement statistics (ratios - provisional data)May 2021180
II. Enterprises by selected legal form
4. Kapitalgesellschaften & Co
All legal formsEnterprises with sales of ... € million
Total Less than 2 2 but less than 10 10 but less than 50 50 and moreCylindered sample 2018/2019
Ratios 2018 2019 2018 2019 2018 2019 2018 2019 2018 2019Income statementIncome Percentage of gross revenueSales 99.4 99.7 99.0 98.0 98.7 98.6 98.7 99.2 99.5 99.8Change in finished goods 0.6 0.3 1.0 2.0 1.3 1.4 1.3 0.8 0.5 0.2Interest and similar income 0.2 0.2 0.2 0.2 0.1 0.1 0.1 0.1 0.2 0.2Other income 2.2 2.1 4.0 3.8 2.4 2.5 1.8 1.9 2.2 2.1
of which: Income from long-term equity investments 0.3 0.3 0.4 0.4 0.3 0.3 0.3 0.3 0.3 0.3Total income 102.3 102.3 104.2 104.0 102.5 102.7 101.9 102.0 102.4 102.3
ExpensesCost of materials 70.3 69.7 31.0 31.4 48.6 48.2 58.2 57.8 72.6 72.0Personnel expenses 13.7 14.0 24.1 23.6 24.7 24.9 21.4 21.9 12.3 12.6Depreciation 2.2 2.3 12.2 11.6 4.7 4.6 3.2 3.2 2.0 2.1
of which: Depreciation of tangible fixed assets 2.1 2.2 12.1 11.5 4.5 4.5 3.1 3.0 1.8 2.0Interest and similar expenses 0.8 0.8 3.3 3.0 1.2 1.2 0.8 0.8 0.8 0.7Operating taxes 0.1 0.1 0.2 0.2 0.1 0.1 0.1 0.1 0.0 0.0Other expenses 11.9 12.3 21.9 21.5 16.8 16.9 13.6 13.8 11.5 11.9Total expenses before taxes on income 98.9 99.2 92.6 91.2 96.1 95.9 97.4 97.5 99.2 99.5Annual result before taxes on income 3.4 3.1 11.6 12.8 6.4 6.7 4.5 4.5 3.2 2.8Taxes on income 0.6 0.5 1.7 1.8 1.0 1.1 0.8 0.8 0.5 0.5Annual result 2.9 2.6 9.9 11.0 5.4 5.7 3.7 3.7 2.7 2.3Profit and loss transfers (parent company) 0.3 0.3 0.1 0.1 0.2 0.3 0.0 0.0 0.3 0.3Profit and loss transfers (subsidiary) 0.1 0.1 0.1 0.1 0.1 0.1 0.1 0.1 0.1 0.2Profit for the year 3.1 2.8 9.9 11.0 5.5 5.9 3.7 3.7 2.9 2.5
Balance sheetAssets Percentage of the balance sheet totalIntangible fixed assets 1.1 1.2 0.4 0.9 0.8 0.9 1.2 1.2 1.1 1.3Tangible fixed assets 26.4 26.5 66.8 64.9 45.4 44.3 31.5 30.9 24.4 24.6
of which: Land and buildings 8.7 8.9 9.3 9.5 12.4 12.5 11.5 11.3 8.1 8.3Inventories 21.7 21.9 5.8 6.9 21.1 22.5 30.1 30.5 20.5 20.7
of which: Finished goods and merchandise 9.6 9.5 2.0 2.1 7.8 7.9 10.9 11.1 9.5 9.5Cash 7.4 7.0 10.1 10.4 9.5 10.0 9.6 10.0 7.0 6.4Receivables 32.6 32.5 13.4 13.4 19.7 18.8 23.5 23.1 34.8 34.8
Short-term 30.7 30.1 12.5 12.6 19.1 18.2 22.6 22.2 32.6 32.0 of which:
Trade receivables 10.1 9.8 4.7 4.8 9.5 9.2 12.4 11.8 9.8 9.6Receivables from affiliated companies 17.1 17.0 5.1 5.1 7.0 6.2 7.1 7.2 19.2 19.1
Long-term 1.9 2.5 0.9 0.7 0.6 0.6 0.9 1.0 2.1 2.8of which: Loans to affiliated companies 1.4 2.0 0.6 0.5 0.3 0.3 0.6 0.6 1.6 2.3
Securities 0.9 0.8 0.1 0.1 0.3 0.2 0.7 0.6 1.0 0.9Other long-term equity investments 9.5 9.6 2.1 2.0 2.4 2.5 3.0 3.4 10.9 11.0
of which: Goodwill 0.2 0.2 0.3 0.3 0.2 0.2 0.2 0.2 0.3 0.2
CapitalEquity 25.0 25.0 25.5 26.6 22.3 22.8 23.6 24.1 25.3 25.2Liabilities 61.0 60.6 70.4 69.1 72.0 71.4 66.3 66.1 59.6 59.2
Short-term 47.7 48.0 29.8 31.6 43.9 47.0 50.9 52.6 47.6 47.5of which:Liabilities to banks 5.0 5.2 11.4 11.8 10.0 12.0 8.4 8.8 4.2 4.2Trade payables 9.7 9.6 3.1 3.5 6.4 6.1 7.1 6.7 10.3 10.2Liabilities to affiliated companies 22.4 22.2 8.6 8.7 13.7 13.8 18.2 18.6 23.6 23.3
Long-term 13.3 12.6 40.7 37.5 28.1 24.4 15.5 13.5 12.0 11.7 of which:
Liabilities to banks 7.8 7.9 35.9 33.6 22.2 18.6 10.0 9.0 6.5 6.9Liabilities to affiliated companies 4.3 3.7 3.9 3.3 4.7 4.6 4.6 3.9 4.3 3.6
Provisions 13.5 13.9 3.2 3.5 5.4 5.5 9.5 9.2 14.7 15.1of which: Provisions for pensions 4.6 4.8 0.1 0.1 0.8 0.8 2.2 2.1 5.2 5.4
Other ratios Percentage of salesAnnual result before taxes on income 3.5 3.1 11.7 13.1 6.5 6.8 4.6 4.5 3.2 2.8Annual result and depreciation 5.2 4.9 22.3 23.0 10.2 10.5 7.1 6.9 4.7 4.5Trade receivables 5.8 5.7 8.8 8.6 8.2 7.8 8.2 7.8 5.4 5.4
Percentage of the balance sheet totalSales 173.4 171.3 53.6 55.8 114.8 116.9 151.7 150.9 180.8 178.1Annual result and interest paid 6.4 5.7 7.1 8.0 7.7 8.1 7.0 6.9 6.3 5.4
Percentage of liabilities and provisions less cashAnnual result and depreciation 13.2 12.4 18.6 20.4 17.2 18.2 16.0 15.9 12.6 11.6
Percentage of fixed assetsLong-term equity and liabilities 108.3 104.8 94.4 93.6 103.6 99.1 111.5 108.0 108.3 104.9
Percentage of short-term liabilitiesCash resources and short-term receivables 80.3 77.7 76.2 73.2 65.3 60.1 64.1 61.7 83.6 81.2Cash resources, short-term receivables and inventories 125.7 123.2 95.8 95.2 113.3 108.0 123.3 119.6 126.8 124.7
Percentage of cost of materialsTrade payables 7.9 8.0 18.7 19.3 11.3 10.7 8.0 7.6 7.8 8.0
Memo item:Balance sheet total in € billion 332.60 343.14 2.99 3.07 12.44 12.64 42.54 43.83 274.64 283.60Sales in € billion 576.84 587.72 1.60 1.71 14.27 14.78 64.52 66.14 496.45 505.09Number of enterprises 8 922 8 922 1 743 1 743 2 729 2 729 2 713 2 713 1 737 1 737
* Agriculture, forestry and fishing, mining and quarrying, manufacturing, electricity, gas and water supply, construction, trade, transportation and storage,accommodation and food service activities, information and communication, business services, personal service activities

Deutsche BundesbankFinancial statement statistics (ratios - provisional data)
May 2021181
Enterprises by selected legal form
cont'd: 4. Kapitalgesellschaft & Co
cont'd: All legal formsEnterprises with sales of ... € million
Total Less than 2 2 but less than 10 10 but less than 50 50 and moreQuartile Cylindered sample 2018/2019value 2018 2019 2018 2019 2018 2019 2018 2019 2018 2019Of the enterprises captured …
Ratios ... % had a ratio of less than …Percentage of gross revenue
Cost of materials 25 32.4 31.9 0.8 0.9 29.5 28.9 43.3 42.6 52.1 51.4 50 52.7 51.9 22.9 23.4 48.4 48.2 58.8 58.2 68.3 67.4 75 71.3 70.7 46.7 46.7 65.5 64.9 74.6 73.9 80.7 80.2
Personnel expenses 25 9.3 9.7 0.0 0.0 12.7 12.8 10.8 11.1 7.6 7.9 50 19.3 19.6 20.4 20.0 23.3 23.8 19.4 19.7 14.0 14.5 75 31.7 32.1 36.2 35.8 35.1 35.3 30.4 31.0 23.1 23.9
Depreciation 25 0.9 0.9 1.3 1.2 1.0 0.9 0.8 0.9 0.7 0.7 50 2.0 2.0 3.8 3.7 2.1 2.1 1.8 1.8 1.5 1.5 75 4.5 4.6 20.0 18.4 4.7 4.8 3.6 3.7 3.0 3.1
Annual result 25 1.0 1.1 1.5 2.8 1.5 1.5 1.0 0.9 0.7 0.5 50 3.6 3.6 8.3 9.0 4.1 4.2 2.9 2.8 2.2 1.9 75 8.2 8.3 19.7 20.6 8.4 8.5 5.9 5.9 5.1 4.8
Percentage of the balance sheet totalTangible fixed assets 25 7.2 6.9 7.4 6.6 7.0 6.5 7.0 7.2 7.5 7.5
50 21.4 21.6 29.8 28.3 21.5 21.6 19.9 20.0 20.2 20.2 75 45.7 46.3 68.6 68.7 49.3 49.1 39.8 40.1 36.0 36.7
Inventories 25 2.7 2.6 0.0 0.0 2.8 2.6 11.7 11.6 12.5 12.0 50 22.2 22.2 1.4 1.5 21.9 21.6 30.4 30.2 25.7 25.5 75 43.7 43.8 20.8 21.5 47.9 47.7 47.9 48.4 42.2 42.2
Equity 25 5.0 5.8 1.3 2.4 3.8 4.3 6.6 7.1 9.2 10.2 50 17.1 18.5 14.1 17.2 14.2 15.5 18.9 19.4 21.7 22.8 75 34.3 35.6 34.7 37.5 30.8 32.5 34.7 36.1 36.6 37.4
Short-term liabilities 25 30.3 29.7 16.9 16.8 32.0 32.1 35.0 34.4 33.1 32.7 50 53.8 53.2 44.3 42.9 56.4 56.1 55.5 55.5 53.4 53.3 75 75.9 74.7 75.0 72.8 78.7 77.2 75.1 75.4 73.2 71.4
Liabilities to banks 25 0.0 0.0 0.0 0.0 0.0 0.0 0.0 0.0 0.0 0.0 50 12.4 11.6 19.0 18.9 15.9 14.9 11.4 10.9 4.3 4.1 75 36.4 35.7 56.4 53.3 40.5 40.4 32.5 31.6 24.1 24.4
Percentage of salesAnnual result before taxes on income 25 1.3 1.4 1.9 3.4 1.9 1.8 1.3 1.2 0.9 0.7
50 4.3 4.3 9.5 10.5 5.0 5.1 3.6 3.4 2.7 2.4 75 9.7 10.0 22.3 23.4 10.0 10.2 7.1 7.0 6.1 5.8
Annual result and depreciation 25 3.3 3.3 6.6 7.7 4.1 4.0 3.1 2.8 2.1 2.0 50 7.3 7.2 17.4 17.3 8.1 8.2 5.9 5.7 4.7 4.1 75 14.7 14.9 46.5 47.4 14.6 15.0 10.7 10.7 9.1 8.6
Trade receivables 25 2.8 2.7 1.2 1.6 3.2 2.9 3.8 3.4 2.6 2.5 50 6.5 6.1 5.1 4.8 6.6 6.1 7.0 6.6 6.3 6.0 75 11.0 10.6 11.4 11.3 11.4 10.7 11.1 10.6 10.2 9.9
Percentage of the balance sheet totalAnnual result and interest paid 25 3.3 3.4 3.2 4.1 3.9 3.9 3.3 3.2 2.8 2.4
50 7.8 7.7 9.7 11.1 8.9 9.0 7.1 7.0 6.6 6.0 75 15.2 15.0 24.1 27.5 17.2 17.0 12.8 12.5 11.3 10.3
Percentage of liabilities and provisions less cashAnnual result and depreciation 25 8.1 8.4 8.1 10.6 9.1 9.2 7.9 8.0 7.5 7.0
50 18.0 18.4 20.9 24.6 19.4 20.1 17.2 16.7 15.4 14.6 75 36.7 37.6 53.0 63.3 40.3 41.0 32.7 32.1 27.7 27.4
Percentage of fixed assetsLong-term equity and liabilities 25 67.7 68.6 54.6 61.3 62.8 64.9 73.6 71.7 76.0 75.6
50 113.1 114.5 102.0 105.8 108.3 109.5 125.0 124.3 124.7 122.1 75 226.4 236.4 187.3 226.1 226.0 240.3 247.1 245.5 223.1 225.0
Percentage of short-term liabilitiesCash resources and short-term receivables 25 39.6 38.7 43.4 42.7 35.5 34.0 38.7 37.6 45.7 45.4
50 72.0 71.8 95.8 99.8 66.6 65.8 65.9 66.0 74.8 75.1 75 124.3 126.7 181.1 196.3 116.3 120.6 111.6 113.5 116.6 118.5
Percentage of cost of materialsTrade payables 25 4.3 4.0 4.7 4.4 4.8 4.3 4.1 3.7 3.9 3.8
50 8.2 7.6 12.3 11.6 9.5 8.6 7.1 6.7 7.2 6.8 75 14.6 13.9 31.8 27.7 17.7 16.9 12.0 11.2 10.6 10.6
* Agriculture, forestry and fishing, mining and quarrying, manufacturing, electricity, gas and water supply, construction, trade, transportation and storage,accommodation and food service activities, information and communication, business services, personal service activities

Deutsche BundesbankFinancial statement statistics (ratios - provisional data)May 2021182
III. East German enterprises by economic sector
1. All economic sectors*
All legal formsEnterprises with sales of ... € million
Total Less than 2 2 but less than 10 10 but less than 50 50 and moreCylindered sample 2018/2019
Ratios 2018 2019 2018 2019 2018 2019 2018 2019 2018 2019Income statementIncome Percentage of gross revenueSales 99.4 99.6 98.7 98.2 98.5 98.3 98.7 99.0 99.7 99.9Change in finished goods 0.6 0.4 1.3 1.8 1.5 1.7 1.3 1.0 0.3 0.1Interest and similar income 0.2 0.2 0.2 0.2 0.2 0.1 0.2 0.1 0.2 0.2Other income 2.9 2.9 8.9 9.3 4.8 4.9 3.0 3.0 2.5 2.6
of which: Income from long-term equity investments 0.2 0.2 0.2 0.2 0.1 0.1 0.2 0.2 0.3 0.2Total income 103.0 103.1 109.1 109.5 105.0 105.0 103.2 103.2 102.7 102.7
ExpensesCost of materials 67.3 67.1 38.7 38.5 48.7 48.5 55.2 54.7 73.8 73.8Personnel expenses 16.3 16.7 34.5 34.5 28.8 29.0 25.0 25.6 11.8 12.0Depreciation 3.9 3.8 7.0 6.7 5.2 5.2 4.6 4.6 3.4 3.4
of which: Depreciation of tangible fixed assets 3.7 3.7 6.9 6.6 5.1 5.1 4.4 4.4 3.2 3.2Interest and similar expenses 0.8 0.7 1.5 1.4 1.0 1.0 0.8 0.7 0.8 0.7Operating taxes 0.1 0.1 0.2 0.2 0.2 0.1 0.1 0.1 0.1 0.1Other expenses 10.7 10.8 21.8 21.9 16.6 16.6 13.2 13.1 9.0 9.3Total expenses before taxes on income 99.0 99.2 103.7 103.3 100.4 100.4 98.7 98.8 98.9 99.2Annual result before taxes on income 4.0 3.8 5.4 6.2 4.6 4.7 4.5 4.4 3.8 3.5Taxes on income 0.8 0.8 1.2 1.4 1.2 1.2 1.0 1.0 0.7 0.7Annual result 3.2 3.0 4.2 4.8 3.4 3.5 3.4 3.3 3.1 2.8Profit and loss transfers (parent company) 0.1 0.2 0.1 0.0 0.1 0.1 0.0 0.1 0.2 0.3Profit and loss transfers (subsidiary) 1.3 1.2 0.0 0.0 0.2 0.2 0.8 0.8 1.6 1.4Profit for the year 2.0 2.1 4.3 4.8 3.3 3.4 2.6 2.7 1.7 1.7
Balance sheetAssets Percentage of the balance sheet totalIntangible fixed assets 1.4 1.7 0.6 0.6 0.4 0.4 0.8 0.8 1.8 2.2Tangible fixed assets 43.7 43.0 53.9 52.5 48.3 47.2 45.6 44.7 41.9 41.4
of which: Land and buildings 15.8 15.5 24.1 23.6 21.5 21.1 17.3 16.9 14.1 13.8Inventories 15.1 15.4 11.6 12.7 18.8 19.6 19.9 20.4 12.5 12.6
of which: Finished goods and merchandise 4.9 5.0 3.7 3.7 5.9 6.0 5.6 5.9 4.5 4.5Cash 7.7 7.5 12.4 12.3 10.8 11.0 9.3 9.3 6.5 6.1Receivables 24.8 24.8 16.6 17.1 17.8 17.8 19.8 20.2 28.2 27.9
Short-term 22.6 22.3 15.7 16.1 16.6 16.6 18.7 19.0 25.3 24.7 of which:
Trade receivables 9.1 8.7 7.1 7.4 7.8 7.6 8.8 8.8 9.6 8.9Receivables from affiliated companies 11.0 11.0 5.1 4.9 5.9 5.9 7.4 7.6 13.5 13.4
Long-term 2.2 2.5 0.9 1.0 1.2 1.2 1.1 1.2 2.9 3.3of which: Loans to affiliated companies 1.6 1.9 0.4 0.5 0.7 0.7 0.6 0.7 2.2 2.6
Securities 1.6 1.5 0.4 0.4 0.7 0.6 1.7 1.7 1.7 1.6Other long-term equity investments 5.4 5.9 3.6 3.6 2.6 2.7 2.6 2.6 7.1 7.8
of which: Goodwill 0.3 0.3 0.3 0.3 0.2 0.2 0.2 0.2 0.3 0.3
CapitalEquity 45.4 45.0 36.1 36.0 41.1 41.1 44.7 44.9 46.5 45.8Liabilities 44.0 44.0 58.8 58.9 53.1 53.3 47.1 47.0 40.9 41.0
Short-term 29.7 29.8 31.3 32.8 30.9 31.8 32.1 32.3 28.5 28.3of which:Liabilities to banks 4.0 4.4 8.6 9.1 6.6 6.7 5.5 5.5 2.8 3.4Trade payables 7.5 6.9 5.2 5.1 5.6 5.3 6.1 5.8 8.4 7.6Liabilities to affiliated companies 9.8 10.2 7.0 7.0 5.8 5.9 8.0 8.1 11.2 11.8
Long-term 14.3 14.3 27.5 26.1 22.2 21.5 15.0 14.8 12.5 12.7 of which:
Liabilities to banks 8.8 8.8 21.1 19.7 16.8 16.1 10.3 10.4 6.8 6.7Liabilities to affiliated companies 4.2 4.3 5.1 5.0 4.6 4.6 3.7 3.4 4.4 4.6
Provisions 9.8 10.1 4.3 4.3 5.2 5.1 7.5 7.4 11.7 12.1of which: Provisions for pensions 1.4 1.5 0.6 0.5 0.6 0.6 0.7 0.7 1.7 1.9
Other ratios Percentage of salesAnnual result before taxes on income 4.1 3.9 5.5 6.3 4.7 4.8 4.5 4.4 3.8 3.5Annual result and depreciation 7.1 6.8 11.4 11.7 8.7 8.8 8.1 8.0 6.6 6.2Trade receivables 7.1 6.8 8.8 8.8 8.0 7.7 7.8 7.9 6.8 6.3
Percentage of the balance sheet totalSales 128.7 127.7 80.9 83.2 97.7 98.5 111.7 111.6 141.7 140.1Annual result and interest paid 5.2 4.8 4.7 5.2 4.4 4.4 4.7 4.6 5.6 4.9
Percentage of liabilities and provisions less cashAnnual result and depreciation 19.6 18.4 17.9 18.8 17.7 18.0 19.6 19.5 19.9 18.0
Percentage of fixed assetsLong-term equity and liabilities 112.8 111.7 108.4 108.1 121.0 121.8 117.1 119.0 110.0 107.7
Percentage of short-term liabilitiesCash resources and short-term receivables 102.5 100.6 90.4 87.4 89.7 87.9 87.8 88.3 112.1 109.1Cash resources, short-term receivables and inventories 153.2 152.2 127.5 126.1 150.6 149.7 149.7 151.5 156.1 153.6
Percentage of cost of materialsTrade payables 8.6 8.0 16.4 15.8 11.5 11.0 9.8 9.4 8.1 7.4
Memo item:Balance sheet total in € billion 154.80 160.50 2.42 2.51 14.21 14.80 41.41 42.92 96.77 100.28Sales in € billion 199.17 205.00 1.96 2.09 13.88 14.57 46.24 47.89 137.10 140.46Number of enterprises 7 660 7 660 2 144 2 144 2 834 2 834 2 004 2 004 678 678
* Agriculture, forestry and fishing, mining and quarrying, manufacturing, electricity, gas and water supply, construction, trade, transportation and storage,accommodation and food service activities, information and communication, business services, personal service activities
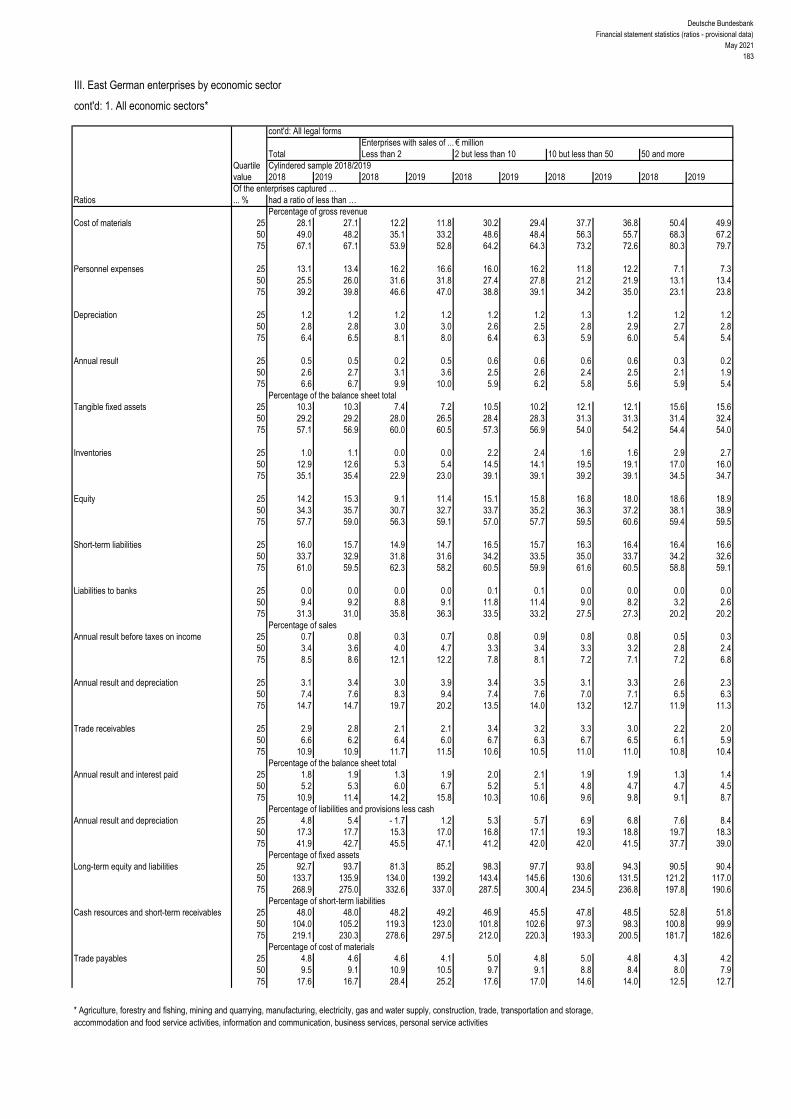
Deutsche BundesbankFinancial statement statistics (ratios - provisional data)
May 2021183
III. East German enterprises by economic sector
cont'd: 1. All economic sectors*
cont'd: All legal formsEnterprises with sales of ... € million
Total Less than 2 2 but less than 10 10 but less than 50 50 and moreQuartile Cylindered sample 2018/2019value 2018 2019 2018 2019 2018 2019 2018 2019 2018 2019Of the enterprises captured …
Ratios ... % had a ratio of less than …Percentage of gross revenue
Cost of materials 25 28.1 27.1 12.2 11.8 30.2 29.4 37.7 36.8 50.4 49.9 50 49.0 48.2 35.1 33.2 48.6 48.4 56.3 55.7 68.3 67.2 75 67.1 67.1 53.9 52.8 64.2 64.3 73.2 72.6 80.3 79.7
Personnel expenses 25 13.1 13.4 16.2 16.6 16.0 16.2 11.8 12.2 7.1 7.3 50 25.5 26.0 31.6 31.8 27.4 27.8 21.2 21.9 13.1 13.4 75 39.2 39.8 46.6 47.0 38.8 39.1 34.2 35.0 23.1 23.8
Depreciation 25 1.2 1.2 1.2 1.2 1.2 1.2 1.3 1.2 1.2 1.2 50 2.8 2.8 3.0 3.0 2.6 2.5 2.8 2.9 2.7 2.8 75 6.4 6.5 8.1 8.0 6.4 6.3 5.9 6.0 5.4 5.4
Annual result 25 0.5 0.5 0.2 0.5 0.6 0.6 0.6 0.6 0.3 0.2 50 2.6 2.7 3.1 3.6 2.5 2.6 2.4 2.5 2.1 1.9 75 6.6 6.7 9.9 10.0 5.9 6.2 5.8 5.6 5.9 5.4
Percentage of the balance sheet totalTangible fixed assets 25 10.3 10.3 7.4 7.2 10.5 10.2 12.1 12.1 15.6 15.6
50 29.2 29.2 28.0 26.5 28.4 28.3 31.3 31.3 31.4 32.4 75 57.1 56.9 60.0 60.5 57.3 56.9 54.0 54.2 54.4 54.0
Inventories 25 1.0 1.1 0.0 0.0 2.2 2.4 1.6 1.6 2.9 2.7 50 12.9 12.6 5.3 5.4 14.5 14.1 19.5 19.1 17.0 16.0 75 35.1 35.4 22.9 23.0 39.1 39.1 39.2 39.1 34.5 34.7
Equity 25 14.2 15.3 9.1 11.4 15.1 15.8 16.8 18.0 18.6 18.9 50 34.3 35.7 30.7 32.7 33.7 35.2 36.3 37.2 38.1 38.9 75 57.7 59.0 56.3 59.1 57.0 57.7 59.5 60.6 59.4 59.5
Short-term liabilities 25 16.0 15.7 14.9 14.7 16.5 15.7 16.3 16.4 16.4 16.6 50 33.7 32.9 31.8 31.6 34.2 33.5 35.0 33.7 34.2 32.6 75 61.0 59.5 62.3 58.2 60.5 59.9 61.6 60.5 58.8 59.1
Liabilities to banks 25 0.0 0.0 0.0 0.0 0.1 0.1 0.0 0.0 0.0 0.0 50 9.4 9.2 8.8 9.1 11.8 11.4 9.0 8.2 3.2 2.6 75 31.3 31.0 35.8 36.3 33.5 33.2 27.5 27.3 20.2 20.2
Percentage of salesAnnual result before taxes on income 25 0.7 0.8 0.3 0.7 0.8 0.9 0.8 0.8 0.5 0.3
50 3.4 3.6 4.0 4.7 3.3 3.4 3.3 3.2 2.8 2.4 75 8.5 8.6 12.1 12.2 7.8 8.1 7.2 7.1 7.2 6.8
Annual result and depreciation 25 3.1 3.4 3.0 3.9 3.4 3.5 3.1 3.3 2.6 2.3 50 7.4 7.6 8.3 9.4 7.4 7.6 7.0 7.1 6.5 6.3 75 14.7 14.7 19.7 20.2 13.5 14.0 13.2 12.7 11.9 11.3
Trade receivables 25 2.9 2.8 2.1 2.1 3.4 3.2 3.3 3.0 2.2 2.0 50 6.6 6.2 6.4 6.0 6.7 6.3 6.7 6.5 6.1 5.9 75 10.9 10.9 11.7 11.5 10.6 10.5 11.0 11.0 10.8 10.4
Percentage of the balance sheet totalAnnual result and interest paid 25 1.8 1.9 1.3 1.9 2.0 2.1 1.9 1.9 1.3 1.4
50 5.2 5.3 6.0 6.7 5.2 5.1 4.8 4.7 4.7 4.5 75 10.9 11.4 14.2 15.8 10.3 10.6 9.6 9.8 9.1 8.7
Percentage of liabilities and provisions less cashAnnual result and depreciation 25 4.8 5.4 - 1.7 1.2 5.3 5.7 6.9 6.8 7.6 8.4
50 17.3 17.7 15.3 17.0 16.8 17.1 19.3 18.8 19.7 18.3 75 41.9 42.7 45.5 47.1 41.2 42.0 42.0 41.5 37.7 39.0
Percentage of fixed assetsLong-term equity and liabilities 25 92.7 93.7 81.3 85.2 98.3 97.7 93.8 94.3 90.5 90.4
50 133.7 135.9 134.0 139.2 143.4 145.6 130.6 131.5 121.2 117.0 75 268.9 275.0 332.6 337.0 287.5 300.4 234.5 236.8 197.8 190.6
Percentage of short-term liabilitiesCash resources and short-term receivables 25 48.0 48.0 48.2 49.2 46.9 45.5 47.8 48.5 52.8 51.8
50 104.0 105.2 119.3 123.0 101.8 102.6 97.3 98.3 100.8 99.9 75 219.1 230.3 278.6 297.5 212.0 220.3 193.3 200.5 181.7 182.6
Percentage of cost of materialsTrade payables 25 4.8 4.6 4.6 4.1 5.0 4.8 5.0 4.8 4.3 4.2
50 9.5 9.1 10.9 10.5 9.7 9.1 8.8 8.4 8.0 7.9 75 17.6 16.7 28.4 25.2 17.6 17.0 14.6 14.0 12.5 12.7
* Agriculture, forestry and fishing, mining and quarrying, manufacturing, electricity, gas and water supply, construction, trade, transportation and storage,accommodation and food service activities, information and communication, business services, personal service activities
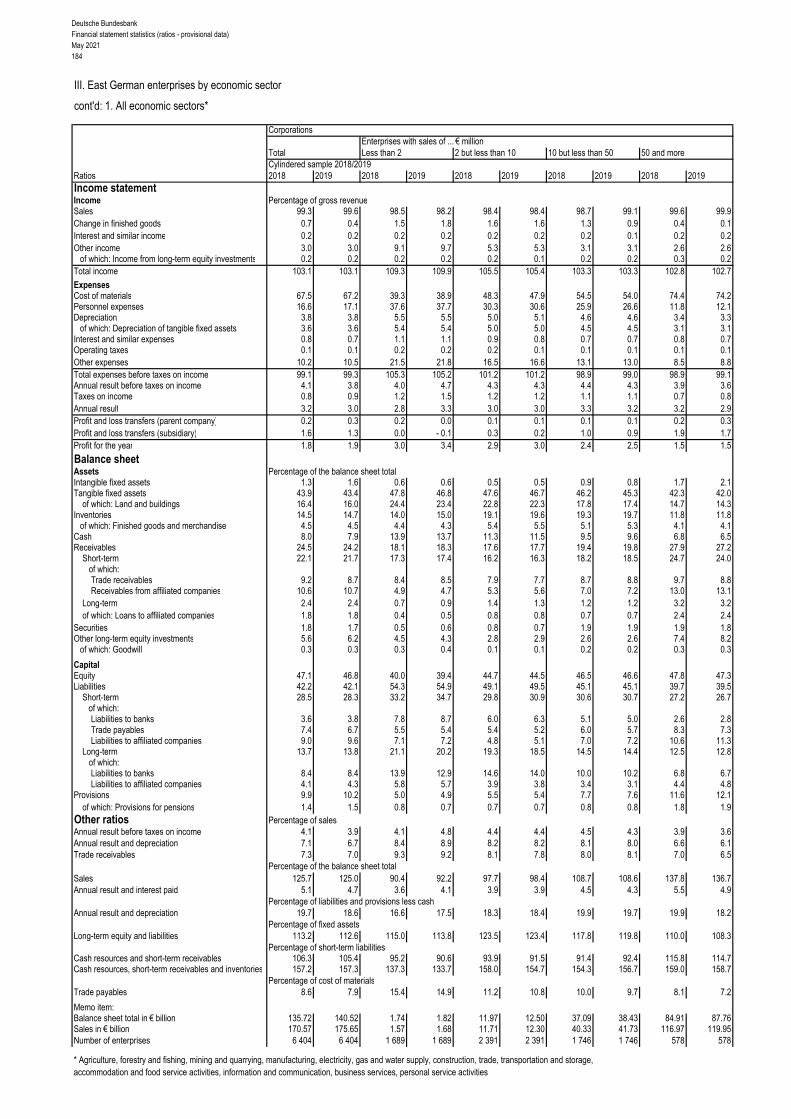
Deutsche BundesbankFinancial statement statistics (ratios - provisional data)May 2021184
III. East German enterprises by economic sector
cont'd: 1. All economic sectors*
CorporationsEnterprises with sales of ... € million
Total Less than 2 2 but less than 10 10 but less than 50 50 and moreCylindered sample 2018/2019
Ratios 2018 2019 2018 2019 2018 2019 2018 2019 2018 2019Income statementIncome Percentage of gross revenueSales 99.3 99.6 98.5 98.2 98.4 98.4 98.7 99.1 99.6 99.9Change in finished goods 0.7 0.4 1.5 1.8 1.6 1.6 1.3 0.9 0.4 0.1Interest and similar income 0.2 0.2 0.2 0.2 0.2 0.2 0.2 0.1 0.2 0.2Other income 3.0 3.0 9.1 9.7 5.3 5.3 3.1 3.1 2.6 2.6
of which: Income from long-term equity investments 0.2 0.2 0.2 0.2 0.2 0.1 0.2 0.2 0.3 0.2Total income 103.1 103.1 109.3 109.9 105.5 105.4 103.3 103.3 102.8 102.7
ExpensesCost of materials 67.5 67.2 39.3 38.9 48.3 47.9 54.5 54.0 74.4 74.2Personnel expenses 16.6 17.1 37.6 37.7 30.3 30.6 25.9 26.6 11.8 12.1Depreciation 3.8 3.8 5.5 5.5 5.0 5.1 4.6 4.6 3.4 3.3
of which: Depreciation of tangible fixed assets 3.6 3.6 5.4 5.4 5.0 5.0 4.5 4.5 3.1 3.1Interest and similar expenses 0.8 0.7 1.1 1.1 0.9 0.8 0.7 0.7 0.8 0.7Operating taxes 0.1 0.1 0.2 0.2 0.2 0.1 0.1 0.1 0.1 0.1Other expenses 10.2 10.5 21.5 21.8 16.5 16.6 13.1 13.0 8.5 8.8Total expenses before taxes on income 99.1 99.3 105.3 105.2 101.2 101.2 98.9 99.0 98.9 99.1Annual result before taxes on income 4.1 3.8 4.0 4.7 4.3 4.3 4.4 4.3 3.9 3.6Taxes on income 0.8 0.9 1.2 1.5 1.2 1.2 1.1 1.1 0.7 0.8Annual result 3.2 3.0 2.8 3.3 3.0 3.0 3.3 3.2 3.2 2.9Profit and loss transfers (parent company) 0.2 0.3 0.2 0.0 0.1 0.1 0.1 0.1 0.2 0.3Profit and loss transfers (subsidiary) 1.6 1.3 0.0 - 0.1 0.3 0.2 1.0 0.9 1.9 1.7Profit for the year 1.8 1.9 3.0 3.4 2.9 3.0 2.4 2.5 1.5 1.5
Balance sheetAssets Percentage of the balance sheet totalIntangible fixed assets 1.3 1.6 0.6 0.6 0.5 0.5 0.9 0.8 1.7 2.1Tangible fixed assets 43.9 43.4 47.8 46.8 47.6 46.7 46.2 45.3 42.3 42.0
of which: Land and buildings 16.4 16.0 24.4 23.4 22.8 22.3 17.8 17.4 14.7 14.3Inventories 14.5 14.7 14.0 15.0 19.1 19.6 19.3 19.7 11.8 11.8
of which: Finished goods and merchandise 4.5 4.5 4.4 4.3 5.4 5.5 5.1 5.3 4.1 4.1Cash 8.0 7.9 13.9 13.7 11.3 11.5 9.5 9.6 6.8 6.5Receivables 24.5 24.2 18.1 18.3 17.6 17.7 19.4 19.8 27.9 27.2
Short-term 22.1 21.7 17.3 17.4 16.2 16.3 18.2 18.5 24.7 24.0 of which:
Trade receivables 9.2 8.7 8.4 8.5 7.9 7.7 8.7 8.8 9.7 8.8Receivables from affiliated companies 10.6 10.7 4.9 4.7 5.3 5.6 7.0 7.2 13.0 13.1
Long-term 2.4 2.4 0.7 0.9 1.4 1.3 1.2 1.2 3.2 3.2of which: Loans to affiliated companies 1.8 1.8 0.4 0.5 0.8 0.8 0.7 0.7 2.4 2.4
Securities 1.8 1.7 0.5 0.6 0.8 0.7 1.9 1.9 1.9 1.8Other long-term equity investments 5.6 6.2 4.5 4.3 2.8 2.9 2.6 2.6 7.4 8.2
of which: Goodwill 0.3 0.3 0.3 0.4 0.1 0.1 0.2 0.2 0.3 0.3
CapitalEquity 47.1 46.8 40.0 39.4 44.7 44.5 46.5 46.6 47.8 47.3Liabilities 42.2 42.1 54.3 54.9 49.1 49.5 45.1 45.1 39.7 39.5
Short-term 28.5 28.3 33.2 34.7 29.8 30.9 30.6 30.7 27.2 26.7of which:Liabilities to banks 3.6 3.8 7.8 8.7 6.0 6.3 5.1 5.0 2.6 2.8Trade payables 7.4 6.7 5.5 5.4 5.4 5.2 6.0 5.7 8.3 7.3Liabilities to affiliated companies 9.0 9.6 7.1 7.2 4.8 5.1 7.0 7.2 10.6 11.3
Long-term 13.7 13.8 21.1 20.2 19.3 18.5 14.5 14.4 12.5 12.8 of which:
Liabilities to banks 8.4 8.4 13.9 12.9 14.6 14.0 10.0 10.2 6.8 6.7Liabilities to affiliated companies 4.1 4.3 5.8 5.7 3.9 3.8 3.4 3.1 4.4 4.8
Provisions 9.9 10.2 5.0 4.9 5.5 5.4 7.7 7.6 11.6 12.1of which: Provisions for pensions 1.4 1.5 0.8 0.7 0.7 0.7 0.8 0.8 1.8 1.9
Other ratios Percentage of salesAnnual result before taxes on income 4.1 3.9 4.1 4.8 4.4 4.4 4.5 4.3 3.9 3.6Annual result and depreciation 7.1 6.7 8.4 8.9 8.2 8.2 8.1 8.0 6.6 6.1Trade receivables 7.3 7.0 9.3 9.2 8.1 7.8 8.0 8.1 7.0 6.5
Percentage of the balance sheet totalSales 125.7 125.0 90.4 92.2 97.7 98.4 108.7 108.6 137.8 136.7Annual result and interest paid 5.1 4.7 3.6 4.1 3.9 3.9 4.5 4.3 5.5 4.9
Percentage of liabilities and provisions less cashAnnual result and depreciation 19.7 18.6 16.6 17.5 18.3 18.4 19.9 19.7 19.9 18.2
Percentage of fixed assetsLong-term equity and liabilities 113.2 112.6 115.0 113.8 123.5 123.4 117.8 119.8 110.0 108.3
Percentage of short-term liabilitiesCash resources and short-term receivables 106.3 105.4 95.2 90.6 93.9 91.5 91.4 92.4 115.8 114.7Cash resources, short-term receivables and inventories 157.2 157.3 137.3 133.7 158.0 154.7 154.3 156.7 159.0 158.7
Percentage of cost of materialsTrade payables 8.6 7.9 15.4 14.9 11.2 10.8 10.0 9.7 8.1 7.2
Memo item:Balance sheet total in € billion 135.72 140.52 1.74 1.82 11.97 12.50 37.09 38.43 84.91 87.76Sales in € billion 170.57 175.65 1.57 1.68 11.71 12.30 40.33 41.73 116.97 119.95Number of enterprises 6 404 6 404 1 689 1 689 2 391 2 391 1 746 1 746 578 578
* Agriculture, forestry and fishing, mining and quarrying, manufacturing, electricity, gas and water supply, construction, trade, transportation and storage,accommodation and food service activities, information and communication, business services, personal service activities

Deutsche BundesbankFinancial statement statistics (ratios - provisional data)
May 2021185
III. East German enterprises by economic sector
cont'd: 1. All economic sectors*
cont'd: CorporationsEnterprises with sales of ... € million
Total Less than 2 2 but less than 10 10 but less than 50 50 and moreQuartile Cylindered sample 2018/2019value 2018 2019 2018 2019 2018 2019 2018 2019 2018 2019Of the enterprises captured …
Ratios ... % had a ratio of less than …Percentage of gross revenue
Cost of materials 25 28.6 27.7 15.1 14.3 30.3 29.5 36.4 36.1 47.7 47.5 50 48.9 48.0 36.1 34.5 48.2 47.9 55.8 55.1 67.3 66.5 75 66.4 66.4 54.3 53.2 62.9 63.0 72.5 71.9 80.7 79.7
Personnel expenses 25 14.5 14.7 21.1 21.4 17.8 18.3 12.3 12.6 7.0 7.2 50 27.3 27.6 35.0 35.1 29.2 29.4 22.3 22.9 13.5 13.9 75 41.3 41.8 49.6 49.6 40.1 40.5 36.1 37.2 24.3 25.3
Depreciation 25 1.2 1.2 1.1 1.1 1.2 1.2 1.3 1.3 1.3 1.3 50 2.8 2.7 2.7 2.8 2.6 2.5 2.9 2.9 3.0 3.0 75 6.1 6.1 6.1 6.4 6.3 6.3 6.0 6.0 5.6 5.6
Annual result 25 0.4 0.4 0.0 0.3 0.5 0.5 0.5 0.5 0.3 0.2 50 2.3 2.4 2.3 3.0 2.2 2.3 2.3 2.4 2.2 1.9 75 5.9 5.9 7.0 7.6 5.4 5.7 5.7 5.5 6.0 5.4
Percentage of the balance sheet totalTangible fixed assets 25 9.5 9.6 5.7 5.9 10.1 9.9 11.8 11.7 14.5 15.3
50 27.5 27.2 20.8 21.3 26.6 26.9 31.3 31.3 31.5 32.8 75 54.7 54.1 51.4 49.8 56.7 55.5 54.5 54.8 55.1 57.5
Inventories 25 1.2 1.2 0.0 0.0 2.3 2.4 1.2 1.2 2.3 2.2 50 13.0 12.7 6.3 6.4 14.6 14.1 17.7 18.1 15.1 14.6 75 35.4 35.7 25.0 24.4 38.4 39.2 38.4 38.4 34.0 34.1
Equity 25 16.4 17.8 11.5 13.8 17.4 18.5 18.9 19.4 20.8 19.5 50 37.2 38.6 34.1 36.8 37.4 38.3 38.4 39.3 40.0 41.2 75 60.5 61.5 59.5 61.0 59.5 60.9 61.6 62.4 62.0 62.2
Short-term liabilities 25 15.3 15.0 15.0 14.7 15.3 15.0 15.1 15.0 15.5 15.6 50 32.0 31.2 31.7 31.3 32.4 31.4 32.2 31.4 31.0 29.6 75 58.8 57.2 61.7 57.0 58.0 57.3 58.7 57.5 55.3 56.5
Liabilities to banks 25 0.0 0.0 0.0 0.0 0.0 0.0 0.0 0.0 0.0 0.0 50 7.6 7.3 4.6 5.4 10.0 9.8 8.0 6.8 3.5 2.7 75 27.0 27.4 27.0 27.9 29.9 29.7 25.6 25.8 19.9 19.6
Percentage of salesAnnual result before taxes on income 25 0.5 0.6 0.0 0.4 0.7 0.7 0.8 0.8 0.5 0.3
50 3.0 3.3 3.1 3.8 3.0 3.2 3.1 3.2 2.9 2.4 75 7.6 7.9 9.1 9.9 7.2 7.7 7.2 7.0 7.3 6.8
Annual result and depreciation 25 2.9 3.2 2.3 3.5 3.2 3.3 3.1 3.2 2.8 2.4 50 6.9 7.2 6.8 7.6 7.2 7.3 7.0 7.1 6.6 6.3 75 13.5 13.5 15.5 16.1 13.0 13.5 13.2 12.7 12.1 11.6
Trade receivables 25 3.1 2.9 2.5 2.5 3.5 3.3 3.4 3.0 2.3 2.2 50 6.8 6.4 6.8 6.5 6.8 6.4 6.9 6.8 6.3 6.0 75 11.2 11.0 12.1 11.8 10.7 10.6 11.3 11.2 11.1 10.8
Percentage of the balance sheet totalAnnual result and interest paid 25 1.6 1.7 0.7 1.4 1.8 1.9 1.8 1.8 1.4 1.4
50 4.7 4.8 5.0 5.9 4.5 4.5 4.6 4.4 4.6 4.4 75 9.7 10.3 11.7 12.9 9.1 9.6 9.2 9.3 9.1 8.5
Percentage of liabilities and provisions less cashAnnual result and depreciation 25 3.8 4.6 - 6.0 - 2.2 4.3 5.0 6.4 6.5 7.9 8.7
50 16.3 16.5 11.9 13.6 16.0 16.0 19.1 18.6 20.4 18.9 75 40.7 41.8 39.3 41.8 41.1 42.1 42.9 41.9 38.1 39.7
Percentage of fixed assetsLong-term equity and liabilities 25 98.2 98.1 91.5 94.9 103.0 102.3 96.5 97.1 95.2 94.1
50 145.0 145.0 158.0 161.5 153.2 156.4 136.1 136.5 123.4 118.8 75 291.4 295.7 397.6 416.4 309.7 320.2 243.3 243.7 202.9 200.6
Percentage of short-term liabilitiesCash resources and short-term receivables 25 51.9 51.8 55.3 55.6 50.9 48.7 50.7 52.8 55.3 54.2
50 112.0 114.0 133.3 138.7 109.2 109.0 105.1 105.0 107.5 107.5 75 238.3 253.0 314.8 325.0 229.7 243.6 209.7 214.8 194.7 197.6
Percentage of cost of materialsTrade payables 25 4.8 4.6 4.7 4.0 4.8 4.7 5.1 5.0 4.5 4.3
50 9.3 9.0 10.6 10.1 9.4 8.9 9.0 8.7 8.0 8.0 75 17.3 16.3 27.0 23.7 17.1 16.5 15.2 14.3 12.8 13.0
* Agriculture, forestry and fishing, mining and quarrying, manufacturing, electricity, gas and water supply, construction, trade, transportation and storage,accommodation and food service activities, information and communication, business services, personal service activities
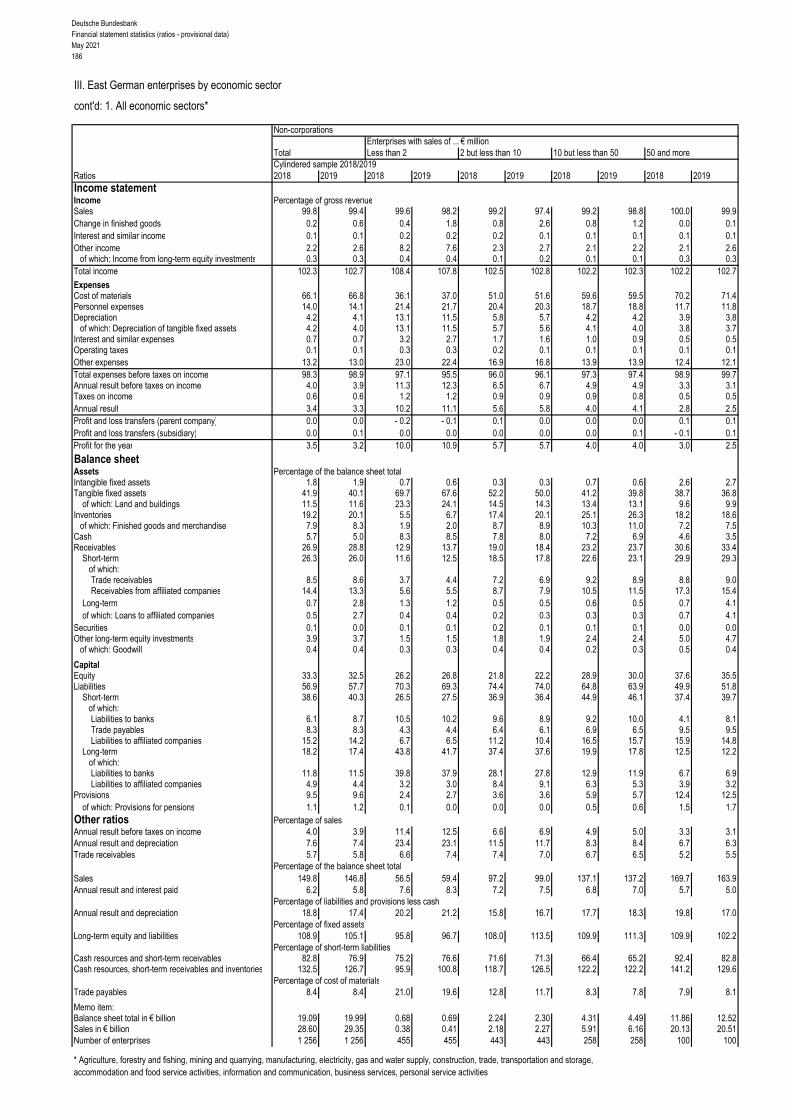
Deutsche BundesbankFinancial statement statistics (ratios - provisional data)May 2021186
III. East German enterprises by economic sector
cont'd: 1. All economic sectors*
Non-corporationsEnterprises with sales of ... € million
Total Less than 2 2 but less than 10 10 but less than 50 50 and moreCylindered sample 2018/2019
Ratios 2018 2019 2018 2019 2018 2019 2018 2019 2018 2019Income statementIncome Percentage of gross revenueSales 99.8 99.4 99.6 98.2 99.2 97.4 99.2 98.8 100.0 99.9Change in finished goods 0.2 0.6 0.4 1.8 0.8 2.6 0.8 1.2 0.0 0.1Interest and similar income 0.1 0.1 0.2 0.2 0.2 0.1 0.1 0.1 0.1 0.1Other income 2.2 2.6 8.2 7.6 2.3 2.7 2.1 2.2 2.1 2.6
of which: Income from long-term equity investments 0.3 0.3 0.4 0.4 0.1 0.2 0.1 0.1 0.3 0.3Total income 102.3 102.7 108.4 107.8 102.5 102.8 102.2 102.3 102.2 102.7
ExpensesCost of materials 66.1 66.8 36.1 37.0 51.0 51.6 59.6 59.5 70.2 71.4Personnel expenses 14.0 14.1 21.4 21.7 20.4 20.3 18.7 18.8 11.7 11.8Depreciation 4.2 4.1 13.1 11.5 5.8 5.7 4.2 4.2 3.9 3.8
of which: Depreciation of tangible fixed assets 4.2 4.0 13.1 11.5 5.7 5.6 4.1 4.0 3.8 3.7Interest and similar expenses 0.7 0.7 3.2 2.7 1.7 1.6 1.0 0.9 0.5 0.5Operating taxes 0.1 0.1 0.3 0.3 0.2 0.1 0.1 0.1 0.1 0.1Other expenses 13.2 13.0 23.0 22.4 16.9 16.8 13.9 13.9 12.4 12.1Total expenses before taxes on income 98.3 98.9 97.1 95.5 96.0 96.1 97.3 97.4 98.9 99.7Annual result before taxes on income 4.0 3.9 11.3 12.3 6.5 6.7 4.9 4.9 3.3 3.1Taxes on income 0.6 0.6 1.2 1.2 0.9 0.9 0.9 0.8 0.5 0.5Annual result 3.4 3.3 10.2 11.1 5.6 5.8 4.0 4.1 2.8 2.5Profit and loss transfers (parent company) 0.0 0.0 - 0.2 - 0.1 0.1 0.0 0.0 0.0 0.1 0.1Profit and loss transfers (subsidiary) 0.0 0.1 0.0 0.0 0.0 0.0 0.0 0.1 - 0.1 0.1Profit for the year 3.5 3.2 10.0 10.9 5.7 5.7 4.0 4.0 3.0 2.5
Balance sheetAssets Percentage of the balance sheet totalIntangible fixed assets 1.8 1.9 0.7 0.6 0.3 0.3 0.7 0.6 2.6 2.7Tangible fixed assets 41.9 40.1 69.7 67.6 52.2 50.0 41.2 39.8 38.7 36.8
of which: Land and buildings 11.5 11.6 23.3 24.1 14.5 14.3 13.4 13.1 9.6 9.9Inventories 19.2 20.1 5.5 6.7 17.4 20.1 25.1 26.3 18.2 18.6
of which: Finished goods and merchandise 7.9 8.3 1.9 2.0 8.7 8.9 10.3 11.0 7.2 7.5Cash 5.7 5.0 8.3 8.5 7.8 8.0 7.2 6.9 4.6 3.5Receivables 26.9 28.8 12.9 13.7 19.0 18.4 23.2 23.7 30.6 33.4
Short-term 26.3 26.0 11.6 12.5 18.5 17.8 22.6 23.1 29.9 29.3 of which:
Trade receivables 8.5 8.6 3.7 4.4 7.2 6.9 9.2 8.9 8.8 9.0Receivables from affiliated companies 14.4 13.3 5.6 5.5 8.7 7.9 10.5 11.5 17.3 15.4
Long-term 0.7 2.8 1.3 1.2 0.5 0.5 0.6 0.5 0.7 4.1of which: Loans to affiliated companies 0.5 2.7 0.4 0.4 0.2 0.3 0.3 0.3 0.7 4.1
Securities 0.1 0.0 0.1 0.1 0.2 0.1 0.1 0.1 0.0 0.0Other long-term equity investments 3.9 3.7 1.5 1.5 1.8 1.9 2.4 2.4 5.0 4.7
of which: Goodwill 0.4 0.4 0.3 0.3 0.4 0.4 0.2 0.3 0.5 0.4
CapitalEquity 33.3 32.5 26.2 26.8 21.8 22.2 28.9 30.0 37.6 35.5Liabilities 56.9 57.7 70.3 69.3 74.4 74.0 64.8 63.9 49.9 51.8
Short-term 38.6 40.3 26.5 27.5 36.9 36.4 44.9 46.1 37.4 39.7of which:Liabilities to banks 6.1 8.7 10.5 10.2 9.6 8.9 9.2 10.0 4.1 8.1Trade payables 8.3 8.3 4.3 4.4 6.4 6.1 6.9 6.5 9.5 9.5Liabilities to affiliated companies 15.2 14.2 6.7 6.5 11.2 10.4 16.5 15.7 15.9 14.8
Long-term 18.2 17.4 43.8 41.7 37.4 37.6 19.9 17.8 12.5 12.2 of which:
Liabilities to banks 11.8 11.5 39.8 37.9 28.1 27.8 12.9 11.9 6.7 6.9Liabilities to affiliated companies 4.9 4.4 3.2 3.0 8.4 9.1 6.3 5.3 3.9 3.2
Provisions 9.5 9.6 2.4 2.7 3.6 3.6 5.9 5.7 12.4 12.5of which: Provisions for pensions 1.1 1.2 0.1 0.0 0.0 0.0 0.5 0.6 1.5 1.7
Other ratios Percentage of salesAnnual result before taxes on income 4.0 3.9 11.4 12.5 6.6 6.9 4.9 5.0 3.3 3.1Annual result and depreciation 7.6 7.4 23.4 23.1 11.5 11.7 8.3 8.4 6.7 6.3Trade receivables 5.7 5.8 6.6 7.4 7.4 7.0 6.7 6.5 5.2 5.5
Percentage of the balance sheet totalSales 149.8 146.8 56.5 59.4 97.2 99.0 137.1 137.2 169.7 163.9Annual result and interest paid 6.2 5.8 7.6 8.3 7.2 7.5 6.8 7.0 5.7 5.0
Percentage of liabilities and provisions less cashAnnual result and depreciation 18.8 17.4 20.2 21.2 15.8 16.7 17.7 18.3 19.8 17.0
Percentage of fixed assetsLong-term equity and liabilities 108.9 105.1 95.8 96.7 108.0 113.5 109.9 111.3 109.9 102.2
Percentage of short-term liabilitiesCash resources and short-term receivables 82.8 76.9 75.2 76.6 71.6 71.3 66.4 65.2 92.4 82.8Cash resources, short-term receivables and inventories 132.5 126.7 95.9 100.8 118.7 126.5 122.2 122.2 141.2 129.6
Percentage of cost of materialsTrade payables 8.4 8.4 21.0 19.6 12.8 11.7 8.3 7.8 7.9 8.1
Memo item:Balance sheet total in € billion 19.09 19.99 0.68 0.69 2.24 2.30 4.31 4.49 11.86 12.52Sales in € billion 28.60 29.35 0.38 0.41 2.18 2.27 5.91 6.16 20.13 20.51Number of enterprises 1 256 1 256 455 455 443 443 258 258 100 100
* Agriculture, forestry and fishing, mining and quarrying, manufacturing, electricity, gas and water supply, construction, trade, transportation and storage,accommodation and food service activities, information and communication, business services, personal service activities

Deutsche BundesbankFinancial statement statistics (ratios - provisional data)
May 2021187
III. East German enterprises by economic sector
cont'd: 1. All economic sectors*
cont'd: Non-corporationsEnterprises with sales of ... € million
Total Less than 2 2 but less than 10 10 but less than 50 50 and moreQuartile Cylindered sample 2018/2019value 2018 2019 2018 2019 2018 2019 2018 2019 2018 2019Of the enterprises captured …
Ratios ... % had a ratio of less than …Percentage of gross revenue
Cost of materials 25 23.5 23.0 2.4 4.2 28.7 28.5 45.4 44.1 60.0 57.0 50 49.4 49.0 29.7 29.1 51.0 51.6 61.8 60.7 72.7 72.6 75 71.2 71.1 52.6 51.6 70.9 72.1 77.4 76.6 79.4 79.5
Personnel expenses 25 8.7 8.9 2.7 2.7 10.1 10.4 9.4 9.7 7.8 8.1 50 16.3 16.9 17.5 18.6 18.3 18.0 15.7 15.8 11.7 11.7 75 28.4 29.4 31.8 31.6 29.8 30.5 26.7 26.8 16.4 17.7
Depreciation 25 1.3 1.3 2.0 1.9 1.3 1.2 1.2 1.2 1.0 0.9 50 3.2 3.1 5.7 5.9 2.6 2.6 2.2 2.4 1.5 1.5 75 9.0 9.4 18.4 18.6 7.3 6.8 5.5 5.5 4.1 3.6
Annual result 25 1.6 1.5 3.0 3.2 1.8 1.8 0.9 0.9 0.0 0.3 50 5.0 5.0 10.0 10.5 4.5 4.5 3.2 3.1 1.9 2.1 75 11.8 12.1 21.1 20.9 8.5 9.1 6.2 6.0 5.5 5.5
Percentage of the balance sheet totalTangible fixed assets 25 16.5 15.3 22.8 22.2 11.8 12.4 14.9 14.5 17.9 18.4
50 40.0 38.7 56.5 58.2 35.8 35.8 31.4 31.3 30.3 31.5 75 67.4 66.7 78.5 77.9 63.4 63.0 52.5 51.6 43.9 47.8
Inventories 25 0.5 0.7 0.0 0.0 1.7 2.1 8.8 9.1 12.1 11.5 50 12.3 12.5 1.7 1.7 13.8 14.2 26.4 24.7 22.8 21.4 75 32.6 33.5 16.0 15.3 41.6 39.0 43.1 45.0 37.3 36.7
Equity 25 5.4 6.0 3.6 3.2 3.6 5.1 7.1 7.1 11.5 15.1 50 20.8 21.6 20.9 20.3 18.1 19.4 23.7 24.5 25.9 29.1 75 40.9 42.1 44.6 45.5 36.1 36.7 42.1 44.7 41.2 42.8
Short-term liabilities 25 21.0 20.8 14.8 14.6 24.8 22.2 28.9 29.5 36.6 38.4 50 44.9 43.6 32.3 33.1 47.5 44.7 53.0 52.6 53.7 51.1 75 70.8 70.3 64.7 62.2 71.3 70.8 73.4 72.9 72.0 72.4
Liabilities to banks 25 2.0 1.8 6.0 4.7 3.7 3.0 1.4 1.2 0.0 0.0 50 24.9 23.0 34.8 34.5 26.6 25.0 16.8 16.1 0.5 1.7 75 52.3 51.7 63.3 63.4 53.1 51.6 38.7 41.9 21.9 24.0
Percentage of salesAnnual result before taxes on income 25 1.8 1.8 3.4 3.6 2.1 2.1 1.2 1.2 0.1 0.4
50 5.7 5.8 11.3 11.7 5.2 5.2 3.7 3.7 2.2 2.4 75 13.2 13.8 23.7 22.6 10.0 10.3 7.4 7.3 7.2 6.8
Annual result and depreciation 25 4.8 5.0 9.2 9.6 4.6 4.7 3.4 3.3 1.2 1.7 50 10.6 10.7 20.3 20.2 9.4 9.2 7.0 7.0 5.2 6.0 75 21.6 22.0 41.3 43.8 16.9 17.4 13.2 12.7 10.1 10.7
Trade receivables 25 1.9 1.9 1.0 0.8 3.0 2.8 2.9 3.0 0.9 1.3 50 5.6 5.3 4.6 4.3 6.3 5.8 6.0 5.6 5.5 5.1 75 9.9 9.6 10.2 10.5 9.9 9.5 9.4 9.0 8.7 8.9
Percentage of the balance sheet totalAnnual result and interest paid 25 3.7 3.8 4.5 4.3 4.6 4.7 3.2 3.2 1.0 1.5
50 8.9 8.8 11.8 13.8 8.9 8.9 6.7 6.8 5.5 5.9 75 18.5 19.4 28.1 30.6 16.8 17.3 13.2 12.5 10.1 9.7
Percentage of liabilities and provisions less cashAnnual result and depreciation 25 10.0 10.3 9.9 12.5 11.1 11.0 9.7 8.4 7.0 6.4
50 21.9 23.0 26.3 29.5 21.3 22.7 20.4 20.2 15.6 16.1 75 47.3 50.2 66.7 70.4 42.2 41.6 38.8 38.4 36.5 35.0
Percentage of fixed assetsLong-term equity and liabilities 25 62.5 67.2 58.2 58.4 68.8 69.1 71.6 73.5 60.2 60.0
50 102.8 103.9 98.7 100.3 105.9 106.7 110.4 110.5 99.9 97.5 75 157.5 167.2 135.7 153.7 174.8 180.4 166.9 188.6 148.1 146.8
Percentage of short-term liabilitiesCash resources and short-term receivables 25 34.9 33.1 35.8 32.6 34.9 31.6 33.0 33.8 34.2 37.6
50 69.5 70.8 86.3 81.1 67.9 71.7 58.2 63.3 72.7 66.2 75 136.1 134.7 172.9 181.0 127.0 132.0 114.0 111.7 113.3 109.7
Percentage of cost of materialsTrade payables 25 4.7 4.7 4.5 4.9 6.4 5.5 3.8 3.9 3.1 3.6
50 9.9 9.8 12.6 13.4 11.0 10.3 7.4 6.9 7.6 7.3 75 19.4 19.2 33.7 34.6 20.3 19.4 12.0 11.9 11.9 12.0
* Agriculture, forestry and fishing, mining and quarrying, manufacturing, electricity, gas and water supply, construction, trade, transportation and storage,accommodation and food service activities, information and communication, business services, personal service activities

Deutsche BundesbankFinancial statement statistics (ratios - provisional data)May 2021188
III. East German enterprises by economic sector
2. Manufacturing
All legal formsEnterprises with sales of ... € million
Total Less than 2 2 but less than 10 10 but less than 50 50 and moreCylindered sample 2018/2019
Ratios 2018 2019 2018 2019 2018 2019 2018 2019 2018 2019Income statementIncome Percentage of gross revenueSales 99.1 99.7 97.8 98.7 98.5 98.7 98.6 99.0 99.3 99.9Change in finished goods 0.9 0.3 2.2 1.3 1.5 1.3 1.4 1.0 0.7 0.1Interest and similar income 0.2 0.2 0.1 0.2 0.1 0.1 0.1 0.1 0.2 0.2Other income 2.1 2.4 4.0 3.3 2.3 2.8 2.3 2.3 2.0 2.4
of which: Income from long-term equity investments 0.2 0.2 0.0 0.1 0.1 0.1 0.3 0.3 0.1 0.1Total income 102.2 102.6 104.1 103.4 102.5 102.9 102.4 102.4 102.2 102.6
ExpensesCost of materials 64.6 63.9 38.6 39.0 46.4 46.6 54.4 53.7 68.9 68.3Personnel expenses 15.7 16.5 36.3 36.1 30.7 31.2 24.0 24.9 12.1 12.8Depreciation 4.0 4.0 5.1 4.6 4.1 4.1 4.4 4.5 3.9 3.8
of which: Depreciation of tangible fixed assets 3.8 3.9 5.0 4.6 4.1 4.1 4.2 4.3 3.7 3.7Interest and similar expenses 0.7 0.7 1.0 0.9 0.8 0.7 0.7 0.7 0.6 0.7Operating taxes 0.1 0.1 0.1 0.1 0.1 0.1 0.1 0.1 0.1 0.1Other expenses 12.7 13.2 18.5 18.7 15.4 15.3 14.7 14.8 11.9 12.6Total expenses before taxes on income 97.7 98.3 99.6 99.4 97.4 98.1 98.2 98.7 97.6 98.1Annual result before taxes on income 4.5 4.3 4.5 4.0 5.1 4.8 4.2 3.8 4.6 4.4Taxes on income 0.9 1.0 1.0 0.9 1.2 1.2 1.1 1.0 0.8 0.9Annual result 3.6 3.3 3.5 3.1 3.8 3.6 3.1 2.8 3.8 3.5Profit and loss transfers (parent company) 0.2 0.2 - 0.2 - 0.2 0.1 0.0 0.0 0.1 0.2 0.3Profit and loss transfers (subsidiary) 1.9 1.5 0.2 0.0 0.4 0.4 0.7 0.6 2.3 1.9Profit for the year 1.9 2.0 3.1 3.0 3.5 3.3 2.4 2.3 1.7 1.9
Balance sheetAssets Percentage of the balance sheet totalIntangible fixed assets 1.5 1.4 0.5 0.6 0.8 0.8 1.0 1.0 1.7 1.6Tangible fixed assets 33.0 32.3 43.2 43.5 38.9 38.5 37.1 36.8 31.2 30.5
of which: Land and buildings 11.6 11.7 20.1 20.1 18.1 17.8 14.3 14.4 10.3 10.4Inventories 21.8 21.5 21.3 21.7 26.0 26.8 29.1 29.3 19.3 18.7
of which: Finished goods and merchandise 5.7 5.6 5.2 5.4 5.7 5.8 6.4 6.7 5.4 5.2Cash 5.7 5.0 11.1 10.7 10.7 10.7 6.6 6.8 5.0 4.0Receivables 30.9 31.6 22.0 21.7 20.1 19.8 22.8 22.8 34.2 35.2
Short-term 29.3 29.5 20.6 19.7 19.2 18.9 21.7 21.8 32.4 32.7 of which:
Trade receivables 8.3 7.7 10.9 10.4 11.1 10.6 10.6 10.5 7.4 6.7Receivables from affiliated companies 18.5 19.0 6.7 5.9 5.6 5.6 8.8 9.0 22.5 23.1
Long-term 1.6 2.1 1.4 2.0 0.8 0.9 1.1 1.1 1.8 2.6of which: Loans to affiliated companies 1.4 1.8 1.4 1.9 0.4 0.5 0.9 0.8 1.6 2.3
Securities 0.2 0.2 0.2 0.2 1.1 1.0 0.4 0.3 0.0 0.1Other long-term equity investments 6.7 7.7 1.0 1.0 2.1 2.1 2.7 2.7 8.2 9.7
of which: Goodwill 0.5 0.4 0.7 0.6 0.2 0.2 0.2 0.2 0.6 0.5
CapitalEquity 46.6 46.4 36.5 36.3 44.7 45.9 42.8 43.9 48.0 47.3Liabilities 45.3 44.7 57.6 58.2 48.9 48.2 50.5 49.6 43.3 42.8
Short-term 33.1 33.3 38.5 36.4 33.9 34.4 37.2 37.1 31.7 32.0of which:Liabilities to banks 3.9 4.5 9.6 8.4 6.7 7.1 6.4 6.2 2.8 3.8Trade payables 7.8 7.4 6.9 6.9 6.7 6.4 7.1 6.7 8.0 7.6Liabilities to affiliated companies 14.1 14.3 7.1 6.7 7.0 7.0 12.0 11.9 15.3 15.6
Long-term 12.2 11.4 19.2 21.8 15.0 13.7 13.2 12.5 11.6 10.9 of which:
Liabilities to banks 6.4 6.3 13.5 14.7 10.2 9.5 7.3 7.5 5.9 5.6Liabilities to affiliated companies 4.7 4.2 4.4 5.7 3.6 2.9 4.9 4.1 4.7 4.2
Provisions 7.9 8.3 5.7 5.3 6.3 5.9 6.6 6.3 8.5 9.2of which: Provisions for pensions 1.4 1.6 0.8 0.6 1.0 1.0 0.9 0.9 1.6 1.8
Other ratios Percentage of salesAnnual result before taxes on income 4.6 4.3 4.6 4.1 5.1 4.9 4.2 3.8 4.6 4.4Annual result and depreciation 7.7 7.3 8.8 7.8 8.1 7.9 7.6 7.3 7.7 7.3Trade receivables 6.1 5.9 8.6 8.1 8.5 8.1 8.1 8.1 5.4 5.1
Percentage of the balance sheet totalSales 136.0 131.4 126.9 128.1 131.6 131.0 130.5 129.1 138.1 132.2Annual result and interest paid 5.9 5.3 5.9 5.3 6.1 5.8 5.1 4.6 6.2 5.5
Percentage of liabilities and provisions less cashAnnual result and depreciation 22.0 19.8 21.2 19.0 23.9 23.8 19.5 19.2 22.7 19.8
Percentage of fixed assetsLong-term equity and liabilities 140.5 136.1 121.9 124.4 141.0 142.1 135.3 137.6 142.2 135.4
Percentage of short-term liabilitiesCash resources and short-term receivables 106.0 103.9 82.7 84.0 90.2 87.5 76.6 77.4 118.2 114.8Cash resources, short-term receivables and inventories 171.9 168.5 138.1 143.6 166.9 165.4 154.7 156.3 178.9 173.3
Percentage of cost of materialsTrade payables 8.8 8.7 13.8 13.6 10.7 10.3 9.8 9.6 8.4 8.5
Memo item:Balance sheet total in € billion 55.91 57.77 0.25 0.26 2.65 2.72 12.67 13.03 40.34 41.76Sales in € billion 76.05 75.92 0.31 0.34 3.48 3.57 16.54 16.82 55.72 55.19Number of enterprises 1 982 1 982 300 300 680 680 691 691 311 311
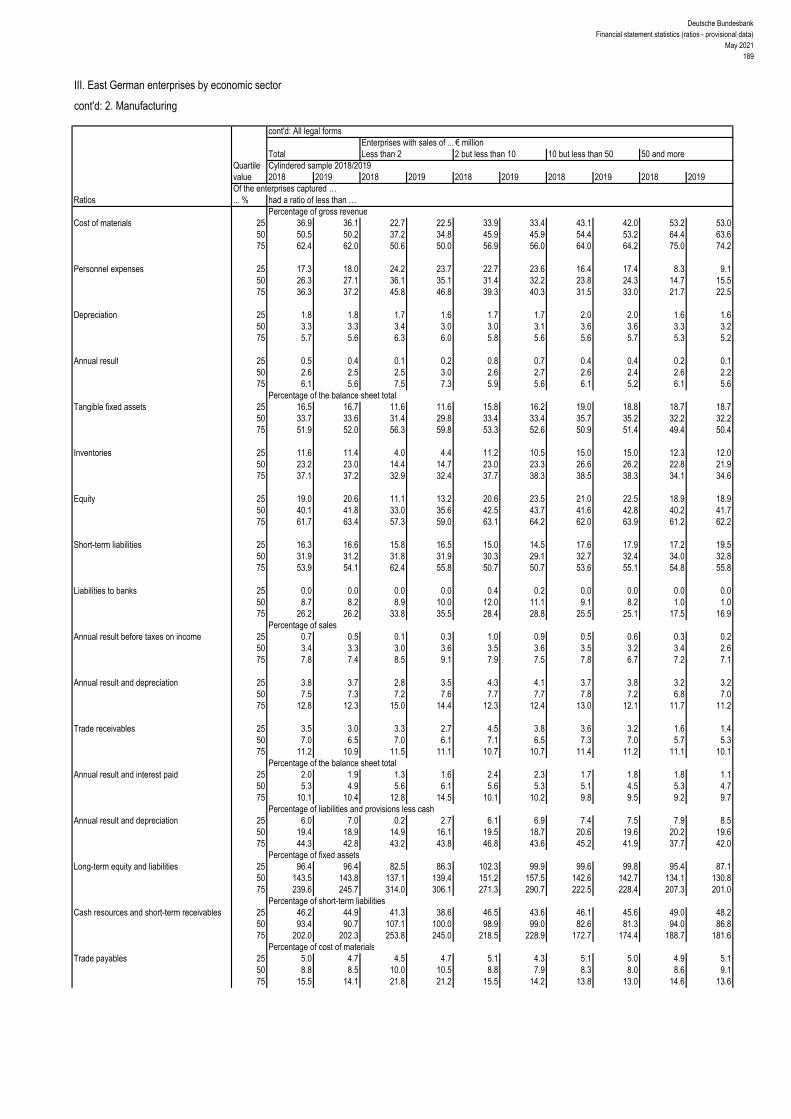
Deutsche BundesbankFinancial statement statistics (ratios - provisional data)
May 2021189
III. East German enterprises by economic sector
cont'd: 2. Manufacturing
cont'd: All legal formsEnterprises with sales of ... € million
Total Less than 2 2 but less than 10 10 but less than 50 50 and moreQuartile Cylindered sample 2018/2019value 2018 2019 2018 2019 2018 2019 2018 2019 2018 2019Of the enterprises captured …
Ratios ... % had a ratio of less than …Percentage of gross revenue
Cost of materials 25 36.9 36.1 22.7 22.5 33.9 33.4 43.1 42.0 53.2 53.0 50 50.5 50.2 37.2 34.8 45.9 45.9 54.4 53.2 64.4 63.6 75 62.4 62.0 50.6 50.0 56.9 56.0 64.0 64.2 75.0 74.2
Personnel expenses 25 17.3 18.0 24.2 23.7 22.7 23.6 16.4 17.4 8.3 9.1 50 26.3 27.1 36.1 35.1 31.4 32.2 23.8 24.3 14.7 15.5 75 36.3 37.2 45.8 46.8 39.3 40.3 31.5 33.0 21.7 22.5
Depreciation 25 1.8 1.8 1.7 1.6 1.7 1.7 2.0 2.0 1.6 1.6 50 3.3 3.3 3.4 3.0 3.0 3.1 3.6 3.6 3.3 3.2 75 5.7 5.6 6.3 6.0 5.8 5.6 5.6 5.7 5.3 5.2
Annual result 25 0.5 0.4 0.1 0.2 0.8 0.7 0.4 0.4 0.2 0.1 50 2.6 2.5 2.5 3.0 2.6 2.7 2.6 2.4 2.6 2.2 75 6.1 5.6 7.5 7.3 5.9 5.6 6.1 5.2 6.1 5.6
Percentage of the balance sheet totalTangible fixed assets 25 16.5 16.7 11.6 11.6 15.8 16.2 19.0 18.8 18.7 18.7
50 33.7 33.6 31.4 29.8 33.4 33.4 35.7 35.2 32.2 32.2 75 51.9 52.0 56.3 59.8 53.3 52.6 50.9 51.4 49.4 50.4
Inventories 25 11.6 11.4 4.0 4.4 11.2 10.5 15.0 15.0 12.3 12.0 50 23.2 23.0 14.4 14.7 23.0 23.3 26.6 26.2 22.8 21.9 75 37.1 37.2 32.9 32.4 37.7 38.3 38.5 38.3 34.1 34.6
Equity 25 19.0 20.6 11.1 13.2 20.6 23.5 21.0 22.5 18.9 18.9 50 40.1 41.8 33.0 35.6 42.5 43.7 41.6 42.8 40.2 41.7 75 61.7 63.4 57.3 59.0 63.1 64.2 62.0 63.9 61.2 62.2
Short-term liabilities 25 16.3 16.6 15.8 16.5 15.0 14.5 17.6 17.9 17.2 19.5 50 31.9 31.2 31.8 31.9 30.3 29.1 32.7 32.4 34.0 32.8 75 53.9 54.1 62.4 55.8 50.7 50.7 53.6 55.1 54.8 55.8
Liabilities to banks 25 0.0 0.0 0.0 0.0 0.4 0.2 0.0 0.0 0.0 0.0 50 8.7 8.2 8.9 10.0 12.0 11.1 9.1 8.2 1.0 1.0 75 26.2 26.2 33.8 35.5 28.4 28.8 25.5 25.1 17.5 16.9
Percentage of salesAnnual result before taxes on income 25 0.7 0.5 0.1 0.3 1.0 0.9 0.5 0.6 0.3 0.2
50 3.4 3.3 3.0 3.6 3.5 3.6 3.5 3.2 3.4 2.6 75 7.8 7.4 8.5 9.1 7.9 7.5 7.8 6.7 7.2 7.1
Annual result and depreciation 25 3.8 3.7 2.8 3.5 4.3 4.1 3.7 3.8 3.2 3.2 50 7.5 7.3 7.2 7.6 7.7 7.7 7.8 7.2 6.8 7.0 75 12.8 12.3 15.0 14.4 12.3 12.4 13.0 12.1 11.7 11.2
Trade receivables 25 3.5 3.0 3.3 2.7 4.5 3.8 3.6 3.2 1.6 1.4 50 7.0 6.5 7.0 6.1 7.1 6.5 7.3 7.0 5.7 5.3 75 11.2 10.9 11.5 11.1 10.7 10.7 11.4 11.2 11.1 10.1
Percentage of the balance sheet totalAnnual result and interest paid 25 2.0 1.9 1.3 1.6 2.4 2.3 1.7 1.8 1.8 1.1
50 5.3 4.9 5.6 6.1 5.6 5.3 5.1 4.5 5.3 4.7 75 10.1 10.4 12.8 14.5 10.1 10.2 9.8 9.5 9.2 9.7
Percentage of liabilities and provisions less cashAnnual result and depreciation 25 6.0 7.0 0.2 2.7 6.1 6.9 7.4 7.5 7.9 8.5
50 19.4 18.9 14.9 16.1 19.5 18.7 20.6 19.6 20.2 19.6 75 44.3 42.8 43.2 43.8 46.8 43.6 45.2 41.9 37.7 42.0
Percentage of fixed assetsLong-term equity and liabilities 25 96.4 96.4 82.5 86.3 102.3 99.9 99.6 99.8 95.4 87.1
50 143.5 143.8 137.1 139.4 151.2 157.5 142.6 142.7 134.1 130.8 75 239.6 245.7 314.0 306.1 271.3 290.7 222.5 228.4 207.3 201.0
Percentage of short-term liabilitiesCash resources and short-term receivables 25 46.2 44.9 41.3 38.6 46.5 43.6 46.1 45.6 49.0 48.2
50 93.4 90.7 107.1 100.0 98.9 99.0 82.6 81.3 94.0 86.8 75 202.0 202.3 253.8 245.0 218.5 228.9 172.7 174.4 188.7 181.6
Percentage of cost of materialsTrade payables 25 5.0 4.7 4.5 4.7 5.1 4.3 5.1 5.0 4.9 5.1
50 8.8 8.5 10.0 10.5 8.8 7.9 8.3 8.0 8.6 9.1 75 15.5 14.1 21.8 21.2 15.5 14.2 13.8 13.0 14.6 13.6
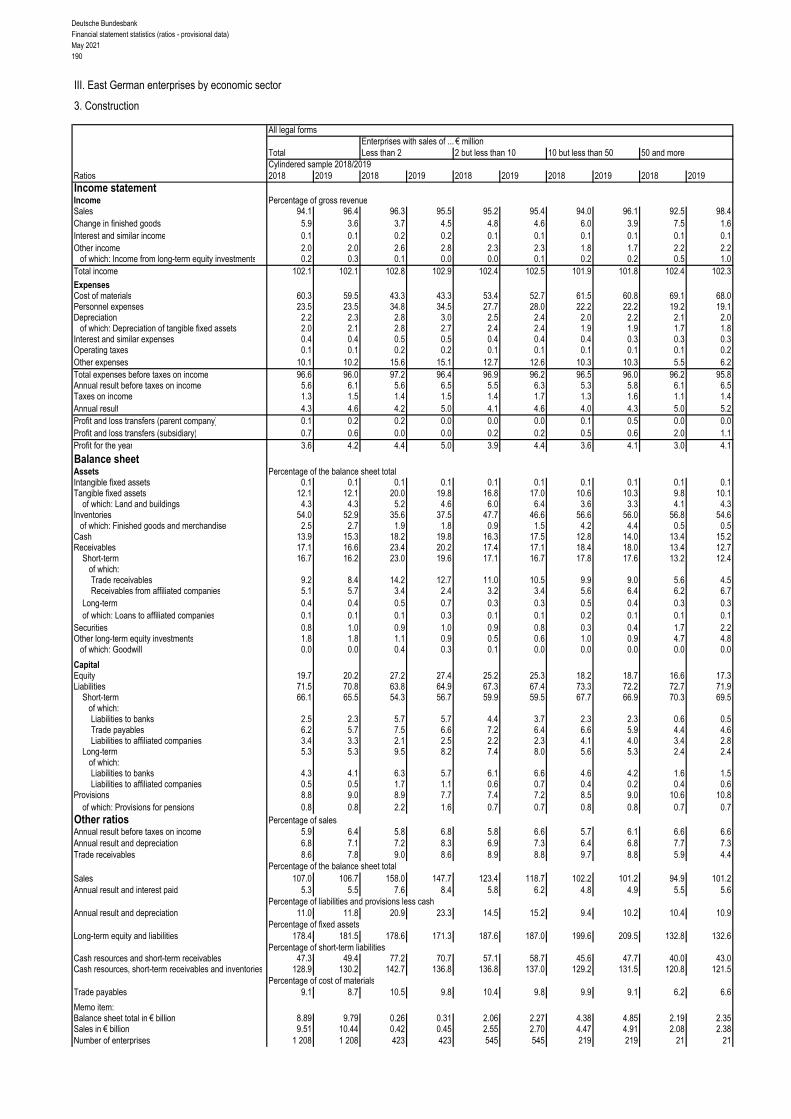
Deutsche BundesbankFinancial statement statistics (ratios - provisional data)May 2021190
III. East German enterprises by economic sector
3. Construction
All legal formsEnterprises with sales of ... € million
Total Less than 2 2 but less than 10 10 but less than 50 50 and moreCylindered sample 2018/2019
Ratios 2018 2019 2018 2019 2018 2019 2018 2019 2018 2019Income statementIncome Percentage of gross revenueSales 94.1 96.4 96.3 95.5 95.2 95.4 94.0 96.1 92.5 98.4Change in finished goods 5.9 3.6 3.7 4.5 4.8 4.6 6.0 3.9 7.5 1.6Interest and similar income 0.1 0.1 0.2 0.2 0.1 0.1 0.1 0.1 0.1 0.1Other income 2.0 2.0 2.6 2.8 2.3 2.3 1.8 1.7 2.2 2.2
of which: Income from long-term equity investments 0.2 0.3 0.1 0.0 0.0 0.1 0.2 0.2 0.5 1.0Total income 102.1 102.1 102.8 102.9 102.4 102.5 101.9 101.8 102.4 102.3
ExpensesCost of materials 60.3 59.5 43.3 43.3 53.4 52.7 61.5 60.8 69.1 68.0Personnel expenses 23.5 23.5 34.8 34.5 27.7 28.0 22.2 22.2 19.2 19.1Depreciation 2.2 2.3 2.8 3.0 2.5 2.4 2.0 2.2 2.1 2.0
of which: Depreciation of tangible fixed assets 2.0 2.1 2.8 2.7 2.4 2.4 1.9 1.9 1.7 1.8Interest and similar expenses 0.4 0.4 0.5 0.5 0.4 0.4 0.4 0.3 0.3 0.3Operating taxes 0.1 0.1 0.2 0.2 0.1 0.1 0.1 0.1 0.1 0.2Other expenses 10.1 10.2 15.6 15.1 12.7 12.6 10.3 10.3 5.5 6.2Total expenses before taxes on income 96.6 96.0 97.2 96.4 96.9 96.2 96.5 96.0 96.2 95.8Annual result before taxes on income 5.6 6.1 5.6 6.5 5.5 6.3 5.3 5.8 6.1 6.5Taxes on income 1.3 1.5 1.4 1.5 1.4 1.7 1.3 1.6 1.1 1.4Annual result 4.3 4.6 4.2 5.0 4.1 4.6 4.0 4.3 5.0 5.2Profit and loss transfers (parent company) 0.1 0.2 0.2 0.0 0.0 0.0 0.1 0.5 0.0 0.0Profit and loss transfers (subsidiary) 0.7 0.6 0.0 0.0 0.2 0.2 0.5 0.6 2.0 1.1Profit for the year 3.6 4.2 4.4 5.0 3.9 4.4 3.6 4.1 3.0 4.1
Balance sheetAssets Percentage of the balance sheet totalIntangible fixed assets 0.1 0.1 0.1 0.1 0.1 0.1 0.1 0.1 0.1 0.1Tangible fixed assets 12.1 12.1 20.0 19.8 16.8 17.0 10.6 10.3 9.8 10.1
of which: Land and buildings 4.3 4.3 5.2 4.6 6.0 6.4 3.6 3.3 4.1 4.3Inventories 54.0 52.9 35.6 37.5 47.7 46.6 56.6 56.0 56.8 54.6
of which: Finished goods and merchandise 2.5 2.7 1.9 1.8 0.9 1.5 4.2 4.4 0.5 0.5Cash 13.9 15.3 18.2 19.8 16.3 17.5 12.8 14.0 13.4 15.2Receivables 17.1 16.6 23.4 20.2 17.4 17.1 18.4 18.0 13.4 12.7
Short-term 16.7 16.2 23.0 19.6 17.1 16.7 17.8 17.6 13.2 12.4 of which:
Trade receivables 9.2 8.4 14.2 12.7 11.0 10.5 9.9 9.0 5.6 4.5Receivables from affiliated companies 5.1 5.7 3.4 2.4 3.2 3.4 5.6 6.4 6.2 6.7
Long-term 0.4 0.4 0.5 0.7 0.3 0.3 0.5 0.4 0.3 0.3of which: Loans to affiliated companies 0.1 0.1 0.1 0.3 0.1 0.1 0.2 0.1 0.1 0.1
Securities 0.8 1.0 0.9 1.0 0.9 0.8 0.3 0.4 1.7 2.2Other long-term equity investments 1.8 1.8 1.1 0.9 0.5 0.6 1.0 0.9 4.7 4.8
of which: Goodwill 0.0 0.0 0.4 0.3 0.1 0.0 0.0 0.0 0.0 0.0
CapitalEquity 19.7 20.2 27.2 27.4 25.2 25.3 18.2 18.7 16.6 17.3Liabilities 71.5 70.8 63.8 64.9 67.3 67.4 73.3 72.2 72.7 71.9
Short-term 66.1 65.5 54.3 56.7 59.9 59.5 67.7 66.9 70.3 69.5of which:Liabilities to banks 2.5 2.3 5.7 5.7 4.4 3.7 2.3 2.3 0.6 0.5Trade payables 6.2 5.7 7.5 6.6 7.2 6.4 6.6 5.9 4.4 4.6Liabilities to affiliated companies 3.4 3.3 2.1 2.5 2.2 2.3 4.1 4.0 3.4 2.8
Long-term 5.3 5.3 9.5 8.2 7.4 8.0 5.6 5.3 2.4 2.4 of which:
Liabilities to banks 4.3 4.1 6.3 5.7 6.1 6.6 4.6 4.2 1.6 1.5Liabilities to affiliated companies 0.5 0.5 1.7 1.1 0.6 0.7 0.4 0.2 0.4 0.6
Provisions 8.8 9.0 8.9 7.7 7.4 7.2 8.5 9.0 10.6 10.8of which: Provisions for pensions 0.8 0.8 2.2 1.6 0.7 0.7 0.8 0.8 0.7 0.7
Other ratios Percentage of salesAnnual result before taxes on income 5.9 6.4 5.8 6.8 5.8 6.6 5.7 6.1 6.6 6.6Annual result and depreciation 6.8 7.1 7.2 8.3 6.9 7.3 6.4 6.8 7.7 7.3Trade receivables 8.6 7.8 9.0 8.6 8.9 8.8 9.7 8.8 5.9 4.4
Percentage of the balance sheet totalSales 107.0 106.7 158.0 147.7 123.4 118.7 102.2 101.2 94.9 101.2Annual result and interest paid 5.3 5.5 7.6 8.4 5.8 6.2 4.8 4.9 5.5 5.6
Percentage of liabilities and provisions less cashAnnual result and depreciation 11.0 11.8 20.9 23.3 14.5 15.2 9.4 10.2 10.4 10.9
Percentage of fixed assetsLong-term equity and liabilities 178.4 181.5 178.6 171.3 187.6 187.0 199.6 209.5 132.8 132.6
Percentage of short-term liabilitiesCash resources and short-term receivables 47.3 49.4 77.2 70.7 57.1 58.7 45.6 47.7 40.0 43.0Cash resources, short-term receivables and inventories 128.9 130.2 142.7 136.8 136.8 137.0 129.2 131.5 120.8 121.5
Percentage of cost of materialsTrade payables 9.1 8.7 10.5 9.8 10.4 9.8 9.9 9.1 6.2 6.6
Memo item:Balance sheet total in € billion 8.89 9.79 0.26 0.31 2.06 2.27 4.38 4.85 2.19 2.35Sales in € billion 9.51 10.44 0.42 0.45 2.55 2.70 4.47 4.91 2.08 2.38Number of enterprises 1 208 1 208 423 423 545 545 219 219 21 21

Deutsche BundesbankFinancial statement statistics (ratios - provisional data)
May 2021191
III. East German enterprises by economic sector
cont'd: 3. Construction
cont'd: All legal formsEnterprises with sales of ... € million
Total Less than 2 2 but less than 10 10 but less than 50 50 and moreQuartile Cylindered sample 2018/2019value 2018 2019 2018 2019 2018 2019 2018 2019 2018 2019Of the enterprises captured …
Ratios ... % had a ratio of less than …Percentage of gross revenue
Cost of materials 25 38.0 37.2 30.4 29.0 40.1 40.1 50.9 48.3 52.8 51.9 50 49.5 48.5 41.3 40.2 51.0 50.1 59.5 59.1 67.7 66.2 75 61.5 61.1 52.1 50.9 61.7 61.8 71.7 70.5 84.1 79.5
Personnel expenses 25 21.5 21.0 26.1 26.6 21.3 21.3 14.8 15.3 8.2 8.0 50 30.1 29.9 34.7 35.1 29.9 29.6 23.0 23.1 22.1 20.7 75 38.3 38.8 43.6 45.0 37.0 37.5 30.3 30.4 29.6 29.7
Depreciation 25 0.9 0.9 1.1 1.1 0.9 0.9 0.6 0.7 0.5 0.3 50 1.8 1.9 2.2 2.3 1.7 1.7 1.5 1.4 1.3 1.1 75 3.4 3.3 3.6 3.9 3.2 3.0 3.0 3.3 3.0 3.2
Annual result 25 1.0 1.2 0.7 1.0 1.1 1.1 1.2 1.5 2.0 2.4 50 3.0 3.4 3.1 3.5 2.9 3.2 3.0 3.4 3.7 4.0 75 6.5 7.2 7.7 8.3 5.9 7.0 6.1 6.5 5.7 5.2
Percentage of the balance sheet totalTangible fixed assets 25 5.3 5.4 6.1 6.2 5.9 6.1 3.6 3.4 2.6 2.9
50 13.5 13.2 17.0 16.2 14.1 13.6 8.7 8.4 10.2 12.2 75 27.5 27.9 36.4 35.4 25.9 27.1 18.8 18.3 17.1 20.9
Inventories 25 8.1 8.1 2.5 3.0 10.4 9.3 28.1 28.7 41.5 42.0 50 31.7 30.6 15.8 15.5 35.5 34.8 52.3 49.8 53.8 51.9 75 59.1 57.5 39.7 42.5 60.7 59.1 68.6 65.7 63.4 61.8
Equity 25 9.9 10.8 8.9 10.6 12.1 12.6 8.0 8.4 5.7 5.3 50 22.9 24.4 26.7 29.2 24.2 25.8 16.7 18.6 16.0 14.8 75 43.3 46.3 48.6 53.2 44.1 47.4 31.5 32.3 25.9 25.1
Short-term liabilities 25 32.5 28.9 23.1 20.9 32.6 30.0 48.5 44.2 48.8 44.6 50 55.5 53.4 45.3 44.5 54.3 53.1 68.0 64.7 65.4 67.8 75 75.9 74.7 71.9 73.0 74.5 73.7 80.1 80.9 77.3 74.8
Liabilities to banks 25 0.0 0.0 0.0 0.0 0.0 0.0 0.0 0.0 0.0 0.0 50 4.2 4.0 6.9 6.7 4.2 4.1 2.5 1.5 1.1 1.0 75 16.2 16.5 25.9 26.3 14.5 15.9 8.2 7.1 4.0 4.4
Percentage of salesAnnual result before taxes on income 25 1.5 1.7 0.9 1.5 1.6 1.8 1.6 2.3 2.6 3.7
50 4.2 4.9 4.1 4.9 4.1 4.7 4.2 4.9 5.4 6.0 75 9.1 10.1 10.3 10.6 8.7 10.1 8.7 9.1 8.3 7.8
Annual result and depreciation 25 3.5 3.9 3.4 4.0 3.5 3.7 3.4 3.9 4.1 5.6 50 6.7 7.3 6.8 8.0 6.6 7.0 6.7 7.2 6.7 7.5 75 12.1 13.0 14.0 14.9 11.7 13.2 11.4 12.0 11.6 12.5
Trade receivables 25 3.9 3.5 3.5 3.0 4.1 3.9 4.9 3.8 2.1 1.3 50 7.7 7.3 7.0 6.5 7.7 7.6 8.2 8.0 7.4 3.5 75 12.4 11.4 12.3 11.0 12.1 11.4 13.4 12.4 10.6 8.8
Percentage of the balance sheet totalAnnual result and interest paid 25 2.4 2.7 2.5 3.2 2.5 2.6 1.9 2.3 3.4 3.8
50 5.6 5.9 7.9 7.5 5.5 5.5 4.4 5.0 4.0 4.8 75 11.8 12.9 16.1 18.3 10.7 11.7 9.1 9.8 8.5 7.4
Percentage of liabilities and provisions less cashAnnual result and depreciation 25 4.2 4.5 1.0 3.1 4.6 4.9 4.7 4.5 7.6 9.0
50 13.8 14.0 15.0 18.1 14.5 13.3 12.0 11.0 11.0 15.4 75 39.8 40.8 48.3 52.8 40.3 40.7 23.0 24.8 17.4 45.0
Percentage of fixed assetsLong-term equity and liabilities 25 111.2 115.5 100.5 111.7 122.1 123.0 112.0 108.3 121.2 101.8
50 203.0 203.7 199.4 185.6 208.1 211.4 200.7 211.4 159.1 140.1 75 407.2 410.6 431.4 429.7 390.7 401.0 430.8 437.1 255.2 248.8
Percentage of short-term liabilitiesCash resources and short-term receivables 25 35.5 36.3 45.6 45.8 35.5 35.6 26.4 31.0 30.3 24.5
50 76.1 77.3 99.2 108.3 74.4 76.5 48.0 52.5 45.3 45.6 75 166.2 179.6 238.3 276.5 164.6 181.7 97.6 102.7 55.5 71.1
Percentage of cost of materialsTrade payables 25 5.0 4.4 4.6 3.5 4.8 4.5 5.9 5.7 4.8 4.7
50 8.8 8.0 8.6 7.6 8.9 7.9 8.9 8.4 8.6 8.4 75 14.7 13.3 16.6 14.3 14.4 13.4 13.2 12.2 11.5 12.0

Deutsche BundesbankFinancial statement statistics (ratios - provisional data)May 2021192
III. East German enterprises by economic sector
4. Wholesale and retail trade; repair of motor vehicles and motorcycles
All legal formsEnterprises with sales of ... € million
Total Less than 2 2 but less than 10 10 but less than 50 50 and moreCylindered sample 2018/2019
Ratios 2018 2019 2018 2019 2018 2019 2018 2019 2018 2019Income statementIncome Percentage of gross revenueSales 99.9 99.9 99.6 99.0 99.8 99.6 100.0 100.0 99.9 99.9Change in finished goods 0.1 0.1 0.4 1.0 0.2 0.4 0.0 0.0 0.1 0.1Interest and similar income 0.1 0.1 0.1 0.1 0.1 0.1 0.1 0.1 0.1 0.1Other income 1.1 1.1 3.0 2.9 1.6 1.8 1.0 0.8 1.0 1.0
of which: Income from long-term equity investments 0.2 0.1 0.0 0.0 0.1 0.1 0.1 0.0 0.2 0.2Total income 101.1 101.1 103.0 102.9 101.7 101.9 101.0 100.9 101.1 101.1
ExpensesCost of materials 79.4 79.3 56.7 56.3 69.6 69.5 76.3 76.0 82.3 82.1Personnel expenses 8.8 8.7 22.5 22.6 15.1 15.3 11.0 11.3 6.8 6.7Depreciation 1.6 2.0 2.9 2.9 2.0 2.0 1.6 1.6 1.6 2.1
of which: Depreciation of tangible fixed assets 1.5 1.7 2.8 2.9 1.9 1.9 1.5 1.5 1.5 1.7Interest and similar expenses 0.4 0.5 0.7 0.6 0.6 0.6 0.4 0.4 0.4 0.5Operating taxes 0.0 0.0 0.1 0.1 0.1 0.1 0.1 0.1 0.0 0.0Other expenses 8.5 8.6 16.0 16.1 11.5 11.6 8.5 8.8 8.0 8.0Total expenses before taxes on income 98.8 99.1 98.8 98.7 98.9 98.9 97.8 98.0 99.1 99.5Annual result before taxes on income 2.4 2.1 4.2 4.3 2.8 3.0 3.2 2.9 2.0 1.6Taxes on income 0.5 0.5 0.9 0.9 0.7 0.7 0.7 0.6 0.4 0.4Annual result 1.9 1.6 3.3 3.4 2.1 2.3 2.5 2.3 1.6 1.2Profit and loss transfers (parent company) - 0.1 0.0 0.0 0.0 0.0 0.0 0.0 0.0 - 0.1 - 0.1Profit and loss transfers (subsidiary) 0.3 0.3 - 0.1 - 0.1 0.1 0.1 0.7 0.6 0.1 0.2Profit for the year 1.5 1.3 3.4 3.4 2.0 2.2 1.8 1.7 1.3 0.9
Balance sheetAssets Percentage of the balance sheet totalIntangible fixed assets 6.0 9.4 0.5 0.6 0.4 0.5 0.3 0.3 10.0 15.1Tangible fixed assets 23.3 21.9 35.1 33.4 27.4 27.4 25.1 25.4 21.5 19.3
of which: Land and buildings 10.1 9.2 13.6 13.0 12.3 12.1 11.8 11.9 8.7 7.4Inventories 30.2 28.6 27.0 27.7 35.0 35.4 37.7 37.8 25.6 23.4
of which: Finished goods and merchandise 27.6 26.3 22.8 21.8 30.6 30.8 34.9 35.3 23.5 21.6Cash 8.8 7.1 14.2 15.0 10.7 10.3 7.8 7.8 8.8 6.2Receivables 27.6 29.3 21.3 21.5 23.6 23.6 26.5 26.3 29.0 31.6
Short-term 26.8 28.5 21.0 21.3 22.4 22.5 25.8 25.5 28.2 30.9 of which:
Trade receivables 14.2 14.3 12.3 12.4 12.8 12.7 13.8 13.5 14.6 15.0Receivables from affiliated companies 8.4 10.0 3.5 3.3 4.0 4.0 6.3 6.4 10.4 12.7
Long-term 0.8 0.8 0.2 0.2 1.2 1.1 0.7 0.8 0.8 0.8of which: Loans to affiliated companies 0.3 0.4 0.1 0.0 0.5 0.5 0.2 0.4 0.3 0.4
Securities 0.3 0.2 0.1 0.2 0.3 0.3 0.6 0.4 0.2 0.1Other long-term equity investments 3.4 3.1 1.2 1.1 2.2 2.1 1.7 1.7 4.6 3.9
of which: Goodwill 0.4 0.3 0.3 0.2 0.8 0.6 0.3 0.4 0.4 0.2
CapitalEquity 28.9 27.1 35.2 36.8 34.3 34.7 33.9 33.8 25.4 22.7Liabilities 65.3 67.5 59.2 57.8 60.2 60.1 59.9 60.3 69.0 72.1
Short-term 48.5 48.6 42.7 40.8 45.9 45.8 50.6 50.7 48.0 48.2of which:Liabilities to banks 14.6 15.0 13.4 11.8 15.1 15.7 18.8 20.1 12.4 12.6Trade payables 15.8 14.7 13.6 11.7 13.5 12.7 15.6 14.5 16.3 15.2Liabilities to affiliated companies 12.8 14.0 6.1 5.6 9.0 8.9 9.9 10.3 15.1 16.6
Long-term 16.8 18.9 16.5 17.0 14.4 14.3 9.4 9.5 21.0 23.9 of which:
Liabilities to banks 13.3 14.4 9.9 9.7 11.4 11.0 7.7 7.8 16.5 18.0Liabilities to affiliated companies 2.9 3.8 4.0 4.5 1.8 2.2 0.8 0.9 4.1 5.4
Provisions 5.3 5.0 5.5 5.3 5.3 5.0 5.3 5.1 5.4 4.9of which: Provisions for pensions 0.6 0.6 1.0 1.0 1.3 1.2 0.7 0.7 0.5 0.5
Other ratios Percentage of salesAnnual result before taxes on income 2.4 2.1 4.2 4.3 2.8 3.0 3.2 2.9 2.0 1.6Annual result and depreciation 3.5 3.5 6.2 6.3 4.1 4.3 4.1 3.8 3.2 3.3Trade receivables 5.0 5.4 6.1 6.2 5.7 5.7 5.4 5.4 4.8 5.3
Percentage of the balance sheet totalSales 280.5 266.6 202.0 199.0 223.9 224.1 256.7 249.8 304.0 282.1Annual result and interest paid 6.4 5.4 8.1 8.0 5.9 6.3 7.4 6.6 6.0 4.7
Percentage of liabilities and provisions less cashAnnual result and depreciation 15.8 14.3 24.7 26.1 16.7 17.3 17.9 16.4 14.7 13.0
Percentage of fixed assetsLong-term equity and liabilities 137.7 132.0 141.8 154.9 159.3 160.0 156.6 154.9 127.1 120.5
Percentage of short-term liabilitiesCash resources and short-term receivables 73.8 73.5 82.5 89.0 72.5 71.7 67.1 66.1 77.4 77.1Cash resources, short-term receivables and inventories 136.0 132.4 145.7 157.0 148.8 149.2 141.7 140.6 130.7 125.6
Percentage of cost of materialsTrade payables 7.1 6.9 11.8 10.4 8.7 8.1 8.0 7.6 6.5 6.5
Memo item:Balance sheet total in € billion 12.21 13.73 0.14 0.15 1.26 1.32 3.62 3.84 7.18 8.41Sales in € billion 34.24 36.60 0.28 0.30 2.83 2.97 9.30 9.60 21.83 23.73Number of enterprises 1 385 1 385 295 295 546 546 396 396 148 148

Deutsche BundesbankFinancial statement statistics (ratios - provisional data)
May 2021193
III. East German enterprises by economic sector
cont'd: 4. Wholesale trade, except of motor vehicles and motorcycles
cont'd: All legal formsEnterprises with sales of ... € million
Total Less than 2 2 but less than 10 10 but less than 50 50 and moreQuartile Cylindered sample 2018/2019value 2018 2019 2018 2019 2018 2019 2018 2019 2018 2019Of the enterprises captured …
Ratios ... % had a ratio of less than …Percentage of gross revenue
Cost of materials 25 59.2 58.1 38.8 37.6 58.1 57.1 72.2 72.1 73.1 73.1 50 73.6 73.6 55.9 55.1 72.3 72.1 77.7 77.4 79.8 79.8 75 80.6 80.6 70.7 70.8 79.3 79.7 82.8 82.5 88.3 88.3
Personnel expenses 25 8.5 8.5 11.6 11.6 9.7 9.8 7.7 7.9 3.3 3.4 50 12.6 12.9 19.6 21.3 13.7 14.0 10.4 10.7 8.9 8.9 75 19.2 19.8 31.2 30.9 21.0 21.3 13.6 14.0 12.5 13.1
Depreciation 25 0.7 0.7 0.6 0.6 0.8 0.7 0.6 0.7 0.5 0.4 50 1.3 1.3 1.5 1.5 1.5 1.4 1.2 1.2 1.1 1.1 75 2.3 2.3 3.4 3.1 2.5 2.5 2.0 2.0 1.7 1.7
Annual result 25 0.4 0.4 0.2 0.6 0.5 0.5 0.5 0.4 0.2 0.2 50 1.6 1.6 2.1 2.9 1.8 1.8 1.5 1.5 1.1 1.0 75 4.0 4.0 6.8 7.0 4.1 3.9 3.6 3.6 2.3 2.2
Percentage of the balance sheet totalTangible fixed assets 25 7.6 7.0 4.2 3.5 8.6 7.9 9.4 8.8 7.6 6.7
50 18.6 18.5 15.8 14.5 19.1 18.4 19.9 19.4 20.1 20.1 75 35.0 35.1 37.3 40.1 34.8 35.1 34.4 33.7 35.7 36.4
Inventories 25 14.9 14.6 6.6 6.3 14.9 15.2 24.0 22.4 17.4 15.1 50 33.1 33.0 21.4 22.3 34.9 34.3 37.0 37.3 34.6 34.0 75 50.7 50.6 45.1 43.7 53.2 52.8 50.8 51.5 45.5 47.7
Equity 25 12.1 13.6 8.3 12.5 14.3 15.6 12.1 12.2 11.4 12.8 50 29.5 30.4 32.8 36.0 30.2 30.9 28.2 28.5 26.2 29.1 75 51.6 53.4 61.4 61.6 51.0 53.4 50.9 51.3 41.2 42.1
Short-term liabilities 25 25.3 24.0 19.8 17.9 25.4 22.2 28.3 29.2 39.4 41.2 50 47.4 46.4 36.0 35.1 44.9 42.7 53.8 52.7 57.4 57.0 75 69.8 69.3 63.6 60.2 67.4 67.5 73.1 75.0 77.0 74.4
Liabilities to banks 25 0.0 0.0 0.0 0.0 2.2 2.0 0.9 0.8 0.0 0.0 50 15.3 15.0 8.9 8.9 17.1 16.6 19.4 19.3 10.7 10.8 75 39.2 39.4 29.5 29.5 41.0 40.3 42.4 45.2 37.3 37.2
Percentage of salesAnnual result before taxes on income 25 0.6 0.6 0.3 0.7 0.7 0.7 0.7 0.6 0.3 0.3
50 2.2 2.2 2.8 3.3 2.4 2.3 2.0 2.1 1.5 1.2 75 5.0 5.1 8.1 7.9 5.0 5.3 4.7 4.4 3.0 3.0
Annual result and depreciation 25 2.0 1.9 1.9 2.6 2.1 2.0 2.0 2.0 0.9 1.0 50 3.9 3.9 4.9 5.5 4.1 4.1 3.7 3.5 2.7 2.4 75 7.3 7.3 10.4 10.2 7.5 7.5 6.0 6.1 4.7 4.5
Trade receivables 25 2.1 2.1 1.6 1.3 2.2 2.2 2.5 2.5 1.3 1.5 50 4.6 4.4 4.7 4.3 4.8 4.6 4.4 4.5 4.4 4.1 75 7.4 7.6 8.1 8.5 7.7 7.6 6.9 6.9 6.5 6.3
Percentage of the balance sheet totalAnnual result and interest paid 25 2.5 2.6 1.4 2.7 2.8 2.7 2.7 2.5 1.7 1.8
50 5.7 5.7 6.5 7.8 6.1 5.9 5.0 4.9 4.5 4.4 75 12.1 12.4 19.6 20.1 11.9 11.9 10.7 11.0 9.1 8.3
Percentage of liabilities and provisions less cashAnnual result and depreciation 25 5.2 5.7 - 5.0 0.0 6.2 6.6 6.4 6.2 4.9 4.8
50 15.5 15.2 15.4 14.1 16.0 16.9 16.1 15.5 13.1 12.6 75 35.9 37.8 47.0 45.5 36.2 39.0 32.9 32.8 30.2 32.5
Percentage of fixed assetsLong-term equity and liabilities 25 95.3 93.9 87.0 95.5 107.0 100.1 83.5 82.7 82.6 84.1
50 169.8 173.1 198.4 206.2 189.8 188.1 155.4 154.2 126.3 121.2 75 365.1 354.2 550.0 779.0 380.7 392.9 291.2 296.9 221.0 219.6
Percentage of short-term liabilitiesCash resources and short-term receivables 25 37.5 37.6 41.6 48.0 37.6 37.4 37.0 34.8 35.2 37.2
50 74.6 76.9 98.3 106.0 74.0 76.4 65.9 65.3 71.5 77.6 75 150.0 156.2 224.0 237.9 170.8 162.4 121.6 123.6 112.6 107.8
Percentage of cost of materialsTrade payables 25 2.7 2.5 3.1 2.7 2.9 2.8 2.5 2.2 2.3 1.9
50 6.4 6.1 7.8 7.3 7.1 6.4 5.3 5.5 5.6 5.1 75 12.1 11.4 16.8 13.2 12.2 11.2 10.7 10.9 11.2 9.9
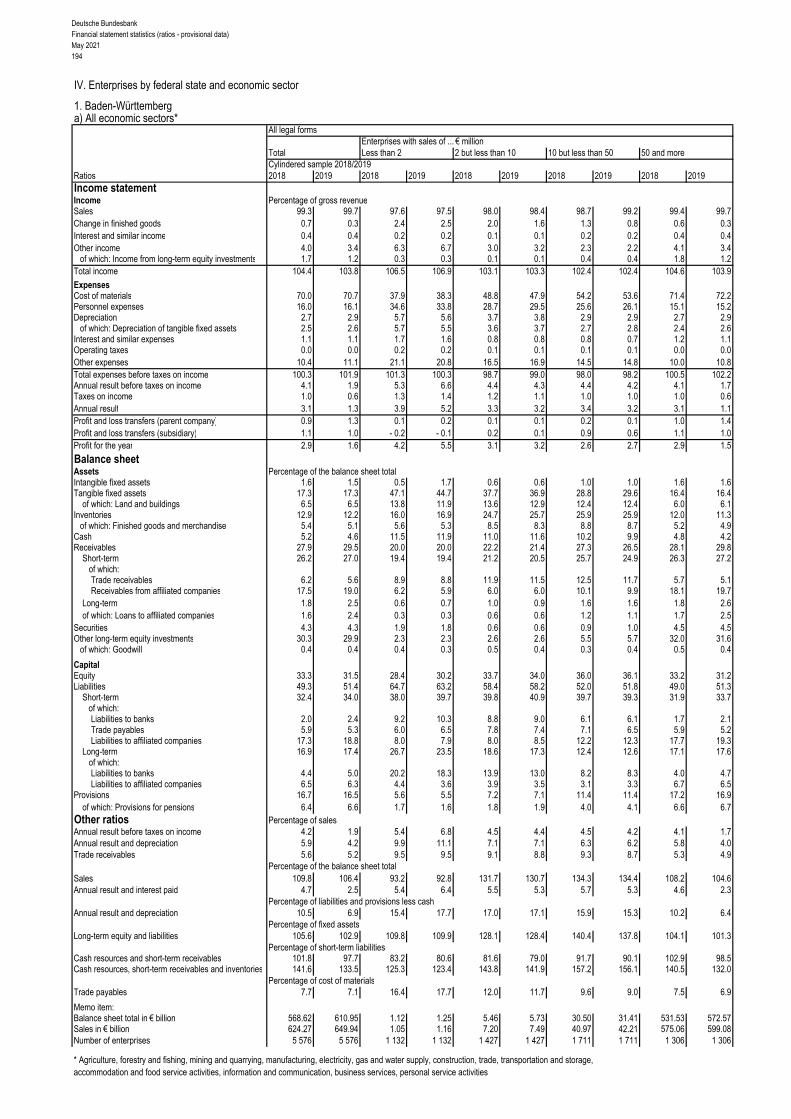
Deutsche BundesbankFinancial statement statistics (ratios - provisional data)May 2021194
IV. Enterprises by federal state and economic sector
1. Baden-Württemberga) All economic sectors*
All legal formsEnterprises with sales of ... € million
Total Less than 2 2 but less than 10 10 but less than 50 50 and moreCylindered sample 2018/2019
Ratios 2018 2019 2018 2019 2018 2019 2018 2019 2018 2019Income statementIncome Percentage of gross revenueSales 99.3 99.7 97.6 97.5 98.0 98.4 98.7 99.2 99.4 99.7Change in finished goods 0.7 0.3 2.4 2.5 2.0 1.6 1.3 0.8 0.6 0.3Interest and similar income 0.4 0.4 0.2 0.2 0.1 0.1 0.2 0.2 0.4 0.4Other income 4.0 3.4 6.3 6.7 3.0 3.2 2.3 2.2 4.1 3.4
of which: Income from long-term equity investments 1.7 1.2 0.3 0.3 0.1 0.1 0.4 0.4 1.8 1.2Total income 104.4 103.8 106.5 106.9 103.1 103.3 102.4 102.4 104.6 103.9
ExpensesCost of materials 70.0 70.7 37.9 38.3 48.8 47.9 54.2 53.6 71.4 72.2Personnel expenses 16.0 16.1 34.6 33.8 28.7 29.5 25.6 26.1 15.1 15.2Depreciation 2.7 2.9 5.7 5.6 3.7 3.8 2.9 2.9 2.7 2.9
of which: Depreciation of tangible fixed assets 2.5 2.6 5.7 5.5 3.6 3.7 2.7 2.8 2.4 2.6Interest and similar expenses 1.1 1.1 1.7 1.6 0.8 0.8 0.8 0.7 1.2 1.1Operating taxes 0.0 0.0 0.2 0.2 0.1 0.1 0.1 0.1 0.0 0.0Other expenses 10.4 11.1 21.1 20.8 16.5 16.9 14.5 14.8 10.0 10.8Total expenses before taxes on income 100.3 101.9 101.3 100.3 98.7 99.0 98.0 98.2 100.5 102.2Annual result before taxes on income 4.1 1.9 5.3 6.6 4.4 4.3 4.4 4.2 4.1 1.7Taxes on income 1.0 0.6 1.3 1.4 1.2 1.1 1.0 1.0 1.0 0.6Annual result 3.1 1.3 3.9 5.2 3.3 3.2 3.4 3.2 3.1 1.1Profit and loss transfers (parent company) 0.9 1.3 0.1 0.2 0.1 0.1 0.2 0.1 1.0 1.4Profit and loss transfers (subsidiary) 1.1 1.0 - 0.2 - 0.1 0.2 0.1 0.9 0.6 1.1 1.0Profit for the year 2.9 1.6 4.2 5.5 3.1 3.2 2.6 2.7 2.9 1.5
Balance sheetAssets Percentage of the balance sheet totalIntangible fixed assets 1.6 1.5 0.5 1.7 0.6 0.6 1.0 1.0 1.6 1.6Tangible fixed assets 17.3 17.3 47.1 44.7 37.7 36.9 28.8 29.6 16.4 16.4
of which: Land and buildings 6.5 6.5 13.8 11.9 13.6 12.9 12.4 12.4 6.0 6.1Inventories 12.9 12.2 16.0 16.9 24.7 25.7 25.9 25.9 12.0 11.3
of which: Finished goods and merchandise 5.4 5.1 5.6 5.3 8.5 8.3 8.8 8.7 5.2 4.9Cash 5.2 4.6 11.5 11.9 11.0 11.6 10.2 9.9 4.8 4.2Receivables 27.9 29.5 20.0 20.0 22.2 21.4 27.3 26.5 28.1 29.8
Short-term 26.2 27.0 19.4 19.4 21.2 20.5 25.7 24.9 26.3 27.2 of which:
Trade receivables 6.2 5.6 8.9 8.8 11.9 11.5 12.5 11.7 5.7 5.1Receivables from affiliated companies 17.5 19.0 6.2 5.9 6.0 6.0 10.1 9.9 18.1 19.7
Long-term 1.8 2.5 0.6 0.7 1.0 0.9 1.6 1.6 1.8 2.6of which: Loans to affiliated companies 1.6 2.4 0.3 0.3 0.6 0.6 1.2 1.1 1.7 2.5
Securities 4.3 4.3 1.9 1.8 0.6 0.6 0.9 1.0 4.5 4.5Other long-term equity investments 30.3 29.9 2.3 2.3 2.6 2.6 5.5 5.7 32.0 31.6
of which: Goodwill 0.4 0.4 0.4 0.3 0.5 0.4 0.3 0.4 0.5 0.4
CapitalEquity 33.3 31.5 28.4 30.2 33.7 34.0 36.0 36.1 33.2 31.2Liabilities 49.3 51.4 64.7 63.2 58.4 58.2 52.0 51.8 49.0 51.3
Short-term 32.4 34.0 38.0 39.7 39.8 40.9 39.7 39.3 31.9 33.7of which:Liabilities to banks 2.0 2.4 9.2 10.3 8.8 9.0 6.1 6.1 1.7 2.1Trade payables 5.9 5.3 6.0 6.5 7.8 7.4 7.1 6.5 5.9 5.2Liabilities to affiliated companies 17.3 18.8 8.0 7.9 8.0 8.5 12.2 12.3 17.7 19.3
Long-term 16.9 17.4 26.7 23.5 18.6 17.3 12.4 12.6 17.1 17.6 of which:
Liabilities to banks 4.4 5.0 20.2 18.3 13.9 13.0 8.2 8.3 4.0 4.7Liabilities to affiliated companies 6.5 6.3 4.4 3.6 3.9 3.5 3.1 3.3 6.7 6.5
Provisions 16.7 16.5 5.6 5.5 7.2 7.1 11.4 11.4 17.2 16.9of which: Provisions for pensions 6.4 6.6 1.7 1.6 1.8 1.9 4.0 4.1 6.6 6.7
Other ratios Percentage of salesAnnual result before taxes on income 4.2 1.9 5.4 6.8 4.5 4.4 4.5 4.2 4.1 1.7Annual result and depreciation 5.9 4.2 9.9 11.1 7.1 7.1 6.3 6.2 5.8 4.0Trade receivables 5.6 5.2 9.5 9.5 9.1 8.8 9.3 8.7 5.3 4.9
Percentage of the balance sheet totalSales 109.8 106.4 93.2 92.8 131.7 130.7 134.3 134.4 108.2 104.6Annual result and interest paid 4.7 2.5 5.4 6.4 5.5 5.3 5.7 5.3 4.6 2.3
Percentage of liabilities and provisions less cashAnnual result and depreciation 10.5 6.9 15.4 17.7 17.0 17.1 15.9 15.3 10.2 6.4
Percentage of fixed assetsLong-term equity and liabilities 105.6 102.9 109.8 109.9 128.1 128.4 140.4 137.8 104.1 101.3
Percentage of short-term liabilitiesCash resources and short-term receivables 101.8 97.7 83.2 80.6 81.6 79.0 91.7 90.1 102.9 98.5Cash resources, short-term receivables and inventories 141.6 133.5 125.3 123.4 143.8 141.9 157.2 156.1 140.5 132.0
Percentage of cost of materialsTrade payables 7.7 7.1 16.4 17.7 12.0 11.7 9.6 9.0 7.5 6.9
Memo item:Balance sheet total in € billion 568.62 610.95 1.12 1.25 5.46 5.73 30.50 31.41 531.53 572.57Sales in € billion 624.27 649.94 1.05 1.16 7.20 7.49 40.97 42.21 575.06 599.08Number of enterprises 5 576 5 576 1 132 1 132 1 427 1 427 1 711 1 711 1 306 1 306
* Agriculture, forestry and fishing, mining and quarrying, manufacturing, electricity, gas and water supply, construction, trade, transportation and storage,accommodation and food service activities, information and communication, business services, personal service activities

Deutsche BundesbankFinancial statement statistics (ratios - provisional data)
May 2021195
IV. Enterprises by federal state and economic sector
cont'd: 1. Baden-Württemberga) All economic sectors*
cont'd: All legal formsEnterprises with sales of ... € million
Total Less than 2 2 but less than 10 10 but less than 50 50 and moreQuartile Cylindered sample 2018/2019value 2018 2019 2018 2019 2018 2019 2018 2019 2018 2019Of the enterprises captured …
Ratios ... % had a ratio of less than …Percentage of gross revenue
Cost of materials 25 31.9 31.0 9.4 9.3 29.3 27.7 37.7 36.7 45.4 44.9 50 51.3 50.6 34.3 33.9 48.3 47.4 55.3 54.0 60.6 60.4 75 69.6 69.4 53.9 53.5 67.0 65.4 72.8 72.3 77.3 77.0
Personnel expenses 25 12.5 12.8 15.8 14.7 14.7 15.2 12.4 12.7 9.7 9.9 50 24.4 24.7 31.6 31.0 27.3 28.3 22.9 23.4 18.9 19.6 75 37.7 38.6 45.3 45.0 40.3 41.0 35.2 36.0 29.9 30.9
Depreciation 25 0.8 0.8 0.9 0.9 0.7 0.7 0.7 0.7 0.8 0.8 50 1.8 1.8 2.2 2.2 1.8 1.8 1.7 1.7 1.8 1.8 75 3.9 3.9 4.8 4.7 4.1 4.1 3.5 3.7 3.5 3.7
Annual result 25 0.6 0.6 0.3 1.3 0.6 0.7 0.7 0.5 0.6 0.4 50 2.8 2.7 3.6 4.7 2.5 2.7 2.7 2.5 2.6 2.2 75 6.4 6.3 10.2 10.7 6.0 5.9 5.6 5.5 5.8 5.1
Percentage of the balance sheet totalTangible fixed assets 25 4.6 4.5 3.5 3.6 4.0 4.0 4.6 4.6 6.3 6.4
50 14.9 14.7 13.5 12.8 14.0 13.7 14.6 14.8 17.3 17.7 75 36.3 37.2 41.3 39.9 38.5 39.0 34.0 35.2 34.9 36.7
Inventories 25 2.7 2.5 0.0 0.0 2.2 2.0 5.0 4.6 8.0 7.7 50 21.1 20.7 8.8 7.7 22.0 21.0 26.7 26.2 21.2 21.2 75 43.4 43.9 39.5 40.4 48.5 48.0 46.0 46.3 37.8 37.0
Equity 25 10.4 12.1 2.2 5.7 9.2 10.2 12.9 14.0 16.6 17.2 50 28.9 30.0 21.5 25.8 25.7 27.8 31.2 31.2 32.0 33.1 75 50.1 52.0 47.6 51.7 49.8 51.6 50.8 52.0 50.8 52.2
Short-term liabilities 25 20.7 19.1 19.3 17.0 23.3 21.4 20.1 19.3 20.4 19.0 50 41.3 40.1 45.0 41.5 44.5 43.5 41.4 40.4 36.6 36.0 75 66.7 64.4 78.5 71.4 69.7 67.7 65.6 64.7 57.9 57.0
Liabilities to banks 25 0.0 0.0 0.0 0.0 0.0 0.0 0.0 0.0 0.0 0.0 50 5.5 4.8 8.8 8.0 8.6 7.8 4.5 3.7 2.0 1.7 75 27.1 26.6 38.1 35.8 31.5 30.8 24.2 24.1 19.4 19.4
Percentage of salesAnnual result before taxes on income 25 0.8 0.9 0.4 1.7 0.8 1.1 1.0 0.7 0.9 0.6
50 3.6 3.5 4.6 5.8 3.5 3.5 3.5 3.2 3.4 2.7 75 8.1 8.0 12.3 13.2 7.9 7.7 7.3 7.0 7.1 6.2
Annual result and depreciation 25 2.6 2.7 2.5 3.9 2.7 2.9 2.6 2.4 2.5 2.1 50 6.2 6.2 8.0 9.3 6.4 6.2 5.8 5.6 5.7 5.1 75 12.0 11.8 19.2 19.8 12.1 11.5 10.6 10.6 10.6 9.8
Trade receivables 25 3.6 3.3 2.1 2.0 3.5 3.4 4.4 3.8 3.9 3.7 50 7.4 6.9 6.3 5.9 7.5 6.9 7.9 7.3 7.4 6.9 75 12.2 11.8 12.1 11.9 12.6 12.0 12.6 11.8 11.7 11.4
Percentage of the balance sheet totalAnnual result and interest paid 25 2.3 2.3 1.9 3.2 2.2 2.5 2.6 2.1 2.4 1.9
50 6.2 6.0 7.4 9.1 6.2 6.0 5.8 5.5 6.0 5.0 75 12.3 12.4 17.7 20.8 12.3 11.9 11.4 10.8 11.0 9.7
Percentage of liabilities and provisions less cashAnnual result and depreciation 25 5.3 5.1 1.2 4.3 4.4 3.9 5.9 5.8 7.3 5.8
50 16.4 16.2 15.4 18.6 16.0 15.4 17.1 16.3 16.7 15.3 75 37.4 36.3 46.3 49.4 38.6 35.9 36.3 33.3 32.8 31.4
Percentage of fixed assetsLong-term equity and liabilities 25 93.4 94.7 66.7 81.0 93.3 94.8 98.6 98.4 99.7 99.2
50 167.4 171.7 147.8 164.7 191.4 201.7 177.3 176.8 154.1 154.3 75 394.9 418.3 427.3 492.5 501.7 529.0 406.4 399.2 309.6 305.1
Percentage of short-term liabilitiesCash resources and short-term receivables 25 49.9 50.7 38.0 42.2 44.6 44.6 53.0 51.8 61.6 60.7
50 99.6 100.0 101.6 105.8 92.0 93.9 97.7 94.5 104.9 107.6 75 199.8 210.8 235.7 259.9 196.0 209.4 189.1 198.9 185.8 194.6
Percentage of cost of materialsTrade payables 25 4.5 4.1 4.7 4.3 4.7 4.6 4.4 4.0 4.3 3.9
50 8.6 8.1 11.8 10.6 10.0 9.2 7.9 7.5 7.4 6.9 75 16.0 15.4 27.3 27.1 18.6 18.6 13.9 13.3 11.7 11.8
* Agriculture, forestry and fishing, mining and quarrying, manufacturing, electricity, gas and water supply, construction, trade, transportation and storage,accommodation and food service activities, information and communication, business services, personal service activities

Deutsche BundesbankFinancial statement statistics (ratios - provisional data)May 2021196
IV. Enterprises by federal state and economic sector
cont'd: 1. Baden-Württemberga) All economic sectors*
CorporationsEnterprises with sales of ... € million
Total Less than 2 2 but less than 10 10 but less than 50 50 and moreCylindered sample 2018/2019
Ratios 2018 2019 2018 2019 2018 2019 2018 2019 2018 2019Income statementIncome Percentage of gross revenueSales 99.3 99.7 97.5 97.1 97.8 98.4 98.8 99.2 99.3 99.8Change in finished goods 0.7 0.3 2.5 2.9 2.2 1.6 1.2 0.8 0.7 0.2Interest and similar income 0.5 0.5 0.3 0.3 0.1 0.1 0.2 0.2 0.5 0.5Other income 4.6 3.8 7.4 7.6 3.2 3.3 2.4 2.3 4.7 3.9
of which: Income from long-term equity investments 1.9 1.3 0.3 0.2 0.1 0.1 0.4 0.4 2.1 1.4Total income 105.0 104.3 107.7 107.9 103.3 103.4 102.6 102.5 105.2 104.4
ExpensesCost of materials 69.7 70.5 38.4 39.2 49.2 48.3 53.7 53.2 71.1 72.0Personnel expenses 16.5 16.5 38.2 36.8 29.6 30.5 26.0 26.5 15.7 15.7Depreciation 2.9 3.1 5.0 4.8 3.4 3.5 2.9 3.0 2.9 3.1
of which: Depreciation of tangible fixed assets 2.7 2.8 4.9 4.8 3.3 3.4 2.7 2.8 2.6 2.8Interest and similar expenses 1.3 1.2 1.5 1.4 0.7 0.7 0.7 0.7 1.3 1.2Operating taxes 0.0 0.0 0.2 0.2 0.1 0.1 0.1 0.1 0.0 0.0Other expenses 10.3 11.2 21.3 20.9 16.4 16.7 14.7 15.1 9.9 10.9Total expenses before taxes on income 100.8 102.6 104.6 103.2 99.3 99.7 98.2 98.4 101.0 102.9Annual result before taxes on income 4.2 1.7 3.2 4.7 4.1 3.8 4.4 4.1 4.2 1.5Taxes on income 1.2 0.7 1.3 1.4 1.2 1.1 1.1 1.1 1.2 0.7Annual result 3.1 1.0 1.8 3.2 2.8 2.6 3.3 3.0 3.1 0.9Profit and loss transfers (parent company) 1.1 1.5 0.2 0.2 0.1 0.1 0.2 0.1 1.2 1.6Profit and loss transfers (subsidiary) 1.4 1.2 - 0.2 - 0.2 0.3 0.1 1.2 0.8 1.4 1.3Profit for the year 2.8 1.3 2.3 3.6 2.6 2.6 2.3 2.4 2.9 1.2
Balance sheetAssets Percentage of the balance sheet totalIntangible fixed assets 1.7 1.6 0.6 0.6 0.6 0.6 1.1 1.1 1.7 1.7Tangible fixed assets 16.0 16.0 41.7 39.4 33.4 33.0 28.6 29.6 15.2 15.1
of which: Land and buildings 5.5 5.5 14.2 11.6 13.9 13.1 12.5 12.6 5.0 5.1Inventories 11.9 11.1 16.8 18.1 26.1 27.0 24.9 24.8 11.1 10.3
of which: Finished goods and merchandise 5.0 4.7 5.7 5.5 9.0 8.7 8.4 8.2 4.8 4.5Cash 5.1 4.4 12.6 13.4 11.9 12.4 10.3 9.9 4.8 4.1Receivables 27.9 29.7 22.2 22.4 23.8 22.8 28.0 27.1 28.0 29.9
Short-term 26.2 27.5 21.4 21.6 22.8 21.9 26.2 25.4 26.3 27.6 of which:
Trade receivables 5.8 5.2 9.5 9.8 12.6 12.1 12.4 11.7 5.4 4.9Receivables from affiliated companies 18.3 20.0 7.1 6.8 6.7 6.6 10.8 10.3 18.8 20.6
Long-term 1.7 2.2 0.8 0.9 1.0 0.9 1.7 1.8 1.7 2.2of which: Loans to affiliated companies 1.5 2.1 0.4 0.4 0.7 0.6 1.3 1.3 1.6 2.1
Securities 4.7 4.7 2.6 2.5 0.7 0.7 1.0 1.1 5.0 4.9Other long-term equity investments 32.1 31.7 2.7 2.7 2.9 2.9 5.8 5.9 33.8 33.3
of which: Goodwill 0.5 0.4 0.4 0.4 0.4 0.4 0.4 0.5 0.5 0.4
CapitalEquity 33.7 31.7 32.7 34.7 36.8 37.1 39.0 38.8 33.4 31.3Liabilities 48.1 50.5 59.2 57.7 54.4 54.3 48.6 48.6 48.0 50.5
Short-term 31.2 33.1 36.5 38.3 38.4 39.2 36.9 36.6 30.9 32.8of which:Liabilities to banks 1.8 2.2 6.7 8.3 7.6 7.9 5.7 5.8 1.5 2.0Trade payables 5.3 4.6 6.2 6.1 7.9 7.4 7.0 6.6 5.2 4.5Liabilities to affiliated companies 17.6 19.3 8.0 7.9 7.0 7.1 10.5 10.5 18.1 19.9
Long-term 16.9 17.4 22.7 19.3 16.0 15.1 11.8 12.0 17.1 17.7 of which:
Liabilities to banks 3.3 4.0 16.1 13.5 11.2 10.6 7.8 8.0 3.0 3.7Liabilities to affiliated companies 6.8 6.6 4.0 3.7 3.9 3.7 2.8 3.0 7.0 6.8
Provisions 17.4 17.2 6.7 6.5 7.9 7.7 11.8 11.9 17.8 17.6of which: Provisions for pensions 6.6 6.8 2.3 2.2 2.2 2.2 4.2 4.3 6.8 6.9
Other ratios Percentage of salesAnnual result before taxes on income 4.3 1.7 3.2 4.8 4.1 3.8 4.5 4.1 4.3 1.5Annual result and depreciation 6.1 4.1 7.0 8.3 6.3 6.2 6.3 6.0 6.1 3.9Trade receivables 5.8 5.4 9.9 10.1 9.2 9.1 9.4 8.9 5.5 5.1
Percentage of the balance sheet totalSales 100.7 97.7 96.3 97.5 136.0 133.8 131.3 131.7 98.8 95.7Annual result and interest paid 4.4 2.2 3.3 4.6 4.9 4.4 5.4 5.0 4.4 2.0
Percentage of liabilities and provisions less cashAnnual result and depreciation 10.0 6.3 12.3 15.6 16.8 16.4 16.3 15.5 9.7 5.8
Percentage of fixed assetsLong-term equity and liabilities 105.2 102.8 121.3 124.1 142.9 143.4 145.8 142.1 103.5 101.2
Percentage of short-term liabilitiesCash resources and short-term receivables 106.2 102.2 95.9 93.8 90.9 88.1 100.5 98.2 106.8 102.6Cash resources, short-term receivables and inventories 144.2 135.9 141.9 141.0 158.7 156.9 168.1 166.1 142.6 134.0
Percentage of cost of materialsTrade payables 7.5 6.7 16.2 15.6 11.6 11.3 9.8 9.3 7.3 6.5
Memo item:Balance sheet total in € billion 502.19 541.04 0.81 0.90 4.20 4.44 24.46 25.25 472.72 510.45Sales in € billion 505.69 528.69 0.78 0.87 5.71 5.94 32.12 33.25 467.07 488.63Number of enterprises 4 317 4 317 833 833 1 125 1 125 1 342 1 342 1 017 1 017
* Agriculture, forestry and fishing, mining and quarrying, manufacturing, electricity, gas and water supply, construction, trade, transportation and storage,accommodation and food service activities, information and communication, business services, personal service activities

Deutsche BundesbankFinancial statement statistics (ratios - provisional data)
May 2021197
IV. Enterprises by federal state and economic sector
cont'd: 1. Baden-Württemberga) All economic sectors*
cont'd: CorporationsEnterprises with sales of ... € million
Total Less than 2 2 but less than 10 10 but less than 50 50 and moreQuartile Cylindered sample 2018/2019value 2018 2019 2018 2019 2018 2019 2018 2019 2018 2019Of the enterprises captured …
Ratios ... % had a ratio of less than …Percentage of gross revenue
Cost of materials 25 31.8 30.9 11.1 11.6 30.7 28.2 36.5 35.8 44.8 44.4 50 51.5 51.1 35.1 34.6 49.2 47.9 55.2 54.0 61.0 60.4 75 69.9 69.7 54.5 54.7 67.3 65.6 72.8 72.5 77.2 77.3
Personnel expenses 25 12.7 13.1 19.5 18.2 15.2 15.7 12.0 12.2 9.7 9.7 50 24.9 25.3 35.9 34.6 28.1 28.9 23.0 23.6 18.8 19.5 75 39.3 40.1 48.6 48.7 41.1 41.9 35.6 36.7 30.3 31.6
Depreciation 25 0.7 0.7 0.8 0.8 0.6 0.7 0.7 0.7 0.8 0.8 50 1.7 1.7 1.9 1.9 1.6 1.6 1.6 1.6 1.8 1.9 75 3.7 3.8 4.2 3.9 3.8 3.8 3.5 3.7 3.6 3.8
Annual result 25 0.4 0.5 0.0 0.9 0.4 0.5 0.7 0.5 0.5 0.3 50 2.4 2.4 2.6 3.2 2.3 2.3 2.5 2.4 2.4 2.1 75 5.7 5.6 7.2 7.8 5.5 5.0 5.3 5.3 5.6 5.0
Percentage of the balance sheet totalTangible fixed assets 25 3.8 3.9 2.8 3.0 3.3 3.4 4.0 4.1 5.7 5.6
50 13.0 12.9 11.5 10.7 11.5 11.4 13.0 12.9 16.1 16.4 75 32.0 33.8 29.1 29.9 31.9 33.8 31.6 33.3 34.1 36.6
Inventories 25 2.3 2.1 0.0 0.0 2.4 2.1 3.7 3.4 6.7 5.4 50 20.5 19.7 10.0 8.2 22.3 21.2 25.6 24.9 19.6 18.8 75 43.7 44.1 40.9 42.0 48.9 48.5 46.2 46.7 36.3 34.6
Equity 25 13.6 15.7 5.2 10.3 12.6 14.2 15.8 17.4 19.3 20.2 50 32.8 34.5 25.9 30.8 29.9 32.6 35.7 35.4 37.0 37.3 75 54.1 56.2 51.3 55.1 54.5 55.3 54.4 56.7 54.6 57.4
Short-term liabilities 25 18.9 16.8 19.2 15.8 20.9 18.5 18.1 17.0 18.2 16.5 50 37.9 36.7 43.0 39.6 42.2 40.3 37.1 36.2 32.7 31.3 75 63.1 60.3 75.2 67.1 66.9 64.3 61.5 60.7 53.3 52.1
Liabilities to banks 25 0.0 0.0 0.0 0.0 0.0 0.0 0.0 0.0 0.0 0.0 50 3.4 3.0 4.1 3.5 6.5 5.7 3.3 2.9 1.0 0.6 75 23.5 23.1 28.7 26.2 28.5 27.0 21.9 21.9 17.8 17.1
Percentage of salesAnnual result before taxes on income 25 0.7 0.7 0.1 1.1 0.6 0.9 0.9 0.7 0.7 0.5
50 3.2 3.2 3.2 4.2 3.1 3.2 3.3 3.0 3.3 2.8 75 7.4 7.2 9.3 9.5 7.3 7.0 7.2 6.9 7.2 6.2
Annual result and depreciation 25 2.4 2.4 1.9 3.1 2.4 2.6 2.5 2.4 2.4 2.0 50 5.7 5.7 5.8 7.1 5.7 5.8 5.6 5.4 5.7 5.1 75 11.2 11.1 13.4 13.9 11.1 10.6 10.6 10.4 10.7 10.1
Trade receivables 25 3.8 3.5 2.4 2.3 3.8 3.6 4.3 3.7 3.9 3.7 50 7.6 7.0 6.8 6.4 7.7 7.1 7.8 7.3 7.6 7.0 75 12.5 12.2 12.8 12.6 12.6 12.3 12.8 12.3 12.1 11.7
Percentage of the balance sheet totalAnnual result and interest paid 25 1.9 2.0 1.1 2.4 1.9 2.2 2.3 2.0 2.0 1.8
50 5.5 5.4 5.6 7.3 5.3 5.3 5.4 5.2 5.6 4.7 75 11.1 11.0 13.9 15.9 11.0 10.5 10.5 10.2 10.8 9.5
Percentage of liabilities and provisions less cashAnnual result and depreciation 25 4.0 4.0 - 3.6 1.7 2.9 2.4 5.6 5.3 6.6 5.3
50 15.1 15.0 11.1 14.8 14.2 12.8 16.6 16.1 16.5 15.6 75 37.7 36.4 39.3 42.4 38.0 33.5 37.9 35.4 35.6 34.8
Percentage of fixed assetsLong-term equity and liabilities 25 103.3 104.8 85.3 97.7 104.7 106.5 106.3 105.8 105.3 104.2
50 194.5 203.0 190.5 216.6 227.6 245.6 204.1 202.9 167.3 169.8 75 476.9 489.8 570.0 634.1 600.0 639.3 468.1 451.9 332.1 342.6
Percentage of short-term liabilitiesCash resources and short-term receivables 25 55.9 56.7 45.7 51.7 49.3 48.3 58.0 57.1 69.0 71.9
50 112.1 114.4 114.8 120.7 108.0 107.5 108.8 106.6 119.7 124.1 75 227.7 246.8 261.1 334.8 234.5 246.1 215.9 240.8 215.4 221.2
Percentage of cost of materialsTrade payables 25 4.4 4.0 4.8 4.3 4.5 4.6 4.4 3.9 4.2 3.7
50 8.6 8.1 11.6 10.8 9.5 9.1 8.0 7.7 7.5 7.0 75 16.0 15.5 27.2 29.0 17.5 18.1 14.6 13.8 12.5 12.3
* Agriculture, forestry and fishing, mining and quarrying, manufacturing, electricity, gas and water supply, construction, trade, transportation and storage,accommodation and food service activities, information and communication, business services, personal service activities

Deutsche BundesbankFinancial statement statistics (ratios - provisional data)May 2021198
IV. Enterprises by federal state and economic sector
cont'd: 1. Baden-Württemberga) All economic sectors*
Non-corporationsEnterprises with sales of ... € million
Total Less than 2 2 but less than 10 10 but less than 50 50 and moreCylindered sample 2018/2019
Ratios 2018 2019 2018 2019 2018 2019 2018 2019 2018 2019Income statementIncome Percentage of gross revenueSales 99.4 99.6 97.8 98.6 98.9 98.5 98.4 99.3 99.5 99.6Change in finished goods 0.6 0.4 2.2 1.4 1.1 1.5 1.6 0.7 0.5 0.4Interest and similar income 0.1 0.1 0.1 0.1 0.1 0.1 0.2 0.2 0.1 0.1Other income 1.7 1.4 3.0 3.7 2.1 2.6 1.7 1.7 1.7 1.3
of which: Income from long-term equity investments 0.4 0.4 0.4 0.4 0.2 0.4 0.3 0.4 0.4 0.4Total income 101.8 101.5 103.0 103.7 102.2 102.6 101.9 101.9 101.8 101.5
ExpensesCost of materials 71.3 71.2 36.5 35.5 47.2 46.6 55.8 55.3 72.9 73.0Personnel expenses 13.9 14.2 24.1 24.3 25.5 25.6 24.3 24.6 12.8 13.1Depreciation 1.9 2.1 8.0 8.1 5.0 5.0 2.7 2.9 1.7 1.9
of which: Depreciation of tangible fixed assets 1.7 1.8 7.9 8.0 4.9 4.9 2.6 2.7 1.6 1.7Interest and similar expenses 0.6 0.6 2.2 2.2 1.2 1.2 0.9 0.8 0.6 0.6Operating taxes 0.0 0.0 0.3 0.4 0.1 0.1 0.1 0.1 0.0 0.0Other expenses 10.5 10.7 20.5 20.5 17.2 17.8 13.7 13.8 10.1 10.3Total expenses before taxes on income 98.2 98.8 91.6 91.0 96.2 96.2 97.5 97.5 98.3 99.0Annual result before taxes on income 3.7 2.7 11.5 12.7 5.9 6.4 4.4 4.4 3.6 2.5Taxes on income 0.5 0.4 1.3 1.4 0.9 0.9 0.7 0.7 0.4 0.4Annual result 3.2 2.3 10.2 11.3 5.0 5.5 3.7 3.7 3.1 2.1Profit and loss transfers (parent company) 0.1 0.4 0.0 0.0 0.0 0.0 0.1 0.0 0.1 0.4Profit and loss transfers (subsidiary) 0.0 0.0 0.0 0.0 0.0 0.1 0.0 0.0 0.0 0.0Profit for the year 3.3 2.7 10.1 11.3 5.0 5.5 3.7 3.7 3.2 2.5
Balance sheetAssets Percentage of the balance sheet totalIntangible fixed assets 0.8 0.9 0.3 4.3 0.5 0.5 0.7 0.8 0.8 0.9Tangible fixed assets 27.2 27.7 61.0 58.1 51.8 50.3 29.3 29.7 26.2 26.8
of which: Land and buildings 13.9 13.9 12.9 12.8 12.5 12.0 11.8 11.9 14.1 14.2Inventories 20.5 20.4 13.9 13.9 20.2 21.6 30.1 30.3 19.5 19.4
of which: Finished goods and merchandise 8.5 8.4 5.1 4.9 6.8 7.0 10.4 10.8 8.4 8.2Cash 5.7 5.6 8.4 8.1 8.0 8.8 10.0 9.8 5.2 5.2Receivables 28.1 28.3 14.3 13.7 17.1 16.4 24.4 23.8 28.8 29.0
Short-term 25.7 23.4 14.2 13.6 16.0 15.6 23.4 23.1 26.2 23.6 of which:
Trade receivables 8.6 8.0 7.3 6.1 9.8 9.4 13.0 11.7 8.2 7.6Receivables from affiliated companies 11.8 11.3 3.7 3.6 3.9 4.0 7.4 8.3 12.4 11.8
Long-term 2.4 4.9 0.2 0.1 1.1 0.8 1.0 0.8 2.6 5.4of which: Loans to affiliated companies 2.2 4.7 0.1 0.1 0.4 0.3 0.7 0.5 2.4 5.2
Securities 0.9 1.0 0.2 0.1 0.3 0.4 0.5 0.5 0.9 1.1Other long-term equity investments 16.5 15.8 1.2 1.0 1.6 1.6 4.6 4.7 18.1 17.3
of which: Goodwill 0.1 0.1 0.3 0.2 0.5 0.5 0.2 0.1 0.0 0.0
CapitalEquity 30.4 30.0 17.3 18.9 23.4 23.4 24.0 25.1 31.3 30.7Liabilities 57.9 58.7 79.0 77.5 71.8 71.7 65.8 65.1 56.7 57.7
Short-term 41.3 41.6 41.9 43.1 44.2 46.7 50.9 50.3 40.2 40.6of which:Liabilities to banks 4.0 4.0 15.8 15.6 12.9 12.7 7.5 7.1 3.3 3.4Trade payables 10.9 10.6 5.4 7.3 7.5 7.5 7.4 6.2 11.3 11.1Liabilities to affiliated companies 15.4 15.2 7.9 7.8 11.3 13.2 19.1 19.4 15.1 14.9
Long-term 16.7 17.1 37.1 34.4 27.6 24.9 14.8 14.9 16.5 17.0 of which:
Liabilities to banks 12.0 12.5 30.8 30.6 22.8 21.3 9.7 9.6 11.9 12.5Liabilities to affiliated companies 3.9 3.8 5.4 3.2 3.9 2.8 4.3 4.5 3.8 3.8
Provisions 11.5 11.2 2.9 2.9 4.8 4.8 10.1 9.7 11.8 11.5of which: Provisions for pensions 5.1 4.9 0.1 0.0 0.7 0.7 3.3 3.2 5.4 5.2
Other ratios Percentage of salesAnnual result before taxes on income 3.7 2.7 11.7 12.9 6.0 6.5 4.5 4.4 3.6 2.5Annual result and depreciation 5.1 4.4 18.6 19.6 10.2 10.7 6.5 6.6 4.9 4.1Trade receivables 4.8 4.6 8.6 7.5 8.4 7.8 8.9 8.1 4.4 4.3
Percentage of the balance sheet totalSales 178.5 173.4 84.9 80.6 117.5 120.0 146.5 145.7 183.6 177.8Annual result and interest paid 6.9 5.1 10.7 11.1 7.5 8.1 6.7 6.6 6.9 4.8
Percentage of liabilities and provisions less cashAnnual result and depreciation 14.2 11.8 21.2 21.7 17.4 18.9 14.5 14.7 14.1 11.2
Percentage of fixed assetsLong-term equity and liabilities 109.6 103.7 87.0 83.8 93.7 92.0 117.5 119.1 109.6 103.0
Percentage of short-term liabilitiesCash resources and short-term receivables 76.7 70.2 54.2 50.6 54.7 52.7 66.1 65.8 78.7 71.2Cash resources, short-term receivables and inventories 126.3 119.2 87.4 83.0 100.5 98.9 125.1 126.1 127.2 119.1
Percentage of cost of materialsTrade payables 8.5 8.5 17.2 25.2 13.5 13.1 8.9 7.7 8.4 8.5
Memo item:Balance sheet total in € billion 66.43 69.92 0.31 0.35 1.26 1.30 6.04 6.15 58.81 62.12Sales in € billion 118.59 121.25 0.26 0.28 1.48 1.56 8.85 8.96 107.99 110.45Number of enterprises 1 259 1 259 299 299 302 302 369 369 289 289
* Agriculture, forestry and fishing, mining and quarrying, manufacturing, electricity, gas and water supply, construction, trade, transportation and storage,accommodation and food service activities, information and communication, business services, personal service activities

Deutsche BundesbankFinancial statement statistics (ratios - provisional data)
May 2021199
IV. Enterprises by federal state and economic sector
cont'd: 1. Baden-Württemberga) All economic sectors*
cont'd: Non-corporationsEnterprises with sales of ... € million
Total Less than 2 2 but less than 10 10 but less than 50 50 and moreQuartile Cylindered sample 2018/2019value 2018 2019 2018 2019 2018 2019 2018 2019 2018 2019Of the enterprises captured …
Ratios ... % had a ratio of less than …Percentage of gross revenue
Cost of materials 25 32.3 31.7 4.2 4.4 25.7 26.2 40.3 39.2 48.1 47.7 50 50.2 49.4 31.9 31.9 44.9 43.7 55.6 54.3 59.8 59.6 75 68.8 68.3 53.0 50.4 65.0 62.9 72.2 72.0 77.3 76.8
Personnel expenses 25 11.5 12.1 5.7 7.8 13.0 12.8 14.2 13.9 10.7 11.5 50 22.2 23.0 22.4 23.6 25.9 25.9 22.8 23.1 19.0 20.2 75 33.6 34.3 35.0 35.9 37.7 38.0 34.0 34.5 28.7 30.0
Depreciation 25 1.1 1.1 1.4 1.5 1.2 1.2 1.0 1.0 0.7 0.8 50 2.2 2.2 3.4 3.1 2.3 2.3 1.9 2.0 1.7 1.8 75 4.3 4.5 8.8 7.5 5.8 5.3 3.6 3.8 3.2 3.4
Annual result 25 1.3 1.3 3.2 4.4 1.2 1.7 1.1 0.8 1.1 0.5 50 4.2 4.2 9.0 10.5 4.3 4.5 3.4 3.1 3.3 2.4 75 8.8 8.9 19.8 20.5 8.4 8.4 6.3 6.1 6.3 5.2
Percentage of the balance sheet totalTangible fixed assets 25 7.8 7.8 7.3 5.9 10.1 10.5 7.2 7.7 8.7 8.3
50 22.4 22.8 30.4 28.2 25.8 24.4 20.9 20.5 20.0 20.2 75 47.0 47.8 69.0 66.9 53.6 55.3 40.5 41.6 36.1 38.5
Inventories 25 4.0 4.1 0.0 0.0 1.8 1.6 12.7 13.8 16.3 14.9 50 23.2 23.1 6.5 7.0 20.5 20.1 31.4 29.4 26.7 26.4 75 42.7 43.5 32.5 33.0 44.9 46.1 44.4 45.8 41.9 42.4
Equity 25 4.2 4.4 - 1.6 0.0 3.1 3.0 6.9 8.0 11.0 11.4 50 17.0 17.7 9.3 11.1 11.8 12.0 19.5 19.7 23.1 23.1 75 32.6 33.3 33.7 34.0 28.7 29.0 33.7 34.9 34.9 33.6
Short-term liabilities 25 30.8 29.8 20.1 20.5 33.6 33.9 33.1 32.9 31.3 31.7 50 52.3 52.2 50.9 51.1 56.1 55.2 53.4 51.8 49.6 50.3 75 75.6 73.2 85.9 81.3 77.6 77.0 73.1 72.7 68.1 67.6
Liabilities to banks 25 0.0 0.0 0.0 1.4 0.1 0.5 0.0 0.0 0.0 0.0 50 14.0 13.4 27.1 28.0 21.3 18.4 8.4 8.3 7.6 6.4 75 38.7 37.9 62.3 64.5 50.7 50.0 32.8 30.1 24.4 24.4
Percentage of salesAnnual result before taxes on income 25 1.6 1.6 3.6 5.1 1.6 1.9 1.4 1.0 1.3 0.7
50 4.9 4.9 10.1 12.2 5.0 5.3 4.1 3.8 3.8 2.7 75 10.1 10.4 22.3 22.7 9.9 9.9 7.6 7.3 7.1 6.0
Annual result and depreciation 25 4.0 3.9 7.9 9.3 4.5 4.5 3.3 2.8 3.1 2.4 50 8.0 8.2 17.0 17.5 8.2 9.1 6.4 6.2 6.0 5.2 75 15.4 15.2 35.0 33.9 15.5 15.1 10.5 11.0 10.1 9.5
Trade receivables 25 3.0 3.0 1.0 1.4 3.1 3.1 4.8 4.2 3.9 3.9 50 6.7 6.2 4.6 4.2 6.6 6.1 8.0 7.3 6.7 6.6 75 11.3 10.6 10.4 9.8 12.3 10.7 11.7 10.7 10.7 10.7
Percentage of the balance sheet totalAnnual result and interest paid 25 4.0 3.8 5.7 7.1 3.9 4.7 3.3 2.8 4.1 2.5
50 9.0 8.8 15.1 17.8 9.8 10.0 7.5 6.9 7.7 6.1 75 17.1 16.9 37.1 39.5 19.1 17.9 13.7 12.8 11.9 10.5
Percentage of liabilities and provisions less cashAnnual result and depreciation 25 9.5 8.6 10.8 12.4 9.9 10.1 8.4 7.2 9.5 7.6
50 19.8 19.0 26.4 28.8 21.3 21.9 18.5 16.7 17.5 15.0 75 37.3 36.0 67.7 67.7 40.0 40.8 33.6 30.1 27.3 25.7
Percentage of fixed assetsLong-term equity and liabilities 25 62.8 64.7 33.9 39.6 51.4 48.4 67.4 71.1 82.8 75.9
50 108.5 111.5 91.8 94.2 106.3 110.5 119.4 124.9 127.8 120.5 75 214.8 220.9 192.6 218.5 218.5 226.4 223.6 233.4 223.8 203.2
Percentage of short-term liabilitiesCash resources and short-term receivables 25 39.5 37.7 26.5 27.3 35.9 34.8 43.3 40.5 47.4 46.5
50 70.6 68.1 72.0 66.7 63.1 61.5 73.0 69.3 73.5 73.3 75 118.0 116.0 160.5 151.9 107.3 115.2 112.4 111.2 112.9 108.0
Percentage of cost of materialsTrade payables 25 4.6 4.3 3.7 4.4 5.5 4.8 4.5 4.2 4.5 4.3
50 8.6 8.0 11.9 10.3 11.5 9.7 7.5 6.9 7.2 6.8 75 16.0 14.5 28.6 23.8 21.9 20.3 12.3 11.6 10.1 10.3
* Agriculture, forestry and fishing, mining and quarrying, manufacturing, electricity, gas and water supply, construction, trade, transportation and storage,accommodation and food service activities, information and communication, business services, personal service activities

Deutsche BundesbankFinancial statement statistics (ratios - provisional data)May 2021200
IV. Enterprises by federal state and economic sector
1. Baden-Württembergb) Manufacturing
All legal formsEnterprises with sales of ... € million
Total Less than 2 2 but less than 10 10 but less than 50 50 and moreCylindered sample 2018/2019
Ratios 2018 2019 2018 2019 2018 2019 2018 2019 2018 2019Income statementIncome Percentage of gross revenueSales 99.3 99.8 98.0 99.4 97.8 99.3 98.7 99.7 99.4 99.9Change in finished goods 0.7 0.2 2.0 0.6 2.2 0.7 1.3 0.3 0.6 0.1Interest and similar income 0.5 0.6 0.1 0.1 0.1 0.1 0.2 0.2 0.5 0.6Other income 5.2 3.8 2.4 2.1 1.9 2.4 2.3 2.1 5.4 3.9
of which: Income from long-term equity investments 2.5 1.4 0.0 0.0 0.1 0.1 0.5 0.4 2.6 1.4Total income 105.7 104.4 102.5 102.2 102.0 102.5 102.4 102.3 105.9 104.5
ExpensesCost of materials 66.0 66.4 36.9 35.4 44.1 43.4 49.9 48.9 67.0 67.4Personnel expenses 18.6 19.2 36.3 35.6 31.8 33.2 28.0 28.9 18.1 18.6Depreciation 3.1 3.5 3.4 3.5 3.0 3.2 3.0 3.1 3.1 3.5
of which: Depreciation of tangible fixed assets 2.9 3.2 3.4 3.5 2.9 3.1 2.8 2.9 2.9 3.2Interest and similar expenses 1.3 1.2 1.0 0.9 0.8 0.9 0.9 0.9 1.3 1.2Operating taxes 0.0 0.0 0.1 0.1 0.1 0.1 0.1 0.1 0.0 0.0Other expenses 11.4 13.0 19.2 19.2 17.1 17.8 15.7 16.2 11.1 12.8Total expenses before taxes on income 100.4 103.3 96.8 94.7 96.9 98.5 97.5 98.1 100.6 103.6Annual result before taxes on income 5.3 1.1 5.7 7.5 5.1 4.0 5.0 4.2 5.3 0.9Taxes on income 1.2 0.7 1.4 1.6 1.3 1.1 1.1 1.0 1.2 0.7Annual result 4.1 0.4 4.3 5.9 3.8 2.8 3.9 3.1 4.2 0.2Profit and loss transfers (parent company) 1.3 2.2 0.2 0.2 0.0 0.0 0.1 0.1 1.4 2.3Profit and loss transfers (subsidiary) 1.5 1.2 0.0 0.1 0.5 0.1 1.0 0.5 1.5 1.2Profit for the year 4.0 1.4 4.5 6.0 3.3 2.8 3.0 2.7 4.0 1.3
Balance sheetAssets Percentage of the balance sheet totalIntangible fixed assets 1.8 1.7 0.8 0.8 0.8 0.8 0.9 1.0 1.8 1.7Tangible fixed assets 13.8 13.7 27.9 28.2 26.6 26.8 24.3 25.8 13.3 13.3
of which: Land and buildings 3.9 3.8 8.7 8.2 10.3 9.9 8.9 9.0 3.7 3.6Inventories 13.8 12.5 31.0 29.9 34.5 35.1 28.7 28.0 13.2 11.9
of which: Finished goods and merchandise 5.3 4.8 12.7 11.8 10.8 11.2 8.6 8.6 5.1 4.7Cash 4.2 4.7 12.4 14.1 10.4 10.9 9.5 9.6 3.9 4.5Receivables 29.6 32.4 24.5 23.7 24.9 23.4 30.0 29.0 29.6 32.6
Short-term 28.0 30.2 24.3 23.5 23.2 22.1 28.1 27.0 28.0 30.3 of which:
Trade receivables 5.4 4.6 14.8 14.8 13.9 13.0 12.7 11.6 5.1 4.3Receivables from affiliated companies 20.9 23.6 4.6 4.5 6.7 6.3 12.5 12.3 21.2 24.1
Long-term 1.6 2.3 0.2 0.2 1.6 1.3 1.9 2.0 1.6 2.3of which: Loans to affiliated companies 1.5 2.2 0.1 0.0 0.7 0.7 1.3 1.4 1.5 2.2
Securities 5.3 5.3 1.4 1.4 0.6 0.4 0.8 1.0 5.4 5.4Other long-term equity investments 31.4 29.3 1.5 1.3 1.8 2.2 5.4 5.2 32.5 30.2
of which: Goodwill 0.3 0.3 0.6 0.5 0.4 0.4 0.3 0.3 0.3 0.3
CapitalEquity 34.3 31.5 27.5 33.2 33.5 33.7 37.9 38.1 34.2 31.3Liabilities 48.4 51.3 63.7 57.5 57.2 57.2 48.4 48.5 48.3 51.4
Short-term 31.0 33.5 47.4 41.3 42.5 42.4 37.9 37.3 30.7 33.3of which:Liabilities to banks 1.7 2.0 12.1 10.0 11.0 10.7 6.1 6.0 1.5 1.8Trade payables 5.5 4.6 8.7 8.1 8.7 8.5 6.6 5.8 5.4 4.5Liabilities to affiliated companies 18.0 20.9 7.7 5.8 9.6 10.6 15.1 16.0 18.2 21.1
Long-term 17.4 17.9 16.2 16.2 14.7 14.8 10.5 11.1 17.6 18.1 of which:
Liabilities to banks 2.7 3.0 11.9 12.5 9.4 9.1 5.6 5.8 2.5 2.8Liabilities to affiliated companies 8.4 8.2 2.4 2.8 4.2 4.5 3.9 4.1 8.6 8.4
Provisions 17.1 17.0 8.2 8.6 9.2 9.1 13.6 13.4 17.3 17.1of which: Provisions for pensions 6.3 6.4 3.1 3.0 3.0 3.1 6.4 6.7 6.3 6.4
Other ratios Percentage of salesAnnual result before taxes on income 5.4 1.1 5.8 7.5 5.2 4.0 5.0 4.2 5.4 0.9Annual result and depreciation 7.3 3.9 7.8 9.5 6.9 6.1 6.9 6.3 7.3 3.8Trade receivables 5.5 5.0 9.9 9.9 9.3 8.9 9.2 8.6 5.3 4.8
Percentage of the balance sheet totalSales 98.0 90.4 148.4 149.2 149.3 146.7 137.7 135.7 96.3 88.7Annual result and interest paid 5.3 1.4 8.0 10.3 7.1 5.5 6.7 5.5 5.3 1.3
Percentage of liabilities and provisions less cashAnnual result and depreciation 11.6 5.5 19.4 26.9 18.5 16.0 18.1 16.3 11.4 5.2
Percentage of fixed assetsLong-term equity and liabilities 113.0 112.1 151.3 168.5 163.5 164.7 167.2 162.7 111.6 110.8
Percentage of short-term liabilitiesCash resources and short-term receivables 111.5 111.9 79.1 93.0 79.6 78.1 100.7 99.7 112.2 112.5Cash resources, short-term receivables and inventories 156.1 149.4 144.4 165.3 160.6 161.0 176.4 174.7 155.2 148.3
Percentage of cost of materialsTrade payables 8.4 7.6 15.6 15.3 13.0 13.2 9.5 8.8 8.3 7.6
Memo item:Balance sheet total in € billion 348.83 381.19 0.13 0.14 1.32 1.35 11.99 12.27 335.39 367.43Sales in € billion 341.71 344.64 0.20 0.21 1.97 1.98 16.51 16.65 323.03 325.80Number of enterprises 1 833 1 833 174 174 351 351 661 661 647 647

Deutsche BundesbankFinancial statement statistics (ratios - provisional data)
May 2021201
IV. Enterprises by federal state and economic sector
cont'd: 1. Baden-Württembergb) Manufacturing
cont'd: All legal formsEnterprises with sales of ... € million
Total Less than 2 2 but less than 10 10 but less than 50 50 and moreQuartile Cylindered sample 2018/2019value 2018 2019 2018 2019 2018 2019 2018 2019 2018 2019Of the enterprises captured …
Ratios ... % had a ratio of less than …Percentage of gross revenue
Cost of materials 25 38.0 36.9 22.1 21.5 31.7 30.3 39.3 38.0 44.0 43.4 50 49.2 48.5 34.5 34.4 43.1 42.1 49.2 48.9 54.2 53.8 75 60.0 59.2 48.1 46.0 55.7 53.4 60.0 59.0 64.2 63.5
Personnel expenses 25 19.5 20.3 26.6 25.3 22.5 23.8 20.0 20.8 16.7 17.3 50 27.7 28.7 36.0 37.0 31.1 33.2 28.2 29.1 24.3 24.9 75 36.4 37.9 45.9 44.2 40.8 42.0 35.9 37.2 31.5 33.1
Depreciation 25 1.2 1.2 1.2 1.3 1.2 1.2 1.2 1.2 1.3 1.3 50 2.3 2.3 2.4 2.5 2.3 2.2 2.2 2.3 2.4 2.4 75 3.9 4.1 4.4 4.3 3.9 4.1 4.0 4.0 3.7 4.1
Annual result 25 0.8 0.5 0.3 1.0 0.6 0.4 0.7 0.4 1.1 0.4 50 3.3 2.9 3.0 4.1 2.9 2.3 3.2 2.8 3.6 2.9 75 6.9 6.5 8.1 9.0 7.2 6.7 6.2 6.0 7.3 6.4
Percentage of the balance sheet totalTangible fixed assets 25 7.4 7.6 4.4 4.8 5.4 5.5 7.8 8.4 8.7 8.6
50 19.0 19.2 14.5 13.9 17.4 17.3 20.2 20.0 18.7 19.3 75 33.7 34.8 34.0 34.8 36.9 37.0 34.0 35.0 32.0 34.1
Inventories 25 17.0 15.8 10.1 8.6 17.1 15.1 18.6 17.7 16.6 15.4 50 28.5 27.5 26.3 27.0 34.1 30.5 30.7 30.2 25.0 24.2 75 43.1 43.2 47.9 46.5 51.0 50.8 43.9 44.4 37.9 37.0
Equity 25 14.9 16.1 4.3 8.2 12.2 13.3 16.6 18.0 18.4 18.6 50 33.1 33.3 21.7 27.4 29.8 31.1 36.0 36.5 33.1 33.7 75 52.9 54.7 49.7 52.9 49.7 52.9 54.1 54.8 53.4 55.7
Short-term liabilities 25 19.2 17.5 21.8 16.8 22.6 18.2 18.3 16.6 19.2 18.4 50 36.8 35.4 45.3 42.7 42.6 39.8 36.2 34.4 33.9 32.7 75 58.6 57.2 77.0 68.3 62.7 61.9 58.2 57.0 51.6 51.8
Liabilities to banks 25 0.0 0.0 0.0 0.0 0.0 0.0 0.0 0.0 0.0 0.0 50 5.6 5.3 14.1 14.1 12.7 12.6 6.2 6.0 1.5 1.0 75 25.1 23.4 37.4 34.6 33.8 33.3 23.7 23.4 16.0 16.3
Percentage of salesAnnual result before taxes on income 25 1.1 0.7 0.4 1.4 0.8 0.7 1.0 0.6 1.6 0.6
50 4.3 3.7 4.1 5.0 3.7 3.0 4.2 3.7 4.7 3.8 75 8.7 8.3 10.2 11.1 9.3 8.7 8.1 7.8 9.2 7.9
Annual result and depreciation 25 3.5 3.0 2.7 3.7 3.4 3.2 3.3 2.9 3.7 2.8 50 7.1 6.6 7.1 8.4 6.9 6.2 6.9 6.5 7.3 6.6 75 12.3 11.7 14.9 15.3 13.4 11.9 11.5 11.5 12.0 11.3
Trade receivables 25 4.2 3.9 3.1 2.8 4.3 4.1 4.6 4.0 4.2 4.0 50 7.6 6.9 6.7 5.9 7.5 6.8 8.0 7.2 7.6 7.0 75 11.8 11.2 12.9 11.5 12.2 11.5 12.0 11.2 11.5 11.0
Percentage of the balance sheet totalAnnual result and interest paid 25 2.8 2.1 2.2 3.6 2.5 2.4 2.8 1.8 3.2 2.0
50 6.7 5.9 7.3 9.2 6.8 6.0 6.3 5.8 6.8 5.4 75 12.5 11.6 16.4 17.8 12.8 11.7 11.8 11.0 11.9 10.8
Percentage of liabilities and provisions less cashAnnual result and depreciation 25 6.6 5.2 0.4 4.5 5.2 3.2 6.7 6.1 8.3 5.8
50 18.5 16.7 13.6 17.9 16.6 14.2 19.5 17.6 19.4 16.7 75 39.3 36.9 39.3 37.6 41.2 34.8 40.3 38.4 38.4 36.2
Percentage of fixed assetsLong-term equity and liabilities 25 104.8 104.6 69.0 75.6 105.5 106.7 109.1 104.6 109.8 108.2
50 176.7 179.5 162.8 208.3 200.6 204.3 182.7 180.4 164.0 160.2 75 333.3 332.6 333.9 503.4 474.0 449.4 330.1 318.2 300.5 288.2
Percentage of short-term liabilitiesCash resources and short-term receivables 25 52.1 52.5 34.4 33.6 41.8 42.2 53.2 53.4 65.3 61.7
50 95.3 96.9 84.4 80.9 79.4 82.8 91.9 92.6 105.1 107.3 75 193.0 217.8 216.4 262.7 180.5 208.9 188.2 226.6 198.3 212.6
Percentage of cost of materialsTrade payables 25 4.7 4.3 5.6 5.3 4.9 4.9 4.5 4.2 4.8 4.3
50 8.0 7.5 11.7 10.5 9.1 8.6 7.5 7.1 7.7 6.8 75 13.4 12.7 23.5 21.2 17.5 16.7 12.1 11.9 11.3 11.4

Deutsche BundesbankFinancial statement statistics (ratios - provisional data)May 2021202
IV. Enterprises by federal state and economic sector
2. Bavariaa) All economic sectors*
All legal formsEnterprises with sales of ... € million
Total Less than 2 2 but less than 10 10 but less than 50 50 and moreCylindered sample 2018/2019
Ratios 2018 2019 2018 2019 2018 2019 2018 2019 2018 2019Income statementIncome Percentage of gross revenueSales 99.5 99.7 98.5 98.3 98.4 98.7 98.8 99.6 99.6 99.8Change in finished goods 0.5 0.3 1.5 1.7 1.6 1.3 1.2 0.4 0.4 0.2Interest and similar income 0.2 0.3 0.2 0.2 0.1 0.2 0.1 0.2 0.3 0.4Other income 3.8 5.4 5.0 5.2 2.8 2.9 2.3 2.3 4.0 5.9
of which: Income from long-term equity investments 1.2 1.5 0.4 0.4 0.3 0.2 0.3 0.3 1.3 1.7Total income 104.1 105.8 105.2 105.5 103.0 103.1 102.4 102.4 104.3 106.2
ExpensesCost of materials 66.4 67.1 34.6 35.3 47.1 46.5 54.3 53.7 68.2 69.1Personnel expenses 16.6 16.5 32.7 32.9 29.4 29.7 24.9 25.5 15.3 15.2Depreciation 2.8 3.0 6.6 6.4 3.5 3.5 3.1 3.1 2.7 2.9
of which: Depreciation of tangible fixed assets 2.5 2.7 6.5 6.3 3.3 3.4 2.9 2.9 2.4 2.6Interest and similar expenses 1.2 1.0 1.6 1.5 0.7 0.7 0.6 0.6 1.2 1.0Operating taxes 0.0 0.0 0.1 0.1 0.1 0.1 0.1 0.1 0.0 0.0Other expenses 13.3 12.9 23.0 21.8 17.3 17.4 14.8 15.0 13.1 12.5Total expenses before taxes on income 100.3 100.5 98.6 98.0 98.1 98.0 97.7 98.0 100.6 100.8Annual result before taxes on income 3.8 5.3 6.6 7.4 4.9 5.1 4.7 4.4 3.7 5.4Taxes on income 1.0 1.1 1.5 1.6 1.2 1.3 1.1 1.1 1.0 1.1Annual result 2.8 4.2 5.1 5.9 3.7 3.8 3.6 3.3 2.7 4.3Profit and loss transfers (parent company) 1.1 0.6 0.0 0.1 0.2 0.3 0.1 0.1 1.3 0.7Profit and loss transfers (subsidiary) 0.9 1.3 - 0.2 - 0.3 0.1 0.1 0.8 0.6 0.9 1.4Profit for the year 3.0 3.5 5.4 6.3 3.8 4.0 2.9 2.8 3.0 3.6
Balance sheetAssets Percentage of the balance sheet totalIntangible fixed assets 1.3 1.3 1.1 1.1 0.8 0.9 1.1 1.2 1.3 1.3Tangible fixed assets 20.4 19.8 49.8 48.0 32.5 32.1 29.4 29.5 19.2 18.6
of which: Land and buildings 7.8 7.6 18.5 19.2 13.0 12.6 12.6 12.5 7.3 7.0Inventories 16.6 15.9 10.5 11.9 23.7 24.4 24.5 23.9 15.8 15.1
of which: Finished goods and merchandise 6.8 6.7 4.3 4.4 8.8 8.7 8.7 8.7 6.6 6.5Cash 7.0 6.7 13.5 12.7 12.5 12.0 11.5 11.7 6.4 6.1Receivables 29.4 29.8 20.6 21.6 25.0 24.8 26.6 27.0 29.8 30.1
Short-term 27.2 27.5 18.5 18.7 23.9 23.6 25.1 25.2 27.5 27.9 of which:
Trade receivables 8.0 7.5 7.4 7.4 12.9 12.4 12.7 12.3 7.4 7.0Receivables from affiliated companies 16.7 17.6 7.8 7.9 7.5 7.7 9.2 9.7 17.6 18.6
Long-term 2.2 2.2 2.1 3.0 1.1 1.2 1.5 1.8 2.3 2.3of which: Loans to affiliated companies 1.7 1.6 1.3 2.3 0.6 0.6 0.9 1.1 1.8 1.7
Securities 5.1 4.9 0.4 0.5 1.1 1.0 1.2 1.1 5.5 5.4Other long-term equity investments 19.8 21.2 3.4 3.5 3.9 4.2 5.2 5.0 21.5 23.1
of which: Goodwill 0.4 0.4 0.8 0.7 0.5 0.5 0.6 0.5 0.4 0.4
CapitalEquity 33.8 33.5 33.5 34.7 35.3 35.5 37.9 38.6 33.4 33.0Liabilities 46.4 47.4 60.4 59.2 55.7 55.7 50.5 49.6 45.8 47.0
Short-term 38.4 39.4 31.0 32.6 38.8 39.3 39.1 38.6 38.4 39.5of which:Liabilities to banks 2.3 2.3 8.2 8.4 7.4 7.8 5.7 5.9 1.9 1.9Trade payables 6.6 6.1 5.4 5.5 7.6 7.2 7.3 7.0 6.5 6.0Liabilities to affiliated companies 18.8 20.6 7.5 7.3 8.1 8.3 11.9 11.8 19.7 21.7
Long-term 8.0 8.1 29.4 26.6 16.9 16.4 11.4 11.0 7.4 7.6 of which:
Liabilities to banks 3.5 3.3 23.1 20.7 13.3 12.6 7.6 7.5 2.8 2.7Liabilities to affiliated companies 3.3 3.6 4.6 4.4 2.4 2.5 3.2 2.7 3.3 3.7
Provisions 18.6 17.8 5.7 5.6 8.3 8.1 10.8 11.0 19.6 18.7of which: Provisions for pensions 6.5 6.4 1.5 1.4 2.0 2.0 2.9 3.0 7.0 6.8
Other ratios Percentage of salesAnnual result before taxes on income 3.8 5.3 6.7 7.6 5.0 5.2 4.7 4.4 3.7 5.4Annual result and depreciation 5.6 7.2 11.8 12.5 7.3 7.5 6.7 6.5 5.4 7.2Trade receivables 6.5 6.4 8.6 8.6 9.3 9.2 9.0 8.7 6.1 6.0
Percentage of the balance sheet totalSales 122.6 117.7 85.8 87.0 138.4 135.5 141.0 141.6 120.7 115.3Annual result and interest paid 4.9 6.1 5.8 6.5 6.2 6.2 6.0 5.6 4.7 6.1
Percentage of liabilities and provisions less cashAnnual result and depreciation 11.6 14.1 19.1 20.7 19.3 19.3 18.8 18.5 10.9 13.7
Percentage of fixed assetsLong-term equity and liabilities 104.8 102.5 113.5 112.3 139.0 138.2 137.7 137.8 101.7 99.4
Percentage of short-term liabilitiesCash resources and short-term receivables 95.5 93.5 103.5 96.9 94.8 91.5 94.7 96.8 95.5 93.2Cash resources, short-term receivables and inventories 138.8 134.0 137.3 133.4 155.9 153.6 157.4 158.7 136.7 131.5
Percentage of cost of materialsTrade payables 8.0 7.7 18.0 17.6 11.4 11.2 9.4 9.2 7.8 7.5
Memo item:Balance sheet total in € billion 584.09 631.92 1.95 2.08 10.81 11.51 48.30 50.08 523.05 568.25Sales in € billion 716.16 743.69 1.67 1.81 14.95 15.60 68.07 70.92 631.47 655.36Number of enterprises 9 420 9 420 1 901 1 901 2 877 2 877 2 939 2 939 1 703 1 703
* Agriculture, forestry and fishing, mining and quarrying, manufacturing, electricity, gas and water supply, construction, trade, transportation and storage,accommodation and food service activities, information and communication, business services, personal service activities

Deutsche BundesbankFinancial statement statistics (ratios - provisional data)
May 2021203
IV. Enterprises by federal state and economic sector
cont'd: 2. Bavariaa) All economic sectors*
cont'd: All legal formsEnterprises with sales of ... € million
Total Less than 2 2 but less than 10 10 but less than 50 50 and moreQuartile Cylindered sample 2018/2019value 2018 2019 2018 2019 2018 2019 2018 2019 2018 2019Of the enterprises captured …
Ratios ... % had a ratio of less than …Percentage of gross revenue
Cost of materials 25 27.1 26.7 4.0 4.5 25.5 24.6 37.9 37.3 46.5 46.1 50 50.0 49.3 27.7 27.9 46.7 45.4 55.6 55.3 64.5 64.1 75 70.3 69.4 51.2 50.1 66.6 65.4 74.3 73.5 79.4 79.3
Personnel expenses 25 11.4 11.6 13.2 12.9 15.1 15.1 10.9 11.2 7.9 8.0 50 23.3 23.5 28.9 28.8 27.8 28.4 21.6 22.1 15.5 15.9 75 37.7 38.1 45.3 45.3 40.5 41.4 34.2 35.1 26.3 27.6
Depreciation 25 0.7 0.7 0.9 1.0 0.7 0.7 0.6 0.7 0.6 0.6 50 1.8 1.8 2.6 2.6 1.7 1.6 1.6 1.6 1.6 1.7 75 4.1 4.1 7.1 6.7 3.7 3.8 3.7 3.7 3.4 3.5
Annual result 25 0.6 0.6 0.3 1.0 0.7 0.7 0.6 0.6 0.4 0.6 50 2.9 3.0 4.5 5.7 2.9 3.0 2.7 2.6 2.6 2.3 75 7.1 7.2 13.2 14.3 6.6 6.6 5.9 5.8 5.7 5.7
Percentage of the balance sheet totalTangible fixed assets 25 3.7 3.6 3.5 3.2 3.6 3.5 3.7 3.8 4.3 4.2
50 14.3 14.3 16.8 16.7 12.4 12.1 14.2 14.4 16.4 16.1 75 38.4 38.5 53.2 51.3 36.8 36.8 36.8 36.6 34.8 34.9
Inventories 25 1.2 1.2 0.0 0.0 1.8 1.7 3.0 2.7 4.7 4.9 50 16.3 16.0 2.5 2.7 17.6 17.5 23.3 22.6 19.9 19.1 75 39.8 40.3 23.1 23.5 43.7 44.6 43.8 44.0 37.8 37.7
Equity 25 11.6 12.7 3.2 5.9 11.2 12.5 15.1 15.3 13.8 14.5 50 30.9 32.6 27.0 28.9 30.3 32.0 33.4 35.0 31.7 32.2 75 54.8 56.1 56.0 58.3 53.7 55.2 55.6 56.5 53.8 54.5
Short-term liabilities 25 18.6 17.8 13.7 13.6 19.2 18.0 19.7 18.6 20.6 20.7 50 38.6 37.6 34.0 33.4 39.2 38.1 39.3 38.0 39.4 39.4 75 64.5 63.3 67.7 65.6 64.9 63.2 63.0 62.4 63.9 62.7
Liabilities to banks 25 0.0 0.0 0.0 0.0 0.0 0.0 0.0 0.0 0.0 0.0 50 3.8 3.6 8.0 7.2 7.3 7.3 3.1 2.9 0.0 0.0 75 26.1 25.4 39.4 37.7 29.8 28.7 22.1 22.5 14.9 13.9
Percentage of salesAnnual result before taxes on income 25 0.8 0.9 0.4 1.1 1.0 1.0 0.9 0.8 0.7 0.8
50 3.8 3.8 5.5 7.1 3.8 3.9 3.6 3.4 3.2 3.0 75 9.0 9.1 15.7 16.9 8.5 8.7 7.8 7.4 7.4 7.2
Annual result and depreciation 25 2.6 2.7 3.0 4.0 2.8 2.8 2.6 2.4 2.2 2.2 50 6.5 6.5 10.0 11.1 6.5 6.5 5.9 5.8 5.4 5.2 75 13.1 13.4 23.4 24.7 12.5 12.5 11.3 11.1 10.7 10.6
Trade receivables 25 2.9 2.8 1.3 1.4 3.2 3.1 3.7 3.4 3.0 3.0 50 7.0 6.7 5.6 5.3 7.3 6.9 7.5 7.2 6.9 6.7 75 12.1 11.8 11.9 10.9 12.4 12.3 12.3 11.8 11.5 11.3
Percentage of the balance sheet totalAnnual result and interest paid 25 2.3 2.3 1.8 2.7 2.6 2.6 2.3 2.1 2.0 2.0
50 6.6 6.6 7.8 9.3 7.0 7.0 6.1 5.8 5.8 5.8 75 13.7 13.9 20.0 22.3 14.3 14.2 12.1 11.4 11.4 10.7
Percentage of liabilities and provisions less cashAnnual result and depreciation 25 4.6 5.0 - 1.5 2.3 4.8 4.7 5.5 5.7 6.6 6.5
50 17.4 17.7 15.8 19.8 17.7 17.6 17.6 17.5 17.4 16.8 75 42.8 44.6 48.7 58.9 45.3 47.7 42.0 41.5 36.1 35.4
Percentage of fixed assetsLong-term equity and liabilities 25 93.5 95.7 75.7 78.3 96.9 100.8 101.9 102.2 91.3 90.6
50 165.9 170.9 134.7 144.0 193.4 198.4 182.0 184.1 146.6 146.9 75 441.7 452.0 372.6 436.4 550.3 575.0 472.1 452.1 314.0 310.7
Percentage of short-term liabilitiesCash resources and short-term receivables 25 52.7 52.9 46.6 44.9 51.3 51.4 53.3 54.6 57.7 57.8
50 108.2 110.6 119.9 123.9 106.7 107.4 106.1 110.1 105.4 106.7 75 232.8 245.5 303.1 326.7 243.8 252.1 216.7 222.9 199.4 205.6
Percentage of cost of materialsTrade payables 25 4.3 4.0 4.2 4.0 4.6 4.3 4.4 4.0 3.8 3.7
50 8.7 8.2 11.6 10.4 9.5 8.9 8.2 7.8 7.5 7.1 75 16.2 15.6 28.4 26.3 18.1 17.8 14.3 13.9 12.1 11.6
* Agriculture, forestry and fishing, mining and quarrying, manufacturing, electricity, gas and water supply, construction, trade, transportation and storage,accommodation and food service activities, information and communication, business services, personal service activities

Deutsche BundesbankFinancial statement statistics (ratios - provisional data)May 2021204
IV. Enterprises by federal state and economic sector
cont'd: 2. Bavariaa) All economic sectors*
CorporationsEnterprises with sales of ... € million
Total Less than 2 2 but less than 10 10 but less than 50 50 and moreCylindered sample 2018/2019
Ratios 2018 2019 2018 2019 2018 2019 2018 2019 2018 2019Income statementIncome Percentage of gross revenueSales 99.6 99.7 98.5 98.2 98.5 98.7 98.7 99.5 99.7 99.8Change in finished goods 0.4 0.3 1.5 1.8 1.5 1.3 1.3 0.5 0.3 0.2Interest and similar income 0.3 0.4 0.3 0.3 0.2 0.2 0.1 0.2 0.3 0.4Other income 4.3 6.3 5.3 5.6 3.0 3.1 2.4 2.3 4.5 6.7
of which: Income from long-term equity investments 1.4 1.8 0.3 0.3 0.3 0.2 0.3 0.3 1.5 2.0Total income 104.6 106.6 105.6 105.9 103.2 103.3 102.6 102.5 104.8 107.1
ExpensesCost of materials 66.6 67.5 34.9 36.0 46.4 45.8 53.8 53.2 68.4 69.5Personnel expenses 16.8 16.6 37.8 37.8 31.0 31.3 25.6 26.3 15.5 15.3Depreciation 2.9 3.1 4.8 4.8 3.2 3.2 3.0 3.1 2.8 3.1
of which: Depreciation of tangible fixed assets 2.6 2.7 4.7 4.6 3.0 3.1 2.8 2.8 2.5 2.7Interest and similar expenses 1.3 1.0 1.2 1.1 0.7 0.7 0.6 0.6 1.4 1.1Operating taxes 0.0 0.0 0.1 0.1 0.1 0.1 0.1 0.1 0.0 0.0Other expenses 13.3 12.7 24.0 22.6 17.5 17.7 15.0 15.3 13.0 12.3Total expenses before taxes on income 100.8 101.0 102.8 102.3 98.8 98.8 98.1 98.4 101.2 101.3Annual result before taxes on income 3.8 5.6 2.8 3.6 4.4 4.5 4.5 4.1 3.7 5.8Taxes on income 1.1 1.2 1.5 1.5 1.4 1.4 1.2 1.2 1.1 1.2Annual result 2.7 4.4 1.3 2.1 3.0 3.1 3.3 2.9 2.6 4.6Profit and loss transfers (parent company) 1.3 0.7 0.1 0.2 0.1 0.1 0.1 0.1 1.4 0.7Profit and loss transfers (subsidiary) 1.0 1.5 - 0.4 - 0.5 0.0 0.0 1.0 0.7 1.0 1.6Profit for the year 2.9 3.6 1.8 2.8 3.1 3.2 2.3 2.3 3.0 3.7
Balance sheetAssets Percentage of the balance sheet totalIntangible fixed assets 1.3 1.2 1.5 1.6 0.8 0.8 1.2 1.3 1.3 1.2Tangible fixed assets 19.7 19.0 35.7 34.8 28.6 28.6 27.7 28.0 18.8 18.1
of which: Land and buildings 7.5 7.2 13.3 14.4 11.1 10.7 11.5 11.5 7.1 6.8Inventories 15.4 14.7 12.9 14.2 23.5 24.1 23.6 22.9 14.6 13.9
of which: Finished goods and merchandise 6.2 6.0 5.0 5.0 8.6 8.4 8.3 8.3 5.9 5.8Cash 6.8 6.5 16.8 15.1 13.8 13.1 12.1 12.3 6.2 5.9Receivables 29.6 29.9 27.8 28.8 27.2 26.9 27.9 28.3 29.7 30.1
Short-term 27.4 27.8 24.4 24.1 25.8 25.5 26.2 26.3 27.6 28.0 of which:
Trade receivables 7.6 7.1 9.9 9.5 13.7 13.2 12.8 12.4 7.0 6.5Receivables from affiliated companies 17.4 18.5 10.3 10.4 8.2 8.4 10.2 10.6 18.2 19.3
Long-term 2.1 2.1 3.4 4.7 1.3 1.4 1.7 2.0 2.2 2.1of which: Loans to affiliated companies 1.6 1.5 2.3 3.8 0.7 0.7 1.1 1.3 1.7 1.5
Securities 5.7 5.5 0.6 0.7 1.3 1.3 1.2 1.1 6.1 5.9Other long-term equity investments 21.2 22.8 4.0 4.0 4.2 4.6 5.7 5.4 22.8 24.5
of which: Goodwill 0.4 0.3 1.0 0.7 0.6 0.5 0.6 0.6 0.4 0.3
CapitalEquity 35.0 34.7 35.2 36.0 39.7 39.5 41.1 41.7 34.4 34.0Liabilities 44.2 45.5 56.4 55.9 50.1 50.7 46.6 45.8 43.9 45.3
Short-term 36.6 37.7 33.4 33.3 36.7 36.8 36.0 35.2 36.7 38.0of which:Liabilities to banks 2.0 2.0 6.9 6.0 6.5 6.6 4.6 4.9 1.7 1.7Trade payables 6.2 5.7 7.0 6.7 7.7 7.2 7.4 7.1 6.1 5.5Liabilities to affiliated companies 18.0 20.1 7.3 6.7 6.8 7.3 10.0 9.9 18.9 21.1
Long-term 7.6 7.7 23.0 22.6 13.4 13.9 10.7 10.6 7.2 7.3 of which:
Liabilities to banks 3.1 2.9 15.4 14.7 9.9 9.9 6.7 6.8 2.7 2.5Liabilities to affiliated companies 3.2 3.6 5.7 5.9 2.4 2.6 3.3 2.8 3.2 3.7
Provisions 19.4 18.5 7.8 7.3 9.2 9.0 11.3 11.6 20.3 19.2of which: Provisions for pensions 6.9 6.7 2.6 2.4 2.4 2.5 3.2 3.3 7.3 7.1
Other ratios Percentage of salesAnnual result before taxes on income 3.8 5.6 2.8 3.6 4.4 4.6 4.5 4.1 3.7 5.8Annual result and depreciation 5.5 7.5 6.2 7.0 6.3 6.5 6.4 6.0 5.4 7.7Trade receivables 6.6 6.4 9.6 9.4 9.8 9.7 9.3 8.9 6.2 6.1
Percentage of the balance sheet totalSales 114.8 109.7 102.8 101.4 139.4 136.2 137.9 139.0 112.6 107.0Annual result and interest paid 4.5 6.0 2.6 3.4 5.2 5.3 5.4 4.9 4.5 6.1
Percentage of liabilities and provisions less cashAnnual result and depreciation 11.0 14.0 13.2 14.6 18.8 18.6 18.8 18.2 10.3 13.7
Percentage of fixed assetsLong-term equity and liabilities 105.4 103.2 134.9 133.7 155.2 153.9 148.4 148.2 102.0 99.8
Percentage of short-term liabilitiesCash resources and short-term receivables 101.0 98.5 123.9 118.5 109.2 106.0 107.7 110.6 100.3 97.5Cash resources, short-term receivables and inventories 143.1 137.5 162.4 161.1 173.2 171.4 173.4 175.6 140.1 134.1
Percentage of cost of materialsTrade payables 8.0 7.6 19.1 18.0 11.7 11.4 9.8 9.5 7.8 7.4
Memo item:Balance sheet total in € billion 515.05 560.06 1.10 1.22 8.11 8.69 38.23 39.71 467.61 510.45Sales in € billion 591.51 614.35 1.13 1.24 11.31 11.83 52.71 55.18 526.36 546.10Number of enterprises 7 072 7 072 1 280 1 280 2 186 2 186 2 287 2 287 1 319 1 319
* Agriculture, forestry and fishing, mining and quarrying, manufacturing, electricity, gas and water supply, construction, trade, transportation and storage,accommodation and food service activities, information and communication, business services, personal service activities

Deutsche BundesbankFinancial statement statistics (ratios - provisional data)
May 2021205
IV. Enterprises by federal state and economic sector
cont'd: 2. Bavariaa) All economic sectors*
cont'd: CorporationsEnterprises with sales of ... € million
Total Less than 2 2 but less than 10 10 but less than 50 50 and moreQuartile Cylindered sample 2018/2019value 2018 2019 2018 2019 2018 2019 2018 2019 2018 2019Of the enterprises captured …
Ratios ... % had a ratio of less than …Percentage of gross revenue
Cost of materials 25 27.1 26.6 5.9 5.9 24.9 23.7 35.6 35.4 45.0 44.5 50 49.9 49.2 29.4 29.0 45.2 44.4 55.5 55.2 64.5 64.3 75 70.5 69.4 51.4 50.1 65.4 64.6 74.3 73.8 80.5 80.2
Personnel expenses 25 12.1 12.4 18.4 19.4 16.7 16.7 10.8 11.1 7.3 7.5 50 24.8 25.3 35.8 35.6 29.6 29.9 21.9 22.6 15.5 15.9 75 40.0 40.6 52.6 52.0 42.3 43.5 35.6 36.6 27.4 28.3
Depreciation 25 0.6 0.6 0.7 0.7 0.6 0.6 0.6 0.6 0.5 0.6 50 1.6 1.6 2.1 2.0 1.5 1.5 1.5 1.5 1.6 1.7 75 3.7 3.8 4.9 4.7 3.5 3.4 3.6 3.6 3.6 3.6
Annual result 25 0.4 0.4 - 0.4 0.2 0.5 0.5 0.5 0.4 0.3 0.5 50 2.5 2.5 2.4 3.4 2.5 2.6 2.5 2.4 2.3 2.2 75 6.0 6.1 7.9 8.9 5.8 5.9 5.7 5.5 5.5 5.6
Percentage of the balance sheet totalTangible fixed assets 25 2.9 2.8 1.7 1.9 3.0 2.9 3.1 3.1 3.5 3.3
50 11.0 10.9 9.9 9.4 9.7 9.8 11.4 11.8 14.2 14.1 75 31.9 31.9 31.4 31.7 30.2 29.6 32.7 33.0 33.0 33.1
Inventories 25 1.0 1.0 0.0 0.0 1.5 1.4 2.1 1.9 3.1 3.2 50 15.7 15.3 3.2 4.0 16.7 16.7 21.4 20.8 18.0 17.0 75 40.1 40.4 25.4 26.0 43.6 44.2 43.6 44.0 36.2 36.4
Equity 25 15.1 16.0 6.6 9.0 15.9 16.8 17.2 17.8 16.3 16.7 50 35.2 36.2 29.7 31.9 35.4 36.5 37.0 38.5 34.3 35.0 75 57.9 59.1 59.2 61.0 57.8 59.1 57.9 59.0 57.7 57.5
Short-term liabilities 25 17.2 16.5 14.7 14.6 17.5 16.7 17.4 16.3 18.4 18.4 50 36.1 35.2 35.6 35.9 36.2 35.2 36.4 34.7 35.5 35.2 75 61.0 60.2 67.7 65.4 60.3 59.4 59.7 59.2 59.6 59.3
Liabilities to banks 25 0.0 0.0 0.0 0.0 0.0 0.0 0.0 0.0 0.0 0.0 50 1.2 1.0 0.7 0.5 3.6 4.0 1.0 1.1 0.0 0.0 75 19.3 19.2 25.2 23.3 23.4 22.9 17.6 18.2 12.1 11.0
Percentage of salesAnnual result before taxes on income 25 0.6 0.6 - 0.3 0.3 0.8 0.7 0.8 0.7 0.6 0.7
50 3.2 3.3 3.0 4.3 3.3 3.5 3.5 3.1 3.1 2.9 75 8.0 8.2 10.4 11.5 7.9 8.1 7.8 7.2 7.3 7.3
Annual result and depreciation 25 2.2 2.3 1.5 2.6 2.3 2.4 2.3 2.2 2.0 2.1 50 5.8 5.8 6.6 7.6 5.9 5.8 5.6 5.5 5.2 5.1 75 11.6 11.9 15.4 16.6 11.3 11.6 11.1 10.7 10.6 10.8
Trade receivables 25 3.1 3.0 1.7 1.8 3.4 3.2 3.7 3.5 2.9 3.0 50 7.4 7.1 6.4 6.1 7.8 7.4 7.7 7.4 7.1 7.0 75 12.8 12.4 13.1 12.4 13.2 13.0 12.9 12.2 12.0 11.6
Percentage of the balance sheet totalAnnual result and interest paid 25 1.8 1.9 0.4 1.5 2.2 2.2 1.9 1.8 1.8 1.9
50 5.7 5.7 5.5 6.9 6.1 6.2 5.7 5.2 5.4 5.3 75 12.2 12.2 14.8 17.2 12.4 12.6 11.3 10.7 10.7 10.6
Percentage of liabilities and provisions less cashAnnual result and depreciation 25 3.0 3.3 - 10.2 - 3.5 3.0 2.8 4.6 4.4 5.8 5.8
50 16.0 16.2 10.6 13.7 16.3 16.0 17.5 17.0 17.1 16.8 75 42.1 43.4 39.8 47.8 45.0 48.0 44.1 43.4 37.0 36.5
Percentage of fixed assetsLong-term equity and liabilities 25 105.4 107.1 91.3 95.0 113.6 119.7 113.4 113.2 99.2 98.4
50 200.4 204.8 180.0 198.7 241.2 252.5 210.9 207.1 159.8 159.0 75 543.8 558.1 541.2 650.8 669.2 692.8 554.2 520.4 349.2 347.1
Percentage of short-term liabilitiesCash resources and short-term receivables 25 60.9 61.9 57.0 59.9 59.9 61.2 61.5 62.5 63.8 63.5
50 125.8 130.5 143.2 146.1 129.7 132.5 120.3 128.1 120.4 119.7 75 271.9 279.8 357.4 383.6 292.2 296.9 249.5 256.0 226.3 237.1
Percentage of cost of materialsTrade payables 25 4.3 4.0 4.4 4.4 4.6 4.2 4.4 4.0 3.6 3.4
50 9.0 8.4 12.4 11.1 9.4 8.9 8.7 8.1 7.5 7.1 75 16.7 16.2 30.0 27.8 18.1 18.2 15.1 14.5 12.5 11.9
* Agriculture, forestry and fishing, mining and quarrying, manufacturing, electricity, gas and water supply, construction, trade, transportation and storage,accommodation and food service activities, information and communication, business services, personal service activities

Deutsche BundesbankFinancial statement statistics (ratios - provisional data)May 2021206
IV. Enterprises by federal state and economic sector
cont'd: 2. Bavariaa) All economic sectors*
Non-corporationsEnterprises with sales of ... € million
Total Less than 2 2 but less than 10 10 but less than 50 50 and moreCylindered sample 2018/2019
Ratios 2018 2019 2018 2019 2018 2019 2018 2019 2018 2019Income statementIncome Percentage of gross revenueSales 99.4 99.7 98.5 98.4 98.3 98.8 99.1 99.7 99.4 99.8Change in finished goods 0.6 0.3 1.5 1.6 1.7 1.2 0.9 0.3 0.6 0.2Interest and similar income 0.1 0.1 0.1 0.1 0.1 0.1 0.1 0.1 0.1 0.1Other income 1.6 1.6 4.3 4.4 2.3 2.3 1.8 2.0 1.5 1.5
of which: Income from long-term equity investments 0.3 0.3 0.5 0.5 0.3 0.2 0.3 0.3 0.3 0.3Total income 101.7 101.7 104.4 104.5 102.4 102.4 101.9 102.1 101.6 101.6
ExpensesCost of materials 65.1 65.0 33.9 33.9 49.5 48.8 56.3 55.7 67.1 67.1Personnel expenses 15.7 15.9 22.3 22.4 24.1 24.4 22.3 22.9 14.4 14.6Depreciation 2.5 2.5 10.2 10.0 4.5 4.5 3.3 3.3 2.3 2.3
of which: Depreciation of tangible fixed assets 2.2 2.4 10.2 9.9 4.3 4.4 3.1 3.1 2.0 2.2Interest and similar expenses 0.6 0.6 2.5 2.2 0.9 0.9 0.8 0.7 0.6 0.6Operating taxes 0.1 0.1 0.2 0.2 0.1 0.1 0.1 0.1 0.1 0.1Other expenses 13.7 13.8 21.0 20.1 16.7 16.7 13.8 13.9 13.5 13.7Total expenses before taxes on income 97.7 98.0 90.0 88.7 95.8 95.5 96.6 96.6 98.0 98.3Annual result before taxes on income 4.0 3.7 14.5 15.7 6.6 6.9 5.4 5.5 3.7 3.3Taxes on income 0.7 0.6 1.6 1.8 0.8 0.9 0.7 0.7 0.6 0.6Annual result 3.4 3.1 12.9 13.9 5.8 5.9 4.6 4.7 3.0 2.7Profit and loss transfers (parent company) 0.3 0.3 0.0 0.0 0.5 1.1 0.0 0.1 0.3 0.3Profit and loss transfers (subsidiary) 0.3 0.3 0.2 0.2 0.2 0.2 0.0 0.0 0.3 0.3Profit for the year 3.3 3.1 12.8 13.7 6.1 6.9 4.6 4.8 3.0 2.7
Balance sheetAssets Percentage of the balance sheet totalIntangible fixed assets 1.4 1.4 0.5 0.5 0.7 1.0 0.6 0.6 1.6 1.5Tangible fixed assets 25.7 25.9 68.0 66.6 44.2 42.9 35.8 35.5 22.4 22.7
of which: Land and buildings 10.2 10.4 25.0 25.9 18.8 18.5 16.7 16.3 8.4 8.7Inventories 25.8 25.6 7.4 8.6 24.3 25.4 28.0 27.5 25.8 25.6
of which: Finished goods and merchandise 11.8 11.9 3.3 3.5 9.2 9.4 10.1 10.4 12.4 12.4Cash 8.6 8.4 9.2 9.3 8.5 8.7 9.4 9.7 8.5 8.1Receivables 28.2 28.6 11.4 11.5 18.4 18.2 21.6 22.0 30.1 30.5
Short-term 25.2 25.2 10.8 11.0 18.0 17.8 20.7 21.1 26.6 26.5 of which:
Trade receivables 10.9 10.8 4.1 4.5 10.4 10.0 12.2 11.7 10.8 10.8Receivables from affiliated companies 11.1 11.1 4.7 4.4 5.2 5.3 5.6 6.3 12.5 12.4
Long-term 3.0 3.4 0.5 0.5 0.4 0.4 0.9 0.9 3.5 4.0of which: Loans to affiliated companies 2.2 2.5 0.1 0.1 0.1 0.1 0.5 0.5 2.6 3.1
Securities 0.5 0.4 0.1 0.2 0.3 0.3 1.0 1.0 0.4 0.4Other long-term equity investments 9.3 9.3 2.6 2.7 3.0 3.1 3.1 3.4 10.8 10.8
of which: Goodwill 0.7 0.7 0.6 0.6 0.4 0.4 0.4 0.4 0.8 0.8
CapitalEquity 24.6 24.2 31.2 32.8 22.0 23.3 25.5 26.7 24.5 23.7Liabilities 62.6 62.7 65.5 63.8 72.3 71.2 65.4 64.3 61.6 62.0
Short-term 51.6 52.0 27.9 31.5 45.0 47.0 51.2 51.4 52.4 52.6of which:Liabilities to banks 5.1 4.9 10.0 11.7 10.0 11.3 9.9 9.9 4.0 3.5Trade payables 9.3 9.2 3.4 3.8 7.3 7.1 6.8 6.7 10.0 9.8Liabilities to affiliated companies 24.1 24.9 7.6 8.1 12.0 11.4 19.3 19.1 25.8 26.8
Long-term 11.0 10.7 37.6 32.3 27.4 24.2 14.2 12.9 9.2 9.4 of which:
Liabilities to banks 6.1 6.1 33.1 29.1 23.7 21.0 10.9 10.1 4.0 4.3Liabilities to affiliated companies 4.0 3.9 3.2 2.3 2.5 2.3 2.8 2.3 4.4 4.4
Provisions 12.3 12.6 3.0 3.2 5.4 5.3 8.8 8.8 13.4 13.8of which: Provisions for pensions 3.7 3.8 0.1 0.1 0.7 0.6 1.8 1.8 4.2 4.4
Other ratios Percentage of salesAnnual result before taxes on income 4.0 3.7 14.7 16.0 6.7 6.9 5.4 5.5 3.7 3.3Annual result and depreciation 5.9 5.6 23.5 24.3 10.4 10.6 8.0 8.0 5.3 5.0Trade receivables 6.0 6.0 6.5 6.8 7.7 7.5 8.0 7.7 5.7 5.7
Percentage of the balance sheet totalSales 180.5 180.0 63.9 66.7 135.2 133.3 152.7 151.7 189.6 189.0Annual result and interest paid 7.2 6.8 10.0 10.9 9.3 9.3 8.3 8.3 6.9 6.3
Percentage of liabilities and provisions less cashAnnual result and depreciation 16.0 15.0 25.2 27.9 20.4 20.7 18.7 19.1 15.1 13.9
Percentage of fixed assetsLong-term equity and liabilities 98.9 96.6 96.1 92.7 103.0 101.2 101.3 101.2 98.3 95.5
Percentage of short-term liabilitiesCash resources and short-term receivables 65.9 64.9 72.0 64.7 59.2 56.4 59.9 60.9 67.2 66.0Cash resources, short-term receivables and inventories 116.0 114.3 98.7 92.1 113.3 110.6 114.7 114.4 116.4 114.6
Percentage of cost of materialsTrade payables 7.9 7.8 15.6 16.7 10.8 10.7 7.9 7.9 7.8 7.7
Memo item:Balance sheet total in € billion 69.04 71.86 0.85 0.86 2.69 2.82 10.06 10.38 55.44 57.80Sales in € billion 124.65 129.34 0.54 0.58 3.64 3.76 15.36 15.74 105.11 109.26Number of enterprises 2 348 2 348 621 621 691 691 652 652 384 384
* Agriculture, forestry and fishing, mining and quarrying, manufacturing, electricity, gas and water supply, construction, trade, transportation and storage,accommodation and food service activities, information and communication, business services, personal service activities

Deutsche BundesbankFinancial statement statistics (ratios - provisional data)
May 2021207
IV. Enterprises by federal state and economic sector
cont'd: 2. Bavariaa) All economic sectors*
cont'd: Non-corporationsEnterprises with sales of ... € million
Total Less than 2 2 but less than 10 10 but less than 50 50 and moreQuartile Cylindered sample 2018/2019value 2018 2019 2018 2019 2018 2019 2018 2019 2018 2019Of the enterprises captured …
Ratios ... % had a ratio of less than …Percentage of gross revenue
Cost of materials 25 27.2 26.9 1.3 1.2 26.8 26.2 41.6 40.9 49.7 49.0 50 50.2 49.5 24.9 25.7 50.1 49.5 56.1 55.6 64.4 62.9 75 69.6 69.3 50.3 50.2 69.9 69.7 74.0 72.9 77.4 77.1
Personnel expenses 25 9.7 9.9 1.6 1.5 11.3 11.8 11.1 11.5 9.6 9.5 50 19.1 19.5 17.4 16.9 23.1 22.9 20.3 20.9 15.7 16.0 75 31.0 31.9 31.1 31.9 34.4 34.7 31.1 32.2 24.4 25.5
Depreciation 25 1.1 1.0 1.6 1.7 1.0 0.9 0.9 0.9 0.9 0.9 50 2.3 2.3 4.2 4.4 2.2 2.1 2.1 2.0 1.7 1.8 75 5.4 5.5 15.3 14.5 5.0 5.0 4.1 4.0 3.2 3.2
Annual result 25 1.7 1.7 4.8 5.5 2.0 1.9 1.1 1.3 0.9 0.9 50 4.7 4.9 11.7 13.4 4.6 4.4 3.3 3.5 3.1 2.7 75 10.9 11.6 24.2 25.6 9.3 8.8 6.6 7.0 6.8 6.1
Percentage of the balance sheet totalTangible fixed assets 25 8.7 8.4 14.4 13.3 7.9 6.8 7.7 7.6 8.0 7.9
50 28.1 27.5 49.1 46.8 25.3 26.1 24.3 23.9 21.5 22.0 75 55.5 54.2 78.1 77.9 57.1 56.9 45.6 46.1 37.9 39.4
Inventories 25 1.7 1.7 0.0 0.0 2.9 2.8 9.8 8.9 11.5 11.6 50 18.6 18.1 1.4 1.5 20.3 20.1 27.5 27.4 25.1 25.4 75 39.0 40.3 19.0 17.4 44.2 45.9 43.9 44.0 40.8 42.6
Equity 25 4.6 5.8 0.1 0.5 3.9 4.9 7.4 8.3 8.3 9.4 50 19.9 22.2 19.1 23.9 15.3 18.2 22.3 23.7 22.5 24.2 75 40.6 43.2 47.2 52.4 35.2 38.2 41.3 43.6 40.7 41.7
Short-term liabilities 25 23.4 22.9 12.1 12.2 26.9 26.3 29.3 28.2 32.2 31.6 50 47.0 46.6 31.8 30.7 49.7 50.4 49.8 49.4 51.6 51.2 75 72.8 70.8 67.9 67.2 75.8 74.0 71.7 70.1 72.5 70.4
Liabilities to banks 25 0.0 0.0 2.1 1.3 3.1 2.5 0.0 0.0 0.0 0.0 50 17.8 17.5 31.3 32.0 24.7 23.0 14.3 13.2 3.2 3.1 75 43.9 43.6 63.6 63.1 48.7 48.8 34.8 33.9 20.4 21.5
Percentage of salesAnnual result before taxes on income 25 2.1 2.1 5.0 6.5 2.5 2.2 1.3 1.5 1.1 1.1
50 5.4 5.6 13.3 15.0 5.4 5.1 3.9 4.1 3.8 3.1 75 12.6 13.3 27.3 29.2 10.8 10.3 7.8 8.2 7.9 7.0
Annual result and depreciation 25 4.4 4.3 10.4 11.6 5.0 4.4 3.3 3.3 2.7 2.6 50 9.1 9.3 21.6 22.5 8.7 8.6 6.6 6.5 6.0 5.3 75 18.2 19.0 45.2 46.8 16.5 16.2 11.9 12.4 11.0 9.9
Trade receivables 25 2.3 2.3 0.8 0.7 2.9 2.6 3.6 3.4 3.1 3.2 50 5.9 5.6 3.9 3.4 6.1 5.8 6.6 6.2 6.5 6.3 75 10.0 9.8 9.1 8.8 9.9 9.8 10.5 10.3 10.2 9.9
Percentage of the balance sheet totalAnnual result and interest paid 25 4.3 4.5 5.8 6.6 4.7 4.4 3.5 3.9 3.1 3.0
50 9.8 9.5 14.7 16.6 10.5 9.9 8.0 8.2 7.9 7.0 75 20.1 20.1 36.5 43.2 21.4 20.2 14.2 13.7 13.0 11.4
Percentage of liabilities and provisions less cashAnnual result and depreciation 25 9.3 9.5 10.5 12.3 10.8 10.3 8.2 9.3 7.8 8.0
50 20.8 21.9 24.7 29.7 22.2 22.9 18.3 19.5 18.2 16.7 75 44.8 47.6 67.5 85.0 45.9 46.8 35.1 37.2 32.7 31.3
Percentage of fixed assetsLong-term equity and liabilities 25 65.3 68.3 54.8 56.3 66.4 70.9 72.9 73.8 64.1 66.1
50 108.4 110.3 100.0 102.1 107.4 109.1 122.4 122.5 109.7 111.6 75 199.2 212.3 152.5 170.6 208.4 218.2 236.3 240.2 193.3 205.6
Percentage of short-term liabilitiesCash resources and short-term receivables 25 36.9 36.0 31.6 28.9 36.4 33.9 37.6 39.1 43.9 43.3
50 70.4 71.8 80.6 86.5 65.3 67.5 68.1 67.2 70.5 74.1 75 138.9 140.4 224.4 236.0 118.6 119.3 121.6 121.4 119.1 122.3
Percentage of cost of materialsTrade payables 25 4.4 4.1 3.7 3.2 4.9 4.5 4.3 4.0 4.6 4.5
50 8.1 7.7 10.2 9.2 9.5 8.8 7.0 7.1 7.4 7.1 75 14.5 14.1 23.3 22.1 18.2 17.2 12.1 11.7 10.3 10.4
* Agriculture, forestry and fishing, mining and quarrying, manufacturing, electricity, gas and water supply, construction, trade, transportation and storage,accommodation and food service activities, information and communication, business services, personal service activities
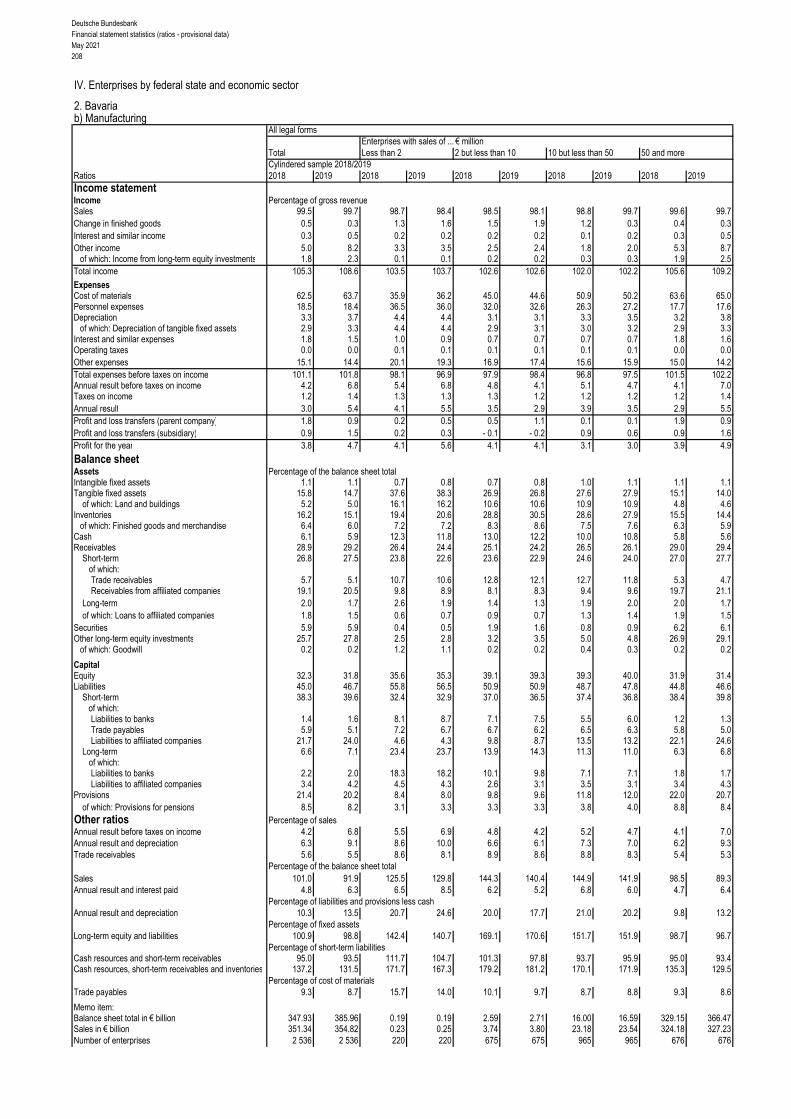
Deutsche BundesbankFinancial statement statistics (ratios - provisional data)May 2021208
IV. Enterprises by federal state and economic sector
2. Bavariab) Manufacturing
All legal formsEnterprises with sales of ... € million
Total Less than 2 2 but less than 10 10 but less than 50 50 and moreCylindered sample 2018/2019
Ratios 2018 2019 2018 2019 2018 2019 2018 2019 2018 2019Income statementIncome Percentage of gross revenueSales 99.5 99.7 98.7 98.4 98.5 98.1 98.8 99.7 99.6 99.7Change in finished goods 0.5 0.3 1.3 1.6 1.5 1.9 1.2 0.3 0.4 0.3Interest and similar income 0.3 0.5 0.2 0.2 0.2 0.2 0.1 0.2 0.3 0.5Other income 5.0 8.2 3.3 3.5 2.5 2.4 1.8 2.0 5.3 8.7
of which: Income from long-term equity investments 1.8 2.3 0.1 0.1 0.2 0.2 0.3 0.3 1.9 2.5Total income 105.3 108.6 103.5 103.7 102.6 102.6 102.0 102.2 105.6 109.2
ExpensesCost of materials 62.5 63.7 35.9 36.2 45.0 44.6 50.9 50.2 63.6 65.0Personnel expenses 18.5 18.4 36.5 36.0 32.0 32.6 26.3 27.2 17.7 17.6Depreciation 3.3 3.7 4.4 4.4 3.1 3.1 3.3 3.5 3.2 3.8
of which: Depreciation of tangible fixed assets 2.9 3.3 4.4 4.4 2.9 3.1 3.0 3.2 2.9 3.3Interest and similar expenses 1.8 1.5 1.0 0.9 0.7 0.7 0.7 0.7 1.8 1.6Operating taxes 0.0 0.0 0.1 0.1 0.1 0.1 0.1 0.1 0.0 0.0Other expenses 15.1 14.4 20.1 19.3 16.9 17.4 15.6 15.9 15.0 14.2Total expenses before taxes on income 101.1 101.8 98.1 96.9 97.9 98.4 96.8 97.5 101.5 102.2Annual result before taxes on income 4.2 6.8 5.4 6.8 4.8 4.1 5.1 4.7 4.1 7.0Taxes on income 1.2 1.4 1.3 1.3 1.3 1.2 1.2 1.2 1.2 1.4Annual result 3.0 5.4 4.1 5.5 3.5 2.9 3.9 3.5 2.9 5.5Profit and loss transfers (parent company) 1.8 0.9 0.2 0.5 0.5 1.1 0.1 0.1 1.9 0.9Profit and loss transfers (subsidiary) 0.9 1.5 0.2 0.3 - 0.1 - 0.2 0.9 0.6 0.9 1.6Profit for the year 3.8 4.7 4.1 5.6 4.1 4.1 3.1 3.0 3.9 4.9
Balance sheetAssets Percentage of the balance sheet totalIntangible fixed assets 1.1 1.1 0.7 0.8 0.7 0.8 1.0 1.1 1.1 1.1Tangible fixed assets 15.8 14.7 37.6 38.3 26.9 26.8 27.6 27.9 15.1 14.0
of which: Land and buildings 5.2 5.0 16.1 16.2 10.6 10.6 10.9 10.9 4.8 4.6Inventories 16.2 15.1 19.4 20.6 28.8 30.5 28.6 27.9 15.5 14.4
of which: Finished goods and merchandise 6.4 6.0 7.2 7.2 8.3 8.6 7.5 7.6 6.3 5.9Cash 6.1 5.9 12.3 11.8 13.0 12.2 10.0 10.8 5.8 5.6Receivables 28.9 29.2 26.4 24.4 25.1 24.2 26.5 26.1 29.0 29.4
Short-term 26.8 27.5 23.8 22.6 23.6 22.9 24.6 24.0 27.0 27.7 of which:
Trade receivables 5.7 5.1 10.7 10.6 12.8 12.1 12.7 11.8 5.3 4.7Receivables from affiliated companies 19.1 20.5 9.8 8.9 8.1 8.3 9.4 9.6 19.7 21.1
Long-term 2.0 1.7 2.6 1.9 1.4 1.3 1.9 2.0 2.0 1.7of which: Loans to affiliated companies 1.8 1.5 0.6 0.7 0.9 0.7 1.3 1.4 1.9 1.5
Securities 5.9 5.9 0.4 0.5 1.9 1.6 0.8 0.9 6.2 6.1Other long-term equity investments 25.7 27.8 2.5 2.8 3.2 3.5 5.0 4.8 26.9 29.1
of which: Goodwill 0.2 0.2 1.2 1.1 0.2 0.2 0.4 0.3 0.2 0.2
CapitalEquity 32.3 31.8 35.6 35.3 39.1 39.3 39.3 40.0 31.9 31.4Liabilities 45.0 46.7 55.8 56.5 50.9 50.9 48.7 47.8 44.8 46.6
Short-term 38.3 39.6 32.4 32.9 37.0 36.5 37.4 36.8 38.4 39.8of which:Liabilities to banks 1.4 1.6 8.1 8.7 7.1 7.5 5.5 6.0 1.2 1.3Trade payables 5.9 5.1 7.2 6.7 6.7 6.2 6.5 6.3 5.8 5.0Liabilities to affiliated companies 21.7 24.0 4.6 4.3 9.8 8.7 13.5 13.2 22.1 24.6
Long-term 6.6 7.1 23.4 23.7 13.9 14.3 11.3 11.0 6.3 6.8 of which:
Liabilities to banks 2.2 2.0 18.3 18.2 10.1 9.8 7.1 7.1 1.8 1.7Liabilities to affiliated companies 3.4 4.2 4.5 4.3 2.6 3.1 3.5 3.1 3.4 4.3
Provisions 21.4 20.2 8.4 8.0 9.8 9.6 11.8 12.0 22.0 20.7of which: Provisions for pensions 8.5 8.2 3.1 3.3 3.3 3.3 3.8 4.0 8.8 8.4
Other ratios Percentage of salesAnnual result before taxes on income 4.2 6.8 5.5 6.9 4.8 4.2 5.2 4.7 4.1 7.0Annual result and depreciation 6.3 9.1 8.6 10.0 6.6 6.1 7.3 7.0 6.2 9.3Trade receivables 5.6 5.5 8.6 8.1 8.9 8.6 8.8 8.3 5.4 5.3
Percentage of the balance sheet totalSales 101.0 91.9 125.5 129.8 144.3 140.4 144.9 141.9 98.5 89.3Annual result and interest paid 4.8 6.3 6.5 8.5 6.2 5.2 6.8 6.0 4.7 6.4
Percentage of liabilities and provisions less cashAnnual result and depreciation 10.3 13.5 20.7 24.6 20.0 17.7 21.0 20.2 9.8 13.2
Percentage of fixed assetsLong-term equity and liabilities 100.9 98.8 142.4 140.7 169.1 170.6 151.7 151.9 98.7 96.7
Percentage of short-term liabilitiesCash resources and short-term receivables 95.0 93.5 111.7 104.7 101.3 97.8 93.7 95.9 95.0 93.4Cash resources, short-term receivables and inventories 137.2 131.5 171.7 167.3 179.2 181.2 170.1 171.9 135.3 129.5
Percentage of cost of materialsTrade payables 9.3 8.7 15.7 14.0 10.1 9.7 8.7 8.8 9.3 8.6
Memo item:Balance sheet total in € billion 347.93 385.96 0.19 0.19 2.59 2.71 16.00 16.59 329.15 366.47Sales in € billion 351.34 354.82 0.23 0.25 3.74 3.80 23.18 23.54 324.18 327.23Number of enterprises 2 536 2 536 220 220 675 675 965 965 676 676

Deutsche BundesbankFinancial statement statistics (ratios - provisional data)
May 2021209
IV. Enterprises by federal state and economic sector
cont'd: 2. Bavariab) Manufacturing
cont'd: All legal formsEnterprises with sales of ... € million
Total Less than 2 2 but less than 10 10 but less than 50 50 and moreQuartile Cylindered sample 2018/2019value 2018 2019 2018 2019 2018 2019 2018 2019 2018 2019Of the enterprises captured …
Ratios ... % had a ratio of less than …Percentage of gross revenue
Cost of materials 25 37.1 36.5 20.9 19.1 32.6 31.5 40.0 38.7 43.6 43.1 50 48.9 47.9 34.7 35.6 44.6 43.9 49.9 49.3 55.0 54.2 75 61.0 60.2 49.1 47.7 55.9 56.3 61.5 60.3 66.8 66.0
Personnel expenses 25 17.9 18.5 21.3 21.7 23.5 23.9 18.4 18.9 13.3 14.1 50 27.2 28.1 35.9 33.6 31.9 32.7 26.7 27.7 20.6 21.7 75 36.0 36.9 48.6 47.6 40.0 41.6 34.7 35.8 28.8 30.7
Depreciation 25 1.2 1.2 1.2 1.1 1.1 1.0 1.2 1.3 1.4 1.5 50 2.4 2.4 2.9 2.7 2.1 2.1 2.4 2.5 2.4 2.6 75 4.2 4.3 5.5 5.5 4.0 4.1 4.1 4.3 4.0 4.2
Annual result 25 0.7 0.5 0.3 0.3 0.8 0.3 0.8 0.7 0.8 0.6 50 3.3 3.2 2.6 4.3 2.9 2.8 3.5 3.2 3.9 3.4 75 7.2 7.1 8.5 11.5 6.6 6.3 6.9 6.9 7.9 7.2
Percentage of the balance sheet totalTangible fixed assets 25 7.2 7.2 6.3 5.8 5.9 5.4 7.9 8.3 8.2 8.7
50 20.5 21.2 23.9 22.7 17.5 17.8 22.3 23.3 20.3 20.3 75 39.6 40.2 49.2 47.7 40.1 40.7 41.8 41.5 36.0 36.3
Inventories 25 12.7 12.3 2.8 3.1 11.8 12.9 16.6 15.7 12.2 11.1 50 25.3 24.8 13.3 13.3 27.6 27.4 28.1 27.7 22.1 21.1 75 40.7 40.9 36.2 37.0 46.8 48.4 42.9 42.6 35.2 34.2
Equity 25 15.9 16.6 6.1 7.4 15.2 16.4 17.7 18.3 17.0 17.0 50 34.6 35.1 28.0 29.3 34.9 35.4 35.8 36.2 34.0 33.6 75 56.9 58.1 57.0 60.5 58.6 60.5 56.1 57.9 56.0 55.7
Short-term liabilities 25 17.5 16.8 13.1 14.7 16.4 15.6 17.6 16.8 18.8 18.9 50 34.5 33.1 32.8 30.7 33.3 32.6 35.6 33.4 34.1 33.9 75 56.1 55.8 63.1 62.4 54.9 55.2 57.1 56.3 54.2 53.2
Liabilities to banks 25 0.0 0.0 0.0 0.0 0.0 0.0 0.0 0.0 0.0 0.0 50 4.7 4.9 11.5 12.0 10.4 10.6 6.2 6.9 0.0 0.0 75 23.8 24.1 41.1 39.2 29.2 29.8 23.5 24.1 11.2 11.5
Percentage of salesAnnual result before taxes on income 25 1.0 0.7 0.3 0.6 1.0 0.5 1.1 0.8 1.1 0.8
50 4.4 4.1 3.3 5.2 3.8 3.6 4.6 4.1 4.9 4.1 75 9.4 8.9 10.5 12.8 8.4 8.2 9.3 8.7 9.7 8.8
Annual result and depreciation 25 3.6 3.1 2.5 3.1 3.6 2.8 3.6 3.4 3.7 3.0 50 7.3 7.1 6.5 8.9 7.1 6.4 7.3 7.3 7.6 7.3 75 12.8 12.7 15.0 17.2 11.9 11.7 12.6 12.4 13.5 12.8
Trade receivables 25 4.0 3.6 3.3 2.5 3.9 3.5 4.4 4.0 3.8 3.7 50 7.5 7.0 6.2 5.5 7.3 6.8 7.8 7.3 7.6 7.2 75 11.6 11.3 10.2 9.1 11.7 11.6 11.9 11.5 10.9 10.8
Percentage of the balance sheet totalAnnual result and interest paid 25 2.4 2.1 1.0 2.0 2.6 1.8 2.7 2.3 2.2 2.1
50 7.0 6.4 6.4 9.0 6.5 5.9 7.0 6.4 7.6 6.6 75 13.5 12.6 16.8 21.4 12.8 12.4 12.8 12.0 13.7 12.2
Percentage of liabilities and provisions less cashAnnual result and depreciation 25 5.8 5.2 1.4 4.9 4.5 3.5 6.1 6.1 7.0 6.1
50 19.3 18.2 14.6 18.1 17.8 15.9 20.2 19.1 20.2 19.0 75 44.4 43.8 45.6 72.9 43.6 39.0 45.5 45.1 41.7 38.0
Percentage of fixed assetsLong-term equity and liabilities 25 100.1 100.8 86.1 82.3 103.7 105.1 105.2 104.8 95.2 93.4
50 162.3 163.3 150.6 157.3 188.9 187.9 169.6 173.4 147.3 145.7 75 331.1 336.9 383.1 486.9 467.9 452.6 333.1 331.6 252.6 249.0
Percentage of short-term liabilitiesCash resources and short-term receivables 25 53.0 52.2 41.0 37.4 51.7 47.7 51.2 51.7 60.4 60.3
50 101.6 102.9 113.3 115.7 101.6 99.8 94.1 98.8 108.7 109.3 75 223.8 232.2 300.7 332.4 255.8 264.6 203.0 221.0 207.9 211.7
Percentage of cost of materialsTrade payables 25 4.6 4.2 4.3 4.2 4.3 4.0 4.5 4.0 5.1 4.9
50 8.2 7.5 11.2 7.9 8.2 7.5 7.7 7.3 8.4 7.6 75 13.2 12.8 21.0 19.8 13.9 14.1 12.5 11.9 12.5 11.8

Deutsche BundesbankFinancial statement statistics (ratios - provisional data)May 2021210
IV. Enterprises by federal state and economic sector
3. Berlin All economic sectors*
All legal formsEnterprises with sales of ... € million
Total Less than 2 2 but less than 10 10 but less than 50 50 and moreCylindered sample 2018/2019
Ratios 2018 2019 2018 2019 2018 2019 2018 2019 2018 2019Income statementIncome Percentage of gross revenueSales 99.1 99.0 97.9 97.6 97.8 97.7 98.9 100.2 99.2 98.9Change in finished goods 0.9 1.0 2.1 2.4 2.2 2.3 1.1 - 0.2 0.8 1.1Interest and similar income 0.3 0.4 0.3 0.2 0.1 0.1 0.2 0.2 0.3 0.4Other income 3.7 3.4 16.6 16.7 4.6 5.1 4.2 3.9 3.6 3.3
of which: Income from long-term equity investments 0.4 0.3 0.0 0.0 0.1 0.1 0.2 0.2 0.5 0.3Total income 104.0 103.8 117.0 116.9 104.7 105.3 104.4 104.0 103.9 103.6
ExpensesCost of materials 65.6 64.4 31.6 32.9 45.9 45.7 45.9 45.8 68.2 67.0Personnel expenses 17.3 18.2 43.2 41.1 31.7 31.4 31.9 32.0 15.3 16.2Depreciation 2.6 2.2 4.8 4.1 2.9 2.8 2.7 2.6 2.5 2.1
of which: Depreciation of tangible fixed assets 2.1 2.1 4.6 4.0 2.8 2.6 2.5 2.4 2.0 2.0Interest and similar expenses 0.6 0.6 1.2 0.9 0.7 0.7 0.6 0.6 0.7 0.6Operating taxes 0.0 0.0 0.2 0.2 0.1 0.1 0.1 0.0 0.0 0.0Other expenses 15.2 15.7 33.7 32.8 18.8 19.8 18.6 18.8 14.7 15.2Total expenses before taxes on income 101.3 101.1 114.6 112.0 100.2 100.5 99.8 99.9 101.4 101.2Annual result before taxes on income 2.7 2.6 2.4 4.9 4.5 4.8 4.5 4.1 2.4 2.4Taxes on income 0.6 0.6 1.7 1.6 1.4 1.4 1.1 1.0 0.6 0.5Annual result 2.0 2.1 0.7 3.3 3.1 3.3 3.4 3.1 1.9 1.9Profit and loss transfers (parent company) 0.3 0.2 0.3 0.1 0.0 0.0 0.3 0.3 0.3 0.2Profit and loss transfers (subsidiary) 1.2 1.0 - 0.2 0.0 0.3 0.5 1.4 1.2 1.3 1.0Profit for the year 1.1 1.2 1.1 3.3 2.9 2.9 2.3 2.1 0.9 1.0
Balance sheetAssets Percentage of the balance sheet totalIntangible fixed assets 1.1 1.3 2.1 1.9 3.1 2.6 1.2 1.2 1.1 1.2Tangible fixed assets 27.3 27.1 29.9 26.8 20.7 19.5 27.5 27.4 27.4 27.3
of which: Land and buildings 12.4 12.7 14.4 13.5 8.8 7.9 16.6 16.6 12.1 12.4Inventories 11.9 12.9 13.0 16.6 25.3 26.3 14.7 14.2 11.3 12.5
of which: Finished goods and merchandise 3.6 4.2 4.0 5.9 4.5 4.6 4.7 4.8 3.5 4.2Cash 7.6 6.7 23.4 20.0 16.2 17.3 15.2 15.4 6.6 5.6Receivables 34.8 34.5 26.8 30.1 30.5 29.8 33.7 34.3 35.0 34.6
Short-term 32.0 30.5 26.0 29.2 29.7 28.9 32.0 32.7 32.1 30.3 of which:
Trade receivables 8.9 8.3 11.9 13.4 13.9 13.7 12.9 12.8 8.4 7.7Receivables from affiliated companies 19.3 18.1 8.5 9.4 11.4 9.7 15.7 16.4 19.9 18.5
Long-term 2.8 4.0 0.8 0.9 0.8 0.9 1.7 1.5 2.9 4.3of which: Loans to affiliated companies 2.3 3.6 0.2 0.2 0.4 0.4 1.4 1.1 2.4 3.9
Securities 1.8 1.4 2.3 2.4 0.7 0.7 1.6 1.5 1.8 1.4Other long-term equity investments 15.2 15.8 1.6 1.4 2.7 2.9 5.4 5.3 16.5 17.1
of which: Goodwill 0.4 0.3 0.7 0.5 0.5 0.4 0.6 0.5 0.4 0.3
CapitalEquity 40.0 38.8 33.5 35.1 28.3 26.6 41.5 40.6 40.2 39.0Liabilities 43.2 45.2 60.3 58.4 59.2 61.1 45.0 46.0 42.6 44.7
Short-term 31.8 33.6 44.4 42.4 46.9 49.3 35.1 35.3 31.1 33.0of which:Liabilities to banks 1.8 1.8 10.8 9.9 6.1 6.6 3.3 3.0 1.5 1.5Trade payables 6.5 6.6 7.2 7.2 8.7 8.4 7.2 7.3 6.4 6.5Liabilities to affiliated companies 11.7 12.3 5.3 6.5 7.0 7.6 12.7 12.9 11.7 12.4
Long-term 11.4 11.7 15.9 16.0 12.3 11.7 9.9 10.7 11.5 11.7 of which:
Liabilities to banks 4.3 4.9 8.9 9.5 6.7 5.3 4.5 5.2 4.2 4.9Liabilities to affiliated companies 6.1 5.9 3.4 2.5 3.5 4.1 4.5 4.6 6.4 6.1
Provisions 15.6 14.7 5.5 5.5 11.3 11.2 11.3 11.2 16.1 15.2of which: Provisions for pensions 3.2 3.2 0.5 0.4 2.1 2.1 2.3 2.4 3.3 3.3
Other ratios Percentage of salesAnnual result before taxes on income 2.7 2.7 2.4 5.0 4.6 4.9 4.6 4.1 2.5 2.4Annual result and depreciation 4.6 4.3 5.6 7.6 6.2 6.3 6.2 5.7 4.4 4.1Trade receivables 7.0 6.8 11.0 11.8 10.3 9.9 9.3 9.1 6.7 6.4
Percentage of the balance sheet totalSales 127.2 122.3 107.6 112.8 135.3 137.4 138.7 140.7 126.0 120.3Annual result and interest paid 3.4 3.3 2.0 4.8 5.3 5.7 5.6 5.1 3.2 3.1
Percentage of liabilities and provisions less cashAnnual result and depreciation 11.2 9.7 14.0 19.0 15.1 15.4 20.0 18.2 10.5 8.9
Percentage of fixed assetsLong-term equity and liabilities 115.2 109.4 136.8 155.7 154.8 154.4 145.5 146.4 112.5 106.2
Percentage of short-term liabilitiesCash resources and short-term receivables 127.0 112.1 111.9 116.7 98.5 94.6 135.9 137.2 127.1 110.2Cash resources, short-term receivables and inventories 164.4 150.6 141.2 155.9 152.3 147.9 177.6 177.4 163.6 148.0
Percentage of cost of materialsTrade payables 7.7 8.3 20.8 18.9 13.7 13.0 11.2 11.3 7.4 8.0
Memo item:Balance sheet total in € billion 87.79 93.05 0.39 0.44 1.72 1.88 7.42 7.93 78.27 82.80Sales in € billion 111.64 113.84 0.42 0.49 2.32 2.59 10.29 11.16 98.62 99.60Number of enterprises 1 708 1 708 527 527 484 484 464 464 233 233
* Agriculture, forestry and fishing, mining and quarrying, manufacturing, electricity, gas and water supply, construction, trade, transportation and storage,accommodation and food service activities, information and communication, business services, personal service activities
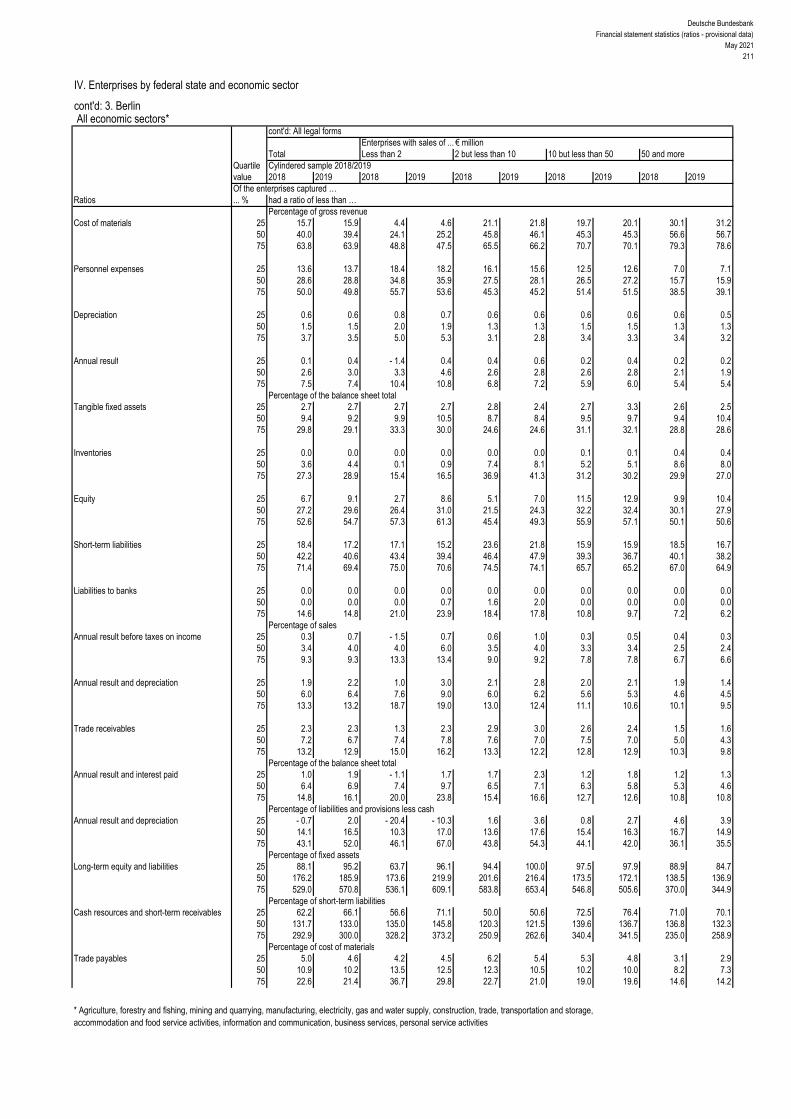
Deutsche BundesbankFinancial statement statistics (ratios - provisional data)
May 2021211
IV. Enterprises by federal state and economic sector
cont'd: 3. Berlin All economic sectors*
cont'd: All legal formsEnterprises with sales of ... € million
Total Less than 2 2 but less than 10 10 but less than 50 50 and moreQuartile Cylindered sample 2018/2019value 2018 2019 2018 2019 2018 2019 2018 2019 2018 2019Of the enterprises captured …
Ratios ... % had a ratio of less than …Percentage of gross revenue
Cost of materials 25 15.7 15.9 4.4 4.6 21.1 21.8 19.7 20.1 30.1 31.2 50 40.0 39.4 24.1 25.2 45.8 46.1 45.3 45.3 56.6 56.7 75 63.8 63.9 48.8 47.5 65.5 66.2 70.7 70.1 79.3 78.6
Personnel expenses 25 13.6 13.7 18.4 18.2 16.1 15.6 12.5 12.6 7.0 7.1 50 28.6 28.8 34.8 35.9 27.5 28.1 26.5 27.2 15.7 15.9 75 50.0 49.8 55.7 53.6 45.3 45.2 51.4 51.5 38.5 39.1
Depreciation 25 0.6 0.6 0.8 0.7 0.6 0.6 0.6 0.6 0.6 0.5 50 1.5 1.5 2.0 1.9 1.3 1.3 1.5 1.5 1.3 1.3 75 3.7 3.5 5.0 5.3 3.1 2.8 3.4 3.3 3.4 3.2
Annual result 25 0.1 0.4 - 1.4 0.4 0.4 0.6 0.2 0.4 0.2 0.2 50 2.6 3.0 3.3 4.6 2.6 2.8 2.6 2.8 2.1 1.9 75 7.5 7.4 10.4 10.8 6.8 7.2 5.9 6.0 5.4 5.4
Percentage of the balance sheet totalTangible fixed assets 25 2.7 2.7 2.7 2.7 2.8 2.4 2.7 3.3 2.6 2.5
50 9.4 9.2 9.9 10.5 8.7 8.4 9.5 9.7 9.4 10.4 75 29.8 29.1 33.3 30.0 24.6 24.6 31.1 32.1 28.8 28.6
Inventories 25 0.0 0.0 0.0 0.0 0.0 0.0 0.1 0.1 0.4 0.4 50 3.6 4.4 0.1 0.9 7.4 8.1 5.2 5.1 8.6 8.0 75 27.3 28.9 15.4 16.5 36.9 41.3 31.2 30.2 29.9 27.0
Equity 25 6.7 9.1 2.7 8.6 5.1 7.0 11.5 12.9 9.9 10.4 50 27.2 29.6 26.4 31.0 21.5 24.3 32.2 32.4 30.1 27.9 75 52.6 54.7 57.3 61.3 45.4 49.3 55.9 57.1 50.1 50.6
Short-term liabilities 25 18.4 17.2 17.1 15.2 23.6 21.8 15.9 15.9 18.5 16.7 50 42.2 40.6 43.4 39.4 46.4 47.9 39.3 36.7 40.1 38.2 75 71.4 69.4 75.0 70.6 74.5 74.1 65.7 65.2 67.0 64.9
Liabilities to banks 25 0.0 0.0 0.0 0.0 0.0 0.0 0.0 0.0 0.0 0.0 50 0.0 0.0 0.0 0.7 1.6 2.0 0.0 0.0 0.0 0.0 75 14.6 14.8 21.0 23.9 18.4 17.8 10.8 9.7 7.2 6.2
Percentage of salesAnnual result before taxes on income 25 0.3 0.7 - 1.5 0.7 0.6 1.0 0.3 0.5 0.4 0.3
50 3.4 4.0 4.0 6.0 3.5 4.0 3.3 3.4 2.5 2.4 75 9.3 9.3 13.3 13.4 9.0 9.2 7.8 7.8 6.7 6.6
Annual result and depreciation 25 1.9 2.2 1.0 3.0 2.1 2.8 2.0 2.1 1.9 1.4 50 6.0 6.4 7.6 9.0 6.0 6.2 5.6 5.3 4.6 4.5 75 13.3 13.2 18.7 19.0 13.0 12.4 11.1 10.6 10.1 9.5
Trade receivables 25 2.3 2.3 1.3 2.3 2.9 3.0 2.6 2.4 1.5 1.6 50 7.2 6.7 7.4 7.8 7.6 7.0 7.5 7.0 5.0 4.3 75 13.2 12.9 15.0 16.2 13.3 12.2 12.8 12.9 10.3 9.8
Percentage of the balance sheet totalAnnual result and interest paid 25 1.0 1.9 - 1.1 1.7 1.7 2.3 1.2 1.8 1.2 1.3
50 6.4 6.9 7.4 9.7 6.5 7.1 6.3 5.8 5.3 4.6 75 14.8 16.1 20.0 23.8 15.4 16.6 12.7 12.6 10.8 10.8
Percentage of liabilities and provisions less cashAnnual result and depreciation 25 - 0.7 2.0 - 20.4 - 10.3 1.6 3.6 0.8 2.7 4.6 3.9
50 14.1 16.5 10.3 17.0 13.6 17.6 15.4 16.3 16.7 14.9 75 43.1 52.0 46.1 67.0 43.8 54.3 44.1 42.0 36.1 35.5
Percentage of fixed assetsLong-term equity and liabilities 25 88.1 95.2 63.7 96.1 94.4 100.0 97.5 97.9 88.9 84.7
50 176.2 185.9 173.6 219.9 201.6 216.4 173.5 172.1 138.5 136.9 75 529.0 570.8 536.1 609.1 583.8 653.4 546.8 505.6 370.0 344.9
Percentage of short-term liabilitiesCash resources and short-term receivables 25 62.2 66.1 56.6 71.1 50.0 50.6 72.5 76.4 71.0 70.1
50 131.7 133.0 135.0 145.8 120.3 121.5 139.6 136.7 136.8 132.3 75 292.9 300.0 328.2 373.2 250.9 262.6 340.4 341.5 235.0 258.9
Percentage of cost of materialsTrade payables 25 5.0 4.6 4.2 4.5 6.2 5.4 5.3 4.8 3.1 2.9
50 10.9 10.2 13.5 12.5 12.3 10.5 10.2 10.0 8.2 7.3 75 22.6 21.4 36.7 29.8 22.7 21.0 19.0 19.6 14.6 14.2
* Agriculture, forestry and fishing, mining and quarrying, manufacturing, electricity, gas and water supply, construction, trade, transportation and storage,accommodation and food service activities, information and communication, business services, personal service activities

Deutsche BundesbankFinancial statement statistics (ratios - provisional data)May 2021212
IV. Enterprises by federal state and economic sector
4. Brandenburg All economic sectors*
All legal formsEnterprises with sales of ... € million
Total Less than 2 2 but less than 10 10 but less than 50 50 and moreCylindered sample 2018/2019
Ratios 2018 2019 2018 2019 2018 2019 2018 2019 2018 2019Income statementIncome Percentage of gross revenueSales 99.8 100.5 98.7 98.9 98.2 99.0 98.4 99.2 100.5 101.1Change in finished goods 0.2 - 0.5 1.3 1.1 1.8 1.0 1.6 0.8 - 0.5 - 1.1Interest and similar income 0.3 0.2 0.2 0.2 0.2 0.2 0.3 0.2 0.3 0.2Other income 3.3 3.2 12.0 12.8 5.3 5.2 3.5 3.3 2.9 2.7
of which: Income from long-term equity investments 0.2 0.3 0.1 0.1 0.1 0.2 0.3 0.3 0.2 0.3Total income 103.6 103.4 112.2 113.0 105.5 105.4 103.8 103.5 103.1 103.0
ExpensesCost of materials 57.6 57.8 39.0 39.0 48.0 48.1 51.6 51.3 60.9 61.3Personnel expenses 19.7 19.7 36.6 37.0 28.7 28.2 26.9 27.2 16.1 15.9Depreciation 4.2 3.9 6.2 6.2 5.6 5.5 5.0 4.9 3.8 3.3
of which: Depreciation of tangible fixed assets 3.9 3.8 6.2 6.2 5.5 5.4 4.9 4.8 3.4 3.3Interest and similar expenses 0.9 0.8 1.6 1.5 1.4 1.3 1.0 1.0 0.9 0.7Operating taxes 0.1 0.1 0.2 0.2 0.2 0.1 0.1 0.1 0.1 0.1Other expenses 15.3 15.1 23.8 22.7 17.2 16.9 14.2 14.0 15.3 15.0Total expenses before taxes on income 97.9 97.3 107.5 106.6 101.0 100.1 98.8 98.5 97.1 96.4Annual result before taxes on income 5.7 6.1 4.7 6.4 4.5 5.3 5.0 5.0 6.1 6.5Taxes on income 0.9 1.0 1.3 1.4 1.2 1.3 1.1 1.1 0.8 0.9Annual result 4.8 5.1 3.3 5.0 3.3 4.0 3.9 3.9 5.2 5.6Profit and loss transfers (parent company) 0.2 0.3 0.1 - 0.1 0.2 0.1 0.0 0.3 0.2 0.4Profit and loss transfers (subsidiary) 2.7 2.6 - 0.2 - 0.2 0.1 0.2 0.6 0.9 3.7 3.5Profit for the year 2.2 2.9 3.6 5.1 3.4 3.9 3.3 3.4 1.7 2.5
Balance sheetAssets Percentage of the balance sheet totalIntangible fixed assets 1.5 1.3 0.4 0.4 0.3 0.3 0.6 0.6 1.9 1.8Tangible fixed assets 39.7 38.1 53.4 52.7 50.1 49.7 45.2 43.7 36.0 34.3
of which: Land and buildings 15.3 14.9 26.7 27.6 19.9 20.5 16.0 15.8 14.2 13.5Inventories 12.5 12.8 12.8 13.1 17.2 17.3 14.8 15.4 11.0 11.4
of which: Finished goods and merchandise 4.0 3.9 3.6 2.9 6.2 6.6 4.2 4.5 3.7 3.4Cash 12.5 12.3 13.0 12.3 10.5 10.4 9.8 9.7 13.7 13.3Receivables 27.1 27.8 16.3 17.4 19.0 19.2 20.0 21.2 30.8 31.4
Short-term 24.2 25.2 15.9 16.7 18.4 18.6 19.2 20.4 26.9 27.9 of which:
Trade receivables 7.6 7.5 7.7 8.4 7.3 7.9 8.2 8.4 7.5 7.2Receivables from affiliated companies 14.5 15.5 3.8 3.6 8.2 7.9 8.2 9.4 17.7 18.9
Long-term 2.8 2.6 0.4 0.7 0.6 0.6 0.8 0.9 3.9 3.4of which: Loans to affiliated companies 2.6 2.4 0.1 0.5 0.2 0.2 0.5 0.6 3.7 3.3
Securities 1.9 1.9 0.5 0.5 0.2 0.2 6.3 6.1 0.8 0.9Other long-term equity investments 4.4 5.4 3.1 3.2 1.8 2.1 2.9 2.9 5.4 6.7
of which: Goodwill 0.4 0.4 0.5 0.6 0.2 0.2 0.6 0.5 0.3 0.4
CapitalEquity 41.8 40.9 30.7 30.7 33.1 33.3 43.6 44.1 42.8 41.2Liabilities 39.8 39.9 64.3 64.1 62.3 61.9 44.4 43.9 34.5 34.9
Short-term 28.7 28.3 32.8 33.0 31.2 30.0 28.8 29.2 28.1 27.5of which:Liabilities to banks 3.1 3.0 8.6 8.2 6.6 6.8 4.8 4.7 2.0 1.9Trade payables 6.1 5.6 5.8 5.9 5.7 5.4 5.4 5.3 6.5 5.7Liabilities to affiliated companies 9.8 10.9 6.2 7.0 6.7 5.6 8.3 8.1 10.7 12.6
Long-term 11.1 11.6 31.5 31.2 31.1 31.9 15.6 14.7 6.4 7.4 of which:
Liabilities to banks 8.0 7.8 20.4 20.2 20.6 19.7 10.9 10.3 4.9 5.0Liabilities to affiliated companies 2.5 3.3 9.8 9.5 9.2 11.2 4.1 4.0 1.0 1.9
Provisions 17.9 18.3 3.9 4.1 4.2 4.2 11.4 11.4 22.3 22.8of which: Provisions for pensions 1.6 1.6 0.3 0.4 0.5 0.5 0.8 0.8 2.0 2.1
Other ratios Percentage of salesAnnual result before taxes on income 5.7 6.1 4.7 6.5 4.6 5.3 5.1 5.0 6.0 6.5Annual result and depreciation 9.0 9.0 9.7 11.4 9.0 9.6 9.1 8.9 9.0 8.9Trade receivables 7.2 7.1 9.6 10.0 8.5 8.5 7.8 7.9 6.8 6.6
Percentage of the balance sheet totalSales 106.1 105.8 80.3 84.0 85.7 92.1 104.8 106.5 110.2 108.0Annual result and interest paid 6.1 6.3 4.0 5.5 4.1 5.0 5.3 5.3 6.7 6.8
Percentage of liabilities and provisions less cashAnnual result and depreciation 21.0 20.3 13.8 16.8 13.6 15.7 20.4 20.4 22.8 21.1
Percentage of fixed assetsLong-term equity and liabilities 108.5 110.4 108.9 108.8 122.2 124.6 107.8 110.4 106.9 108.4
Percentage of short-term liabilitiesCash resources and short-term receivables 128.3 133.6 88.8 88.5 93.4 97.3 101.4 103.9 144.6 150.8Cash resources, short-term receivables and inventories 171.8 178.9 127.9 128.2 148.6 155.0 152.8 156.5 183.9 192.1
Percentage of cost of materialsTrade payables 10.0 9.2 18.2 17.7 13.7 12.0 9.7 9.6 9.7 8.7
Memo item:Balance sheet total in € billion 29.60 31.16 0.49 0.51 2.86 2.91 6.48 6.72 19.78 21.03Sales in € billion 31.42 32.98 0.39 0.43 2.45 2.68 6.79 7.15 21.79 22.72Number of enterprises 1 390 1 390 459 459 517 517 302 302 112 112
* Agriculture, forestry and fishing, mining and quarrying, manufacturing, electricity, gas and water supply, construction, trade, transportation and storage,accommodation and food service activities, information and communication, business services, personal service activities

Deutsche BundesbankFinancial statement statistics (ratios - provisional data)
May 2021213
IV. Enterprises by federal state and economic sector
cont'd: 4. Brandenburg All economic sectors*
cont'd: All legal formsEnterprises with sales of ... € million
Total Less than 2 2 but less than 10 10 but less than 50 50 and moreQuartile Cylindered sample 2018/2019value 2018 2019 2018 2019 2018 2019 2018 2019 2018 2019Of the enterprises captured …
Ratios ... % had a ratio of less than …Percentage of gross revenue
Cost of materials 25 23.0 21.8 11.4 10.9 28.0 26.8 27.0 27.1 38.1 37.3 50 45.5 45.0 36.1 33.1 47.4 46.7 55.0 55.4 63.7 64.1 75 66.6 65.9 55.5 54.7 64.9 64.1 73.1 72.4 79.4 78.4
Personnel expenses 25 12.1 12.3 13.1 14.2 13.8 13.7 11.8 12.3 7.0 6.9 50 26.0 26.2 31.8 32.6 26.4 26.3 21.2 21.7 13.1 12.6 75 41.8 42.1 46.7 47.9 39.6 38.9 40.7 41.3 24.8 25.8
Depreciation 25 1.2 1.2 1.1 1.1 1.2 1.2 1.2 1.2 1.1 1.1 50 2.8 2.7 2.9 3.0 2.6 2.4 2.6 2.6 2.5 2.1 75 6.6 6.6 8.9 8.5 6.7 6.6 5.9 5.8 5.5 5.1
Annual result 25 0.4 0.7 - 0.2 0.6 0.7 0.9 0.8 0.9 0.0 0.1 50 2.6 3.1 2.9 4.0 2.8 3.0 2.4 2.7 1.9 1.8 75 6.8 7.3 9.2 9.8 6.1 7.1 6.2 5.7 6.1 5.8
Percentage of the balance sheet totalTangible fixed assets 25 8.7 9.1 7.0 7.1 10.1 9.6 9.1 10.0 8.4 8.5
50 28.9 28.0 26.8 24.8 28.8 28.1 33.0 31.3 29.4 28.6 75 58.9 58.8 59.5 58.2 59.0 60.4 58.2 56.9 58.6 59.8
Inventories 25 0.2 0.2 0.0 0.0 0.8 0.7 0.5 0.5 1.2 0.8 50 8.7 7.8 3.5 3.8 10.8 9.8 13.1 13.4 8.2 8.2 75 29.8 29.3 20.9 21.3 33.4 31.7 33.1 35.2 32.7 29.7
Equity 25 12.1 13.5 7.9 10.6 13.1 13.6 15.2 16.9 10.9 18.3 50 32.8 34.3 29.5 30.6 33.3 33.4 34.3 35.2 38.9 40.3 75 55.5 57.7 53.5 57.6 55.5 57.2 58.7 59.9 59.5 57.9
Short-term liabilities 25 15.4 15.1 14.7 13.9 15.6 15.1 14.5 13.8 17.3 16.8 50 32.9 31.8 31.0 31.9 33.5 30.7 34.0 34.0 34.7 31.9 75 62.9 58.6 64.6 58.1 59.1 57.2 65.9 59.0 65.7 61.8
Liabilities to banks 25 0.0 0.0 0.0 0.0 0.1 0.1 0.0 0.0 0.0 0.0 50 9.0 9.4 7.6 9.3 12.1 12.4 8.1 6.1 0.8 0.6 75 34.3 35.0 39.4 39.8 35.4 36.9 28.1 28.0 22.8 20.1
Percentage of salesAnnual result before taxes on income 25 0.6 1.0 - 0.2 0.9 0.9 1.1 1.0 1.1 0.2 0.2
50 3.4 3.9 3.8 4.9 3.6 3.8 3.0 3.3 2.4 1.9 75 8.8 9.3 11.3 12.2 8.1 8.7 7.4 7.1 7.4 7.1
Annual result and depreciation 25 3.1 3.8 2.8 4.2 3.6 3.9 3.1 3.2 2.5 2.0 50 7.3 7.9 7.6 9.7 7.7 7.9 7.0 7.2 6.0 5.2 75 14.9 15.6 18.5 21.6 13.8 15.0 13.7 13.1 12.1 11.9
Trade receivables 25 3.0 2.8 2.2 1.9 3.5 3.6 2.8 2.7 2.9 2.6 50 6.9 6.9 6.8 7.2 7.1 7.0 6.7 6.3 7.3 6.7 75 11.8 11.9 13.4 13.5 11.4 10.9 11.2 11.2 11.6 12.1
Percentage of the balance sheet totalAnnual result and interest paid 25 1.7 2.2 0.6 2.1 2.2 2.5 2.0 2.1 0.8 0.9
50 5.1 5.8 5.4 6.9 5.8 6.2 4.7 4.9 3.7 5.2 75 10.9 12.0 13.7 15.9 10.9 11.6 9.6 9.5 9.1 8.9
Percentage of liabilities and provisions less cashAnnual result and depreciation 25 4.3 5.8 - 0.8 2.9 4.9 5.7 6.9 7.5 6.3 10.7
50 16.2 17.6 13.4 15.9 15.9 17.0 20.3 20.8 20.2 18.6 75 41.4 43.0 39.0 47.0 43.6 41.0 43.7 46.0 35.3 38.7
Percentage of fixed assetsLong-term equity and liabilities 25 90.5 91.7 79.7 83.4 96.9 97.6 87.8 90.4 82.4 83.5
50 130.8 130.4 131.0 132.4 145.8 141.9 122.9 121.8 121.2 117.4 75 260.6 283.7 275.6 292.1 287.5 311.6 221.3 225.3 178.8 190.6
Percentage of short-term liabilitiesCash resources and short-term receivables 25 51.2 53.4 51.2 52.7 50.0 53.0 52.4 55.2 57.4 55.7
50 114.6 116.0 123.4 134.3 112.4 114.0 106.0 104.4 114.0 113.7 75 227.8 248.9 304.6 314.4 223.9 236.0 193.1 215.7 180.3 194.1
Percentage of cost of materialsTrade payables 25 5.1 4.7 4.5 4.0 5.6 5.4 5.1 4.7 4.1 3.9
50 10.3 9.4 11.4 10.7 10.8 9.4 8.9 9.0 8.5 8.3 75 20.5 18.0 32.2 29.2 21.0 18.3 15.7 14.6 15.2 12.5
* Agriculture, forestry and fishing, mining and quarrying, manufacturing, electricity, gas and water supply, construction, trade, transportation and storage,accommodation and food service activities, information and communication, business services, personal service activities

Deutsche BundesbankFinancial statement statistics (ratios - provisional data)May 2021214
IV. Enterprises by federal state and economic sector
5. Bremen All economic sectors*
All legal formsEnterprises with sales of ... € million
Total Less than 2 2 but less than 10 10 but less than 50 50 and moreCylindered sample 2018/2019
Ratios 2018 2019 2018 2019 2018 2019 2018 2019 2018 2019Income statementIncome Percentage of gross revenueSales 99.6 100.0 100.3 98.8 99.9 100.6 101.9 100.5 99.4 99.9Change in finished goods 0.4 0.0 - 0.3 1.2 0.1 - 0.6 - 1.9 - 0.5 0.6 0.1Interest and similar income 0.1 0.1 0.1 0.1 0.1 0.1 0.2 0.1 0.1 0.1Other income 3.0 3.0 2.4 2.5 3.1 2.9 3.9 2.6 2.9 3.0
of which: Income from long-term equity investments 0.2 0.7 0.0 0.0 0.1 0.1 0.3 0.3 0.2 0.7Total income 103.1 103.1 102.5 102.6 103.2 103.0 104.1 102.7 103.0 103.1
ExpensesCost of materials 74.0 75.2 30.0 32.1 53.4 53.3 58.0 56.7 76.0 77.3Personnel expenses 14.3 13.7 23.0 25.0 26.4 27.2 24.0 24.8 13.0 12.5Depreciation 2.1 2.0 16.7 15.6 3.5 3.7 2.1 2.2 2.1 2.0
of which: Depreciation of tangible fixed assets 2.0 1.9 16.6 15.5 3.4 3.6 2.0 1.9 2.0 1.8Interest and similar expenses 0.8 0.7 2.3 2.0 1.2 1.1 0.6 0.6 0.8 0.8Operating taxes 0.0 0.0 0.0 0.1 0.1 0.1 0.1 0.1 0.0 0.0Other expenses 9.3 8.7 15.9 17.5 15.4 15.4 14.3 14.4 8.7 8.1Total expenses before taxes on income 100.5 100.4 87.8 92.3 100.0 100.8 99.1 98.6 100.7 100.6Annual result before taxes on income 2.5 2.6 14.7 10.3 3.2 2.1 5.0 4.1 2.3 2.5Taxes on income 0.5 0.6 2.0 2.2 1.1 0.9 1.0 1.2 0.4 0.5Annual result 2.0 2.1 12.7 8.1 2.1 1.3 4.0 2.9 1.8 2.0Profit and loss transfers (parent company) 0.1 0.1 - 0.3 - 0.3 0.1 0.1 - 0.2 0.5 0.1 0.1Profit and loss transfers (subsidiary) 0.5 0.1 0.1 - 0.5 - 0.2 - 0.3 0.9 1.1 0.4 0.0Profit for the year 1.7 2.1 12.2 8.4 2.4 1.6 2.9 2.3 1.5 2.1
Balance sheetAssets Percentage of the balance sheet totalIntangible fixed assets 1.0 1.0 0.1 0.1 1.0 0.9 0.7 0.8 1.1 1.0Tangible fixed assets 36.6 34.9 77.1 77.7 47.4 46.8 23.3 23.1 37.6 35.7
of which: Land and buildings 9.2 10.3 2.1 0.7 16.2 15.0 14.2 14.3 8.5 9.7Inventories 18.9 17.2 3.0 3.5 18.0 16.9 22.7 22.2 18.6 16.8
of which: Finished goods and merchandise 7.8 7.5 2.0 2.0 12.0 11.5 13.4 13.0 7.1 6.9Cash 4.2 3.9 7.6 7.7 9.5 8.9 9.7 10.1 3.5 3.1Receivables 34.0 36.8 8.8 7.8 21.0 23.4 38.1 38.8 34.0 36.9
Short-term 33.1 35.9 8.6 7.7 19.8 22.1 34.9 35.8 33.3 36.3 of which:
Trade receivables 16.4 15.8 2.3 2.9 12.3 12.9 18.9 18.3 16.3 15.7Receivables from affiliated companies 11.9 15.1 4.1 2.2 5.4 7.1 12.7 14.1 12.0 15.5
Long-term 0.9 0.9 0.2 0.1 1.2 1.2 3.2 3.0 0.7 0.6of which: Loans to affiliated companies 0.6 0.6 0.0 0.0 0.9 1.0 1.9 1.6 0.4 0.4
Securities 0.5 0.6 0.0 0.0 0.1 0.1 0.6 0.7 0.5 0.6Other long-term equity investments 4.3 5.2 0.2 0.1 2.2 2.2 4.5 3.9 4.3 5.4
of which: Goodwill 0.2 0.2 0.0 0.0 0.4 0.5 0.2 0.2 0.2 0.2
CapitalEquity 25.6 26.6 40.4 40.3 32.7 31.7 40.0 40.1 23.8 25.0Liabilities 55.0 53.8 55.9 55.6 60.1 61.3 49.9 49.3 55.5 54.1
Short-term 34.8 34.7 34.2 35.0 33.3 34.4 41.9 40.6 34.1 34.1of which:Liabilities to banks 5.2 5.2 2.0 2.2 12.0 11.0 7.6 6.9 4.8 4.9Trade payables 8.5 7.7 1.3 1.1 6.7 6.0 8.7 8.6 8.6 7.7Liabilities to affiliated companies 11.1 11.2 28.0 27.5 9.4 11.8 15.2 16.9 10.6 10.5
Long-term 20.2 19.1 21.7 20.6 26.8 26.9 8.0 8.7 21.4 20.0 of which:
Liabilities to banks 7.2 8.9 19.1 18.0 23.9 24.2 4.8 4.5 7.1 9.0Liabilities to affiliated companies 9.5 7.0 2.6 2.6 2.2 2.2 2.4 3.5 10.5 7.5
Provisions 18.9 19.3 2.9 3.2 6.7 6.5 9.3 9.7 20.3 20.7of which: Provisions for pensions 7.5 7.6 0.2 0.2 1.1 1.1 2.1 2.2 8.2 8.4
Other ratios Percentage of salesAnnual result before taxes on income 2.6 2.6 14.6 10.4 3.2 2.1 4.9 4.1 2.3 2.5Annual result and depreciation 4.2 4.1 29.3 24.0 5.6 5.0 6.0 5.1 3.9 4.0Trade receivables 9.5 8.8 6.3 7.3 8.7 9.1 11.4 11.1 9.3 8.6
Percentage of the balance sheet totalSales 172.6 180.4 37.1 39.5 141.7 142.7 166.0 165.0 174.7 183.5Annual result and interest paid 4.9 5.1 5.5 4.0 4.7 3.3 7.5 5.7 4.6 5.1
Percentage of liabilities and provisions less cashAnnual result and depreciation 10.3 10.6 20.9 18.3 13.8 11.9 19.8 16.7 9.5 10.1
Percentage of fixed assetsLong-term equity and liabilities 123.3 125.6 80.2 78.4 116.8 116.6 156.5 163.7 121.2 123.3
Percentage of short-term liabilitiesCash resources and short-term receivables 107.3 115.0 47.5 44.1 88.3 90.5 107.3 113.8 108.0 116.0Cash resources, short-term receivables and inventories 161.6 164.8 56.2 54.0 142.4 139.7 161.6 168.4 162.5 165.2
Percentage of cost of materialsTrade payables 6.6 5.7 11.8 8.7 8.8 7.9 9.2 9.2 6.4 5.4
Memo item:Balance sheet total in € billion 20.58 21.65 0.10 0.09 0.40 0.41 1.98 2.03 18.10 19.12Sales in € billion 35.52 39.06 0.04 0.04 0.57 0.58 3.30 3.35 31.62 35.09Number of enterprises 394 394 39 39 100 100 141 141 114 114
* Agriculture, forestry and fishing, mining and quarrying, manufacturing, electricity, gas and water supply, construction, trade, transportation and storage,accommodation and food service activities, information and communication, business services, personal service activities

Deutsche BundesbankFinancial statement statistics (ratios - provisional data)
May 2021215
IV. Enterprises by federal state and economic sector
cont'd: 5. Bremen All economic sectors*
cont'd: All legal formsEnterprises with sales of ... € million
Total Less than 2 2 but less than 10 10 but less than 50 50 and moreQuartile Cylindered sample 2018/2019value 2018 2019 2018 2019 2018 2019 2018 2019 2018 2019Of the enterprises captured …
Ratios ... % had a ratio of less than …Percentage of gross revenue
Cost of materials 25 31.3 30.8 2.0 4.5 28.7 28.5 40.4 37.1 53.1 52.6 50 61.0 60.2 19.2 30.4 51.2 52.2 62.0 61.4 73.8 72.7 75 78.3 78.0 49.6 51.1 74.6 74.8 77.4 76.3 83.9 83.4
Personnel expenses 25 7.7 8.1 0.0 0.0 12.3 12.4 9.7 11.5 4.8 4.8 50 17.2 17.7 17.0 23.1 27.4 27.2 18.0 18.9 11.4 12.5 75 35.4 36.3 41.5 41.7 40.9 43.2 34.0 34.1 25.2 22.1
Depreciation 25 0.5 0.5 0.8 1.3 0.6 0.8 0.6 0.6 0.3 0.4 50 1.4 1.5 2.8 2.8 1.4 1.5 1.3 1.4 1.1 1.1 75 3.0 3.1 23.5 25.7 2.8 3.6 2.3 2.6 2.7 2.5
Annual result 25 0.5 0.3 0.7 0.8 0.3 0.2 0.5 0.2 0.3 0.4 50 2.4 2.1 3.6 4.6 2.7 2.0 2.2 2.0 2.0 2.1 75 5.7 5.3 12.6 15.4 5.5 4.7 5.7 5.1 3.8 4.9
Percentage of the balance sheet totalTangible fixed assets 25 2.3 2.3 2.0 1.8 3.6 3.5 2.6 2.8 1.5 1.5
50 11.9 11.0 25.0 16.9 14.0 11.8 9.6 11.0 11.0 8.7 75 34.7 31.1 71.4 70.4 37.7 32.0 28.3 26.2 32.0 30.8
Inventories 25 0.7 0.5 0.0 0.0 0.8 0.4 2.1 3.0 1.2 1.1 50 14.5 13.5 0.0 0.0 13.1 13.3 22.5 24.4 14.7 14.5 75 40.8 41.0 15.8 11.4 42.9 38.2 44.3 43.5 40.8 41.0
Equity 25 13.8 13.2 8.7 4.7 15.8 14.8 13.5 15.0 13.2 11.5 50 30.4 30.4 37.7 33.7 30.5 28.5 32.6 32.2 28.5 26.2 75 48.7 51.5 68.2 67.2 48.8 55.0 53.9 54.5 42.7 44.1
Short-term liabilities 25 19.6 17.5 7.3 7.8 19.8 16.4 19.4 20.8 25.4 22.8 50 41.7 39.6 27.3 15.6 35.6 31.9 47.1 43.2 44.3 45.6 75 65.1 66.0 65.1 71.0 57.7 64.3 65.8 66.0 66.8 66.0
Liabilities to banks 25 0.0 0.0 0.0 0.0 0.0 0.0 0.0 0.0 0.0 0.0 50 0.8 0.8 0.0 0.0 12.4 13.4 0.5 0.0 0.0 0.0 75 26.7 26.2 17.3 19.2 47.9 43.9 21.0 21.7 19.2 21.5
Percentage of salesAnnual result before taxes on income 25 0.6 0.4 0.9 1.2 0.3 0.3 0.8 0.4 0.6 0.6
50 2.9 2.8 3.6 5.1 3.3 2.8 3.1 2.7 2.4 2.5 75 7.3 6.8 16.8 15.5 7.7 6.5 7.4 6.8 5.8 5.4
Annual result and depreciation 25 1.9 1.7 3.6 4.2 2.3 1.7 2.0 1.7 1.4 1.3 50 5.1 4.7 8.9 8.9 6.2 6.2 5.1 4.4 4.2 4.1 75 9.9 10.0 47.0 22.3 9.7 10.3 9.5 8.0 9.0 8.8
Trade receivables 25 4.0 3.7 0.1 0.1 4.5 3.8 4.5 3.8 3.9 4.3 50 8.2 7.8 5.2 5.9 7.9 8.0 8.4 7.3 9.2 9.0 75 12.8 12.4 10.9 12.6 12.8 12.9 12.8 12.0 13.3 11.4
Percentage of the balance sheet totalAnnual result and interest paid 25 2.1 1.8 2.0 1.6 1.9 2.2 2.3 1.3 2.0 2.3
50 5.9 5.9 3.5 6.3 6.8 6.3 7.0 5.3 5.0 5.7 75 12.3 12.6 7.1 12.6 14.5 12.7 13.7 14.1 9.4 10.6
Percentage of liabilities and provisions less cashAnnual result and depreciation 25 4.7 4.3 - 3.0 - 5.6 2.6 3.8 5.1 6.1 6.0 4.5
50 14.6 15.5 11.9 13.6 17.8 18.6 18.2 19.0 12.2 13.6 75 37.6 36.5 30.1 31.1 44.0 40.5 45.9 42.3 27.2 30.6
Percentage of fixed assetsLong-term equity and liabilities 25 100.2 98.5 51.1 49.1 104.7 100.0 102.6 114.0 103.4 100.1
50 188.2 200.0 110.6 96.3 215.8 212.1 218.3 226.9 172.2 184.1 75 506.3 511.1 240.4 297.3 630.0 816.4 614.1 492.9 382.5 475.5
Percentage of short-term liabilitiesCash resources and short-term receivables 25 58.6 63.6 59.5 45.5 58.2 68.4 55.9 64.6 66.9 63.5
50 110.7 114.6 145.1 132.4 103.9 109.8 110.7 113.4 108.8 114.1 75 219.4 237.9 710.3 459.0 222.1 287.2 219.0 227.7 189.9 183.4
Percentage of cost of materialsTrade payables 25 3.1 2.8 0.9 0.0 4.1 2.6 3.5 3.4 2.9 2.8
50 7.4 6.6 3.2 4.4 8.4 6.7 6.5 6.6 7.8 7.0 75 11.8 11.0 15.3 11.0 13.6 12.5 10.8 10.4 10.8 11.2
* Agriculture, forestry and fishing, mining and quarrying, manufacturing, electricity, gas and water supply, construction, trade, transportation and storage,accommodation and food service activities, information and communication, business services, personal service activities

Deutsche BundesbankFinancial statement statistics (ratios - provisional data)May 2021216
IV. Enterprises by federal state and economic sector
6. Hamburg All economic sectors*
All legal formsEnterprises with sales of ... € million
Total Less than 2 2 but less than 10 10 but less than 50 50 and moreCylindered sample 2018/2019
Ratios 2018 2019 2018 2019 2018 2019 2018 2019 2018 2019Income statementIncome Percentage of gross revenueSales 99.7 99.8 98.5 99.2 98.9 99.5 99.1 99.3 99.8 99.8Change in finished goods 0.3 0.2 1.5 0.8 1.1 0.5 0.9 0.7 0.2 0.2Interest and similar income 0.2 0.2 0.2 0.2 0.2 0.2 0.2 0.2 0.2 0.2Other income 3.2 2.7 4.6 4.9 4.2 3.9 3.7 3.9 3.2 2.6
of which: Income from long-term equity investments 0.7 0.7 0.3 0.5 0.6 0.5 0.5 0.4 0.7 0.7Total income 103.4 102.9 104.9 105.1 104.4 104.1 103.9 104.1 103.4 102.8
ExpensesCost of materials 82.4 81.6 32.2 32.9 49.0 48.0 57.6 57.6 83.9 83.1Personnel expenses 7.2 7.2 33.5 32.5 26.7 27.1 23.2 23.2 6.2 6.3Depreciation 1.6 1.6 7.5 6.9 3.4 3.6 2.7 3.1 1.5 1.5
of which: Depreciation of tangible fixed assets 1.5 1.5 6.9 6.8 3.3 3.4 2.5 2.4 1.4 1.4Interest and similar expenses 1.0 0.9 2.0 1.8 1.0 1.0 1.1 1.0 1.0 0.9Operating taxes 0.0 0.0 0.2 0.2 0.1 0.1 0.1 0.0 0.0 0.0Other expenses 8.5 8.4 23.9 23.6 19.0 19.0 15.8 15.8 8.0 7.9Total expenses before taxes on income 100.6 99.7 99.3 97.9 99.2 98.7 100.4 100.8 100.6 99.7Annual result before taxes on income 2.8 3.2 5.6 7.2 5.2 5.4 3.4 3.4 2.7 3.1Taxes on income 0.4 0.5 1.7 1.7 1.5 1.2 0.9 0.9 0.3 0.4Annual result 2.4 2.7 3.9 5.5 3.8 4.1 2.6 2.5 2.4 2.7Profit and loss transfers (parent company) 0.2 0.2 0.2 0.3 0.1 - 0.1 - 0.1 - 0.1 0.2 0.2Profit and loss transfers (subsidiary) 1.1 1.2 0.1 0.1 0.4 0.7 0.7 0.8 1.2 1.2Profit for the year 1.5 1.7 4.0 5.6 3.5 3.4 1.8 1.6 1.4 1.7
Balance sheetAssets Percentage of the balance sheet totalIntangible fixed assets 0.7 0.8 0.7 1.0 1.1 1.0 0.8 0.7 0.6 0.8Tangible fixed assets 25.6 26.0 50.6 48.7 30.6 29.4 26.8 25.7 25.5 25.9
of which: Land and buildings 6.5 6.5 3.6 3.4 5.1 5.5 11.3 11.0 6.2 6.2Inventories 12.5 12.6 7.3 7.6 15.8 16.3 18.2 18.6 12.1 12.3
of which: Finished goods and merchandise 7.7 7.6 3.2 3.4 9.0 9.5 7.9 8.2 7.7 7.6Cash 3.8 3.7 15.5 15.2 11.8 11.7 9.9 10.4 3.4 3.2Receivables 34.7 35.8 20.1 21.4 32.7 33.5 36.4 37.1 34.7 35.8
Short-term 31.2 32.4 19.2 19.9 31.9 32.1 34.1 35.0 31.1 32.3 of which:
Trade receivables 8.8 8.6 8.8 9.3 15.8 15.6 13.3 12.8 8.5 8.2Receivables from affiliated companies 20.2 21.1 6.2 6.4 11.8 12.3 17.2 18.5 20.5 21.4
Long-term 3.5 3.4 0.9 1.5 0.9 1.4 2.3 2.1 3.6 3.5of which: Loans to affiliated companies 3.2 3.2 0.7 1.3 0.3 0.8 1.6 1.6 3.3 3.3
Securities 2.7 2.7 0.2 0.2 0.2 0.3 0.6 0.7 2.8 2.8Other long-term equity investments 19.7 18.0 4.6 4.2 6.9 6.7 6.7 6.1 20.7 18.9
of which: Goodwill 1.0 0.9 0.3 0.3 2.1 1.6 1.1 1.0 1.0 0.9
CapitalEquity 32.5 33.2 32.7 32.8 32.5 32.9 31.1 31.2 32.6 33.3Liabilities 50.3 49.8 61.2 61.2 57.2 57.4 52.5 52.9 50.1 49.5
Short-term 35.1 34.5 31.7 33.6 40.1 41.3 39.4 41.6 34.8 34.1of which:Liabilities to banks 3.6 3.7 11.3 12.8 9.7 9.5 7.0 7.3 3.3 3.4Trade payables 10.3 10.1 5.6 6.1 8.8 8.1 8.0 7.7 10.4 10.3Liabilities to affiliated companies 15.1 15.6 5.7 5.6 10.6 11.2 13.8 14.1 15.3 15.7
Long-term 15.2 15.3 29.5 27.7 17.1 16.0 13.1 11.3 15.3 15.5 of which:
Liabilities to banks 7.2 7.5 25.0 22.7 11.4 11.1 7.6 6.2 7.1 7.5Liabilities to affiliated companies 4.2 4.1 2.4 2.6 3.3 2.8 4.6 4.3 4.2 4.1
Provisions 16.7 16.4 5.1 5.0 9.3 8.7 15.2 14.5 16.9 16.6of which: Provisions for pensions 8.3 8.4 0.5 0.5 2.9 2.9 4.5 4.8 8.6 8.7
Other ratios Percentage of salesAnnual result before taxes on income 2.8 3.2 5.7 7.3 5.3 5.4 3.5 3.4 2.8 3.1Annual result and depreciation 4.0 4.3 11.6 12.4 7.3 7.8 5.4 5.6 3.9 4.2Trade receivables 5.0 4.8 10.2 10.2 10.9 10.6 9.3 8.9 4.8 4.5
Percentage of the balance sheet totalSales 175.0 178.8 86.4 90.7 145.2 146.2 142.8 143.2 177.3 181.5Annual result and interest paid 6.0 6.5 5.2 6.7 7.0 7.5 5.3 5.0 6.0 6.5
Percentage of liabilities and provisions less cashAnnual result and depreciation 11.0 12.2 19.3 21.7 18.9 20.5 13.0 13.6 10.8 12.0
Percentage of fixed assetsLong-term equity and liabilities 109.1 112.8 110.3 110.1 132.4 133.8 131.6 135.1 108.0 111.8
Percentage of short-term liabilitiesCash resources and short-term receivables 102.3 106.3 110.2 105.1 109.0 106.5 112.0 109.9 101.6 106.1Cash resources, short-term receivables and inventories 137.8 142.9 133.1 127.8 148.3 146.1 158.1 154.8 136.4 142.1
Percentage of cost of materialsTrade payables 7.1 6.9 19.8 20.3 12.3 11.5 9.6 9.2 7.0 6.8
Memo item:Balance sheet total in € billion 163.59 165.56 0.43 0.47 1.87 1.96 8.26 8.64 153.03 154.48Sales in € billion 286.23 296.09 0.38 0.43 2.71 2.86 11.79 12.37 271.35 280.43Number of enterprises 1 926 1 926 484 484 526 526 513 513 403 403
* Agriculture, forestry and fishing, mining and quarrying, manufacturing, electricity, gas and water supply, construction, trade, transportation and storage,accommodation and food service activities, information and communication, business services, personal service activities

Deutsche BundesbankFinancial statement statistics (ratios - provisional data)
May 2021217
IV. Enterprises by federal state and economic sector
cont'd: 6. Hamburg All economic sectors*
cont'd: All legal formsEnterprises with sales of ... € million
Total Less than 2 2 but less than 10 10 but less than 50 50 and moreQuartile Cylindered sample 2018/2019value 2018 2019 2018 2019 2018 2019 2018 2019 2018 2019Of the enterprises captured …
Ratios ... % had a ratio of less than …Percentage of gross revenue
Cost of materials 25 21.4 21.6 1.0 1.3 20.7 21.1 33.8 32.8 52.9 53.9 50 53.2 53.1 25.4 24.8 48.5 47.5 64.5 64.1 79.1 78.1 75 79.5 78.9 51.8 51.2 71.9 72.6 83.8 83.4 90.4 89.9
Personnel expenses 25 5.8 6.3 8.2 9.9 10.3 10.6 6.3 6.6 2.4 2.7 50 17.4 17.8 27.9 27.5 21.0 21.5 16.0 16.2 7.9 8.1 75 37.9 37.9 48.0 47.7 43.0 42.3 33.4 32.9 18.8 19.2
Depreciation 25 0.3 0.3 0.5 0.5 0.4 0.4 0.3 0.3 0.2 0.2 50 1.1 1.1 1.8 1.7 1.1 1.1 0.9 0.8 0.8 0.9 75 3.1 3.1 4.9 5.1 2.4 2.5 2.7 2.6 2.5 2.8
Annual result 25 0.3 0.4 0.0 0.3 0.4 0.6 0.3 0.4 0.3 0.3 50 2.3 2.3 4.0 4.1 2.5 2.7 1.9 1.8 1.7 1.7 75 6.3 6.4 11.7 10.4 6.5 6.4 4.8 4.6 4.6 4.5
Percentage of the balance sheet totalTangible fixed assets 25 1.2 1.2 1.8 1.8 1.5 1.4 1.2 1.3 0.7 0.7
50 6.6 6.2 9.3 8.9 6.1 6.0 5.8 5.5 5.3 4.6 75 24.6 24.0 36.2 36.8 19.3 20.1 23.6 21.9 23.9 24.0
Inventories 25 0.0 0.0 0.0 0.0 0.0 0.0 0.6 0.4 0.9 0.7 50 6.5 6.5 0.0 0.0 6.6 6.5 12.3 13.2 13.8 13.1 75 33.6 33.7 17.5 16.5 33.6 34.6 39.9 40.1 38.1 38.1
Equity 25 9.8 10.7 5.2 6.9 10.8 12.1 10.5 11.1 10.9 11.7 50 26.1 27.2 26.9 29.6 29.0 29.7 26.8 27.7 21.7 24.6 75 47.6 49.1 53.9 54.3 50.2 52.2 44.5 45.9 41.4 42.1
Short-term liabilities 25 21.3 20.7 15.7 15.0 22.3 21.9 25.5 25.3 23.1 22.4 50 45.8 44.8 37.8 37.6 46.1 44.5 50.6 49.0 50.2 47.3 75 70.8 69.2 70.1 65.7 68.2 68.6 70.6 69.7 75.0 72.1
Liabilities to banks 25 0.0 0.0 0.0 0.0 0.0 0.0 0.0 0.0 0.0 0.0 50 0.0 0.0 0.0 0.6 2.3 1.8 0.0 0.0 0.0 0.0 75 24.2 23.8 31.0 30.2 24.0 24.9 25.4 23.7 15.7 16.3
Percentage of salesAnnual result before taxes on income 25 0.4 0.6 0.0 0.5 0.6 0.8 0.5 0.6 0.4 0.5
50 3.2 3.1 5.0 5.4 3.6 3.7 2.7 2.6 2.2 2.2 75 8.3 8.3 14.0 13.6 8.8 8.4 6.3 6.6 5.8 5.6
Annual result and depreciation 25 1.5 1.9 1.6 2.7 2.0 2.3 1.4 1.6 1.2 1.2 50 5.1 5.1 8.5 8.7 5.8 5.7 4.0 4.1 3.8 3.4 75 12.0 12.1 21.1 20.5 12.1 12.6 9.2 9.3 8.3 7.8
Trade receivables 25 2.9 2.9 1.4 1.9 4.2 3.7 3.2 3.2 3.2 3.3 50 7.6 7.2 6.3 6.4 8.4 7.7 7.6 7.1 7.7 7.4 75 13.1 12.9 13.1 12.8 14.0 13.8 13.0 12.3 12.4 12.3
Percentage of the balance sheet totalAnnual result and interest paid 25 2.0 2.5 1.2 2.2 2.2 3.1 2.0 2.3 2.2 2.1
50 6.5 6.8 7.7 8.9 7.1 7.7 6.2 6.5 5.5 5.2 75 15.0 14.6 20.6 22.6 16.5 16.2 12.3 11.8 11.3 10.9
Percentage of liabilities and provisions less cashAnnual result and depreciation 25 2.8 3.5 - 10.8 - 8.9 3.7 4.2 3.9 5.2 3.9 4.2
50 15.1 15.0 17.2 14.9 18.7 18.8 14.6 14.2 11.5 12.9 75 39.2 38.7 48.8 49.6 52.6 48.6 37.7 35.3 26.6 27.6
Percentage of fixed assetsLong-term equity and liabilities 25 95.9 98.4 84.3 87.8 106.5 105.4 105.7 105.4 90.4 91.2
50 206.6 219.0 166.4 185.2 289.8 290.3 249.8 264.9 161.9 178.3 75 735.6 790.7 582.4 673.3 979.2 956.3 807.6 833.3 554.1 582.6
Percentage of short-term liabilitiesCash resources and short-term receivables 25 64.7 65.8 67.2 70.0 67.6 68.9 66.2 65.0 59.1 61.0
50 116.6 119.7 139.4 142.9 127.8 127.2 109.4 115.8 102.3 103.4 75 237.1 254.3 293.1 320.6 242.5 264.8 212.5 218.4 194.3 209.8
Percentage of cost of materialsTrade payables 25 3.9 3.5 4.7 3.8 5.1 4.4 4.0 3.6 2.7 2.2
50 8.7 7.8 12.3 12.1 10.8 9.3 8.2 7.3 6.0 5.8 75 17.4 16.0 33.3 36.7 21.1 17.9 14.8 13.8 10.9 11.0
* Agriculture, forestry and fishing, mining and quarrying, manufacturing, electricity, gas and water supply, construction, trade, transportation and storage,accommodation and food service activities, information and communication, business services, personal service activities

Deutsche BundesbankFinancial statement statistics (ratios - provisional data)May 2021218
IV. Enterprises by federal state and economic sector
7. Hessea) All economic sectors*
All legal formsEnterprises with sales of ... € million
Total Less than 2 2 but less than 10 10 but less than 50 50 and moreCylindered sample 2018/2019
Ratios 2018 2019 2018 2019 2018 2019 2018 2019 2018 2019Income statementIncome Percentage of gross revenueSales 99.2 99.3 99.0 97.5 98.3 98.3 99.4 99.6 99.2 99.3Change in finished goods 0.8 0.7 1.0 2.5 1.7 1.7 0.6 0.4 0.8 0.7Interest and similar income 0.2 0.3 0.3 0.2 0.1 0.1 0.1 0.2 0.2 0.4Other income 2.8 3.0 4.2 3.6 3.0 2.7 2.8 2.8 2.8 3.0
of which: Income from long-term equity investments 0.5 0.7 0.3 0.1 0.2 0.2 0.2 0.3 0.6 0.7Total income 103.0 103.3 104.5 103.8 103.1 102.9 102.9 102.9 103.0 103.4
ExpensesCost of materials 71.0 70.8 36.3 36.4 47.9 47.6 54.9 55.1 73.0 72.8Personnel expenses 14.6 15.1 34.6 33.6 28.7 28.7 25.2 25.2 13.3 13.9Depreciation 2.6 2.7 4.6 4.4 3.3 3.2 2.9 2.7 2.5 2.7
of which: Depreciation of tangible fixed assets 2.4 2.6 4.5 4.3 3.2 3.2 2.6 2.6 2.4 2.5Interest and similar expenses 1.1 0.9 1.2 1.0 0.9 0.8 0.8 0.7 1.1 0.9Operating taxes 0.1 0.1 0.2 0.2 0.1 0.1 0.1 0.1 0.1 0.1Other expenses 11.3 11.2 22.0 21.4 18.2 18.0 15.4 15.2 10.7 10.7Total expenses before taxes on income 100.6 100.9 98.8 97.1 99.1 98.5 99.2 99.0 100.7 101.1Annual result before taxes on income 2.4 2.5 5.7 6.7 4.1 4.3 3.7 3.9 2.2 2.3Taxes on income 0.5 0.5 1.4 1.4 1.1 1.1 1.1 1.1 0.4 0.4Annual result 1.9 2.0 4.4 5.3 3.0 3.2 2.7 2.8 1.8 1.9Profit and loss transfers (parent company) 0.8 0.7 0.0 0.0 0.2 0.2 0.2 0.2 0.9 0.8Profit and loss transfers (subsidiary) 1.7 1.7 - 0.1 - 0.2 0.3 0.4 0.7 0.6 1.9 1.9Profit for the year 1.0 1.0 4.5 5.5 2.8 2.9 2.2 2.4 0.8 0.8
Balance sheetAssets Percentage of the balance sheet totalIntangible fixed assets 2.9 2.5 0.7 0.7 1.0 0.9 1.1 1.0 3.1 2.7Tangible fixed assets 29.3 29.3 41.4 38.8 34.0 33.8 25.0 24.8 29.6 29.6
of which: Land and buildings 12.0 11.7 11.1 10.4 13.0 12.5 10.2 9.9 12.1 11.8Inventories 13.5 12.7 14.9 16.8 21.9 23.0 22.3 22.2 12.6 11.7
of which: Finished goods and merchandise 6.6 5.8 6.8 6.2 8.4 8.0 8.3 8.3 6.4 5.6Cash 4.8 4.6 15.4 16.5 12.6 12.6 11.7 11.7 4.1 3.9Receivables 30.1 29.9 24.2 24.0 25.1 24.0 33.0 32.8 30.0 29.8
Short-term 27.8 27.6 22.8 22.6 24.1 23.0 31.5 31.2 27.5 27.4 of which:
Trade receivables 9.6 9.2 11.7 11.3 12.8 12.4 14.9 14.1 9.1 8.7Receivables from affiliated companies 16.0 16.1 5.3 5.1 7.4 6.5 12.7 13.1 16.4 16.5
Long-term 2.4 2.3 1.5 1.4 1.0 1.0 1.5 1.6 2.5 2.4of which: Loans to affiliated companies 1.8 1.7 1.1 1.0 0.4 0.5 1.1 1.1 1.9 1.8
Securities 1.4 1.3 0.3 0.4 1.4 1.3 0.9 0.8 1.4 1.4Other long-term equity investments 17.4 19.2 2.5 2.2 3.3 3.9 5.2 5.9 18.8 20.6
of which: Goodwill 1.2 1.0 0.9 0.6 0.5 0.8 0.7 0.6 1.3 1.1
CapitalEquity 31.0 30.5 28.5 30.6 34.1 33.2 34.4 35.3 30.7 30.0Liabilities 51.9 52.4 64.7 62.5 57.1 58.0 51.2 50.9 51.9 52.4
Short-term 38.4 37.8 37.2 38.3 38.0 39.7 39.2 39.9 38.3 37.6of which:Liabilities to banks 2.5 2.5 8.7 9.0 7.7 8.5 5.2 5.7 2.2 2.1Trade payables 6.3 5.8 8.9 8.6 7.8 7.4 7.9 7.6 6.1 5.6Liabilities to affiliated companies 22.0 22.3 6.8 5.6 7.5 7.5 13.2 13.3 23.0 23.4
Long-term 13.6 14.6 27.5 24.2 19.2 18.4 12.0 11.0 13.6 14.8 of which:
Liabilities to banks 4.9 5.0 20.4 18.1 14.7 13.9 6.5 6.3 4.5 4.7Liabilities to affiliated companies 7.1 7.4 5.1 4.2 3.4 3.2 4.8 3.8 7.4 7.8
Provisions 16.0 15.9 6.0 6.0 8.1 7.8 13.1 12.5 16.4 16.4of which: Provisions for pensions 5.6 5.9 1.3 1.2 1.9 2.0 3.7 3.8 5.9 6.1
Other ratios Percentage of salesAnnual result before taxes on income 2.4 2.5 5.8 6.9 4.2 4.4 3.8 3.9 2.3 2.3Annual result and depreciation 4.5 4.8 9.0 9.9 6.4 6.6 5.6 5.5 4.4 4.7Trade receivables 7.1 7.1 9.2 8.8 9.5 9.2 10.5 10.1 6.7 6.7
Percentage of the balance sheet totalSales 136.0 130.8 127.8 127.8 135.4 134.4 141.1 139.4 135.6 130.0Annual result and interest paid 4.0 3.8 7.2 8.3 5.3 5.5 4.9 4.9 3.9 3.7
Percentage of liabilities and provisions less cashAnnual result and depreciation 9.6 9.6 20.6 23.9 16.3 16.3 14.5 14.6 9.1 9.2
Percentage of fixed assetsLong-term equity and liabilities 94.9 94.0 124.1 129.6 136.8 131.7 149.2 147.9 91.5 90.7
Percentage of short-term liabilitiesCash resources and short-term receivables 86.4 86.4 103.1 102.6 97.7 90.2 110.6 108.0 84.0 84.3Cash resources, short-term receivables and inventories 121.6 119.9 143.1 146.5 155.5 148.1 167.4 163.6 116.9 115.3
Percentage of cost of materialsTrade payables 6.5 6.3 19.1 18.0 11.8 11.4 10.1 9.9 6.1 5.9
Memo item:Balance sheet total in € billion 244.04 257.07 0.71 0.79 3.77 4.06 18.81 19.83 220.75 232.41Sales in € billion 331.96 336.20 0.91 1.00 5.11 5.45 26.53 27.63 299.41 302.12Number of enterprises 4 018 4 018 1 085 1 085 1 032 1 032 1 131 1 131 770 770
* Agriculture, forestry and fishing, mining and quarrying, manufacturing, electricity, gas and water supply, construction, trade, transportation and storage,accommodation and food service activities, information and communication, business services, personal service activities
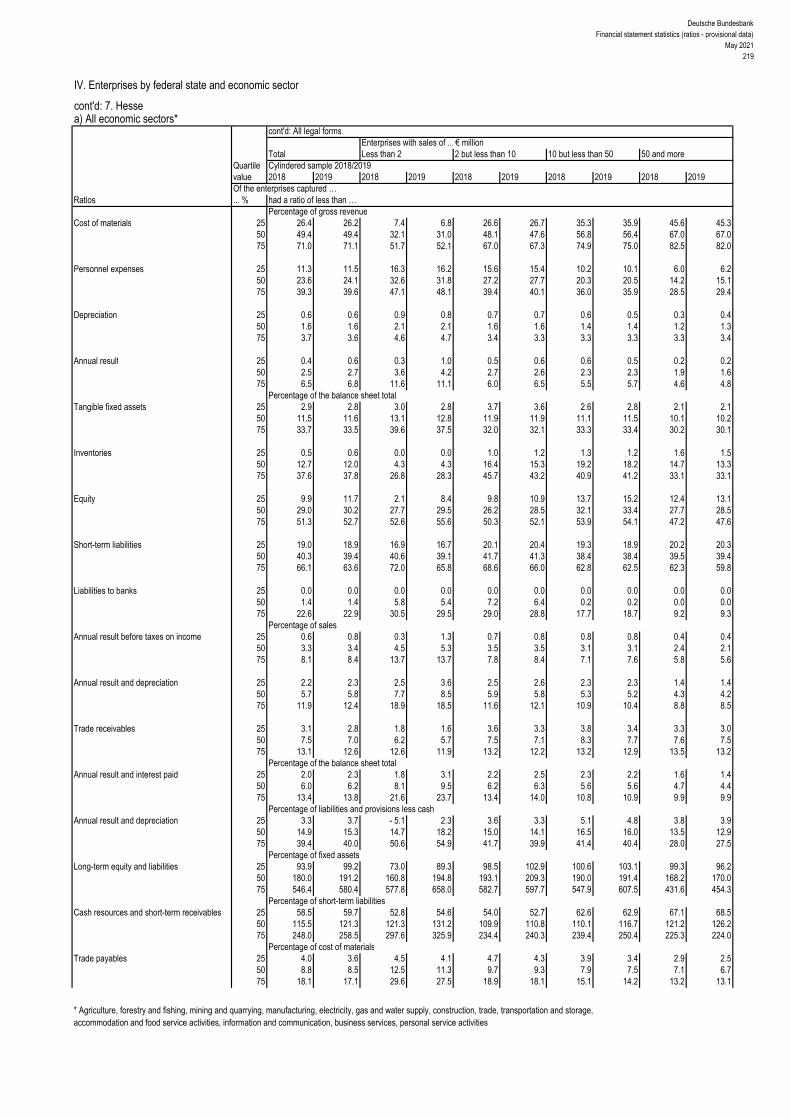
Deutsche BundesbankFinancial statement statistics (ratios - provisional data)
May 2021219
IV. Enterprises by federal state and economic sector
cont'd: 7. Hessea) All economic sectors*
cont'd: All legal formsEnterprises with sales of ... € million
Total Less than 2 2 but less than 10 10 but less than 50 50 and moreQuartile Cylindered sample 2018/2019value 2018 2019 2018 2019 2018 2019 2018 2019 2018 2019Of the enterprises captured …
Ratios ... % had a ratio of less than …Percentage of gross revenue
Cost of materials 25 26.4 26.2 7.4 6.8 26.6 26.7 35.3 35.9 45.6 45.3 50 49.4 49.4 32.1 31.0 48.1 47.6 56.8 56.4 67.0 67.0 75 71.0 71.1 51.7 52.1 67.0 67.3 74.9 75.0 82.5 82.0
Personnel expenses 25 11.3 11.5 16.3 16.2 15.6 15.4 10.2 10.1 6.0 6.2 50 23.6 24.1 32.6 31.8 27.2 27.7 20.3 20.5 14.2 15.1 75 39.3 39.6 47.1 48.1 39.4 40.1 36.0 35.9 28.5 29.4
Depreciation 25 0.6 0.6 0.9 0.8 0.7 0.7 0.6 0.5 0.3 0.4 50 1.6 1.6 2.1 2.1 1.6 1.6 1.4 1.4 1.2 1.3 75 3.7 3.6 4.6 4.7 3.4 3.3 3.3 3.3 3.3 3.4
Annual result 25 0.4 0.6 0.3 1.0 0.5 0.6 0.6 0.5 0.2 0.2 50 2.5 2.7 3.6 4.2 2.7 2.6 2.3 2.3 1.9 1.6 75 6.5 6.8 11.6 11.1 6.0 6.5 5.5 5.7 4.6 4.8
Percentage of the balance sheet totalTangible fixed assets 25 2.9 2.8 3.0 2.8 3.7 3.6 2.6 2.8 2.1 2.1
50 11.5 11.6 13.1 12.8 11.9 11.9 11.1 11.5 10.1 10.2 75 33.7 33.5 39.6 37.5 32.0 32.1 33.3 33.4 30.2 30.1
Inventories 25 0.5 0.6 0.0 0.0 1.0 1.2 1.3 1.2 1.6 1.5 50 12.7 12.0 4.3 4.3 16.4 15.3 19.2 18.2 14.7 13.3 75 37.6 37.8 26.8 28.3 45.7 43.2 40.9 41.2 33.1 33.1
Equity 25 9.9 11.7 2.1 8.4 9.8 10.9 13.7 15.2 12.4 13.1 50 29.0 30.2 27.7 29.5 26.2 28.5 32.1 33.4 27.7 28.5 75 51.3 52.7 52.6 55.6 50.3 52.1 53.9 54.1 47.2 47.6
Short-term liabilities 25 19.0 18.9 16.9 16.7 20.1 20.4 19.3 18.9 20.2 20.3 50 40.3 39.4 40.6 39.1 41.7 41.3 38.4 38.4 39.5 39.4 75 66.1 63.6 72.0 65.8 68.6 66.0 62.8 62.5 62.3 59.8
Liabilities to banks 25 0.0 0.0 0.0 0.0 0.0 0.0 0.0 0.0 0.0 0.0 50 1.4 1.4 5.8 5.4 7.2 6.4 0.2 0.2 0.0 0.0 75 22.6 22.9 30.5 29.5 29.0 28.8 17.7 18.7 9.2 9.3
Percentage of salesAnnual result before taxes on income 25 0.6 0.8 0.3 1.3 0.7 0.8 0.8 0.8 0.4 0.4
50 3.3 3.4 4.5 5.3 3.5 3.5 3.1 3.1 2.4 2.1 75 8.1 8.4 13.7 13.7 7.8 8.4 7.1 7.6 5.8 5.6
Annual result and depreciation 25 2.2 2.3 2.5 3.6 2.5 2.6 2.3 2.3 1.4 1.4 50 5.7 5.8 7.7 8.5 5.9 5.8 5.3 5.2 4.3 4.2 75 11.9 12.4 18.9 18.5 11.6 12.1 10.9 10.4 8.8 8.5
Trade receivables 25 3.1 2.8 1.8 1.6 3.6 3.3 3.8 3.4 3.3 3.0 50 7.5 7.0 6.2 5.7 7.5 7.1 8.3 7.7 7.6 7.5 75 13.1 12.6 12.6 11.9 13.2 12.2 13.2 12.9 13.5 13.2
Percentage of the balance sheet totalAnnual result and interest paid 25 2.0 2.3 1.8 3.1 2.2 2.5 2.3 2.2 1.6 1.4
50 6.0 6.2 8.1 9.5 6.2 6.3 5.6 5.6 4.7 4.4 75 13.4 13.8 21.6 23.7 13.4 14.0 10.8 10.9 9.9 9.9
Percentage of liabilities and provisions less cashAnnual result and depreciation 25 3.3 3.7 - 5.1 2.3 3.6 3.3 5.1 4.8 3.8 3.9
50 14.9 15.3 14.7 18.2 15.0 14.1 16.5 16.0 13.5 12.9 75 39.4 40.0 50.6 54.9 41.7 39.9 41.4 40.4 28.0 27.5
Percentage of fixed assetsLong-term equity and liabilities 25 93.9 99.2 73.0 89.3 98.5 102.9 100.6 103.1 99.3 96.2
50 180.0 191.2 160.8 194.8 193.1 209.3 190.0 191.4 168.2 170.0 75 546.4 580.4 577.8 658.0 582.7 597.7 547.9 607.5 431.6 454.3
Percentage of short-term liabilitiesCash resources and short-term receivables 25 58.5 59.7 52.8 54.6 54.0 52.7 62.6 62.9 67.1 68.5
50 115.5 121.3 121.3 131.2 109.9 110.8 110.1 116.7 121.2 126.2 75 248.0 258.5 297.6 325.9 234.4 240.3 239.4 250.4 225.3 224.0
Percentage of cost of materialsTrade payables 25 4.0 3.6 4.5 4.1 4.7 4.3 3.9 3.4 2.9 2.5
50 8.8 8.5 12.5 11.3 9.7 9.3 7.9 7.5 7.1 6.7 75 18.1 17.1 29.6 27.5 18.9 18.1 15.1 14.2 13.2 13.1
* Agriculture, forestry and fishing, mining and quarrying, manufacturing, electricity, gas and water supply, construction, trade, transportation and storage,accommodation and food service activities, information and communication, business services, personal service activities

Deutsche BundesbankFinancial statement statistics (ratios - provisional data)May 2021220
IV. Enterprises by federal state and economic sector
cont'd: 7. Hessea) All economic sectors*
CorporationsEnterprises with sales of ... € million
Total Less than 2 2 but less than 10 10 but less than 50 50 and moreCylindered sample 2018/2019
Ratios 2018 2019 2018 2019 2018 2019 2018 2019 2018 2019Income statementIncome Percentage of gross revenueSales 99.1 99.2 98.9 97.4 98.3 98.1 99.3 99.7 99.1 99.2Change in finished goods 0.9 0.8 1.1 2.6 1.7 1.9 0.7 0.3 0.9 0.8Interest and similar income 0.2 0.4 0.3 0.2 0.1 0.1 0.2 0.2 0.2 0.4Other income 3.0 3.2 4.6 3.8 3.2 2.9 3.0 3.0 3.0 3.3
of which: Income from long-term equity investments 0.6 0.7 0.3 0.0 0.2 0.2 0.2 0.3 0.6 0.8Total income 103.2 103.6 104.9 104.0 103.3 103.0 103.2 103.1 103.2 103.6
ExpensesCost of materials 70.0 70.1 36.4 36.8 47.3 47.1 54.4 54.5 71.8 71.9Personnel expenses 15.1 15.5 37.4 36.3 30.2 30.3 26.0 26.0 13.9 14.3Depreciation 2.7 2.8 3.7 3.4 2.9 2.8 2.8 2.6 2.7 2.8
of which: Depreciation of tangible fixed assets 2.5 2.6 3.6 3.3 2.7 2.8 2.5 2.5 2.5 2.6Interest and similar expenses 1.1 1.0 0.9 0.8 0.8 0.7 0.7 0.7 1.1 1.0Operating taxes 0.1 0.1 0.2 0.2 0.1 0.1 0.1 0.1 0.1 0.1Other expenses 11.8 11.6 22.5 21.7 18.5 18.3 15.7 15.4 11.3 11.1Total expenses before taxes on income 100.7 101.0 101.1 99.1 99.7 99.3 99.6 99.2 100.8 101.2Annual result before taxes on income 2.5 2.5 3.8 4.9 3.6 3.7 3.6 3.9 2.4 2.4Taxes on income 0.5 0.5 1.3 1.4 1.2 1.2 1.2 1.2 0.5 0.4Annual result 1.9 2.0 2.5 3.5 2.4 2.5 2.4 2.7 1.9 2.0Profit and loss transfers (parent company) 0.9 0.8 0.0 0.0 0.2 0.1 0.2 0.3 1.0 0.9Profit and loss transfers (subsidiary) 2.0 2.0 - 0.2 - 0.2 0.4 0.6 0.8 0.8 2.1 2.1Profit for the year 0.8 0.9 2.6 3.7 2.2 2.1 1.8 2.2 0.7 0.7
Balance sheetAssets Percentage of the balance sheet totalIntangible fixed assets 3.0 2.6 0.8 0.8 1.1 1.0 1.0 0.9 3.2 2.7Tangible fixed assets 29.7 29.6 33.3 31.1 29.3 29.4 24.2 24.2 30.1 30.0
of which: Land and buildings 12.3 12.0 11.4 10.1 12.6 12.1 10.0 9.6 12.5 12.2Inventories 12.6 11.7 17.0 18.8 22.3 23.6 21.5 21.4 11.8 10.8
of which: Finished goods and merchandise 6.3 5.6 8.0 7.1 8.8 8.4 7.7 7.7 6.2 5.4Cash 4.8 4.6 17.5 18.5 14.1 13.8 11.8 11.7 4.1 3.9Receivables 29.8 29.6 27.4 26.9 27.3 25.9 34.1 34.0 29.5 29.3
Short-term 27.3 27.2 26.6 26.2 26.4 25.0 32.3 32.2 27.0 26.8 of which:
Trade receivables 9.5 9.1 13.7 13.0 13.7 13.3 14.9 14.1 9.0 8.6Receivables from affiliated companies 15.8 16.0 6.0 5.7 8.5 7.4 13.6 14.1 16.1 16.3
Long-term 2.5 2.4 0.8 0.7 0.8 0.9 1.7 1.8 2.6 2.5of which: Loans to affiliated companies 1.8 1.7 0.3 0.3 0.3 0.4 1.3 1.3 1.9 1.8
Securities 1.5 1.4 0.4 0.5 1.6 1.3 1.0 0.9 1.5 1.5Other long-term equity investments 18.2 20.1 2.9 2.6 3.8 4.5 5.5 6.0 19.4 21.4
of which: Goodwill 1.3 1.1 0.8 0.6 0.6 0.9 0.7 0.7 1.3 1.1
CapitalEquity 31.8 31.2 32.6 34.2 36.7 35.3 37.2 37.9 31.3 30.6Liabilities 50.9 51.4 59.2 57.6 53.4 55.0 48.3 48.2 51.1 51.5
Short-term 37.3 36.4 38.8 40.2 37.5 37.9 37.7 38.2 37.2 36.2of which:Liabilities to banks 2.1 1.9 7.7 7.9 6.7 6.3 4.6 4.9 1.8 1.6Trade payables 6.0 5.4 10.4 9.9 8.3 8.0 7.9 7.7 5.8 5.2Liabilities to affiliated companies 22.3 22.5 6.6 5.7 7.4 7.4 12.5 12.5 23.3 23.5
Long-term 13.7 14.9 20.4 17.5 15.9 17.1 10.6 10.0 13.9 15.3 of which:
Liabilities to banks 4.7 4.9 12.0 10.3 10.7 12.0 5.7 5.8 4.5 4.7Liabilities to affiliated companies 7.3 7.8 6.0 4.8 4.3 4.0 4.2 3.4 7.6 8.2
Provisions 16.3 16.2 7.1 7.0 8.9 8.5 13.4 12.8 16.6 16.6of which: Provisions for pensions 5.7 6.0 1.8 1.7 2.4 2.4 3.7 3.8 5.9 6.2
Other ratios Percentage of salesAnnual result before taxes on income 2.5 2.6 3.8 5.0 3.7 3.8 3.6 4.0 2.4 2.4Annual result and depreciation 4.7 4.9 6.2 7.1 5.4 5.4 5.2 5.4 4.6 4.8Trade receivables 7.5 7.3 9.7 9.3 9.7 9.6 10.9 10.5 7.1 7.0
Percentage of the balance sheet totalSales 127.5 123.8 141.7 140.2 141.1 137.8 136.0 134.6 126.6 122.7Annual result and interest paid 3.9 3.7 4.9 6.2 4.6 4.6 4.3 4.6 3.9 3.7
Percentage of liabilities and provisions less cashAnnual result and depreciation 9.3 9.4 17.6 21.0 15.4 14.7 13.9 14.3 9.0 9.0
Percentage of fixed assetsLong-term equity and liabilities 94.2 93.9 144.6 150.7 152.1 148.7 154.6 154.4 90.8 90.5
Percentage of short-term liabilitiesCash resources and short-term receivables 87.8 88.7 114.5 112.2 109.2 103.0 117.6 115.8 85.1 86.2Cash resources, short-term receivables and inventories 121.6 120.9 158.2 159.1 168.7 165.2 174.7 171.8 116.7 116.0
Percentage of cost of materialsTrade payables 6.6 6.2 20.0 18.6 12.3 12.0 10.5 10.5 6.3 5.8
Memo item:Balance sheet total in € billion 224.63 236.87 0.50 0.56 2.77 3.03 16.09 17.00 205.27 216.27Sales in € billion 286.43 293.20 0.71 0.79 3.91 4.17 21.89 22.89 259.93 265.35Number of enterprises 3 251 3 251 855 855 800 800 929 929 667 667
* Agriculture, forestry and fishing, mining and quarrying, manufacturing, electricity, gas and water supply, construction, trade, transportation and storage,accommodation and food service activities, information and communication, business services, personal service activities
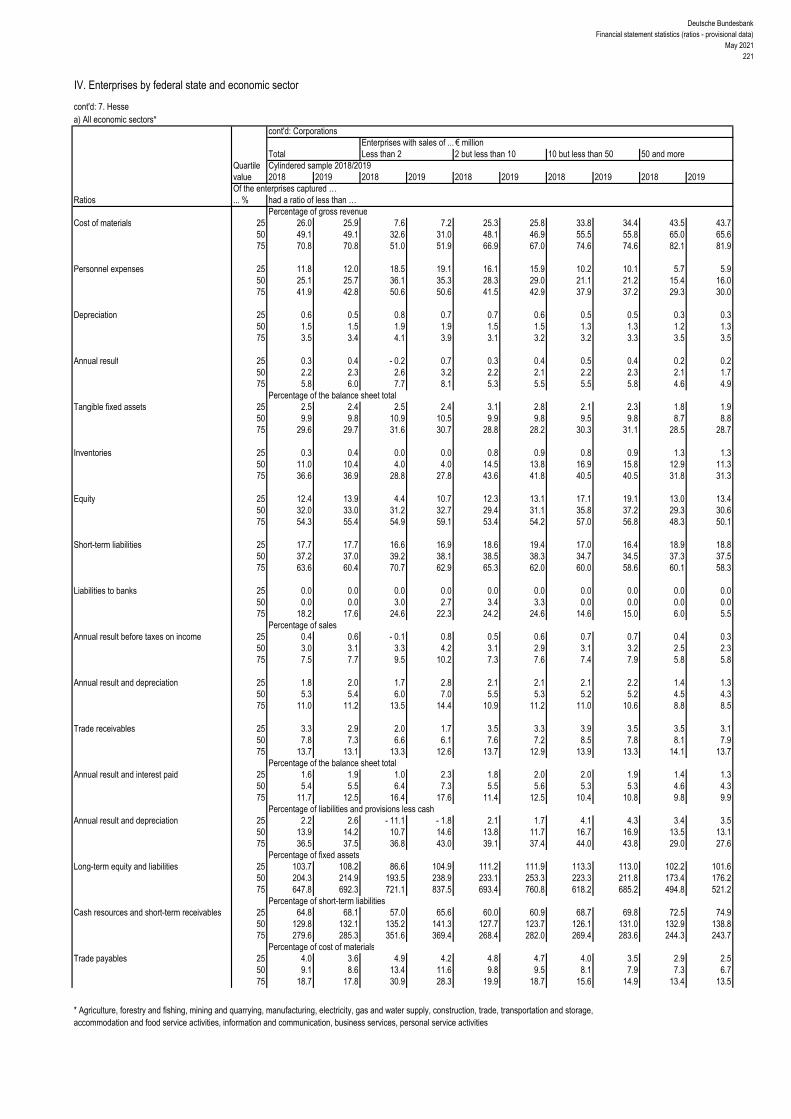
Deutsche BundesbankFinancial statement statistics (ratios - provisional data)
May 2021221
IV. Enterprises by federal state and economic sector
cont'd: 7. Hessea) All economic sectors*
cont'd: CorporationsEnterprises with sales of ... € million
Total Less than 2 2 but less than 10 10 but less than 50 50 and moreQuartile Cylindered sample 2018/2019value 2018 2019 2018 2019 2018 2019 2018 2019 2018 2019Of the enterprises captured …
Ratios ... % had a ratio of less than …Percentage of gross revenue
Cost of materials 25 26.0 25.9 7.6 7.2 25.3 25.8 33.8 34.4 43.5 43.7 50 49.1 49.1 32.6 31.0 48.1 46.9 55.5 55.8 65.0 65.6 75 70.8 70.8 51.0 51.9 66.9 67.0 74.6 74.6 82.1 81.9
Personnel expenses 25 11.8 12.0 18.5 19.1 16.1 15.9 10.2 10.1 5.7 5.9 50 25.1 25.7 36.1 35.3 28.3 29.0 21.1 21.2 15.4 16.0 75 41.9 42.8 50.6 50.6 41.5 42.9 37.9 37.2 29.3 30.0
Depreciation 25 0.6 0.5 0.8 0.7 0.7 0.6 0.5 0.5 0.3 0.3 50 1.5 1.5 1.9 1.9 1.5 1.5 1.3 1.3 1.2 1.3 75 3.5 3.4 4.1 3.9 3.1 3.2 3.2 3.3 3.5 3.5
Annual result 25 0.3 0.4 - 0.2 0.7 0.3 0.4 0.5 0.4 0.2 0.2 50 2.2 2.3 2.6 3.2 2.2 2.1 2.2 2.3 2.1 1.7 75 5.8 6.0 7.7 8.1 5.3 5.5 5.5 5.8 4.6 4.9
Percentage of the balance sheet totalTangible fixed assets 25 2.5 2.4 2.5 2.4 3.1 2.8 2.1 2.3 1.8 1.9
50 9.9 9.8 10.9 10.5 9.9 9.8 9.5 9.8 8.7 8.8 75 29.6 29.7 31.6 30.7 28.8 28.2 30.3 31.1 28.5 28.7
Inventories 25 0.3 0.4 0.0 0.0 0.8 0.9 0.8 0.9 1.3 1.3 50 11.0 10.4 4.0 4.0 14.5 13.8 16.9 15.8 12.9 11.3 75 36.6 36.9 28.8 27.8 43.6 41.8 40.5 40.5 31.8 31.3
Equity 25 12.4 13.9 4.4 10.7 12.3 13.1 17.1 19.1 13.0 13.4 50 32.0 33.0 31.2 32.7 29.4 31.1 35.8 37.2 29.3 30.6 75 54.3 55.4 54.9 59.1 53.4 54.2 57.0 56.8 48.3 50.1
Short-term liabilities 25 17.7 17.7 16.6 16.9 18.6 19.4 17.0 16.4 18.9 18.8 50 37.2 37.0 39.2 38.1 38.5 38.3 34.7 34.5 37.3 37.5 75 63.6 60.4 70.7 62.9 65.3 62.0 60.0 58.6 60.1 58.3
Liabilities to banks 25 0.0 0.0 0.0 0.0 0.0 0.0 0.0 0.0 0.0 0.0 50 0.0 0.0 3.0 2.7 3.4 3.3 0.0 0.0 0.0 0.0 75 18.2 17.6 24.6 22.3 24.2 24.6 14.6 15.0 6.0 5.5
Percentage of salesAnnual result before taxes on income 25 0.4 0.6 - 0.1 0.8 0.5 0.6 0.7 0.7 0.4 0.3
50 3.0 3.1 3.3 4.2 3.1 2.9 3.1 3.2 2.5 2.3 75 7.5 7.7 9.5 10.2 7.3 7.6 7.4 7.9 5.8 5.8
Annual result and depreciation 25 1.8 2.0 1.7 2.8 2.1 2.1 2.1 2.2 1.4 1.3 50 5.3 5.4 6.0 7.0 5.5 5.3 5.2 5.2 4.5 4.3 75 11.0 11.2 13.5 14.4 10.9 11.2 11.0 10.6 8.8 8.5
Trade receivables 25 3.3 2.9 2.0 1.7 3.5 3.3 3.9 3.5 3.5 3.1 50 7.8 7.3 6.6 6.1 7.6 7.2 8.5 7.8 8.1 7.9 75 13.7 13.1 13.3 12.6 13.7 12.9 13.9 13.3 14.1 13.7
Percentage of the balance sheet totalAnnual result and interest paid 25 1.6 1.9 1.0 2.3 1.8 2.0 2.0 1.9 1.4 1.3
50 5.4 5.5 6.4 7.3 5.5 5.6 5.3 5.3 4.6 4.3 75 11.7 12.5 16.4 17.6 11.4 12.5 10.4 10.8 9.8 9.9
Percentage of liabilities and provisions less cashAnnual result and depreciation 25 2.2 2.6 - 11.1 - 1.8 2.1 1.7 4.1 4.3 3.4 3.5
50 13.9 14.2 10.7 14.6 13.8 11.7 16.7 16.9 13.5 13.1 75 36.5 37.5 36.8 43.0 39.1 37.4 44.0 43.8 29.0 27.6
Percentage of fixed assetsLong-term equity and liabilities 25 103.7 108.2 86.6 104.9 111.2 111.9 113.3 113.0 102.2 101.6
50 204.3 214.9 193.5 238.9 233.1 253.3 223.3 211.8 173.4 176.2 75 647.8 692.3 721.1 837.5 693.4 760.8 618.2 685.2 494.8 521.2
Percentage of short-term liabilitiesCash resources and short-term receivables 25 64.8 68.1 57.0 65.6 60.0 60.9 68.7 69.8 72.5 74.9
50 129.8 132.1 135.2 141.3 127.7 123.7 126.1 131.0 132.9 138.8 75 279.6 285.3 351.6 369.4 268.4 282.0 269.4 283.6 244.3 243.7
Percentage of cost of materialsTrade payables 25 4.0 3.6 4.9 4.2 4.8 4.7 4.0 3.5 2.9 2.5
50 9.1 8.6 13.4 11.6 9.8 9.5 8.1 7.9 7.3 6.7 75 18.7 17.8 30.9 28.3 19.9 18.7 15.6 14.9 13.4 13.5
* Agriculture, forestry and fishing, mining and quarrying, manufacturing, electricity, gas and water supply, construction, trade, transportation and storage,accommodation and food service activities, information and communication, business services, personal service activities

Deutsche BundesbankFinancial statement statistics (ratios - provisional data)May 2021222
IV. Enterprises by federal state and economic sector
cont'd: 7. Hessea) All economic sectors*
Non-corporationsEnterprises with sales of ... € million
Total Less than 2 2 but less than 10 10 but less than 50 50 and moreCylindered sample 2018/2019
Ratios 2018 2019 2018 2019 2018 2019 2018 2019 2018 2019Income statementIncome Percentage of gross revenueSales 99.5 100.1 99.3 98.0 98.1 99.0 99.9 99.1 99.5 100.2Change in finished goods 0.5 - 0.1 0.7 2.0 1.9 1.0 0.1 0.9 0.5 - 0.2Interest and similar income 0.2 0.3 0.2 0.2 0.1 0.1 0.1 0.1 0.2 0.3Other income 1.3 1.4 3.0 2.7 2.5 2.3 1.5 1.7 1.2 1.3
of which: Income from long-term equity investments 0.2 0.2 0.3 0.1 0.2 0.2 0.2 0.2 0.2 0.2Total income 101.5 101.7 103.2 102.9 102.6 102.5 101.6 101.8 101.4 101.6
ExpensesCost of materials 77.5 75.5 35.9 34.9 49.9 49.2 57.3 57.9 80.9 78.9Personnel expenses 11.1 12.3 24.4 23.8 23.7 23.7 21.3 21.5 9.5 10.7Depreciation 2.1 2.3 7.8 8.0 4.9 4.7 3.3 3.3 1.8 2.1
of which: Depreciation of tangible fixed assets 2.0 2.3 7.8 8.0 4.7 4.6 3.2 3.2 1.8 2.0Interest and similar expenses 0.8 0.6 2.1 1.9 1.3 1.2 1.0 1.0 0.8 0.6Operating taxes 0.1 0.1 0.2 0.2 0.1 0.1 0.1 0.1 0.0 0.0Other expenses 8.0 8.8 20.0 20.5 17.1 17.2 14.0 14.3 7.0 7.7Total expenses before taxes on income 99.6 99.6 90.4 89.2 96.9 96.0 97.0 98.0 100.0 100.0Annual result before taxes on income 1.9 2.0 12.9 13.7 5.7 6.5 4.5 3.8 1.4 1.6Taxes on income 0.3 0.3 1.6 1.6 0.9 1.0 0.7 0.7 0.2 0.3Annual result 1.6 1.7 11.3 12.0 4.7 5.5 3.9 3.1 1.1 1.3Profit and loss transfers (parent company) 0.2 0.2 0.0 0.0 0.2 0.3 0.0 0.0 0.2 0.3Profit and loss transfers (subsidiary) 0.0 0.0 - 0.1 0.1 0.0 0.0 - 0.1 0.0 0.0 0.0Profit for the year 1.7 2.0 11.4 12.0 4.9 5.8 4.0 3.2 1.3 1.6
Balance sheetAssets Percentage of the balance sheet totalIntangible fixed assets 1.5 2.0 0.2 0.3 0.5 0.5 1.5 1.4 1.6 2.2Tangible fixed assets 25.3 25.8 60.9 58.5 47.0 46.7 29.9 28.6 22.6 23.6
of which: Land and buildings 8.0 7.9 10.5 11.2 14.1 13.8 11.7 11.4 6.9 6.9Inventories 24.0 23.6 9.8 11.7 20.8 21.2 26.5 27.2 24.0 23.3
of which: Finished goods and merchandise 9.2 8.1 3.9 4.0 7.2 6.8 11.4 11.6 9.0 7.6Cash 5.2 5.2 10.3 11.2 8.5 9.0 11.1 11.5 3.9 3.8Receivables 34.0 33.6 16.7 16.4 19.3 18.4 27.0 25.4 36.4 36.3
Short-term 32.6 32.2 13.5 13.4 17.8 17.1 26.5 24.9 34.9 34.7 of which:
Trade receivables 10.8 11.0 7.0 6.8 10.4 9.9 14.9 14.0 10.2 10.6Receivables from affiliated companies 17.9 17.3 3.7 3.7 4.5 3.9 7.7 6.8 20.8 20.2
Long-term 1.4 1.4 3.2 3.0 1.5 1.3 0.5 0.5 1.5 1.6of which: Loans to affiliated companies 1.1 1.2 3.1 2.9 0.8 0.8 0.3 0.3 1.3 1.4
Securities 0.3 0.3 0.1 0.1 1.1 1.3 0.3 0.2 0.2 0.2Other long-term equity investments 9.1 8.8 1.6 1.4 1.9 2.1 3.3 5.4 10.7 9.9
of which: Goodwill 0.2 0.3 1.0 0.8 0.4 0.4 0.2 0.2 0.2 0.3
CapitalEquity 22.6 21.8 18.5 21.4 26.8 27.2 18.1 20.2 23.2 21.8Liabilities 63.7 64.8 77.8 74.9 67.4 67.0 68.3 66.9 62.5 64.1
Short-term 51.2 54.7 33.3 33.6 39.2 44.9 48.1 50.5 52.8 56.4of which:Liabilities to banks 8.0 9.8 11.3 11.8 10.3 15.1 8.5 10.1 7.7 9.4Trade payables 10.2 10.7 5.4 5.3 6.3 5.9 8.1 7.4 10.9 11.7Liabilities to affiliated companies 18.4 20.3 7.3 5.3 7.8 7.9 17.2 18.2 19.5 21.7
Long-term 12.5 10.1 44.5 41.3 28.2 22.1 20.3 16.4 9.7 7.8 of which:
Liabilities to banks 7.1 6.5 40.6 37.8 25.6 19.5 11.1 9.0 4.8 4.8Liabilities to affiliated companies 4.9 3.0 2.8 2.6 0.8 0.9 8.2 6.4 4.6 2.5
Provisions 12.8 12.5 3.1 3.4 5.6 5.7 11.1 10.6 13.6 13.4of which: Provisions for pensions 4.9 4.9 0.1 0.1 0.6 0.7 3.6 3.7 5.4 5.4
Other ratios Percentage of salesAnnual result before taxes on income 1.9 2.0 13.0 14.0 5.8 6.5 4.5 3.8 1.4 1.6Annual result and depreciation 3.7 4.0 19.2 20.4 9.8 10.2 7.2 6.5 3.0 3.4Trade receivables 4.6 5.2 7.4 7.0 8.7 8.0 8.7 8.3 4.0 4.7
Percentage of the balance sheet totalSales 234.6 212.8 94.4 96.0 119.7 124.3 171.0 168.1 255.1 227.9Annual result and interest paid 5.7 5.0 12.7 13.6 7.3 8.3 8.4 6.9 5.0 4.4
Percentage of liabilities and provisions less cashAnnual result and depreciation 11.9 11.8 25.5 29.1 18.2 19.9 17.4 15.9 10.4 10.5
Percentage of fixed assetsLong-term equity and liabilities 107.1 96.5 95.8 99.4 107.2 96.4 118.7 111.9 105.4 93.8
Percentage of short-term liabilitiesCash resources and short-term receivables 74.1 68.7 71.5 73.1 67.5 58.4 78.4 72.3 73.7 68.6Cash resources, short-term receivables and inventories 121.1 111.8 100.9 107.8 120.5 105.6 133.6 126.0 119.2 109.9
Percentage of cost of materialsTrade payables 5.6 6.7 15.7 15.6 10.3 9.5 8.3 7.5 5.3 6.5
Memo item:Balance sheet total in € billion 19.41 20.21 0.21 0.22 1.00 1.03 2.72 2.82 15.48 16.13Sales in € billion 45.52 43.00 0.20 0.21 1.20 1.28 4.65 4.74 39.48 36.77Number of enterprises 767 767 230 230 232 232 202 202 103 103
* Agriculture, forestry and fishing, mining and quarrying, manufacturing, electricity, gas and water supply, construction, trade, transportation and storage,accommodation and food service activities, information and communication, business services, personal service activities

Deutsche BundesbankFinancial statement statistics (ratios - provisional data)
May 2021223
IV. Enterprises by federal state and economic sector
cont'd: 7. Hessea) All economic sectors*
cont'd: Non-corporationsEnterprises with sales of ... € million
Total Less than 2 2 but less than 10 10 but less than 50 50 and moreQuartile Cylindered sample 2018/2019value 2018 2019 2018 2019 2018 2019 2018 2019 2018 2019Of the enterprises captured …
Ratios ... % had a ratio of less than …Percentage of gross revenue
Cost of materials 25 27.0 27.6 4.7 3.3 29.5 29.4 42.7 42.2 56.5 55.0 50 51.4 50.1 31.3 31.1 48.6 48.3 59.4 58.0 74.2 74.5 75 71.7 72.2 52.8 53.8 69.5 69.4 75.9 76.6 84.2 83.8
Personnel expenses 25 9.3 9.7 6.5 7.2 12.6 12.6 9.6 10.2 6.6 7.1 50 19.2 19.4 20.6 20.4 21.8 22.5 17.3 17.8 12.0 12.2 75 32.4 32.2 33.6 34.4 33.6 33.6 31.8 31.7 20.6 22.5
Depreciation 25 0.9 0.8 1.3 1.1 0.9 0.8 0.9 0.8 0.6 0.6 50 2.1 2.1 3.5 3.2 2.0 2.0 1.8 1.9 1.3 1.3 75 4.7 4.6 7.3 6.7 4.8 4.9 3.4 3.5 2.9 3.0
Annual result 25 1.3 1.3 4.0 5.0 1.8 1.6 1.0 0.9 0.3 0.4 50 4.0 4.5 12.3 12.1 3.9 4.7 2.6 2.3 1.6 1.3 75 10.9 11.0 23.3 21.2 7.5 8.7 5.5 5.2 4.4 4.1
Percentage of the balance sheet totalTangible fixed assets 25 7.4 7.4 7.9 7.5 7.8 7.7 6.6 6.6 5.5 7.1
50 21.2 20.9 27.7 24.5 21.6 19.5 19.8 20.5 17.0 18.6 75 48.3 49.0 63.8 61.5 49.4 53.1 42.1 41.2 35.2 34.6
Inventories 25 1.9 1.9 0.0 0.0 2.1 2.1 9.1 8.4 12.5 15.1 50 18.6 19.3 5.9 5.5 21.4 19.7 24.9 27.0 23.2 25.4 75 41.6 42.1 25.8 31.8 50.6 47.6 43.9 44.1 43.0 40.8
Equity 25 3.7 5.5 - 4.6 0.4 4.9 6.3 4.7 6.3 8.4 9.1 50 16.9 18.3 16.2 17.3 17.1 18.5 15.3 16.6 18.6 21.1 75 37.7 39.0 43.0 45.6 36.7 41.0 32.9 35.1 40.9 37.2
Short-term liabilities 25 28.9 27.4 18.3 15.6 30.9 26.1 34.0 30.6 31.0 36.0 50 53.4 51.9 44.3 46.4 56.6 52.3 55.7 54.7 52.5 54.5 75 76.4 74.5 82.3 75.9 77.2 74.7 73.7 74.9 73.2 71.5
Liabilities to banks 25 0.0 0.0 0.0 0.0 2.5 2.0 0.0 0.0 0.0 0.0 50 15.1 14.2 21.5 23.0 19.3 17.3 9.9 9.6 4.4 5.3 75 43.1 43.4 58.7 58.9 46.3 45.3 33.4 33.6 36.7 32.4
Percentage of salesAnnual result before taxes on income 25 1.7 1.8 4.4 5.8 2.3 2.1 1.4 1.2 0.5 0.5
50 4.8 5.1 13.7 13.9 5.0 5.4 3.1 3.0 1.9 1.6 75 12.4 12.5 26.0 24.3 9.1 10.3 6.1 6.0 5.3 4.8
Annual result and depreciation 25 3.7 3.7 7.6 9.1 4.2 4.2 3.0 2.8 1.5 1.7 50 7.9 8.2 19.0 18.5 7.7 7.9 5.6 5.0 3.8 3.7 75 17.9 17.7 32.6 32.3 13.3 15.0 9.9 9.9 9.7 8.8
Trade receivables 25 2.4 2.3 0.8 1.4 3.6 3.2 3.6 3.0 2.4 2.5 50 6.2 5.9 4.3 4.0 7.0 6.8 7.3 6.6 6.2 5.6 75 10.8 10.3 10.0 9.5 11.4 10.7 11.8 11.9 9.1 9.0
Percentage of the balance sheet totalAnnual result and interest paid 25 4.2 4.3 7.4 10.1 4.2 4.6 4.0 3.3 2.3 2.3
50 9.6 9.9 23.1 27.0 10.1 10.0 6.8 7.0 5.3 4.9 75 22.3 24.3 59.5 56.3 17.7 20.9 12.7 11.4 10.6 10.0
Percentage of liabilities and provisions less cashAnnual result and depreciation 25 8.2 8.6 12.8 15.7 9.0 9.3 7.6 7.5 6.0 6.9
50 19.1 20.6 40.5 37.7 18.6 19.7 15.6 14.7 12.0 12.3 75 52.5 55.9 103.6 128.9 46.8 55.4 29.7 29.8 26.7 25.6
Percentage of fixed assetsLong-term equity and liabilities 25 60.9 65.2 31.0 54.7 69.0 66.7 66.0 62.5 75.6 76.2
50 109.7 115.7 96.4 108.7 113.2 125.8 110.1 113.9 128.3 122.4 75 228.6 251.4 201.1 269.2 268.7 270.1 216.8 221.0 229.5 253.8
Percentage of short-term liabilitiesCash resources and short-term receivables 25 38.4 38.1 35.9 32.0 34.7 34.9 39.6 39.8 42.0 42.3
50 74.9 74.5 81.8 97.4 68.9 70.1 72.8 72.9 75.6 74.2 75 134.6 144.8 192.0 223.2 123.5 131.2 111.3 131.0 116.6 118.6
Percentage of cost of materialsTrade payables 25 3.9 3.6 3.8 3.9 4.6 3.9 3.7 3.3 2.9 2.4
50 8.1 7.7 9.9 9.6 9.5 8.6 6.5 6.1 6.6 7.3 75 15.3 14.5 21.8 23.2 15.5 15.6 12.0 10.8 11.2 11.2
* Agriculture, forestry and fishing, mining and quarrying, manufacturing, electricity, gas and water supply, construction, trade, transportation and storage,accommodation and food service activities, information and communication, business services, personal service activities

Deutsche BundesbankFinancial statement statistics (ratios - provisional data)May 2021224
IV. Enterprises by federal state and economic sector
7. Hesseb) Manufacturing
All legal formsEnterprises with sales of ... € million
Total Less than 2 2 but less than 10 10 but less than 50 50 and moreCylindered sample 2018/2019
Ratios 2018 2019 2018 2019 2018 2019 2018 2019 2018 2019Income statementIncome Percentage of gross revenueSales 98.6 98.9 98.8 94.8 98.2 97.4 98.9 99.7 98.6 98.8Change in finished goods 1.4 1.1 1.2 5.2 1.8 2.6 1.1 0.3 1.4 1.2Interest and similar income 0.3 0.8 0.1 0.1 0.1 0.1 0.1 0.1 0.3 0.8Other income 3.8 5.0 2.5 2.8 2.6 2.2 2.3 2.6 4.0 5.2
of which: Income from long-term equity investments 1.3 1.8 0.0 0.0 0.4 0.3 0.4 0.5 1.4 1.9Total income 104.1 105.7 102.7 102.9 102.7 102.4 102.5 102.7 104.3 106.0
ExpensesCost of materials 62.5 61.5 38.7 39.3 46.7 46.1 50.9 51.2 63.8 62.7Personnel expenses 17.3 19.2 35.7 35.3 30.9 31.4 26.7 27.2 16.3 18.2Depreciation 3.4 4.0 3.1 2.9 2.7 2.6 3.1 2.9 3.4 4.1
of which: Depreciation of tangible fixed assets 3.1 3.7 3.1 2.8 2.5 2.5 2.7 2.7 3.1 3.8Interest and similar expenses 1.7 1.5 0.9 0.9 0.8 0.8 0.8 0.8 1.8 1.6Operating taxes 0.0 0.0 0.2 0.2 0.1 0.1 0.1 0.1 0.0 0.0Other expenses 16.4 16.8 19.1 18.6 17.0 17.1 16.7 17.1 16.4 16.7Total expenses before taxes on income 101.4 103.0 97.8 97.1 98.2 98.1 98.2 99.1 101.7 103.4Annual result before taxes on income 2.7 2.7 4.9 5.8 4.5 4.3 4.3 3.6 2.6 2.6Taxes on income 0.6 0.6 1.3 1.2 1.1 1.0 1.0 1.1 0.5 0.5Annual result 2.2 2.2 3.6 4.5 3.4 3.3 3.2 2.5 2.1 2.1Profit and loss transfers (parent company) 2.3 2.3 0.0 0.0 0.2 0.4 0.1 0.2 2.5 2.6Profit and loss transfers (subsidiary) 3.2 3.2 0.4 0.4 0.6 0.9 0.7 0.4 3.5 3.5Profit for the year 1.3 1.3 3.2 4.2 3.0 2.7 2.6 2.3 1.1 1.2
Balance sheetAssets Percentage of the balance sheet totalIntangible fixed assets 5.5 4.5 0.4 0.6 1.7 1.6 1.6 1.5 5.8 4.7Tangible fixed assets 13.8 13.5 24.5 22.0 23.5 22.9 20.4 20.8 13.3 12.9
of which: Land and buildings 4.8 4.6 7.3 6.5 11.9 11.2 9.0 9.0 4.5 4.3Inventories 12.6 11.5 33.3 37.0 31.7 33.3 31.6 30.8 11.2 10.1
of which: Finished goods and merchandise 4.7 4.0 14.0 11.4 9.6 9.5 7.8 7.8 4.5 3.7Cash 3.0 2.9 12.7 13.8 10.2 11.1 9.3 10.0 2.5 2.3Receivables 31.5 31.2 23.5 21.0 28.0 25.1 29.5 28.2 31.6 31.5
Short-term 27.6 27.4 22.8 20.4 26.8 24.2 27.9 26.6 27.6 27.5 of which:
Trade receivables 5.5 5.1 13.9 12.4 16.3 13.9 13.6 12.9 4.9 4.5Receivables from affiliated companies 20.6 20.9 3.9 3.8 8.2 8.1 11.4 10.8 21.3 21.7
Long-term 3.9 3.8 0.7 0.5 1.3 0.9 1.6 1.6 4.1 3.9of which: Loans to affiliated companies 2.8 2.7 0.0 0.0 0.2 0.2 1.2 1.1 3.0 2.8
Securities 0.4 0.3 1.5 1.3 1.5 1.4 1.0 0.6 0.3 0.3Other long-term equity investments 33.0 35.9 3.5 3.7 2.8 4.1 6.3 7.7 35.0 37.9
of which: Goodwill 2.5 2.0 1.6 1.1 0.7 1.7 0.8 0.7 2.7 2.1
CapitalEquity 28.9 27.5 30.0 30.0 36.7 36.2 36.6 38.4 28.3 26.8Liabilities 53.5 54.5 58.9 60.3 52.3 53.7 49.9 48.6 53.8 54.8
Short-term 39.9 40.5 44.2 45.6 39.8 39.7 38.7 37.8 40.0 40.7of which:Liabilities to banks 1.6 1.3 11.4 10.7 6.9 6.4 5.4 6.0 1.3 1.0Trade payables 5.4 4.5 10.8 10.5 7.7 7.0 6.3 5.8 5.3 4.4Liabilities to affiliated companies 29.0 31.0 4.0 4.2 9.2 9.6 13.6 13.0 30.2 32.3
Long-term 13.6 13.9 14.7 14.7 12.5 14.0 11.1 10.7 13.8 14.1 of which:
Liabilities to banks 4.4 3.8 10.4 10.9 7.9 8.7 4.3 4.9 4.4 3.7Liabilities to affiliated companies 7.3 6.6 2.8 2.4 3.8 3.9 6.2 5.3 7.4 6.7
Provisions 17.3 17.2 11.1 9.6 10.8 9.8 13.4 13.0 17.6 17.5of which: Provisions for pensions 8.0 8.1 5.3 4.4 3.4 3.2 5.2 5.4 8.3 8.3
Other ratios Percentage of salesAnnual result before taxes on income 2.8 2.8 5.0 6.1 4.6 4.4 4.3 3.6 2.6 2.7Annual result and depreciation 5.6 6.2 6.8 7.8 6.2 6.1 6.3 5.4 5.6 6.3Trade receivables 5.5 5.8 8.2 8.2 11.3 10.1 10.3 9.7 5.0 5.3
Percentage of the balance sheet totalSales 100.8 88.6 169.4 151.0 144.8 136.8 132.1 132.2 98.3 85.4Annual result and interest paid 4.0 3.3 7.7 8.6 6.2 5.8 5.4 4.4 3.8 3.2
Percentage of liabilities and provisions less cashAnnual result and depreciation 8.4 7.9 20.1 20.9 16.9 15.8 15.5 13.8 7.9 7.6
Percentage of fixed assetsLong-term equity and liabilities 89.6 85.8 171.5 182.5 173.7 176.2 173.3 170.8 86.3 82.6
Percentage of short-term liabilitiesCash resources and short-term receivables 77.1 75.2 83.5 77.9 94.2 90.2 96.8 97.4 75.8 73.8Cash resources, short-term receivables and inventories 108.7 103.7 159.0 158.8 173.8 174.2 178.4 178.8 103.7 98.7
Percentage of cost of materialsTrade payables 8.4 8.2 16.4 16.8 11.2 10.8 9.3 8.6 8.4 8.1
Memo item:Balance sheet total in € billion 96.78 103.69 0.07 0.08 0.82 0.89 5.84 5.96 90.04 96.75Sales in € billion 97.52 91.89 0.12 0.13 1.19 1.22 7.72 7.88 88.49 82.66Number of enterprises 863 863 112 112 212 212 312 312 227 227

Deutsche BundesbankFinancial statement statistics (ratios - provisional data)
May 2021225
IV. Enterprises by federal state and economic sector
cont'd: 7. Hesseb) Manufacturing
cont'd: All legal formsEnterprises with sales of ... € million
Total Less than 2 2 but less than 10 10 but less than 50 50 and moreQuartile Cylindered sample 2018/2019value 2018 2019 2018 2019 2018 2019 2018 2019 2018 2019Of the enterprises captured …
Ratios ... % had a ratio of less than …Percentage of gross revenue
Cost of materials 25 37.8 37.4 26.9 27.4 34.3 34.4 39.4 39.6 46.4 46.5 50 49.3 49.2 36.5 36.3 46.9 44.9 49.7 50.2 56.5 57.3 75 60.5 60.0 47.2 49.4 56.3 57.0 59.9 59.5 69.4 68.5
Personnel expenses 25 18.5 18.7 27.1 23.5 22.3 23.4 18.6 18.8 12.2 13.1 50 27.5 27.8 35.3 37.5 30.6 32.2 27.6 27.8 20.9 21.9 75 36.3 37.2 45.3 47.6 39.7 40.1 35.3 36.2 28.1 29.2
Depreciation 25 1.1 1.1 1.1 1.0 1.0 1.0 1.2 1.2 1.0 1.1 50 2.1 2.2 2.2 1.9 1.6 1.7 2.2 2.4 2.2 2.4 75 3.8 3.9 3.9 4.4 3.2 3.2 4.0 4.2 3.8 3.9
Annual result 25 0.5 0.3 0.1 0.3 0.6 0.5 0.6 0.2 0.5 0.0 50 2.7 2.4 2.0 2.6 2.9 2.3 2.7 2.5 2.9 2.3 75 6.5 6.2 6.3 7.0 5.7 5.8 6.6 6.2 7.1 6.4
Percentage of the balance sheet totalTangible fixed assets 25 6.4 6.4 6.2 6.2 5.9 5.4 7.1 7.3 6.0 6.4
50 16.2 16.7 17.8 15.0 12.4 14.4 18.4 20.2 15.9 16.3 75 32.4 32.6 34.2 34.9 31.3 29.8 33.9 34.2 28.6 30.3
Inventories 25 13.3 12.6 5.9 5.6 14.3 15.0 16.5 16.5 10.3 9.0 50 26.4 26.0 23.1 20.7 31.7 32.2 30.4 29.6 19.9 19.5 75 44.5 44.2 49.1 54.1 51.2 52.9 45.4 43.6 33.0 32.5
Equity 25 14.2 15.5 3.3 8.8 10.8 13.0 16.6 20.6 15.5 16.2 50 32.7 32.7 27.2 28.8 34.2 32.3 35.6 36.9 29.9 30.2 75 53.9 54.1 48.9 54.3 56.5 54.9 57.1 56.0 47.3 46.9
Short-term liabilities 25 19.0 18.7 17.6 18.4 19.8 19.4 19.1 18.1 17.7 18.2 50 34.6 35.0 36.2 38.7 35.8 36.1 34.9 35.0 30.2 32.4 75 57.5 55.5 74.3 64.6 62.2 59.4 55.9 55.0 51.7 51.0
Liabilities to banks 25 0.0 0.0 0.0 0.0 0.0 0.0 0.0 0.0 0.0 0.0 50 2.3 2.4 16.8 15.2 8.1 9.6 1.9 1.8 0.0 0.0 75 20.6 21.6 33.4 39.4 26.4 26.3 16.8 18.2 9.0 6.7
Percentage of salesAnnual result before taxes on income 25 0.7 0.4 0.1 0.4 1.1 0.6 0.7 0.3 0.6 0.2
50 3.6 3.2 2.4 3.3 3.7 3.2 3.7 3.3 3.8 2.9 75 7.9 8.0 7.2 8.2 7.6 7.9 8.3 8.2 8.0 7.6
Annual result and depreciation 25 2.8 2.6 2.7 3.2 3.1 2.8 3.0 2.7 2.5 2.0 50 6.2 6.1 5.7 6.6 6.0 5.6 6.7 6.3 6.2 6.3 75 11.3 11.1 10.4 11.2 10.4 10.7 12.2 10.6 12.0 11.3
Trade receivables 25 3.9 3.3 3.1 2.7 4.8 4.7 4.0 3.4 3.6 2.8 50 8.1 7.5 6.4 6.1 8.6 8.1 8.7 7.7 7.6 7.4 75 12.5 11.9 11.5 9.4 15.4 14.0 12.8 12.6 11.3 10.8
Percentage of the balance sheet totalAnnual result and interest paid 25 2.1 1.5 1.6 2.0 2.4 1.8 2.1 1.2 2.4 1.4
50 5.9 5.1 5.7 6.7 6.3 5.6 5.8 5.2 5.9 4.5 75 12.3 12.1 14.6 17.5 11.9 11.8 11.5 10.8 12.7 11.4
Percentage of liabilities and provisions less cashAnnual result and depreciation 25 4.2 3.9 1.0 3.2 3.5 4.3 5.3 4.9 4.7 2.9
50 15.2 15.0 11.2 14.6 14.9 15.7 17.9 17.0 15.1 12.3 75 37.7 37.2 36.9 39.7 40.7 39.8 44.8 43.1 28.9 31.2
Percentage of fixed assetsLong-term equity and liabilities 25 110.0 112.0 93.4 111.7 111.6 121.6 112.7 114.9 106.1 107.6
50 186.2 188.7 189.1 210.9 196.4 216.1 186.2 184.7 166.9 172.9 75 390.8 391.0 577.8 489.6 534.5 542.1 382.2 354.1 274.9 265.5
Percentage of short-term liabilitiesCash resources and short-term receivables 25 56.2 55.5 40.8 33.6 47.9 44.9 55.1 58.1 69.1 70.8
50 104.0 105.2 108.3 105.6 99.0 94.5 95.5 96.9 114.6 123.6 75 214.0 224.0 219.5 228.6 207.3 214.9 203.3 205.0 241.3 237.1
Percentage of cost of materialsTrade payables 25 4.2 3.9 4.4 4.9 4.9 4.7 4.0 3.6 4.0 3.7
50 7.9 7.6 10.8 11.3 8.4 8.9 7.1 6.4 7.9 7.5 75 14.5 14.2 24.6 23.6 15.3 15.1 12.0 12.1 13.9 13.5

Deutsche BundesbankFinancial statement statistics (ratios - provisional data)May 2021226
IV. Enterprises by federal state and economic sector
8. Mecklenburg-West Pomerania All economic sectors*
All legal formsEnterprises with sales of ... € million
Total Less than 2 2 but less than 10 10 but less than 50 50 and moreCylindered sample 2018/2019
Ratios 2018 2019 2018 2019 2018 2019 2018 2019 2018 2019Income statementIncome Percentage of gross revenueSales 99.2 99.0 100.0 97.3 98.6 96.9 99.1 99.6 99.4 99.1Change in finished goods 0.8 1.0 0.0 2.7 1.4 3.1 0.9 0.4 0.6 0.9Interest and similar income 0.2 0.2 0.4 0.3 0.1 0.1 0.2 0.2 0.3 0.3Other income 3.9 3.7 10.5 10.1 5.4 5.5 4.2 3.9 3.3 3.1
of which: Income from long-term equity investments 0.1 0.1 0.3 0.6 0.0 0.1 0.1 0.2 0.1 0.1Total income 104.1 103.9 110.9 110.4 105.5 105.6 104.3 104.1 103.6 103.4
ExpensesCost of materials 64.9 63.9 37.7 38.3 50.5 50.3 58.3 57.5 71.5 70.3Personnel expenses 17.6 18.1 30.8 30.2 26.7 27.0 22.7 23.6 12.9 13.3Depreciation 4.7 4.9 10.7 8.7 5.7 5.6 4.4 4.4 4.5 4.9
of which: Depreciation of tangible fixed assets 4.5 4.7 10.6 8.6 5.6 5.6 4.2 4.2 4.3 4.7Interest and similar expenses 1.3 1.3 2.5 2.2 1.3 1.2 0.8 0.8 1.6 1.6Operating taxes 0.1 0.1 0.3 0.3 0.1 0.1 0.1 0.1 0.0 0.1Other expenses 11.9 12.3 22.4 21.5 16.4 16.3 13.2 12.9 10.2 11.1Total expenses before taxes on income 100.4 100.6 104.4 101.2 100.7 100.5 99.5 99.3 100.8 101.2Annual result before taxes on income 3.7 3.3 6.4 9.2 4.8 5.1 4.9 4.8 2.8 2.1Taxes on income 0.9 0.8 1.1 1.6 1.1 1.1 1.1 1.0 0.7 0.6Annual result 2.8 2.5 5.3 7.7 3.7 4.0 3.7 3.8 2.1 1.5Profit and loss transfers (parent company) 0.2 0.2 - 0.3 - 0.2 0.1 0.0 0.0 0.0 0.4 0.3Profit and loss transfers (subsidiary) 0.7 0.6 0.2 0.2 0.1 0.0 0.8 0.9 0.7 0.5Profit for the year 2.4 2.1 4.8 7.2 3.6 4.0 2.9 2.8 1.8 1.3
Balance sheetAssets Percentage of the balance sheet totalIntangible fixed assets 4.6 7.4 0.7 0.6 0.6 0.5 0.9 0.8 7.6 12.6Tangible fixed assets 47.0 45.0 60.0 59.0 61.6 58.4 46.8 46.1 43.5 41.0
of which: Land and buildings 20.8 19.9 30.0 29.8 27.4 26.2 21.3 20.9 18.8 17.7Inventories 14.4 14.9 8.7 10.2 14.6 17.0 20.1 20.4 11.5 11.8
of which: Finished goods and merchandise 4.6 4.8 2.9 3.4 3.9 4.1 6.9 7.4 3.6 3.7Cash 7.5 6.1 8.9 8.5 8.4 9.0 8.2 7.7 6.9 4.6Receivables 19.5 20.0 18.2 18.6 13.0 13.5 20.0 21.2 20.6 20.8
Short-term 16.9 17.4 15.8 16.4 12.8 13.3 18.7 19.7 16.9 17.1 of which:
Trade receivables 7.9 7.9 5.5 6.7 6.7 6.5 7.9 8.3 8.2 8.1Receivables from affiliated companies 6.6 6.8 8.2 7.2 3.8 4.2 8.1 8.1 6.3 6.7
Long-term 2.6 2.6 2.4 2.1 0.2 0.2 1.3 1.5 3.7 3.7of which: Loans to affiliated companies 2.4 2.3 1.1 0.9 0.1 0.1 1.1 1.3 3.7 3.3
Securities 0.3 0.3 0.5 0.5 0.3 0.2 0.5 0.5 0.2 0.2Other long-term equity investments 6.3 5.9 1.6 1.4 0.4 0.4 3.1 2.9 9.4 8.7
of which: Goodwill 0.3 0.3 0.2 0.2 0.0 0.0 0.5 0.4 0.3 0.2
CapitalEquity 39.4 38.5 36.7 37.4 41.0 40.8 42.1 42.3 37.8 36.1Liabilities 54.4 55.0 59.8 58.8 54.7 55.2 50.6 50.4 56.1 57.2
Short-term 27.3 27.4 27.4 30.7 28.1 30.0 34.2 34.5 23.4 23.0of which:Liabilities to banks 4.6 5.3 9.5 11.5 6.4 6.2 7.0 7.3 2.7 3.8Trade payables 5.5 5.5 4.8 4.5 5.1 5.1 5.9 6.1 5.3 5.2Liabilities to affiliated companies 8.4 8.3 7.6 8.1 5.7 7.1 8.2 8.6 9.0 8.3
Long-term 27.0 27.6 32.4 28.1 26.6 25.2 16.4 15.8 32.7 34.2 of which:
Liabilities to banks 16.7 17.9 27.8 24.0 21.1 20.8 12.3 11.9 17.8 20.2Liabilities to affiliated companies 5.1 4.9 3.4 2.8 4.7 3.5 2.8 2.5 6.6 6.5
Provisions 5.8 6.0 3.0 3.2 3.8 3.5 6.5 6.5 6.0 6.4of which: Provisions for pensions 0.6 0.6 0.2 0.2 0.4 0.4 0.9 1.0 0.5 0.5
Other ratios Percentage of salesAnnual result before taxes on income 3.7 3.4 6.4 9.5 4.8 5.2 4.9 4.8 2.8 2.2Annual result and depreciation 7.6 7.5 16.0 16.8 9.5 9.9 8.2 8.2 6.7 6.5Trade receivables 7.5 7.6 9.1 11.1 7.7 7.6 7.3 7.7 7.6 7.5
Percentage of the balance sheet totalSales 104.8 103.9 60.6 60.7 87.4 85.5 107.9 108.7 108.6 107.0Annual result and interest paid 4.4 4.0 4.7 6.2 4.4 4.6 5.0 4.9 4.0 3.3
Percentage of liabilities and provisions less cashAnnual result and depreciation 14.9 14.1 17.8 18.9 16.4 16.8 17.8 17.9 13.1 11.7
Percentage of fixed assetsLong-term equity and liabilities 110.7 109.4 106.3 103.6 108.2 111.4 113.6 114.7 110.2 107.1
Percentage of short-term liabilitiesCash resources and short-term receivables 90.0 86.4 90.4 81.7 76.1 74.6 79.6 80.4 101.7 94.5Cash resources, short-term receivables and inventories 142.7 140.7 122.1 114.9 128.0 131.3 138.6 139.4 150.8 145.7
Percentage of cost of materialsTrade payables 8.0 8.1 20.9 19.0 11.5 11.5 9.4 9.7 6.8 6.9
Memo item:Balance sheet total in € billion 17.37 18.21 0.42 0.44 1.98 2.10 5.29 5.44 9.68 10.24Sales in € billion 18.21 18.93 0.26 0.26 1.73 1.80 5.71 5.91 10.51 10.96Number of enterprises 944 944 269 269 359 359 250 250 66 66
* Agriculture, forestry and fishing, mining and quarrying, manufacturing, electricity, gas and water supply, construction, trade, transportation and storage,accommodation and food service activities, information and communication, business services, personal service activities
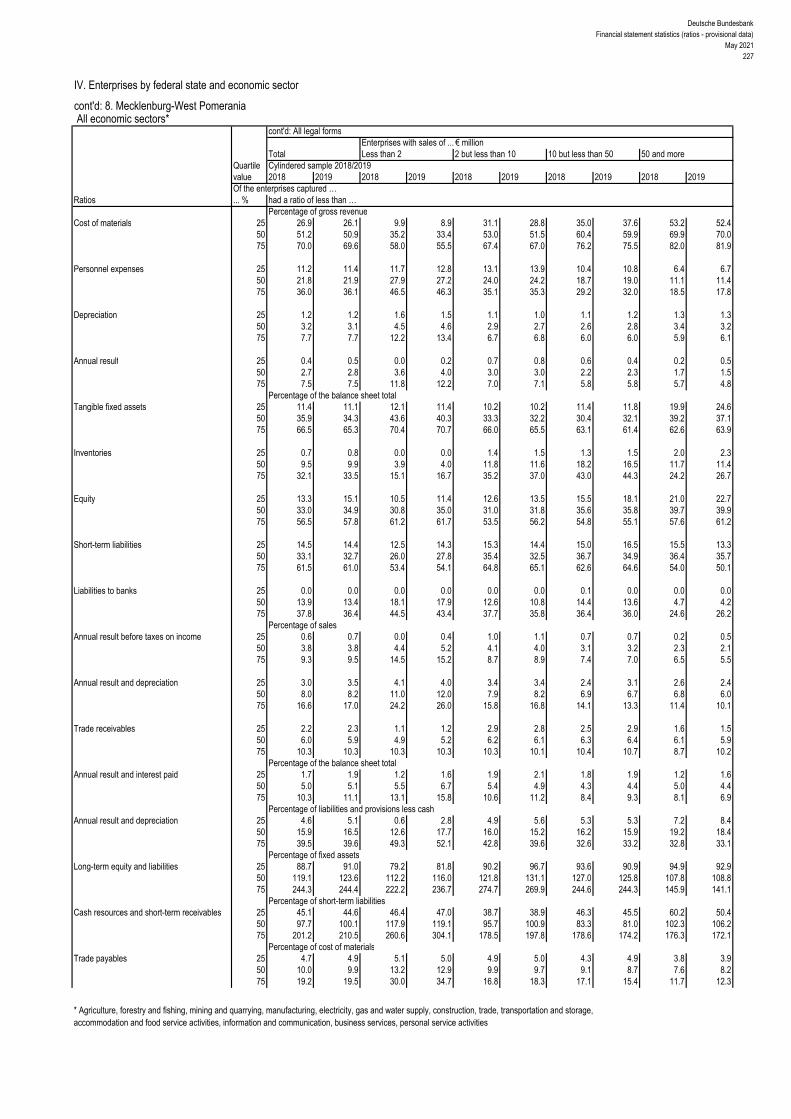
Deutsche BundesbankFinancial statement statistics (ratios - provisional data)
May 2021227
IV. Enterprises by federal state and economic sector
cont'd: 8. Mecklenburg-West Pomerania All economic sectors*
cont'd: All legal formsEnterprises with sales of ... € million
Total Less than 2 2 but less than 10 10 but less than 50 50 and moreQuartile Cylindered sample 2018/2019value 2018 2019 2018 2019 2018 2019 2018 2019 2018 2019Of the enterprises captured …
Ratios ... % had a ratio of less than …Percentage of gross revenue
Cost of materials 25 26.9 26.1 9.9 8.9 31.1 28.8 35.0 37.6 53.2 52.4 50 51.2 50.9 35.2 33.4 53.0 51.5 60.4 59.9 69.9 70.0 75 70.0 69.6 58.0 55.5 67.4 67.0 76.2 75.5 82.0 81.9
Personnel expenses 25 11.2 11.4 11.7 12.8 13.1 13.9 10.4 10.8 6.4 6.7 50 21.8 21.9 27.9 27.2 24.0 24.2 18.7 19.0 11.1 11.4 75 36.0 36.1 46.5 46.3 35.1 35.3 29.2 32.0 18.5 17.8
Depreciation 25 1.2 1.2 1.6 1.5 1.1 1.0 1.1 1.2 1.3 1.3 50 3.2 3.1 4.5 4.6 2.9 2.7 2.6 2.8 3.4 3.2 75 7.7 7.7 12.2 13.4 6.7 6.8 6.0 6.0 5.9 6.1
Annual result 25 0.4 0.5 0.0 0.2 0.7 0.8 0.6 0.4 0.2 0.5 50 2.7 2.8 3.6 4.0 3.0 3.0 2.2 2.3 1.7 1.5 75 7.5 7.5 11.8 12.2 7.0 7.1 5.8 5.8 5.7 4.8
Percentage of the balance sheet totalTangible fixed assets 25 11.4 11.1 12.1 11.4 10.2 10.2 11.4 11.8 19.9 24.6
50 35.9 34.3 43.6 40.3 33.3 32.2 30.4 32.1 39.2 37.1 75 66.5 65.3 70.4 70.7 66.0 65.5 63.1 61.4 62.6 63.9
Inventories 25 0.7 0.8 0.0 0.0 1.4 1.5 1.3 1.5 2.0 2.3 50 9.5 9.9 3.9 4.0 11.8 11.6 18.2 16.5 11.7 11.4 75 32.1 33.5 15.1 16.7 35.2 37.0 43.0 44.3 24.2 26.7
Equity 25 13.3 15.1 10.5 11.4 12.6 13.5 15.5 18.1 21.0 22.7 50 33.0 34.9 30.8 35.0 31.0 31.8 35.6 35.8 39.7 39.9 75 56.5 57.8 61.2 61.7 53.5 56.2 54.8 55.1 57.6 61.2
Short-term liabilities 25 14.5 14.4 12.5 14.3 15.3 14.4 15.0 16.5 15.5 13.3 50 33.1 32.7 26.0 27.8 35.4 32.5 36.7 34.9 36.4 35.7 75 61.5 61.0 53.4 54.1 64.8 65.1 62.6 64.6 54.0 50.1
Liabilities to banks 25 0.0 0.0 0.0 0.0 0.0 0.0 0.1 0.0 0.0 0.0 50 13.9 13.4 18.1 17.9 12.6 10.8 14.4 13.6 4.7 4.2 75 37.8 36.4 44.5 43.4 37.7 35.8 36.4 36.0 24.6 26.2
Percentage of salesAnnual result before taxes on income 25 0.6 0.7 0.0 0.4 1.0 1.1 0.7 0.7 0.2 0.5
50 3.8 3.8 4.4 5.2 4.1 4.0 3.1 3.2 2.3 2.1 75 9.3 9.5 14.5 15.2 8.7 8.9 7.4 7.0 6.5 5.5
Annual result and depreciation 25 3.0 3.5 4.1 4.0 3.4 3.4 2.4 3.1 2.6 2.4 50 8.0 8.2 11.0 12.0 7.9 8.2 6.9 6.7 6.8 6.0 75 16.6 17.0 24.2 26.0 15.8 16.8 14.1 13.3 11.4 10.1
Trade receivables 25 2.2 2.3 1.1 1.2 2.9 2.8 2.5 2.9 1.6 1.5 50 6.0 5.9 4.9 5.2 6.2 6.1 6.3 6.4 6.1 5.9 75 10.3 10.3 10.3 10.3 10.3 10.1 10.4 10.7 8.7 10.2
Percentage of the balance sheet totalAnnual result and interest paid 25 1.7 1.9 1.2 1.6 1.9 2.1 1.8 1.9 1.2 1.6
50 5.0 5.1 5.5 6.7 5.4 4.9 4.3 4.4 5.0 4.4 75 10.3 11.1 13.1 15.8 10.6 11.2 8.4 9.3 8.1 6.9
Percentage of liabilities and provisions less cashAnnual result and depreciation 25 4.6 5.1 0.6 2.8 4.9 5.6 5.3 5.3 7.2 8.4
50 15.9 16.5 12.6 17.7 16.0 15.2 16.2 15.9 19.2 18.4 75 39.5 39.6 49.3 52.1 42.8 39.6 32.6 33.2 32.8 33.1
Percentage of fixed assetsLong-term equity and liabilities 25 88.7 91.0 79.2 81.8 90.2 96.7 93.6 90.9 94.9 92.9
50 119.1 123.6 112.2 116.0 121.8 131.1 127.0 125.8 107.8 108.8 75 244.3 244.4 222.2 236.7 274.7 269.9 244.6 244.3 145.9 141.1
Percentage of short-term liabilitiesCash resources and short-term receivables 25 45.1 44.6 46.4 47.0 38.7 38.9 46.3 45.5 60.2 50.4
50 97.7 100.1 117.9 119.1 95.7 100.9 83.3 81.0 102.3 106.2 75 201.2 210.5 260.6 304.1 178.5 197.8 178.6 174.2 176.3 172.1
Percentage of cost of materialsTrade payables 25 4.7 4.9 5.1 5.0 4.9 5.0 4.3 4.9 3.8 3.9
50 10.0 9.9 13.2 12.9 9.9 9.7 9.1 8.7 7.6 8.2 75 19.2 19.5 30.0 34.7 16.8 18.3 17.1 15.4 11.7 12.3
* Agriculture, forestry and fishing, mining and quarrying, manufacturing, electricity, gas and water supply, construction, trade, transportation and storage,accommodation and food service activities, information and communication, business services, personal service activities
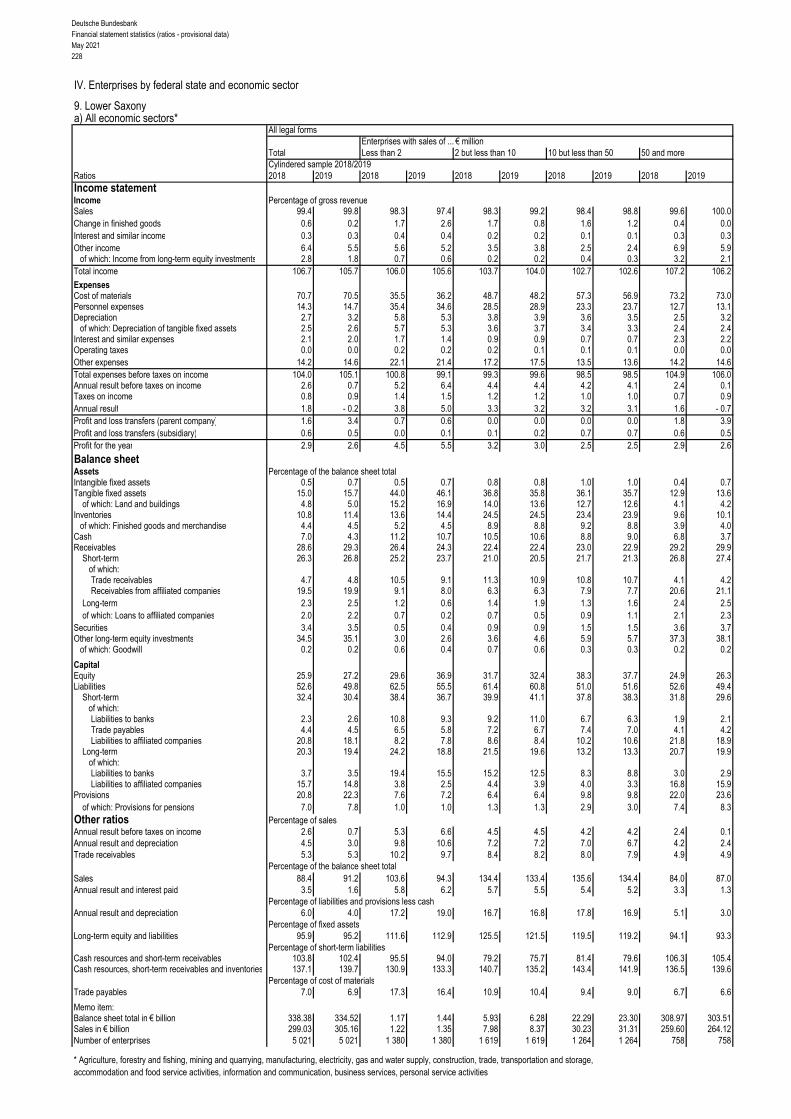
Deutsche BundesbankFinancial statement statistics (ratios - provisional data)May 2021228
IV. Enterprises by federal state and economic sector
9. Lower Saxonya) All economic sectors*
All legal formsEnterprises with sales of ... € million
Total Less than 2 2 but less than 10 10 but less than 50 50 and moreCylindered sample 2018/2019
Ratios 2018 2019 2018 2019 2018 2019 2018 2019 2018 2019Income statementIncome Percentage of gross revenueSales 99.4 99.8 98.3 97.4 98.3 99.2 98.4 98.8 99.6 100.0Change in finished goods 0.6 0.2 1.7 2.6 1.7 0.8 1.6 1.2 0.4 0.0Interest and similar income 0.3 0.3 0.4 0.4 0.2 0.2 0.1 0.1 0.3 0.3Other income 6.4 5.5 5.6 5.2 3.5 3.8 2.5 2.4 6.9 5.9
of which: Income from long-term equity investments 2.8 1.8 0.7 0.6 0.2 0.2 0.4 0.3 3.2 2.1Total income 106.7 105.7 106.0 105.6 103.7 104.0 102.7 102.6 107.2 106.2
ExpensesCost of materials 70.7 70.5 35.5 36.2 48.7 48.2 57.3 56.9 73.2 73.0Personnel expenses 14.3 14.7 35.4 34.6 28.5 28.9 23.3 23.7 12.7 13.1Depreciation 2.7 3.2 5.8 5.3 3.8 3.9 3.6 3.5 2.5 3.2
of which: Depreciation of tangible fixed assets 2.5 2.6 5.7 5.3 3.6 3.7 3.4 3.3 2.4 2.4Interest and similar expenses 2.1 2.0 1.7 1.4 0.9 0.9 0.7 0.7 2.3 2.2Operating taxes 0.0 0.0 0.2 0.2 0.2 0.1 0.1 0.1 0.0 0.0Other expenses 14.2 14.6 22.1 21.4 17.2 17.5 13.5 13.6 14.2 14.6Total expenses before taxes on income 104.0 105.1 100.8 99.1 99.3 99.6 98.5 98.5 104.9 106.0Annual result before taxes on income 2.6 0.7 5.2 6.4 4.4 4.4 4.2 4.1 2.4 0.1Taxes on income 0.8 0.9 1.4 1.5 1.2 1.2 1.0 1.0 0.7 0.9Annual result 1.8 - 0.2 3.8 5.0 3.3 3.2 3.2 3.1 1.6 - 0.7Profit and loss transfers (parent company) 1.6 3.4 0.7 0.6 0.0 0.0 0.0 0.0 1.8 3.9Profit and loss transfers (subsidiary) 0.6 0.5 0.0 0.1 0.1 0.2 0.7 0.7 0.6 0.5Profit for the year 2.9 2.6 4.5 5.5 3.2 3.0 2.5 2.5 2.9 2.6
Balance sheetAssets Percentage of the balance sheet totalIntangible fixed assets 0.5 0.7 0.5 0.7 0.8 0.8 1.0 1.0 0.4 0.7Tangible fixed assets 15.0 15.7 44.0 46.1 36.8 35.8 36.1 35.7 12.9 13.6
of which: Land and buildings 4.8 5.0 15.2 16.9 14.0 13.6 12.7 12.6 4.1 4.2Inventories 10.8 11.4 13.6 14.4 24.5 24.5 23.4 23.9 9.6 10.1
of which: Finished goods and merchandise 4.4 4.5 5.2 4.5 8.9 8.8 9.2 8.8 3.9 4.0Cash 7.0 4.3 11.2 10.7 10.5 10.6 8.8 9.0 6.8 3.7Receivables 28.6 29.3 26.4 24.3 22.4 22.4 23.0 22.9 29.2 29.9
Short-term 26.3 26.8 25.2 23.7 21.0 20.5 21.7 21.3 26.8 27.4 of which:
Trade receivables 4.7 4.8 10.5 9.1 11.3 10.9 10.8 10.7 4.1 4.2Receivables from affiliated companies 19.5 19.9 9.1 8.0 6.3 6.3 7.9 7.7 20.6 21.1
Long-term 2.3 2.5 1.2 0.6 1.4 1.9 1.3 1.6 2.4 2.5of which: Loans to affiliated companies 2.0 2.2 0.7 0.2 0.7 0.5 0.9 1.1 2.1 2.3
Securities 3.4 3.5 0.5 0.4 0.9 0.9 1.5 1.5 3.6 3.7Other long-term equity investments 34.5 35.1 3.0 2.6 3.6 4.6 5.9 5.7 37.3 38.1
of which: Goodwill 0.2 0.2 0.6 0.4 0.7 0.6 0.3 0.3 0.2 0.2
CapitalEquity 25.9 27.2 29.6 36.9 31.7 32.4 38.3 37.7 24.9 26.3Liabilities 52.6 49.8 62.5 55.5 61.4 60.8 51.0 51.6 52.6 49.4
Short-term 32.4 30.4 38.4 36.7 39.9 41.1 37.8 38.3 31.8 29.6of which:Liabilities to banks 2.3 2.6 10.8 9.3 9.2 11.0 6.7 6.3 1.9 2.1Trade payables 4.4 4.5 6.5 5.8 7.2 6.7 7.4 7.0 4.1 4.2Liabilities to affiliated companies 20.8 18.1 8.2 7.8 8.6 8.4 10.2 10.6 21.8 18.9
Long-term 20.3 19.4 24.2 18.8 21.5 19.6 13.2 13.3 20.7 19.9 of which:
Liabilities to banks 3.7 3.5 19.4 15.5 15.2 12.5 8.3 8.8 3.0 2.9Liabilities to affiliated companies 15.7 14.8 3.8 2.5 4.4 3.9 4.0 3.3 16.8 15.9
Provisions 20.8 22.3 7.6 7.2 6.4 6.4 9.8 9.8 22.0 23.6of which: Provisions for pensions 7.0 7.8 1.0 1.0 1.3 1.3 2.9 3.0 7.4 8.3
Other ratios Percentage of salesAnnual result before taxes on income 2.6 0.7 5.3 6.6 4.5 4.5 4.2 4.2 2.4 0.1Annual result and depreciation 4.5 3.0 9.8 10.6 7.2 7.2 7.0 6.7 4.2 2.4Trade receivables 5.3 5.3 10.2 9.7 8.4 8.2 8.0 7.9 4.9 4.9
Percentage of the balance sheet totalSales 88.4 91.2 103.6 94.3 134.4 133.4 135.6 134.4 84.0 87.0Annual result and interest paid 3.5 1.6 5.8 6.2 5.7 5.5 5.4 5.2 3.3 1.3
Percentage of liabilities and provisions less cashAnnual result and depreciation 6.0 4.0 17.2 19.0 16.7 16.8 17.8 16.9 5.1 3.0
Percentage of fixed assetsLong-term equity and liabilities 95.9 95.2 111.6 112.9 125.5 121.5 119.5 119.2 94.1 93.3
Percentage of short-term liabilitiesCash resources and short-term receivables 103.8 102.4 95.5 94.0 79.2 75.7 81.4 79.6 106.3 105.4Cash resources, short-term receivables and inventories 137.1 139.7 130.9 133.3 140.7 135.2 143.4 141.9 136.5 139.6
Percentage of cost of materialsTrade payables 7.0 6.9 17.3 16.4 10.9 10.4 9.4 9.0 6.7 6.6
Memo item:Balance sheet total in € billion 338.38 334.52 1.17 1.44 5.93 6.28 22.29 23.30 308.97 303.51Sales in € billion 299.03 305.16 1.22 1.35 7.98 8.37 30.23 31.31 259.60 264.12Number of enterprises 5 021 5 021 1 380 1 380 1 619 1 619 1 264 1 264 758 758
* Agriculture, forestry and fishing, mining and quarrying, manufacturing, electricity, gas and water supply, construction, trade, transportation and storage,accommodation and food service activities, information and communication, business services, personal service activities

Deutsche BundesbankFinancial statement statistics (ratios - provisional data)
May 2021229
IV. Enterprises by federal state and economic sector
cont'd: 9. Lower Saxonya) All economic sectors*
cont'd: All legal formsEnterprises with sales of ... € million
Total Less than 2 2 but less than 10 10 but less than 50 50 and moreQuartile Cylindered sample 2018/2019value 2018 2019 2018 2019 2018 2019 2018 2019 2018 2019Of the enterprises captured …
Ratios ... % had a ratio of less than …Percentage of gross revenue
Cost of materials 25 28.0 27.2 7.8 7.2 29.5 28.1 40.4 39.6 52.2 51.7 50 49.8 49.6 31.7 30.8 48.5 47.7 60.2 59.7 70.2 70.4 75 71.0 70.4 49.7 50.2 66.2 65.6 76.2 76.3 83.9 84.1
Personnel expenses 25 11.0 11.2 15.8 16.2 14.5 14.8 9.9 10.1 5.9 6.1 50 23.2 23.9 32.4 31.3 26.7 27.1 18.5 19.1 12.4 13.0 75 37.8 38.5 46.1 46.1 38.5 39.8 32.7 33.0 22.7 23.3
Depreciation 25 0.8 0.8 1.0 0.9 0.8 0.8 0.7 0.7 0.6 0.6 50 1.9 1.9 2.3 2.4 1.8 1.8 1.7 1.8 1.5 1.4 75 4.2 4.2 5.7 5.5 4.0 3.9 4.0 3.9 3.3 3.4
Annual result 25 0.4 0.6 0.2 1.0 0.6 0.5 0.6 0.7 0.2 0.2 50 2.4 2.7 3.8 4.2 2.3 2.7 2.2 2.5 1.6 1.5 75 6.3 6.6 10.1 10.5 5.8 6.1 5.1 5.4 4.2 4.3
Percentage of the balance sheet totalTangible fixed assets 25 5.5 5.7 5.3 5.5 5.2 5.4 6.0 6.2 6.0 6.1
50 18.8 18.6 20.5 19.4 16.3 16.6 20.8 20.9 18.7 18.6 75 43.8 43.6 49.3 48.8 40.9 40.7 44.6 44.8 37.9 38.4
Inventories 25 1.4 1.3 0.0 0.0 2.2 2.3 3.0 3.2 4.6 4.4 50 17.0 17.0 6.3 5.8 21.1 20.2 23.4 23.2 20.9 20.0 75 41.8 41.7 29.2 29.1 47.0 47.5 46.1 44.7 37.8 40.0
Equity 25 10.0 11.1 2.8 5.6 9.8 11.0 13.4 14.4 15.7 15.3 50 27.8 29.3 22.8 25.5 26.1 27.7 31.0 33.4 31.5 30.9 75 50.4 52.0 49.7 52.3 49.4 52.7 52.6 53.2 49.6 49.5
Short-term liabilities 25 21.2 20.4 20.0 17.8 21.8 21.2 20.5 19.7 22.7 21.9 50 43.2 42.8 44.2 42.8 43.3 43.1 42.1 42.6 43.0 42.8 75 68.5 66.9 75.3 71.1 69.5 67.8 65.1 64.5 63.0 64.2
Liabilities to banks 25 0.0 0.0 0.0 0.0 0.0 0.0 0.0 0.0 0.0 0.0 50 8.6 8.0 13.9 12.0 9.9 9.5 7.3 6.8 2.5 2.3 75 31.9 32.1 42.9 42.1 34.4 34.4 27.6 27.9 18.3 18.4
Percentage of salesAnnual result before taxes on income 25 0.6 0.8 0.4 1.3 0.8 0.8 0.9 0.9 0.3 0.4
50 3.1 3.5 4.6 5.2 3.1 3.5 2.9 3.2 2.0 2.0 75 7.9 8.4 12.6 13.5 7.6 8.1 6.4 6.8 5.5 5.3
Annual result and depreciation 25 2.4 2.6 2.7 3.9 2.5 2.8 2.5 2.5 1.5 1.5 50 5.8 6.3 8.2 8.9 6.0 6.3 5.4 5.6 4.0 3.9 75 12.3 12.6 18.6 19.7 11.9 12.3 10.8 10.6 8.3 8.3
Trade receivables 25 2.9 2.7 1.8 2.0 3.2 2.8 3.5 3.2 2.9 2.8 50 6.7 6.4 6.2 5.7 6.9 6.5 6.9 6.7 6.5 6.1 75 11.4 11.0 11.9 11.5 11.6 11.0 11.1 10.9 10.8 10.5
Percentage of the balance sheet totalAnnual result and interest paid 25 2.2 2.4 1.8 2.9 2.4 2.5 2.5 2.7 1.7 1.7
50 5.8 6.3 7.6 9.1 5.9 6.4 5.4 5.5 4.3 4.6 75 13.0 13.3 19.5 20.9 12.3 13.0 11.2 11.0 8.8 8.7
Percentage of liabilities and provisions less cashAnnual result and depreciation 25 4.6 5.4 0.0 3.9 4.8 5.1 6.4 6.6 5.3 5.6
50 16.0 17.0 15.7 18.7 16.3 17.7 17.3 17.4 14.1 13.6 75 38.2 40.7 47.8 55.7 37.9 44.5 38.1 38.0 29.1 27.6
Percentage of fixed assetsLong-term equity and liabilities 25 87.2 88.2 61.9 72.0 91.0 93.0 94.2 92.4 93.6 93.8
50 149.1 153.3 129.8 141.8 175.8 181.5 146.4 148.3 145.2 140.4 75 351.9 376.2 350.0 415.9 426.4 448.6 328.7 351.2 276.3 260.0
Percentage of short-term liabilitiesCash resources and short-term receivables 25 45.3 45.4 41.5 42.7 42.7 42.1 47.4 46.7 56.3 56.7
50 92.1 94.0 100.0 105.3 88.7 90.7 88.1 87.6 95.9 95.9 75 191.5 200.9 231.8 264.5 187.1 194.4 178.9 190.7 165.6 162.7
Percentage of cost of materialsTrade payables 25 4.3 4.0 4.6 4.0 4.5 4.1 4.2 4.1 3.8 3.8
50 8.9 8.2 12.0 10.3 9.0 8.4 8.2 7.7 7.1 7.1 75 16.7 15.6 28.6 25.8 17.2 16.1 14.1 13.9 11.7 11.6
* Agriculture, forestry and fishing, mining and quarrying, manufacturing, electricity, gas and water supply, construction, trade, transportation and storage,accommodation and food service activities, information and communication, business services, personal service activities

Deutsche BundesbankFinancial statement statistics (ratios - provisional data)May 2021230
IV. Enterprises by federal state and economic sector
cont'd: 9. Lower Saxonya) All economic sectors*
CorporationsEnterprises with sales of ... € million
Total Less than 2 2 but less than 10 10 but less than 50 50 and moreCylindered sample 2018/2019
Ratios 2018 2019 2018 2019 2018 2019 2018 2019 2018 2019Income statementIncome Percentage of gross revenueSales 99.6 99.9 97.8 97.1 98.1 99.2 98.8 98.9 99.7 100.1Change in finished goods 0.4 0.1 2.2 2.9 1.9 0.8 1.2 1.1 0.3 - 0.1Interest and similar income 0.3 0.3 0.5 0.4 0.3 0.3 0.2 0.2 0.3 0.3Other income 7.6 6.4 6.1 5.8 3.8 4.4 2.7 2.6 8.2 6.8
of which: Income from long-term equity investments 3.5 2.2 0.9 0.8 0.3 0.3 0.4 0.3 3.9 2.5Total income 107.9 106.7 106.6 106.3 104.1 104.6 102.9 102.8 108.6 107.2
ExpensesCost of materials 70.2 70.1 36.2 36.9 48.3 47.8 56.0 55.9 72.5 72.4Personnel expenses 15.0 15.4 39.1 37.9 30.3 30.8 24.7 25.1 13.4 13.8Depreciation 2.7 3.3 4.3 4.1 3.7 3.8 3.5 3.5 2.6 3.3
of which: Depreciation of tangible fixed assets 2.5 2.5 4.2 4.0 3.5 3.6 3.2 3.2 2.4 2.4Interest and similar expenses 2.3 2.3 1.4 1.2 0.8 0.9 0.7 0.7 2.6 2.5Operating taxes 0.0 0.0 0.2 0.2 0.1 0.1 0.1 0.1 0.0 0.0Other expenses 15.3 15.5 22.3 21.5 17.2 17.4 13.6 13.6 15.4 15.6Total expenses before taxes on income 105.6 106.6 103.4 101.7 100.5 100.9 98.6 98.8 106.5 107.7Annual result before taxes on income 2.4 0.0 3.2 4.6 3.6 3.7 4.3 4.0 2.1 - 0.5Taxes on income 0.9 1.0 1.4 1.5 1.2 1.3 1.1 1.1 0.8 1.0Annual result 1.5 - 0.9 1.8 3.1 2.4 2.5 3.2 2.9 1.3 - 1.5Profit and loss transfers (parent company) 2.0 4.2 0.7 0.6 0.1 0.1 0.0 0.0 2.3 4.8Profit and loss transfers (subsidiary) 0.7 0.7 0.0 0.1 0.1 0.3 0.9 0.8 0.7 0.6Profit for the year 2.8 2.6 2.5 3.6 2.4 2.2 2.3 2.1 2.8 2.7
Balance sheetAssets Percentage of the balance sheet totalIntangible fixed assets 0.5 0.6 0.6 0.8 0.9 0.9 0.9 0.9 0.4 0.6Tangible fixed assets 12.6 13.4 36.5 41.6 32.3 31.2 36.7 36.5 10.8 11.5
of which: Land and buildings 4.3 4.5 14.5 17.1 13.7 13.0 13.8 13.8 3.6 3.7Inventories 9.3 9.8 17.0 16.9 26.1 25.6 20.0 20.2 8.3 8.8
of which: Finished goods and merchandise 3.9 4.0 6.1 4.8 8.2 8.0 8.6 8.3 3.6 3.7Cash 7.2 4.1 12.4 10.8 11.1 11.0 9.1 9.1 7.0 3.6Receivables 28.2 28.9 29.2 26.2 24.0 24.3 23.9 24.2 28.6 29.3
Short-term 25.8 26.3 28.0 25.3 22.3 21.9 22.5 22.4 26.0 26.7 of which:
Trade receivables 4.1 4.2 10.9 9.3 12.0 11.6 11.1 10.9 3.5 3.6Receivables from affiliated companies 19.6 20.0 10.1 8.1 6.5 6.6 8.3 8.4 20.5 21.1
Long-term 2.5 2.6 1.2 0.9 1.7 2.5 1.4 1.8 2.6 2.7of which: Loans to affiliated companies 2.2 2.4 0.7 0.3 0.8 0.6 0.9 1.3 2.3 2.5
Securities 3.6 3.7 0.7 0.5 1.2 1.2 2.0 1.8 3.7 3.8Other long-term equity investments 38.5 39.3 2.9 2.4 3.9 5.3 7.1 6.9 41.0 42.1
of which: Goodwill 0.3 0.2 0.7 0.4 0.8 0.8 0.4 0.3 0.3 0.2
CapitalEquity 25.4 27.1 34.6 43.7 35.1 35.7 42.9 42.5 24.1 25.9Liabilities 52.8 49.5 55.2 47.1 57.0 56.7 45.9 46.4 53.1 49.6
Short-term 31.3 28.7 35.6 34.1 40.1 40.0 33.0 32.9 31.1 28.2of which:Liabilities to banks 2.1 2.3 7.5 6.4 8.8 9.6 6.2 5.6 1.7 2.0Trade payables 3.8 3.8 7.0 5.9 7.5 6.8 7.6 7.2 3.5 3.5Liabilities to affiliated companies 21.4 18.1 6.9 7.1 7.4 7.2 8.5 8.6 22.4 18.9
Long-term 21.5 20.8 19.6 13.0 16.9 16.7 12.9 13.5 22.1 21.4 of which:
Liabilities to banks 3.4 3.1 14.1 9.6 11.5 10.2 8.8 9.4 2.9 2.6Liabilities to affiliated companies 17.1 16.5 4.5 2.6 3.3 2.6 3.0 2.6 18.2 17.7
Provisions 21.2 22.7 9.9 8.7 7.2 6.9 10.0 10.0 22.2 23.8of which: Provisions for pensions 7.4 8.3 1.5 1.4 1.6 1.6 3.3 3.4 7.8 8.8
Other ratios Percentage of salesAnnual result before taxes on income 2.4 0.0 3.2 4.7 3.7 3.7 4.3 4.0 2.1 - 0.5Annual result and depreciation 4.2 2.4 6.2 7.3 6.2 6.3 6.8 6.4 3.9 1.8Trade receivables 5.1 5.1 9.6 9.5 8.7 8.6 8.3 8.3 4.7 4.7
Percentage of the balance sheet totalSales 79.6 82.5 114.3 97.9 138.3 135.7 132.9 131.5 75.4 78.3Annual result and interest paid 3.1 1.1 3.7 4.3 4.5 4.5 5.3 4.8 2.9 0.8
Percentage of liabilities and provisions less cashAnnual result and depreciation 5.0 2.9 13.5 15.8 15.9 16.2 18.7 17.5 4.2 2.0
Percentage of fixed assetsLong-term equity and liabilities 94.6 94.7 133.7 126.7 134.1 131.8 123.6 124.4 92.7 92.6
Percentage of short-term liabilitiesCash resources and short-term receivables 106.1 106.2 114.3 106.5 83.5 82.4 96.6 96.4 107.1 107.5Cash resources, short-term receivables and inventories 135.7 140.2 162.1 156.1 148.7 146.5 157.2 157.9 133.9 138.6
Percentage of cost of materialsTrade payables 6.7 6.6 16.4 16.0 11.0 10.4 10.0 9.7 6.3 6.2
Memo item:Balance sheet total in € billion 297.57 292.94 0.76 1.01 4.23 4.53 16.74 17.54 275.84 269.87Sales in € billion 236.84 241.54 0.87 0.99 5.85 6.15 22.25 23.07 207.87 211.34Number of enterprises 3 634 3 634 973 973 1 186 1 186 932 932 543 543
* Agriculture, forestry and fishing, mining and quarrying, manufacturing, electricity, gas and water supply, construction, trade, transportation and storage,accommodation and food service activities, information and communication, business services, personal service activities

Deutsche BundesbankFinancial statement statistics (ratios - provisional data)
May 2021231
IV. Enterprises by federal state and economic sector
cont'd: 9. Lower Saxonya) All economic sectors*
cont'd: CorporationsEnterprises with sales of ... € million
Total Less than 2 2 but less than 10 10 but less than 50 50 and moreQuartile Cylindered sample 2018/2019value 2018 2019 2018 2019 2018 2019 2018 2019 2018 2019Of the enterprises captured …
Ratios ... % had a ratio of less than …Percentage of gross revenue
Cost of materials 25 27.6 27.3 8.8 8.4 29.5 28.5 37.3 36.3 51.3 50.9 50 49.1 48.9 31.8 31.7 47.9 47.2 59.1 57.8 70.0 70.4 75 70.6 70.0 51.0 51.2 65.4 64.5 76.2 76.3 83.9 84.0
Personnel expenses 25 12.0 12.8 20.7 20.7 15.8 16.4 9.9 10.2 6.2 6.4 50 26.0 26.3 36.4 36.0 28.8 28.8 19.3 19.8 13.0 13.8 75 40.6 41.1 50.6 50.3 40.3 41.4 34.1 34.8 24.5 24.8
Depreciation 25 0.7 0.7 0.8 0.8 0.7 0.8 0.7 0.7 0.6 0.7 50 1.7 1.8 2.0 2.0 1.7 1.7 1.8 1.9 1.5 1.5 75 4.0 3.9 4.4 4.3 3.7 3.7 4.2 4.0 3.7 3.7
Annual result 25 0.3 0.4 - 0.1 0.4 0.4 0.4 0.5 0.5 0.1 0.1 50 1.9 2.2 2.3 2.9 1.8 2.2 2.1 2.2 1.4 1.3 75 5.3 5.7 7.3 7.3 5.0 5.4 4.9 5.3 3.9 4.0
Percentage of the balance sheet totalTangible fixed assets 25 4.6 4.8 3.7 3.8 4.6 4.7 5.3 5.5 5.8 6.0
50 16.1 16.0 15.1 14.0 13.8 14.0 20.0 19.7 18.9 18.7 75 39.3 38.6 36.5 35.8 35.4 34.9 45.2 45.4 39.5 38.9
Inventories 25 1.3 1.2 0.0 0.0 2.1 2.0 1.8 1.7 3.8 3.6 50 16.3 16.6 7.0 6.9 21.2 20.3 20.6 19.2 19.3 18.7 75 41.3 41.0 31.8 32.6 46.7 46.6 44.2 42.4 37.2 39.1
Equity 25 13.7 15.2 7.0 10.4 13.8 15.1 18.0 18.5 17.8 17.5 50 32.8 34.6 27.2 31.1 31.4 32.5 37.4 37.9 35.5 35.2 75 55.3 57.2 54.5 57.4 54.8 57.4 57.7 57.9 53.1 53.4
Short-term liabilities 25 18.9 17.9 18.1 16.6 20.3 19.6 17.1 17.0 19.4 19.8 50 39.3 38.3 41.7 40.3 41.0 39.3 35.3 35.1 39.3 39.2 75 64.7 62.7 71.2 65.6 66.8 63.9 58.0 58.9 59.8 61.3
Liabilities to banks 25 0.0 0.0 0.0 0.0 0.0 0.0 0.0 0.0 0.0 0.0 50 5.7 5.5 7.6 5.9 7.5 6.8 5.5 4.7 2.6 2.6 75 28.1 27.4 31.7 31.6 30.1 30.2 26.4 25.1 17.8 18.4
Percentage of salesAnnual result before taxes on income 25 0.4 0.6 0.0 0.6 0.6 0.6 0.7 0.8 0.3 0.3
50 2.6 2.9 3.1 3.7 2.6 2.9 2.8 2.9 1.8 1.8 75 7.0 7.3 9.2 9.8 6.9 7.2 6.4 6.9 5.3 5.1
Annual result and depreciation 25 2.0 2.2 1.7 2.7 2.1 2.4 2.2 2.2 1.4 1.4 50 5.2 5.6 6.0 6.7 5.3 5.6 5.4 5.5 3.9 3.9 75 11.0 11.2 13.5 14.0 10.9 11.3 10.8 10.6 8.5 8.2
Trade receivables 25 3.2 3.0 2.6 2.5 3.4 3.1 3.4 3.4 3.3 3.1 50 6.9 6.6 6.7 6.4 7.1 6.8 6.9 7.0 6.7 6.3 75 11.8 11.6 12.4 12.5 11.9 11.4 11.7 11.6 10.9 10.7
Percentage of the balance sheet totalAnnual result and interest paid 25 1.7 2.0 0.9 2.1 2.0 2.1 2.2 2.3 1.4 1.1
50 5.0 5.4 5.7 7.2 5.0 5.5 5.1 5.1 3.7 3.9 75 11.0 11.5 14.5 15.8 10.4 11.2 10.2 10.0 8.2 7.9
Percentage of liabilities and provisions less cashAnnual result and depreciation 25 2.7 3.4 - 6.7 0.0 2.6 3.2 5.7 5.9 4.3 4.7
50 14.2 15.3 11.1 15.0 14.4 15.4 16.9 17.0 13.1 12.7 75 36.7 39.7 40.2 48.0 36.3 43.2 40.4 40.3 29.8 27.9
Percentage of fixed assetsLong-term equity and liabilities 25 97.2 100.0 84.9 94.8 101.8 105.5 101.7 99.2 94.3 96.0
50 177.1 183.1 183.2 199.7 208.3 215.5 163.0 168.4 150.7 147.6 75 425.7 452.8 500.0 554.7 484.3 536.7 382.2 410.3 285.9 274.1
Percentage of short-term liabilitiesCash resources and short-term receivables 25 52.7 54.2 53.2 56.9 46.9 46.6 55.3 56.9 62.3 62.2
50 106.6 112.5 124.5 129.7 102.9 106.7 104.4 105.8 102.7 106.0 75 225.6 238.9 288.7 324.1 223.6 220.8 222.0 237.9 177.1 175.3
Percentage of cost of materialsTrade payables 25 4.4 4.2 4.7 4.0 4.6 4.2 4.3 4.3 4.0 4.2
50 9.2 8.5 11.8 10.1 9.3 8.5 8.8 8.4 7.5 7.4 75 17.2 16.0 26.8 23.8 17.3 16.2 14.9 14.6 12.2 12.2
* Agriculture, forestry and fishing, mining and quarrying, manufacturing, electricity, gas and water supply, construction, trade, transportation and storage,accommodation and food service activities, information and communication, business services, personal service activities

Deutsche BundesbankFinancial statement statistics (ratios - provisional data)May 2021232
IV. Enterprises by federal state and economic sector
cont'd: 9. Lower Saxonya) All economic sectors*
Non-corporationsEnterprises with sales of ... € million
Total Less than 2 2 but less than 10 10 but less than 50 50 and moreCylindered sample 2018/2019
Ratios 2018 2019 2018 2019 2018 2019 2018 2019 2018 2019Income statementIncome Percentage of gross revenueSales 98.8 99.5 99.6 98.4 99.0 99.1 97.3 98.5 99.1 99.7Change in finished goods 1.2 0.5 0.4 1.6 1.0 0.9 2.7 1.5 0.9 0.3Interest and similar income 0.1 0.1 0.1 0.2 0.1 0.1 0.1 0.1 0.2 0.1Other income 1.8 2.0 4.2 3.4 2.6 2.1 1.9 2.0 1.7 2.0
of which: Income from long-term equity investments 0.3 0.2 0.2 0.1 0.1 0.1 0.3 0.3 0.3 0.2Total income 101.9 102.2 104.3 103.6 102.7 102.2 102.0 102.0 101.9 102.2
ExpensesCost of materials 72.8 72.2 33.8 34.3 49.9 49.2 60.8 59.8 75.9 75.5Personnel expenses 11.8 12.1 25.8 25.5 23.6 23.7 19.3 19.9 10.0 10.3Depreciation 2.7 2.8 9.8 8.7 4.1 4.2 4.0 3.7 2.3 2.5
of which: Depreciation of tangible fixed assets 2.5 2.7 9.6 8.7 4.0 4.0 3.9 3.5 2.1 2.5Interest and similar expenses 1.0 0.9 2.4 2.2 1.1 1.0 0.7 0.7 1.0 0.9Operating taxes 0.1 0.1 0.2 0.2 0.2 0.1 0.1 0.1 0.1 0.1Other expenses 10.1 11.0 21.9 21.1 17.1 17.5 13.2 13.5 9.2 10.2Total expenses before taxes on income 98.3 99.1 93.8 92.0 96.1 95.8 98.0 97.5 98.5 99.5Annual result before taxes on income 3.6 3.1 10.5 11.6 6.6 6.3 4.0 4.5 3.4 2.7Taxes on income 0.5 0.5 1.4 1.5 0.9 1.0 0.7 0.8 0.4 0.4Annual result 3.1 2.7 9.1 10.1 5.7 5.3 3.3 3.8 3.0 2.3Profit and loss transfers (parent company) 0.1 0.2 0.7 0.5 0.0 0.0 0.0 0.0 0.1 0.2Profit and loss transfers (subsidiary) 0.0 0.1 0.0 0.1 0.1 0.1 0.1 0.2 0.0 0.0Profit for the year 3.2 2.8 9.7 10.6 5.6 5.2 3.1 3.6 3.1 2.5
Balance sheetAssets Percentage of the balance sheet totalIntangible fixed assets 0.7 1.3 0.4 0.4 0.4 0.4 1.2 1.1 0.6 1.4Tangible fixed assets 32.4 31.5 58.1 56.8 48.2 47.7 34.2 33.3 30.9 30.0
of which: Land and buildings 8.7 8.5 16.5 16.3 14.6 15.1 9.3 9.0 8.1 7.9Inventories 21.9 22.6 7.2 8.5 20.6 21.6 33.8 35.0 20.1 20.7
of which: Finished goods and merchandise 7.8 7.6 3.5 3.9 10.6 10.9 10.8 10.2 7.2 7.0Cash 5.6 5.5 9.1 10.3 9.0 9.5 7.6 8.6 5.1 4.7Receivables 31.5 31.6 21.1 20.0 18.5 17.5 20.5 19.1 34.2 34.6
Short-term 30.4 30.2 20.1 19.8 17.8 17.0 19.6 18.1 33.0 33.1 of which:
Trade receivables 9.4 9.0 9.7 8.7 9.4 9.1 10.2 9.9 9.2 8.8Receivables from affiliated companies 18.4 18.7 7.2 7.8 5.7 5.4 6.6 5.6 21.2 21.7
Long-term 1.1 1.4 1.0 0.2 0.6 0.5 1.0 1.0 1.2 1.5of which: Loans to affiliated companies 0.7 0.9 0.9 0.0 0.5 0.3 0.7 0.8 0.7 1.0
Securities 2.4 2.2 0.1 0.1 0.2 0.2 0.2 0.3 2.9 2.7Other long-term equity investments 5.3 5.2 3.2 3.1 2.7 2.6 2.2 2.3 6.0 5.8
of which: Goodwill 0.1 0.1 0.5 0.4 0.3 0.3 0.1 0.1 0.1 0.1
CapitalEquity 30.0 28.4 20.2 21.0 23.2 23.6 24.4 23.0 31.4 29.7Liabilities 51.6 51.9 76.2 75.1 72.2 71.3 66.2 67.7 47.8 48.0
Short-term 40.2 42.6 43.6 42.7 39.4 44.2 52.2 54.8 38.2 40.5of which:Liabilities to banks 4.1 4.3 16.9 16.1 10.1 14.9 8.1 8.1 2.9 3.0Trade payables 9.1 9.0 5.6 5.3 6.6 6.4 7.0 6.4 9.6 9.7Liabilities to affiliated companies 16.2 18.2 10.5 9.5 11.8 11.6 15.3 16.8 16.6 18.9
Long-term 11.4 9.3 32.7 32.4 32.8 27.1 14.0 12.9 9.6 7.5 of which:
Liabilities to banks 5.6 6.1 29.2 29.3 24.5 18.5 6.8 6.9 4.1 5.0Liabilities to affiliated companies 5.2 2.5 2.6 2.2 7.1 7.1 6.9 5.3 4.8 1.8
Provisions 18.0 19.3 3.2 3.7 4.5 5.0 9.1 9.1 20.4 22.0of which: Provisions for pensions 3.9 4.0 0.0 0.0 0.6 0.6 1.9 1.9 4.4 4.6
Other ratios Percentage of salesAnnual result before taxes on income 3.6 3.1 10.5 11.8 6.7 6.4 4.1 4.6 3.4 2.7Annual result and depreciation 5.9 5.5 18.9 19.2 10.0 9.6 7.5 7.5 5.3 4.9Trade receivables 6.1 5.9 11.7 10.1 7.6 7.1 7.1 6.9 5.9 5.6
Percentage of the balance sheet totalSales 152.4 153.0 83.6 85.7 124.9 127.4 143.7 143.2 156.1 156.9Annual result and interest paid 6.3 5.4 9.7 10.7 8.7 8.1 5.8 6.4 6.2 5.1
Percentage of liabilities and provisions less cashAnnual result and depreciation 13.9 12.7 22.4 23.9 18.4 18.2 15.8 15.7 13.1 11.7
Percentage of fixed assetsLong-term equity and liabilities 109.4 101.1 84.3 88.3 109.0 100.0 104.4 99.4 110.7 101.7
Percentage of short-term liabilitiesCash resources and short-term receivables 90.7 84.2 66.9 70.5 68.3 60.0 52.3 48.9 101.1 93.9Cash resources, short-term receivables and inventories 145.1 137.3 83.4 90.5 120.6 108.9 117.1 112.7 153.8 145.1
Percentage of cost of materialsTrade payables 8.1 8.1 19.7 17.8 10.5 10.2 7.8 7.4 8.1 8.1
Memo item:Balance sheet total in € billion 40.81 41.57 0.41 0.43 1.70 1.75 5.56 5.76 33.14 33.64Sales in € billion 62.19 63.61 0.34 0.37 2.13 2.22 7.99 8.25 51.73 52.78Number of enterprises 1 387 1 387 407 407 433 433 332 332 215 215
* Agriculture, forestry and fishing, mining and quarrying, manufacturing, electricity, gas and water supply, construction, trade, transportation and storage,accommodation and food service activities, information and communication, business services, personal service activities

Deutsche BundesbankFinancial statement statistics (ratios - provisional data)
May 2021233
IV. Enterprises by federal state and economic sector
cont'd: 9. Lower Saxonya) All economic sectors*
cont'd: Non-corporationsEnterprises with sales of ... € million
Total Less than 2 2 but less than 10 10 but less than 50 50 and moreQuartile Cylindered sample 2018/2019value 2018 2019 2018 2019 2018 2019 2018 2019 2018 2019Of the enterprises captured …
Ratios ... % had a ratio of less than …Percentage of gross revenue
Cost of materials 25 28.7 27.0 5.6 5.1 29.0 27.0 47.5 45.9 53.8 52.9 50 51.9 51.7 31.3 28.9 51.5 51.3 64.1 62.7 71.6 71.0 75 71.9 71.5 48.0 49.3 68.8 68.0 76.6 76.0 84.9 84.4
Personnel expenses 25 8.8 9.0 5.2 5.5 11.5 11.4 9.7 10.0 4.9 5.2 50 18.0 18.2 22.8 22.8 20.6 20.0 16.4 16.4 11.4 11.7 75 31.1 30.9 35.7 35.0 34.0 34.3 27.5 27.6 20.2 20.0
Depreciation 25 1.0 1.0 1.9 1.6 0.9 1.0 0.9 0.9 0.6 0.6 50 2.2 2.2 3.9 3.7 2.1 2.1 1.7 1.8 1.3 1.3 75 4.9 4.8 12.0 11.2 4.5 4.6 3.2 3.5 2.7 2.9
Annual result 25 1.3 1.5 2.9 4.0 1.6 1.7 1.2 1.2 0.7 0.6 50 3.8 4.3 8.6 10.0 3.8 4.3 2.7 3.1 1.8 2.0 75 9.2 9.6 17.2 19.2 7.7 7.7 5.4 5.7 4.8 5.1
Percentage of the balance sheet totalTangible fixed assets 25 9.5 9.3 16.0 14.0 9.5 9.6 7.8 8.2 6.9 6.3
50 26.7 26.8 43.1 44.6 26.0 25.8 22.5 22.8 18.5 18.5 75 53.4 54.2 70.0 71.5 52.1 53.4 41.7 43.4 36.4 37.7
Inventories 25 1.8 1.6 0.0 0.0 2.5 2.9 11.4 11.7 8.4 10.2 50 18.3 18.3 4.9 3.8 20.3 19.9 31.9 31.4 25.0 25.4 75 42.6 42.9 22.6 20.3 48.7 49.1 52.2 51.4 40.5 41.5
Equity 25 4.2 4.9 - 5.4 0.0 4.2 4.7 7.3 7.6 11.5 11.3 50 16.5 17.7 10.4 13.5 15.1 16.3 18.1 18.4 23.6 24.9 75 35.3 36.1 33.5 37.1 33.2 34.2 33.9 35.6 39.6 40.2
Short-term liabilities 25 29.5 28.6 24.5 23.1 28.1 28.5 37.9 37.0 31.6 32.7 50 53.3 54.4 50.6 49.7 52.5 52.8 58.5 57.1 51.9 51.9 75 76.6 76.1 81.5 80.9 74.6 74.3 76.1 77.1 71.7 71.6
Liabilities to banks 25 0.0 0.0 7.5 6.0 0.3 0.0 0.4 0.0 0.0 0.0 50 17.3 16.4 34.3 33.3 19.3 18.4 14.2 12.5 2.1 2.0 75 44.8 45.3 67.8 65.8 47.2 48.3 31.4 33.7 20.1 19.1
Percentage of salesAnnual result before taxes on income 25 1.6 1.8 3.2 4.7 2.0 2.0 1.4 1.4 0.8 0.8
50 4.6 5.1 9.5 11.3 4.6 5.1 3.5 3.6 2.3 2.3 75 10.8 11.3 19.8 21.8 9.3 9.4 6.9 6.7 5.9 5.9
Annual result and depreciation 25 3.6 3.9 7.4 9.1 4.1 4.2 3.2 3.5 1.7 1.7 50 7.8 8.4 17.1 18.3 8.0 8.3 5.5 5.7 4.1 3.9 75 16.4 16.3 32.0 35.6 13.4 13.9 10.6 10.5 8.2 8.7
Trade receivables 25 2.1 2.0 0.9 1.0 2.3 2.1 3.6 3.1 2.4 2.3 50 5.9 5.5 4.6 4.3 6.0 5.9 6.8 6.2 5.5 5.7 75 10.0 9.7 10.2 9.3 9.7 9.7 9.8 9.6 10.1 10.0
Percentage of the balance sheet totalAnnual result and interest paid 25 3.8 4.3 4.9 6.5 4.5 4.2 3.1 3.9 2.5 2.8
50 9.1 9.3 15.4 16.4 9.6 9.8 7.0 7.6 5.6 6.3 75 19.2 20.0 34.3 38.4 18.4 19.1 13.3 13.5 10.3 10.4
Percentage of liabilities and provisions less cashAnnual result and depreciation 25 8.7 10.0 10.7 13.5 10.3 10.9 8.1 8.3 6.4 7.3
50 20.3 20.8 24.3 28.1 21.4 23.1 17.7 17.5 15.1 15.1 75 42.6 44.1 60.1 72.2 43.5 45.1 33.7 32.2 28.8 27.1
Percentage of fixed assetsLong-term equity and liabilities 25 64.3 63.8 25.8 31.6 73.2 74.6 73.7 69.8 91.3 82.0
50 106.3 106.2 81.2 84.2 113.0 113.7 113.6 111.3 136.6 126.0 75 202.2 211.3 133.5 144.4 245.3 249.9 220.8 225.8 224.3 225.4
Percentage of short-term liabilitiesCash resources and short-term receivables 25 34.9 32.7 24.0 24.9 35.8 32.6 36.9 35.2 45.7 46.8
50 64.9 64.4 60.5 62.1 64.7 61.7 59.5 59.5 78.6 79.7 75 118.7 119.6 133.3 136.3 118.7 127.3 97.5 94.5 118.4 121.8
Percentage of cost of materialsTrade payables 25 4.0 3.6 4.4 4.0 4.0 3.4 4.0 3.8 3.5 3.4
50 8.1 7.5 12.5 11.1 8.2 8.0 7.1 6.5 6.5 6.4 75 15.5 14.7 36.1 32.0 16.9 15.0 11.9 10.7 10.0 10.2
* Agriculture, forestry and fishing, mining and quarrying, manufacturing, electricity, gas and water supply, construction, trade, transportation and storage,accommodation and food service activities, information and communication, business services, personal service activities

Deutsche BundesbankFinancial statement statistics (ratios - provisional data)May 2021234
IV. Enterprises by federal state and economic sector
9. Lower Saxonyb) Manufacturing
All legal formsEnterprises with sales of ... € million
Total Less than 2 2 but less than 10 10 but less than 50 50 and moreCylindered sample 2018/2019
Ratios 2018 2019 2018 2019 2018 2019 2018 2019 2018 2019Income statementIncome Percentage of gross revenueSales 99.7 100.0 97.2 95.1 98.2 99.6 98.9 99.1 99.8 100.1Change in finished goods 0.3 0.0 2.8 4.9 1.8 0.4 1.1 0.9 0.2 - 0.1Interest and similar income 0.4 0.4 0.2 0.2 0.1 0.1 0.1 0.2 0.4 0.4Other income 9.1 7.4 2.7 2.5 1.6 2.5 2.1 1.8 9.7 7.9
of which: Income from long-term equity investments 4.5 2.9 0.2 0.1 0.0 0.0 0.3 0.2 4.9 3.1Total income 109.5 107.8 102.9 102.6 101.7 102.6 102.2 102.0 110.0 108.2
ExpensesCost of materials 69.6 69.5 38.3 39.9 47.1 46.0 55.0 54.8 70.9 70.8Personnel expenses 14.6 15.1 35.8 34.4 31.0 32.1 23.9 24.5 13.8 14.3Depreciation 2.6 3.6 3.8 3.7 2.7 2.9 3.0 3.0 2.6 3.6
of which: Depreciation of tangible fixed assets 2.5 2.5 3.8 3.6 2.6 2.8 2.9 2.9 2.5 2.5Interest and similar expenses 2.6 2.8 1.1 1.0 0.7 0.7 0.7 0.7 2.8 2.9Operating taxes 0.0 0.0 0.1 0.2 0.1 0.1 0.1 0.1 0.0 0.0Other expenses 17.6 18.1 19.3 18.1 16.1 16.8 15.8 15.9 17.7 18.3Total expenses before taxes on income 107.2 109.1 98.5 97.2 97.7 98.6 98.5 98.9 107.8 109.9Annual result before taxes on income 2.3 - 1.3 4.4 5.4 4.0 4.0 3.7 3.1 2.2 - 1.7Taxes on income 0.8 1.0 1.1 1.1 1.2 1.2 0.9 0.8 0.8 1.1Annual result 1.5 - 2.4 3.3 4.3 2.8 2.8 2.9 2.3 1.4 - 2.8Profit and loss transfers (parent company) 2.8 6.0 0.0 0.0 0.0 0.0 0.0 0.0 3.0 6.5Profit and loss transfers (subsidiary) 0.7 0.4 0.1 0.2 0.1 0.2 0.9 0.6 0.6 0.4Profit for the year 3.6 3.2 3.2 4.1 2.7 2.6 2.0 1.7 3.8 3.3
Balance sheetAssets Percentage of the balance sheet totalIntangible fixed assets 0.4 0.6 0.6 0.6 0.5 0.5 0.9 0.8 0.4 0.6Tangible fixed assets 8.1 8.8 37.9 34.2 27.4 27.1 27.0 26.8 7.5 8.2
of which: Land and buildings 2.5 2.6 18.1 15.1 10.2 9.6 10.1 10.1 2.3 2.3Inventories 9.1 9.5 22.2 27.3 33.6 32.5 29.2 30.2 8.4 8.8
of which: Finished goods and merchandise 2.9 2.9 6.9 6.6 9.3 8.6 9.2 9.1 2.7 2.7Cash 7.5 3.7 10.3 10.8 9.7 9.9 8.1 7.6 7.5 3.5Receivables 24.7 25.2 25.3 23.5 25.9 24.3 25.7 25.7 24.7 25.2
Short-term 22.0 22.4 22.5 21.2 25.2 23.3 23.8 23.5 22.0 22.3 of which:
Trade receivables 3.0 3.1 10.4 9.5 13.7 12.4 13.3 13.0 2.7 2.8Receivables from affiliated companies 17.3 17.8 8.3 7.9 7.7 7.2 7.6 7.9 17.6 18.2
Long-term 2.7 2.8 2.8 2.2 0.7 0.9 1.9 2.2 2.7 2.8of which: Loans to affiliated companies 2.4 2.6 2.4 1.9 0.4 0.4 1.1 1.5 2.4 2.6
Securities 4.2 4.4 0.0 0.2 0.3 0.4 1.0 0.9 4.3 4.5Other long-term equity investments 45.9 47.7 3.1 2.9 2.2 4.8 7.8 7.5 47.1 49.1
of which: Goodwill 0.1 0.1 0.4 0.4 1.0 0.8 0.6 0.6 0.1 0.0
CapitalEquity 22.9 24.6 30.2 30.6 36.7 37.4 37.7 37.4 22.4 24.2Liabilities 56.0 51.7 64.5 64.1 54.8 54.8 51.3 51.6 56.1 51.7
Short-term 32.1 28.4 41.1 46.0 42.0 42.5 39.6 41.0 31.9 27.9of which:Liabilities to banks 1.8 1.6 8.6 10.1 9.3 10.8 7.9 7.2 1.6 1.4Trade payables 3.0 3.1 7.1 7.2 7.7 7.4 7.8 7.4 2.8 2.9Liabilities to affiliated companies 24.1 19.9 9.4 8.7 9.3 8.5 12.6 13.8 24.5 20.2
Long-term 23.9 23.4 23.3 18.1 12.7 12.3 11.6 10.6 24.3 23.8 of which:
Liabilities to banks 2.3 2.1 17.4 13.3 9.2 9.3 7.1 7.2 2.1 1.9Liabilities to affiliated companies 20.8 20.2 4.0 3.7 2.5 2.1 3.9 3.0 21.3 20.8
Provisions 20.6 22.9 5.2 5.0 8.3 7.7 10.9 10.9 20.9 23.4of which: Provisions for pensions 8.6 9.7 1.0 1.0 2.6 2.6 4.0 4.1 8.7 9.9
Other ratios Percentage of salesAnnual result before taxes on income 2.3 - 1.3 4.5 5.7 4.1 4.0 3.8 3.1 2.2 - 1.7Annual result and depreciation 4.1 1.2 7.3 8.4 5.6 5.7 5.9 5.3 4.0 0.9Trade receivables 4.4 4.3 7.8 7.2 8.3 7.8 8.5 8.4 4.0 4.0
Percentage of the balance sheet totalSales 69.9 72.5 133.5 131.1 166.1 159.3 155.7 153.9 67.1 69.7Annual result and interest paid 2.9 0.3 6.0 7.4 5.9 5.6 5.6 4.7 2.8 0.1
Percentage of liabilities and provisions less cashAnnual result and depreciation 4.2 1.2 16.4 18.8 17.3 17.3 16.9 14.9 3.8 0.8
Percentage of fixed assetsLong-term equity and liabilities 90.6 90.2 123.0 124.3 168.3 155.8 138.7 136.3 89.6 89.2
Percentage of short-term liabilitiesCash resources and short-term receivables 92.7 92.0 79.7 69.9 83.3 78.8 80.8 76.2 93.1 92.8Cash resources, short-term receivables and inventories 120.9 125.7 133.7 129.2 163.2 155.3 154.4 149.8 119.5 124.4
Percentage of cost of materialsTrade payables 6.1 6.1 13.5 13.0 9.6 10.0 9.0 8.7 5.9 5.9
Memo item:Balance sheet total in € billion 237.94 230.56 0.13 0.15 1.14 1.21 6.11 6.29 230.55 222.91Sales in € billion 166.37 167.22 0.18 0.20 1.90 1.93 9.52 9.68 154.78 155.41Number of enterprises 1 168 1 168 165 165 348 348 371 371 284 284

Deutsche BundesbankFinancial statement statistics (ratios - provisional data)
May 2021235
IV. Enterprises by federal state and economic sector
cont'd: 9. Lower Saxonyb) Manufacturing
cont'd: All legal formsEnterprises with sales of ... € million
Total Less than 2 2 but less than 10 10 but less than 50 50 and moreQuartile Cylindered sample 2018/2019value 2018 2019 2018 2019 2018 2019 2018 2019 2018 2019Of the enterprises captured …
Ratios ... % had a ratio of less than …Percentage of gross revenue
Cost of materials 25 38.9 37.9 21.9 21.8 35.9 35.0 43.1 42.9 49.2 49.0 50 50.1 50.3 36.0 34.9 46.0 45.0 53.9 54.0 61.1 59.9 75 64.2 62.6 49.1 50.5 57.1 56.0 65.7 64.5 74.3 74.3
Personnel expenses 25 16.7 16.9 25.4 25.7 23.0 24.5 15.2 15.4 10.3 10.9 50 26.1 26.6 36.1 35.5 31.4 32.2 24.7 24.5 17.7 18.0 75 35.9 36.5 45.8 45.5 39.4 41.3 33.6 34.4 24.8 25.3
Depreciation 25 1.1 1.1 1.1 1.1 1.0 1.1 1.2 1.2 1.0 1.0 50 2.1 2.2 2.3 2.3 2.0 2.1 2.1 2.2 2.0 2.1 75 3.7 3.8 4.4 4.2 3.5 3.8 3.6 3.6 3.8 3.8
Annual result 25 0.3 0.4 0.2 0.9 0.6 0.5 0.4 0.4 0.1 0.1 50 2.2 2.4 3.1 3.4 2.2 2.6 2.1 2.3 1.9 2.0 75 5.6 5.9 7.4 8.3 5.3 5.9 5.2 5.6 5.3 5.2
Percentage of the balance sheet totalTangible fixed assets 25 8.5 8.2 7.5 6.4 7.8 7.2 9.4 9.1 9.0 8.7
50 22.1 22.3 23.2 22.3 18.8 18.8 25.1 24.5 21.6 22.2 75 41.0 40.6 46.4 49.9 40.3 39.8 42.0 41.0 38.2 38.7
Inventories 25 13.8 13.6 6.8 5.3 14.2 14.8 16.6 17.0 14.2 12.7 50 27.4 26.4 19.8 20.6 31.0 28.6 28.4 28.0 25.2 24.1 75 44.2 42.6 36.4 37.2 48.7 48.1 45.0 44.0 36.9 38.1
Equity 25 13.7 13.6 4.7 9.4 13.7 13.2 15.4 16.5 16.1 15.5 50 30.7 32.0 23.3 24.9 32.5 34.1 30.9 33.4 32.0 31.9 75 52.7 55.1 44.5 48.5 57.0 57.7 53.8 55.0 51.1 50.6
Short-term liabilities 25 20.9 20.4 22.5 21.5 19.9 18.4 19.0 20.4 23.1 21.7 50 41.0 39.9 48.6 43.6 40.3 38.8 41.0 39.9 40.1 38.8 75 61.5 61.5 70.9 69.9 65.8 62.2 59.8 59.4 55.6 55.9
Liabilities to banks 25 0.0 0.0 0.0 0.0 0.0 0.0 0.0 0.0 0.0 0.0 50 6.3 6.5 15.8 13.6 7.6 8.3 7.9 7.0 1.1 1.4 75 27.5 27.6 41.7 38.2 30.5 31.6 27.7 27.2 13.9 14.1
Percentage of salesAnnual result before taxes on income 25 0.4 0.5 0.2 1.1 1.0 0.7 0.5 0.6 0.1 0.3
50 2.8 3.1 4.1 4.0 3.0 3.6 2.9 3.0 2.3 2.4 75 7.0 7.6 10.2 10.5 6.8 7.6 6.6 6.9 6.0 6.9
Annual result and depreciation 25 2.4 2.3 2.2 3.4 2.6 2.7 2.4 2.2 2.0 1.7 50 5.6 6.0 7.0 7.0 6.1 6.6 5.5 5.6 4.7 4.5 75 10.5 10.9 14.0 14.3 10.6 11.2 10.1 10.2 9.7 9.5
Trade receivables 25 3.2 3.0 3.0 2.7 3.6 3.2 3.5 3.5 2.5 2.5 50 6.7 6.4 6.4 5.5 6.9 6.4 7.6 7.2 5.9 5.8 75 11.2 10.5 10.2 9.3 11.7 10.0 11.9 11.8 9.9 9.7
Percentage of the balance sheet totalAnnual result and interest paid 25 1.9 1.9 1.8 2.3 2.3 2.2 1.9 1.9 1.4 1.1
50 5.4 5.8 7.3 8.6 5.7 6.1 4.9 5.2 4.6 5.0 75 11.5 12.2 15.6 17.5 11.8 12.4 10.8 11.5 10.3 10.2
Percentage of liabilities and provisions less cashAnnual result and depreciation 25 4.5 4.0 3.6 4.8 4.5 2.9 5.4 4.9 4.1 4.5
50 15.8 16.2 16.2 17.1 15.3 15.5 16.6 17.7 15.4 15.6 75 33.6 36.2 40.9 41.1 34.9 38.6 32.1 37.7 31.2 30.6
Percentage of fixed assetsLong-term equity and liabilities 25 95.1 94.7 71.3 83.3 100.8 102.6 98.7 92.7 93.9 92.6
50 162.2 161.6 140.5 160.2 195.5 189.5 160.0 154.3 149.8 147.5 75 321.3 323.9 346.7 378.1 393.7 371.2 298.6 290.0 249.2 237.4
Percentage of short-term liabilitiesCash resources and short-term receivables 25 46.2 47.4 43.9 39.7 42.4 42.1 46.9 47.4 53.1 55.6
50 86.0 88.2 81.6 94.0 86.6 85.0 80.4 81.8 89.5 96.1 75 170.0 191.2 192.0 207.7 184.9 204.4 164.3 180.2 165.9 177.2
Percentage of cost of materialsTrade payables 25 4.3 3.9 4.5 3.8 4.1 3.4 4.4 4.2 4.2 4.2
50 8.1 7.4 10.0 9.8 7.7 6.8 8.3 7.6 7.5 7.1 75 13.6 13.0 23.3 24.5 13.3 12.7 13.5 12.9 11.6 11.7

Deutsche BundesbankFinancial statement statistics (ratios - provisional data)May 2021236
IV. Enterprises by federal state and economic sector
10. North Rhine-Westphaliaa) All economic sectors*
All legal formsEnterprises with sales of ... € million
Total Less than 2 2 but less than 10 10 but less than 50 50 and moreCylindered sample 2018/2019
Ratios 2018 2019 2018 2019 2018 2019 2018 2019 2018 2019Income statementIncome Percentage of gross revenueSales 99.7 99.7 98.5 98.1 99.2 98.5 99.2 99.4 99.8 99.8Change in finished goods 0.3 0.3 1.5 1.9 0.8 1.5 0.8 0.6 0.2 0.2Interest and similar income 0.5 0.5 0.1 0.1 0.2 0.2 0.2 0.2 0.5 0.5Other income 4.1 4.4 3.6 3.4 4.0 4.0 2.6 2.7 4.3 4.6
of which: Income from long-term equity investments 0.8 1.0 0.1 0.1 0.3 0.3 0.3 0.3 0.9 1.1Total income 104.6 104.9 103.7 103.5 104.2 104.1 102.8 102.9 104.8 105.2
ExpensesCost of materials 71.2 70.5 38.0 38.1 49.5 49.3 57.1 56.9 73.3 72.5Personnel expenses 13.9 14.4 33.2 33.1 28.9 29.0 23.8 24.2 12.5 12.9Depreciation 3.0 2.9 4.6 4.4 3.1 3.2 2.8 2.9 3.0 2.9
of which: Depreciation of tangible fixed assets 2.8 2.7 4.5 4.4 3.0 3.1 2.6 2.7 2.8 2.6Interest and similar expenses 1.6 1.2 1.1 1.1 0.8 0.8 0.8 0.8 1.7 1.3Operating taxes 0.1 0.1 0.2 0.2 0.1 0.1 0.1 0.1 0.1 0.1Other expenses 12.3 13.0 21.4 20.7 17.1 17.0 14.2 14.2 12.0 12.7Total expenses before taxes on income 102.2 102.0 98.4 97.5 99.5 99.4 98.7 99.0 102.6 102.4Annual result before taxes on income 2.4 2.9 5.3 6.0 4.7 4.8 4.0 3.8 2.2 2.7Taxes on income 0.7 0.6 1.6 1.7 1.3 1.3 1.1 1.0 0.6 0.6Annual result 1.8 2.3 3.8 4.3 3.4 3.5 2.9 2.8 1.6 2.2Profit and loss transfers (parent company) 1.2 1.2 0.3 0.2 0.1 0.1 0.1 0.1 1.4 1.4Profit and loss transfers (subsidiary) 0.8 1.1 - 0.5 - 0.6 0.2 0.2 0.5 0.6 0.9 1.2Profit for the year 2.2 2.4 4.5 5.1 3.3 3.4 2.5 2.3 2.1 2.4
Balance sheetAssets Percentage of the balance sheet totalIntangible fixed assets 2.0 1.9 0.6 0.6 0.7 0.7 1.3 1.3 2.1 1.9Tangible fixed assets 18.6 19.0 43.2 40.9 32.1 31.6 31.2 31.1 17.4 17.8
of which: Land and buildings 5.4 5.6 12.8 11.7 10.1 9.9 13.3 13.1 4.7 4.9Inventories 8.9 9.2 15.4 17.2 22.6 23.9 22.3 22.4 7.7 7.9
of which: Finished goods and merchandise 4.3 4.4 5.5 5.7 9.1 9.1 9.4 9.5 3.8 4.0Cash 4.5 4.6 13.0 13.4 12.4 12.3 9.7 10.0 4.0 4.0Receivables 35.2 34.4 22.8 22.3 26.7 26.1 28.5 28.0 35.9 35.1
Short-term 25.7 24.0 22.2 21.2 25.5 25.1 26.9 26.3 25.6 23.8 of which:
Trade receivables 7.1 7.0 10.7 10.3 12.7 12.3 12.2 11.7 6.7 6.5Receivables from affiliated companies 15.9 14.0 6.4 5.8 8.6 8.7 11.1 11.2 16.4 14.3
Long-term 9.6 10.4 0.7 1.1 1.1 1.0 1.6 1.7 10.3 11.3of which: Loans to affiliated companies 8.9 9.4 0.4 0.8 0.6 0.7 1.0 1.1 9.6 10.2
Securities 0.8 1.1 0.5 0.5 1.1 1.1 1.5 1.5 0.8 1.1Other long-term equity investments 29.4 29.4 3.6 4.4 3.8 3.8 5.1 5.4 31.7 31.7
of which: Goodwill 0.2 0.2 0.8 0.6 0.4 0.4 0.5 0.4 0.2 0.2
CapitalEquity 35.0 36.0 31.2 31.5 34.2 34.2 36.7 37.0 34.9 35.9Liabilities 52.3 50.9 61.6 61.6 56.4 56.3 50.8 50.7 52.3 50.8
Short-term 32.7 32.7 38.2 39.3 39.5 40.5 37.5 37.3 32.2 32.2of which:Liabilities to banks 2.3 2.5 9.3 9.0 7.5 8.0 6.3 6.5 1.9 2.1Trade payables 5.4 5.2 7.4 7.8 8.2 7.6 7.3 6.8 5.2 5.0Liabilities to affiliated companies 19.1 19.2 7.1 7.5 9.2 9.0 12.3 12.0 19.8 19.9
Long-term 19.6 18.2 23.5 22.2 16.9 15.9 13.3 13.5 20.1 18.6 of which:
Liabilities to banks 5.1 4.8 17.5 17.2 12.3 11.1 9.3 8.9 4.6 4.4Liabilities to affiliated companies 11.5 9.6 4.3 3.4 3.6 3.6 2.9 3.5 12.3 10.2
Provisions 12.2 12.6 6.3 6.2 8.6 8.5 11.5 11.3 12.4 12.8of which: Provisions for pensions 4.1 4.3 1.2 1.2 2.7 2.7 4.1 4.1 4.1 4.4
Other ratios Percentage of salesAnnual result before taxes on income 2.4 2.9 5.4 6.1 4.7 4.8 4.1 3.9 2.2 2.7Annual result and depreciation 4.8 5.2 8.4 8.9 6.6 6.8 5.8 5.7 4.6 5.1Trade receivables 6.7 6.6 8.8 8.6 9.0 8.8 8.7 8.4 6.5 6.3
Percentage of the balance sheet totalSales 106.2 106.1 120.8 119.7 141.1 139.6 141.2 140.6 103.0 102.9Annual result and interest paid 3.6 3.7 6.0 6.5 6.0 6.0 5.3 5.0 3.4 3.5
Percentage of liabilities and provisions less cashAnnual result and depreciation 8.4 9.2 18.3 19.3 17.4 17.8 15.3 15.1 7.8 8.7
Percentage of fixed assetsLong-term equity and liabilities 97.6 95.0 115.7 116.3 139.2 139.1 134.4 134.5 95.4 92.6
Percentage of short-term liabilitiesCash resources and short-term receivables 93.4 88.2 92.8 88.6 96.7 93.0 98.7 98.3 92.8 87.2Cash resources, short-term receivables and inventories 120.7 116.2 133.2 132.3 154.0 152.0 158.2 158.4 116.7 111.7
Percentage of cost of materialsTrade payables 7.1 6.9 15.9 16.9 11.6 10.8 9.0 8.4 6.8 6.7
Memo item:Balance sheet total in € billion 837.23 843.26 2.47 2.71 13.12 13.88 55.70 57.81 765.94 768.85Sales in € billion 888.97 895.05 2.98 3.25 18.51 19.39 78.64 81.26 788.84 791.15Number of enterprises 12 558 12 558 3 405 3 405 3 758 3 758 3 249 3 249 2 146 2 146
* Agriculture, forestry and fishing, mining and quarrying, manufacturing, electricity, gas and water supply, construction, trade, transportation and storage,accommodation and food service activities, information and communication, business services, personal service activities

Deutsche BundesbankFinancial statement statistics (ratios - provisional data)
May 2021237
IV. Enterprises by federal state and economic sector
cont'd: 10. North Rhine-Westphaliaa) All economic sectors*
cont'd: All legal formsEnterprises with sales of ... € million
Total Less than 2 2 but less than 10 10 but less than 50 50 and moreQuartile Cylindered sample 2018/2019value 2018 2019 2018 2019 2018 2019 2018 2019 2018 2019Of the enterprises captured …
Ratios ... % had a ratio of less than …Percentage of gross revenue
Cost of materials 25 27.9 27.8 7.7 7.6 28.0 28.0 41.1 40.6 48.8 48.9 50 51.4 51.4 32.7 32.3 49.3 49.3 60.0 59.7 67.9 67.5 75 72.1 71.9 54.2 53.8 69.6 69.3 76.4 76.5 82.8 82.6
Personnel expenses 25 10.7 10.8 14.9 15.0 13.0 13.1 9.8 9.8 6.4 6.6 50 22.9 23.3 31.0 31.5 26.2 26.4 19.6 19.9 13.9 14.4 75 38.5 38.9 46.5 47.0 40.1 40.4 33.2 34.0 24.7 25.7
Depreciation 25 0.6 0.6 0.8 0.7 0.6 0.6 0.6 0.6 0.5 0.5 50 1.6 1.6 1.9 1.9 1.4 1.4 1.4 1.4 1.5 1.5 75 3.5 3.6 4.5 4.4 3.2 3.3 3.1 3.1 3.3 3.4
Annual result 25 0.5 0.5 0.3 0.8 0.7 0.8 0.6 0.5 0.3 0.3 50 2.6 2.6 3.6 4.1 2.7 2.6 2.3 2.1 1.9 1.7 75 6.2 6.4 10.0 10.7 5.9 5.9 5.1 5.0 4.6 4.6
Percentage of the balance sheet totalTangible fixed assets 25 3.5 3.5 3.1 2.9 3.3 3.3 3.8 4.0 4.1 4.3
50 13.2 13.2 12.9 12.9 12.0 11.7 13.3 13.6 15.9 15.3 75 34.0 34.0 38.5 37.1 32.9 33.4 31.7 32.0 34.3 35.3
Inventories 25 0.9 0.9 0.0 0.0 1.4 1.6 2.5 2.5 3.1 3.0 50 16.4 16.7 5.1 6.0 19.1 19.5 24.5 24.0 19.0 18.6 75 40.9 41.2 30.4 31.0 46.4 46.7 45.0 45.1 37.8 36.9
Equity 25 9.3 10.9 3.3 6.9 8.8 10.1 12.9 13.4 14.5 14.8 50 27.8 29.2 24.2 26.8 26.0 27.1 30.0 31.4 30.9 31.3 75 50.3 52.3 51.3 54.2 49.9 51.8 50.6 52.4 49.0 50.2
Short-term liabilities 25 20.5 19.3 18.9 17.4 21.4 20.0 20.5 19.7 21.2 20.1 50 42.4 41.1 43.2 40.3 44.1 43.4 42.7 41.7 39.1 37.5 75 68.5 67.2 73.2 68.9 70.3 70.0 65.9 65.4 62.2 61.7
Liabilities to banks 25 0.0 0.0 0.0 0.0 0.0 0.0 0.0 0.0 0.0 0.0 50 4.0 3.9 5.9 5.5 5.5 5.5 3.2 3.0 0.4 0.3 75 26.3 25.8 32.5 32.1 28.2 27.4 23.9 24.6 18.1 17.9
Percentage of salesAnnual result before taxes on income 25 0.8 0.8 0.5 1.0 1.0 1.1 0.9 0.7 0.5 0.4
50 3.4 3.4 4.6 5.3 3.6 3.6 3.1 2.9 2.5 2.2 75 8.1 8.3 12.7 13.5 7.7 7.8 6.6 6.5 5.7 5.8
Annual result and depreciation 25 2.3 2.3 2.4 3.2 2.6 2.7 2.3 2.0 1.9 1.5 50 5.6 5.7 7.8 8.5 5.9 5.9 5.1 4.8 4.4 4.1 75 11.5 12.0 17.4 18.4 10.9 11.2 9.5 9.6 8.9 8.7
Trade receivables 25 3.0 2.8 1.8 1.9 3.5 3.1 3.6 3.3 3.2 3.0 50 7.0 6.5 6.1 5.8 7.3 6.7 7.2 6.8 7.2 6.8 75 11.9 11.5 12.3 11.8 12.3 11.6 11.8 11.3 11.5 11.2
Percentage of the balance sheet totalAnnual result and interest paid 25 2.3 2.3 1.7 2.8 2.7 2.8 2.5 2.1 1.9 1.6
50 6.4 6.4 8.3 9.2 6.7 6.9 5.9 5.5 5.2 4.6 75 13.7 13.8 21.5 23.7 14.0 13.9 11.4 10.9 9.5 9.2
Percentage of liabilities and provisions less cashAnnual result and depreciation 25 4.3 4.5 - 1.1 2.2 4.5 4.7 5.7 5.0 5.9 5.2
50 15.9 16.5 16.9 19.7 16.2 16.9 16.0 15.6 14.8 14.0 75 40.0 40.5 54.9 57.5 41.2 41.9 37.3 35.7 29.3 30.4
Percentage of fixed assetsLong-term equity and liabilities 25 92.1 95.1 73.0 84.8 93.4 96.8 100.0 99.0 95.0 95.5
50 174.1 181.8 156.5 181.2 195.9 202.9 190.0 188.3 151.9 153.1 75 477.0 509.0 518.2 566.0 564.9 606.3 460.1 476.7 327.1 334.5
Percentage of short-term liabilitiesCash resources and short-term receivables 25 52.6 53.7 50.0 54.6 47.9 47.7 54.1 54.1 59.9 60.4
50 104.6 107.6 110.7 120.2 99.4 101.7 103.5 104.4 106.5 107.6 75 221.8 235.3 272.2 300.0 217.3 238.6 207.5 217.8 190.4 196.6
Percentage of cost of materialsTrade payables 25 4.1 3.7 4.4 3.9 4.6 4.0 4.1 3.6 3.4 3.2
50 8.6 8.0 10.8 10.4 9.5 8.5 7.9 7.4 7.1 6.7 75 16.6 15.6 26.3 24.5 18.2 17.2 14.1 13.1 12.2 11.3
* Agriculture, forestry and fishing, mining and quarrying, manufacturing, electricity, gas and water supply, construction, trade, transportation and storage,accommodation and food service activities, information and communication, business services, personal service activities

Deutsche BundesbankFinancial statement statistics (ratios - provisional data)May 2021238
IV. Enterprises by federal state and economic sector
cont'd: 10. North Rhine-Westphaliaa) All economic sectors*
CorporationsEnterprises with sales of ... € million
Total Less than 2 2 but less than 10 10 but less than 50 50 and moreCylindered sample 2018/2019
Ratios 2018 2019 2018 2019 2018 2019 2018 2019 2018 2019Income statementIncome Percentage of gross revenueSales 99.8 99.7 98.1 98.1 99.1 98.4 99.2 99.4 99.8 99.8Change in finished goods 0.2 0.3 1.9 1.9 0.9 1.6 0.8 0.6 0.2 0.2Interest and similar income 0.5 0.6 0.1 0.2 0.2 0.2 0.2 0.2 0.6 0.6Other income 4.5 4.9 3.7 3.5 4.5 4.5 3.0 3.1 4.7 5.1
of which: Income from long-term equity investments 0.9 1.1 0.1 0.1 0.3 0.3 0.4 0.4 0.9 1.2Total income 105.1 105.5 103.9 103.6 104.7 104.6 103.2 103.3 105.3 105.7
ExpensesCost of materials 71.6 70.9 38.6 38.7 49.0 48.7 55.8 55.6 73.6 72.9Personnel expenses 13.8 14.3 36.1 35.9 30.5 30.6 25.2 25.5 12.4 12.8Depreciation 3.2 3.0 3.6 3.5 2.9 3.0 2.9 2.9 3.2 3.0
of which: Depreciation of tangible fixed assets 2.9 2.8 3.5 3.4 2.8 2.8 2.7 2.7 3.0 2.8Interest and similar expenses 1.8 1.3 0.9 0.8 0.8 0.7 0.8 0.8 1.9 1.4Operating taxes 0.1 0.1 0.2 0.2 0.1 0.1 0.1 0.1 0.1 0.1Other expenses 12.4 13.0 21.4 20.7 17.4 17.4 14.5 14.5 12.1 12.8Total expenses before taxes on income 103.0 102.7 100.8 99.9 100.7 100.4 99.2 99.4 103.3 103.0Annual result before taxes on income 2.1 2.8 3.0 3.7 4.0 4.2 4.0 3.8 1.9 2.6Taxes on income 0.7 0.6 1.5 1.6 1.3 1.3 1.2 1.1 0.6 0.6Annual result 1.5 2.1 1.5 2.1 2.7 2.9 2.8 2.7 1.3 2.1Profit and loss transfers (parent company) 1.4 1.4 0.3 0.2 0.2 0.1 0.1 0.2 1.6 1.6Profit and loss transfers (subsidiary) 1.0 1.3 - 0.7 - 0.9 0.3 0.3 0.7 0.8 1.0 1.4Profit for the year 1.9 2.3 2.6 3.2 2.6 2.7 2.2 2.1 1.9 2.3
Balance sheetAssets Percentage of the balance sheet totalIntangible fixed assets 2.1 1.9 0.7 0.7 0.8 0.8 1.1 1.1 2.2 2.0Tangible fixed assets 17.9 18.3 32.0 29.5 29.3 28.8 32.6 32.6 16.8 17.2
of which: Land and buildings 5.2 5.3 13.6 11.9 10.0 9.8 14.4 14.2 4.5 4.7Inventories 7.5 7.8 19.1 20.8 22.2 23.4 19.9 19.9 6.5 6.7
of which: Finished goods and merchandise 3.5 3.7 6.4 6.4 8.7 8.7 8.2 8.3 3.2 3.3Cash 4.2 4.2 15.4 15.6 13.4 13.0 9.4 9.5 3.8 3.6Receivables 35.5 34.7 26.7 26.4 28.2 28.1 29.4 28.9 36.0 35.2
Short-term 25.2 23.5 26.1 25.1 26.9 26.8 27.6 27.1 25.0 23.2 of which:
Trade receivables 6.5 6.4 13.2 12.7 13.3 12.9 11.7 11.3 6.1 6.0Receivables from affiliated companies 16.1 14.1 7.3 6.9 9.1 9.5 12.4 12.5 16.4 14.3
Long-term 10.3 11.2 0.6 1.3 1.4 1.2 1.8 1.8 11.0 12.0of which: Loans to affiliated companies 9.6 10.2 0.3 0.9 0.7 0.8 1.1 1.2 10.3 10.9
Securities 0.8 1.1 0.7 0.6 1.4 1.4 1.6 1.7 0.7 1.1Other long-term equity investments 31.6 31.6 4.7 5.8 4.1 4.1 5.6 5.8 33.7 33.7
of which: Goodwill 0.2 0.2 0.9 0.7 0.4 0.4 0.6 0.5 0.2 0.2
CapitalEquity 35.8 36.8 32.9 33.2 38.1 38.0 39.8 40.1 35.5 36.6Liabilities 51.5 50.0 58.7 58.7 51.3 51.5 47.0 46.9 51.8 50.2
Short-term 31.3 31.3 41.3 42.1 36.4 36.9 33.9 33.3 31.0 31.1of which:Liabilities to banks 1.9 2.1 8.0 7.5 6.7 6.6 5.6 5.7 1.6 1.8Trade payables 4.8 4.6 8.7 9.3 8.2 7.4 7.0 6.5 4.6 4.4Liabilities to affiliated companies 19.0 19.1 7.4 7.7 7.0 7.0 10.6 10.2 19.7 19.9
Long-term 20.2 18.7 17.3 16.7 14.9 14.6 13.0 13.6 20.7 19.1 of which:
Liabilities to banks 4.8 4.5 10.9 11.5 10.3 9.7 9.3 9.0 4.4 4.1Liabilities to affiliated companies 12.2 10.2 4.7 3.5 3.6 3.8 2.6 3.5 12.9 10.7
Provisions 12.3 12.7 7.7 7.4 9.7 9.5 12.1 12.0 12.3 12.8of which: Provisions for pensions 4.1 4.3 1.8 1.7 3.4 3.4 4.5 4.6 4.1 4.3
Other ratios Percentage of salesAnnual result before taxes on income 2.1 2.8 3.1 3.8 4.1 4.3 4.0 3.9 1.9 2.6Annual result and depreciation 4.7 5.2 5.2 5.7 5.7 6.0 5.7 5.7 4.6 5.1Trade receivables 6.7 6.6 9.6 9.4 9.4 9.3 8.8 8.6 6.5 6.3
Percentage of the balance sheet totalSales 97.4 97.5 137.8 135.0 141.0 139.1 131.8 131.0 94.5 94.6Annual result and interest paid 3.2 3.4 3.4 4.1 4.9 5.1 4.8 4.6 3.0 3.3
Percentage of liabilities and provisions less cashAnnual result and depreciation 7.6 8.6 13.7 15.1 16.5 16.9 14.7 14.8 7.1 8.1
Percentage of fixed assetsLong-term equity and liabilities 96.3 93.6 135.8 137.6 153.8 155.4 135.4 136.4 94.2 91.2
Percentage of short-term liabilitiesCash resources and short-term receivables 95.0 89.0 101.1 97.5 111.4 108.7 109.9 110.8 93.6 87.1Cash resources, short-term receivables and inventories 119.0 113.8 147.3 146.9 172.4 172.1 168.5 170.6 114.6 108.6
Percentage of cost of materialsTrade payables 6.8 6.6 16.0 17.4 11.7 10.8 9.5 8.9 6.5 6.4
Memo item:Balance sheet total in € billion 762.05 764.67 1.61 1.81 9.76 10.43 44.86 46.72 705.82 705.72Sales in € billion 742.25 745.71 2.22 2.44 13.77 14.51 59.11 61.22 667.15 667.54Number of enterprises 9 403 9 403 2 511 2 511 2 807 2 807 2 435 2 435 1 650 1 650
* Agriculture, forestry and fishing, mining and quarrying, manufacturing, electricity, gas and water supply, construction, trade, transportation and storage,accommodation and food service activities, information and communication, business services, personal service activities
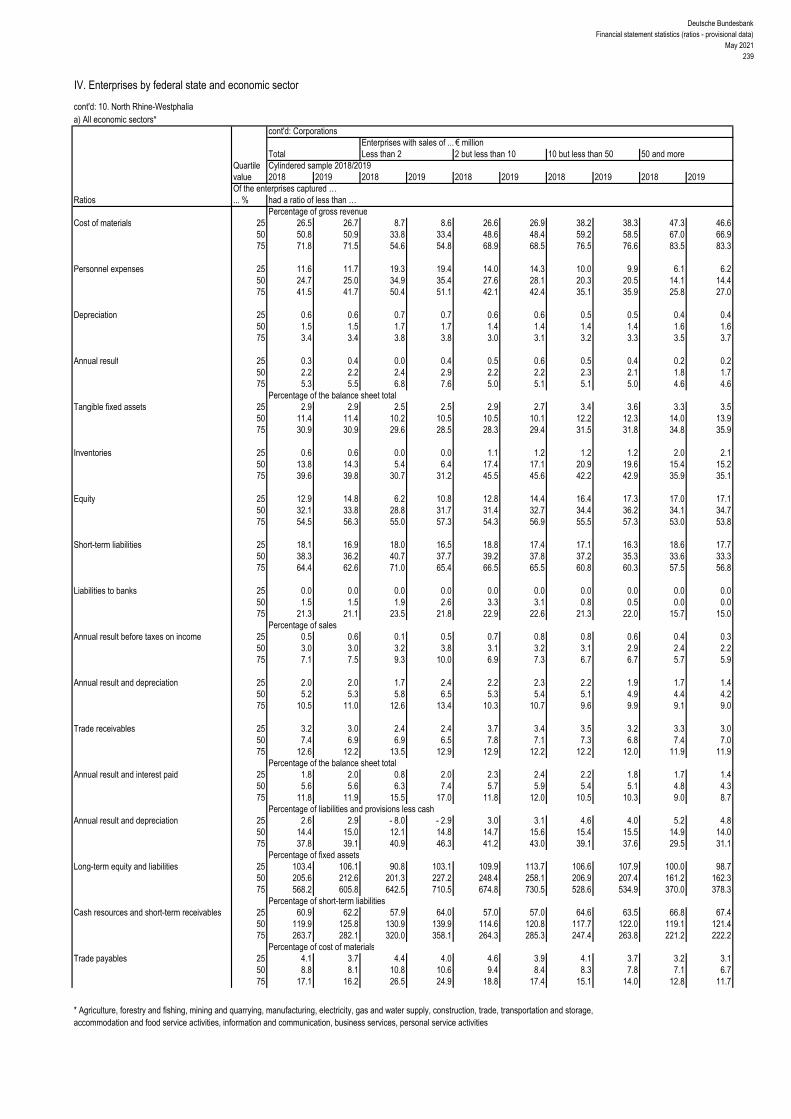
Deutsche BundesbankFinancial statement statistics (ratios - provisional data)
May 2021239
IV. Enterprises by federal state and economic sector
cont'd: 10. North Rhine-Westphaliaa) All economic sectors*
cont'd: CorporationsEnterprises with sales of ... € million
Total Less than 2 2 but less than 10 10 but less than 50 50 and moreQuartile Cylindered sample 2018/2019value 2018 2019 2018 2019 2018 2019 2018 2019 2018 2019Of the enterprises captured …
Ratios ... % had a ratio of less than …Percentage of gross revenue
Cost of materials 25 26.5 26.7 8.7 8.6 26.6 26.9 38.2 38.3 47.3 46.6 50 50.8 50.9 33.8 33.4 48.6 48.4 59.2 58.5 67.0 66.9 75 71.8 71.5 54.6 54.8 68.9 68.5 76.5 76.6 83.5 83.3
Personnel expenses 25 11.6 11.7 19.3 19.4 14.0 14.3 10.0 9.9 6.1 6.2 50 24.7 25.0 34.9 35.4 27.6 28.1 20.3 20.5 14.1 14.4 75 41.5 41.7 50.4 51.1 42.1 42.4 35.1 35.9 25.8 27.0
Depreciation 25 0.6 0.6 0.7 0.7 0.6 0.6 0.5 0.5 0.4 0.4 50 1.5 1.5 1.7 1.7 1.4 1.4 1.4 1.4 1.6 1.6 75 3.4 3.4 3.8 3.8 3.0 3.1 3.2 3.3 3.5 3.7
Annual result 25 0.3 0.4 0.0 0.4 0.5 0.6 0.5 0.4 0.2 0.2 50 2.2 2.2 2.4 2.9 2.2 2.2 2.3 2.1 1.8 1.7 75 5.3 5.5 6.8 7.6 5.0 5.1 5.1 5.0 4.6 4.6
Percentage of the balance sheet totalTangible fixed assets 25 2.9 2.9 2.5 2.5 2.9 2.7 3.4 3.6 3.3 3.5
50 11.4 11.4 10.2 10.5 10.5 10.1 12.2 12.3 14.0 13.9 75 30.9 30.9 29.6 28.5 28.3 29.4 31.5 31.8 34.8 35.9
Inventories 25 0.6 0.6 0.0 0.0 1.1 1.2 1.2 1.2 2.0 2.1 50 13.8 14.3 5.4 6.4 17.4 17.1 20.9 19.6 15.4 15.2 75 39.6 39.8 30.7 31.2 45.5 45.6 42.2 42.9 35.9 35.1
Equity 25 12.9 14.8 6.2 10.8 12.8 14.4 16.4 17.3 17.0 17.1 50 32.1 33.8 28.8 31.7 31.4 32.7 34.4 36.2 34.1 34.7 75 54.5 56.3 55.0 57.3 54.3 56.9 55.5 57.3 53.0 53.8
Short-term liabilities 25 18.1 16.9 18.0 16.5 18.8 17.4 17.1 16.3 18.6 17.7 50 38.3 36.2 40.7 37.7 39.2 37.8 37.2 35.3 33.6 33.3 75 64.4 62.6 71.0 65.4 66.5 65.5 60.8 60.3 57.5 56.8
Liabilities to banks 25 0.0 0.0 0.0 0.0 0.0 0.0 0.0 0.0 0.0 0.0 50 1.5 1.5 1.9 2.6 3.3 3.1 0.8 0.5 0.0 0.0 75 21.3 21.1 23.5 21.8 22.9 22.6 21.3 22.0 15.7 15.0
Percentage of salesAnnual result before taxes on income 25 0.5 0.6 0.1 0.5 0.7 0.8 0.8 0.6 0.4 0.3
50 3.0 3.0 3.2 3.8 3.1 3.2 3.1 2.9 2.4 2.2 75 7.1 7.5 9.3 10.0 6.9 7.3 6.7 6.7 5.7 5.9
Annual result and depreciation 25 2.0 2.0 1.7 2.4 2.2 2.3 2.2 1.9 1.7 1.4 50 5.2 5.3 5.8 6.5 5.3 5.4 5.1 4.9 4.4 4.2 75 10.5 11.0 12.6 13.4 10.3 10.7 9.6 9.9 9.1 9.0
Trade receivables 25 3.2 3.0 2.4 2.4 3.7 3.4 3.5 3.2 3.3 3.0 50 7.4 6.9 6.9 6.5 7.8 7.1 7.3 6.8 7.4 7.0 75 12.6 12.2 13.5 12.9 12.9 12.2 12.2 12.0 11.9 11.9
Percentage of the balance sheet totalAnnual result and interest paid 25 1.8 2.0 0.8 2.0 2.3 2.4 2.2 1.8 1.7 1.4
50 5.6 5.6 6.3 7.4 5.7 5.9 5.4 5.1 4.8 4.3 75 11.8 11.9 15.5 17.0 11.8 12.0 10.5 10.3 9.0 8.7
Percentage of liabilities and provisions less cashAnnual result and depreciation 25 2.6 2.9 - 8.0 - 2.9 3.0 3.1 4.6 4.0 5.2 4.8
50 14.4 15.0 12.1 14.8 14.7 15.6 15.4 15.5 14.9 14.0 75 37.8 39.1 40.9 46.3 41.2 43.0 39.1 37.6 29.5 31.1
Percentage of fixed assetsLong-term equity and liabilities 25 103.4 106.1 90.8 103.1 109.9 113.7 106.6 107.9 100.0 98.7
50 205.6 212.6 201.3 227.2 248.4 258.1 206.9 207.4 161.2 162.3 75 568.2 605.8 642.5 710.5 674.8 730.5 528.6 534.9 370.0 378.3
Percentage of short-term liabilitiesCash resources and short-term receivables 25 60.9 62.2 57.9 64.0 57.0 57.0 64.6 63.5 66.8 67.4
50 119.9 125.8 130.9 139.9 114.6 120.8 117.7 122.0 119.1 121.4 75 263.7 282.1 320.0 358.1 264.3 285.3 247.4 263.8 221.2 222.2
Percentage of cost of materialsTrade payables 25 4.1 3.7 4.4 4.0 4.6 3.9 4.1 3.7 3.2 3.1
50 8.8 8.1 10.8 10.6 9.4 8.4 8.3 7.8 7.1 6.7 75 17.1 16.2 26.5 24.9 18.8 17.4 15.1 14.0 12.8 11.7
* Agriculture, forestry and fishing, mining and quarrying, manufacturing, electricity, gas and water supply, construction, trade, transportation and storage,accommodation and food service activities, information and communication, business services, personal service activities

Deutsche BundesbankFinancial statement statistics (ratios - provisional data)May 2021240
IV. Enterprises by federal state and economic sector
cont'd: 10. North Rhine-Westphaliaa) All economic sectors*
Non-corporationsEnterprises with sales of ... € million
Total Less than 2 2 but less than 10 10 but less than 50 50 and moreCylindered sample 2018/2019
Ratios 2018 2019 2018 2019 2018 2019 2018 2019 2018 2019Income statementIncome Percentage of gross revenueSales 99.5 99.7 99.5 98.3 99.8 98.7 99.0 99.5 99.5 99.8Change in finished goods 0.5 0.3 0.5 1.7 0.2 1.3 1.0 0.5 0.5 0.2Interest and similar income 0.1 0.1 0.1 0.1 0.1 0.1 0.1 0.1 0.1 0.1Other income 2.0 2.1 3.2 3.1 2.5 2.5 1.5 1.6 2.1 2.1
of which: Income from long-term equity investments 0.5 0.5 0.1 0.2 0.4 0.4 0.2 0.3 0.6 0.5Total income 102.2 102.2 103.3 103.2 102.6 102.6 101.6 101.7 102.2 102.3
ExpensesCost of materials 69.3 68.3 36.0 36.1 50.8 51.0 61.2 61.0 71.5 70.4Personnel expenses 14.4 14.8 24.5 24.5 24.3 24.2 19.5 20.0 13.1 13.5Depreciation 2.0 2.2 7.5 7.3 3.9 3.9 2.6 2.7 1.8 2.0
of which: Depreciation of tangible fixed assets 1.9 2.0 7.4 7.3 3.8 3.8 2.5 2.6 1.7 1.8Interest and similar expenses 0.7 0.7 1.7 1.7 0.9 0.9 0.7 0.7 0.7 0.7Operating taxes 0.0 0.0 0.2 0.2 0.1 0.1 0.1 0.1 0.0 0.0Other expenses 11.9 12.7 21.4 20.8 16.0 16.0 13.1 13.4 11.5 12.4Total expenses before taxes on income 98.3 98.7 91.2 90.6 96.0 96.2 97.2 97.8 98.6 99.0Annual result before taxes on income 3.9 3.5 12.1 12.7 6.6 6.4 4.3 3.8 3.7 3.3Taxes on income 0.6 0.6 1.7 1.9 1.2 1.1 0.9 0.8 0.6 0.6Annual result 3.2 2.9 10.4 10.8 5.5 5.3 3.4 3.1 3.1 2.7Profit and loss transfers (parent company) 0.2 0.2 0.0 0.0 0.1 0.1 0.0 0.0 0.3 0.3Profit and loss transfers (subsidiary) 0.1 0.1 0.0 0.0 0.0 0.0 0.0 0.0 0.1 0.1Profit for the year 3.4 3.0 10.3 10.8 5.6 5.4 3.4 3.0 3.3 2.9
Balance sheetAssets Percentage of the balance sheet totalIntangible fixed assets 1.5 1.5 0.4 0.3 0.6 0.6 2.0 2.0 1.4 1.5Tangible fixed assets 25.8 25.8 64.2 63.8 40.4 39.9 25.2 24.5 24.6 24.7
of which: Land and buildings 7.8 8.0 11.4 11.2 10.3 10.3 8.5 8.4 7.5 7.7Inventories 23.1 22.9 8.5 10.1 23.7 25.3 32.3 32.9 21.6 21.2
of which: Finished goods and merchandise 11.7 11.7 3.9 4.2 10.5 10.6 14.1 14.4 11.5 11.4Cash 7.7 8.9 8.5 9.0 9.6 10.2 11.1 11.8 7.0 8.3Receivables 32.9 31.4 15.6 14.1 22.1 20.3 24.6 24.1 35.2 33.5
Short-term 30.5 29.0 14.8 13.4 21.6 19.8 23.7 23.1 32.4 30.8 of which:
Trade receivables 13.2 12.6 5.9 5.6 10.8 10.4 14.6 13.8 13.2 12.6Receivables from affiliated companies 13.6 12.9 4.6 3.6 7.4 6.0 5.8 5.8 15.5 14.7
Long-term 2.4 2.3 0.8 0.7 0.5 0.4 0.8 1.0 2.8 2.7of which: Loans to affiliated companies 1.5 1.5 0.7 0.6 0.3 0.2 0.5 0.6 1.7 1.8
Securities 1.4 0.9 0.2 0.3 0.2 0.2 1.3 0.9 1.5 1.0Other long-term equity investments 7.3 8.2 1.6 1.6 2.8 2.9 3.2 3.6 8.3 9.4
of which: Goodwill 0.2 0.2 0.5 0.4 0.5 0.5 0.2 0.3 0.1 0.1
CapitalEquity 27.2 27.9 28.1 28.1 22.6 23.0 23.9 23.9 28.0 28.9Liabilities 60.2 59.1 67.2 67.1 71.3 70.9 66.4 66.8 58.4 57.0
Short-term 46.7 46.2 32.3 33.9 48.4 51.2 52.0 53.9 45.8 44.8of which:Liabilities to banks 6.1 6.3 11.8 12.1 10.0 12.2 9.3 10.1 5.3 5.2Trade payables 11.5 11.0 5.0 5.0 8.2 8.0 8.5 7.9 12.3 11.8Liabilities to affiliated companies 20.0 19.6 6.4 6.9 15.8 15.0 19.1 19.7 20.6 20.0
Long-term 13.5 12.9 34.9 33.3 22.9 19.7 14.4 12.9 12.6 12.2 of which:
Liabilities to banks 8.3 8.0 29.8 28.6 18.0 15.3 9.4 8.6 7.2 7.2Liabilities to affiliated companies 4.4 4.2 3.6 3.4 3.6 2.9 4.0 3.6 4.6 4.3
Provisions 11.9 12.3 3.6 3.6 5.4 5.5 8.7 8.4 13.0 13.5of which: Provisions for pensions 4.4 4.4 0.1 0.1 0.7 0.7 2.6 2.2 5.0 5.1
Other ratios Percentage of salesAnnual result before taxes on income 3.9 3.5 12.1 12.9 6.6 6.5 4.4 3.9 3.7 3.3Annual result and depreciation 5.3 5.1 17.9 18.4 9.4 9.4 6.1 5.8 4.9 4.7Trade receivables 6.8 6.6 6.6 6.3 7.7 7.4 8.1 7.6 6.5 6.4
Percentage of the balance sheet totalSales 195.2 190.0 89.1 89.3 141.3 141.3 180.2 180.7 202.4 195.8Annual result and interest paid 7.7 6.8 10.8 11.4 9.1 8.9 7.6 6.8 7.6 6.7
Percentage of liabilities and provisions less cashAnnual result and depreciation 15.9 15.3 25.2 26.1 19.5 19.8 17.0 16.2 15.3 14.7
Percentage of fixed assetsLong-term equity and liabilities 119.0 117.7 94.1 92.6 104.1 98.6 128.6 123.6 119.2 118.6
Percentage of short-term liabilitiesCash resources and short-term receivables 82.7 82.7 72.8 66.8 64.6 58.7 68.5 65.5 86.8 88.1Cash resources, short-term receivables and inventories 132.1 132.3 99.2 96.5 113.6 108.2 130.6 126.6 133.9 135.4
Percentage of cost of materialsTrade payables 8.4 8.4 15.7 15.2 11.5 10.9 7.6 7.1 8.4 8.5
Memo item:Balance sheet total in € billion 75.18 78.58 0.86 0.91 3.35 3.45 10.84 11.09 60.13 63.13Sales in € billion 146.72 149.34 0.76 0.81 4.74 4.88 19.52 20.04 121.69 123.61Number of enterprises 3 155 3 155 894 894 951 951 814 814 496 496
* Agriculture, forestry and fishing, mining and quarrying, manufacturing, electricity, gas and water supply, construction, trade, transportation and storage,accommodation and food service activities, information and communication, business services, personal service activities

Deutsche BundesbankFinancial statement statistics (ratios - provisional data)
May 2021241
IV. Enterprises by federal state and economic sector
cont'd: 10. North Rhine-Westphaliaa) All economic sectors*
cont'd: Non-corporationsEnterprises with sales of ... € million
Total Less than 2 2 but less than 10 10 but less than 50 50 and moreQuartile Cylindered sample 2018/2019value 2018 2019 2018 2019 2018 2019 2018 2019 2018 2019Of the enterprises captured …
Ratios ... % had a ratio of less than …Percentage of gross revenue
Cost of materials 25 31.6 31.4 3.2 4.1 32.4 31.8 46.4 46.3 54.4 52.6 50 53.3 52.6 29.5 28.7 52.4 51.5 62.0 61.6 69.8 69.1 75 72.8 72.6 52.2 51.1 71.3 71.9 76.3 76.3 81.0 80.3
Personnel expenses 25 8.5 8.7 5.5 5.4 10.8 11.2 9.1 9.2 7.3 7.6 50 18.4 18.9 20.5 20.6 22.1 22.8 17.4 18.1 13.2 13.9 75 31.0 32.1 34.3 35.7 34.8 34.9 28.6 29.2 22.9 23.1
Depreciation 25 0.8 0.8 1.1 1.0 0.8 0.8 0.7 0.7 0.7 0.7 50 1.8 1.7 2.7 2.7 1.8 1.7 1.3 1.4 1.4 1.4 75 3.9 4.0 7.6 7.3 3.7 3.8 2.7 2.8 2.8 2.9
Annual result 25 1.3 1.3 3.6 4.1 1.7 1.7 0.8 0.7 0.7 0.4 50 4.1 3.8 10.2 10.2 4.3 4.0 2.5 2.3 2.0 1.9 75 9.3 9.2 20.1 20.5 7.8 7.8 5.2 4.9 4.7 4.6
Percentage of the balance sheet totalTangible fixed assets 25 6.4 6.3 7.1 7.2 6.4 6.0 5.7 5.8 7.1 7.1
50 19.4 19.5 28.2 28.1 18.3 18.4 16.7 16.0 20.6 20.2 75 42.1 42.3 65.0 64.3 44.8 45.8 32.3 32.6 33.4 33.5
Inventories 25 3.1 3.0 0.0 0.0 4.1 3.7 14.0 13.9 14.5 13.1 50 22.6 22.9 4.5 4.7 24.2 24.0 33.7 33.0 26.6 25.5 75 44.9 44.8 29.6 31.0 49.4 49.8 49.7 50.7 43.1 41.6
Equity 25 3.9 4.5 - 3.4 0.3 3.1 3.8 6.8 7.1 9.6 10.2 50 15.8 17.1 10.4 14.1 12.6 13.0 19.2 20.6 21.4 23.3 75 34.6 34.8 35.7 36.7 29.2 30.8 35.2 35.6 36.1 36.9
Short-term liabilities 25 32.6 31.9 23.4 20.9 34.5 34.0 38.0 38.8 34.2 32.7 50 56.2 55.2 52.2 49.5 59.4 58.4 56.4 56.1 54.5 53.6 75 77.3 76.3 77.9 75.7 80.6 79.5 75.6 75.5 74.5 72.1
Liabilities to banks 25 0.0 0.0 0.0 0.0 0.0 0.0 0.0 0.0 0.0 0.0 50 14.4 14.1 23.5 23.8 15.4 15.7 11.3 11.3 6.6 6.2 75 39.7 39.7 59.4 55.6 41.2 42.1 31.8 30.9 25.4 26.4
Percentage of salesAnnual result before taxes on income 25 1.7 1.6 3.8 4.8 2.1 2.1 1.2 1.0 0.9 0.5
50 4.9 4.7 11.5 12.2 5.1 5.0 3.2 2.9 2.6 2.3 75 11.2 11.1 23.1 24.0 9.4 9.4 6.5 5.9 5.7 5.4
Annual result and depreciation 25 3.5 3.2 7.7 8.5 4.0 3.8 2.6 2.3 2.1 1.9 50 7.4 7.2 17.0 17.2 7.5 7.4 5.0 4.6 4.5 3.7 75 15.3 15.4 33.3 32.5 13.0 12.9 9.1 8.4 8.2 7.9
Trade receivables 25 2.3 2.2 0.7 0.8 2.5 2.4 4.1 3.5 2.7 2.5 50 6.0 5.6 4.5 4.0 6.0 5.7 7.0 6.9 6.5 6.1 75 10.1 9.6 9.0 8.7 10.3 10.1 10.7 9.9 10.0 9.5
Percentage of the balance sheet totalAnnual result and interest paid 25 4.2 4.0 7.4 7.5 4.8 4.5 3.4 3.1 3.1 2.2
50 9.7 9.3 21.0 22.9 10.6 10.4 7.3 6.6 6.6 5.9 75 20.8 20.7 46.6 50.5 19.3 19.0 13.0 12.1 11.0 10.3
Percentage of liabilities and provisions less cashAnnual result and depreciation 25 8.9 8.8 11.7 14.1 9.4 9.1 7.9 7.9 7.8 6.6
50 20.8 20.5 35.7 37.3 20.7 20.1 17.4 16.3 14.3 14.0 75 44.9 44.5 84.6 87.2 41.3 39.8 32.8 31.9 28.4 28.5
Percentage of fixed assetsLong-term equity and liabilities 25 65.2 66.3 38.2 47.4 59.4 60.0 83.6 77.1 83.2 83.8
50 116.9 119.6 100.7 105.8 107.2 111.3 145.2 144.2 131.3 131.9 75 261.3 273.3 224.6 250.0 260.5 274.7 320.4 304.8 236.3 245.7
Percentage of short-term liabilitiesCash resources and short-term receivables 25 39.5 38.0 36.0 36.1 35.7 34.3 41.8 39.5 48.7 48.7
50 71.6 71.3 78.6 81.0 66.5 63.7 68.1 67.7 75.4 76.6 75 122.9 129.8 160.0 171.1 115.7 124.1 117.4 116.1 114.4 116.8
Percentage of cost of materialsTrade payables 25 4.2 3.7 4.3 3.6 4.5 4.3 3.9 3.2 3.7 3.9
50 8.3 7.7 10.7 9.7 9.7 8.8 6.8 6.6 7.0 6.8 75 14.9 14.1 25.5 23.2 17.3 16.4 11.5 10.8 11.0 10.6
* Agriculture, forestry and fishing, mining and quarrying, manufacturing, electricity, gas and water supply, construction, trade, transportation and storage,accommodation and food service activities, information and communication, business services, personal service activities

Deutsche BundesbankFinancial statement statistics (ratios - provisional data)May 2021242
IV. Enterprises by federal state and economic sector
10. North Rhine-Westphaliab) Manufacturing
All legal formsEnterprises with sales of ... € million
Total Less than 2 2 but less than 10 10 but less than 50 50 and moreCylindered sample 2018/2019
Ratios 2018 2019 2018 2019 2018 2019 2018 2019 2018 2019Income statementIncome Percentage of gross revenueSales 99.5 99.8 98.6 98.4 98.9 98.9 99.0 99.5 99.6 99.9Change in finished goods 0.5 0.2 1.4 1.6 1.1 1.1 1.0 0.5 0.4 0.1Interest and similar income 0.9 1.0 0.2 0.1 0.1 0.1 0.1 0.1 1.0 1.2Other income 6.8 6.8 2.5 2.9 2.1 2.3 2.2 2.3 7.5 7.5
of which: Income from long-term equity investments 1.5 2.4 0.0 0.1 0.1 0.2 0.3 0.4 1.7 2.7Total income 107.7 107.8 102.6 103.0 102.2 102.5 102.4 102.4 108.5 108.7
ExpensesCost of materials 59.9 59.1 36.5 36.6 46.0 45.6 53.1 52.8 61.1 60.2Personnel expenses 18.7 19.2 37.7 37.6 31.4 32.1 26.3 27.1 17.4 17.9Depreciation 3.0 3.2 3.2 3.0 2.7 2.8 2.5 2.7 3.1 3.3
of which: Depreciation of tangible fixed assets 2.5 2.7 3.1 3.0 2.5 2.6 2.4 2.5 2.5 2.7Interest and similar expenses 2.0 1.4 1.0 0.9 0.8 0.8 0.8 0.8 2.2 1.5Operating taxes 0.1 0.1 0.1 0.1 0.1 0.1 0.1 0.1 0.0 0.1Other expenses 19.2 20.4 19.3 19.6 16.7 16.6 15.3 15.4 19.8 21.2Total expenses before taxes on income 102.9 103.4 97.9 97.9 97.6 97.9 98.2 98.9 103.7 104.1Annual result before taxes on income 4.8 4.4 4.8 5.2 4.6 4.5 4.2 3.5 4.9 4.5Taxes on income 0.9 0.9 1.3 1.4 1.3 1.2 1.1 1.0 0.9 0.9Annual result 3.9 3.5 3.5 3.8 3.3 3.3 3.1 2.5 4.0 3.7Profit and loss transfers (parent company) 1.3 2.8 0.0 0.0 0.1 0.0 0.2 0.2 1.5 3.3Profit and loss transfers (subsidiary) 1.7 1.9 0.1 0.0 0.3 0.4 0.7 0.7 1.8 2.1Profit for the year 3.5 4.4 3.4 3.8 3.0 3.0 2.6 2.0 3.6 4.8
Balance sheetAssets Percentage of the balance sheet totalIntangible fixed assets 1.4 1.4 0.5 0.4 0.8 0.8 1.0 1.0 1.5 1.4Tangible fixed assets 12.6 13.0 26.5 25.5 24.9 24.5 20.9 21.2 11.8 12.2
of which: Land and buildings 3.7 3.7 7.1 6.9 10.6 10.0 7.9 7.9 3.3 3.4Inventories 13.5 13.4 24.5 26.8 31.2 32.2 30.5 30.3 12.1 12.0
of which: Finished goods and merchandise 4.2 4.3 9.5 10.5 10.1 10.3 9.1 9.1 3.8 3.9Cash 4.7 5.1 13.6 14.0 12.7 12.5 9.1 9.2 4.3 4.7Receivables 32.3 32.3 29.5 28.0 26.4 26.3 31.0 30.2 32.4 32.5
Short-term 20.6 22.1 29.1 27.4 25.1 25.0 29.2 28.3 20.0 21.7 of which:
Trade receivables 5.8 5.6 15.4 14.3 14.0 13.0 13.7 12.8 5.2 5.0Receivables from affiliated companies 13.0 14.5 7.9 7.0 7.3 8.0 12.4 12.4 13.1 14.8
Long-term 11.7 10.1 0.4 0.6 1.3 1.2 1.8 1.8 12.5 10.8of which: Loans to affiliated companies 11.0 9.5 0.1 0.2 0.8 0.8 1.4 1.4 11.8 10.2
Securities 0.8 0.7 0.6 0.6 0.8 0.6 0.7 0.7 0.8 0.7Other long-term equity investments 34.5 33.9 4.1 3.9 2.8 2.7 6.4 7.1 36.8 36.2
of which: Goodwill 0.3 0.4 1.0 0.9 0.5 0.6 1.0 0.8 0.3 0.4
CapitalEquity 35.9 38.3 27.8 30.2 36.3 36.4 37.2 37.7 35.8 38.3Liabilities 52.7 50.1 64.2 61.8 54.1 54.6 49.2 48.8 52.9 50.2
Short-term 40.0 39.4 42.6 42.4 40.7 40.9 39.4 38.6 40.0 39.4of which:Liabilities to banks 1.8 1.8 9.8 8.8 7.8 8.0 6.0 6.1 1.4 1.4Trade payables 4.8 4.5 9.1 9.3 8.2 7.3 7.5 6.7 4.5 4.3Liabilities to affiliated companies 28.2 27.4 8.0 9.6 10.6 10.7 14.8 14.5 29.3 28.5
Long-term 12.7 10.8 21.6 19.3 13.4 13.7 9.8 10.2 12.9 10.8 of which:
Liabilities to banks 4.1 3.8 11.3 11.9 7.9 7.7 5.3 5.3 3.9 3.6Liabilities to affiliated companies 4.9 3.5 7.3 4.7 3.9 4.3 3.8 4.4 5.0 3.4
Provisions 11.3 11.4 7.8 7.9 9.5 9.0 13.5 13.4 11.1 11.3of which: Provisions for pensions 5.2 5.5 2.4 2.5 3.2 3.1 5.8 6.0 5.2 5.5
Other ratios Percentage of salesAnnual result before taxes on income 4.8 4.4 4.8 5.2 4.6 4.6 4.3 3.5 4.9 4.6Annual result and depreciation 6.9 6.7 6.8 7.0 6.1 6.1 5.7 5.2 7.1 6.9Trade receivables 6.7 6.5 9.4 8.6 8.5 8.2 9.0 8.5 6.4 6.2
Percentage of the balance sheet totalSales 87.1 85.4 164.3 166.8 164.2 158.9 152.7 150.4 81.7 79.9Annual result and interest paid 5.2 4.2 7.5 8.0 6.7 6.5 5.9 5.0 5.1 4.1
Percentage of liabilities and provisions less cashAnnual result and depreciation 10.1 10.2 19.1 20.8 19.5 19.1 16.1 14.8 9.7 9.7
Percentage of fixed assetsLong-term equity and liabilities 88.5 92.6 162.5 169.1 176.6 181.2 174.1 171.8 85.2 89.3
Percentage of short-term liabilitiesCash resources and short-term receivables 63.6 69.6 100.6 98.1 94.1 92.8 98.4 98.2 60.9 67.4Cash resources, short-term receivables and inventories 97.4 103.8 158.1 161.4 170.8 171.7 176.0 176.9 91.2 97.9
Percentage of cost of materialsTrade payables 9.1 8.9 14.9 15.0 10.7 10.0 9.1 8.4 9.0 8.9
Memo item:Balance sheet total in € billion 263.58 267.08 0.27 0.28 2.73 2.85 16.78 17.21 243.79 246.74Sales in € billion 229.67 228.12 0.44 0.47 4.49 4.53 25.62 25.88 199.12 197.24Number of enterprises 3 044 3 044 421 421 852 852 1 011 1 011 760 760

Deutsche BundesbankFinancial statement statistics (ratios - provisional data)
May 2021243
IV. Enterprises by federal state and economic sector
cont'd: 10. North Rhine-Westphaliab) Manufacturing
cont'd: All legal formsEnterprises with sales of ... € million
Total Less than 2 2 but less than 10 10 but less than 50 50 and moreQuartile Cylindered sample 2018/2019value 2018 2019 2018 2019 2018 2019 2018 2019 2018 2019Of the enterprises captured …
Ratios ... % had a ratio of less than …Percentage of gross revenue
Cost of materials 25 38.1 37.3 23.6 22.3 34.1 33.5 41.8 41.6 48.1 48.0 50 49.6 49.5 35.0 33.9 44.7 44.0 52.3 52.3 59.3 59.0 75 62.0 61.3 46.9 46.7 56.2 55.4 62.6 61.8 70.2 69.5
Personnel expenses 25 18.2 18.7 25.5 25.7 23.4 24.2 18.6 19.2 12.8 13.3 50 27.0 28.1 37.4 39.1 31.8 32.4 26.3 27.2 19.4 20.6 75 36.9 38.0 48.3 48.8 40.9 41.4 34.6 35.7 27.1 28.3
Depreciation 25 1.1 1.1 1.0 1.0 1.0 1.0 1.1 1.1 1.3 1.3 50 2.1 2.1 2.0 1.9 1.9 2.0 2.0 2.1 2.3 2.5 75 3.5 3.7 4.0 4.3 3.4 3.6 3.3 3.5 3.4 3.7
Annual result 25 0.6 0.4 0.6 0.4 0.8 0.7 0.6 0.2 0.5 0.1 50 2.8 2.5 3.3 3.0 3.0 2.8 2.6 2.2 2.7 2.4 75 6.0 6.0 8.0 8.2 6.2 6.0 5.4 5.3 5.8 5.9
Percentage of the balance sheet totalTangible fixed assets 25 7.5 7.6 5.4 5.6 6.7 6.3 7.6 7.6 10.0 9.9
50 18.2 18.9 15.9 17.0 17.6 17.9 18.3 19.1 20.7 20.4 75 34.3 35.1 37.1 38.0 36.8 36.6 33.1 33.9 33.4 34.8
Inventories 25 14.1 14.5 5.4 5.4 14.0 14.4 19.7 18.7 13.9 14.0 50 27.5 27.3 18.2 21.5 28.6 29.2 32.3 31.3 25.6 24.3 75 43.6 43.4 38.1 41.8 46.8 47.1 45.3 45.4 37.9 36.0
Equity 25 13.7 14.0 4.0 7.9 12.1 12.4 16.8 17.2 17.2 16.7 50 31.0 32.4 25.7 26.7 30.1 31.5 31.9 33.5 33.1 34.6 75 54.1 55.3 52.8 53.5 56.5 58.5 52.9 53.5 54.7 54.6
Short-term liabilities 25 19.7 18.4 18.3 19.3 17.9 15.5 20.5 19.8 21.2 19.1 50 38.1 37.3 42.7 41.2 39.8 39.2 39.2 38.3 33.6 32.9 75 62.1 60.8 70.1 66.7 64.8 64.0 59.9 60.3 55.8 54.3
Liabilities to banks 25 0.0 0.0 0.0 0.0 0.0 0.0 0.0 0.0 0.0 0.0 50 6.1 5.6 11.5 9.6 9.4 9.9 6.6 6.2 0.6 0.3 75 23.7 24.5 30.9 31.2 29.2 29.9 23.0 24.1 15.4 15.6
Percentage of salesAnnual result before taxes on income 25 0.9 0.6 0.8 0.6 1.1 1.0 0.8 0.4 0.8 0.3
50 3.7 3.3 3.8 3.9 3.9 3.7 3.6 3.1 3.6 3.1 75 7.9 7.9 10.2 10.8 8.4 7.9 7.1 7.0 7.4 7.3
Annual result and depreciation 25 3.0 2.6 3.0 2.9 3.3 3.1 2.9 2.3 2.9 2.4 50 6.2 5.9 7.2 6.9 6.6 6.3 5.7 5.5 6.1 5.9 75 11.0 10.9 13.2 13.9 11.8 11.0 10.0 9.7 10.3 10.5
Trade receivables 25 3.9 3.4 3.3 3.1 4.0 3.4 4.6 4.1 3.5 3.0 50 7.3 6.7 6.9 6.1 7.2 6.5 7.7 7.3 6.9 6.4 75 11.4 10.7 12.7 10.8 11.3 10.6 11.7 11.4 10.8 10.2
Percentage of the balance sheet totalAnnual result and interest paid 25 2.6 2.0 1.7 2.7 3.2 2.7 2.2 1.5 2.5 1.5
50 6.4 6.0 8.3 8.1 6.9 6.8 6.0 5.3 6.1 5.6 75 12.7 12.0 18.0 18.2 14.2 13.0 11.2 10.7 10.6 10.2
Percentage of liabilities and provisions less cashAnnual result and depreciation 25 5.5 4.6 - 0.9 2.6 4.5 4.4 7.0 5.3 6.6 4.8
50 16.9 16.6 16.9 16.6 16.5 17.3 17.4 16.6 16.8 15.3 75 37.9 37.9 51.9 50.0 41.3 40.3 37.5 35.8 33.3 34.9
Percentage of fixed assetsLong-term equity and liabilities 25 103.7 103.5 82.3 89.7 97.8 98.1 111.0 109.3 107.2 106.1
50 172.4 174.3 170.8 184.2 178.3 187.2 185.5 182.0 155.8 156.8 75 365.0 376.6 494.2 498.1 452.8 487.9 362.3 356.9 257.7 265.9
Percentage of short-term liabilitiesCash resources and short-term receivables 25 50.3 49.8 47.1 47.0 44.4 42.1 49.8 50.8 57.6 59.4
50 96.0 97.0 95.9 100.0 89.0 89.9 91.4 92.7 101.7 104.1 75 208.4 212.6 252.7 233.3 230.7 251.4 194.5 192.6 190.3 197.6
Percentage of cost of materialsTrade payables 25 4.6 4.1 4.3 3.5 4.3 3.8 4.9 4.2 4.5 4.3
50 8.1 7.4 9.8 8.8 8.2 7.2 7.8 7.3 7.9 7.3 75 14.0 13.1 22.4 19.4 16.1 15.2 13.0 12.0 12.3 11.6

Deutsche BundesbankFinancial statement statistics (ratios - provisional data)May 2021244
IV. Enterprises by federal state and economic sector
11. Rhineland-Palatinate All economic sectors*
All legal formsEnterprises with sales of ... € million
Total Less than 2 2 but less than 10 10 but less than 50 50 and moreCylindered sample 2018/2019
Ratios 2018 2019 2018 2019 2018 2019 2018 2019 2018 2019Income statementIncome Percentage of gross revenueSales 99.3 99.8 95.6 98.3 99.1 98.1 99.2 99.5 99.3 99.9Change in finished goods 0.7 0.2 4.4 1.7 0.9 1.9 0.8 0.5 0.7 0.1Interest and similar income 0.6 0.7 0.1 0.1 0.1 0.1 0.1 0.2 0.7 0.8Other income 8.2 10.0 3.2 7.0 3.3 3.5 2.0 2.3 9.1 11.2
of which: Income from long-term equity investments 1.8 3.4 0.2 0.3 0.2 0.2 0.3 0.3 2.0 3.9Total income 108.8 110.7 103.3 107.1 103.4 103.6 102.1 102.4 109.8 112.0
ExpensesCost of materials 62.0 60.8 37.2 39.0 50.8 50.3 57.9 57.6 62.9 61.6Personnel expenses 18.4 19.1 29.9 30.7 27.0 27.3 23.0 23.3 17.5 18.2Depreciation 3.0 3.4 7.2 7.1 3.5 3.5 3.1 2.9 3.0 3.4
of which: Depreciation of tangible fixed assets 2.8 3.1 7.2 7.1 3.4 3.4 2.7 2.8 2.8 3.1Interest and similar expenses 2.3 1.7 2.1 2.0 0.8 0.7 0.7 0.7 2.5 1.9Operating taxes 0.1 0.1 0.2 0.2 0.1 0.1 0.1 0.1 0.1 0.1Other expenses 17.9 17.8 22.2 22.4 16.5 16.4 14.0 14.0 18.4 18.3Total expenses before taxes on income 103.7 102.8 98.9 101.4 98.6 98.4 98.8 98.6 104.5 103.4Annual result before taxes on income 5.1 7.9 4.5 5.7 4.8 5.2 3.3 3.9 5.3 8.6Taxes on income 0.6 0.6 1.5 1.7 1.2 1.2 0.9 0.9 0.6 0.5Annual result 4.5 7.4 2.9 4.0 3.6 4.0 2.4 3.0 4.7 8.0Profit and loss transfers (parent company) 5.2 1.2 0.9 0.9 0.0 0.0 0.2 0.3 5.9 1.3Profit and loss transfers (subsidiary) 4.2 2.9 - 0.5 - 0.4 0.0 0.2 0.8 1.0 4.7 3.3Profit for the year 5.5 5.6 4.3 5.3 3.7 3.8 1.9 2.3 6.0 6.1
Balance sheetAssets Percentage of the balance sheet totalIntangible fixed assets 1.0 1.1 0.3 0.4 0.5 0.5 0.8 0.8 1.0 1.1Tangible fixed assets 13.8 14.2 54.6 52.6 32.9 31.1 29.1 29.0 12.5 12.9
of which: Land and buildings 3.7 3.8 14.3 13.7 10.5 9.9 11.9 11.5 3.1 3.2Inventories 8.5 8.6 12.5 13.4 24.5 25.8 25.8 26.3 7.3 7.3
of which: Finished goods and merchandise 2.7 2.7 4.6 4.7 10.6 9.8 9.4 9.7 2.2 2.2Cash 5.9 4.4 9.3 10.8 14.7 15.2 10.7 10.6 5.5 3.9Receivables 40.0 41.4 16.8 16.7 22.8 22.9 25.2 25.1 41.2 42.7
Short-term 38.0 40.1 16.4 16.2 22.2 22.5 24.0 24.0 39.0 41.4 of which:
Trade receivables 5.0 4.7 7.5 6.8 12.4 11.9 13.2 12.5 4.4 4.2Receivables from affiliated companies 31.6 33.9 6.1 6.2 6.0 6.7 7.9 8.6 33.4 35.9
Long-term 2.1 1.3 0.5 0.5 0.6 0.4 1.1 1.1 2.1 1.3of which: Loans to affiliated companies 1.7 0.9 0.4 0.4 0.3 0.2 0.6 0.5 1.8 1.0
Securities 3.0 1.4 0.1 0.1 0.4 0.4 1.7 1.7 3.1 1.4Other long-term equity investments 27.4 28.6 5.0 4.9 3.8 3.7 6.4 6.2 29.0 30.3
of which: Goodwill 1.0 0.8 0.4 0.4 0.3 0.2 0.2 0.3 1.0 0.8
CapitalEquity 32.4 32.8 25.3 27.0 37.8 37.5 34.5 34.1 32.2 32.7Liabilities 55.1 54.8 69.4 67.5 53.8 53.8 54.2 54.7 55.1 54.8
Short-term 41.9 41.1 36.1 38.5 39.4 40.4 41.4 42.3 41.9 41.1of which:Liabilities to banks 2.1 1.9 10.3 10.6 9.0 9.1 6.1 6.3 1.8 1.5Trade payables 3.3 3.1 4.9 5.4 7.8 7.2 9.0 8.0 2.9 2.8Liabilities to affiliated companies 30.9 32.6 10.1 10.5 7.6 7.0 11.2 12.0 32.3 34.2
Long-term 13.2 13.7 33.3 29.0 14.5 13.5 12.8 12.4 13.2 13.7 of which:
Liabilities to banks 2.1 2.9 28.7 25.9 10.8 9.7 7.5 7.5 1.6 2.4Liabilities to affiliated companies 2.1 2.2 3.4 2.1 2.6 2.6 4.3 4.2 2.0 2.1
Provisions 11.8 11.7 4.0 4.2 8.2 8.5 10.7 10.7 12.0 11.8of which: Provisions for pensions 5.6 5.9 0.7 0.8 2.3 2.3 3.5 3.6 5.8 6.1
Other ratios Percentage of salesAnnual result before taxes on income 5.1 8.0 4.7 5.8 4.8 5.3 3.4 3.9 5.3 8.6Annual result and depreciation 7.6 10.8 10.6 11.3 7.2 7.6 5.6 6.0 7.8 11.5Trade receivables 6.9 6.6 9.7 8.5 8.8 8.7 8.7 8.5 6.7 6.3
Percentage of the balance sheet totalSales 71.9 71.5 77.0 80.6 141.0 136.5 150.9 146.6 66.6 66.2Annual result and interest paid 4.9 6.5 4.1 4.9 6.3 6.6 4.7 5.4 4.9 6.6
Percentage of liabilities and provisions less cashAnnual result and depreciation 8.8 12.3 12.5 14.7 21.3 22.0 15.4 15.8 8.3 12.0
Percentage of fixed assetsLong-term equity and liabilities 109.2 113.8 98.1 97.2 143.5 148.2 132.2 131.4 107.9 112.7
Percentage of short-term liabilitiesCash resources and short-term receivables 105.6 109.5 71.3 70.1 94.1 93.8 85.4 83.2 107.0 111.4Cash resources, short-term receivables and inventories 126.0 130.3 106.1 104.8 156.2 157.8 147.7 145.3 124.5 129.2
Percentage of cost of materialsTrade payables 7.3 7.2 16.5 16.7 10.8 10.2 10.3 9.4 6.8 6.8
Memo item:Balance sheet total in € billion 145.82 148.63 0.54 0.55 1.84 1.97 7.47 8.00 135.97 138.11Sales in € billion 104.79 106.32 0.41 0.44 2.59 2.69 11.27 11.72 90.50 91.46Number of enterprises 1 778 1 778 475 475 531 531 485 485 287 287
* Agriculture, forestry and fishing, mining and quarrying, manufacturing, electricity, gas and water supply, construction, trade, transportation and storage,accommodation and food service activities, information and communication, business services, personal service activities

Deutsche BundesbankFinancial statement statistics (ratios - provisional data)
May 2021245
IV. Enterprises by federal state and economic sector
cont'd: 11. Rhineland-Palatinate All economic sectors*
cont'd: All legal formsEnterprises with sales of ... € million
Total Less than 2 2 but less than 10 10 but less than 50 50 and moreQuartile Cylindered sample 2018/2019value 2018 2019 2018 2019 2018 2019 2018 2019 2018 2019Of the enterprises captured …
Ratios ... % had a ratio of less than …Percentage of gross revenue
Cost of materials 25 28.1 27.0 5.0 5.3 30.7 30.2 41.3 38.5 46.8 45.8 50 50.6 50.7 31.4 30.5 51.9 51.7 59.2 58.8 62.8 61.9 75 71.4 70.7 48.6 51.5 71.3 70.7 75.6 75.4 78.5 79.0
Personnel expenses 25 10.9 11.1 11.8 11.4 13.3 12.9 10.8 10.9 8.6 8.8 50 22.3 23.0 29.3 29.0 24.5 24.4 19.9 20.7 16.2 16.4 75 36.2 37.0 43.2 43.2 37.1 37.9 31.9 33.4 26.8 28.9
Depreciation 25 0.8 0.8 1.2 1.1 0.7 0.7 0.7 0.7 0.7 0.7 50 1.9 1.9 2.8 2.8 1.7 1.7 1.6 1.6 1.9 1.9 75 4.4 4.5 7.0 7.3 4.1 3.9 3.5 3.5 4.2 4.4
Annual result 25 0.6 0.7 0.3 1.1 0.7 0.7 0.5 0.6 0.3 0.3 50 2.5 2.7 3.5 4.5 2.4 2.7 2.3 2.3 2.1 2.0 75 6.4 7.0 10.7 10.7 6.2 6.4 4.8 5.3 5.7 5.5
Percentage of the balance sheet totalTangible fixed assets 25 5.4 5.2 6.3 5.4 4.1 4.3 5.4 5.1 7.6 8.0
50 17.6 17.1 18.7 21.3 13.9 14.0 17.9 17.1 18.9 18.8 75 39.9 40.1 52.5 52.9 39.4 37.3 36.6 37.4 35.3 38.2
Inventories 25 1.0 1.1 0.0 0.0 1.5 1.6 3.3 3.1 2.8 2.8 50 17.0 16.9 5.5 5.5 21.5 20.6 24.1 23.7 17.0 16.3 75 41.8 41.8 35.5 31.4 45.8 46.7 45.1 45.6 37.1 35.3
Equity 25 9.1 10.0 3.3 3.9 9.1 9.4 11.4 12.3 16.0 17.5 50 27.5 29.5 19.3 22.1 29.2 30.2 28.9 30.3 34.5 35.0 75 51.9 52.6 51.2 51.7 55.4 56.5 50.8 50.9 51.6 52.4
Short-term liabilities 25 18.1 18.2 14.3 15.2 17.2 17.3 21.2 21.6 17.6 16.4 50 40.5 40.6 41.0 41.0 41.4 42.3 42.7 43.0 35.6 32.5 75 68.7 68.0 75.8 74.1 70.6 69.5 67.3 68.0 58.4 55.0
Liabilities to banks 25 0.0 0.0 0.0 0.0 0.0 0.0 0.0 0.0 0.0 0.0 50 6.8 7.0 14.8 14.9 8.7 7.2 4.7 4.6 0.5 0.1 75 30.0 30.4 44.9 45.5 32.0 30.1 23.6 23.8 17.6 16.6
Percentage of salesAnnual result before taxes on income 25 0.8 0.8 0.5 1.2 0.9 1.0 0.8 0.7 0.4 0.5
50 3.2 3.6 4.6 5.6 3.1 3.6 3.0 2.9 2.9 2.5 75 7.9 8.6 13.7 12.8 8.1 8.3 6.0 6.7 7.2 6.8
Annual result and depreciation 25 2.5 2.6 3.1 3.6 2.6 2.7 2.3 2.4 2.2 1.9 50 6.2 6.3 9.4 10.3 6.0 6.2 5.1 5.1 5.2 5.3 75 12.9 13.4 22.8 21.5 11.9 12.7 9.2 9.8 10.6 10.5
Trade receivables 25 3.6 3.1 2.7 2.1 4.0 3.5 3.9 3.5 3.7 3.7 50 7.3 6.7 7.0 6.1 6.9 6.7 8.0 7.5 7.4 6.8 75 12.0 11.4 12.5 11.8 11.5 11.1 12.2 11.9 12.1 11.6
Percentage of the balance sheet totalAnnual result and interest paid 25 2.2 2.3 2.2 2.8 2.5 2.8 2.2 2.0 1.7 1.5
50 5.8 6.1 6.7 7.9 6.1 6.3 5.6 5.3 5.0 4.7 75 12.1 12.4 16.0 17.5 12.3 12.8 10.3 11.2 9.6 9.5
Percentage of liabilities and provisions less cashAnnual result and depreciation 25 4.2 3.8 2.0 0.5 3.7 4.5 5.0 4.0 5.4 5.2
50 14.4 15.4 12.4 14.3 14.6 16.4 14.6 15.1 15.1 15.0 75 34.7 35.5 38.7 40.4 42.1 42.2 30.6 33.9 29.0 31.0
Percentage of fixed assetsLong-term equity and liabilities 25 92.7 91.2 72.0 77.3 103.0 97.4 95.3 96.6 92.9 92.0
50 157.6 155.2 132.4 137.6 189.5 189.4 162.2 161.5 134.2 136.2 75 372.1 380.0 374.1 371.0 467.6 526.8 374.1 376.1 254.5 257.7
Percentage of short-term liabilitiesCash resources and short-term receivables 25 48.0 46.9 40.3 38.5 48.7 47.0 49.5 47.0 56.4 56.9
50 102.0 103.4 98.6 101.3 107.9 109.2 93.8 92.7 113.1 115.3 75 220.9 223.1 250.8 246.6 242.5 232.1 193.0 189.0 212.3 241.6
Percentage of cost of materialsTrade payables 25 4.1 3.9 3.9 3.6 4.0 3.9 4.3 4.3 4.3 3.8
50 8.4 8.0 10.3 10.3 8.3 8.0 8.2 7.5 7.7 7.3 75 16.8 15.8 27.1 26.6 17.3 15.3 14.7 13.6 12.8 11.8
* Agriculture, forestry and fishing, mining and quarrying, manufacturing, electricity, gas and water supply, construction, trade, transportation and storage,accommodation and food service activities, information and communication, business services, personal service activities
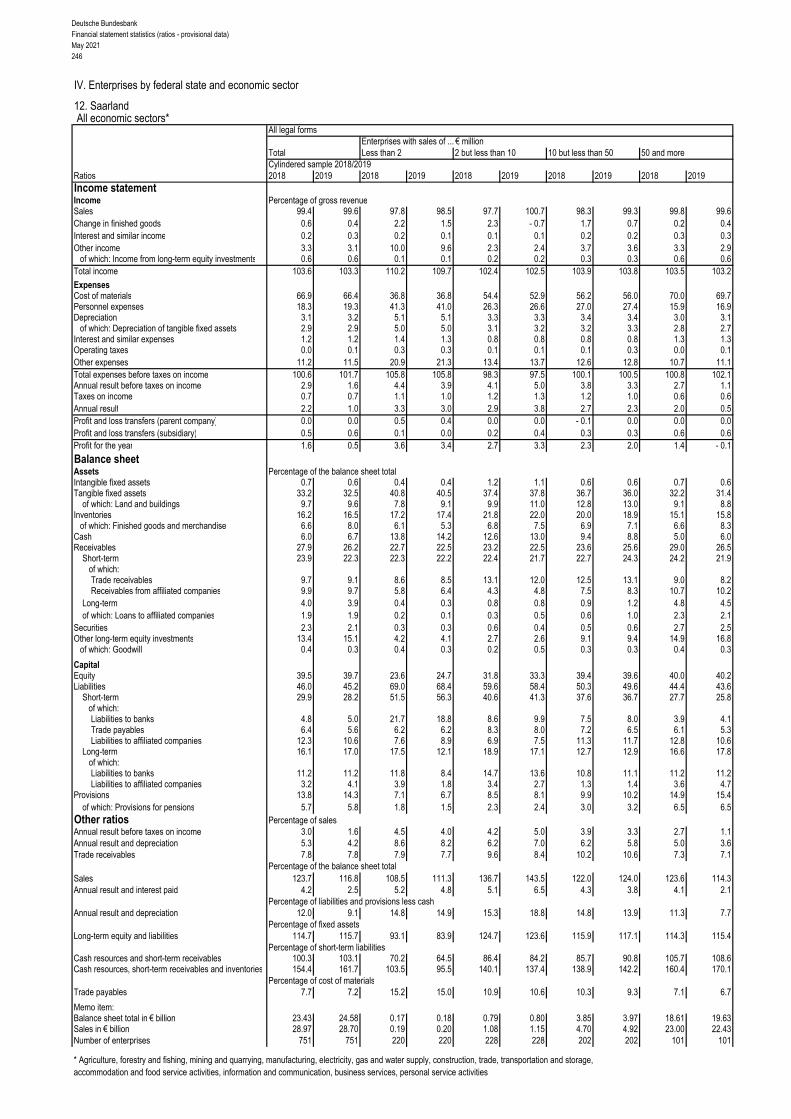
Deutsche BundesbankFinancial statement statistics (ratios - provisional data)May 2021246
IV. Enterprises by federal state and economic sector
12. Saarland All economic sectors*
All legal formsEnterprises with sales of ... € million
Total Less than 2 2 but less than 10 10 but less than 50 50 and moreCylindered sample 2018/2019
Ratios 2018 2019 2018 2019 2018 2019 2018 2019 2018 2019Income statementIncome Percentage of gross revenueSales 99.4 99.6 97.8 98.5 97.7 100.7 98.3 99.3 99.8 99.6Change in finished goods 0.6 0.4 2.2 1.5 2.3 - 0.7 1.7 0.7 0.2 0.4Interest and similar income 0.2 0.3 0.2 0.1 0.1 0.1 0.2 0.2 0.3 0.3Other income 3.3 3.1 10.0 9.6 2.3 2.4 3.7 3.6 3.3 2.9
of which: Income from long-term equity investments 0.6 0.6 0.1 0.1 0.2 0.2 0.3 0.3 0.6 0.6Total income 103.6 103.3 110.2 109.7 102.4 102.5 103.9 103.8 103.5 103.2
ExpensesCost of materials 66.9 66.4 36.8 36.8 54.4 52.9 56.2 56.0 70.0 69.7Personnel expenses 18.3 19.3 41.3 41.0 26.3 26.6 27.0 27.4 15.9 16.9Depreciation 3.1 3.2 5.1 5.1 3.3 3.3 3.4 3.4 3.0 3.1
of which: Depreciation of tangible fixed assets 2.9 2.9 5.0 5.0 3.1 3.2 3.2 3.3 2.8 2.7Interest and similar expenses 1.2 1.2 1.4 1.3 0.8 0.8 0.8 0.8 1.3 1.3Operating taxes 0.0 0.1 0.3 0.3 0.1 0.1 0.1 0.3 0.0 0.1Other expenses 11.2 11.5 20.9 21.3 13.4 13.7 12.6 12.8 10.7 11.1Total expenses before taxes on income 100.6 101.7 105.8 105.8 98.3 97.5 100.1 100.5 100.8 102.1Annual result before taxes on income 2.9 1.6 4.4 3.9 4.1 5.0 3.8 3.3 2.7 1.1Taxes on income 0.7 0.7 1.1 1.0 1.2 1.3 1.2 1.0 0.6 0.6Annual result 2.2 1.0 3.3 3.0 2.9 3.8 2.7 2.3 2.0 0.5Profit and loss transfers (parent company) 0.0 0.0 0.5 0.4 0.0 0.0 - 0.1 0.0 0.0 0.0Profit and loss transfers (subsidiary) 0.5 0.6 0.1 0.0 0.2 0.4 0.3 0.3 0.6 0.6Profit for the year 1.6 0.5 3.6 3.4 2.7 3.3 2.3 2.0 1.4 - 0.1
Balance sheetAssets Percentage of the balance sheet totalIntangible fixed assets 0.7 0.6 0.4 0.4 1.2 1.1 0.6 0.6 0.7 0.6Tangible fixed assets 33.2 32.5 40.8 40.5 37.4 37.8 36.7 36.0 32.2 31.4
of which: Land and buildings 9.7 9.6 7.8 9.1 9.9 11.0 12.8 13.0 9.1 8.8Inventories 16.2 16.5 17.2 17.4 21.8 22.0 20.0 18.9 15.1 15.8
of which: Finished goods and merchandise 6.6 8.0 6.1 5.3 6.8 7.5 6.9 7.1 6.6 8.3Cash 6.0 6.7 13.8 14.2 12.6 13.0 9.4 8.8 5.0 6.0Receivables 27.9 26.2 22.7 22.5 23.2 22.5 23.6 25.6 29.0 26.5
Short-term 23.9 22.3 22.3 22.2 22.4 21.7 22.7 24.3 24.2 21.9 of which:
Trade receivables 9.7 9.1 8.6 8.5 13.1 12.0 12.5 13.1 9.0 8.2Receivables from affiliated companies 9.9 9.7 5.8 6.4 4.3 4.8 7.5 8.3 10.7 10.2
Long-term 4.0 3.9 0.4 0.3 0.8 0.8 0.9 1.2 4.8 4.5of which: Loans to affiliated companies 1.9 1.9 0.2 0.1 0.3 0.5 0.6 1.0 2.3 2.1
Securities 2.3 2.1 0.3 0.3 0.6 0.4 0.5 0.6 2.7 2.5Other long-term equity investments 13.4 15.1 4.2 4.1 2.7 2.6 9.1 9.4 14.9 16.8
of which: Goodwill 0.4 0.3 0.4 0.3 0.2 0.5 0.3 0.3 0.4 0.3
CapitalEquity 39.5 39.7 23.6 24.7 31.8 33.3 39.4 39.6 40.0 40.2Liabilities 46.0 45.2 69.0 68.4 59.6 58.4 50.3 49.6 44.4 43.6
Short-term 29.9 28.2 51.5 56.3 40.6 41.3 37.6 36.7 27.7 25.8of which:Liabilities to banks 4.8 5.0 21.7 18.8 8.6 9.9 7.5 8.0 3.9 4.1Trade payables 6.4 5.6 6.2 6.2 8.3 8.0 7.2 6.5 6.1 5.3Liabilities to affiliated companies 12.3 10.6 7.6 8.9 6.9 7.5 11.3 11.7 12.8 10.6
Long-term 16.1 17.0 17.5 12.1 18.9 17.1 12.7 12.9 16.6 17.8 of which:
Liabilities to banks 11.2 11.2 11.8 8.4 14.7 13.6 10.8 11.1 11.2 11.2Liabilities to affiliated companies 3.2 4.1 3.9 1.8 3.4 2.7 1.3 1.4 3.6 4.7
Provisions 13.8 14.3 7.1 6.7 8.5 8.1 9.9 10.2 14.9 15.4of which: Provisions for pensions 5.7 5.8 1.8 1.5 2.3 2.4 3.0 3.2 6.5 6.5
Other ratios Percentage of salesAnnual result before taxes on income 3.0 1.6 4.5 4.0 4.2 5.0 3.9 3.3 2.7 1.1Annual result and depreciation 5.3 4.2 8.6 8.2 6.2 7.0 6.2 5.8 5.0 3.6Trade receivables 7.8 7.8 7.9 7.7 9.6 8.4 10.2 10.6 7.3 7.1
Percentage of the balance sheet totalSales 123.7 116.8 108.5 111.3 136.7 143.5 122.0 124.0 123.6 114.3Annual result and interest paid 4.2 2.5 5.2 4.8 5.1 6.5 4.3 3.8 4.1 2.1
Percentage of liabilities and provisions less cashAnnual result and depreciation 12.0 9.1 14.8 14.9 15.3 18.8 14.8 13.9 11.3 7.7
Percentage of fixed assetsLong-term equity and liabilities 114.7 115.7 93.1 83.9 124.7 123.6 115.9 117.1 114.3 115.4
Percentage of short-term liabilitiesCash resources and short-term receivables 100.3 103.1 70.2 64.5 86.4 84.2 85.7 90.8 105.7 108.6Cash resources, short-term receivables and inventories 154.4 161.7 103.5 95.5 140.1 137.4 138.9 142.2 160.4 170.1
Percentage of cost of materialsTrade payables 7.7 7.2 15.2 15.0 10.9 10.6 10.3 9.3 7.1 6.7
Memo item:Balance sheet total in € billion 23.43 24.58 0.17 0.18 0.79 0.80 3.85 3.97 18.61 19.63Sales in € billion 28.97 28.70 0.19 0.20 1.08 1.15 4.70 4.92 23.00 22.43Number of enterprises 751 751 220 220 228 228 202 202 101 101
* Agriculture, forestry and fishing, mining and quarrying, manufacturing, electricity, gas and water supply, construction, trade, transportation and storage,accommodation and food service activities, information and communication, business services, personal service activities

Deutsche BundesbankFinancial statement statistics (ratios - provisional data)
May 2021247
IV. Enterprises by federal state and economic sector
cont'd: 12. Saarland All economic sectors*
cont'd: All legal formsEnterprises with sales of ... € million
Total Less than 2 2 but less than 10 10 but less than 50 50 and moreQuartile Cylindered sample 2018/2019value 2018 2019 2018 2019 2018 2019 2018 2019 2018 2019Of the enterprises captured …
Ratios ... % had a ratio of less than …Percentage of gross revenue
Cost of materials 25 28.9 28.9 15.6 13.2 31.7 30.4 37.6 41.1 47.3 47.3 50 50.1 48.9 33.4 34.8 51.7 49.7 58.6 58.1 65.8 67.0 75 70.0 69.9 51.6 51.4 73.8 72.2 72.6 72.9 79.5 77.8
Personnel expenses 25 12.6 12.5 18.5 19.4 12.0 12.3 12.1 12.4 9.1 9.0 50 25.2 25.5 34.4 35.1 25.2 25.5 21.9 21.9 15.0 15.4 75 41.8 40.8 50.2 50.5 40.5 39.5 35.4 36.6 24.2 25.5
Depreciation 25 0.9 0.9 0.9 0.9 0.9 0.8 0.9 0.9 0.9 1.0 50 1.9 2.0 2.5 2.4 1.7 1.9 1.9 1.9 2.0 1.9 75 4.7 4.6 5.8 5.7 3.8 4.2 4.3 4.2 4.2 4.0
Annual result 25 0.2 0.4 - 0.1 0.7 0.4 0.5 0.3 0.2 0.1 - 0.1 50 2.1 2.5 2.4 3.6 2.1 2.4 2.0 1.8 2.1 1.5 75 5.5 5.9 6.9 7.5 5.1 6.0 4.7 4.7 5.3 5.5
Percentage of the balance sheet totalTangible fixed assets 25 5.6 5.4 3.7 3.6 3.9 4.2 7.9 9.0 10.4 9.3
50 18.7 19.3 19.3 18.2 14.4 17.2 21.4 21.4 20.3 22.1 75 43.6 44.6 45.7 48.4 44.2 44.6 44.4 44.0 40.8 41.0
Inventories 25 1.0 1.1 0.0 0.0 1.0 1.6 1.0 1.1 4.0 4.5 50 14.4 13.4 11.9 12.5 13.2 12.8 17.8 15.2 15.7 15.3 75 36.9 36.7 34.1 35.9 37.8 36.8 38.6 39.3 34.9 35.4
Equity 25 9.9 11.1 - 0.3 2.3 11.5 13.0 17.2 19.0 9.9 9.6 50 27.1 28.0 18.2 21.8 25.9 26.8 32.3 34.4 29.7 30.2 75 49.2 51.9 41.5 44.3 47.8 51.5 53.4 57.9 51.7 53.9
Short-term liabilities 25 21.6 19.3 22.7 22.2 21.8 19.5 22.6 18.7 18.9 17.2 50 40.1 40.5 46.3 44.5 42.6 44.3 36.0 30.8 32.1 29.3 75 67.2 65.6 74.6 70.4 67.6 66.7 60.4 58.1 71.6 67.2
Liabilities to banks 25 0.0 0.0 0.0 0.0 0.0 0.0 0.0 0.0 0.0 0.0 50 8.8 9.0 14.8 13.5 8.5 9.9 7.7 6.4 1.6 3.1 75 31.0 31.6 42.2 42.9 29.7 31.5 30.0 28.3 13.5 16.6
Percentage of salesAnnual result before taxes on income 25 0.3 0.6 - 0.1 0.9 0.6 0.8 0.5 0.5 0.2 - 0.1
50 3.0 3.3 3.3 4.6 2.9 3.4 2.9 2.3 2.4 1.9 75 7.4 7.4 8.9 9.0 7.1 8.3 6.1 6.1 6.1 6.8
Annual result and depreciation 25 2.2 2.5 1.4 3.7 2.2 2.5 2.6 2.4 2.3 1.5 50 5.6 6.0 6.4 7.8 5.6 6.2 5.3 4.8 5.1 4.5 75 11.4 11.6 13.8 14.5 10.9 11.2 10.6 9.8 10.0 9.3
Trade receivables 25 3.0 3.0 1.6 1.5 4.0 3.7 3.7 3.5 3.3 3.3 50 6.9 6.6 5.4 5.3 8.1 7.0 7.5 7.9 6.5 6.8 75 12.3 11.7 10.1 9.8 13.6 12.0 13.0 12.6 11.1 11.7
Percentage of the balance sheet totalAnnual result and interest paid 25 1.8 2.3 0.8 2.7 2.2 2.9 1.8 1.4 1.6 0.8
50 5.4 5.7 6.1 7.1 5.7 6.3 4.5 4.3 5.4 4.8 75 11.0 11.7 14.4 16.3 10.6 11.4 8.7 8.4 9.2 8.8
Percentage of liabilities and provisions less cashAnnual result and depreciation 25 4.5 5.4 - 1.0 4.9 5.3 5.7 6.8 6.5 5.0 4.0
50 13.6 16.4 11.1 17.3 13.8 16.6 17.5 16.7 13.7 13.3 75 35.5 39.8 39.1 52.9 37.0 36.1 33.2 30.9 30.3 27.8
Percentage of fixed assetsLong-term equity and liabilities 25 83.7 86.0 69.8 69.6 91.5 94.7 89.5 94.9 80.4 71.4
50 146.2 147.4 140.4 135.8 173.3 171.1 151.3 151.1 119.7 125.0 75 384.9 365.9 441.5 425.0 527.2 596.1 296.2 271.8 218.3 240.0
Percentage of short-term liabilitiesCash resources and short-term receivables 25 47.5 49.6 36.8 39.1 47.6 50.0 57.4 59.7 59.6 52.1
50 100.0 104.1 87.1 96.9 100.0 103.4 102.3 113.3 100.0 99.2 75 205.6 226.6 200.0 212.5 208.8 239.5 197.8 249.6 189.6 210.5
Percentage of cost of materialsTrade payables 25 4.7 3.9 4.6 4.7 4.7 3.9 4.8 3.9 4.6 3.5
50 9.3 8.2 12.3 10.6 9.6 8.5 8.0 7.0 7.9 7.6 75 17.3 16.0 24.5 24.0 18.8 18.0 13.3 13.1 11.8 11.2
* Agriculture, forestry and fishing, mining and quarrying, manufacturing, electricity, gas and water supply, construction, trade, transportation and storage,accommodation and food service activities, information and communication, business services, personal service activities

Deutsche BundesbankFinancial statement statistics (ratios - provisional data)May 2021248
IV. Enterprises by federal state and economic sector
13. Saxony All economic sectors*
All legal formsEnterprises with sales of ... € million
Total Less than 2 2 but less than 10 10 but less than 50 50 and moreCylindered sample 2018/2019
Ratios 2018 2019 2018 2019 2018 2019 2018 2019 2018 2019Income statementIncome Percentage of gross revenueSales 99.3 99.4 98.3 97.8 98.9 97.6 98.6 98.3 99.6 99.9Change in finished goods 0.7 0.6 1.7 2.2 1.1 2.4 1.4 1.7 0.4 0.1Interest and similar income 0.1 0.1 0.2 0.1 0.2 0.1 0.1 0.1 0.1 0.1Other income 2.6 2.7 5.3 4.9 4.5 4.8 2.7 2.8 2.4 2.5
of which: Income from long-term equity investments 0.2 0.2 0.2 0.0 0.1 0.1 0.1 0.1 0.3 0.2Total income 102.8 102.9 105.4 105.1 104.7 104.9 102.8 102.9 102.5 102.7
ExpensesCost of materials 71.4 71.7 38.6 38.2 49.4 49.0 55.0 54.5 78.8 79.5Personnel expenses 15.1 15.5 34.2 34.2 29.2 29.5 25.8 26.5 10.3 10.6Depreciation 3.5 3.5 5.8 5.7 4.6 4.8 4.3 4.3 3.2 3.1
of which: Depreciation of tangible fixed assets 3.4 3.3 5.8 5.6 4.5 4.7 4.1 4.1 3.0 2.9Interest and similar expenses 0.7 0.6 1.2 1.0 0.8 0.7 0.6 0.6 0.7 0.6Operating taxes 0.1 0.1 0.2 0.2 0.1 0.1 0.1 0.1 0.0 0.0Other expenses 8.9 9.0 20.2 20.4 15.9 16.2 12.5 12.6 7.1 7.0Total expenses before taxes on income 99.7 100.3 100.2 99.8 100.1 100.4 98.3 98.6 100.1 100.9Annual result before taxes on income 3.1 2.5 5.2 5.2 4.7 4.5 4.5 4.3 2.5 1.8Taxes on income 0.7 0.7 0.9 1.3 1.2 1.2 1.1 1.1 0.6 0.6Annual result 2.4 1.8 4.3 3.9 3.5 3.2 3.4 3.2 1.9 1.2Profit and loss transfers (parent company) 0.2 0.3 0.0 0.0 0.1 0.1 0.1 0.1 0.2 0.3Profit and loss transfers (subsidiary) 0.8 0.5 0.0 0.0 0.2 0.2 0.9 0.6 0.8 0.5Profit for the year 1.8 1.6 4.2 4.0 3.3 3.2 2.6 2.7 1.4 1.1
Balance sheetAssets Percentage of the balance sheet totalIntangible fixed assets 0.9 0.8 0.9 0.9 0.5 0.5 0.9 0.9 0.9 0.9Tangible fixed assets 44.4 44.3 50.2 48.2 43.8 42.8 43.5 42.3 44.7 45.2
of which: Land and buildings 15.3 15.0 14.5 14.6 21.1 20.4 17.3 16.7 13.7 13.4Inventories 16.8 17.3 13.7 15.3 21.5 22.6 22.2 23.3 13.9 13.9
of which: Finished goods and merchandise 4.9 5.1 3.6 3.7 5.3 5.3 5.6 5.8 4.5 4.7Cash 6.9 6.8 14.2 14.6 12.2 12.5 9.9 10.0 4.7 4.4Receivables 23.2 23.3 17.4 17.6 18.4 18.0 19.4 19.3 25.7 26.0
Short-term 20.9 20.3 16.6 16.7 16.8 16.4 18.1 18.0 22.8 22.0 of which:
Trade receivables 11.6 10.6 9.1 8.6 8.8 8.2 9.6 9.2 12.9 11.5Receivables from affiliated companies 7.1 7.4 3.3 4.0 5.3 5.3 6.2 6.4 7.9 8.3
Long-term 2.3 3.0 0.8 0.9 1.6 1.7 1.2 1.3 2.9 4.0of which: Loans to affiliated companies 1.2 1.8 0.4 0.5 1.4 1.3 0.7 0.7 1.4 2.5
Securities 3.0 2.8 0.7 0.7 1.1 1.0 1.1 1.2 4.1 3.8Other long-term equity investments 4.5 4.3 2.0 1.9 2.2 2.2 2.6 2.6 5.8 5.5
of which: Goodwill 0.3 0.3 0.4 0.4 0.2 0.2 0.1 0.1 0.4 0.4
CapitalEquity 45.1 45.1 32.5 32.3 44.4 43.9 47.0 47.0 44.6 44.6Liabilities 45.0 45.0 61.2 61.4 49.3 50.1 45.7 45.9 43.7 43.5
Short-term 34.3 34.3 33.3 35.7 32.8 34.1 32.4 32.8 35.4 34.9of which:Liabilities to banks 3.7 4.9 7.4 7.5 6.8 6.8 5.5 5.5 2.5 4.3Trade payables 10.1 9.1 5.8 5.6 6.0 5.9 6.6 6.0 12.3 11.0Liabilities to affiliated companies 10.9 10.6 6.6 7.2 4.6 4.8 6.7 6.6 13.8 13.3
Long-term 10.7 10.7 27.8 25.7 16.4 16.0 13.3 13.0 8.4 8.6 of which:
Liabilities to banks 6.6 6.5 21.9 20.2 12.5 12.2 9.7 9.9 4.1 3.9Liabilities to affiliated companies 3.5 3.5 4.6 4.0 3.3 3.1 2.8 2.3 3.8 4.1
Provisions 8.9 9.0 5.2 5.2 5.6 5.4 6.7 6.5 10.4 10.7of which: Provisions for pensions 1.9 2.1 1.0 0.8 0.8 0.8 0.7 0.7 2.7 2.9
Other ratios Percentage of salesAnnual result before taxes on income 3.1 2.5 5.3 5.3 4.7 4.6 4.6 4.4 2.5 1.8Annual result and depreciation 5.9 5.3 10.2 9.8 8.2 8.2 7.8 7.7 5.1 4.3Trade receivables 7.7 7.1 9.1 8.5 7.9 7.5 8.2 8.0 7.5 6.7
Percentage of the balance sheet totalSales 150.0 149.2 100.8 100.9 110.6 108.4 116.8 115.1 171.3 171.5Annual result and interest paid 4.6 3.6 5.6 5.1 4.8 4.4 4.8 4.5 4.5 3.1
Percentage of liabilities and provisions less cashAnnual result and depreciation 18.5 16.5 19.3 18.6 20.8 20.4 21.2 20.6 17.2 14.5
Percentage of fixed assetsLong-term equity and liabilities 105.3 105.0 113.3 112.9 126.9 127.5 124.1 126.1 95.5 94.5
Percentage of short-term liabilitiesCash resources and short-term receivables 81.7 79.7 93.9 89.3 90.0 86.3 87.1 85.8 78.1 76.0Cash resources, short-term receivables and inventories 130.8 130.3 135.2 132.3 155.4 152.7 155.6 156.7 117.3 115.8
Percentage of cost of materialsTrade payables 9.4 8.4 14.6 14.3 10.8 10.8 10.1 9.3 9.1 8.1
Memo item:Balance sheet total in € billion 53.10 55.06 0.68 0.73 4.46 4.73 14.88 15.56 33.07 34.04Sales in € billion 79.63 82.14 0.69 0.74 4.93 5.12 17.38 17.90 56.63 58.38Number of enterprises 2 702 2 702 735 735 983 983 743 743 241 241
* Agriculture, forestry and fishing, mining and quarrying, manufacturing, electricity, gas and water supply, construction, trade, transportation and storage,accommodation and food service activities, information and communication, business services, personal service activities

Deutsche BundesbankFinancial statement statistics (ratios - provisional data)
May 2021249
IV. Enterprises by federal state and economic sector
cont'd: 13. Saxony All economic sectors*
cont'd: All legal formsEnterprises with sales of ... € million
Total Less than 2 2 but less than 10 10 but less than 50 50 and moreQuartile Cylindered sample 2018/2019value 2018 2019 2018 2019 2018 2019 2018 2019 2018 2019Of the enterprises captured …
Ratios ... % had a ratio of less than …Percentage of gross revenue
Cost of materials 25 29.4 28.7 15.9 14.6 30.7 29.9 39.7 38.6 50.1 49.1 50 48.7 48.3 34.7 33.3 48.7 48.7 55.6 54.3 68.2 67.2 75 66.8 66.6 52.3 51.6 65.0 65.9 71.9 71.9 79.9 79.6
Personnel expenses 25 14.7 14.9 20.3 20.2 17.1 17.6 12.9 13.1 8.2 8.8 50 27.2 27.4 33.8 33.8 29.1 28.9 23.3 23.5 14.3 15.5 75 40.0 40.7 47.8 47.9 40.1 40.5 34.1 34.9 24.8 25.3
Depreciation 25 1.2 1.2 1.1 1.1 1.2 1.1 1.3 1.2 1.1 1.2 50 2.5 2.6 2.7 2.7 2.4 2.4 2.8 2.9 2.3 2.7 75 5.6 5.7 5.8 5.9 5.8 5.8 5.7 5.7 5.0 5.1
Annual result 25 0.5 0.6 0.3 0.6 0.6 0.6 0.8 0.7 0.2 0.0 50 2.5 2.6 2.9 3.2 2.3 2.5 2.6 2.7 2.3 1.7 75 6.1 6.1 9.1 8.6 5.2 6.0 5.9 5.5 5.5 4.9
Percentage of the balance sheet totalTangible fixed assets 25 9.0 8.9 5.4 4.8 9.4 8.7 12.2 12.1 14.3 14.9
50 25.5 25.7 18.4 18.8 25.7 26.2 28.7 28.7 30.2 32.2 75 51.0 50.7 50.5 50.3 54.5 52.6 49.4 49.5 47.7 49.4
Inventories 25 2.0 2.2 0.0 0.2 3.5 3.3 3.9 3.4 5.6 5.8 50 16.4 16.4 7.2 8.4 17.0 17.2 24.2 23.2 19.9 19.2 75 38.7 39.2 27.3 29.0 42.6 42.2 41.8 41.7 37.9 39.0
Equity 25 14.9 15.5 8.9 10.7 15.7 16.9 19.3 18.6 16.0 15.5 50 34.7 36.4 30.4 32.0 34.0 36.4 39.1 39.8 35.4 35.9 75 58.5 59.4 55.9 58.4 56.8 56.9 61.9 63.7 59.5 60.3
Short-term liabilities 25 17.7 16.6 17.4 16.4 18.5 16.6 16.7 16.3 18.5 18.7 50 35.3 34.1 35.1 33.4 36.0 35.5 34.0 32.4 37.2 37.2 75 61.2 60.0 62.6 60.9 61.3 60.3 59.5 57.9 62.1 63.6
Liabilities to banks 25 0.0 0.0 0.0 0.0 0.0 0.0 0.0 0.0 0.0 0.0 50 7.7 7.3 5.8 5.7 9.7 9.5 8.6 8.0 1.4 1.5 75 27.5 27.5 27.6 27.9 32.2 31.4 25.9 25.1 15.0 16.9
Percentage of salesAnnual result before taxes on income 25 0.8 0.8 0.3 0.7 0.8 0.8 1.1 1.1 0.3 0.1
50 3.4 3.5 3.8 4.2 3.1 3.4 3.5 3.6 2.8 2.2 75 7.9 8.3 11.3 11.1 7.0 8.1 7.4 6.9 7.0 6.3
Annual result and depreciation 25 3.2 3.5 3.0 3.7 3.4 3.6 3.5 3.7 2.3 2.1 50 7.1 7.3 7.8 8.3 6.8 7.4 7.1 7.1 5.6 5.1 75 13.5 13.4 17.7 17.7 12.4 13.2 13.0 12.2 11.7 10.6
Trade receivables 25 3.1 2.9 2.6 2.8 3.4 3.2 3.4 3.0 2.1 1.9 50 6.7 6.2 7.1 6.4 6.8 6.2 6.6 6.4 5.6 5.1 75 11.1 10.6 12.9 11.6 10.6 10.3 10.8 10.8 10.8 10.1
Percentage of the balance sheet totalAnnual result and interest paid 25 2.0 2.1 1.4 2.0 2.1 2.4 2.1 2.1 1.2 0.9
50 5.4 5.4 6.4 6.4 5.2 5.4 5.3 4.9 4.4 3.8 75 11.5 11.6 15.0 15.9 10.4 10.5 10.1 10.6 9.0 8.2
Percentage of liabilities and provisions less cashAnnual result and depreciation 25 5.5 6.0 - 2.4 0.3 5.8 6.5 8.7 7.9 6.7 6.3
50 18.3 18.8 17.0 16.6 17.2 18.0 21.7 22.0 15.9 17.3 75 45.8 44.4 50.0 47.1 42.7 42.7 49.0 47.6 37.0 37.7
Percentage of fixed assetsLong-term equity and liabilities 25 96.9 97.0 87.0 95.4 100.6 98.2 98.5 100.1 86.3 81.9
50 143.7 146.2 166.0 166.5 147.3 154.1 139.0 140.5 119.9 115.2 75 298.6 304.9 482.1 505.6 310.1 321.4 240.5 244.5 196.4 186.6
Percentage of short-term liabilitiesCash resources and short-term receivables 25 48.7 47.9 52.4 51.1 47.5 45.0 49.0 48.6 43.9 46.1
50 101.7 106.2 119.5 122.2 97.3 101.2 97.9 103.4 91.0 89.5 75 217.9 227.7 272.0 287.0 211.6 221.5 196.5 203.2 169.2 160.8
Percentage of cost of materialsTrade payables 25 5.0 4.5 5.0 4.3 4.9 4.4 5.0 4.8 5.0 4.6
50 9.3 8.9 10.5 10.3 9.3 9.0 8.7 8.2 8.2 8.6 75 16.5 15.9 25.6 23.8 16.5 16.0 14.2 13.5 12.9 13.3
* Agriculture, forestry and fishing, mining and quarrying, manufacturing, electricity, gas and water supply, construction, trade, transportation and storage,accommodation and food service activities, information and communication, business services, personal service activities

Deutsche BundesbankFinancial statement statistics (ratios - provisional data)May 2021250
IV. Enterprises by federal state and economic sector
14. Saxony-Anhalt All economic sectors*
All legal formsEnterprises with sales of ... € million
Total Less than 2 2 but less than 10 10 but less than 50 50 and moreCylindered sample 2018/2019
Ratios 2018 2019 2018 2019 2018 2019 2018 2019 2018 2019Income statementIncome Percentage of gross revenueSales 99.2 99.6 98.5 99.8 97.9 98.6 98.9 99.9 99.4 99.6Change in finished goods 0.8 0.4 1.5 0.2 2.1 1.4 1.1 0.1 0.6 0.4Interest and similar income 0.1 0.1 0.1 0.1 0.2 0.2 0.1 0.1 0.1 0.1Other income 2.5 2.7 8.9 11.8 4.4 4.5 2.7 2.8 2.2 2.5
of which: Income from long-term equity investments 0.2 0.1 0.6 0.7 0.2 0.2 0.2 0.1 0.2 0.1Total income 102.6 102.9 109.1 112.0 104.6 104.8 102.9 102.9 102.4 102.6
ExpensesCost of materials 71.3 70.3 40.0 39.4 49.1 49.2 55.1 54.7 77.5 76.7Personnel expenses 13.3 13.8 32.3 32.7 27.3 27.7 23.8 24.1 9.2 9.7Depreciation 3.7 3.7 7.0 6.9 5.5 5.4 4.9 4.9 3.3 3.2
of which: Depreciation of tangible fixed assets 3.6 3.6 6.9 6.8 5.5 5.3 4.8 4.8 3.1 3.1Interest and similar expenses 0.7 0.7 1.6 1.5 1.2 1.1 0.9 0.8 0.6 0.6Operating taxes 0.1 0.2 0.3 0.3 0.2 0.2 0.1 0.1 0.1 0.2Other expenses 9.2 9.8 22.3 24.9 16.2 16.0 13.9 13.8 7.3 8.0Total expenses before taxes on income 98.3 98.5 103.6 105.7 99.5 99.5 98.8 98.5 98.0 98.3Annual result before taxes on income 4.3 4.4 5.4 6.3 5.1 5.3 4.1 4.4 4.3 4.3Taxes on income 0.6 0.8 1.3 1.5 1.2 1.2 0.9 1.1 0.5 0.7Annual result 3.7 3.6 4.2 4.8 3.8 4.1 3.2 3.3 3.8 3.6Profit and loss transfers (parent company) 0.2 0.2 0.1 0.2 0.0 0.0 0.0 0.0 0.2 0.3Profit and loss transfers (subsidiary) 2.0 1.7 0.3 0.1 0.5 0.4 0.7 0.6 2.5 2.1Profit for the year 1.9 2.1 4.0 4.8 3.3 3.6 2.5 2.7 1.5 1.8
Balance sheetAssets Percentage of the balance sheet totalIntangible fixed assets 0.7 0.6 0.2 0.3 0.4 0.4 0.7 0.7 0.7 0.7Tangible fixed assets 43.6 43.4 58.0 56.2 47.3 46.3 48.7 48.0 41.0 41.0
of which: Land and buildings 13.9 13.8 29.4 26.8 19.2 18.7 16.2 15.8 12.1 12.2Inventories 13.3 13.5 10.0 10.4 17.1 17.8 17.3 17.4 11.4 11.6
of which: Finished goods and merchandise 5.1 5.3 2.7 3.0 4.7 4.6 5.9 6.3 5.0 5.0Cash 5.7 5.8 9.9 10.1 9.5 10.0 8.4 8.6 4.1 4.1Receivables 29.5 28.6 14.9 15.9 19.0 18.5 22.2 22.7 33.8 32.4
Short-term 28.3 26.6 14.5 15.2 17.4 17.1 21.1 21.3 32.6 30.0 of which:
Trade receivables 8.2 7.7 5.4 5.9 7.3 6.9 8.3 8.6 8.3 7.6Receivables from affiliated companies 17.0 15.4 5.7 5.7 6.0 5.9 10.1 9.8 21.1 18.8
Long-term 1.2 2.0 0.4 0.7 1.6 1.5 1.2 1.4 1.2 2.4of which: Loans to affiliated companies 0.6 1.7 0.1 0.4 0.7 0.6 0.3 0.8 0.7 2.2
Securities 0.4 0.4 0.1 0.2 0.5 0.5 0.7 0.9 0.2 0.3Other long-term equity investments 6.4 7.3 6.3 6.4 5.6 5.9 1.6 1.4 8.3 9.7
of which: Goodwill 0.1 0.1 0.1 0.2 0.2 0.2 0.1 0.1 0.1 0.0
CapitalEquity 46.4 46.3 41.3 40.5 37.5 37.8 41.1 42.0 49.5 49.1Liabilities 44.5 44.1 53.8 54.2 55.2 54.9 50.5 49.7 40.7 40.4
Short-term 27.9 27.9 30.9 30.1 31.4 33.4 30.8 29.6 26.4 26.5of which:Liabilities to banks 4.4 4.1 10.5 10.1 6.5 6.9 5.3 5.0 3.6 3.3Trade payables 7.1 6.4 4.7 4.9 5.2 4.8 6.1 5.8 7.7 6.8Liabilities to affiliated companies 10.2 11.2 6.3 6.1 7.9 8.4 8.0 8.2 11.4 12.7
Long-term 16.5 16.2 22.8 24.2 23.8 21.5 19.7 20.1 14.3 13.8 of which:
Liabilities to banks 9.7 9.2 19.6 20.3 19.0 17.2 11.9 12.3 7.5 6.8Liabilities to affiliated companies 5.5 5.7 2.2 2.4 4.1 3.6 5.5 5.5 5.8 6.1
Provisions 7.9 8.4 4.3 4.4 6.7 6.8 7.3 7.3 8.4 9.1of which: Provisions for pensions 1.0 1.2 0.4 0.3 0.5 0.5 0.8 0.8 1.2 1.5
Other ratios Percentage of salesAnnual result before taxes on income 4.4 4.4 5.5 6.3 5.2 5.3 4.2 4.4 4.4 4.3Annual result and depreciation 7.5 7.3 11.4 11.7 9.6 9.6 8.2 8.2 7.1 6.8Trade receivables 6.1 5.9 7.5 7.5 8.0 7.5 7.7 7.9 5.5 5.2
Percentage of the balance sheet totalSales 133.6 131.6 72.3 78.2 91.1 92.6 106.6 109.7 150.1 145.7Annual result and interest paid 5.9 5.6 4.3 5.0 4.7 4.8 4.4 4.5 6.7 6.2
Percentage of liabilities and provisions less cashAnnual result and depreciation 20.9 20.0 16.9 18.4 16.5 17.0 17.3 18.2 23.1 21.2
Percentage of fixed assetsLong-term equity and liabilities 122.4 118.6 99.5 102.1 112.2 110.1 116.9 120.4 126.4 119.4
Percentage of short-term liabilitiesCash resources and short-term receivables 121.9 116.2 79.2 84.3 86.7 82.0 96.2 101.4 139.2 128.4Cash resources, short-term receivables and inventories 169.4 164.5 111.7 118.9 141.4 135.3 152.6 160.1 182.3 172.0
Percentage of cost of materialsTrade payables 7.4 6.9 16.1 16.0 11.4 10.5 10.3 9.6 6.6 6.1
Memo item:Balance sheet total in € billion 31.84 32.43 0.43 0.43 2.62 2.71 7.72 7.88 21.05 21.41Sales in € billion 42.54 42.68 0.31 0.34 2.39 2.51 8.24 8.64 31.60 31.19Number of enterprises 1 338 1 338 345 345 490 490 355 355 148 148
* Agriculture, forestry and fishing, mining and quarrying, manufacturing, electricity, gas and water supply, construction, trade, transportation and storage,accommodation and food service activities, information and communication, business services, personal service activities

Deutsche BundesbankFinancial statement statistics (ratios - provisional data)
May 2021251
IV. Enterprises by federal state and economic sector
cont'd: 14. Saxony-Anhalt All economic sectors*
cont'd: All legal formsEnterprises with sales of ... € million
Total Less than 2 2 but less than 10 10 but less than 50 50 and moreQuartile Cylindered sample 2018/2019value 2018 2019 2018 2019 2018 2019 2018 2019 2018 2019Of the enterprises captured …
Ratios ... % had a ratio of less than …Percentage of gross revenue
Cost of materials 25 28.9 28.0 9.8 14.6 30.2 30.4 35.9 35.5 56.0 55.8 50 50.8 50.4 36.1 34.2 48.2 48.2 56.8 56.5 71.7 69.9 75 69.1 68.8 54.6 54.3 64.1 65.5 73.4 72.9 81.5 81.1
Personnel expenses 25 11.7 12.2 15.2 17.6 15.4 14.9 11.4 11.7 5.2 5.8 50 24.1 24.7 29.7 30.8 26.5 27.2 20.5 21.4 10.4 11.2 75 37.5 37.6 45.4 45.8 37.7 37.9 34.1 34.0 18.2 19.3
Depreciation 25 1.2 1.2 1.1 1.2 1.2 1.2 1.3 1.2 1.2 1.2 50 2.9 2.9 3.2 3.3 2.6 2.5 3.0 3.0 2.8 3.0 75 6.7 6.9 8.2 8.6 6.1 5.9 6.8 6.7 5.8 6.3
Annual result 25 0.4 0.5 0.2 0.7 0.4 0.5 0.4 0.4 0.3 0.4 50 2.7 2.8 3.6 4.0 2.5 2.7 2.3 2.2 2.1 2.0 75 6.9 6.8 11.5 11.0 6.7 6.4 5.0 5.2 5.9 5.4
Percentage of the balance sheet totalTangible fixed assets 25 12.2 12.5 10.3 10.4 11.5 10.9 13.1 13.8 18.9 20.6
50 32.3 32.4 36.4 31.6 26.9 29.5 35.7 33.2 35.7 35.9 75 59.7 59.3 64.7 66.8 56.8 55.0 58.0 58.2 57.7 58.3
Inventories 25 0.7 0.9 0.0 0.0 1.6 1.6 0.9 0.9 2.9 2.4 50 9.9 10.3 4.5 4.7 13.1 13.3 14.6 14.7 14.2 14.2 75 32.1 33.9 19.4 20.4 39.2 40.2 35.2 35.0 30.3 32.3
Equity 25 13.7 14.8 7.4 11.8 14.3 14.8 13.9 15.6 23.3 23.0 50 33.1 34.0 33.8 33.0 30.5 32.1 34.0 34.8 40.0 39.6 75 56.8 56.8 57.9 59.8 55.6 54.9 55.6 55.3 56.3 57.9
Short-term liabilities 25 16.6 16.6 13.8 13.4 17.6 18.0 17.4 17.5 17.8 16.9 50 33.8 34.2 31.7 31.6 36.1 36.3 35.8 34.4 32.0 31.2 75 59.9 59.9 60.0 59.8 61.4 61.1 59.9 61.8 54.1 55.4
Liabilities to banks 25 0.0 0.0 0.0 0.0 0.8 0.4 0.0 0.0 0.0 0.0 50 10.1 9.6 11.6 13.1 14.3 13.2 8.2 6.6 3.4 3.1 75 32.0 32.4 40.3 40.1 35.1 35.0 27.5 26.2 18.9 19.5
Percentage of salesAnnual result before taxes on income 25 0.6 0.7 0.4 1.0 0.7 0.8 0.6 0.5 0.5 0.6
50 3.5 3.6 4.7 5.2 3.6 3.6 3.3 2.9 2.5 2.4 75 8.9 8.7 14.0 13.0 9.1 8.6 6.5 6.6 7.2 6.9
Annual result and depreciation 25 3.1 3.1 3.3 4.5 3.3 3.0 3.0 2.8 2.7 2.3 50 7.6 7.7 8.9 9.8 7.8 7.3 6.6 6.8 6.8 6.8 75 15.0 14.9 20.5 20.5 14.2 13.6 13.4 12.4 13.0 11.7
Trade receivables 25 2.7 2.6 1.7 1.7 3.4 3.0 3.3 3.1 2.0 1.9 50 6.6 6.1 6.0 5.7 6.7 5.9 6.9 6.5 7.0 6.5 75 10.8 10.9 10.3 11.2 10.7 10.2 11.5 11.2 12.3 11.0
Percentage of the balance sheet totalAnnual result and interest paid 25 1.7 1.8 1.3 2.2 1.9 2.0 1.7 1.6 1.6 1.5
50 5.2 5.2 6.6 7.3 5.1 5.3 4.8 4.4 5.2 4.4 75 10.8 11.4 15.6 19.0 10.0 10.4 9.5 8.6 10.3 9.0
Percentage of liabilities and provisions less cashAnnual result and depreciation 25 4.9 4.7 - 2.4 - 1.6 5.0 5.0 6.3 6.6 9.9 8.8
50 17.0 16.4 14.2 15.5 16.2 16.0 18.3 16.7 20.6 16.7 75 37.2 39.6 49.0 46.8 35.0 39.1 34.2 34.7 40.9 38.2
Percentage of fixed assetsLong-term equity and liabilities 25 88.5 87.5 67.6 76.9 96.4 95.5 88.1 89.2 95.0 95.0
50 126.9 129.2 116.0 116.1 139.3 141.2 123.1 121.7 124.9 116.7 75 241.3 239.5 263.6 270.2 276.6 288.5 205.8 214.9 185.8 168.9
Percentage of short-term liabilitiesCash resources and short-term receivables 25 45.3 45.9 39.5 39.3 43.6 40.9 49.1 52.9 61.1 57.6
50 100.4 99.1 108.6 102.7 97.7 99.0 95.6 96.7 100.9 102.3 75 210.0 212.1 289.4 276.2 187.4 188.0 199.4 200.7 176.6 185.1
Percentage of cost of materialsTrade payables 25 4.6 4.5 4.0 3.5 4.6 4.6 5.2 5.4 4.3 3.9
50 9.4 8.9 10.7 10.6 9.3 8.5 9.1 8.8 8.2 7.6 75 18.5 16.7 29.6 24.2 18.1 17.0 15.5 15.0 12.8 12.5
* Agriculture, forestry and fishing, mining and quarrying, manufacturing, electricity, gas and water supply, construction, trade, transportation and storage,accommodation and food service activities, information and communication, business services, personal service activities

Deutsche BundesbankFinancial statement statistics (ratios - provisional data)May 2021252
IV. Enterprises by federal state and economic sector
15. Schleswig-Holstein All economic sectors*
All legal formsEnterprises with sales of ... € million
Total Less than 2 2 but less than 10 10 but less than 50 50 and moreCylindered sample 2018/2019
Ratios 2018 2019 2018 2019 2018 2019 2018 2019 2018 2019Income statementIncome Percentage of gross revenueSales 99.5 99.7 98.4 98.6 98.6 98.9 99.1 99.4 99.6 99.8Change in finished goods 0.5 0.3 1.6 1.4 1.4 1.1 0.9 0.6 0.4 0.2Interest and similar income 0.2 0.2 0.3 0.3 0.1 0.1 0.2 0.2 0.2 0.2Other income 2.5 2.5 4.0 4.2 2.4 2.8 2.5 2.4 2.5 2.5
of which: Income from long-term equity investments 0.4 0.4 0.3 0.4 0.2 0.2 0.4 0.4 0.4 0.4Total income 102.6 102.7 104.2 104.5 102.5 102.9 102.7 102.6 102.6 102.7
ExpensesCost of materials 71.4 71.3 36.9 36.1 50.1 49.6 57.6 57.5 74.8 74.8Personnel expenses 13.6 13.9 30.5 31.0 26.3 26.3 22.5 22.5 11.5 11.8Depreciation 2.4 2.3 6.2 6.5 3.6 3.5 3.3 3.1 2.2 2.1
of which: Depreciation of tangible fixed assets 2.1 2.1 6.2 6.2 3.5 3.5 3.1 3.0 1.9 1.9Interest and similar expenses 0.7 0.6 1.4 1.3 0.8 0.8 1.2 1.1 0.6 0.5Operating taxes 0.1 0.1 0.2 0.2 0.1 0.1 0.1 0.1 0.0 0.0Other expenses 11.2 11.0 20.6 20.3 16.2 16.2 13.4 13.5 10.5 10.3Total expenses before taxes on income 99.4 99.1 95.8 95.3 97.1 96.5 98.2 97.9 99.7 99.5Annual result before taxes on income 3.3 3.6 8.4 9.2 5.5 6.5 4.6 4.7 2.9 3.2Taxes on income 0.7 0.7 1.4 1.6 1.1 1.2 1.1 1.1 0.6 0.6Annual result 2.6 2.9 6.9 7.6 4.4 5.2 3.4 3.6 2.3 2.6Profit and loss transfers (parent company) 0.2 0.3 0.1 0.2 0.0 0.0 0.2 0.2 0.3 0.3Profit and loss transfers (subsidiary) 0.7 1.1 0.1 0.1 0.2 0.2 0.6 0.6 0.8 1.2Profit for the year 2.1 2.1 7.0 7.7 4.2 5.0 3.0 3.2 1.8 1.7
Balance sheetAssets Percentage of the balance sheet totalIntangible fixed assets 0.9 0.9 0.6 0.6 0.4 0.4 1.0 0.9 0.9 0.9Tangible fixed assets 31.2 31.9 52.6 51.1 39.6 37.7 35.3 35.1 29.4 30.4
of which: Land and buildings 10.4 11.2 18.6 18.0 13.6 13.0 15.4 14.9 8.9 10.0Inventories 18.2 18.5 10.8 12.1 24.5 24.8 21.6 22.1 17.1 17.3
of which: Finished goods and merchandise 10.3 10.3 4.2 4.1 10.0 10.4 10.8 10.7 10.3 10.3Cash 6.3 6.4 10.5 11.0 10.7 11.8 8.4 8.1 5.4 5.6Receivables 32.9 32.1 21.2 21.5 21.4 21.8 28.3 28.2 34.8 33.8
Short-term 30.4 29.4 20.9 21.1 19.9 20.4 22.4 22.1 33.1 31.9 of which:
Trade receivables 12.3 12.5 8.4 8.4 12.3 12.0 11.5 11.3 12.6 12.9Receivables from affiliated companies 14.9 13.7 7.2 7.6 4.7 5.2 7.6 7.7 17.4 15.8
Long-term 2.5 2.7 0.4 0.4 1.5 1.4 6.0 6.1 1.8 2.0of which: Loans to affiliated companies 1.2 1.4 0.2 0.2 1.0 1.0 0.7 1.0 1.3 1.5
Securities 0.2 0.2 0.2 0.1 0.3 0.3 0.3 0.4 0.2 0.2Other long-term equity investments 10.0 9.7 3.0 2.6 2.2 2.3 4.9 4.9 11.8 11.4
of which: Goodwill 1.1 0.9 0.4 0.3 0.3 0.3 0.3 0.3 1.4 1.1
CapitalEquity 35.9 36.8 35.2 35.3 32.6 33.6 36.4 35.8 36.0 37.2Liabilities 49.6 48.9 59.0 59.0 60.7 59.6 51.0 51.3 48.5 47.4
Short-term 36.2 33.8 33.0 34.3 42.9 43.8 34.8 36.5 36.2 32.5of which:Liabilities to banks 5.5 5.3 11.2 11.1 13.3 14.0 7.5 8.1 4.5 4.0Trade payables 8.7 8.7 5.4 5.8 7.4 7.2 7.2 6.6 9.2 9.4Liabilities to affiliated companies 14.5 12.2 6.1 6.5 7.8 8.4 9.5 9.9 16.2 13.1
Long-term 13.4 15.1 25.9 24.7 17.8 15.9 16.2 14.9 12.3 14.9 of which:
Liabilities to banks 9.9 10.2 23.2 22.1 15.1 12.9 12.9 12.6 8.6 9.3Liabilities to affiliated companies 1.3 2.9 1.9 1.7 1.2 1.6 1.7 1.5 1.3 3.3
Provisions 13.7 13.9 4.7 4.7 6.2 6.2 11.9 12.2 14.8 14.9of which: Provisions for pensions 4.2 4.4 0.5 0.6 1.0 1.0 1.9 2.0 4.9 5.3
Other ratios Percentage of salesAnnual result before taxes on income 3.3 3.6 8.5 9.4 5.6 6.5 4.6 4.8 2.9 3.2Annual result and depreciation 5.0 5.2 13.4 14.3 8.0 8.8 6.8 6.8 4.5 4.7Trade receivables 6.9 6.9 9.1 8.9 8.5 8.2 8.9 8.7 6.4 6.5
Percentage of the balance sheet totalSales 179.9 181.3 93.1 93.6 144.6 146.9 129.4 129.4 195.3 197.5Annual result and interest paid 5.9 6.3 7.9 8.4 7.6 8.9 6.1 6.2 5.7 6.2
Percentage of liabilities and provisions less cashAnnual result and depreciation 15.6 16.5 22.9 24.9 20.5 23.8 16.1 15.6 15.0 16.1
Percentage of fixed assetsLong-term equity and liabilities 119.9 124.4 109.0 110.6 117.3 120.2 115.5 111.5 121.4 128.2
Percentage of short-term liabilitiesCash resources and short-term receivables 101.5 106.2 95.2 93.5 71.7 73.9 88.7 83.2 106.7 115.4Cash resources, short-term receivables and inventories 151.5 160.7 127.8 128.7 128.9 130.6 150.7 143.7 153.8 168.5
Percentage of cost of materialsTrade payables 6.8 6.7 15.4 17.0 10.1 9.7 9.6 8.9 6.3 6.3
Memo item:Balance sheet total in € billion 45.39 46.87 0.54 0.58 2.19 2.30 8.10 8.55 34.55 35.44Sales in € billion 81.65 84.99 0.51 0.54 3.17 3.38 10.48 11.06 67.49 70.00Number of enterprises 1 945 1 945 571 571 633 633 472 472 269 269
* Agriculture, forestry and fishing, mining and quarrying, manufacturing, electricity, gas and water supply, construction, trade, transportation and storage,accommodation and food service activities, information and communication, business services, personal service activities

Deutsche BundesbankFinancial statement statistics (ratios - provisional data)
May 2021253
IV. Enterprises by federal state and economic sector
cont'd: 15. Schleswig-Holstein All economic sectors*
cont'd: All legal formsEnterprises with sales of ... € million
Total Less than 2 2 but less than 10 10 but less than 50 50 and moreQuartile Cylindered sample 2018/2019value 2018 2019 2018 2019 2018 2019 2018 2019 2018 2019Of the enterprises captured …
Ratios ... % had a ratio of less than …Percentage of gross revenue
Cost of materials 25 27.1 27.3 6.3 5.7 29.8 31.2 40.1 40.0 51.8 51.0 50 49.6 49.2 32.5 30.9 49.2 48.1 60.5 59.0 72.0 71.4 75 71.1 71.1 52.5 52.1 69.2 67.7 75.4 75.2 85.3 85.2
Personnel expenses 25 9.8 9.9 10.6 10.1 13.4 13.4 10.1 10.8 4.5 4.4 50 21.7 22.2 28.6 29.9 25.9 26.3 18.3 18.7 11.4 11.4 75 37.7 37.4 44.8 44.5 38.9 38.0 32.6 32.6 19.4 20.6
Depreciation 25 0.8 0.8 1.2 1.1 0.8 0.8 0.8 0.8 0.6 0.6 50 2.0 1.9 2.6 2.6 1.8 1.8 1.8 1.7 1.4 1.4 75 4.4 4.5 6.8 8.4 3.9 3.8 3.8 3.8 3.3 3.2
Annual result 25 0.6 0.9 0.5 1.4 0.8 1.2 0.7 0.7 0.4 0.4 50 2.9 3.3 5.1 5.6 2.9 3.4 2.5 2.5 1.9 1.9 75 7.8 7.9 13.0 13.3 6.9 7.3 5.6 6.0 5.4 5.1
Percentage of the balance sheet totalTangible fixed assets 25 6.2 6.2 6.2 6.2 5.4 5.3 6.9 6.5 7.2 7.2
50 19.7 20.0 24.0 25.2 18.5 19.2 18.6 18.1 17.8 17.8 75 47.4 47.1 62.1 63.3 43.2 43.4 45.2 45.0 36.1 36.3
Inventories 25 0.9 1.1 0.0 0.0 2.9 3.0 2.7 2.8 4.5 4.5 50 16.4 15.7 3.7 4.3 21.6 21.2 23.5 24.3 19.8 19.2 75 39.8 40.0 23.9 27.0 47.4 44.8 44.6 45.2 37.2 37.0
Equity 25 12.7 14.2 7.7 11.0 12.2 13.5 15.6 15.0 21.2 21.2 50 30.0 31.8 28.5 33.3 28.0 29.7 32.5 31.7 33.0 34.8 75 52.3 53.3 56.1 58.6 49.9 51.1 48.6 51.4 52.8 52.2
Short-term liabilities 25 19.5 18.5 14.9 14.1 21.5 20.8 21.3 20.6 22.2 20.7 50 41.2 40.1 34.4 33.3 43.2 42.8 43.3 43.8 40.7 40.7 75 66.7 65.4 67.5 63.0 68.6 67.3 67.2 68.9 62.0 61.1
Liabilities to banks 25 0.0 0.0 0.0 0.0 0.0 0.0 0.0 0.0 0.0 0.0 50 11.0 10.8 12.2 12.2 15.0 14.3 9.9 10.2 4.0 3.2 75 35.4 35.4 46.1 44.8 37.4 36.8 32.3 33.2 24.8 25.2
Percentage of salesAnnual result before taxes on income 25 0.9 1.3 0.7 1.7 1.1 1.6 1.0 1.0 0.6 0.6
50 3.8 4.1 6.2 7.2 3.8 4.3 3.4 3.3 2.5 2.5 75 9.8 10.0 15.4 15.2 8.8 9.5 7.1 7.5 6.8 6.7
Annual result and depreciation 25 2.7 3.1 3.5 4.9 3.0 3.6 2.9 2.8 1.6 1.6 50 6.9 7.1 10.7 11.8 6.8 7.1 6.1 5.5 4.6 4.4 75 14.0 14.0 24.7 25.0 12.5 12.9 11.3 10.7 10.3 9.7
Trade receivables 25 3.0 2.7 2.0 1.8 3.4 3.0 3.8 3.4 2.3 2.0 50 6.7 6.1 6.4 6.0 7.1 6.1 7.0 6.7 6.1 5.7 75 11.7 11.4 11.3 11.1 12.1 11.4 12.6 12.1 10.6 10.7
Percentage of the balance sheet totalAnnual result and interest paid 25 2.6 3.0 2.3 3.4 3.1 3.7 2.5 2.6 2.0 1.8
50 6.6 7.1 8.4 9.5 6.6 7.8 6.1 5.6 5.3 5.3 75 14.5 15.5 20.1 22.4 13.3 15.2 11.8 11.5 11.1 10.6
Percentage of liabilities and provisions less cashAnnual result and depreciation 25 5.8 7.1 2.2 6.2 5.5 7.0 7.2 7.9 7.6 7.0
50 17.9 19.7 19.8 22.8 17.6 20.9 17.1 18.4 16.4 16.8 75 40.3 46.7 46.9 59.6 43.4 48.6 33.6 36.8 33.4 33.0
Percentage of fixed assetsLong-term equity and liabilities 25 89.6 91.4 75.4 87.0 92.9 92.3 94.4 94.1 93.8 96.6
50 143.9 149.1 127.3 135.3 158.3 164.9 151.5 145.5 145.0 144.4 75 347.9 360.9 350.0 360.9 391.5 439.0 331.8 307.9 255.5 292.6
Percentage of short-term liabilitiesCash resources and short-term receivables 25 46.4 46.4 46.7 45.4 40.2 44.3 46.0 44.7 60.5 64.5
50 94.1 99.3 108.9 112.5 85.9 92.8 87.9 86.5 100.9 107.0 75 193.0 212.1 230.4 268.7 190.8 196.4 173.8 174.2 174.1 189.1
Percentage of cost of materialsTrade payables 25 4.1 3.9 4.1 4.5 4.7 4.5 4.0 3.7 3.2 3.1
50 8.6 8.1 10.2 9.5 8.8 8.2 7.9 8.0 6.6 6.4 75 16.1 15.6 25.9 26.9 16.6 15.5 13.7 13.5 10.9 10.7
* Agriculture, forestry and fishing, mining and quarrying, manufacturing, electricity, gas and water supply, construction, trade, transportation and storage,accommodation and food service activities, information and communication, business services, personal service activities

Deutsche BundesbankFinancial statement statistics (ratios - provisional data)May 2021254
IV. Enterprises by federal state and economic sector
16. Thuringia All economic sectors*
All legal formsEnterprises with sales of ... € million
Total Less than 2 2 but less than 10 10 but less than 50 50 and moreCylindered sample 2018/2019
Ratios 2018 2019 2018 2019 2018 2019 2018 2019 2018 2019Income statementIncome Percentage of gross revenueSales 99.2 99.6 98.9 97.5 98.6 99.6 98.8 99.2 99.6 99.8Change in finished goods 0.8 0.4 1.1 2.5 1.4 0.4 1.2 0.8 0.4 0.2Interest and similar income 0.1 0.1 0.3 0.2 0.2 0.1 0.1 0.1 0.1 0.1Other income 2.9 3.0 12.0 11.6 5.0 4.7 2.7 3.1 2.5 2.5
of which: Income from long-term equity investments 0.4 0.4 0.2 0.1 0.2 0.1 0.2 0.2 0.5 0.5Total income 103.0 103.1 112.3 111.7 105.2 104.8 102.8 103.2 102.7 102.7
ExpensesCost of materials 62.1 61.8 37.7 37.7 46.3 46.0 56.4 55.9 67.7 67.4Personnel expenses 19.5 19.9 37.6 37.6 30.8 31.6 24.3 25.0 15.2 15.4Depreciation 4.0 4.0 7.5 7.7 5.1 5.0 4.6 4.7 3.5 3.5
of which: Depreciation of tangible fixed assets 3.8 3.9 7.5 7.3 5.0 4.9 4.5 4.5 3.3 3.3Interest and similar expenses 0.8 0.7 1.3 1.2 0.8 0.8 0.6 0.6 0.8 0.7Operating taxes 0.1 0.1 0.3 0.2 0.2 0.2 0.1 0.1 0.1 0.0Other expenses 11.8 12.0 21.7 21.6 17.8 17.9 12.9 13.1 10.3 10.5Total expenses before taxes on income 98.3 98.5 106.2 106.1 101.0 101.3 98.8 99.3 97.5 97.5Annual result before taxes on income 4.7 4.6 6.1 5.6 4.2 3.5 4.0 3.8 5.2 5.2Taxes on income 1.1 1.1 1.5 1.4 1.2 1.1 1.0 1.0 1.2 1.2Annual result 3.6 3.5 4.6 4.3 3.0 2.4 2.9 2.8 4.0 4.0Profit and loss transfers (parent company) - 0.1 0.0 0.6 - 0.1 0.3 0.2 0.0 0.2 - 0.2 0.0Profit and loss transfers (subsidiary) 0.9 1.0 - 0.3 - 0.3 0.1 0.0 1.0 0.9 0.9 1.3Profit for the year 2.6 2.5 5.5 4.5 3.2 2.6 1.9 2.1 2.8 2.7
Balance sheetAssets Percentage of the balance sheet totalIntangible fixed assets 1.0 0.9 0.7 0.7 0.4 0.5 1.0 0.9 1.1 0.9Tangible fixed assets 44.6 44.4 50.0 49.2 44.4 44.3 46.3 46.1 43.6 43.4
of which: Land and buildings 16.3 16.1 25.4 25.3 21.7 21.4 16.7 16.7 14.8 14.6Inventories 17.2 17.0 11.1 12.6 21.3 20.9 22.1 22.2 14.1 13.7
of which: Finished goods and merchandise 5.6 5.5 3.6 3.7 6.3 6.3 5.8 5.9 5.4 5.2Cash 6.5 6.4 14.7 14.6 11.8 11.5 9.2 9.2 3.9 3.8Receivables 23.1 22.4 15.9 15.3 17.7 18.4 17.6 17.6 27.2 25.9
Short-term 20.7 20.6 15.4 14.8 16.1 16.7 16.8 17.0 23.8 23.5 of which:
Trade receivables 7.8 7.8 6.2 6.0 7.9 7.8 8.7 8.6 7.3 7.4Receivables from affiliated companies 10.6 10.6 6.1 5.1 5.7 6.4 5.6 6.0 14.3 13.9
Long-term 2.4 1.8 0.6 0.5 1.6 1.7 0.8 0.6 3.5 2.5of which: Loans to affiliated companies 2.1 1.5 0.2 0.2 0.7 0.9 0.6 0.4 3.2 2.3
Securities 0.5 0.5 0.2 0.2 1.0 1.0 0.6 0.6 0.4 0.4Other long-term equity investments 6.7 8.0 6.3 6.4 3.0 3.0 3.1 3.2 9.4 11.6
of which: Goodwill 0.5 0.4 0.3 0.4 0.4 0.3 0.2 0.2 0.6 0.5
CapitalEquity 53.6 53.4 42.8 42.9 48.9 49.1 46.6 46.1 58.5 58.3Liabilities 38.6 39.0 52.3 52.4 45.5 45.4 46.3 47.1 32.9 33.1
Short-term 24.8 25.8 29.5 32.5 29.0 29.0 34.2 35.0 19.0 20.1of which:Liabilities to banks 4.4 4.7 7.7 9.4 6.4 6.6 5.4 5.4 3.4 3.8Trade payables 5.4 5.3 4.4 4.2 5.2 5.0 5.9 5.8 5.2 5.1Liabilities to affiliated companies 7.9 8.4 7.6 6.5 4.8 4.9 10.4 10.6 7.1 7.9
Long-term 13.8 13.2 22.8 20.0 16.6 16.4 12.2 12.1 13.9 13.0 of which:
Liabilities to banks 8.0 7.8 15.4 12.9 14.1 14.3 7.8 8.2 6.9 6.3Liabilities to affiliated companies 5.4 4.8 6.3 6.2 1.8 1.5 3.9 3.3 6.7 6.2
Provisions 7.5 7.4 4.5 4.2 5.2 5.1 6.6 6.4 8.4 8.4of which: Provisions for pensions 0.8 0.8 0.7 0.6 0.6 0.7 0.6 0.6 0.8 0.9
Other ratios Percentage of salesAnnual result before taxes on income 4.8 4.6 6.1 5.8 4.2 3.5 4.0 3.9 5.2 5.2Annual result and depreciation 7.7 7.6 12.3 12.3 8.2 7.4 7.6 7.6 7.5 7.5Trade receivables 6.5 6.5 7.9 7.5 7.6 7.4 7.6 7.6 5.8 5.8
Percentage of the balance sheet totalSales 119.5 119.6 78.5 79.6 103.8 104.8 115.6 112.8 125.5 126.9Annual result and interest paid 5.2 5.0 4.7 4.5 4.0 3.3 4.2 3.9 6.0 6.0
Percentage of liabilities and provisions less cashAnnual result and depreciation 23.0 22.5 22.7 23.1 21.6 19.7 19.9 19.2 25.1 25.2
Percentage of fixed assetsLong-term equity and liabilities 123.8 121.5 115.0 111.6 133.2 133.2 115.3 114.9 126.6 123.1
Percentage of short-term liabilitiesCash resources and short-term receivables 110.6 105.6 102.0 90.9 99.0 100.0 76.6 75.3 146.4 136.2Cash resources, short-term receivables and inventories 180.1 171.6 139.8 129.6 172.6 172.1 141.2 138.7 220.8 204.4
Percentage of cost of materialsTrade payables 7.2 7.2 14.6 13.5 10.8 10.4 8.9 9.1 6.1 6.0
Memo item:Balance sheet total in € billion 22.90 23.64 0.39 0.39 2.29 2.35 7.02 7.33 13.19 13.56Sales in € billion 27.37 28.26 0.31 0.31 2.38 2.46 8.12 8.27 16.56 17.21Number of enterprises 1 286 1 286 336 336 485 485 354 354 111 111
* Agriculture, forestry and fishing, mining and quarrying, manufacturing, electricity, gas and water supply, construction, trade, transportation and storage,accommodation and food service activities, information and communication, business services, personal service activities
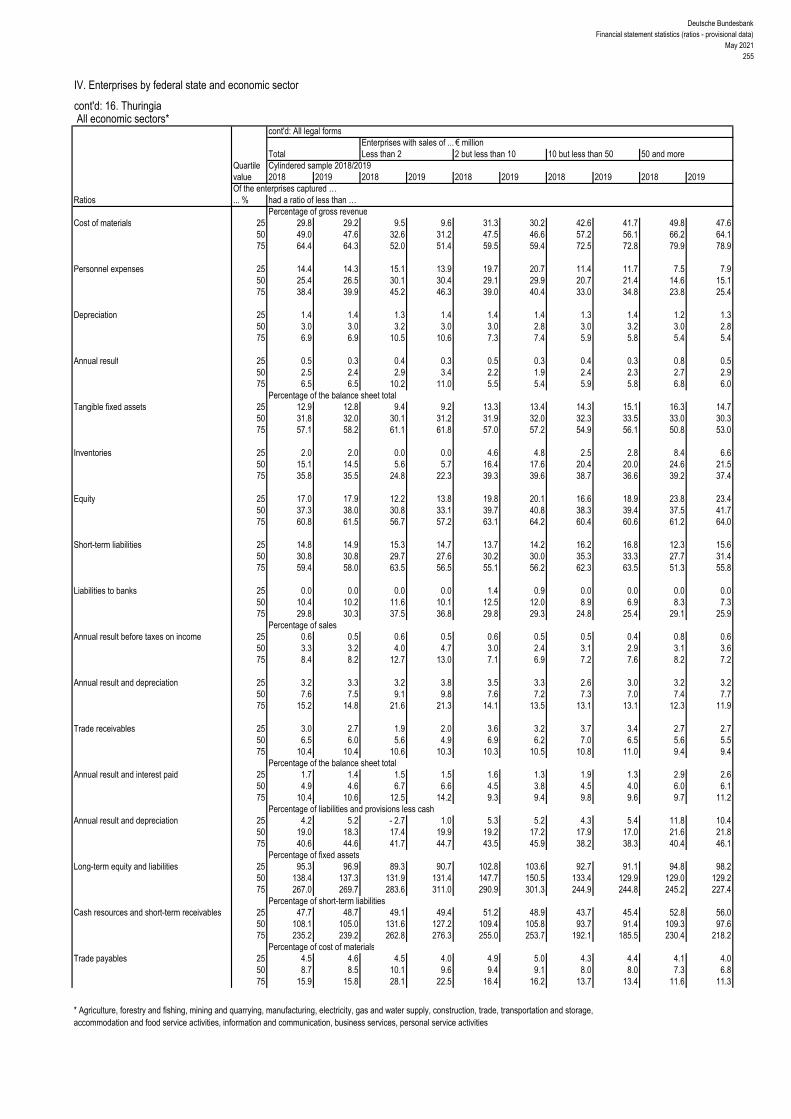
Deutsche BundesbankFinancial statement statistics (ratios - provisional data)
May 2021255
IV. Enterprises by federal state and economic sector
cont'd: 16. Thuringia All economic sectors*
cont'd: All legal formsEnterprises with sales of ... € million
Total Less than 2 2 but less than 10 10 but less than 50 50 and moreQuartile Cylindered sample 2018/2019value 2018 2019 2018 2019 2018 2019 2018 2019 2018 2019Of the enterprises captured …
Ratios ... % had a ratio of less than …Percentage of gross revenue
Cost of materials 25 29.8 29.2 9.5 9.6 31.3 30.2 42.6 41.7 49.8 47.6 50 49.0 47.6 32.6 31.2 47.5 46.6 57.2 56.1 66.2 64.1 75 64.4 64.3 52.0 51.4 59.5 59.4 72.5 72.8 79.9 78.9
Personnel expenses 25 14.4 14.3 15.1 13.9 19.7 20.7 11.4 11.7 7.5 7.9 50 25.4 26.5 30.1 30.4 29.1 29.9 20.7 21.4 14.6 15.1 75 38.4 39.9 45.2 46.3 39.0 40.4 33.0 34.8 23.8 25.4
Depreciation 25 1.4 1.4 1.3 1.4 1.4 1.4 1.3 1.4 1.2 1.3 50 3.0 3.0 3.2 3.0 3.0 2.8 3.0 3.2 3.0 2.8 75 6.9 6.9 10.5 10.6 7.3 7.4 5.9 5.8 5.4 5.4
Annual result 25 0.5 0.3 0.4 0.3 0.5 0.3 0.4 0.3 0.8 0.5 50 2.5 2.4 2.9 3.4 2.2 1.9 2.4 2.3 2.7 2.9 75 6.5 6.5 10.2 11.0 5.5 5.4 5.9 5.8 6.8 6.0
Percentage of the balance sheet totalTangible fixed assets 25 12.9 12.8 9.4 9.2 13.3 13.4 14.3 15.1 16.3 14.7
50 31.8 32.0 30.1 31.2 31.9 32.0 32.3 33.5 33.0 30.3 75 57.1 58.2 61.1 61.8 57.0 57.2 54.9 56.1 50.8 53.0
Inventories 25 2.0 2.0 0.0 0.0 4.6 4.8 2.5 2.8 8.4 6.6 50 15.1 14.5 5.6 5.7 16.4 17.6 20.4 20.0 24.6 21.5 75 35.8 35.5 24.8 22.3 39.3 39.6 38.7 36.6 39.2 37.4
Equity 25 17.0 17.9 12.2 13.8 19.8 20.1 16.6 18.9 23.8 23.4 50 37.3 38.0 30.8 33.1 39.7 40.8 38.3 39.4 37.5 41.7 75 60.8 61.5 56.7 57.2 63.1 64.2 60.4 60.6 61.2 64.0
Short-term liabilities 25 14.8 14.9 15.3 14.7 13.7 14.2 16.2 16.8 12.3 15.6 50 30.8 30.8 29.7 27.6 30.2 30.0 35.3 33.3 27.7 31.4 75 59.4 58.0 63.5 56.5 55.1 56.2 62.3 63.5 51.3 55.8
Liabilities to banks 25 0.0 0.0 0.0 0.0 1.4 0.9 0.0 0.0 0.0 0.0 50 10.4 10.2 11.6 10.1 12.5 12.0 8.9 6.9 8.3 7.3 75 29.8 30.3 37.5 36.8 29.8 29.3 24.8 25.4 29.1 25.9
Percentage of salesAnnual result before taxes on income 25 0.6 0.5 0.6 0.5 0.6 0.5 0.5 0.4 0.8 0.6
50 3.3 3.2 4.0 4.7 3.0 2.4 3.1 2.9 3.1 3.6 75 8.4 8.2 12.7 13.0 7.1 6.9 7.2 7.6 8.2 7.2
Annual result and depreciation 25 3.2 3.3 3.2 3.8 3.5 3.3 2.6 3.0 3.2 3.2 50 7.6 7.5 9.1 9.8 7.6 7.2 7.3 7.0 7.4 7.7 75 15.2 14.8 21.6 21.3 14.1 13.5 13.1 13.1 12.3 11.9
Trade receivables 25 3.0 2.7 1.9 2.0 3.6 3.2 3.7 3.4 2.7 2.7 50 6.5 6.0 5.6 4.9 6.9 6.2 7.0 6.5 5.6 5.5 75 10.4 10.4 10.6 10.3 10.3 10.5 10.8 11.0 9.4 9.4
Percentage of the balance sheet totalAnnual result and interest paid 25 1.7 1.4 1.5 1.5 1.6 1.3 1.9 1.3 2.9 2.6
50 4.9 4.6 6.7 6.6 4.5 3.8 4.5 4.0 6.0 6.1 75 10.4 10.6 12.5 14.2 9.3 9.4 9.8 9.6 9.7 11.2
Percentage of liabilities and provisions less cashAnnual result and depreciation 25 4.2 5.2 - 2.7 1.0 5.3 5.2 4.3 5.4 11.8 10.4
50 19.0 18.3 17.4 19.9 19.2 17.2 17.9 17.0 21.6 21.8 75 40.6 44.6 41.7 44.7 43.5 45.9 38.2 38.3 40.4 46.1
Percentage of fixed assetsLong-term equity and liabilities 25 95.3 96.9 89.3 90.7 102.8 103.6 92.7 91.1 94.8 98.2
50 138.4 137.3 131.9 131.4 147.7 150.5 133.4 129.9 129.0 129.2 75 267.0 269.7 283.6 311.0 290.9 301.3 244.9 244.8 245.2 227.4
Percentage of short-term liabilitiesCash resources and short-term receivables 25 47.7 48.7 49.1 49.4 51.2 48.9 43.7 45.4 52.8 56.0
50 108.1 105.0 131.6 127.2 109.4 105.8 93.7 91.4 109.3 97.6 75 235.2 239.2 262.8 276.3 255.0 253.7 192.1 185.5 230.4 218.2
Percentage of cost of materialsTrade payables 25 4.5 4.6 4.5 4.0 4.9 5.0 4.3 4.4 4.1 4.0
50 8.7 8.5 10.1 9.6 9.4 9.1 8.0 8.0 7.3 6.8 75 15.9 15.8 28.1 22.5 16.4 16.2 13.7 13.4 11.6 11.3
* Agriculture, forestry and fishing, mining and quarrying, manufacturing, electricity, gas and water supply, construction, trade, transportation and storage,accommodation and food service activities, information and communication, business services, personal service activities


