Financial Year 2015 Results PresentationAugust 7, 2015
FY15 vs. FY141
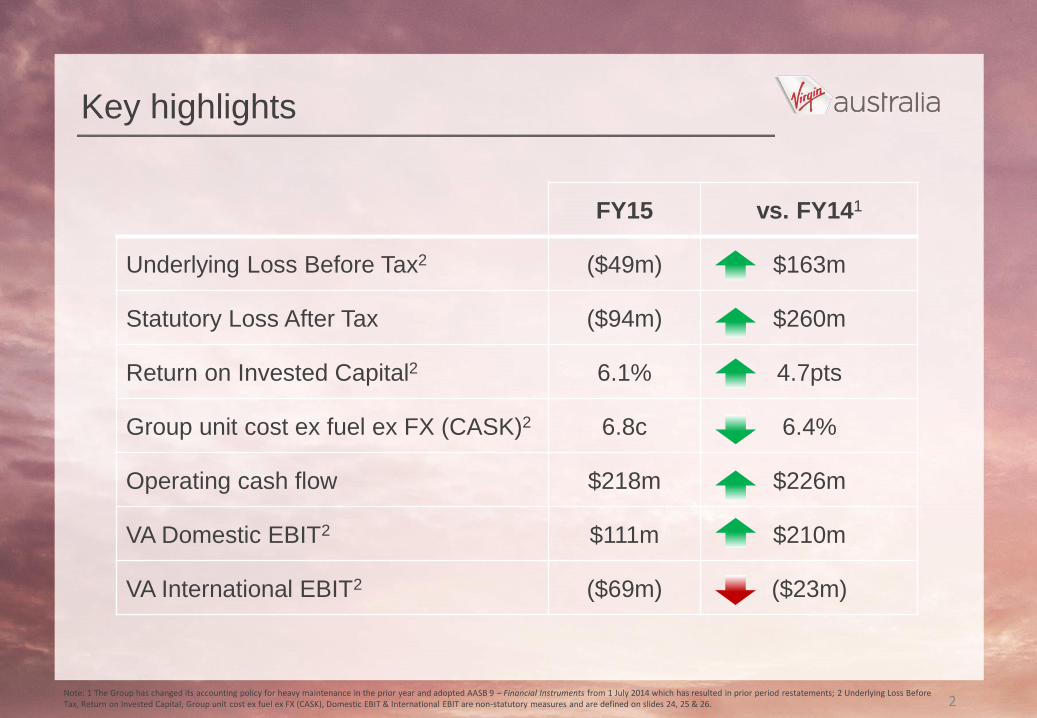
Underlying Loss Before Tax2 ($49m) $163m
Statutory Loss After Tax ($94m) $260m
Return on Invested Capital2 6.1% 4.7pts
Group unit cost ex fuel ex FX (CASK)2 6.8c 6.4%
Operating cash flow $218m $226m
VA Domestic EBIT2 $111m $210m
VA International EBIT2 ($69m) ($23m)
Key highlights
2Note: 1 The Group has changed its accounting policy for heavy maintenance in the prior year and adopted AASB 9 – Financial Instruments from 1 July 2014 which has resulted in prior period restatements; 2 Underlying Loss Before Tax, Return on Invested Capital, Group unit cost ex fuel ex FX (CASK), Domestic EBIT & International EBIT are non-statutory measures and are defined on slides 24, 25 & 26.
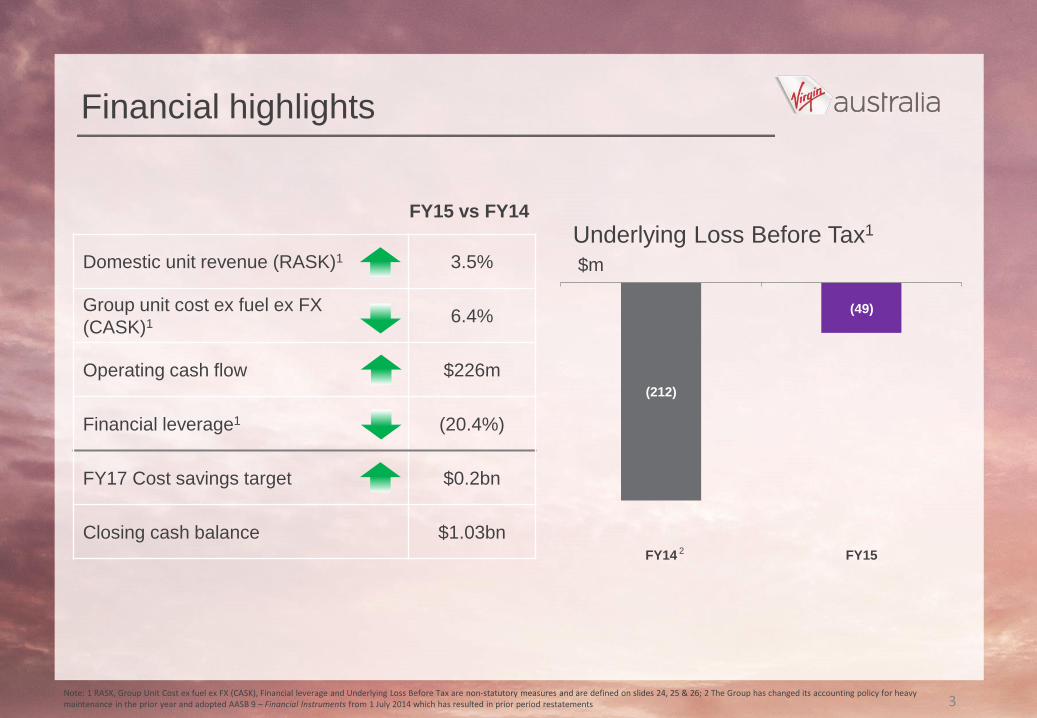
Financial highlights
3
(212)
FY14 FY15
(49)
Underlying Loss Before Tax1
Domestic unit revenue (RASK)1 3.5%
Group unit cost ex fuel ex FX
(CASK)1 6.4%
Operating cash flow $226m
Financial leverage1 (20.4%)
FY17 Cost savings target $0.2bn
Closing cash balance $1.03bn
$m
Note: 1 RASK, Group Unit Cost ex fuel ex FX (CASK), Financial leverage and Underlying Loss Before Tax are non-statutory measures and are defined on slides 24, 25 & 26; 2 The Group has changed its accounting policy for heavy maintenance in the prior year and adopted AASB 9 – Financial Instruments from 1 July 2014 which has resulted in prior period restatements
2
FY15 vs FY14
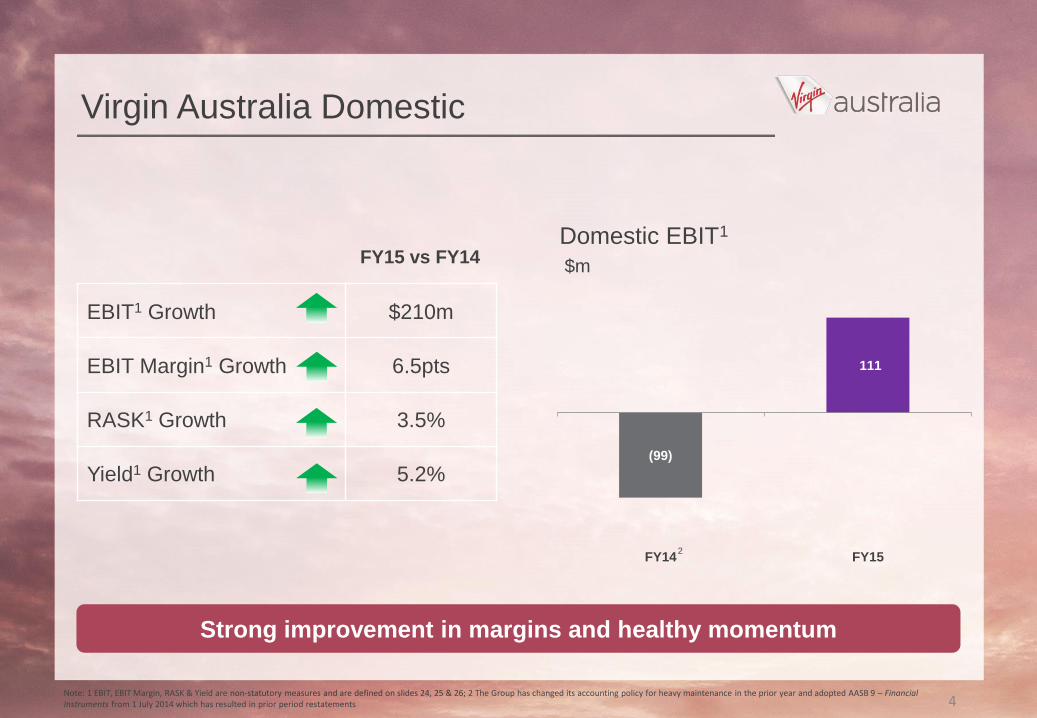
Virgin Australia Domestic
EBIT1 Growth $210m
EBIT Margin1 Growth 6.5pts
RASK1 Growth 3.5%
Yield1 Growth 5.2%
Strong improvement in margins and healthy momentum
(99)
FY14 FY15
Domestic EBIT1
$m
111
4
2
Note: 1 EBIT, EBIT Margin, RASK & Yield are non-statutory measures and are defined on slides 24, 25 & 26; 2 The Group has changed its accounting policy for heavy maintenance in the prior year and adopted AASB 9 – Financial Instruments from 1 July 2014 which has resulted in prior period restatements
FY15 vs FY14

Virgin Australia Domestic – leading the pack
%
82
92
88
0
Sep-14Jul-14 Jul-15May-15Mar-15Jan-15Nov-14
90
86
84
QF brand
VA brand
On time performance leader for the past 10 months1
5Note: 1 In accordance with the Bureau of Infrastructure, Transport & Regional Economics (BITRE) definitions, flight departure is counted as "on time" if it departs the gate within 15 mins of the scheduled departure time shown in the carriers' schedule; 2 Guest Satisfaction Tracker, July 2014 – June 2015. Data has been collected and analysed by Colmar Brunton, a leading external Australian market research agency. Colmar Brunton specialises in rigorous market research methodologies and provides research services to leading blue chip companies, Federal and State and governments.
End to end customer
experience
Domestic business class
service
Lounge experience
Record customer satisfaction2
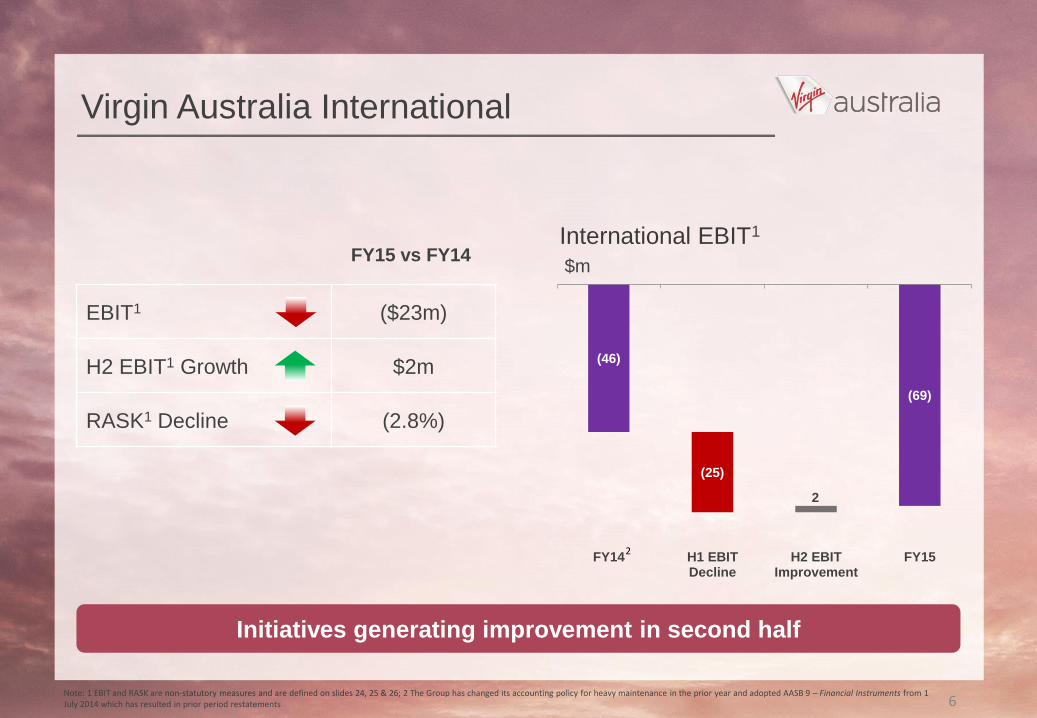
Virgin Australia International
Initiatives generating improvement in second half
(46)
(69)
(25)
2
FY14 H1 EBITDecline
H2 EBITImprovement
FY15
International EBIT1
$m
EBIT1 ($23m)
H2 EBIT1 Growth $2m
RASK1 Decline (2.8%)
6
2
Note: 1 EBIT and RASK are non-statutory measures and are defined on slides 24, 25 & 26; 2 The Group has changed its accounting policy for heavy maintenance in the prior year and adopted AASB 9 – Financial Instruments from 1 July 2014 which has resulted in prior period restatements
FY15 vs FY14
International improvement plan
Targeting return to profitability by end of FY17
1st Phase
- Business Class on Tasman and Pacific Islands
- Management integration of NZ operations
- LAX Flying Consolidation
- B777 Business Class Suites
2nd Phase
Route Changes
- Jan-16 PER-HKT withdrawal
- Mar-16 PER-DPS; MEL-DPS and ADL-DPS withdrawal
- Selected frequency increases on Tasman and other Pacific Island routes
Tigerair - Flying to International Leisure Destinations
- Launch date: Mar-16: PER-DPS; MEL-DPS and ADL-DPS
7
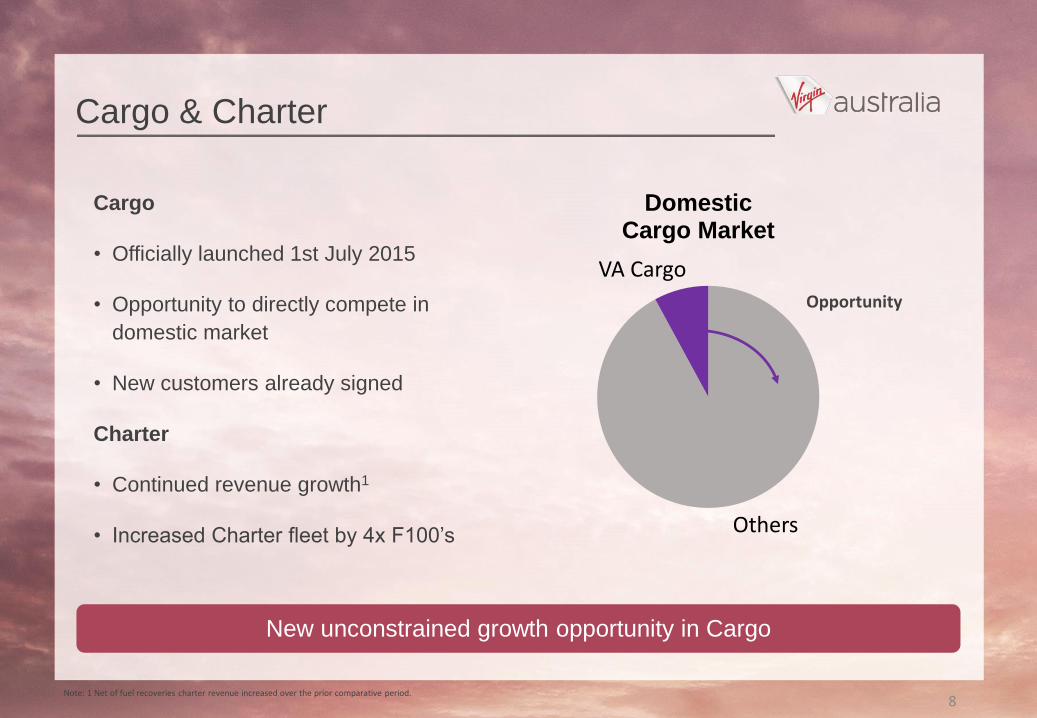
Others
VA Cargo
Domestic Cargo Market
Cargo
• Officially launched 1st July 2015
• Opportunity to directly compete in
domestic market
• New customers already signed
Charter
• Continued revenue growth1
• Increased Charter fleet by 4x F100’s
Cargo & Charter
New unconstrained growth opportunity in Cargo
8Note: 1 Net of fuel recoveries charter revenue increased over the prior comparative period.
Opportunity
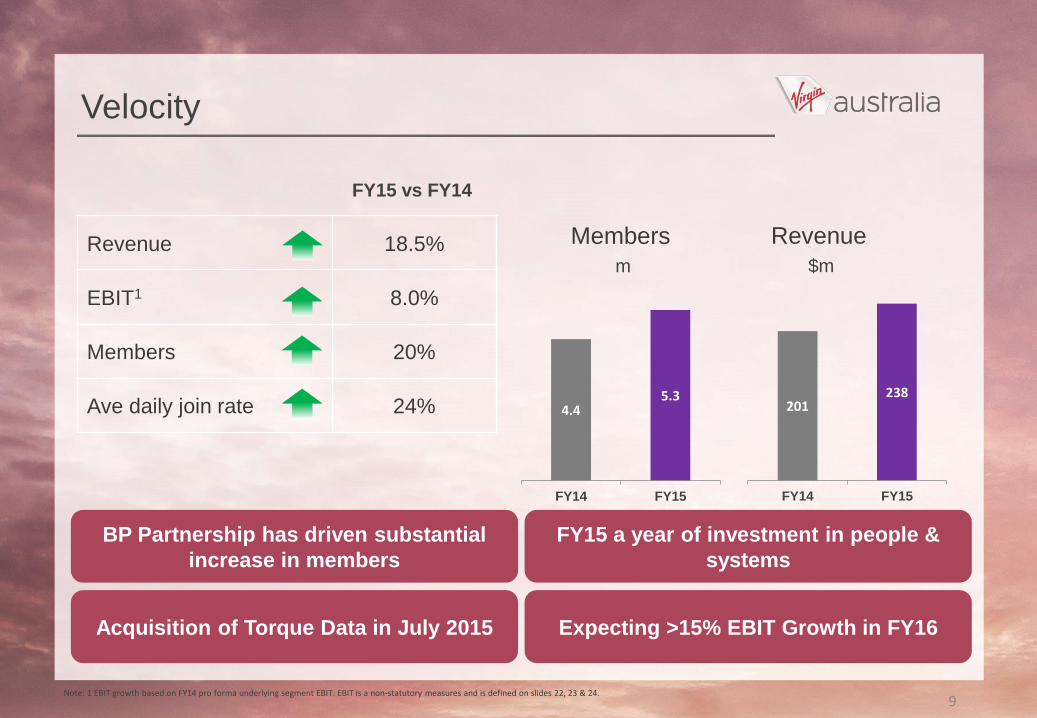
Velocity
Revenue 18.5%
EBIT1 8.0%
Members 20%
Ave daily join rate 24%
BP Partnership has driven substantial
increase in members
4.45.3
FY14 FY15
Members
m
Revenue
$m
201238
FY14 FY15
Acquisition of Torque Data in July 2015
FY15 a year of investment in people &
systems
Expecting >15% EBIT Growth in FY16
9Note: 1 EBIT growth based on FY14 pro forma underlying segment EBIT. EBIT is a non-statutory measures and is defined on slides 22, 23 & 24.
FY15 vs FY14

Tigerair1
EBIT2 $43m
EBIT Margin2 14.1pts
Load Factor 1.8pts
RASK2 8.5%
Guest Satisfaction3 11pts
Tigerair expected to be profitable for FY16
H2 E
BIT
A$
m
Strong H2 performance
-82%
10
(51)
(9)
FY14 FY15
Note 1 All metrics calculated for Tigerair are on a standalone full year underlying basis. Segment results for the period in which Tigerair was fully consolidated are included in Note 4 of the preliminary final report. For the avoidance of doubt the standalone amounts above will vary from those reported in the post consolidation Tigerair segment; 2: EBIT, EBIT margin, and RASK are non-statutory measures as defined on slides 22, 23 & 24; 3 Source: Tigerair Customer Satisfaction Survey April 2015 vs. October 2014. Data has been collected and analysed by Colmar Brunton, a leading external Australian market research agency.
FY15 vs FY14
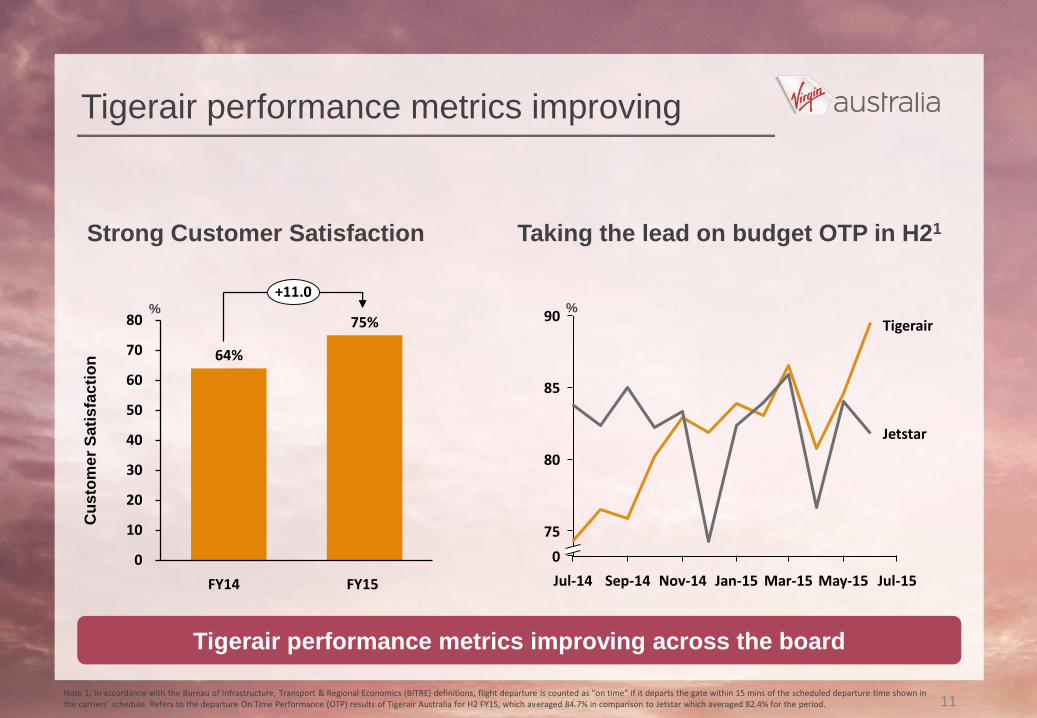
%
Tigerair performance metrics improving
0
10
20
30
40
50
60
70
80
+11.0
FY15
75%
FY14
64%
Taking the lead on budget OTP in H21
90
85
0
80
75
Jul-15May-15Mar-15Jan-15Nov-14Sep-14Jul-14
Jetstar
Tigerair
Cu
sto
me
r S
ati
sfa
cti
on
Tigerair performance metrics improving across the board
Strong Customer Satisfaction
11Note 1: In accordance with the Bureau of Infrastructure, Transport & Regional Economics (BITRE) definitions, flight departure is counted as "on time" if it departs the gate within 15 mins of the scheduled departure time shown in the carriers' schedule. Refers to the departure On Time Performance (OTP) results of Tigerair Australia for H2 FY15, which averaged 84.7% in comparison to Jetstar which averaged 82.4% for the period.
%

Our people successfully deliver Virgin Vision
12
Recent awards
Conde Nast – ‘top 10 airlines in the world for Business Travel’
Skytrax World Airline Awards – ‘Best Airline Staff’ for Australia/Pacific
Freddie Awards – ‘Program of the Year’, ‘Best Customer Service’ and ‘Best Redemption Ability’ for Middle East & Asia/Oceania
Randstad Awards – ‘Most attractive Employer’

0
5
10
15
20
25
30
35
40
45
50
VA Domestic - closing the margin gap
RASK premium
%
Increasing share of higher yielding
corporate and government market to
close RASK premium to ~15%
Qantas domestic RASK premium
over Virgin Australia1
Target
15%
1HFY15
31%
FY13
46%
13Note 1: RASK & CASK comparison has been performed between Qantas and Virgin Australia domestic segments based on published company accounts, operating statistics and Virgin Australia management estimates of revenues from non recurring items and discontinued operations. RASK & CASK are non-statutory measures and are defined on slides 24, 25 & 26.
0
2
4
6
8
10
12
14
16
Qantas Virgin Australia
CASK (¢)Qantas Domestic
CASK is 25%
higher
Domestic CASK – Virgin Australia vs.
Qantas H1FY151
-25%
Virgin Australia retaining cost
advantage over major domestic
competitor
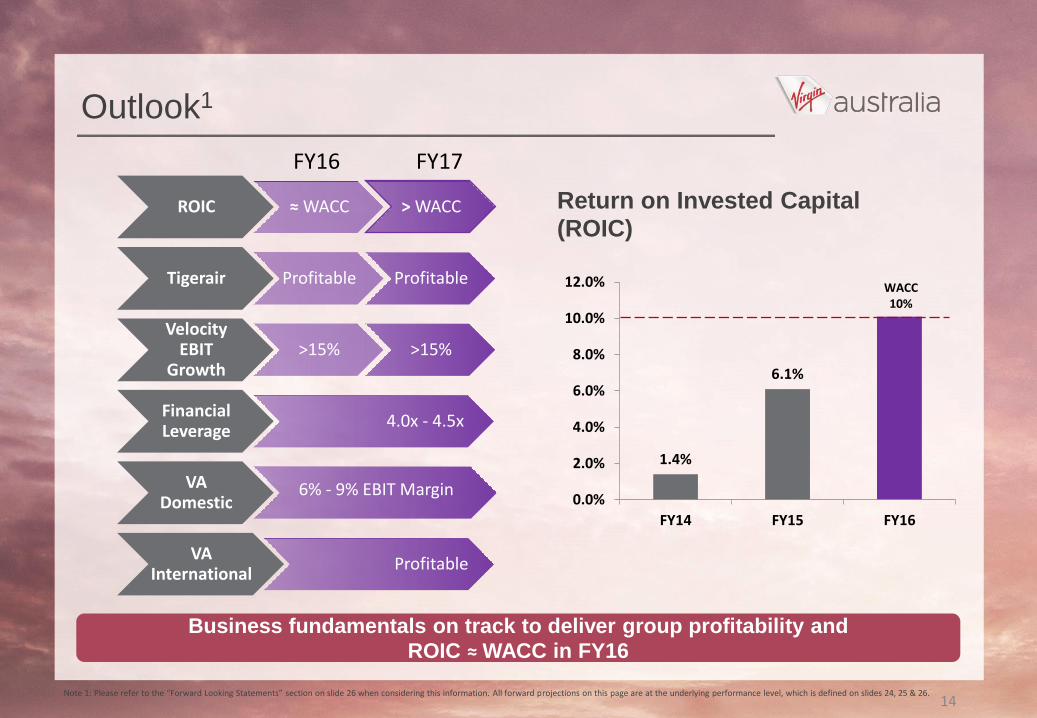
Outlook1
Business fundamentals on track to deliver group profitability and
ROIC ≈ WACC in FY16
ROIC ≈ WACC > WACC
Tigerair Profitable Profitable
Velocity EBIT
Growth>15% >15%
Financial Leverage
4.0x - 4.5x
VA Domestic
6% - 9% EBIT Margin
VA International
Profitable
Return on Invested Capital (ROIC)
FY16 FY17
1.4%
6.1%
0.0%
2.0%
4.0%
6.0%
8.0%
10.0%
12.0%
FY14 FY15 FY16
WACC 10%
14Note 1: Please refer to the “Forward Looking Statements” section on slide 26 when considering this information. All forward projections on this page are at the underlying performance level, which is defined on slides 24, 25 & 26.

Outlook statement
15
“Based on current market conditions, all fundamental business metrics
are on track for the Group to return to profitability and report a Return on
Invested Capital in line with its cost of capital for the 2016 financial year”

Supplementary financial slides
16
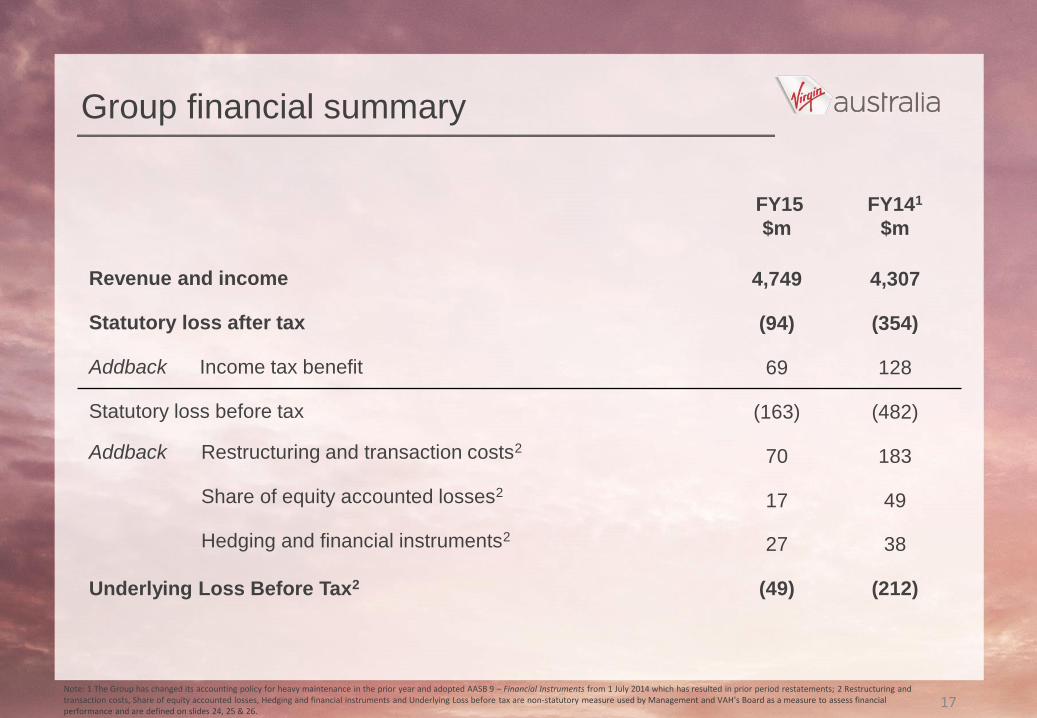
FY15
$m
FY141
$m
Revenue and income 4,749 4,307
Statutory loss after tax (94) (354)
Addback Income tax benefit 69 128
Statutory loss before tax (163) (482)
Addback Restructuring and transaction costs270 183
Share of equity accounted losses217 49
Hedging and financial instruments227 38
Underlying Loss Before Tax2 (49) (212)
Group financial summary
17Note: 1 The Group has changed its accounting policy for heavy maintenance in the prior year and adopted AASB 9 – Financial Instruments from 1 July 2014 which has resulted in prior period restatements; 2 Restructuring and transaction costs, Share of equity accounted losses, Hedging and financial instruments and Underlying Loss before tax are non-statutory measure used by Management and VAH’s Board as a measure to assess financial performance and are defined on slides 24, 25 & 26.
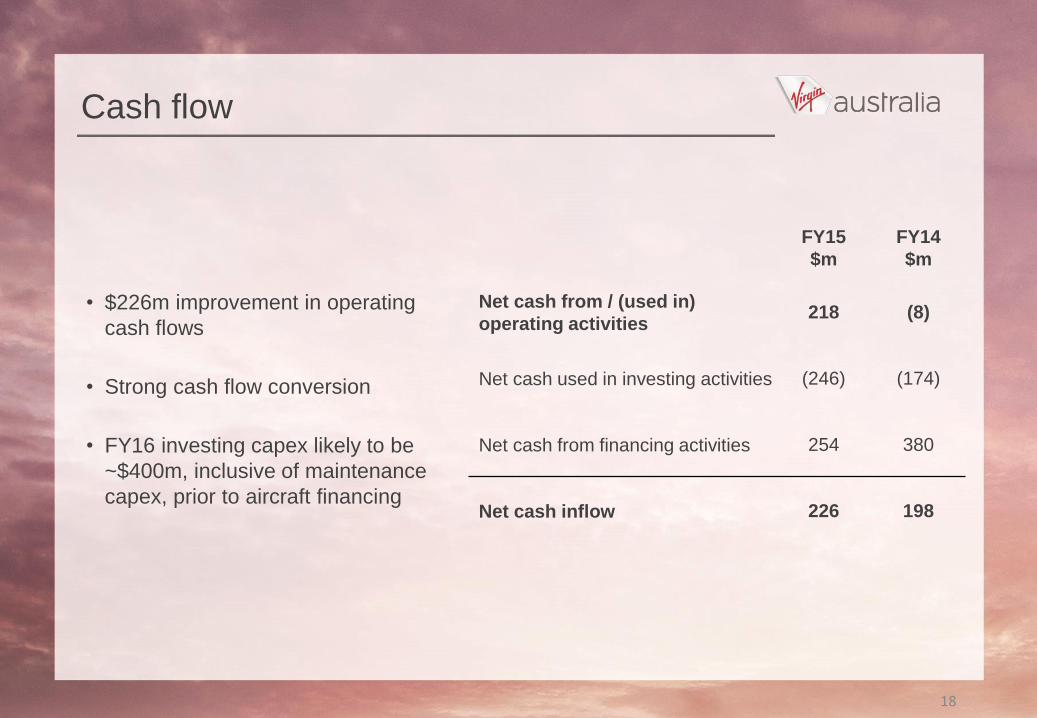
Cash flow
FY15
$m
FY14
$m
Net cash from / (used in)
operating activities218 (8)
Net cash used in investing activities (246) (174)
Net cash from financing activities 254 380
Net cash inflow 226 198
• $226m improvement in operating
cash flows
• Strong cash flow conversion
• FY16 investing capex likely to be
~$400m, inclusive of maintenance
capex, prior to aircraft financing
18
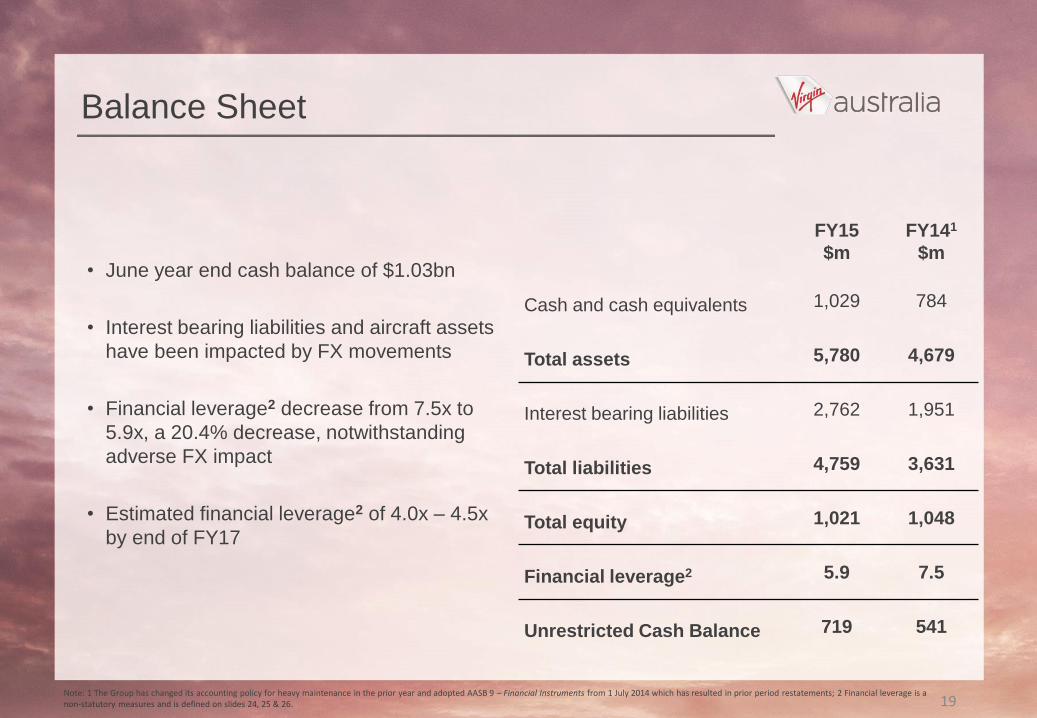
Balance Sheet
FY15
$m
FY141
$m
Cash and cash equivalents 1,029 784
Total assets 5,780 4,679
Interest bearing liabilities 2,762 1,951
Total liabilities 4,759 3,631
Total equity 1,021 1,048
Financial leverage2 5.9 7.5
Unrestricted Cash Balance 719 541
• June year end cash balance of $1.03bn
• Interest bearing liabilities and aircraft assets
have been impacted by FX movements
• Financial leverage2 decrease from 7.5x to
5.9x, a 20.4% decrease, notwithstanding
adverse FX impact
• Estimated financial leverage2 of 4.0x – 4.5x
by end of FY17
19Note: 1 The Group has changed its accounting policy for heavy maintenance in the prior year and adopted AASB 9 – Financial Instruments from 1 July 2014 which has resulted in prior period restatements; 2 Financial leverage is a non-statutory measures and is defined on slides 24, 25 & 26.
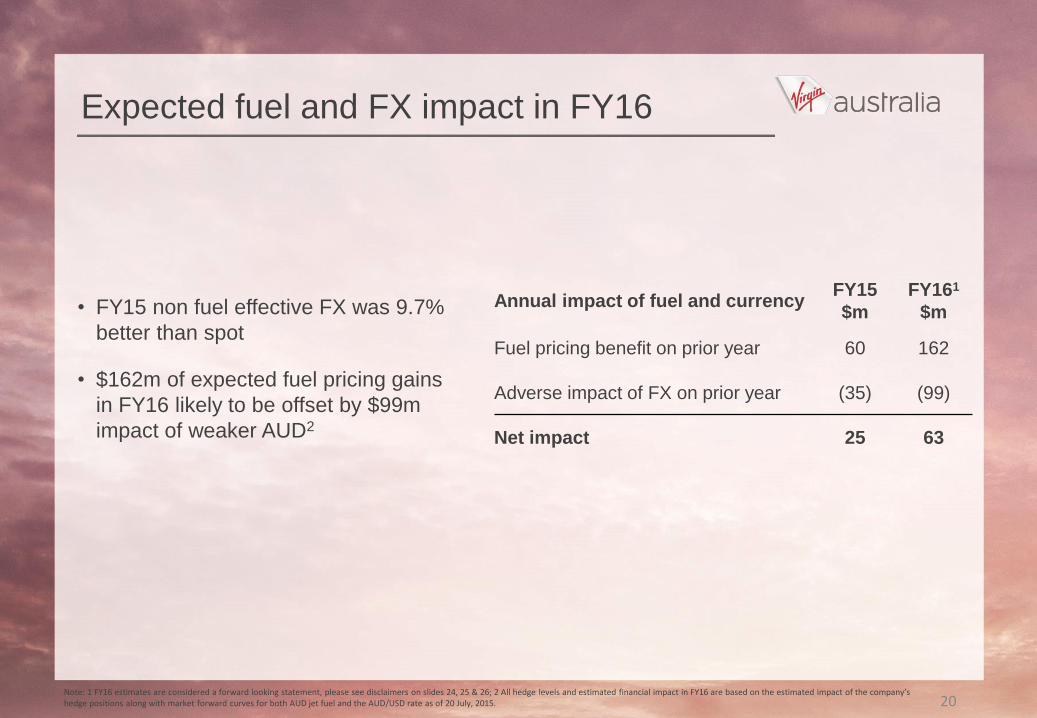
Expected fuel and FX impact in FY16
Note: 1 FY16 estimates are considered a forward looking statement, please see disclaimers on slides 24, 25 & 26; 2 All hedge levels and estimated financial impact in FY16 are based on the estimated impact of the company’s hedge positions along with market forward curves for both AUD jet fuel and the AUD/USD rate as of 20 July, 2015.
• FY15 non fuel effective FX was 9.7%
better than spot
• $162m of expected fuel pricing gains
in FY16 likely to be offset by $99m
impact of weaker AUD2
Annual impact of fuel and currencyFY15
$m
FY161
$m
Fuel pricing benefit on prior year 60 162
Adverse impact of FX on prior year (35) (99)
Net impact 25 63
20
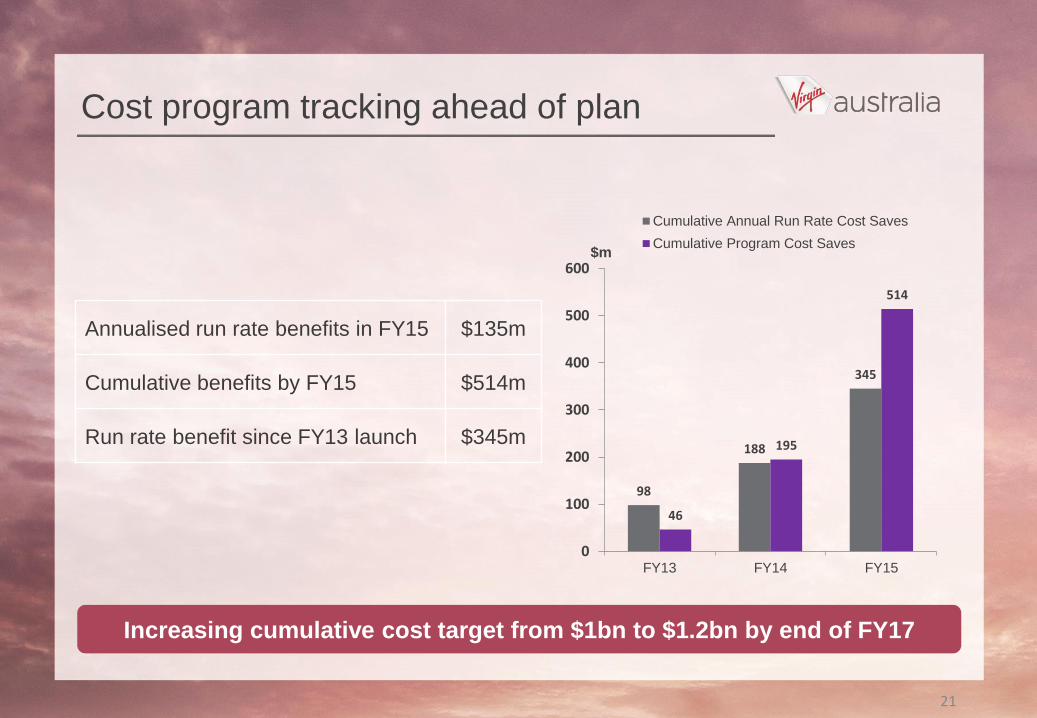
Cost program tracking ahead of plan
98
188
345
46
195
514
0
100
200
300
400
500
600
FY13 FY14 FY15
$m
Cumulative Annual Run Rate Cost Saves
Cumulative Program Cost Saves
Increasing cumulative cost target from $1bn to $1.2bn by end of FY17
Annualised run rate benefits in FY15 $135m
Cumulative benefits by FY15 $514m
Run rate benefit since FY13 launch $345m
21
30
June
20141
30
June
2015
Leased Owned
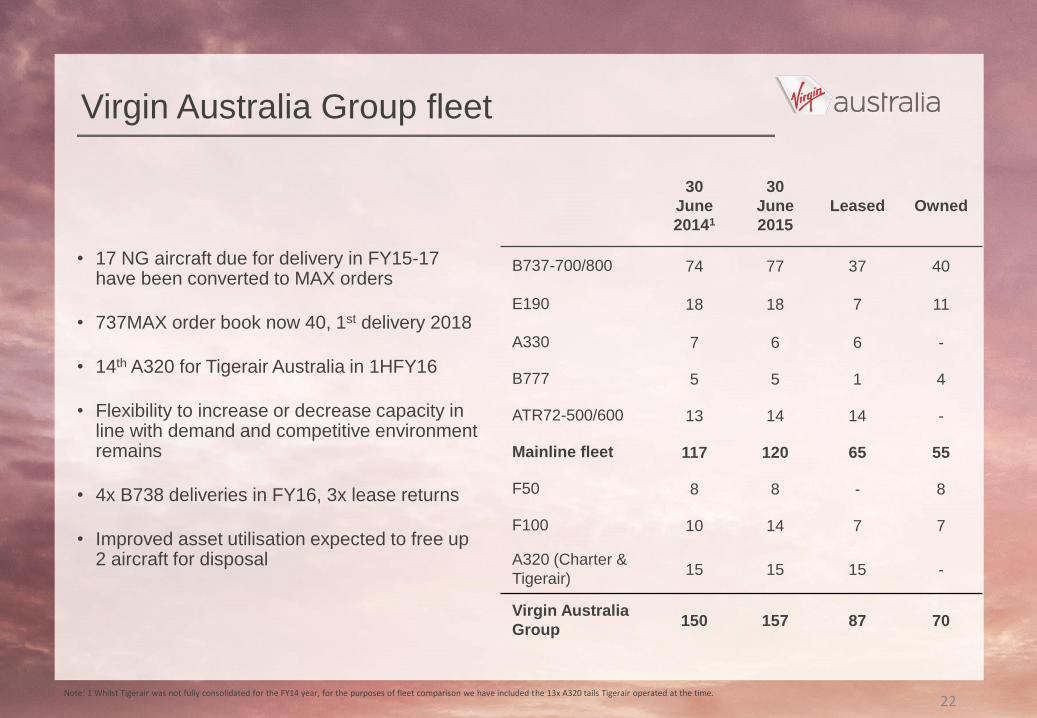
B737-700/800 74 77 37 40
E190 18 18 7 11
A330 7 6 6 -
B777 5 5 1 4
ATR72-500/600 13 14 14 -
Mainline fleet 117 120 65 55
F50 8 8 - 8
F100 10 14 7 7
A320 (Charter &
Tigerair)15 15 15 -
Virgin Australia
Group150 157 87 70
Virgin Australia Group fleet
• 17 NG aircraft due for delivery in FY15-17 have been converted to MAX orders
• 737MAX order book now 40, 1st delivery 2018
• 14th A320 for Tigerair Australia in 1HFY16
• Flexibility to increase or decrease capacity in line with demand and competitive environment remains
• 4x B738 deliveries in FY16, 3x lease returns
• Improved asset utilisation expected to free up 2 aircraft for disposal
22Note: 1 Whilst Tigerair was not fully consolidated for the FY14 year, for the purposes of fleet comparison we have included the 13x A320 tails Tigerair operated at the time.
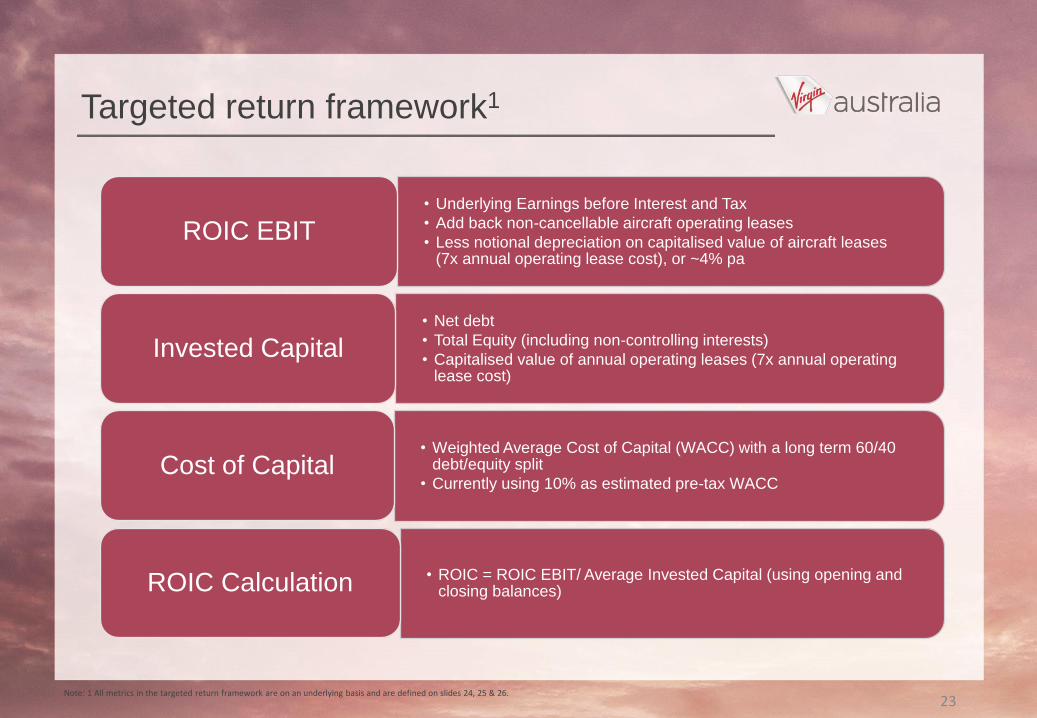
Targeted return framework1
• Underlying Earnings before Interest and Tax
• Add back non-cancellable aircraft operating leases
• Less notional depreciation on capitalised value of aircraft leases (7x annual operating lease cost), or ~4% pa
ROIC EBIT
• Net debt
• Total Equity (including non-controlling interests)
• Capitalised value of annual operating leases (7x annual operating lease cost)
Invested Capital
• Weighted Average Cost of Capital (WACC) with a long term 60/40 debt/equity split
• Currently using 10% as estimated pre-tax WACCCost of Capital
• ROIC = ROIC EBIT/ Average Invested Capital (using opening and closing balances)ROIC Calculation
23Note: 1 All metrics in the targeted return framework are on an underlying basis and are defined on slides 24, 25 & 26.

Disclaimer, definitions and ASIC guidance
Disclaimer
The following non-IFRS information has not been audited or reviewed by KPMG: Underlying Loss Before Tax, Underlying performance, Restructuring and transaction Costs, Share of equity accounted losses, Hedging and financial instruments, Earnings Before Interest, Tax, Depreciation, Amortisation and Aircraft Rentals (EBITDAR), Earnings Before Interest & Tax (EBIT), EBIT Margin, RASK (Segment unit revenue), CASK (Segment unit cost), Group unit cost ex fuel ex FX (CASK), Yield, Financial leverage, Adjusted Net Debt, Return on Invested capital (ROIC) EBIT, Invested capital, Cost of capital / WACC and ROIC.
This presentation has not been audited or reviewed by KPMG; however, IFRS data has been derived from the unaudited annual consolidated financial statements that are in the process of being audited by KPMG.
Definitions
Underlying Loss Before Tax: is a non-statutory measure that represents statutory loss before tax excluding the impact of restructuring and transaction costs (as defined below), share of equity accounted losses from associates (as defined below), impact of hedging and financial instruments (as defined below). This is a measure used by Management and VAH’s Board to assess the financial performance of VAH. The Group changed its accounting policy for heavy maintenance in the prior year and adopted AASB 9 – Financial Instruments from 1 July 2014 which has resulted in prior period restatements.
Underlying performance: is a non-statutory measure that refers to earnings or returns calculated based on the Underlying Loss Before Tax excluding restructuring and transaction costs, equity accounted losses and hedging and financial instruments (as above).
Restructuring and transaction costs: is a non-statutory measure that includes the following items outlined in Note 4 of the Virgin Australia Holdings Limited Preliminary Final Report for the full-year ended 30 June 2015: Business and capital restructure and transaction costs ($84.4m), Finance income from Tiger acquisition ($21.8m) and Accelerated depreciation due to changes in useful life of assets and net loss on disposal of assets ($7.6m). For the year ended 30 June 2014, this item included business and capital restructure costs ($101.9m), impairment losses ($56.9m), Accelerated depreciation due to changes in useful life of assets and net loss on disposal of assets ($3.1m), Accelerated amortisation resulting from a capital restructure ($12.3) and different interest rate swap terminations associated with capital restructure ($8.4m).
Share of equity accounted losses: is a non-statutory measure that includes the following items outlined in Note 4 of the Virgin Australia Holdings Limited Preliminary Final Report for the full-year ended 30 June 2015: Associate earnings (loss of $16.6m) representing the share of equity accounted earnings from Tiger Airways Australia Pty Limited and Virgin Samoa Limited for the full year ended 30 June 2015. For the year ended 30 June 2014, the share of equity accounted earnings from Tiger Airways Australia Pty Limited and Virgin Samoa Limited was a loss of $48.7m.
Hedging and financial instruments: is a non-statutory measure that includes the following items outlined in Note 4 of the Virgin Australia Holdings Limited Preliminary Final Report for the Year Ended 30 June 2015: Unrealised ineffectiveness on cash flow hedges and non-designated derivatives (loss of $17.4m) and time value movements on cash flow hedges (loss of $10.0m). For the year ended 30 June 2014, this item includes: Unrealised ineffectiveness on cash flow hedges and non-designated derivatives (loss of $20.2m) and time value movements on cash flow hedges (loss of $18.3m). The Group has early adopted AASB 9 Financial Instruments from 1 July 2014 which has resulted in prior period restatements.
Earnings Before Interest, Tax, Depreciation, Amortisation and Aircraft Rentals (EBITDAR): is a non-statutory measure per Note 4 of the Virgin Australia Holdings Limited Preliminary Final Report for the Year Ended 30 June 2015. It is used by Management and VAH’s Board as a measure to assess the financial performance of VAH and its individual segments. It is defined as Underlying Profit / (Loss) before tax (as defined above) with the addition of depreciation, aircraft rentals and net finance costs. The Group has changed its accounting policy for heavy maintenance in the prior year and adopted AASB 9 – Financial Instruments from 1 July 2014 which has resulted in prior period restatements.
24

Disclaimer, definitions and ASIC guidance
Definitions (continued)
Earnings Before Interest & Tax (EBIT): is a non-statutory measure per Note 4 of the Virgin Australia Holdings Limited Preliminary Final Report for the Year Ended 30 June 2015. It is used by Management and VAH’s Board as a measure to assess the financial performance of VAH and its individual segments. It is defined as Underlying Profit / (Loss) before tax (as defined above) with the addition of net interest expense. The Group has changed its accounting policy for heavy maintenance in the prior year and adopted AASB 9 – Financial Instruments from 1 July 2014 which has resulted in prior period restatements.
EBIT Margin: is a non-statutory measure derived from dividing Earnings Before Interest & Tax (EBIT) as defined above by total segment revenues.
RASK (Segment unit revenue): is a non-statutory measure derived from segment revenue divided by Available Seat Kilometres of the Regular Passenger Transport business.
CASK (Segment unit cost): is a non-statutory measure derived from segment revenue less total segment EBIT (as above) divided by Available Seat Kilometres of the Regular Passenger Transport business.
Group unit cost ex fuel ex FX (CASK): is a non-statutory measure derived from consolidated segment revenue less consolidated segment EBIT (as defined above) excluding fuel, hedging gains / (losses) on fuel, non-Regular Passenger Transport (RPT) costs, Velocity Frequent Flyer segment costs, foreign exchange gains / (losses) on non-fuel costs and unallocated corporate costs divided by Available Seat Kilometres of the Regular Passenger Transport business including Available Seat Kilometres of Tiger from 16 October 2014.
Yield: is a non-statutory measure derived from total consolidated segment revenues divided by Revenue Passenger Kilometres of the Regular Passenger Transport business.
Financial leverage: is a non-statutory measure and is defined as the ratio of adjusted net debt (as defined below) to EBITDAR (as defined above)
Adjusted Net Debt: is a non-statutory measure derived by taking interest bearing liabilities less cash and adding 7 times annual rentals on aircraft operating leases.
Return on Invested capital (ROIC) EBIT: is a non-statutory measure derived from underlying EBIT, adding back rentals on aircraft operating leases, and adjusting for a notional depreciation on the capitalised value of aircraft leases (7 times annual operating lease cost), or approximately 4% pa. This metric provides an indication of underlying earnings (as defined above) assuming all aircraft were owned by VAH.
Invested capital: is a non-statutory measure which provides an indication as to the invested capital within the VAH, and is derived from adding average adjusted net debt and total equity as reported in the consolidated statement of financial position.
Cost of capital / WACC: is a non-statutory measure that estimates the pre-tax weighted average cost of capital (WACC) for VAH, using an estimated 60 to 40 debt to equity split. VAH estimates its cost of capital as 10% for the 2015 financial year (2014 10%).
ROIC: is a non-statutory measure and is defined as ROIC EBIT/ Invested Capital (as defined above), and represents a measure of the Group’s Underlying Profit/(Loss) (as defined above) as a percentage of Invested capital (as defined above).
25

Disclaimer, definitions and ASIC guidance
Definitions (continued)
Forward Looking Statements: This presentation contains certain forward looking statements. Forward looking statements can generally be identified by the use of words such as ‘project’, ‘believe’, ‘foresee’, ‘plan’, ‘expect, ‘aim’, ‘potential’, ‘goal’, ‘target’, ‘intend’, ‘anticipate’, ‘believe’, ‘estimate’, ‘may’, ‘could’, ‘should’, ‘will’ or similar expressions. Indications of, and guidance on, future earnings and financial position and performance are also forward looking statements. Forward looking statements, opinions and estimates provided in this presentation involve a number of risks, assumptions and contingencies, many of which are beyond the Virgin Australia Group’s control and which are subject to change without notice, as are statements about market and industry trends, which are based on interpretations of current market conditions. It is believed that the expectations reflected in these forward looking statements, opinions and estimates are reasonable, but there can be no assurance that actual outcomes will not differ materially from these statements. Such forward looking statements, opinions and estimates are provided as a general guide only, should not be relied on as an indication or guarantee of future performance and speak only as of the date of this announcement. You should not place undue reliance on forward looking statements.
No representation or warranty, express or implied, is made as to the fairness, accuracy, completeness or correctness, likelihood of achievement or reasonableness of any of the information, forward looking statements, opinions and estimates contained in this presentation. To the maximum extent permitted by law, none of the Virgin Australia Group, its directors, employees or agents, nor any other person accepts any liability for any loss arising from the use of the information contained in this presentation. Except as required by law and ASX Listing Rules, the Virgin Australia Group has no obligation to update publicly or otherwise revise any forward looking statement, opinion or estimate as a result of new information, future events or other factors.
Nothing contained in this presentation constitutes investment, legal, tax or other advice. You should make your own assessment and take independent professional advice in relation to the information contained in this presentation and any action taken on the basis of that information.
ASIC guidance
In December 2011 ASIC issued Regulatory Guide 230. In order to comply with this Guide, VAH is required to make a clear statement about whether information disclosed in documents other than the Virgin Australia Holdings Limited Preliminary Final Report for the full-year ended 30 June 2015 has been audited or reviewed in accordance with Australian Auditing Standards.
The following non-IFRS information has not been audited or reviewed by KPMG: Underlying Loss Before Tax, Underlying performance, Restructuring and transaction Costs, Share of equity accounted losses, Hedging and financial instruments, Earnings Before Interest, Tax, Depreciation, Amortisation and Aircraft Rentals (EBITDAR), Earnings Before Interest & Tax (EBIT), EBIT Margin, RASK (Segment unit revenue), CASK (Segment unit cost), Group unit cost ex fuel ex FX (CASK), Yield, Financial leverage, Adjusted Net Debt, Return on Invested capital (ROIC) EBIT, Invested capital, Cost of capital / WACC and ROIC.
This presentation has not been audited or reviewed by KPMG; however, IFRS data has been derived from the unaudited annual consolidated financial statements that are in the process of being audited by KPMG.
26


