
ADVANCECONNECTStrengthen

INNOVATIONS IN ASSET allocation
Allocation strategy in a dynamic investment environment

RISK – MANAGING IT AND DE-RISKINGportfoliosKej SomaiaPortfolio Manager, Multi Asset, Colonial First State Asset Management

Measuring, managing and reducing risk
Leah Kelly & Kej Somaia
7th & 9th June 2011

Risk

6
What is risk?
– Uncertainty around expected returns?
– Not beating benchmark?
– Chance of not being able to meet liabilities when they fall due?
– Chance of losing capital?
– Probability of a negative return over certain periods?
– Probability of an extreme event?
Risk has a different definition depending on your objective
Risk is the probability that investment objectives will not be met

7
Typical risks in a diversified portfolio
Market
Credit
Liquidity
– Interest rate moves, credit spread moves, inflation moves, equity market moves, currency moves, stock specific
– Typically, related to fixed income investments, it is the risk that the borrower will be unable to meet its payment obligations (coupons, repayment of principal for example)
Counterparty– Closely related to credit risk, counterparty risk is the risk that the one of the parties
involved in an over-the-counter derivative is unable to meet its contractual obligations
– Typically, we define it as the risk that we will be unable to sell assets without having a significant impact on the market or without having to take a significant haircut in value

Measuring risk

9
Recap on some key terms
σ
Portfolio value
Mean / expected portfolio value
Volatility (σ) describes the width of the modelled portfolio
Portfolio value
VaR is a point on the distribution
CVaR is the avg region beyond VaR
Total portfolio risk measures Non-normal distributions
10
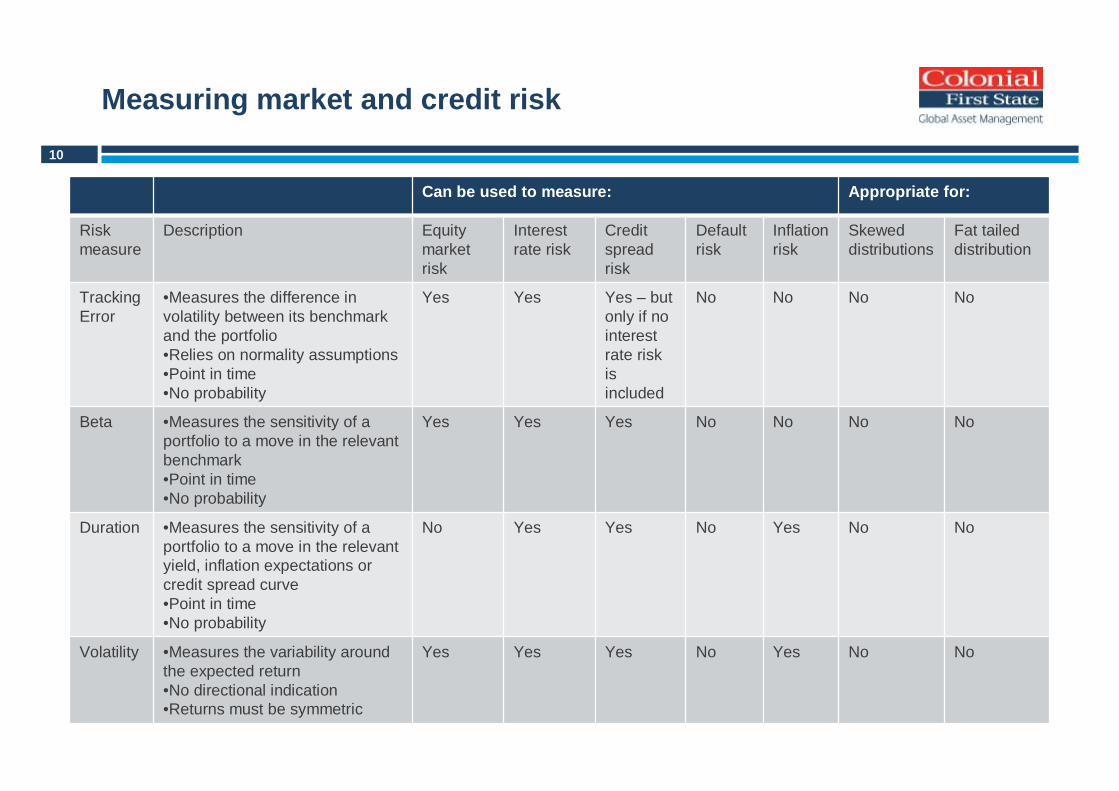
Measuring market and credit risk
Can be used to measure: Appropriate for:
Risk measure
Description Equity market risk
Interest rate risk
Credit spread risk
Default risk
Inflation risk
Skewed distributions
Fat tailed distribution
Tracking Error
•Measures the difference in volatility between its benchmark and the portfolio•Relies on normality assumptions•Point in time •No probability
Yes Yes Yes – but only if no interest rate risk is included
No No No No
Beta •Measures the sensitivity of a portfolio to a move in the relevant benchmark•Point in time•No probability
Yes Yes Yes No No No No
Duration •Measures the sensitivity of a portfolio to a move in the relevant yield, inflation expectations or credit spread curve•Point in time•No probability
No Yes Yes No Yes No No
Volatility •Measures the variability around the expected return•No directional indication•Returns must be symmetric
Yes Yes Yes No Yes No No
11
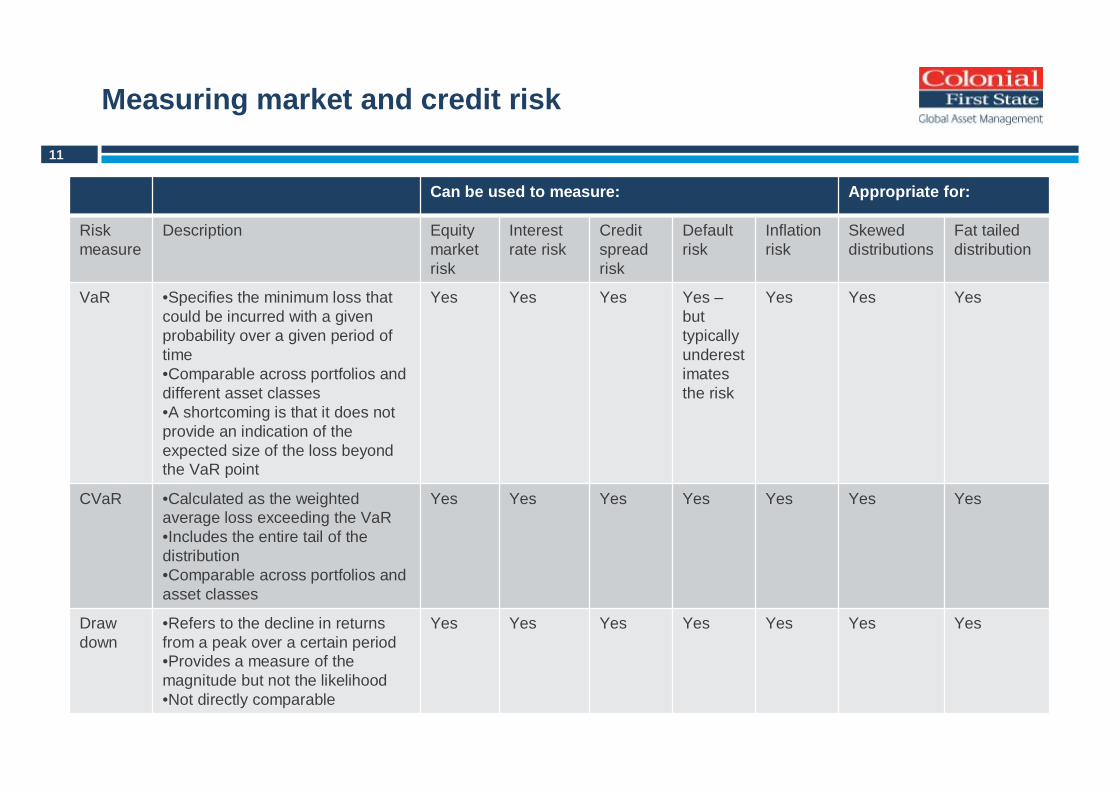
Measuring market and credit risk
Can be used to measure: Appropriate for:
Risk measure
Description Equity market risk
Interest rate risk
Credit spread risk
Default risk
Inflation risk
Skewed distributions
Fat tailed distribution
VaR •Specifies the minimum loss that could be incurred with a given probability over a given period of time•Comparable across portfolios and different asset classes•A shortcoming is that it does not provide an indication of the expected size of the loss beyond the VaR point
Yes Yes Yes Yes –but typically underestimates the risk
Yes Yes Yes
CVaR •Calculated as the weighted average loss exceeding the VaR•Includes the entire tail of the distribution•Comparable across portfolios and asset classes
Yes Yes Yes Yes Yes Yes Yes
Drawdown
•Refers to the decline in returns from a peak over a certain period•Provides a measure of the magnitude but not the likelihood•Not directly comparable
Yes Yes Yes Yes Yes Yes Yes
12
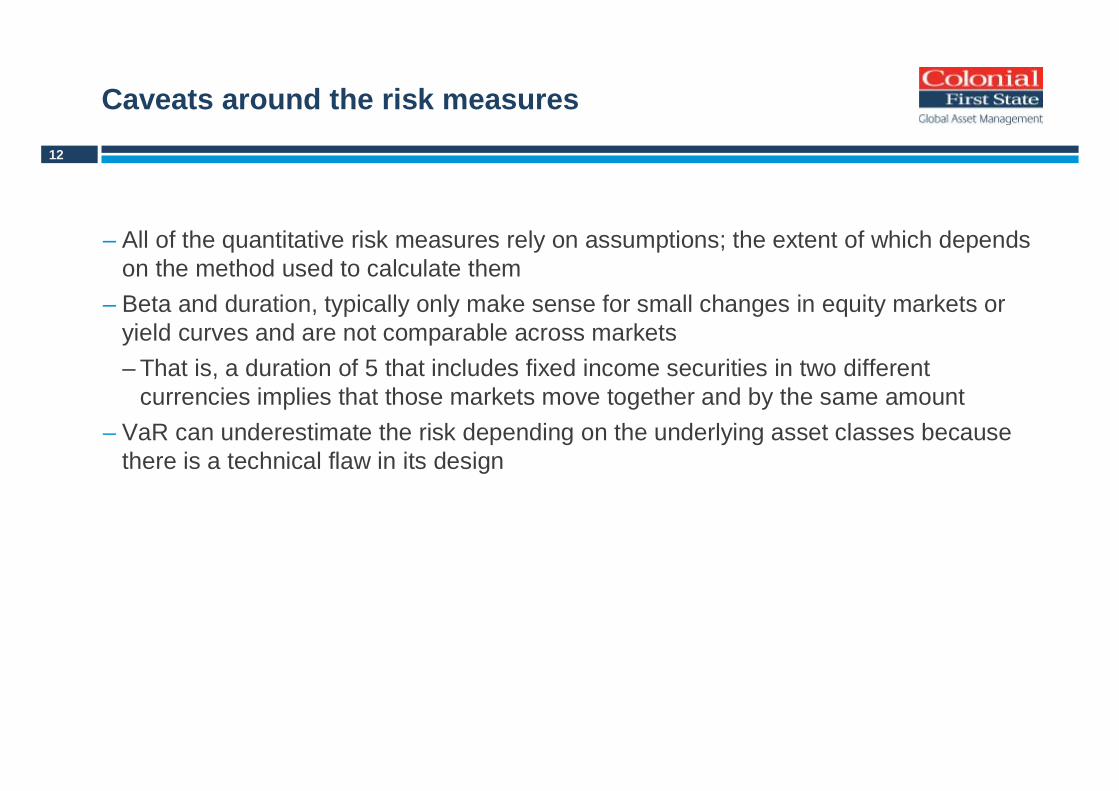
Caveats around the risk measures
– All of the quantitative risk measures rely on assumptions; the extent of which depends on the method used to calculate them
– Beta and duration, typically only make sense for small changes in equity markets or yield curves and are not comparable across markets– That is, a duration of 5 that includes fixed income securities in two different
currencies implies that those markets move together and by the same amount– VaR can underestimate the risk depending on the underlying asset classes because
there is a technical flaw in its design

13
Measuring liquidity risk
– It depends on such things as– The number of traders– The frequency and size of trades– The time it takes to execute– The bid-ask spread– How big your portfolio is!
– A variety of approaches exist and there is NO consensus
– Methods vary:– Add a liquidity factor to the risk measure of the portfolio– Assume properties of the bid ask spread – usually normally distributed
Liquidity is a function of the relevant market

14
Measuring liquidity risk
– “Know your portfolio” approach– VWAP for equities; takes into account the spread and the size of the portfolio
relative to the market in which it is invested– No liquidity for any type of alternative– Look through into cash portfolios and all fixed income portfolios– Stress OTCs to see the impact of collateral calls– Stress Forward FX positions to see the funding impact on rolling the hedge
15
Measuring counterparty risk
– Know or derive a credit rating of the counterparty– Only applied in practice to OTC derivatives, where the notional exposure is not a true
indication of the size of the possible obligation– Many participants use a “potential exposure” number, which is calculated using some
kind of volatility and/or distribution to estimate the potential size of the obligations (on both sides)
– Different treatment of different types of OTC derivatives

Managing risk

17
Risk management strategies
– Risk management also depends on the risk you are trying to manage
– If tracking error, volatility, beta or duration are your relevant risk metric knowing the contributions to your total portfolio volatility, for example, helps
– Portfolios can then be adjusted accordingly so that the risks you expect to be rewarded are the dominant risk factors
Relevant risk management strategies depend on your investment objective

18
Risk management strategies
– A Liability Mismatch– Asset portfolios should be constructed to evolve in line with liabilities– Note that liabilities evolve through time– This may be through duration, convexity matching, through credit spread matching,
through cash flow matching
– If tail risk, loss of capital are the focus:– Recognising that in extreme events all markets tend to move together though often
at different rates; a number of strategies exist:• Volatility hedging through actively managed equity put options, VIX futures or
some other volatility derivative• Credit default swap indices is also another way.
19
Risk management strategies
– Credit risk: diversification is key. There is no upside in taking credit risk, the best you can hope for is that you get your principal plus interest back.– Lend a little to a lot– Know your position in the capital structure
– Counterparty risk:– Vigilant monitoring of the financial strength of the counterparty– Diversification helps– Collateralisation (albeit carefully)– Strong documentation is critical– Strong record and settlement procedures are key
• Note that a confirmation overrules a schedule overrules the ISDA Master agreement

20
Risk management strategies
– Liquidity risk:– Know your portfolio!– Hold a buffer of cash and synthetically replicate your market exposure– Keep your methods of rebalancing a portfolio open– Manage your resets
• Not all Forward FX rolling at the same time• Not all your derivatives resetting at the same time
– If you have collateral agreements in place, maintain some flexibility in what you can post

21
Risk management strategies
And finally:– STRESS TEST , STRESS TEST, STRESS TEST all of your assumptions

Practice is changing

23
How has practice changed?
– Certainly there is a focus from regulators, advisor networks, superannuation firms regarding DB and DC risk
– More and more conversations are focusing on portfolio design that has meeting investor objectives as a key
– Furthermore, investors are focussing on the total risk of their portfolios, rather than just one metric
– Increased focus on education of Boards and Trustees with regards to communicating risks of investment options

24
Disclaimer
Product Disclosure Statements (PDS) and Information Memoranda (IM) for the funds issued by Colonial First State Investments Limited ABN 98 002 348 352, Commonwealth Managed Investments Limited ABN 33 084 098 180, and CFS Managed Property Limited ABN 13 006 464 428 (collectively CFS) are available from Colonial First State Global Asset Management. Investors should consider the relevant PDS or IM before making an investment decision. Past performance should not be taken as a reliable indication of future performance.
Information in this presentation is confidential. No part of this material may be reproduced or transmitted in any form or by any means without prior written consent of Colonial First State Asset Management (Australia) Limited ABN 89 114 194 311 (CFSAMAL). This material contains or is based upon information that we believe to be accurate and reliable. While every effort has been made to ensure its accuracy, none of CFS or CFSAMAL offers any warranty that it contains no factual errors. We would like to be told of any such errors in order to correct them.
This material has been prepared for general information. You should not rely on the contents. To the fullest extent allowed by law, CFS and CFSAMAL exclude all liability (whether arising in contract, from negligence or otherwise) in respect of all and each part of the material, including without limitation, any errors or omissions.
This material is intended only to provide a summary of the subject matter covered. It does not purport to be comprehensive or to render specific advice. It is not an offer document, and does not constitute a recommendation of any securities offered by any of the CFS or CFSAMAL. No person should act on the basis of any matter contained in this material without obtaining specific professional advice.
CFS and CFSAMAL are wholly owned subsidiaries of Commonwealth Bank of Australia. The Bank and its subsidiaries do not guarantee the performance of any funds invested in by clients of CFS and CFSAMAL or the repayment of capital. Investments are not deposits or other liabilities of the Bank or its subsidiaries and are subject to investment risk including loss of income and capital invested.
Colonial First State Global Asset management is the consolidated asset management division of the Commonwealth Bank of Australia
ABN 48 123 123 124
Copyright © Colonial First State Group Limited 2011
All rights reserved

INNOVATIONS IN ASSET allocation
Allocation strategy in a dynamic investment environment

LIFECYCLE INVESTING strategiesProfessor Michael Drew SF FinManaging Director, Lifecycle Strategies, QIC

Innovations in Asset Allocation
Allocation strategy in a dynamic investment environment
Finsia workshopsJune 2011

28
DisclaimerQIC Limited ACN 130 539 123 (“QIC”) is a wholesale funds manager and its products and services are not directly available to retail investors. QIC is a company government owned corporation constituted under the Queensland Investment Corporation Act 1991 (Qld). QIC is regulated by State Government legislation pertaining to government owned corporations in addition to the Corporations Act 2001 (“Corporations Act”). QIC does not hold an Australian financial services (“AFS”) licence and certain provisions (including the financial product disclosure provisions) of the Corporations Act do not apply to QIC. Please note however that some wholly owned subsidiaries of QIC have been issued with an AFS licence and are required to comply with the Corporations Act. QIC Lifecycle Strategies is a business division of QIC.QIC, its subsidiaries, associated entities, their directors, employees and representatives (“the QIC Parties”) do not warrant the accuracy or completeness of the information contained in this document (“the Information”). To the extent permitted by law, the QIC Parties disclaim all responsibility and liability for any loss or damage of any nature whatsoever which may be suffered by any person directly or indirectly through relying on the Information, whether that loss or damage is caused by any fault or negligence of the QIC Parties or otherwise. The Information is not intended to constitute advice and persons should seek professional advice before relying on the Information. Copyright QIC Limited, Australia 2011. All rights are reserved. Do not copy, disseminate or use, except in accordance with the prior written consent of QIC.
29
QIC Lifecycle Strategies
QIC Lifecycle Strategies works with superannuation funds to develop and
manage sophisticated investment solutions and lifecycle programs for the sole
purpose of improving the retirement outcomes of defined contribution (DC)
members.
Our customised solutions allow trustees to deliver tailored outcomes for their
members based on their investment horizon.

30
Lifecycle Strategies key beliefs

31
The problem (1) –Members aren’t always long-term investors
• Investing for the long term does not reduce the probability of experiencing a loss in any one year
• Therefore, the probable range of outcomes widens as a member’s investment horizon shortens.

32
The problem (1) –History isn’t kind when timeframes are finite
• History shows that, in their final year, a 40-year investor has a:• 42% chance of not achieving a 7.5% return • 24% chance of falling short of CPI+3%• 14% chance of a negative return
• This is interesting, but doesn’t factor in the dollars (portfolio size) against this return.Source: QIC Lifecycle Strategies

33
The problem (1) illustrated
• One version of reality … a 25% drawdown five years from retirement destroys up to 1.5 times a member’s lifetime contributions to superannuation and reduces their annuity income by one-third. This situation was the lived experience for some super fund members in 2008/09.
$1,493,608
$1,071,515(-28% impact)
-$2,000,000
-$1,500,000
-$1,000,000
-$500,000
$0
$500,000
$1,000,000
$1,500,000
$2,000,000
40 38 36 34 32 30 28 26 24 22 20 18 16 14 12 10 8 6 4 2 0 2 4 6 8 10 12 14 16 18 20 22 24 26 28 30
Base case - Accumulation (7.5% p.a.) Base case - Decumulation (4.5% p.a.)
Drawdown 1 - Accumulation (-25%, year 35) Drawdown 1 - Decumulation (-25%, year 35)

34
The problem (2) –The portfolio size effect
• It’s what you do when the largest amount of money is at risk that matters
• Due to this size effect, a member’s final investment outcomes become more sensitive to asset allocation in later years relative to early years
• Switching to less volatile assets before retirement can lessen the impact of severe stock market downturns
• can be justified only when the accumulation at the point of switch exceeds the target set by the Fund
Source: Basu, A. and Drew, M.E. (2009) Portfolio Size Effect in Retirement Accounts:
What Does It Imply for Lifecycle Asset Allocation Funds, Journal of Portfolio
Management, 35:3, 61-72.

35
So, are target date funds the solution?
Equities
Bonds
Cash
0%
10%
20%
30%
40%
50%
60%
70%
80%
90%
100%
40 35 30 25 20 15 10 5 0 5 10 15 20 25 30
Years to Retirement
Stylised asset alloction of XYZ Target Date Fund
Years Post Retirement

36
Issues with 1st generation target date funds
• The proponents of 1st generation target date strategies cite the convenience to members of putting their investing activities on autopilot
• However, the GFC has reminded us that:
- what's safe and what’s risky changes as you move through life
- sequencing risk impacts differently in savings years versus spending years
- negative compounding matters!
• Unlike the ‘auto-pilot’ or static approach, QIC's approach to lifecycle investing is dynamic:
- The riskiness (or otherwise) of the glidepath is informed (among other things) by the extent to which the members' retirement wealth accumulation objective has been achieved
37
So, is switching between MIC options the solution?
• Superannuation funds already have ‘target risk’ member investment choice (MIC) options available for
members
• Some funds already have a ‘partial lifecycle’ strategy that moves members from one MIC option to
another at set birthdays
• Our modelling shows that these strategies have the potential to expose members to unintended risks
- essentially require the planets to perfectly align 2, 3 or 4 times in a members’ life, at the exact time
de-risking takes place
• Most funds employ active managers and dynamic asset allocation strategies, so why be deterministic
in designing a glidepath?

38
The solution
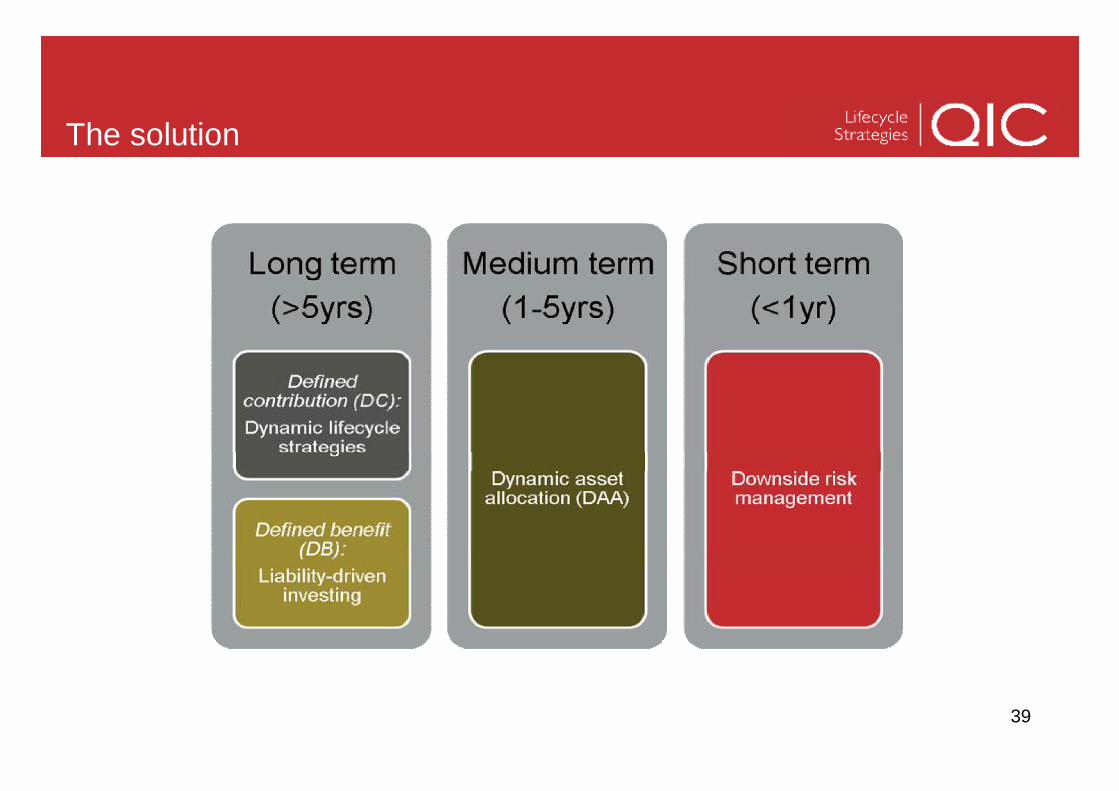
39
The solution

40
Our solution – The Lifecycle Completion Portfolio
• The QIC Lifecycle Completion Portfolio takes the form of an overlay
• This allows the superannuation/pension fund to manage (or complete) the competing investment horizons of:
- the superannuation fund’s long-term investment portfolio, and - the finite investment horizons of members
• QIC Lifecycle Strategies analyses the investment objectives set for every member cohort by the trustees to identify the most appropriate glidepath from a return, risk, and constraint perspective
• This frees the CEO/CIO (and their advisers) from the burden of managing competing retirement horizons of members
- concentrates their efforts on constructing and managing the core investment portfolio over a long-time horizon

41
The Completion Portfolio in practice

42
Lifecycle Strategies investment process

43
Lifecycle Strategies glidepath design

44
Implementation
Optimal glidepath
Implementation via ...
Completion Portfolio
construction
CompletionPortfolio
management
Glidepath to client/
delegate
Receivedata
Performance and risk
monitoring
Todesignphase
Performance reporting to
client
QICLifecycle
Strategies
Client or
delegate
Multiple implementation paths

45
Dynamic lifecycle solutions
Key steps:
• Analyse membership cohorts
• In consultation with the Trustees - determine objectives appropriate to membership
• Design customised asset allocation glide path:
• Take account of portfolio size effect, market conditions, and objectives
• Incorporate downside protection as relevant
• Manage asset allocation dynamically
• Review glide path periodically (e.g. monthly) versus objectives and adjust as necessary

46
Case study excerpt – results comparison
Weighting DLC2050
Weigh ted
S core TDF 2050
Weigh ted
S core B a lanced
Weigh ted
S core 100% Equ ities
Weigh ted
S core
Retirem ent Wea lth Ratio
Mean 5% 6 0.3 3 0.2 3 0.2 7 0.4
Median 18% 6 1.1 3 0.5 3 0.5 7 1.3
Maximum 1% 6 0.1 3 0.0 3 0.0 7 0.1
Minimum 1% 3 0.0 7 0.1 6 0.1 3 0.0
Quartile 1 5% 6 0.3 3 0.2 3 0.2 3 0.2
Quartile 3 5% 6 0.3 3 0.2 3 0.2 3 0.2
Coefficient of Variation 5% 3 0.2 6 0.3 6 0.3 2 0.1
Interquartile range ratio 5% 3 0.2 6 0.3 6 0.3 2 0.1
TOTAL 45% 2.4 1.7 1.7 2.2
Downside Risk a nd P erform ance M ea sures
LPM0 (Probability of Shortfall) 17% 6 1.0 2 0.3 2 0.3 5 0.9
LPM1 (Expected Shortfall) 20% 7 1.4 3 0.6 2 0.4 5 1.0
LPM2 (Downside Semi-variance) 1% 6 0.1 5 0.1 3 0.0 2 0.0
Sortino Ratio (SR) 1% 6 0.1 3 0.0 3 0.0 7 0.1
Upside Potential Ratio (UPR) 1% 6 0.1 3 0.0 3 0.0 7 0.1
TOTAL 40% 2.6 1.1 0.8 2.0
Ta i l R isk Estim ates
Value-at-Risk (VaR) 10% 8 0.8 4 0.4 3 0.3 5 0.5
Expected Tail Loss (ETL) 5% 6 0.3 7 0.4 5 0.3 2 0.1
TOTAL 15% 1.1 0.8 0.6 0.6
Defau lt Option S u itab i l i ty Ra ting * 6.1 3.5 3.1 4.8
*Maximum Score = 9.0 DLC2050 TDF 2050 B a la nced 100% Equ ities
Recom m end
Rankings (1-9)

47
Comparing alternative default designs
Target Risk (with DAA)
Age-based MIC Switch
Target Date Fund
Dynamic Lifecycle Strategy
Ability to take account of assets outside of super û û û û
Provide adequate retirement savings if market conditions are generally bad û û û û
Age / time to retirement considered in asset allocation û ü ü ü
Market conditions considered before a change to asset allocation ü û û ü
Protection strategies offered during transition phase û û û ü
Strategy customised to the characteristics of the funds cohort membership û û û ü

Thanks .....
Questions?

CASE STUDY: ASSET ALLOCATION – A PRACTICAL examplePaul Chin F FinSenior Investment Analyst, Investment Strategy and Research Group, Vanguard Investments Australia

FINSIA Conference: Innovations in Asset Allocation
Current reflections on Asset Allocation (including a Case Study)
Sydney, Australia: Tuesday 7th June 2011Melbourne, Australia: Thursday 9th June 2011
Paul W. ChinSenior Investment AnalystInvestment Strategy & Research GroupInvestments Team (Asia-Pacific)

> 51 Confidential
Agenda
1. Constructing portfolios: topical issues
2. Asset Allocation: revisiting key themes
3. A Case Study:
n Vanguard Diversified Funds’asset allocation

> 52 Confidential
1. Constructing portfolios: topical issues

> 53 Confidential
Individual Investors:- Investor behaviour: left to their own devices (U.S.)
-50%
-40%
-30%
-20%
-10%
0%
10%
20%
30%
40%
50%
1990
1991
1992
1993
1994
1995
1996
1997
1998
1999
2000
2001
2002
2003
2004
2005
2006
2007
2008
2009
1999Equities: $160b inflowsBonds: $2b inflows
2000Equities: $262b inflowsBonds: $48b outflows
2001Equities: $70b inflowsBonds: $81b inflows
2002Equities: $37b inflowsBonds: $148b inflows
Stocks outperform
Bonds outperform
2006–2007Equities: $464b inflowsBonds: $182b inflows
2009Equities: $40b outflowsBonds: $398b inflows
Rolling 12-month excess returns: Dow Jones U.S. Total Stock Market Index versus Barclays Capital Aggregate Bond Index
Date label as of 31 December for each year.Stock returns use the Dow Jones U.S. Total Stock Market Index from 1990 through April 22, 2005 and the MSCI US Broad Market Index thereafter. Bonds consist of the Barclays Capital U.S. Aggregate Bond Index. Sources: Vanguard Investment Strategy Group and Strategic Insight.

> 54 Confidential
Financial Planning (intermediated advice): - A value chain under pressure
Financial Advice Industry Margins
Total costs need to reduce in area of
0.5 – 1.0%
Regulators Investors
Investment Managers Platforms Dealer
GroupsAdvice
Businesses
Value proposition changes; impacts to portfolio constructionValue proposition changes; impacts to portfolio construction

> 55 Confidential
Some other major Asset Allocation trends- Portfolio construction challenges still exist
n Defined Benefit challenges (e.g. GFC & impact on funding levels, regulatory):
– é to FI, ê in EQ allocations– Rise of alternative investments & riskier
assets: PE/VC, commodities, infrastructure, absolute return, structured, alternative/systematic betas
n Intermediated/Individual: ‘value for services’ top of mind:
– Use of indexing in portfolios– Rapid growth of ETFs
n A rise in the number of Asset Classes used
n A focus on liabilitiesn A growth in types (and
complexity) of derivatives
“May you live in interesting times…”

> 56 Confidential
Building policy portfolios…- Perspectives of different investors
StrategicAsset
Allocation
ModelledLiabilities
Surplus, given acceptable risk level
- Aus Equities
- Intl Equities- Listed Property
- Bonds
- Aus Equities
- Intl Equities
- Listed Property
- Bonds- Cash
Focus: AA is tailored to meet liabilities & maximise the surplus given acceptable risk level
Focus: earning the highest level of return for a given acceptable risk level
StrategicAsset
Allocation
n Define investor’s return requirement
n Identify current wealth position
n List investment constraints
Source: Vanguard (stylised)

> 57 Confidential
Common issues in investing/Asset Allocation (AA)- Expecting a perfect AA leads to disappointment
n The temptation to respond to market dynamics is high
– Regret minimisation– Overconfidence – Aversion to ambiguity– Loss Aversion
Are you succumbing to the effects of behavioural finance?
Source: Kahneman and Tversky (1979)
Pleasure
Pain
GainLoss+$50
-$50

> 58 Confidential
Core Portfolio Construction principles haven’t changed
n Perhaps a ‘New Normal’ in economic terms
n Strategic Asset Allocation ≠ “buy & hold” or “set & forget”
n The underlying premises of portfolio construction remains highly relevant– Expectations in return, risk, correlation periodically– Funding needs/liabilities may have changed– Risk management is gaining prominence– Rebalancing within tolerances– Taxation, costs and fees
Be mindful of constantly responding to short-term market dynamics
> 59 Confidential
2. Asset Allocation: revisiting key themes

> 60 Confidential
What do you see in this picture?
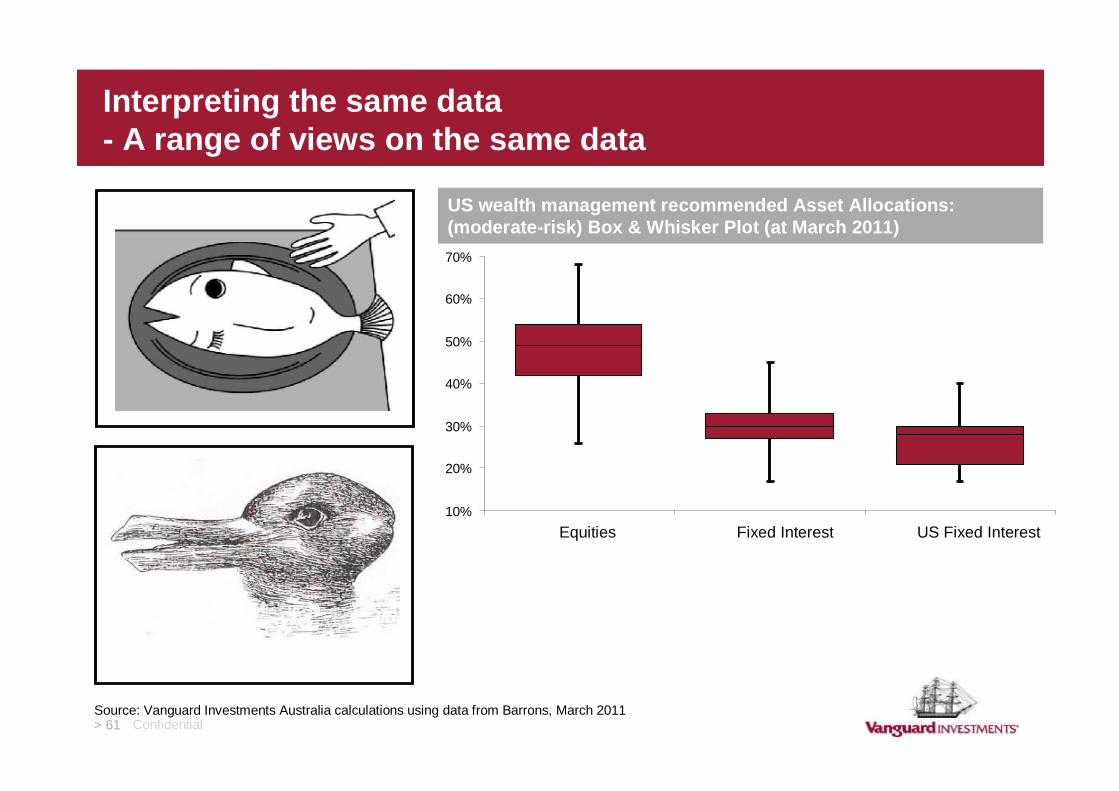
> 61 Confidential
10%
20%
30%
40%
50%
60%
70%
Equities Fixed Interest US Fixed Interest
Interpreting the same data- A range of views on the same data
Source: Vanguard Investments Australia calculations using data from Barrons, March 2011
US wealth management recommended Asset Allocations: (moderate-risk) Box & Whisker Plot (at March 2011)

> 62 Confidential
Dynamic Asset Allocation- Getting the timing, magnitude & direction right…
Ratings houses silent on Japan fund fallout
World’s largest bond investor PIMCO dumps U.S. Treasuries
- The Guardian UK, 11 April 2011
- Bloomberg, 12 May 2011
Global Equities…the average super fund on Morningstar’s database had a 23.2% weighting to Japan (vs a Feb-11 index weight of 10.4%).
Global Equities…the average super fund on Morningstar’s database had a 23.2% weighting to Japan (vs a Feb-11 index weight of 10.4%).
Currencies & Commodities…head of Toscafund hedge fund Dr Savouri predicts the AUD could keep climbing, reaching $US1.30 by 2013 & $US1.70 by 2014.
Currencies & Commodities…head of Toscafund hedge fund Dr Savouri predicts the AUD could keep climbing, reaching $US1.30 by 2013 & $US1.70 by 2014.
Fixed Interest…strategies range from reducing longest-dated holdings and shifting to higher-yielding corporate debt, to investing in stocks, commodities & non-U.S. bonds...
Fixed Interest…strategies range from reducing longest-dated holdings and shifting to higher-yielding corporate debt, to investing in stocks, commodities & non-U.S. bonds...
Aussie dollar will rise further, expert predicts
- Financial Standard, 13 May 2011
Fidelity says yields may stay low, conflicting with PIMCO
RBA dismisses commodity price bubble talk
- The Age, 26 May 2011
- Financial Standard, 15 March 2011

> 63 Confidential
The body of notable research on Asset Allocation
Brinson et al. (1986) 91 Pension Funds 1974-1983 93.6% 112% n.a.
Brinson et al. (1991) 82 Pension Funds 1978-1987 91.5% 101% n.a.
Ibbotson & Kaplan (1991)
58 Pension Funds 1993-1997 88.0% 99% 35%
94 US Balanced Funds 1988-1998 81.4% 104% 40%
Drobetz & Kohler (2002)
51 German & Swiss balanced funds 1995-2001 82.9% 134% 65%
Vanguard (2003)420 US Balanced Funds 1962-2001 76.6% 114% n.a.
66 US Balanced Funds Bear markets 69.4% 100% n.a.
VanguardTokat et al. (2006) 227 US Balanced funds 1966-2003 81.6% 122% 19%
Vanguard Davis et al. (2007) 189 US Balanced funds 1966-2006 82.1% 108% 20%
Researcher Data Set Period
Effect on Total Return Variability: Ave time series R2
AvePolicy Return / Ave
Actual Return
Effect ondifferences inTotal Returnsacross funds:
cross sectional R2

> 64 Confidential
Some forthcoming Vanguard research (2011)
n In Australia…n Over 80% of the variability of monthly
returns can be explained by the variability of the fund’s policy benchmark
n Funds detracted from their performance and increased their volatility relative to their Asset Allocation policies
n The distribution of alpha is highly skewed: only a small number of funds have been able to generate statistically positive alpha

> 65 Confidential
3. A Case Study: Vanguard Diversified Funds

> 66 Confidential
Building a Strategic Asset Allocation
n Maintain an appropriate policy portfolion Diversify to the maximum possible extentn Hold investment costs to the bare bones minimumn Be realistic with your return expectations

> 67 Confidential
Building a Strategic Asset Allocation:- International Equity hedging considerations
Diversification benefits from unhedged International Equity allocation
R
y = 0.48x + 0.0042 = 0.4
-20%
-15%
-10%
-5%
0%
5%
10%
-20% -15% -10% -5% 0% 5% 10% 15%
Local market return
AUD Hedge Impact Index
Level of hedging needs to consider overall risk minimisation objective – no one clear strategy for equities (unlike global bonds)
Scatter plot of monthly local market returns and return to hedging shows positive relationship
When local returns are negative, the AUD return has tended to be also negative ⇒ mitigates unhedged AUD return
Source: Vanguard team analysis

> 68 Confidential
Building a Strategic Asset Allocation:- Were the changes worthwhile?
-0.05
0.00
0.05
0.10
0.15
0.20
0.25
Dec
-99
Jun-
00
Dec
-00
Jun-
01
Dec
-01
Jun-
02
Dec
-02
Jun-
03
Dec
-03
Jun-
04
Dec
-04
Jun-
05
Dec
-05
Jun-
06
Dec
-06
Jun-
07
Dec
-07
Jun-
08
Dec
-08
Jun-
09
Dec
-09
Jun-
10
Dec
-10
Conservative (30/70)
Balanced (50/50)Growth (70/30)High Growth (90/10)
The positive difference in Sharpe Ratio means greater return per unit of risk
The difference in Sharpe Ratio declined during the GFC as returns dropped rapidly and total risk increased
The Sharpe Ratio ends up higher than original allocation, so changes were worthwhile
Source: Vanguard team analysis
5yr rolling: Sharpe Ratio differentials between original & current allocations

> 69 Confidential
Relative performance

> 70 Confidential
In summary
n Don’t forget the (high) hurdles of costs, taxes and market impacts in assessing investment approaches
n A highly dynamic investing environment: regulatory development, instrument evolution, investor awareness
n Asset Allocation remains important; fundamental investment principles still hold
n Strategic Asset Allocation ≠ “buy & hold” or “set & forget”

> 71 Confidential
Disclosures - General advice warningConnect with Vanguard® > www.vanguard.com.au > 1300 655 102
This presentation contains general information and is intended to assist you. We have not taken anybody's circumstances into account so the information may not be applicable to your circumstances. Before making an investment decision, you should consider your circumstances, whether the information is applicable your situation, and our Product Disclosure Statement (PDS) You can access our PDS at www.vanguard.com.au or by calling 1300 655 102Past performance is not an indication of future performance. Vanguard Investments Australia Ltd (ABN 72 072 881 086 / AFS Licence 227263 / RSE Licence L0001335) (“Vanguard”) is the product issuer. This publication was prepared in good faith and we accept no liability for any errors or omissions. We are the trustee of Vanguard®Personal Superannuation Plan ABN 81 550 468 553.‘Vanguard’, ‘Vanguard Investments’ and the ship logo are the trademarks of The Vanguard Group, Inc.© 2011 Vanguard Investments Australia. All rights reserved.

In summary
> 73 Confidential
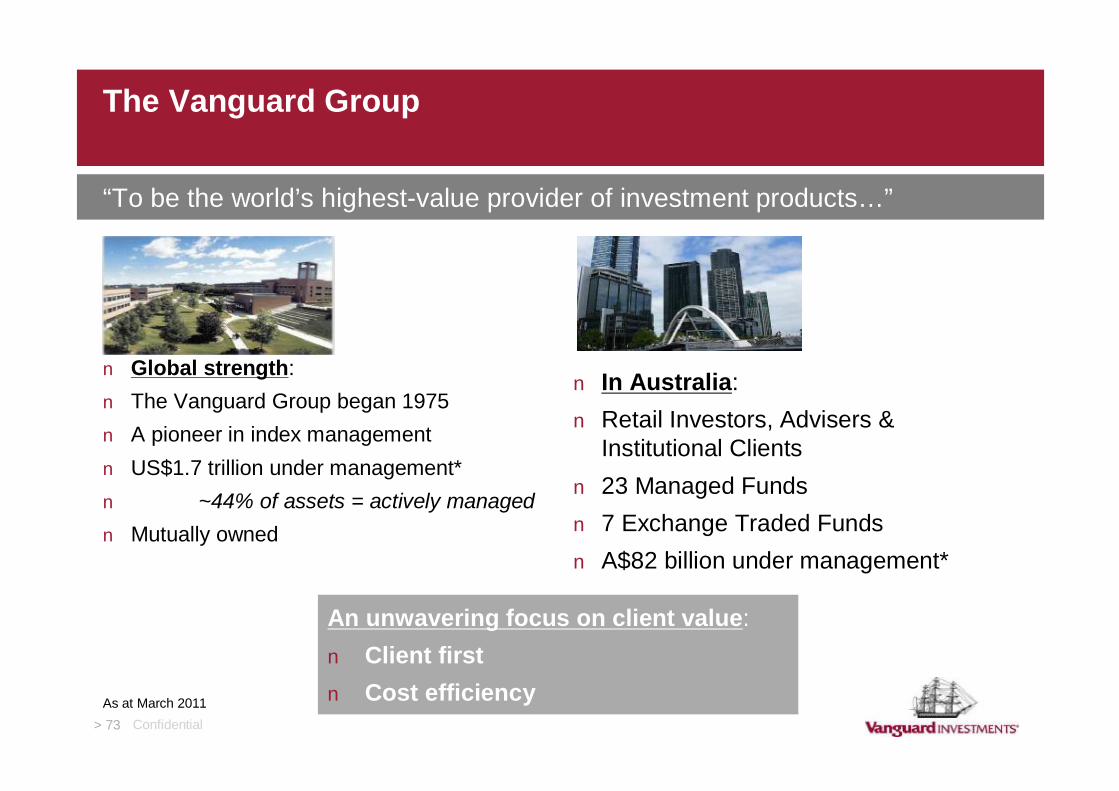
The Vanguard Group
n Global strength:n The Vanguard Group began 1975n A pioneer in index managementn US$1.7 trillion under management*n ~44% of assets = actively managedn Mutually owned
n In Australia:n Retail Investors, Advisers &
Institutional Clientsn 23 Managed Fundsn 7 Exchange Traded Fundsn A$82 billion under management*
“To be the world’s highest-value provider of investment products…”
An unwavering focus on client value:n Client firstn Cost efficiencyAs at March 2011

> 74 Confidential
Paul Chin, F FinSenior Investment AnalystInvestment Strategy & Research Group, Investments (Asia-Pacific)
Paul is responsible for providing investment thought-leadership and research for Vanguard Investments as a member of the global investment research effort. He originally joined Vanguard to head the firm’s Research & Technical Services Group, overseeing the retail thought-leadership agenda, researcher and platform relationships and delivering portfolio construction analytics for advisers.
Prior to joining Vanguard, Paul worked with Barclays Global Investors (now Blackrock) in San Francisco, USA for over 7 years, most recently as principal, portfolio manager. In this money management role, he managed asset allocation, global macro and currency hedged strategies. Before that, he worked with Advance FM (including fund manager incubator, Ascalon Capital Managers) and Colonial First State Investments in product development and institutional client-facing roles across Australia and Asia-Pacific.
He has previously served as Director/Vice-President of the Australian-American Chamber of Commerce, played First Grade cricket in Victoria and represented Barclays in the 2004/05 Global Challenge Round the World Yacht Race. Paul holds a Masters in Applied Finance & Investments (Finsia) and a Bachelors of Commerce (Monash). He is a Fellow of the Financial Services Institute of Australasia, sits on the Finsia Regional Council for Vic/Tas and occasionally lectures in the Asia-Pacific region in the areas of portfolio management, traditional and alternative investments.
Vanguard professional biographies


