1
Fiscal Policy Management in ThailandFiscal Policy Management in ThailandFiscal Analysis and Forecasting Workshop
Bangkok, ThailandJune 16 – 27, 2014
Wuttipong Jittungsakul
ConsultantConsultant
IMF-TAOLAM training activities are supported by funding of the Government of Japan
CONTENT
Fiscal Policy Management
Revenue Forecasting
Expenditure Formulationp
Cash and Debt Management
Fiscal Sustainability

2
Fiscal Policy Management
Counter Cyclical Fiscal Policy
GDP growthContraction fiscal policy slowing economy down
coping overheat
Expansionary fiscal policy dealing with
economic downturn in order to stimulate
economy
time
order to stimulate economy
3
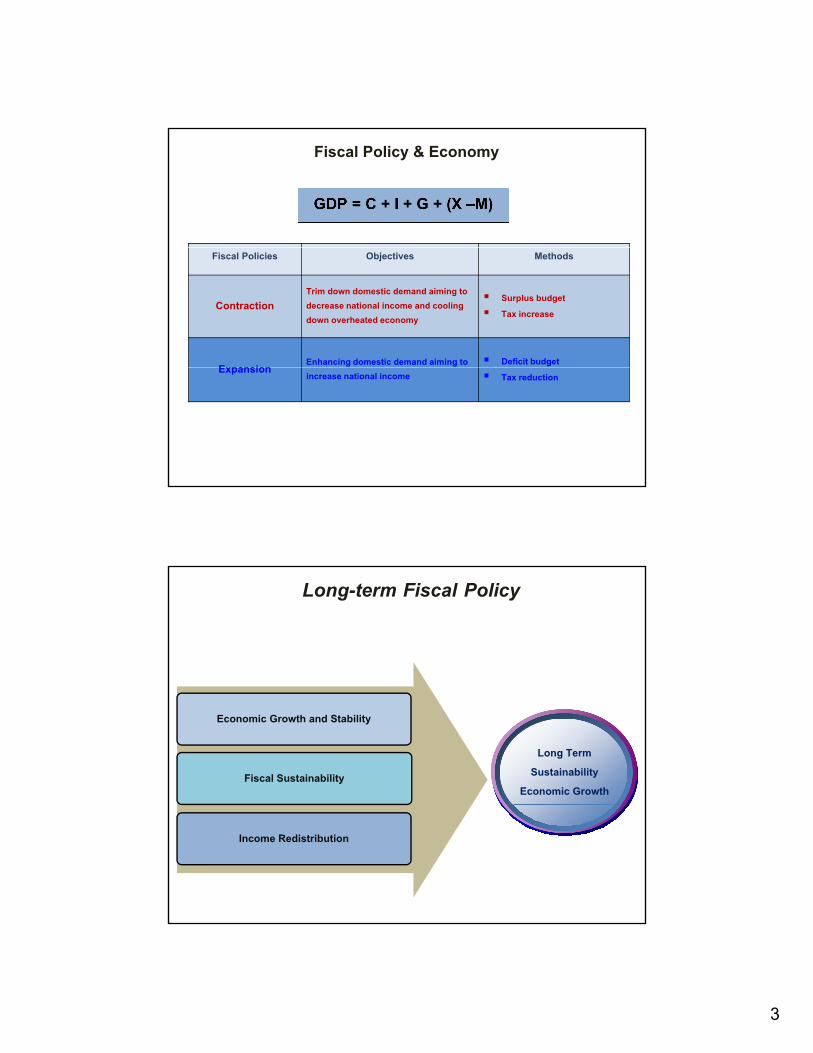
Fiscal Policy & Economy
Fiscal Policies Objectives Methods
ContractionTrim down domestic demand aiming to decrease national income and cooling down overheated economy
Surplus budget Tax increase
Expansion Enhancing domestic demand aiming to Deficit budgetExpansion increase national income Tax reduction
Long-term Fiscal Policy
Economic Growth and Stability
Fiscal Sustainability
Long Term Sustainability
Economic Growth
Income Redistribution

4
Fiscal Policy Design(Expansion/Contraction/Neutral)
Budget Policy
Fiscal Policy Framework
Budget Preparation
Budget Adoption
Budget Execution
Budgetary Disbursement
Treasury ReserveAccount #1 Account #2
(Receipt) (Disbursement)
(Balance/Deficit/Surplus)Receipt
Budgetary Receipt
Non-Budgetary Receipt
Non-budgetary
Reaction from economy and social through fiscal policy
Public G&S
Economy & SocialReaction from economy and social through fiscal policy
Revenue Forecasting

5
GDP = C + I + G + (X - M)
GDP & Taxation
Revenue Base- Personal Income Tax- Corporate Income Tax- Petroleum Income Tax
Consumption Base- VAT- Specific business tax- Stamp Duty- Excise Tax
International Trade Base - Import - Export
Upturn Economy Increasing Revenue Trend Downturn Economy Decreasing Revenue Trend
Source Categories
Revenue Policies
Revenue Management
Revenue Department
Personal Income Tax, Corporate Income Tax, Petroleum Tax, Value Added Tax, Specific Business Tax, Stamp Duty
Excise Department
Oil, Tobacco, Liquor, Beer, Automobile, Beverage, Electrical appliances, Motorcycle, Battery
Custom Import Duty, Export Duty
Department
SOE SOE-Remittance Dividend
Others Mining-royalty Petroleum-royalty Licensing Fees and Others

6
90%
100%
Revenue Structure
90% of revenue collection come from 3 main collected departments 90% of revenue collection come from 3 main collected departments
20 3%
69.6% 67.8% 63.3% 68.3% 68.8% 68.8%
30%
40%
50%
60%
70%
80%
90%Revenue
Department
Excise Department
Custom
4.2% 5.0% 7.0% 4.6% 4.8% 5.9%5.5% 5.2% 4.6% 4.5% 5.2% 4.0%5.4% 4.8% 4.9% 4.6% 5.1% 4.4%
15.2% 17.3% 20.3%18.0% 16.1% 16.9%
0%
10%
20%Department
SOE
Others2008 2009 2010 2011 2012 2013
Categories 2008 2009 2010 2011 2012 2013
Personal Income Tax 11.2 11.8 10.4 10.6 11.3 11.6
Percent
Revenue Structure
Corporate Income Tax 25.1 23.3 22.7 25.8 23.1 23.0
Value Added Tax 27.4 25.6 25.1 26.0 28.0 27.2
Excise Department 15.1 17.3 20.3 18.0 16.1 16.8
Import Duty 5.3 4.6 4.7 4.5 4.9 4.3
SOE 5.5 5.1 4.6 4.4 5.2 4.2
Treasury Department 0.3 0.2 0.2 0.2 0.2 0.3
Other Government Agencies 4.2 5.0 7.0 4.6 4.8 5.9
Others 5.9 7.1 5.0 5.9 6.4 6.7
Total 100.0 100.0 100.0 100.0 100.0 100.0

7
16.1% 17.4% 16.5% 15.6% 16.5% 16.9%
80%
90%
100%
Revenue Department Collected Structure
Personal Income Tax
39.5% 37.9% 39.7% 38.1% 40.8% 39.6%
5.8% 8.0% 5.3% 5.4% 5.8% 6.4%
36.1% 34.4% 35.9% 37.9% 33.7% 33.6%
20%
30%
40%
50%
60%
70%
80% Consumption Basis
VAT:largest proportion
Revenue BasisPIT: Stable proportionCIT: Diminishing proportion
Consumption Basis VAT:largest proportion
Revenue BasisPIT: Stable proportionCIT: Diminishing proportion
Corporate Income Tax
Petroleum Tax
Value Added Tax
2.0% 1.6% 1.8% 2.3% 2.5% 2.8%0%
10% due to 2011 Flood and CIT rate deduction on 2012due to 2011 Flood and CIT rate deduction on 2012
Specific Business Tax
Stamp Duty2008 2009 2010 2011 2012 2013
24.2%31 3% 29.5%
16.1% 14.7%90%
100%
Excise Department Collected Structure
Petroleum Tax
13.2% 13.0%10.4% 12.2% 14.1% 12.2%
15.0% 15.1%13.2% 14.3%
15.8% 15.7%
20.8%16.9%
19.0%23.2%
30.9% 35.5%
31.3% 37.7%
20%
30%
40%
50%
60%
70%
80%
Tobacco Tax
Automobile Tax
Liquor Tax
Petroleum Diminishing in proportion due to diesel tax cut policy
AutomobileIncrease in proportion resulting from first time car buyer policyLiquor & Tobacco Gradually increase in
19.2% 16.8% 14.5% 15.4% 17.1% 16.0%0%
10%
2551 2552 2553 2554 2555 2556 Others
Beer Taxproportion since August 2012 from hiking collection rate
2008 2009 2010 2011 2012 2013

8
90%
100%
Custom Department Collected Structure
97.3% 96.1% 96.3% 97.2% 97.8% 97.6%
20%
30%
40%
50%
60%
70%
80%
98 % came from import duty
98 % came from import duty
2.2% 3.4% 3.6% 2.6% 2.0% 2.2%0%
10%
2551 2552 2553 2554 2555 2556
อากรขาเข้า อากรขาออก รายได้อ่ืนๆ
2008 2009 2010 2011 2012 2013
Import Tariff Export Tariff Others
FY 2014 Revenue Projection
Revenue projection on FY 2014 is expected be 2.275 Trillion BHT higher than FY 2013 by 175,000 million BHT (8.3%), 17.2% for the revenue to GDP ratio
Estimated Revenue Changes OverAssumptions1. Economy - GDP 4.5
- Inflation 3.2 % - Nominal GDP 7.7 %
2. Include tax restructuring resulting in revenue loss for 49,900 million BHT - CIT cut (22,500 million BHT) - Restructuring PIT (25,000 million BHT)
2013 2014 Amount %
1. The Revenue Department 1,774,000 1,890,550 116,550 6.6
2. The Excise Department 412,000 463,700 51,700 12.5
3. The Customs Department 115,900 131,800 15,900 13.7
4. Total from 3 Department 2,301,900 2,486,050 184,150 8.0
5. State Enterprises 100,000 116,000 16,000 16.0 - First time home buyer policy (2,400 million BHT)
p , , ,
6.Others 109,100 116,250 7,150 6.6
7. Total (Gross) 2,511,000 2,718,300 207,300 8.3
8. Deduct 411,000 443,300 32,300 7.9
9. Total (Net) 2,100,000 2,275,000 175,000 8.3

9
Economic Assumptions
Revenue Projection Preparation
Involved Factors
Previous collected data
Selected Method
Real GDP Growth
Revenue Projection Assumptions
Inflation
Export growth
Consumption growth
Exchange rate
World Oil Price
Bank Deposit Bank Deposit
Interest Rate

10
1 Effective Tax Rate : ETR
Revenue Analysis
Tax revenue1. Effective Tax Rate : ETR Tax Base
2. Tax Buoyancy Percentage change in taxation
Percentage change in GDP
3. Revenue/GDP
Revenue to GDP will be in line with economic expansion.
Economic expansion has resulted hiking in revenue to GDP, vice versa.
R /GDP(FY)
Revenue / GDP Correlation
17.915.7 15.415.5 15.415.9 16.817.518.317.4 17.416.9 15.917.2
17.7 18.217.7
12.014.016.018.020.0
Revenue/GDP (FY)%
4.21-0.71 -1.27
5.26 5.19 4.79 8.13 9.35 9.48 11.26 7.82 10.17-3.23
12.10 7.54 1.8411.22
-10.00.0
10.020.0
/775 /776 /777 0. . . 0. ./ 0. .0 0. .1 0. .2 0. .3 0. .4 0. .5 0. .6 0. .7 0./. 0.// 0./0 2013 (F)
%GDP(FY)

11
Expenditure Formulation
Expenditure
• Budget formulation process accordance to The Budget Procedure Act B E 2502 (A D 1959)
Methedology Design suitable budget structure to current economic situation and built
up fiscal space for new fiscal policy
Macro & Micro Concerns
Procedure Act B.E. 2502 (A.D.1959)• Annual Budget ACT
Macro & Micro Concerns Macro: optimize budget structure under the concern of long-term fiscal
discipline, economic objectives, and sustainable growth
Micro: the main concerns cover necessity, public services, income redistribution, and improving quality of life

12
Expenditure
• Budget Structure: Current economic and fiscal situations, response to government policies
Key concern on Budget Structure
• Current Expenditure: Efficiency and sufficiency
• Principle Repayment: Fiscal discipline and management efficiency
• Capital Expenditure: Prioritize capital expenditure by considering country strategy and readiness of implementing agencies
Budget Analysis MethodologyBudget Analysis Methodology
Macro view on budgeting under the concern of off-budget financing; loans, external funding
I li ith ti l l & t t i In line with national plans & strategies
Equally distribution
Avoid operational replicate
Value for money and Economic value
Proceeding continue projects
24
Absorptive Capacity

13
Agencies
MinistriesOperating
Personal
Budget Classification
Budget Allocation
Economic Classification
Departments
Public Agencies
SOEs
Others
Investments
Subsidies and Grants
Public Organizations
Current
Capital
Principle repayment
Treasury Reserve Repayment25
Central Fund
Revolving Funds
3000000
Budget Structure FY 2002 - 2013
Million Baht
1500000
2000000
2500000
Total Budget
Capital Expenditure
Current Expenditure
สาํนักงบประมาณ
0
500000
1000000
2002 2003 2004 2005 2006 2007 2008 2009 2010 2011 2012 2013

14
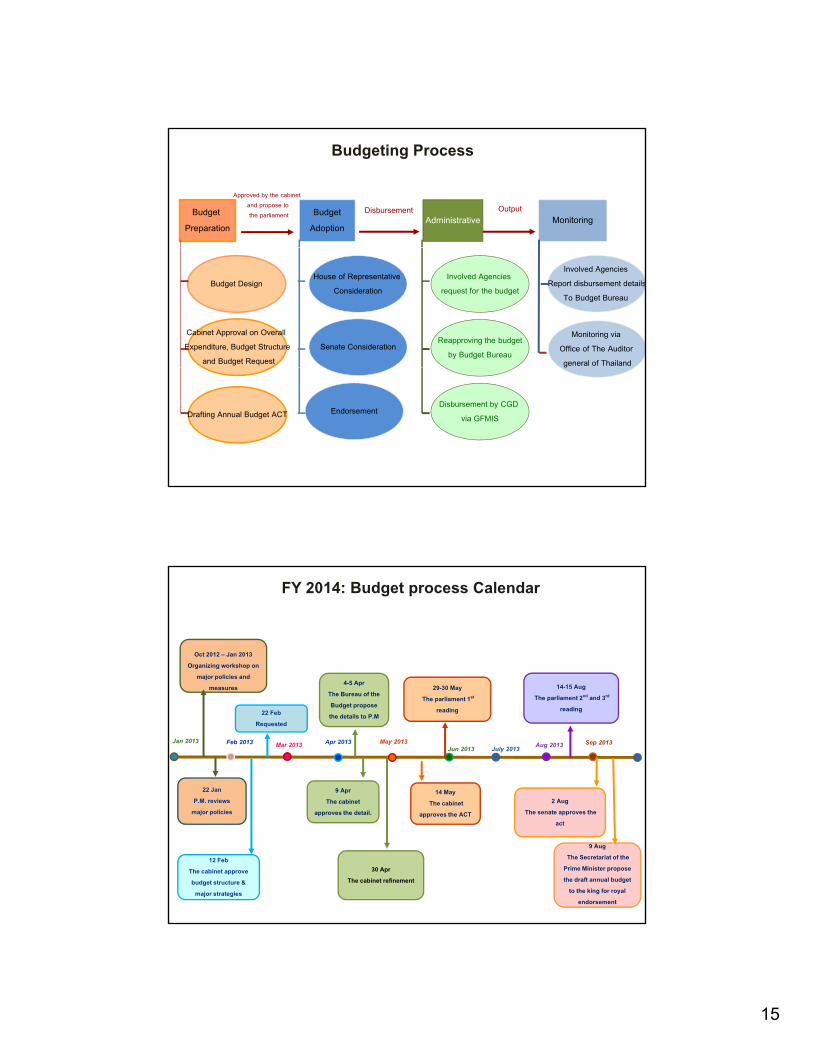
Budgeting Process
Revenue Projection: MOF
Working Committee on Tracking Revenue Collection Bank of Thailand
Budget Preparation
Budget Bureau
National Economic and Social Development Board (NESDB)
Revenue Department, Excise Department, Custom Department, Treasury Department, State Enterprise Policy Office, Fiscal Policy Office (Committee Secretariat)
Budget Planning: 4 Main Economic agencies MOF
Bank of Thailand
Budget Bureau
NESDB
15
Budget Preparation
BudgetAdoption
Administrative Monitoring
Approved by the cabinet and propose tothe parliament Disbursement Output
Budgeting Process
Budget Design
Cabinet Approval on Overall Expenditure, Budget Structure
and Budget Request
House of Representative Consideration
Senate Consideration
Involved Agencies request for the budget
Reapproving the budgetby Budget Bureau
Involved Agencies Report disbursement details
To Budget Bureau
Monitoring via Office of The Auditor general of Thailand
Drafting Annual Budget ACT EndorsementDisbursement by CGD
via GFMIS
g
14 15 A
FY 2014: Budget process Calendar
Oct 2012 – Jan 2013Organizing workshop on
major policies and 4-5 Apr
Feb 2013 Apr 2013 May 2013
22 FebRequested
14 MayThe cabinet
29-30 MayThe parliament 1st
reading
14-15 AugThe parliament 2nd and 3rd
reading
2 Aug
ก.ค.55 Aug 2013 Sep 2013Mar 2013
22 JanP.M. reviews
measures pThe Bureau of the Budget propose the details to P.M
Jun 2013 July 2013Jan 2013
9 AprThe cabinet
30 AprThe cabinet refinement
The cabinet approves the ACT The senate approves the
act
9 AugThe Secretariat of the
Prime Minister propose the draft annual budget
to the king for royal endorsement
major policies
12 FebThe cabinet approve budget structure &
major strategies
approves the detail.

16
Budget Structure FY 2014
Budget Strategies for 2014 BudgetBudget Strategies for 2014 Budget
Fiscal sustainability concern
Enhancing Disbursement Efficiency
Shaping Agencies Strategies to be in line with National Social and Economic Policies; AEC, Urgent Issues etc
Both of Budgetary and Off-budgetary projects has been analyze together under the concern of projects linkage
Tailoring Policies to Serve Local Necessities; social equality, improve quality of life
32
Review and reallocate budget from less necessary project to more necessary and urgent Project under the Budget Framework
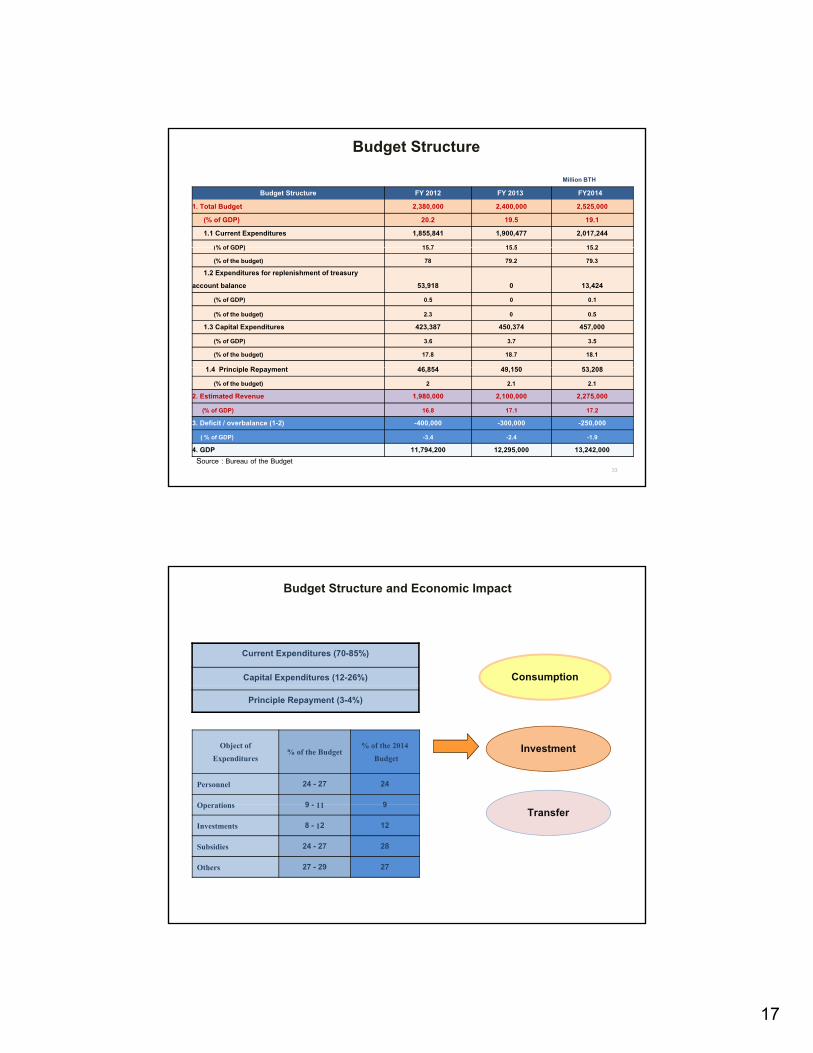
17
Budget Structure FY 2012 FY 2013 FY2014 1. Total Budget 2,380,000 2,400,000 2,525,000 (% of GDP) 20.2 19.5 19.1 1.1 Current Expenditures 1,855,841 1,900,477 2,017,244 (% of GDP) 15 7 15 5 15 2
Budget StructureMillion BTH
(% of GDP) 15.7 15.5 15.2
(% of the budget) 78 79.2 79.3 1.2 Expenditures for replenishment of treasury account balance 53,918 0 13,424 (% of GDP) 0.5 0 0.1
(% of the budget) 2.3 0 0.5 1.3 Capital Expenditures 423,387 450,374 457,000 (% of GDP) 3.6 3.7 3.5
(% of the budget) 17.8 18.7 18.1
1 4 P i i l R t 46 854 49 150 53 208
Source : Bureau of the Budget 33
1.4 Principle Repayment 46,854 49,150 53,208 (% of the budget) 2 2.1 2.12. Estimated Revenue 1,980,000 2,100,000 2,275,000 (% of GDP) 16.8 17.1 17.23. Deficit / overbalance (1-2) -400,000 -300,000 -250,000 ( % of GDP) -3.4 -2.4 -1.94. GDP 11,794,200 12,295,000 13,242,000
Budget Structure and Economic Impact
Current Expenditures (70-85%)
Capital Expenditures (12-26%) Consumption
Principle Repayment (3-4%)
Object of Expenditures % of the Budget % of the 2014
Budget
Personnel 24 - 27 24
Operations 9 - 11 9
Investment
TransferOperations 9 - 11 9
Investments 8 - 12 12
Subsidies 24 - 27 28
Others 27 - 29 27

18
FY Budget Expenditure(Million BTH)
Current Year Disbursement
(% of the budget)
Carry over Budget Disbursement
(% of the total budget)
2007 1 566 200 0 1 466 915 2 112 594 6
Actual Expenditures FY 2007-2013
2007 1,566,200.0 1,466,915.2(93.6)
112,594.6(7.2)
2008 1,660,000.0 1,541,847.5(91.2)
140,947.5(8.5)
2009 1,951,700.0 1,771,446.4(90.8)
183,692.9(9.4)
2010 1,700,000.0 1,663,095.4(97.8)
102,636.8(6.0)
2011 2,169,967.5 2,056,352.1(94.8)
157,631.6(7.3)
2012 2,380,000.0 2,148,475(90.3)
146,852 (7.5)
2013 2400,000.0 2,171,459.5(90.5)
231,022.0(9.6)
Cash Management
19
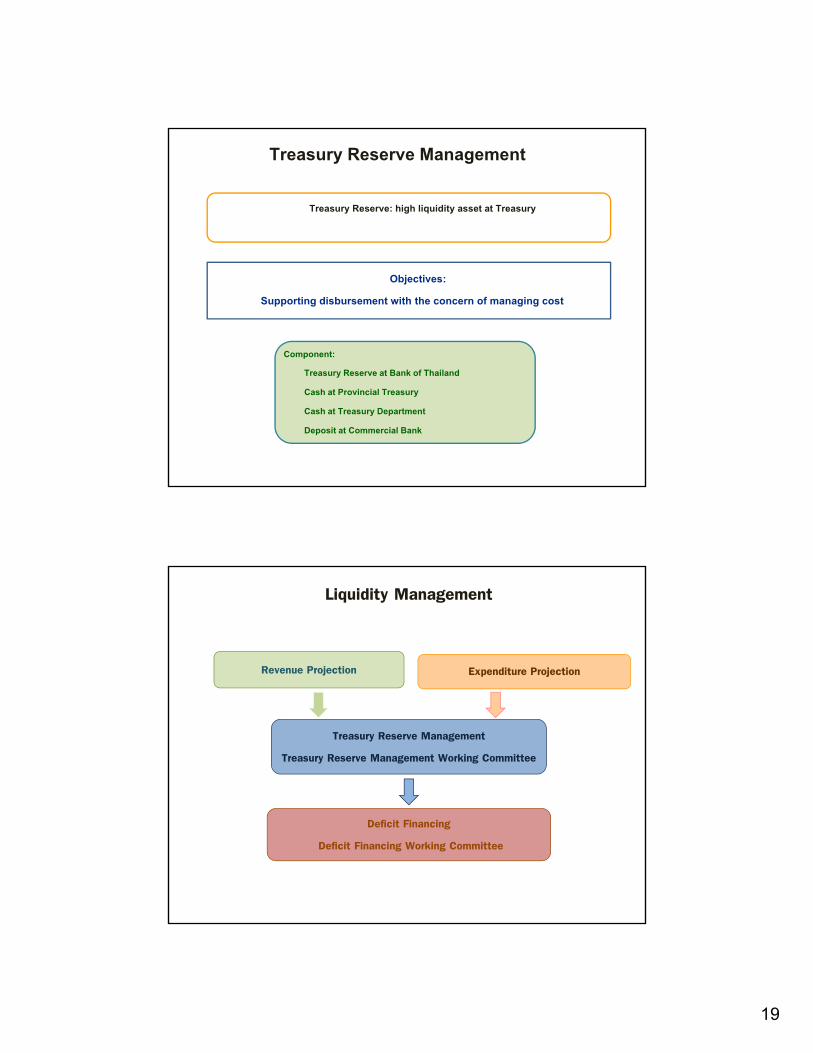
Treasury Reserve Management
Treasury Reserve: high liquidity asset at Treasury
Objectives: Supporting disbursement with the concern of managing cost
Component:Treasury Reserve at Bank of Thailand
Cash at Provincial Treasury
Cash at Treasury Department
Deposit at Commercial Bank
Liquidity Management
Revenue Projection Expenditure Projection
Treasury Reserve Management
Treasury Reserve Management Working Committee
Deficit Financing
Deficit Financing Working Committee

20
Public Debt Management
Public Debt Management Act, B.E. 2548 (2005) Component
Direct Government Debt
Public Debt
Non-financial SOE Debt Financial SOE Debt (Government Guarantee) Financial Institutions Development Fund (FIDF)
PDMO has been in charge with debt obligation and management

21
Budget deficit financing in domestic currency
Fiscal DisciplinePublic Debt Management Act, B.E. 2548 (2005)
+ 20% of annual budget and supplementary 80% of principle repayment
Raise loan in foreign currency not exceed 10% of annual budget with an aim for economic and social development
Guarantee loans shall not exceed 20% of annual budget and supplementary budget
+ 20% of annual budget and supplementary budget
80% of principle repayment budget
Debt Obligation & Management
T-bill : Short-term (less than 1 year)
Promissory Note: Medium term ( 1 5 years) D ti Fi i Obligation
Debt Reconstruction
Promissory Note: Medium-term ( 1- 5 years)
Government Bond : Long-term (more than 3 years) Domestic Financing
Foreign Financing
PREPAY
REFINANCE
ROLL OVER
22
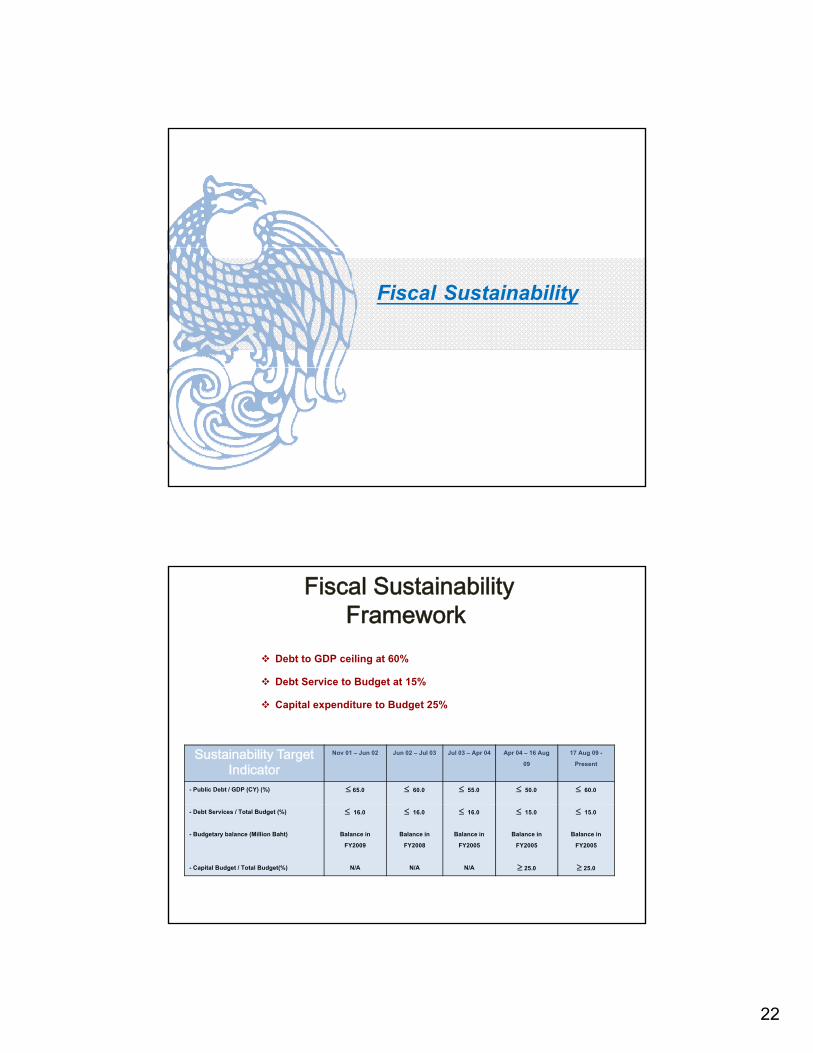
Fiscal Sustainability
Fiscal Sustainability Framework
Debt to GDP ceiling at 60%
Debt Service to Budget at 15%
Sustainability Target Indicator
Nov 01 – Jun 02 Jun 02 – Jul 03 Jul 03 – Apr 04 Apr 04 – 16 Aug 09
17 Aug 09 - Present
- Public Debt / GDP (CY) (%)
65.0 60.0 55.0 50.0 60.0
Debt Service to Budget at 15%
Capital expenditure to Budget 25%
- Debt Services / Total Budget (%)
- Budgetary balance (Million Baht)
- Capital Budget / Total Budget(%)
16.0
Balance in FY2009
N/A
16.0
Balance in FY2008
N/A
16.0
Balance in FY2005
N/A
15.0
Balance in FY2005
25.0
15.0
Balance in FY2005
25.0
23
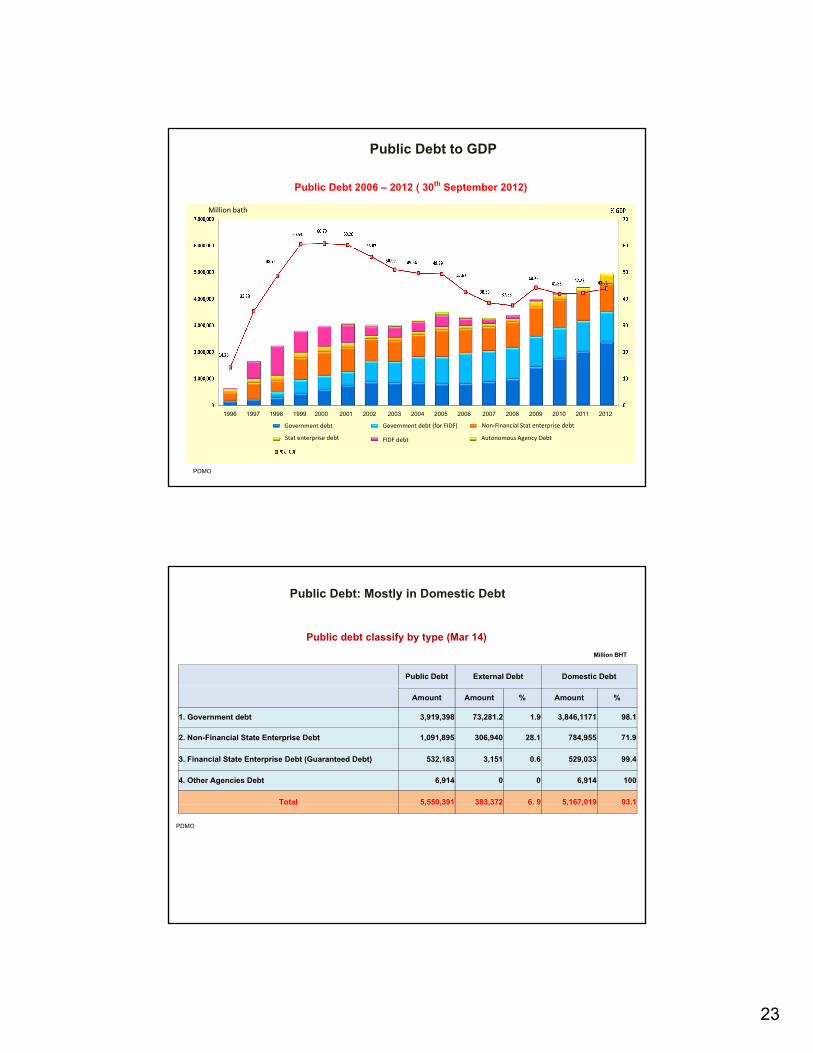
Public Debt to GDP
Public Debt 2006 – 2012 ( 30th September 2012)Million bath
Government debt
Stat enterprise debt FIDF debt
Government debt (for FIDF) Non-Financial Stat enterprise debt
Autonomous Agency Debt
1996 1997 1998 1999 2000 2001 2002 2003 2004 2005 2006 2007 2008 2009 2010 2011 2012
PDMO
Public Debt: Mostly in Domestic Debt
Public Debt External Debt Domestic Debt
Million BHT
Public debt classify by type (Mar 14)
Amount Amount % Amount %
1. Government debt 3,919,398 73,281.2 1.9 3,846,1171 98.1
2. Non-Financial State Enterprise Debt 1,091,895 306,940 28.1 784,955 71.9
3. Financial State Enterprise Debt (Guaranteed Debt) 532,183 3,151 0.6 529,033 99.4
4. Other Agencies Debt 6,914 0 0 6,914 100
Total 5,550,391 383,372 6. 9 5,167,019 93.1 , , , , ,
PDMO

24
Public Debt: LT-debt is the majority
Public debt classify by maturities (Mar 14)
Public Debt LT-debt ST-debt
Amount Amount % Amount %
Million BHT
Amount Amount % Amount %
1. Government debt 3,919,398 3,828,398 97.7 91,000 2.3
2. Non-Financial State Enterprise Debt 1,091,895 1,065,687 97.6 26,208 2.4
3. Financial State Enterprise Debt (Guaranteed Debt) 532,183 527,721 99.2 4,462 0.8
4. Other Agencies Debt 6,914 6914 100.0 - -
Total 5,550,391 5,422,470 98.0 107,895 2.0
PDMO
(Draft) Public Finance Act.• Enhance fiscal discipline and transparency• Fiscal Discipline: major issues
• Government’s duty to implement fiscal policy effectively and take i t t th i t bilit d t i bilit into account the economic stability and sustainability
• Government to conduct medium term fiscal plan (3 years) with annual revision
• Government must take into account all fiscal burden• Any revenue from government agencies that will not be submitted to
the treasury must be authorized by separate Act/Regulations• Other issues covering revenue, expenditure, budget formulation, g , p , g ,
debt, cash and asset management

25
Fiscal Risk
Fiscal Risk from Operation
Economic
Current Fiscal Risk
Medium-term Fiscal Risk
Infrastructure BalanceBalance
Revenue Expenditure
Economic Fluctuation
Infrastructure Development
BalanceBudget
BalanceBudget
50
Capital

26
Fiscal Risk
SFIs
SOEGovernment
LAO
Extra-budgetary
Fund


