
Flood of September 13–16, 2008, in Northeastern Illinois
Data Series 726
U.S. Department of the InteriorU.S. Geological Survey

Cover. Snowplows attempting to push accumulated rainfall off the Tarmac at O’Hare International Airport, Chicago, Illinois, September 14, 2008. Photograph used with permission of David Lastrucci, ALPI U.S.A. Inc.
Flood of September 13–16, 2008, in Northeastern Illinois
By David J. Fazio and Jennifer B. Sharpe
Data Series 726
U.S. Department of the InteriorU.S. Geological Survey

U.S. Department of the InteriorKEN SALAZAR, Secretary
U.S. Geological SurveyMarcia K. McNutt, Director
U.S. Geological Survey, Reston, Virginia: 2012
For more information on the USGS—the Federal source for science about the Earth, its natural and living resources, natural hazards, and the environment, visit http://www.usgs.gov or call 1–888–ASK–USGS.
For an overview of USGS information products, including maps, imagery, and publications, visit http://www.usgs.gov/pubprod
To order this and other USGS information products, visit http://store.usgs.gov
Any use of trade, product, or firm names is for descriptive purposes only and does not imply endorsement by the U.S. Government.
Although this report is in the public domain, permission must be secured from the individual copyright owners to reproduce any copyrighted materials contained within this report.
Suggested citation:Fazio, D.J., and Sharpe, J.B., 2012, Flood of September 13–16, 2008, in northeastern Illinois: U.S. Geological Survey Data Series 726, 40 p., at http://pubs.usgs.gov/ds/726/.

iii
Acknowledgments
This report presents a compilation of information supplied by many agencies and individuals. The authors would like to thank the Illinois Department of Natural Resources–Office of Water Resources (IDNR-OWR) and the Metropolitan Water Reclamation District of Greater Chicago (MWRDGC) for their work in measuring the elevation of the set high-water marks. The authors also acknowledge the many personnel in the U.S. Geological Survey (USGS)–Illinois Water Science Center who took streamflow measurements during the flooding and identified and flagged the high-water marks after the floodwaters had subsided.
The authors acknowledge Bonnie Stich of the USGS–Office of Communications and Publishing for her timely and thorough editorial review of the report, and Pamela Lombard, Gary Johnson, and Jon Hortness of the USGS for their timely and thorough review of technical aspects of this report. Lastly, the authors acknowledge Tom Over, Audrey Ishii, and Kelly Warner of the USGS for their guidance throughout this study.

This page has been left blank intentionally.

v
Contents
Abstract ...........................................................................................................................................................1Introduction ....................................................................................................................................................1
Purpose and Scope ..............................................................................................................................1Storm and Flood of September 13–16, 2008, in Northeastern Illinois ....................................................4
Flood-Peak Water-Surface Profiles ...................................................................................................4Flood Damages and Impacts ..............................................................................................................5
Summary........................................................................................................................................................22References Cited..........................................................................................................................................22Glossary .........................................................................................................................................................24Appendix 1. High-Water Mark Site Description and Elevation at Select Stream Reaches,
Flood of September 2008, Northeastern Illinois ........................................................................26Appendix 2. Example High-Water Mark Documentation Field Sheet, Flood of September
2008, Northeastern Illinois ............................................................................................................36Appendix 3. Flood-Peak Water-Surface Profiles at Select Stream Reaches, Flood of
September 2008, Northeastern Illinois .......................................................................................37
Figures 1. Map of flood and high-flow conditions in the United States as measured by
U.S. Geological Survey streamflow-gaging stations on September 14, 2008 .....................2 2. Map of study area showing locations of select streams, select U.S. Geological
Survey streamgages, and high-water marks from the September 13–16, 2008, flood ......3 3. Map showing Next Generation RADAR (NEXRAD) total storm precipitation during
September 12–14, 2008, in northeastern Illinois ......................................................................7 4. Graph showing cumulative precipitation during September 3–14, 2008, for select
rain gages in northeastern Illinois .............................................................................................8 5. Photographs of selected high-water marks in October 2008 ..............................................20 6. Photographs of the Elmhurst Quarry Flood Control Facility, DuPage County, Illinois .....21 7. Photogragh of passenger jet taxiing to a terminal at O'Hare International Airport,
Chicago, Illinois, September 14, 2008 ......................................................................................21
Tables 1. Rainfall data for a 3-day period at selected rain gages in northeastern Illinois,
September 12–14, 2008 ..............................................................................................................10 2. Flood-peak gage height, peak discharge, and annual exceedance probability of
peak discharge during the flood of September 2008 at selected U.S. Geological Survey streamgages in northeastern Illinois .........................................................................16
3. List of communities, by stream reach, and approximate number of miles where high-water marks were set for the September 13–16, 2008, flood in northeastern Illinois ...................................................................................................................18
4. Counties eligible for individual disaster assistance approved by the Federal Emergency Management Agency and ranked by dollar amount .......................................22

vi
Conversion Factors, Datums, and Abbreviations
Multiply By To obtain
Length
inch (in.) 2.54 centimeter (cm)inch (in.) 25.4 millimeter (mm)foot (ft) 0.3048 meter (m)mile (mi) 1.609 kilometer (km)
Volume
acre foot 1,233 cubic meter (m3)gallon (gal) 3.785 liter (L)gallon (gal) 0.003785 cubic meter (m3)
Flow rate
gallon per minute (gal/min) 0.06309 liter per second (L/s)inch per year (in/yr) 25.4 millimeter per year (mm/yr)
Temperature in degrees Celsius (°C) may be converted to degrees Fahrenheit (°F) as follows:
°F=(1.8×°C)+32
Temperature in degrees Fahrenheit (°F) may be converted to degrees Celsius (°C) as follows:
°C=(°F–32)/1.8
Vertical coordinate information is referenced to the North American Vertical Datum of 1988 (NAVD 88).
Horizontal coordinate information is referenced to the North American Datum of 1983 (NAD 83).
Altitude, as used in this report, refers to distance above the vertical datum.

vii
List of Abbreviations
AEP annual exceedance probabilityCSO combined sewer overflowFEMA Federal Emergency Management Agency FGCS Federal Geodetic Control Subcommittee GIS Geographic Information SystemGNSS Global Navigation Satellite SystemIDNR–OWR Illinois Department of Natural Resources–Office of Water Resources IDOT Illinois Department of TransportationISWS Illinois State Water SurveyKML Keyhole Markup LanguageMWRDGC Metropolitan Water Reclamation District of Greater Chicago NEXRAD Next Generation RADARNGS National Geodetic SurveyNOAA National Oceanic and Atmospheric AdministrationNPDES National Pollutant Discharge Elimination SystemNWS National Weather ServicePFDS Precipitation Frequency Data Server RADAR Radio Detection and RangingTARP Tunnel and Reservoir PlanUSGS U.S. Geological Survey

This page has been left blank intentionally.

Flood of September 13–16, 2008, in Northeastern Illinois
By David J. Fazio and Jennifer B. Sharpe
AbstractMajor flooding occurred in northeastern Illinois during
September 13–16, 2008, following extended storm activity. Rainfall recorded at select Illinois State Water Survey (ISWS), National Weather Service (NWS), and U.S. Geological Survey (USGS) rain gages in northeastern Illinois, ranged from 2.39 to 10.51 inches throughout a 51-hour period during September 12–14, 2008. The rainfall resulted in extensive urban drainage1 and riverine flooding, causing the evacuation of thousands of residents, millions of dollars in damages, hundreds of road closings, and two water-related fatalities in the greater Chicago area. Nine counties in northeastern Illinois (16 counties throughout the State) were declared Federal disaster areas.
USGS streamgages recorded new record-peak streamflows at 13 locations as a result of the heavy rainfall. Four streamgages had a calculated annual exceedance probability (AEP) ranging from 0.2 to 1 percent, and one streamgage had a calculated AEP of less than 0.2 percent. During this flood event, USGS crews made 48 streamflow measurements at 45 streamgages. After the high-water had subsided, USGS crews set 230 high-water marks in over 40 communities along 131 miles of streams. The elevations for 117 high-water marks along approximately 100 miles of streams were measured by the Metropolitan Water Reclamation District of Greater Chicago (MWRDGC) and the Illinois Department of Natural Resources–Office of Water Resources (IDNR–OWR). Flood peak water-surface profiles for select streams are plotted from the high-water mark data.
Introduction During September 13 and 14, 2008, heavy rains caused
severe flooding in several Midwestern States (fig. 1). The U.S. Geological Survey (USGS) Illinois Water Science Center responded to this flood event as part of its mission to provide
1Bolded terms (or close variants thereof) are defined in the glossary near the end of the report.
scientific, unbiased information about the Nation’s rivers and streams. To meet critical needs for real-time streamflow data during the September 2008 flood event, USGS personnel were mobilized to the areas of flooding in order to make direct streamflow measurements and maintain the operational readiness of the streamgages (See Activities Log at http://il.water.usgs.gov/flooddata/viewNews.cgi?date=20080913). USGS personnel collected 48 streamflow measurements at 45 streamgages; 4 additional streamflow measurements were made at 3 ungaged locations, where flooding was particularly severe. After the floodwaters receded, high-water marks were set in 12 drainage basins in northeastern Illinois (fig. 2). Of these drainage basins, high-water marks were measured along the following select streams: Des Plaines River, North Branch Chicago River, West Branch DuPage River, East Branch DuPage River, DuPage River, Johnny Run, and Illinois River.
Purpose and Scope
This report summarizes the high-water mark data and presents flood-peak water-surface profiles of select stream reaches during the September 13–16, 2008, flood in northeastern Illinois. This report describes the meteorological conditions leading up to the flood, recorded rainfall, recorded flood-peak gage heights, and the flood-peak discharges with computed annual exceedance probabilities2 (AEPs) at USGS streamgages. The impact and damages of the flood also are summarized.
2 The annual exceedance probability (AEP) is the probability that a given event magnitude will be exceeded or equaled in any given year. For example, the AEP of the 50-year peak-flood streamflow is 0.02. In other words, there is a 2-percent chance that the 50-year peak flow will be exceeded or equaled in any given year. The reciprocal of the AEP is the recurrence interval. The recurrence interval (or return period) is the statistically computed average period of time within which a given event will be equal to or greater than a specified magnitude. This does not imply that an event of a specified magnitude will happen at regular intervals. For example, a 50-year rainfall is the rainfall that would be equal to or greater than the long-term average rainfall of once in 50 years. Two 50-year rainfalls could be experienced in 2 consecutive years (Hodgkins and others, 2007).

2 Flood of September 13–16, 2008, in Northeastern Illinois
Figure 1. Map of flood and high-flow conditions in the United States as measured by U.S. Geological Survey gagingstations on September 14, 2008.
Figure 1. Flood and high-flow conditions in the United States as measured by U.S. Geological Survey streamflow-gaging stations on September 14, 2008.

Introduction 3
Figure 2. Map of study area showing the location of select streams, select U.S. Geological Survey streamgages, and high-water marks fromthe September 13-16, 2008 flood.
#
#
#
#05529000
#
05550500
#05539900
#05540095
#05540130 #05540250
#05540500
#05439000
#
87°30'88°0'88°30'
42°30'
42°0'
41°30'Will
LakeMcHenry
Boone
Cook
La Salle
KaneDe Kalb
Kankakee
Grundy
DuPage
Kendall
Lake Michigan
0 20 MILES10
0 20 KILOMETERS10
Chicago
Joliet
Aurora
Elgin
Naperville
Bartlett
Bolingbrook
DeKalb
Sycamore
Glenview
Plainfield
NilesDes Plaines
Morris
West Chicago
Lansing
Channahon
Roselle
Yorkville
Carol Stream
Mount Prospect
Minooka
Hanover Park
Oak ParkForest Park
Wilmington
River Grove
Albany Park
Winfield
Melrose ParkRiver Forest
Genoa
Mazon
Prospect Heights
Rosemont
Park Ridge
Schiller Park
Elmwood Park
RiversideLyons
South Holland
Calumet City
Stone Park
Woodridge
Northlake
Bellwood
Warrenville
Shorewood
Des P
laines
Illinois
River
River
Riv
er
River
Riv
er
River
River
Rive
r
Fox
DuP
age
DuP
age
Salt Creek
North B
ranch Chicago
W. B
r.
E. B
r.
Johnny R
un
Addison Cr.
ILLINOIS
MapArea
S. B
ranc
hK
ishw
auke
e
Poplar Cre
ek
Kankakee EXPLANATION
# U.S. Geological Survey streamflow-gaging station with identifier
High-water mark location
05550500
E. Br. S. Br.
Harvey
Thornton
Brookfield
Broadview
Franklin ParkElmhurst Quarry
Willmette
T.J. O’BrienLock
ChicagoRiverControllingWorks
MaywoodElburn
Old EdgebrookSouth EdgebrookO’Hare
Airport
05532000
05532500
05536000
05536105
Northbrook
Little Calumet R.
!!!!!!!!!!!!
!!
!!!!!
!
!!
!
!
!
!
!
!
!
!
!
!
!!
!!!!
!
!!!!!!!!
!
!!!!!!!!!!!!!!!!!
!!
!!
!!!!!!!!!!!!
!!!!
!
!!!!!!!
!! !
!
!!
!!
!!
!!!
! !
!
!
!!
!
!!!!
!!!
!!
!!!!!
!!!!!!!!!!!!!!!!!!!!!!!!!!!!!!!!!!!!!!!
!
!!!!!
!
!
!
!!!
!!
!
!!!!
!
!!!!!
!!!
!!!!!
!!!!
!!!
!!!
!
!!!!!!!!!! !
!!
!!!!!!!!!!
!!
Hebron
05530990#
St. Louis
Figure 2. Locations of select streams, select U.S. Geological Survey streamgages, and high-water marks from the September 13–16, 2008, flood.

4 Flood of September 13–16, 2008, in Northeastern Illinois
Storm and Flood of September 13–16, 2008, in Northeastern Illinois
Approximately 51 consecutive hours of rainfall (as measured at real-time gages during September 12–14) in northeastern Illinois caused new record flood-peak streamflows at USGS streamgages. Prior to this, Illinois had experienced the wettest January–July on record (Illinois State Water Survey, 2008a). While the August statewide precipitation was 1.4 in. below normal, combined with the above-normal precipitation of the preceding months, the statewide January–August precipitation total was 8.0 in. above normal (Illinois State Water Survey, 2008b).
On September 4th, tropical depression Gustav (an Atlantic storm) tracked northeasterly through central Illinois on a line between St. Louis, Mo. and Kankakee, Ill. As the storm progressed, it became extratropical as it merged with a cold front (Beven and Kimberlain, 2008). The slow, steady movement of this storm produced 1 to 4 in. of rain throughout most of Illinois (Illinois State Water Survey, 2008c). On September 8th, a narrow band of rainfall, greater than 1 in., further saturated northern DuPage and Cook Counties (National Oceanic and Atmospheric Administration, National Climatic Data Center NEXRAD Data Inventory, accessed May 9, 2011, at http://www.ncdc.noaa.gov/nexradinv/). On September 12th, Tropical Depression Lowell (a Pacific storm) merged with a front over the central United States (Berg, 2008). This storm moved across northern Illinois on Saturday, September 13th, generating the heaviest rainfall during the combined 3-day (September 12–14) rainfall event.
At the same time, Hurricane Ike (an Atlantic storm) was downgraded to a tropical depression as it passed through Arkansas into Missouri (Berg, 2009). On Sunday, September 14th, Tropical Depression Ike tracked into Illinois, south of Saint Louis, and merged with the trailing end of the storm that had been fueled by Tropical Depression Lowell (Berg, 2008). The combination of the two storms produced additional rain over large areas of northeastern Illinois, which were already saturated from the previous day of rainfall. Precipitation in La Salle, DeKalb, Kane, DuPage, and Cook Counties was particularly severe with the region’s 3-day Next Generation RADAR (NEXRAD) rainfall total measuring from 1 in. to greater than 10 in. (fig. 3), and the 12-day cumulative precipitation at select USGS rain gages (where the rainfall was most severe) measured as much as 13.68 in. (fig. 4).
Data from USGS, DuPage County, Illinois State Water Survey (ISWS), and National Weather Service (NWS) rain gages corroborate the National Oceanic and Atmospheric Administration (NOAA) NEXRAD data. The measured storm-event totals (precipitation during September 12–September 14) at select rain gages had a range similar to the NEXRAD data. The select rain-gage totals ranged from 2.39 in. at Hebron,
Ill., to 10.51 in. at Elburn, Ill. (table 1). Based on the NOAA Hydrometeorological Design Studies Center Precipitation Frequency Data Server (PFDS), 16 of the 95 select rain gages had an AEP ranging from 1 to 0.5 percent, and 2 rain gages had an AEP ranging from 0.5 to 0.2 percent. The AEP was computed on the basis of the partial-duration series for a 72-hour duration rainfall.
USGS streamgages in northeastern Illinois (with more than 10 years of data) recorded new record flood-peak streamflows at 13 locations (table 2). An AEP ranging from 1 to 2 percent was calculated at four gages; an AEP ranging from 0.2 to 1 percent was calculated at three gages; and an AEP of less than 0.2 percent was calculated at one gage (Salt Creek at Rolling Meadows, USGS station 05530990) (Holmes and others, 2010).
Flood-Peak Water-Surface Profiles
High-water marks are evidence of the highest stage reached by a flood (Benson and Dalrymple, 1967). Two weeks after the September 2008 flood event, high-water marks were identified and flagged (appendix 1) in 43 communities, along 131 mi of 12 streams (table 3). The high-water mark evidence flagged for measurement consisted of the concentrated remains of buoyant material such as seeds, dried grass, polystyrene-foam particles, sticks and debris, or a “line” created as suspended sediment in the water coated submerged objects. Most of the high-water marks were flagged at bridge crossings and parks, as these provided the easiest access to the stream reach. High-water marks often were located on bridge structures, trees, fence posts, sign posts, utility poles, buildings, and electrical housings. High-water marks were flagged with either a blaze of paint or a floodmark disk and flagging. All high-water marks set were described on a field-data sheet (appendix 2) and most high-water marks were photographed (fig. 5). Copies of the field-data sheets, photographs, and a Keyhole Markup Language (KML) file of the high-water mark locations were delivered to Metropolitan Water Reclamation District of Greater Chicago (MWRDGC) and Illinois Department of Natural Resources–Office of Water Resources (IDNR–OWR) for the elevations to be measured using a Global Navigation Satellite System (GNSS) or a digital level.
The elevation survey was conducted during summer 2009. Of the 239 high-water marks set, 121 were surveyed. Surveyed elevations were measured in relation to NAVD 88. The IDNR–OWR surveyed high-water marks set on the DuPage River, West Branch DuPage River, East Branch DuPage River, Johnny Run Creek, and Illinois River. The IDNR–OWR ran levels from National Geodetic Survey (NGS) 1st or 2nd vertical-order bench marks or IDNR–OWR bench marks. IDNR–OWR ran constant level lines the length of the flood area (or “main run”) while measuring to

Storm and Flood of September 13–16, 2008, in Northeastern Illinois 5
established bench marks along the main run. The main run and all measurements to established bench marks was run as a closed-loop survey with errors not exceeding 0.005 inch per mile (L. Woodward, Illinois Department of Natural Resources–Office of Water Resources, written commun., 2011). The MWRDGC contracted with an engineering firm to survey high-water marks on the Des Plaines and North Branch Chicago Rivers. The engineering firm established horizontal and vertical ground control using GNSS technology, which met the specifications of the Federal Geodetic Control Subcommittee (FGCS) Second Order Class One and the accuracy standards in Federal Emergency Management Agency (FEMA) Guidelines and Specifications for Flood Hazard Mapping Partners, Appendix A—Guidance for Aerial Mapping and Surveying, 2003. High-water marks without satellite obstruction were directly measured by a GNSS. High-water marks with satellite obstruction were measured by setting two reference points with a GNSS and measuring to the high-water mark with a total station (J. Kratzer, MetropolitanWater Reclamation District Greater Chicago, written commun., 2011). The MWRDGC contracted with a second engineering firm to survey the high-water marks on the Little Calumet River. These high-water marks were measured to the same standards as the high-water marks measured on the Des Plaines and North Branch Chicago Rivers (M. Rembold, Camp Dresser & McKee, written commun., 2011).
Flood-peak water-surface profiles were produced by plotting high-water mark elevations by river mile. River mile was measured from the mouth of the river and was calculated by a Geographic Information System (GIS) program. The water surface between high-water marks was estimated by linear interpolation, creating an approximation of the actual water surface. High-water mark elevations are referenced to NAVD 88 (appendix 3). Of the 117 surveyed high-water marks, 1 has been annotated as unsuitable for use in the flood-peak water-surface profile.
Flood Damages and Impacts
Excessive rainfall on saturated soils and impervious land surfaces resulted in extensive urban drainage and riverine flooding. The flooding caused the evacuation of thousands of residents (Changnon, 2010); more than $110 million in damages to residences, businesses, infrastructure and crops; five injuries; and 2 drowning fatalities (National Oceanic and Atmospheric Administration, 2008). In DuPage County, the Elmhurst Quarry Flood Control Facility diverted enough water from Salt Creek to fill the 8,300 acre-foot (2.7 billion gal) reservoir (fig. 6) (Illinois Environmental Protection Agency, 2009). In Cook County, the MWRDGC reported the Deep Tunnel, one portion of the Tunnel and Reservoir Plan (TARP), was filled to capacity—7,074 acre-foot (2.305 billion gal)—by 7:30 a.m. on Saturday, September
13th. The TARP is a combination of 109 mi of underground tunnels and two reservoirs designed to capture combined sewer overflow (CSO) and provide overbank flood relief; the TARP has a capacity of 17,660 acre-foot (5.755 billion gal). Prior to reaching the TARP’s capacity, MWRDGC officials reversed the flow of the Chicago River by opening the gate at Wilmette, the T.J. O’Brien lock, and the lock at the Chicago River Controlling Works. The MWRDGC reported that approximately 34,370 acre-foot (11.2 billion gal) of storm water was released into Lake Michigan and 153,400 acre-foot (50 billion gal) into the Des Plains River (E. Staudacher, Metropolitan Water Reclamation District of Greater Chicago, written commun., 2011).
The Illinois Department of Transportation (IDOT) closed 25 roads owing to flooding. IDOT reported another 101 intersections with excessive water, of which 11 were reported impassable. Other road closures included sections of three U.S. interstates; four U.S. highways; and seven Illinois state highways (Illinois Department of Natural Resources—Office of Water Resources, 2008). Floodwater closed two commuter rails and several freight rails for 2 to 3 days (Changnon, 2010). Flight delays at O’Hare International Airport and Midway Airport ranged from 6 to 8 hours (Changnon, 2010). Several feet of water at O’Hare Airport (fig. 7) caused closing of some taxiways and gate areas (National Oceanic and Atmospheric Administration, 2008). For the first time in 74 years, the Brookfield Zoo was closed because of flooded roads, viewing galleries, and exhibits. Lions, bears, and other large carnivores were restricted from their outdoor habitats as it was possible for the animals to swim across the moats inundated with floodwater (Chicago Tribune, 2008). Damage from overbank flooding was particularly severe in the Chicago communities of Morris (Grundy County); Warrenville (DuPage County); (fig. 7) and River Forest, Schiller Park, Des Plaines, and Albany Park (Cook County) (table 2).
On October 3, 2008, President George W. Bush signed Major Disaster Declaration FEMA–1800–DR for Cook, DeKalb, DuPage, Grundy, Kane, LaSalle, and Will Counties, Ill., which qualified these counties to receive public and (or) individual assistance through FEMA. On November 18, 2008, the list was updated to include two additional counties (outside the scope of this report) to receive public and (or) individual assistance, and Kendall County and six other counties (outside the scope of this report) to receive public assistance only (Federal Emergency Management Agency, 2008a). As of December 19, 2008, FEMA had approved more than $69 Million in disaster assistance for residents of Illinois. In the 9 counties approved for individual disaster assistance, more than 26 thousand claims totaling $54 Million were approved (Federal Emergency Management Agency, 2008b). The overwhelming majority of these claims were from Cook County (table 4).

6 Flood of September 13–16, 2008, in Northeastern Illinois
Figu
re 3
. Map
sho
win
g N
ext G
ener
atio
n RA
DAR
(NEX
RAD)
and
rain
gag
e to
tal s
torm
pre
cipi
tatio
n du
ring
Sept
embe
r 12–
14, 2
008,
in n
orth
east
ern
Illin
ois.
!4.08
/R79
EXPL
AN
ATIO
N
Tota
l pre
cipi
tatio
n fo
r Sep
tem
ber 1
2–15
, 200
8, in
inch
es
Rada
r site
Less
than
1
1 to
1.9
9
2 to
2.9
9
3 to
3. 9
9
4 to
4.9
9
5 to
5.9
9
6 to
7.9
9
8 to
9.9
9
10 a
nd g
reat
er
Rain
gag
e w
ith to
tal p
reci
pita
tion
for
Sep
tem
ber 1
2–15
, 200
8, in
inch
es
and
rain
gag
e id
entif
ier
3.25
/R1
9.20
/R2
8.74
/R3
8.50
/R4
8.45
/R5
8.39
/R6
8.32
/R7
8.31
/R8
8.19
/R9
8.19
/R10
8.12
/R11
8.12
/R12
7.84
/R13
7.77
/R147.
69/R
15
7.62
/R17
7.58
/R18
7.31
/R20
7.28
/R21
7.19
/R22
7.09
/R23
6.94
/R24
6.72
/R25
6.67
/R26
6.60
/R27
6.59
/R28
6.58
/R29
6.57
/R30
6.54
/R31
6.39
/R32
6.39
/R33
5.79
/R34
5.78
/R35
5.70
/R36
5.68
/R37
5.54
/R38
5.21
/R39
8.11
/R40
5.98
/R41
4.63
/R42
8.47
/R44
8.37
/R45
8.08
/R46
7.89
/R47
7.09
/R48
7.03
/R49
6.86
/R50
6.69
/R52
6.59
/R53
6.57
/R54
6.19
/R55
6.08
/R56
5.99
/R58
5.88
/R59
5.75
/R60 5.
60/R
61
4.82
/R63
6.89
/R64
5.75
/R65
10.5
1/R6
69.46
/R67
8.74
/R68
7.72
/R697.
08/R
70
7.06
/R71
6.26
/R72
6.63
/R73
6.21
/R74
6.39
/R75
6.10
/R76
5.46
/R77
4.66
/R78
4.08
/R79
5.38
/R80
5.13
/R81
5.99
/R82
5.38
/R83
3.75
/R84
3.06
/R85
3.03
/R86
2.45
/R87
2.39
/R88
8.68
/R89
8.59
/R90
7.44
/R91
6.93
/R92
6.12
/R93
6.11
/R94
5.92
/R95
Wil
l
Coo
k
La
Sal
le
Kan
e
Lak
e
De
Kal
bO
gle
Lee
McH
enry
Kan
kak
ee
Gru
nd
y
Win
neb
ago
Boo
ne
Du
Pag
e
Ken
dal
l
87°3
0'88
°88
°30'
89°
42°3
0'
42°
41°3
0'
Illi
nois
Riv
er
John
ny R
un
River
S. Branch
Kishwaukee
E. B
r. S.
Br.
Riv
er
Fox
Pop
lar
Creek
Salt
Creek
River
Du Page
RiverDu Page
RiverDu PageE. Br.
RiverDes Plaines
North Branch Chicago
River
Littl
e C
alum
et R
.
Lak
e M
ichi
gan
020
MIL
ES10
020
KIL
OMET
ERS
10
7.67
/R16 7.
38/R
198.
73/R
43 Addison C
r.
6.80
/R51
5.30
/R62

Storm and Flood of September 13–16, 2008, in Northeastern Illinois 7
Figu
re 3
. Map
sho
win
g N
ext G
ener
atio
n RA
DAR
(NEX
RAD)
and
rain
gag
e to
tal s
torm
pre
cipi
tatio
n du
ring
Sept
embe
r 12–
14, 2
008,
in n
orth
east
ern
Illin
ois.
!4.08
/R79
EXPL
AN
ATIO
N
Tota
l pre
cipi
tatio
n fo
r Sep
tem
ber 1
2–15
, 200
8, in
inch
es
Rada
r site
Less
than
1
1 to
1.9
9
2 to
2.9
9
3 to
3. 9
9
4 to
4.9
9
5 to
5.9
9
6 to
7.9
9
8 to
9.9
9
10 a
nd g
reat
er
Rain
gag
e w
ith to
tal p
reci
pita
tion
for
Sep
tem
ber 1
2–15
, 200
8, in
inch
es
and
rain
gag
e id
entif
ier
3.25
/R1
9.20
/R2
8.74
/R3
8.50
/R4
8.45
/R5
8.39
/R6
8.32
/R7
8.31
/R8
8.19
/R9
8.19
/R10
8.12
/R11
8.12
/R12
7.84
/R13
7.77
/R147.
69/R
15
7.62
/R17
7.58
/R18
7.31
/R20
7.28
/R21
7.19
/R22
7.09
/R23
6.94
/R24
6.72
/R25
6.67
/R26
6.60
/R27
6.59
/R28
6.58
/R29
6.57
/R30
6.54
/R31
6.39
/R32
6.39
/R33
5.79
/R34
5.78
/R35
5.70
/R36
5.68
/R37
5.54
/R38
5.21
/R39
8.11
/R40
5.98
/R41
4.63
/R42
8.47
/R44
8.37
/R45
8.08
/R46
7.89
/R47
7.09
/R48
7.03
/R49
6.86
/R50
6.69
/R52
6.59
/R53
6.57
/R54
6.19
/R55
6.08
/R56
5.99
/R58
5.88
/R59
5.75
/R60 5.
60/R
61
4.82
/R63
6.89
/R64
5.75
/R65
10.5
1/R6
69.46
/R67
8.74
/R68
7.72
/R697.
08/R
70
7.06
/R71
6.26
/R72
6.63
/R73
6.21
/R74
6.39
/R75
6.10
/R76
5.46
/R77
4.66
/R78
4.08
/R79
5.38
/R80
5.13
/R81
5.99
/R82
5.38
/R83
3.75
/R84
3.06
/R85
3.03
/R86
2.45
/R87
2.39
/R88
8.68
/R89
8.59
/R90
7.44
/R91
6.93
/R92
6.12
/R93
6.11
/R94
5.92
/R95
Wil
l
Coo
k
La
Sal
le
Kan
e
Lak
e
De
Kal
bO
gle
Lee
McH
enry
Kan
kak
ee
Gru
nd
y
Win
neb
ago
Boo
ne
Du
Pag
e
Ken
dal
l
87°3
0'88
°88
°30'
89°
42°3
0'
42°
41°3
0'
Illi
nois
Riv
er
John
ny R
un
River
S. Branch
Kishwaukee
E. B
r. S.
Br.
Riv
er
Fox
Pop
lar
Creek
Salt
Creek
River
Du Page
RiverDu Page
RiverDu PageE. Br.
RiverDes Plaines
North Branch Chicago
River
Littl
e C
alum
et R
.
Lak
e M
ichi
gan
020
MIL
ES10
020
KIL
OMET
ERS
10
7.67
/R16 7.
38/R
198.
73/R
43 Addison C
r.
6.80
/R51
5.30
/R62
Figu
re 3
. N
ext G
ener
atio
n RA
DAR
(NEX
RAD)
tota
l sto
rm p
reci
pita
tion
durin
g Se
ptem
ber 1
2–14
, 200
8, in
nor
thea
ster
n Ill
inoi
s.

8 Flood of September 13–16, 2008, in Northeastern Illinois 8 Flood of September 13–16, 2008, in Northeastern Illinois
0246810121416
9/3/
2008
9/4/
2008
9/5/
2008
9/6/
2008
9/7/
2008
9/8/
2008
9/9/
2008
9/10
/200
89/
11/2
008
9/12
/200
89/
13/2
008
9/14
/200
8
Date
Cumulative precipitation, in inches Figu
re 4
. Gra
ph s
how
ing
cum
ulat
ive
prec
ipita
tion
durin
g Se
ptem
ber 3
--14
, 200
8, fo
r sel
ect r
ain
gage
s in
nor
thea
ster
n Ill
inoi
s.
Salt
Cree
k at
Rol
ling
Mea
dow
s, Il
l. (S
tatio
n nu
mbe
r 055
3099
0, p
oint
R2
on fi
gure
3)
Rain
Gag
e ne
ar C
hica
go H
eigh
ts, I
ll. (S
tatio
n nu
mbe
r 413
1130
8734
2201
, poi
nt R
7 on
figu
re 3
)
O’Ha
re A
irpor
t at C
hica
go, I
ll. (S
tatio
n nu
mbe
r 415
7550
8752
5300
, poi
nt R
13 o
n fig
ure
3)
Woo
d Da
le W
WTF
at W
ood
Dale
, Ill.
(Sta
tion
num
ber 4
1575
1087
5910
00, p
oint
R43
on
figur
e 3)
Caro
l Stre
am W
WTF
at C
arol
Stre
am, I
ll. (S
tatio
n nu
mbe
r 415
4230
8808
1500
, poi
nt R
47 o
n fig
ure
3)
Fear
son
Cree
k ne
ar S
t. Ch
arle
s, Il
l. (S
tatio
n nu
mbe
r 055
5120
0, p
oint
R68
on
figur
e 3)
Mill
Cre
ek n
ear B
atav
ia, I
ll. (S
tatio
n nu
mbe
r 055
5133
0, p
oint
R69
on
figur
e 3)
Figu
re 4
. Cu
mul
ativ
e pr
ecip
itatio
n du
ring
Sept
embe
r 3–1
4, 2
008,
for s
elec
t rai
n ga
ges
in n
orth
east
ern
Illin
ois.

This page has been left blank intentionally.

10 Flood of September 13–16, 2008, in Northeastern Illinois
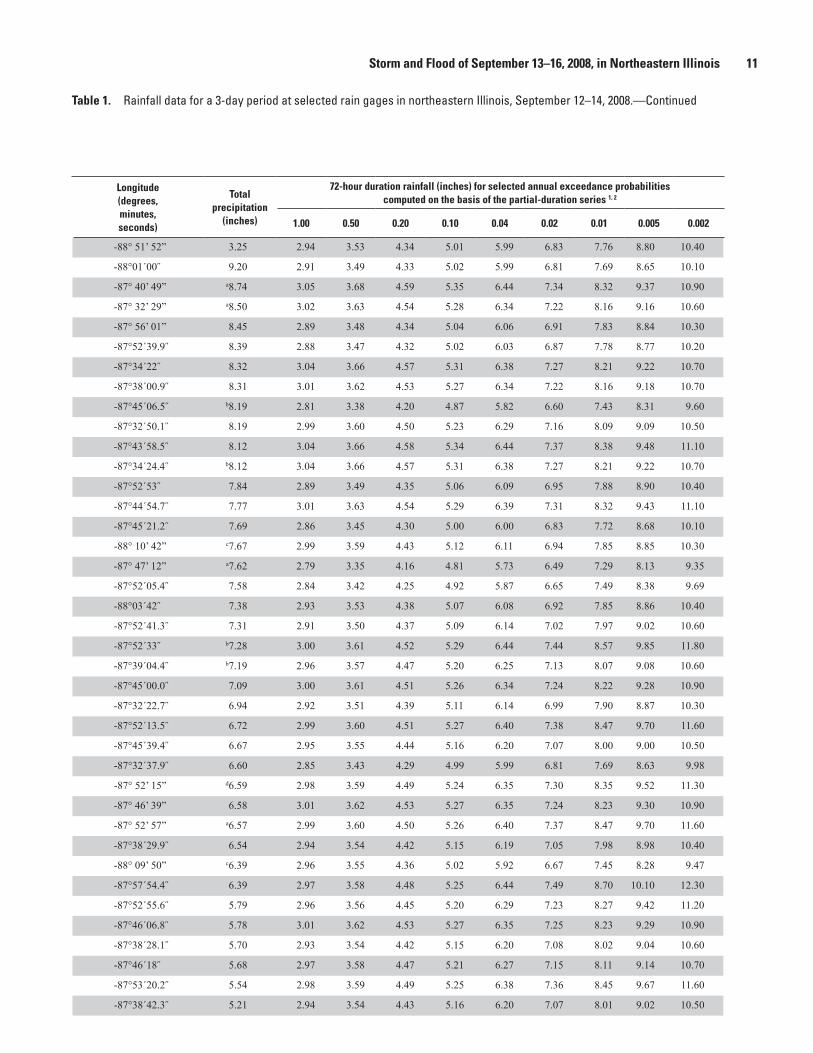
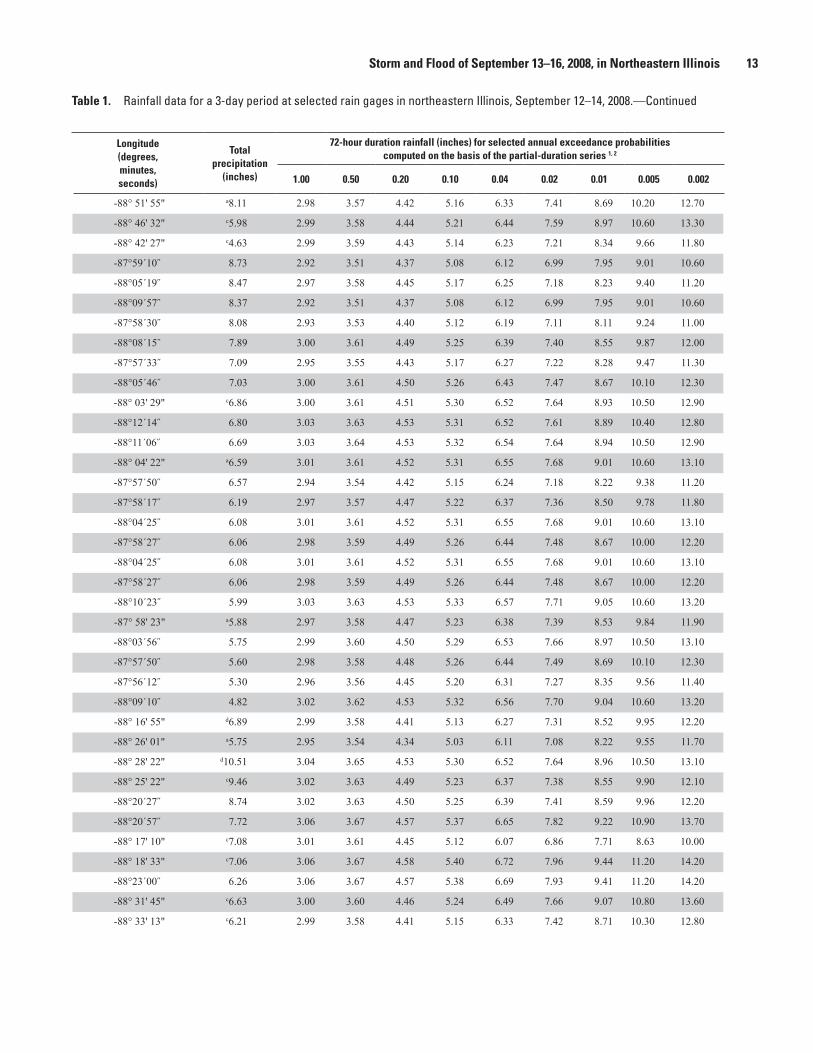
Table 1. Rainfall data for a 3-day period at selected rain gages in northeastern Illinois, September 12–14, 2008.
[USGS, U.S. Geological Survey; AP, airport; GDN, garden; S, south; SE, south east; SSE, south south-east; SW, south west; HSE, house; WWTF, waste water treatment facility; W, west; WSW, west south-west; NE, north east; NW, north west; IS, island; L&D, lock and dam; RD, road; WFO, weather forecast office,]
County
Map reference number (fig. 3)
Agency station number
Agency station nameReporting
agency
Latitude (degrees, minutes, seconds)
Boone R1 110583 Belvidere NWS 42° 15’ 18”
Cook R2 5530990 Salt Creek at Rolling Meadows, IL USGS 42°03΄38˝
R3 116616 Park Forest NWS 41° 29’ 41”
R4 114890 Lansing NWS 41° 32’ 31”
R5 111549 Chicago Ohare AP NWS 41° 59’ 42”
R6 G3 Des Plaines ISWS 42°01΄21.0˝
R7 413113087342201 Rain Gage near Chicago Heights, IL USGS 41°31΄13˝
R8 G22 Harvey ISWS 41°35΄08.4˝
R9 G2 Winnetka ISWS 42°06΄29.2˝
R10 G23 Lansing - Police Department ISWS 41°35΄16.0˝
R11 G24 Matteson - Police Department ISWS 41°31΄04.4˝
R12 G25 Chicago Heights - Big John’s Farm Stand ISWS 41°31΄14.55˝
R13 415755087525300 O’Hare Airport at Chicago, IL USGS 41°57΄55˝
R14 G21 Tinley Park ISWS 41°35΄12.5˝
R15 G4 Village of Skokie ISWS 42°01΄36.2˝
R16 118324 Streamwood NWS 42° 01’ 32”
R17 111497 Chicago Botanical GDN NWS 42° 08’ 26”
R18 G1 Northbrook - Mission Brook Sanitary District ISWS 42°06΄38.85˝
R19 420052088034200 Schaumburg Public Works at Schaumburg, IL USGS 42°00΄52˝
R20 G5 Franklin Park ISWS 41°55΄55.3˝
R21 G20 Orland Park ISWS 41°35΄12.3˝
R22 G18 West 119th Street - Heat Corp. of America ISWS 41°40΄40.9˝
R23 G17 Alsip - Fire Department Station #2 ISWS 41°40΄30.1˝
R24 G19 Avenue O ISWS 41°40΄21.5˝
R25 G16 Palos Park ISWS 41°39΄47.4˝
R26 G6 North Central Chicago, near Belmont ISWS 41°56΄17.0˝
R27 G14 South Water Purification Plant ISWS 41°45΄27.2˝
R28 114816 La Grange NWS 41° 47’ 43”
R29 111577 Chicago Midway AP 3SW NWS 41° 44’ 14”
R30 115110 Little Red School HSE NWS 41° 42’ 56”
R31 G13 Greune Coal Company ISWS 41°45΄30.1˝
R32 110442 Barrington 3SW NWS 42° 06’ 55”
R33 G15 Lemont - Saint Mary’s Seminary ISWS 41°40΄45.9˝
R34 G8 Westchester - Forest Preserve ISWS 41°50΄41.1˝
R35 G12 Near Bedford Park - CP Hall ISWS 41°45΄30.7˝
R36 G10 West 26th Street ISWS 41°50΄42.5˝
R37 G9 Oak Park ISWS 41°52΄20˝
R38 G11 La Grange ISWS 41°45΄31.8˝
R39 G7 Broadway United Methodist Church ISWS 41°56΄35.1˝
Storm and Flood of September 13–16, 2008, in Northeastern Illinois 11
Table 1. Rainfall data for a 3-day period at selected rain gages in northeastern Illinois, September 12–14, 2008.—Continued
Longitude (degrees, minutes, seconds)
Total precipitation
(inches)
72-hour duration rainfall (inches) for selected annual exceedance probabilities computed on the basis of the partial-duration series 1, 2
1.00 0.50 0.20 0.10 0.04 0.02 0.01 0.005 0.002
-88° 51’ 52” 3.25 2.94 3.53 4.34 5.01 5.99 6.83 7.76 8.80 10.40
-88°01΄00˝ 9.20 2.91 3.49 4.33 5.02 5.99 6.81 7.69 8.65 10.10
-87° 40’ 49” a8.74 3.05 3.68 4.59 5.35 6.44 7.34 8.32 9.37 10.90
-87° 32’ 29” a8.50 3.02 3.63 4.54 5.28 6.34 7.22 8.16 9.16 10.60
-87° 56’ 01” 8.45 2.89 3.48 4.34 5.04 6.06 6.91 7.83 8.84 10.30
-87°52΄39.9˝ 8.39 2.88 3.47 4.32 5.02 6.03 6.87 7.78 8.77 10.20
-87°34΄22˝ 8.32 3.04 3.66 4.57 5.31 6.38 7.27 8.21 9.22 10.70
-87°38΄00.9˝ 8.31 3.01 3.62 4.53 5.27 6.34 7.22 8.16 9.18 10.70
-87°45΄06.5˝ b8.19 2.81 3.38 4.20 4.87 5.82 6.60 7.43 8.31 9.60
-87°32΄50.1˝ 8.19 2.99 3.60 4.50 5.23 6.29 7.16 8.09 9.09 10.50
-87°43΄58.5˝ 8.12 3.04 3.66 4.58 5.34 6.44 7.37 8.38 9.48 11.10
-87°34΄24.4˝ b8.12 3.04 3.66 4.57 5.31 6.38 7.27 8.21 9.22 10.70
-87°52΄53˝ 7.84 2.89 3.49 4.35 5.06 6.09 6.95 7.88 8.90 10.40
-87°44΄54.7˝ 7.77 3.01 3.63 4.54 5.29 6.39 7.31 8.32 9.43 11.10
-87°45΄21.2˝ 7.69 2.86 3.45 4.30 5.00 6.00 6.83 7.72 8.68 10.10
-88° 10’ 42” c7.67 2.99 3.59 4.43 5.12 6.11 6.94 7.85 8.85 10.30
-87° 47’ 12” a7.62 2.79 3.35 4.16 4.81 5.73 6.49 7.29 8.13 9.35
-87°52΄05.4˝ 7.58 2.84 3.42 4.25 4.92 5.87 6.65 7.49 8.38 9.69
-88°03΄42˝ 7.38 2.93 3.53 4.38 5.07 6.08 6.92 7.85 8.86 10.40
-87°52΄41.3˝ 7.31 2.91 3.50 4.37 5.09 6.14 7.02 7.97 9.02 10.60
-87°52΄33˝ b7.28 3.00 3.61 4.52 5.29 6.44 7.44 8.57 9.85 11.80
-87°39΄04.4˝ b7.19 2.96 3.57 4.47 5.20 6.25 7.13 8.07 9.08 10.60
-87°45΄00.0˝ 7.09 3.00 3.61 4.51 5.26 6.34 7.24 8.22 9.28 10.90
-87°32΄22.7˝ 6.94 2.92 3.51 4.39 5.11 6.14 6.99 7.90 8.87 10.30
-87°52΄13.5˝ 6.72 2.99 3.60 4.51 5.27 6.40 7.38 8.47 9.70 11.60
-87°45΄39.4˝ 6.67 2.95 3.55 4.44 5.16 6.20 7.07 8.00 9.00 10.50
-87°32΄37.9˝ 6.60 2.85 3.43 4.29 4.99 5.99 6.81 7.69 8.63 9.98
-87° 52’ 15” d6.59 2.98 3.59 4.49 5.24 6.35 7.30 8.35 9.52 11.30
-87° 46’ 39” 6.58 3.01 3.62 4.53 5.27 6.35 7.24 8.23 9.30 10.90
-87° 52’ 57” a6.57 2.99 3.60 4.50 5.26 6.40 7.37 8.47 9.70 11.60
-87°38΄29.9˝ 6.54 2.94 3.54 4.42 5.15 6.19 7.05 7.98 8.98 10.40
-88° 09’ 50” c6.39 2.96 3.55 4.36 5.02 5.92 6.67 7.45 8.28 9.47
-87°57΄54.4˝ 6.39 2.97 3.58 4.48 5.25 6.44 7.49 8.70 10.10 12.30
-87°52΄55.6˝ 5.79 2.96 3.56 4.45 5.20 6.29 7.23 8.27 9.42 11.20
-87°46΄06.8˝ 5.78 3.01 3.62 4.53 5.27 6.35 7.25 8.23 9.29 10.90
-87°38΄28.1˝ 5.70 2.93 3.54 4.42 5.15 6.20 7.08 8.02 9.04 10.60
-87°46΄18˝ 5.68 2.97 3.58 4.47 5.21 6.27 7.15 8.11 9.14 10.70
-87°53΄20.2˝ 5.54 2.98 3.59 4.49 5.25 6.38 7.36 8.45 9.67 11.60
-87°38΄42.3˝ 5.21 2.94 3.54 4.43 5.16 6.20 7.07 8.01 9.02 10.50

12 Flood of September 13–16, 2008, in Northeastern Illinois
Table 1. Rainfall data for a 3-day period at selected rain gages in northeastern Illinois, September 12–14, 2008.—Continued
County
Map reference number (fig. 3)
Agency station number
Agency station nameReporting
agency
Latitude (degrees, minutes, seconds)
DeKalb R40 117833 Shabbona 3S NWS 41° 43' 56"
R41 112223 DeKalb NWS 41° 56' 03"
R42 113392 Genoa 2 SW NWS 42° 04' 28"
DuPage R43 415751087591000 Wood Dale WWTF at Wood Dale, IL USGS 41°57΄51˝
R44 415651088051900 Bloomingdale Lift Station at Bloomingdale, IL USGS 41°56΄51˝
R45 415801088095700 Bartlett WWTF near Bartlett, IL USGS 41°58΄01˝
R46 415518087583000 Addison WWTF at Addison, IL USGS 41°55΄18˝
R47 415423088081500 Carol Stream WWTF at Carol Stream, IL USGS 41°54΄23˝
R48 05531300 Salt Creek at Elmhurst, IL USGS 41°53΄10˝
R49 415300088054600 Wheaton Water Department at Wheaton, IL USGS 41°53΄00˝
R50 113490 Glen Ellyn 4S NWS 41° 49' 36"
R51 05540060 Kress Creek at West Chicago, IL USGS 41°51΄23˝
R52 415037088110600 Blackwell Forest Preserve near Warrenville, IL USGS 41°50΄37˝
R53 115097 Lisle-Morton Arboretum NWS 41° 48' 46"
R54 415356087575000 Elmhurst Quarry at Elmhurst, IL USGS 41°53΄56˝
R55 415037087581700 Oak Brook Well at Oak Brook, IL USGS 41°50΄37˝
R56 414843088042500 Morton Arboretum Near Lisle, IL USGS 41°48΄43˝
R57 414747087582700 Westmont Water Department at Westmont, IL USGS 41°47΄47˝
R56 414843088042500 Morton Arboretum Near Lisle, IL USGS 41°48΄43˝
R57 414747087582700 Westmont Water Department at Westmont, IL USGS 41°47΄47˝
R58 414655088102300 Naperville N Operations Center at Naperville, IL USGS 41°46΄55˝
R59 116281 Oak Brook 2W NWS 41° 50' 32"
R60 414430088035600 Woodridge WWTF at Woodridge, IL USGS 41°44΄30˝
R61 414411087575000 Marienbrook WWTF at Darien, IL USGS 41°44΄11˝
R62 05531410 Salt Creek at 22nd Street at Oakbrook, IL USGS 41°50΄51˝
R63 414613088091000 Naperville Municipal Building at Naperville, IL USGS 41°46΄13˝
Grundy R64 111420 Channahon Dresden IS NWS 41° 23' 52"
R65 115825 Morris 1 NW NWS 41° 22' 15"
Kane R66 112709 Elburn NWS 41° 52' 27"
R67 117586 St. Charles 7 NW NWS 41° 57' 37"
R68 05551200 Ferson Creek near St. Charles, IL USGS 41°55΄58˝
R69 05551330 Mill Creek near Batavia, IL USGS 41°50΄45˝
R70 112736 Elgin NWS 42° 03' 46"
R71 110338 Aurora NWS 41° 46' 50"
R72 05551675 Blackberry Creek near Montgomery, IL USGS 41°44΄27˝
Kendall R73 116855 Plano NWS 41° 39' 07"
R74 116065 Newark 2 SSE NWS 41° 31' 57"
Storm and Flood of September 13–16, 2008, in Northeastern Illinois 13
Table 1. Rainfall data for a 3-day period at selected rain gages in northeastern Illinois, September 12–14, 2008.—Continued
Longitude (degrees, minutes, seconds)
Total precipitation
(inches)
72-hour duration rainfall (inches) for selected annual exceedance probabilities computed on the basis of the partial-duration series 1, 2
1.00 0.50 0.20 0.10 0.04 0.02 0.01 0.005 0.002
-88° 51' 55" a8.11 2.98 3.57 4.42 5.16 6.33 7.41 8.69 10.20 12.70
-88° 46' 32" c5.98 2.99 3.58 4.44 5.21 6.44 7.59 8.97 10.60 13.30
-88° 42' 27" c4.63 2.99 3.59 4.43 5.14 6.23 7.21 8.34 9.66 11.80
-87°59΄10˝ 8.73 2.92 3.51 4.37 5.08 6.12 6.99 7.95 9.01 10.60
-88°05΄19˝ 8.47 2.97 3.58 4.45 5.17 6.25 7.18 8.23 9.40 11.20
-88°09΄57˝ 8.37 2.92 3.51 4.37 5.08 6.12 6.99 7.95 9.01 10.60
-87°58΄30˝ 8.08 2.93 3.53 4.40 5.12 6.19 7.11 8.11 9.24 11.00
-88°08΄15˝ 7.89 3.00 3.61 4.49 5.25 6.39 7.40 8.55 9.87 12.00
-87°57΄33˝ 7.09 2.95 3.55 4.43 5.17 6.27 7.22 8.28 9.47 11.30
-88°05΄46˝ 7.03 3.00 3.61 4.50 5.26 6.43 7.47 8.67 10.10 12.30
-88° 03' 29" c6.86 3.00 3.61 4.51 5.30 6.52 7.64 8.93 10.50 12.90
-88°12΄14˝ 6.80 3.03 3.63 4.53 5.31 6.52 7.61 8.89 10.40 12.80
-88°11΄06˝ 6.69 3.03 3.64 4.53 5.32 6.54 7.64 8.94 10.50 12.90
-88° 04' 22" a6.59 3.01 3.61 4.52 5.31 6.55 7.68 9.01 10.60 13.10
-87°57΄50˝ 6.57 2.94 3.54 4.42 5.15 6.24 7.18 8.22 9.38 11.20
-87°58΄17˝ 6.19 2.97 3.57 4.47 5.22 6.37 7.36 8.50 9.78 11.80
-88°04΄25˝ 6.08 3.01 3.61 4.52 5.31 6.55 7.68 9.01 10.60 13.10
-87°58΄27˝ 6.06 2.98 3.59 4.49 5.26 6.44 7.48 8.67 10.00 12.20
-88°04΄25˝ 6.08 3.01 3.61 4.52 5.31 6.55 7.68 9.01 10.60 13.10
-87°58΄27˝ 6.06 2.98 3.59 4.49 5.26 6.44 7.48 8.67 10.00 12.20
-88°10΄23˝ 5.99 3.03 3.63 4.53 5.33 6.57 7.71 9.05 10.60 13.20
-87° 58' 23" a5.88 2.97 3.58 4.47 5.23 6.38 7.39 8.53 9.84 11.90
-88°03΄56˝ 5.75 2.99 3.60 4.50 5.29 6.53 7.66 8.97 10.50 13.10
-87°57΄50˝ 5.60 2.98 3.58 4.48 5.26 6.44 7.49 8.69 10.10 12.30
-87°56΄12˝ 5.30 2.96 3.56 4.45 5.20 6.31 7.27 8.35 9.56 11.40
-88°09΄10˝ 4.82 3.02 3.62 4.53 5.32 6.56 7.70 9.04 10.60 13.20
-88° 16' 55" d6.89 2.99 3.58 4.41 5.13 6.27 7.31 8.52 9.95 12.20
-88° 26' 01" a5.75 2.95 3.54 4.34 5.03 6.11 7.08 8.22 9.55 11.70
-88° 28' 22" d10.51 3.04 3.65 4.53 5.30 6.52 7.64 8.96 10.50 13.10
-88° 25' 22" c9.46 3.02 3.63 4.49 5.23 6.37 7.38 8.55 9.90 12.10
-88°20΄27˝ 8.74 3.02 3.63 4.50 5.25 6.39 7.41 8.59 9.96 12.20
-88°20΄57˝ 7.72 3.06 3.67 4.57 5.37 6.65 7.82 9.22 10.90 13.70
-88° 17' 10" c7.08 3.01 3.61 4.45 5.12 6.07 6.86 7.71 8.63 10.00
-88° 18' 33" c7.06 3.06 3.67 4.58 5.40 6.72 7.96 9.44 11.20 14.20
-88°23΄00˝ 6.26 3.06 3.67 4.57 5.38 6.69 7.93 9.41 11.20 14.20
-88° 31' 45" c6.63 3.00 3.60 4.46 5.24 6.49 7.66 9.07 10.80 13.60
-88° 33' 13" c6.21 2.99 3.58 4.41 5.15 6.33 7.42 8.71 10.30 12.80

14 Flood of September 13–16, 2008, in Northeastern Illinois
Table 1. Rainfall data for a 3-day period at selected rain gages in northeastern Illinois, September 12–14, 2008.—Continued
County
Map reference number (fig. 3)
Agency station number
Agency station nameReporting
agency
Latitude (degrees, minutes, seconds)
La Salle R75 115562 Mendota 2 SE NWS 41° 31' 46"
R76 112510 Earlville 3 S NWS 41° 33' 05"
R77 116753 Peru NWS 41° 21' 01"
R78 115372 Marseilles Lock NWS 41° 19' 43"
R79 116526 Ottawa 5SW NWS 41° 19' 42"
Lake R80 5528000 Des Plaines River near Gurnee, IL USGS 42°20΄38˝
R81 115961 Mundelein 4WSW NWS 42° 15' 19"
McHenry R82 112048 Crystal Lake 4 NW NWS 42° 15' 40"
R83 115493 McHenry Stratton L&D NWS 42° 18' 37"
R84 119480 Woodstock 5 NW NWS 42° 21' 46"
R85 118192 Spring Grove NWS 42° 28' 04"
R86 5548280 Nippersink Creek near Spring Grove, IL USGS 42°26΄36˝
R87 113902 Harvard NWS 42° 24' 53"
R88 422834088255800 Rain Gage at Hebron, IL USGS 42°28΄34˝
Will R89 116725 Peotone NWS 41° 19' 37"
R90 115763 Monee Reservoir NWS 41° 23' 36"
R91 412657087372001 Rain Gage at Crete, IL USGS 41°26΄57˝
R92 114530 Joliet Brandon RD DAM NWS 41° 30' 12"
R93 117457 Romeoville WFO NWS 41° 36' 16"
R94 116849 Plainfield 3 NE NWS 41° 38' 19"
R95 414306088042100 Bolingbrook WWTF at Bolingbrook, IL USGS 41°43΄06˝1The annual exceedance probability (AEP) is the probability that a given event will be exceeded or equaled in any given year. For example, the AEP of
the 100-year rainfall is 0.01. In other words, there is a 1-percent chance that the rainfall would be exceeded or equaled in any given year.2National Oceanic and Atmospheric Administration (2011).aDaily rainfall recorded at 8 a.m.bIncludes estimated data based on distance weighted linear interpolation (Westcott, 2008). cDaily rainfall recorded at 7 a.m.dDaily rainfall recorded at 6 a.m.

Storm and Flood of September 13–16, 2008, in Northeastern Illinois 15
Table 1. Rainfall data for a 3-day period at selected rain gages in northeastern Illinois, September 12–14, 2008.—Continued
Longitude (degrees, minutes, seconds)
Total precipitation
(inches)
72-hour duration rainfall (inches) for selected annual exceedance probabilities computed on the basis of the partial-duration series 1, 2
1.00 0.50 0.20 0.10 0.04 0.02 0.01 0.005 0.002
-89° 07' 36" c6.39 3.02 3.62 4.45 5.14 6.16 7.04 8.01 9.10 10.80
-88° 54' 53" d6.10 3.00 3.60 4.42 5.12 6.20 7.16 8.26 9.53 11.50
-89° 06' 26" c5.46 3.02 3.62 4.45 5.13 6.10 6.90 7.76 8.69 10.00
-88° 45' 12" d4.66 3.03 3.62 4.44 5.12 6.16 7.08 8.11 9.30 11.10
-88° 54' 38" a4.08 3.01 3.61 4.42 5.10 6.12 7.01 8.01 9.14 10.90
-87°56΄28˝ 5.38 2.72 3.26 3.99 4.55 5.32 5.91 6.51 7.11 7.91
-88° 04' 37" c5.13 2.86 3.43 4.22 4.83 5.68 6.35 7.05 7.77 8.77
-88° 23' 43" c5.99 2.97 3.56 4.37 5.01 5.90 6.62 7.38 8.18 9.33
-88° 15' 09" a5.38 2.96 3.54 4.34 4.99 5.90 6.66 7.47 8.36 9.65
-88° 31' 53" c3.75 2.97 3.56 4.36 4.98 5.83 6.52 7.22 7.96 8.99
-88° 14' 14" c3.06 2.91 3.49 4.27 4.87 5.67 6.29 6.92 7.55 8.41
-88°14΄51˝ 3.03 2.92 3.50 4.28 4.88 5.69 6.32 6.96 7.60 8.47
-88° 37' 51" c2.45 2.94 3.53 4.32 4.93 5.78 6.46 7.17 7.91 8.94
-88°25΄58˝ 2.39 2.95 3.54 4.33 4.93 5.75 6.39 7.04 7.70 8.59
-87° 47' 09" c8.68 3.15 3.80 4.74 5.53 6.68 7.65 8.71 9.88 11.60
-87° 45' 54" a8.59 3.12 3.76 4.70 5.48 6.62 7.59 8.64 9.81 11.60
-87°37΄20˝ 7.44 3.07 3.70 4.62 5.37 6.46 7.36 8.32 9.34 10.90
-88° 06' 10" d6.93 2.94 3.53 4.41 5.19 6.44 7.61 8.99 10.70 13.40
-88° 05' 09" 6.12 2.96 3.56 4.44 5.22 6.44 7.56 8.86 10.40 12.90
-88° 11' 17" c6.11 2.99 3.58 4.47 5.25 6.49 7.63 8.98 10.60 13.20
-88°04΄21˝ 5.92 2.99 3.59 4.49 5.28 6.52 7.64 8.94 10.50 13.00

16 Flood of September 13–16, 2008, in Northeastern Illinois Ta
ble
2.
Floo
d-pe
ak g
age
heig
ht, p
eak
disc
harg
e, a
nd a
nnua
l exc
eeda
nce
prob
abili
ty o
f pea
k di
scha
rge
(as
publ
ishe
d by
Hol
mes
and
oth
ers,
201
0) d
urin
g th
e flo
od o
f Se
ptem
ber 2
008
at s
elec
ted
U.S.
Geo
logi
cal S
urve
y st
ream
gage
s in
nor
thea
ster
n Ill
inoi
s.
[mi2 ,
squa
re m
ile; f
t, fo
ot; f
t3 /s, c
ubic
foot
per
seco
nd; A
EP, a
nnua
l exc
eeda
nce
prob
abili
ty; I
L, Il
linoi
s; >
, gre
ater
than
]
Stat
ion
num
ber
Stat
ion
nam
eD
rain
age
ar
ea
(mi2 )
Prev
ious
max
imun
str
eam
flow
Rank
Ann
ual
peak
s
Floo
d of
Sep
tem
ber 2
008
AEP
(H
olm
es a
nd
othe
rs, 2
010)
Dat
eSt
age
(ft
)D
isch
arge
(ft
3 /s)
Dat
eSt
age
(ft)
Dis
char
ge
(ft3 /s
)
0543
9000
SOU
TH B
RA
NC
H K
ISH
WA
UK
EE R
IVER
AT
DEK
ALB
, IL
77.7
08/2
007
13.6
03,
020
537
9/14
/200
811
.30
a 2,0
30
0552
9000
DES
PLA
INES
RIV
ER N
EAR
DES
PLA
INES
, IL
360
10/1
986
10.8
84,
900
1469
9/14
/200
810
.00
a 3,0
1010
0553
0990
SALT
CR
EEK
AT
RO
LLIN
G M
EAD
OW
S, IL
30.5
08/1
987
14.0
31,
650
135
9/13
/200
812
.99
a 2,5
10>.
2
0553
1300
SALT
CR
EEK
AT
ELM
HU
RST
, IL
91.4
708
/197
27.
272,
230
245
9/14
/200
813
.27
a 1,9
40
0553
1500
SALT
CR
EEK
AT
WES
TER
N S
PRIN
GS,
IL11
508
/198
710
.54
3,54
02
639/
14/2
008
9.92
a 2,8
90
0553
2500
DES
PLA
INES
RIV
ER A
T R
IVER
SID
E, IL
630
08/1
987
9.90
9,77
02
959/
14/2
008
9.87
a 9,5
600.
2-1
0553
6000
NO
RTH
BR
AN
CH
CH
ICA
GO
RIV
ER A
T N
ILES
, IL
100
08/1
987
11.3
52,
590
158
9/13
/200
812
.13
a 3,3
40.2
-1
0553
6105
NO
RTH
BR
AN
CH
CH
ICA
GO
RIV
ER A
T A
LBA
NY
AV
ENU
E AT
CH
ICA
GO
, IL
113
02/1
997
6.81
2,36
01
189/
14/2
008
7.86
a 3,5
80
0553
6235
DEE
R C
REE
K N
EAR
CH
ICA
GO
HEI
GH
TS, I
L23
.108
/200
712
.37
1,32
01
619/
15/2
008
12.8
7a,
b 1,3
20
0553
6275
THO
RN
CR
EEK
AT
THO
RN
TON
, IL
104
04/2
006
15.1
05,
540
162
9/14
/200
815
.89
a 5,8
601-
2
0553
9900
WES
T B
RA
NC
H D
U P
AG
E R
IVER
NR
WES
T C
HIC
AG
O, I
L28
.508
/200
710
.35
1,04
01
489/
13/2
008
12.2
8a 1
,840
.2-1
0554
0060
KR
ESS
CR
EEK
AT
WES
T C
HIC
AG
O, I
L18
.107
/199
69.
241,
980
150
9/14
/200
89.
37a 2
,100
1-2
0554
0095
WES
T B
RA
NC
H D
U P
AG
E R
IVER
NEA
R W
AR
REN
VIL
LE, I
L90
.407
/199
66.
413,
470
140
9/14
/200
88.
03a 4
,930
1-2
0554
0130
WES
T B
RA
NC
H D
U P
AG
E R
IVER
NEA
R N
APE
RVIL
LE, I
L12
307
/199
614
.31
6,62
02
209/
14/2
008
11.9
8a 4
,160
4-10
0554
0160
EAST
BR
AN
CH
DU
PA
GE
RIV
ER N
EAR
DO
WN
ERS
GR
OV
E, IL
26.6
08/1
972
16.9
41,
720
335
9/14
/200
817
.26
a 1,1
904-
10
0554
0250
EAST
BR
AN
CH
DU
PA
GE
RIV
ER A
T B
OLI
NG
BR
OO
K, I
L75
.807
/199
623
.75
3,98
02
209/
14/2
008
24.0
1a 2
,410
4-10
0554
0500
DU
PA
GE
RIV
ER A
T SH
OR
EWO
OD
, IL
324
07/1
996
14.0
317
,300
468
9/15
/200
89.
94a 9
,440
4-10
0554
3500
ILLI
NO
IS R
IVER
AT
MA
RSE
ILLE
S, IL
8,25
901
/191
635
.40
d 40,
000
211
29/
16/2
008
28.1
3c 1
04,0
00
0555
0300
TYLE
R C
REE
K A
T EL
GIN
, IL
38.9
08/2
002
8.26
1,65
03
289/
13/2
008
8.53
a 1,2
50>1
0
0555
0500
POPL
AR
CR
EEK
AT
ELG
IN, I
L35
.202
/199
76.
781,
180
157
9/13
/200
87.
69a 1
,560
2-4
0555
1200
FER
SON
CR
EEK
NEA
R S
T. C
HA
RLE
S, IL
51.7
02/1
997
8.77
2,58
01
489/
13/2
008
8.96
a 2,9
801-
2
0555
1330
MIL
L C
REE
K N
EAR
BAT
AVIA
, IL
27.6
204
/199
97.
521,
080
111
9/13
/200
89.
48a 4
,510
0555
1540
FOX
RIV
ER A
T M
ON
TGO
MER
Y, IL
1,73
208
/200
714
.69
13,8
001
69/
14/2
008
15.1
2a 1
8,00
0
0555
1675
BLA
CK
BER
RY C
REE
K N
EAR
MO
NTG
OM
ERY,
IL54
.97
04/1
999
8.61
1,04
01
119/
14/2
008
10.6
9a 1
,740
0555
1700
BLA
CK
BER
RY C
REE
K N
EAR
YO
RK
VIL
LE, I
L70
.207
/199
613
.16
5,51
02
489/
15/2
008
9.94
a 2,1
30>1
0a A
ll or
par
t of t
he re
cord
affe
cted
by
urba
niza
tion.
b Dis
char
ge a
ffect
ed to
unk
now
n de
gree
by
regu
latio
n or
div
ersi
on.
c Dis
char
ge a
ffect
ed b
y re
gula
tion
or d
iver
sion
.d D
isch
arge
ow
ing
to sn
owm
elt,
hurr
ican
e, ic
e-ja
m, o
r deb
ris-d
am b
reak
up.

This page has been left blank intentionally.

18 Flood of September 13–16, 2008, in Northeastern Illinois
Table 3. List of communities, by stream reach, and approximate number of miles where high-water marks were set for the September 13–16, 2008, flood in northeastern Illinois.
[̰~, approximately]
Table 3. List of communities, by stream reach, and approximate number of miles wherehigh-water marks were set for the September 13-16, 2008 flood in northeastern Illinois.[~, approximately]
Stream Stream miles Community CountyAddison Creek ~6.5 Northlake Cook
Stone Park CookBellwood CookBroadview Cook
Des Plaines River ~28.0 Northbrook CookProspect Heights CookGlenview CookMount Prospect CookDes Plaines CookPark Ridge CookRosemont CookSchiller Park CookFranklin Park CookRiver Grove CookMelrose Park CookRiver Forest CookMaywood CookOak Park CookForest Park CookRiverside CookLyons Cook
DuPage River ~27.0 Naperville DuPage/WillBolingbrook WillPlainfield WillJoliet WillShorewood WillMinooka WillChannahon Will
East Branch DuPage River ~5.5 Woodridge DuPageNaperville DuPage/WillBolingbrook Will
Illinois River ~6.0 Morris Grundy
Johnny Run ~4.0 Mazon Grundy

Storm and Flood of September 13–16, 2008, in Northeastern Illinois 19
Table 3. List of communities, by stream reach, and approximate number of miles where high-water marks were set for the September 13–16, 2008, flood in northeastern Illinois.—ContinuedTable 3. List of communities, by stream reach, and approximate number of miles wherehigh-water marks were set for the September 13-16, 2008 flood in northeastern Illinois.[~, approximately]
Stream Stream miles Community CountyAddison Creek ~6.5 Northlake Cook
Stone Park CookBellwood CookBroadview Cook
Des Plaines River ~28.0 Northbrook CookProspect Heights CookGlenview CookMount Prospect CookDes Plaines CookPark Ridge CookRosemont CookSchiller Park CookFranklin Park CookRiver Grove CookMelrose Park CookRiver Forest CookMaywood CookOak Park CookForest Park CookRiverside CookLyons Cook
DuPage River ~27.0 Naperville DuPage/WillBolingbrook WillPlainfield WillJoliet WillShorewood WillMinooka WillChannahon Will
East Branch DuPage River ~5.5 Woodridge DuPageNaperville DuPage/WillBolingbrook Will
Illinois River ~6.0 Morris Grundy
Johnny Run ~4.0 Mazon Grundy
Little Calumet River ~8.0 Harvey CookSouth Holland CookThorton CookCalumet City CookLansing Cook
North Branch Chicago River ~8.5 Niles CookOld Edgebrook CookSouth Edgebrook CookAlbany Park Cook
Poplar Creek ~1.5 Elgin Cook/Kane
Salt Creek ~3.0 Brookfield CookLyons Cook
South Branch Kishwaukee ~12.5 Genoa DeKalbSycamore DeKalbDeKalb DeKalb
West Branch DuPage River ~21.0 Roselle DuPageHanover Park DuPageCarol Stream DuPageWest Chicago DuPageWinfield DuPageWarrenville DuPageNaperville DuPage/Will
Total stream miles ~131.5

20 Flood of September 13–16, 2008, in Northeastern Illinois
High-Water Mark
High-Water Mark
High-Water Mark
High-Water Mark
High-Water Mark
High-Water Mark
A B
C D
E F
Figure 5. Photographs of selected high-water marks in October 2008: (A) Paint blaze on streetlight, Des Plaines River at Lake Street, River Forest, Illinois; (B) Floodmark disk and flagging on tree, Poplar Creek at Hammond Avenue, Elgin, Ill.; (C) Paint blaze on sign post, Des Plaines River at Robinson Avenue, Franklin Park, Ill.; (D) Paint blaze on bridge support, Des Plaines River at Golf Road, Des Plaines, Ill.; (E) Paint blaze and flagging on metal pole, North Branch Chicago River in an alley between North Springfield Avenue and North Avers Avenue, Albany Park, Ill.; and (F) Paint blaze on guard rail, North Branch Chicago River at North Bernard Street, Albany Park, Ill.
Figure 5. Selected high-water marks in October 2008. A, Paint blaze on streetlight, Des Plaines River at Lake Street, River Forest, Illinois (Ill.). B, Floodmark disk and flagging on tree, Poplar Creek at Hammond Avenue, Elgin, Ill. C, Paint blaze on sign post, Des Plaines River at Robinson Avenue, Franklin Park, Ill. D, Paint blaze on bridge support, Des Plaines River at Golf Road, Des Plaines, Ill. E, Paint blaze and flagging on metal pole, North Branch Chicago River in an alley between North Springfield Avenue and North Avers Avenue, Albany Park, Ill. F, Paint blaze on guard rail, North Branch Chicago River at North Bernard Street, Albany Park, Ill.

Storm and Flood of September 13–16, 2008, in Northeastern Illinois 21
A B
Figure 6. Photographs of the Elmhurst Quarry Flood Control Facility, DuPage County, Illinois (A) full of water on September 16, 2008, and (B) dry on May 31, 2011. Photograph A was taken by Jon E. Hortness, U.S. Geological Survey, and photograph B by David J. Fazio.Figure 6. Elmhurst Quarry Flood Control Facility, DuPage County, Illinois. A, full of water on September 16, 2008. B, dry on May 31, 2011.
Figure 7. Passenger jet taxiing to a terminal at O'Hare International Airport, Chicago, Illinois, September 14, 2008. Photograph used with permission of David Lastrucci, ALPI U.S.A. Inc.Figure 7. Passenger jet taxiing to a terminal at O'Hare International Airport, Chicago, Illinois, September 14, 2008.
22 Flood of September 13–16, 2008, in Northeastern Illinois
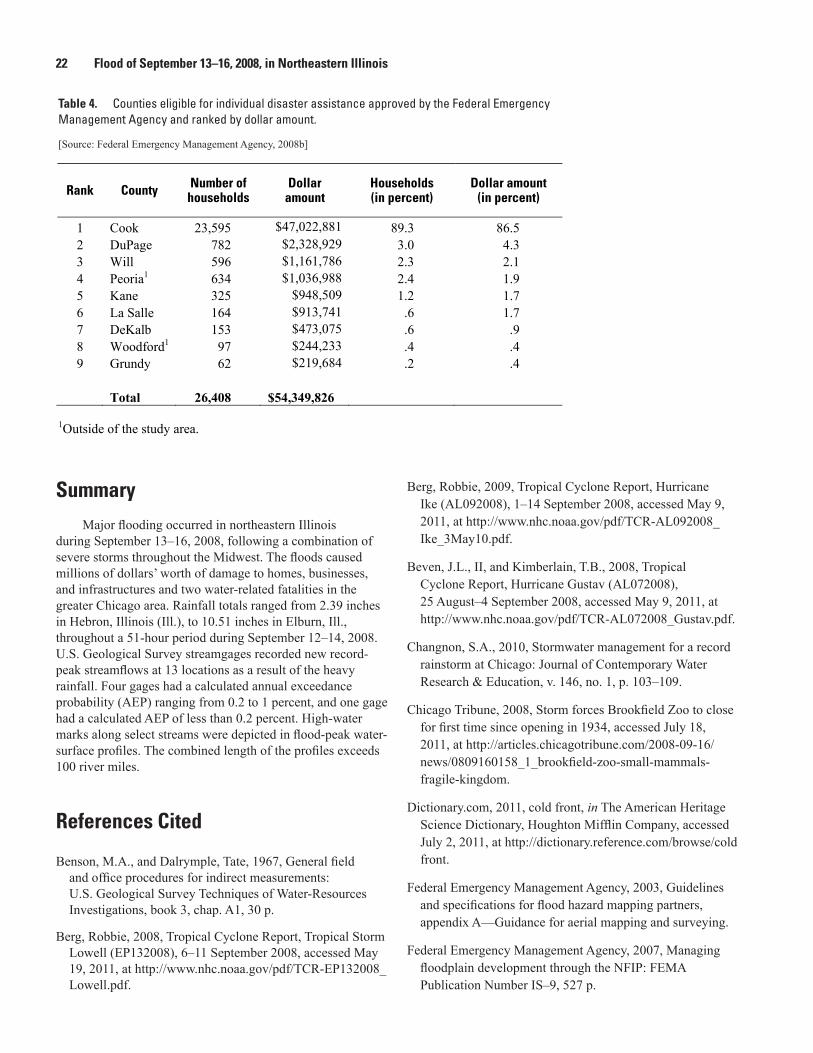
Table 4. Counties eligible for individual disaster assistance approved by the Federal Emergency Management Agency and ranked by dollar amount.
[Source: Federal Emergency Management Agency, 2008b]
1
Table 4. Counties eligible for individual disaster assistance approved by the Federal
Emergency Management Agency and ranked by dollar amount.
[Source: Federal Emergency Management Agency, 2008b]
Rank County Number of households
Dollar amount
Households (in percent)
Dollar amount (in percent)
1 Cook 23,595 $47,022,881 89.3 86.5 2 DuPage 782 $2,328,929 3.0 4.3 3 Will 596 $1,161,786 2.3 2.1 4 Peoria1 634 $1,036,988 2.4 1.9 5 Kane 325 $948,509 1.2 1.7 6 La Salle 164 $913,741 .6 1.7 7 DeKalb 153 $473,075 .6 .9 8 Woodford1 97 $244,233 .4 .4 9 Grundy 62 $219,684 .2 .4
Total 26,408 $54,349,826
1Outside of the study area.
SummaryMajor flooding occurred in northeastern Illinois
during September 13–16, 2008, following a combination of severe storms throughout the Midwest. The floods caused millions of dollars’ worth of damage to homes, businesses, and infrastructures and two water-related fatalities in the greater Chicago area. Rainfall totals ranged from 2.39 inches in Hebron, Illinois (Ill.), to 10.51 inches in Elburn, Ill., throughout a 51-hour period during September 12–14, 2008. U.S. Geological Survey streamgages recorded new record-peak streamflows at 13 locations as a result of the heavy rainfall. Four gages had a calculated annual exceedance probability (AEP) ranging from 0.2 to 1 percent, and one gage had a calculated AEP of less than 0.2 percent. High-water marks along select streams were depicted in flood-peak water-surface profiles. The combined length of the profiles exceeds 100 river miles.
References Cited
Benson, M.A., and Dalrymple, Tate, 1967, General field and office procedures for indirect measurements: U.S. Geological Survey Techniques of Water-Resources Investigations, book 3, chap. A1, 30 p.
Berg, Robbie, 2008, Tropical Cyclone Report, Tropical Storm Lowell (EP132008), 6–11 September 2008, accessed May 19, 2011, at http://www.nhc.noaa.gov/pdf/TCR-EP132008_Lowell.pdf.
Berg, Robbie, 2009, Tropical Cyclone Report, Hurricane Ike (AL092008), 1–14 September 2008, accessed May 9, 2011, at http://www.nhc.noaa.gov/pdf/TCR-AL092008_Ike_3May10.pdf.
Beven, J.L., II, and Kimberlain, T.B., 2008, Tropical Cyclone Report, Hurricane Gustav (AL072008), 25 August–4 September 2008, accessed May 9, 2011, at http://www.nhc.noaa.gov/pdf/TCR-AL072008_Gustav.pdf.
Changnon, S.A., 2010, Stormwater management for a record rainstorm at Chicago: Journal of Contemporary Water Research & Education, v. 146, no. 1, p. 103–109.
Chicago Tribune, 2008, Storm forces Brookfield Zoo to close for first time since opening in 1934, accessed July 18, 2011, at http://articles.chicagotribune.com/2008-09-16/news/0809160158_1_brookfield-zoo-small-mammals-fragile-kingdom.
Dictionary.com, 2011, cold front, in The American Heritage Science Dictionary, Houghton Mifflin Company, accessed July 2, 2011, at http://dictionary.reference.com/browse/cold front.
Federal Emergency Management Agency, 2003, Guidelines and specifications for flood hazard mapping partners, appendix A—Guidance for aerial mapping and surveying.
Federal Emergency Management Agency, 2007, Managing floodplain development through the NFIP: FEMA Publication Number IS–9, 527 p.

References Cited 23
Federal Emergency Management Agency, 2008a, Nine counties eligible for federal disaster help, Release Number 1800–036, accessed May 23, 2011, at http://www.fema.gov/news/newsrelease.fema?id=46830.
Federal Emergency Management Agency, 2008b, Disaster assistance for Illinois residents reaches $69 Million, Release Number 1800–048, accessed May 23, 2011, at http://www.fema.gov/news/newsrelease.fema?id=47151.
Hodgkins, G.A., Stewart, G.J., Cohn, T.A., and Dudley, R.W., 2007, Estimated magnitudes and recurrence intervals of peak flows on the Mousam and Little Ossipee Rivers for the flood of April 2007 in southern Maine: U.S. Geological Survey Open-File Report 2007–1146, 5 p., accessed July 16, 2011, at http://pubs.usgs.gov/of/2007/1146/.
Holmes, R.R., Jr., Koenig, T.A., and Karstensen, K.A., 2010, Flooding in the United States Midwest, 2008: U.S. Geological Survey Professional Paper 1775, 64 p., accessed August 29, 2011, at http://pubs.usgs.gov/pp/1775/.
Illinois Department of Natural Resources–Office of Water Resources, 2008, Flood surveillance report, northeastern Illinois, September 13–15, 2008: Springfield, Ill., Illinois Department of Natural Resources, Office of Water Resources, 117 p.
Illinois Environmental Protection Agency, 2009, Annual facility inspection report—NPDES permit for storm water discharges from municipal separate storm sewer systems (MS4)—March 2008 to March 2009 reporting period, 77 p., accessed November 22, 2011, at http://www.dupageco.org/EDP/Stormwater_Management/Docs/Reports/18211/.
Illinois State Water Survey, 2008a, Wet weather challenges the 2008 growing season, accessed July 16, 2011, at http://www.isws.illinois.edu/hilites/press/080729wetwx.asp.
Illinois State Water Survey, 2008b, Cool, dry August for Illinois, accessed July 16, 2011, at http://www.isws.illinois.edu/atmos/statecli/2008/August2008.htm.
Illinois State Water Survey, 2008c, Heavy rains in Illinois, September 2008, accessed May 9, 2011, at http://www.isws.illinois.edu/atmos/statecli/2008/September2008/tropical.htm.
Langbein, W.B., and Iseri, K.T., 1960, General introduction and hydrologic definitions—Manual of hydrology—Part 1, General surface-water techniques: U.S. Geological Survey Water-Supply Paper 1541–A, accessed July 2, 2011, at http://water.usgs.gov/wsc/glossary.html.
Lumia, Richard, Burke, P.M., and Johnston, W.H., 1987, Flooding of December 29, 1984 through January 2, 1985, in northern New York State, with flood profiles of the Black and Salmon rivers: U.S. Geological Survey Water-Resources Investigations Report 86–4191, 53 p., accessed August 29, 2011, at http://pubs.usgs.gov/wri/1986/4191/report.pdf.
National Oceanic and Atmospheric Administration, 2008, Storm data and unusual weather phenomena—September 2008, 9 p., accessed July 13, 2011, at http://www.crh.noaa.gov/Image/lot/stormdata/sep2008.pdf.
National Oceanic and Atmospheric Administration, 2011, National Weather Service Hydrometeorological Design Studies Center Precipitation Frequency Data Server (PFDS), NOAA atlas 14 point precipitation frequency estimates, accessed May 23, 2011, at http://hdsc.nws.noaa.gov/hdsc/pfds/pfds_map_cont.html?bkmrk=il.
National Weather Service, 2009, National Weather Service glossary, accessed July 2, 2011, at http://www.weather.gov/glossary/.
Westcott, N.E., 2008, Operation of the Cook County Precipitation Network—Monthly progress report for September 2008: Champaign, Ill., Illinois State Water Survey, University of Illinoi at Urbana–Champaign, 4 p.
GlossaryThe following definitions, except where noted, are from
Langbein and Iseri (1960).
A
acre-foot A unit for measuring the volume of water equal to the quantity of water required to cover 1 acre to a depth of 1 foot and is equal to 43,560 cubic feet or 325,851 gallons. The term is commonly used in measuring volumes of water used or stored.annual exceedance probability The probability that a given event magnitude will be exceeded or equaled in any given year. For example, the annual exceedance probability of the 50-year peak-flood streamflow is 0.02. In other words, there is a 2-percent chance that the 50-year peak flow will be exceeded or equaled in any given year (Hodgkins and others, 2007). The reciprocal of the annual exceedance probability is the recurrence interval.
C
cold front The zone separating two air masses, with the cooler, denser air mass advancing and replacing the warmer air mass. Cold fronts often cause precipitation as water vapor in the rising warm air condenses and forms clouds. The cloud formation can result in heavy rain, thunderstorms, hail, or snow (Dictionary.com, 2011).cubic feet per second A unit expressing discharge as a volume per unit of time. For example 1 cubic foot per second is equal to the discharge of a stream of 1 square foot in area passing a point with an average velocity of 1 foot per second.
D
discharge In hydrologic terms, the rate at which water passes a given point. Discharge is expressed in a volume per time with units of cubic feet per second. Discharge often is used interchangeably with streamflow (National Weather Service, 2009). drainage basin A part of the surface of the earth that is occupied by a drainage system, which consists of a surface stream or a body of impounded surface water together with all tributary surface streams and bodies of impounded surface water.
E
extratropical A term used in advisories and tropical summaries to indicate that a cyclone has lost its “tropical” characteristics. The term implies both poleward displacement of the cyclone and the conversion of the cyclone’s primary energy source from the release of latent heat of condensation to baroclinic (the temperature contrast between warm and cold air masses) processes. It is important to note that cyclones can become extratropical and still retain winds of hurricane or tropical storm force (National Weather Service, 2009).
Fflood Any high flow, overflow, or inundation by water that causes or threatens damage (National Weather Service, 2009).flood peak The highest value of the stage or discharge attained by a flood; thus, peak stage or peak discharge. Flood crest has nearly the same meaning, but because it connotes the top of the flood wave, it is properly used only in referring to stage—thus, crest stage, but not crest discharge. front A boundary or transition zone between two air masses of different density, and thus (usually) of different temperature. A moving front is named according to the advancing air mass; for example, cold front if colder air is advancing (National Weather Service, 2009).
Ggage height The water-surface elevation referred to some arbitrary gage datum. Gage height often is used interchangeably with the more general term stage, although gage height is more appropriate when used with a reading on a streamgage.
R river mile The curvilinear distance, in miles, measured upstream from the mouth along the meandering path of a stream channel in accordance with Bulletin No. 14 (October 1968) of the Water Resources Council and typically is used to denote location along a river.riverine flood Excess flows over the banks of a natural channel such as a river, creek, stream, or ditch (Federal Emergency Management Agency, 2007).
Sstream A general term for a body of flowing water. In hydrology, the term generally is applied to the water flowing in a natural channel as distinct from a canal.streamflow The discharge that occurs in a natural channel. Although the term discharge can be applied to the flow of a canal, the word streamflow uniquely describes the discharge in a surface-stream course.streamgage A gaging station where a record of discharge of a stream is obtained. Within the U.S. Geological Survey, this term is used only for those gaging stations where a continuous record of gage height is obtained.Ttropical depression A tropical cyclone in which the maximum 1-minute sustained surface wind is 33 knots (38 miles per hour) or less (National Weather Service, 2009).
Uurban drainage flood Excess flows over the banks of man-made ditches, retention ponds, and other facilities constructed to store runoff or carry it to a receiving stream or lake (Federal Emergency Management Agency, 2007).

Appendix 25
Appendixes 1–3
Appendix 1. High-Water Mark Site Description and Elevation at Select Stream Reaches, Flood of September 2008, Northeastern Illinois
Appendix 2. Example High-Water Mark Documentation Field Sheet, Flood of September 2008, Northeastern Illinois
Appendix 3. Flood-Peak Water-Surface Profiles at Select Stream Reaches, Flood of September 2008, Northeastern Illinois

26 Flood of September 13–16, 2008, in Northeastern Illinois A
ppen
dix
1.
High
-Wat
er M
ark
Site
Des
crip
tion
and
Elev
atio
n at
Sel
ect S
tream
Rea
ches
, Flo
od o
f Sep
tem
ber 2
008,
Nor
thea
ster
n Ill
inoi
s.
[Ver
tical
coo
rdin
ate
data
are
refe
renc
ed to
the
Nor
th A
mer
ican
Ver
tical
Dat
um o
f 198
8 (N
AVD
88)
; hor
izon
tal c
oord
inat
e da
ta a
re re
fere
nced
to th
e N
orth
Am
eric
an D
atum
of 1
983;
app
roxi
mat
e qu
antit
ativ
e in
dica
tions
of a
ccur
acy
of h
igh-
wat
er m
ark
ratin
gs: e
xcel
lent
, + 0
.02
foot
; goo
d, +
0.0
5 fo
ot; f
air,
+ 0.
10 fo
ot; a
nd p
oor,
> 0.
10 fo
ot (L
umia
and
oth
ers,
1987
); fo
r the
ban
k de
sign
atio
n, "
right
" an
d "l
eft"
refe
r to
an o
bser
vatio
n lo
okin
g in
the
dow
nstre
am d
irect
ion
of th
e w
ater
cour
se; N
R, n
ot re
cove
red;
ft, f
eet;
° ′ ″, d
egre
es, m
inut
es, s
econ
ds; ~
, app
roxi
mat
ely;
R+R
, rai
lroad
]
Coun
tySt
reet
refe
renc
eH
igh-
wat
er m
ark
desc
ript
ion
Hig
h-w
ater
m
ark
type
Hig
h-w
ater
m
ark
ratin
g
Elev
atio
n
(ft a
bove
N
AVD
88)
Latit
ude
(deg
rees
, m
inut
es,
seco
nds)
Long
itude
(d
egre
es,
min
utes
, se
cond
s)
Nor
th B
ranc
h Ch
icag
o Ri
ver
Coo
kH
owar
d St
reet
Pain
t 3.0
ft u
p th
e do
wns
tream
side
of H
owar
d St
. brid
ge o
n th
e rig
ht b
ank
seed
line
/de
bris
line
exce
llent
42° 0
1′ 08.
4″-8
7° 4
7′ 45.
6″
Coo
kH
owar
d St
reet
A fl
ood
mar
k di
sc 3
.5 ft
up
a fe
nce
post
60
ft do
wns
tream
of H
owar
d St
. on
the
right
ban
k ne
xt to
a p
arki
ng lo
tse
ed li
ne/
debr
is li
nefa
ir 4
2° 0
1′ 07.
77″
-87°
47′ 4
6.5″
Coo
kH
arts
Roa
dA
floo
d m
ark
disc
2.0
ft u
p a
tree
10 ft
dow
nstre
am o
f Har
ts R
d. a
nd 1
4 po
sts o
ff th
e le
ft ba
nkm
ud li
nego
od42
° 00′ 3
4.3″
-87°
47′ 4
7.1″
Coo
kH
arts
Roa
dPa
int 2
.0 ft
up
the
side
of a
n eq
uipm
ent h
ousi
ng u
pstre
am o
f Har
ts R
d.
brid
ge o
n th
e le
ft ba
nk 3
ft w
est o
f Riv
ersi
de R
d.m
ud li
neex
celle
nt61
2.46
42° 0
0′ 36.
7″-8
7° 4
7′ 45.
8″
Coo
kH
arts
Roa
dPa
int 0
.4 ft
up
a no
par
king
sign
2 ft
ups
tream
of H
arts
Rd.
on
the
left
bank
ac
ross
Riv
ersi
de R
d.m
ud li
ne
good
42° 0
0′ 36.
4″-8
7° 4
7′ 43.
0″
Coo
kC
layt
on S
mith
W
oods
Pre
serv
e A
floo
d m
ark
disc
6.5
ft u
p a
tree
560 ft
dow
nstre
am o
f the
ped
estri
an p
ath
on th
e rig
ht b
ank
near
a p
ool
seed
line
/de
bris
line
41° 5
9′ 55.
7″-8
7° 4
7′ 00.
32″
Coo
kC
layt
on S
mith
W
oods
Pre
serv
e A
floo
d m
ark
disc
2.5
ft u
p a
tree
20 ft
dow
nstre
am o
f the
ped
estri
an b
ridge
on
the
left
bank
seed
line
/de
bris
line
fair
608.
7540
° 00′ 0
0.5″
-87°
47′ 0
3.7″
Coo
kC
layt
on S
mith
W
oods
Pre
serv
ePa
int 7
.0 ft
up
the
dow
nstre
am si
de o
f the
ped
estri
an b
ridge
on
the
right
ban
kse
ed li
ne/
debr
is li
nego
od41
° 59′ 5
9.9″
-87°
47′ 0
3.9″
Coo
kC
layt
on S
mith
W
oods
Pre
serv
e Pa
int 6
.0 ft
up
the
dow
nstre
am si
de o
f the
ped
estri
an b
ridge
on
the
left
bank
seed
line
/de
bris
line
good
42° 0
0′ 00.
9″-8
7° 4
7′ 03.
9″
Coo
kW
est D
evon
Ave
nue
A m
ark
1.0 ft
up
an a
butm
ent 4
ft d
owns
tream
of W
. Dev
on A
ve. b
ridge
on
the
left
bank
seed
line
/de
bris
line
good
41° 5
4′ 50.
4″-8
7° 4
6′ 47.
2″
Coo
kW
est D
evon
Ave
nue
A fl
ood
mar
k di
sc 3
.0 ft
up
a tre
e 15
ft d
owns
tream
of W
. Dev
on A
ve. b
ridge
on
the
left
bank
seed
line
/de
bris
line
fair
41° 5
4′ 50.
1″-8
7° 4
6′ 47.
0″
Coo
kN
orth
Cen
tral
Aven
uePa
int 6
.5 ft
up
a fe
nce
post
1,0
00 ft
dow
nstre
am o
f N. C
entra
l Ave
. on
the
right
ban
k ne
ar a
pav
illio
nse
ed li
ne/
debr
is li
nego
od60
3.42
41°
59′ 1
9.77
″-8
7° 4
5′ 45.
91″
Coo
kN
orth
Cen
tral
Aven
uePa
int 3
.0 ft
up
the
dow
nstre
am si
de o
f N. C
entra
l Ave
. brid
ge o
n th
e rig
ht
bank
seed
line
/de
bris
line
fair
603.
76 4
1° 5
9′ 23.
63″
-87°
45′ 5
7.76
″
Coo
kFo
rest
Gle
n Av
enue
Pain
t 2.0
ft u
p th
e do
wns
tream
side
of F
ores
t Gle
n Av
e. b
ridge
on
the
right
ba
nkse
ed li
ne/
debr
is li
neex
celle
nt60
2.05
41° 5
8′ 54.
4″-8
7° 4
5′ 05.
4″
Coo
kC
icer
o Av
enue
Pain
t 2.0
ft u
p th
e C
icer
o Av
e. b
ridge
win
gwal
l dow
nstre
am o
f the
brid
ge o
n th
e rig
ht b
ank
mud
line
good
41° 5
8′ 57.
8″-8
7° 4
4′ 48.
8″
Coo
kC
icer
o Av
enue
A fl
ood
mar
k di
sc 4
.5 ft
up
a tre
e 20
ft d
owns
tream
of C
icer
o Av
e. b
ridge
on
the
right
ban
km
ud li
nefa
ir60
0.94
41° 5
9′ 00.
3″-8
7° 4
4′ 53.
0″
Coo
kFo
ster
Ave
nue/
R+R
B
ridge
A fl
ood
mar
k di
sc o
n a
tree
20 ft
dow
nstre
am o
f the
R+R
brid
ge o
n th
e rig
ht
bank
seed
line
/de
bris
line
good
600.
3741
° 58′ 4
1.0″
-87°
44′ 2
6.7″

Appendix 1 27A
ppen
dix
1.
High
-Wat
er M
ark
Site
Des
crip
tion
and
Elev
atio
n at
Sel
ect S
tream
Rea
ches
, Flo
od o
f Sep
tem
ber 2
008,
Nor
thea
ster
n Ill
inoi
s.—
Cont
inue
d
Coun
tySt
reet
refe
renc
eH
igh-
wat
er m
ark
desc
ript
ion
Hig
h-w
ater
m
ark
type
Hig
h-w
ater
m
ark
ratin
g
Elev
atio
n
(ft a
bove
N
AVD
88)
Latit
ude
(deg
rees
, m
inut
es,
seco
nds)
Long
itude
(d
egre
es,
min
utes
, se
cond
s)
Coo
kFo
ster
Ave
nue/
Kos
tner
Pain
t on
a m
etal
pos
t on
the
right
ban
k no
rth o
f Fos
ter (
furth
er e
ast)
seed
line
good
600.
3041
° 58′ 3
4.8″
-87°
44′ 1
0.8″
Coo
kFo
ster
Ave
nue/
Kos
tner
Pain
t on
a m
etal
pos
t on
the
right
ban
k no
rth o
f Kos
tner
(fur
ther
eas
t)se
ed li
nego
od41
° 58′ 3
4.9″
-87°
44′ 1
5.8″
Coo
kFo
ster
Ave
nue/
Kos
tner
Pain
t on
a m
etal
pos
t on
the
right
ban
k no
rth o
f Kos
tner
(fur
ther
wes
t)se
ed li
nego
od60
0.20
41° 5
8′ 35.
0″-8
7° 4
4′ 16.
6″
Coo
kFo
ster
Ave
nue/
Pula
ski
A fl
ood
mar
k di
sc 4
.5 ft
up
a C
hica
go p
ark
dist
rict s
ign
110 ft
ups
tream
of
Pula
ski
on th
e rig
ht b
ank
acro
ss a
foot
pat
hse
ed li
ne/
debr
is li
nego
od41
° 58′ 2
8.6″
-87°
43′ 4
3.2″
Coo
kFo
ster
Ave
nue/
Pula
ski
A fl
ood
mar
k di
sc 4
.5 ft
up
a tre
e 80
ft d
owns
tream
of P
ulas
ki b
ridge
on
the
left
bank
mud
line
fair
598.
3141
° 58′ 3
1.3″
-87°
43′ 4
7.2″
Coo
kFo
ster
Ave
nue
Pain
t on
the
upst
ream
side
of F
oste
r Ave
. brid
ge o
n th
e le
ft ba
nkse
ed li
ne/
debr
is li
neex
celle
nt41
° 58′ 3
1.6″
-87°
43′ 3
9.4″
Coo
kFo
ster
Ave
nue
A fl
ood
mar
k di
sc o
n a
tree
10 ft
ups
ream
of F
oste
r Ave
. brd
ige
on th
e le
ft ba
nkse
ed li
nego
od59
8.04
41° 5
8′ 31.
5″-8
7° 4
3′ 39.
4″
Coo
kFo
ster
Ave
nue/
Sprin
gfiel
dPa
int o
n a
met
al p
ost o
n th
e rig
ht b
ank
acro
ss F
oste
r Ave
. and
wes
t of
Sprin
gfiel
dse
ed li
ne/
debr
is li
nego
od59
7.19
41° 5
8′ 30.
3″-8
7° 4
3′ 31.
4″
Coo
kFo
ster
Ave
nue/
Sprin
gfiel
dPa
int o
n a
mai
l box
on
the
right
ban
k ac
ross
Fos
ter A
ve. o
n a
road
inbe
twee
n Sp
ringfi
eld
and
Ayer
sm
ud li
nefa
ir41
° 58′ 3
1.7″
-87°
43′ 3
3.2″
Coo
kFo
ster
Ave
nue/
Ayer
sPa
int 2
.5 ft
up
the
upst
ream
side
of F
oste
r Ave
. brid
ge o
n th
e rig
ht b
ank
seed
line
/de
bris
line
good
597.
0541
° 58′ 3
2.6″
-87°
43′ 2
8.1″
Coo
kFo
ster
Ave
nue/
Ayer
sA
floo
d m
ark
disc
1.5
ft u
p a
tree
150 ft
dow
nstre
am o
f Fos
ter A
ve. o
n th
e rig
ht b
ank
acro
ss A
yers
mud
line
fair
596.
0641
° 58′ 3
1.4″
-87°
43′ 2
8.6″
Coo
kW
est F
oste
r Ave
nue/
Rid
gew
ayPa
int o
n a
met
al p
ost d
owns
tream
of a
ped
estri
an b
ridge
off
of W
. Fos
ter
Ave.
and
410
ft o
ff of
the
left
bank
debr
is li
nefa
ir59
6.64
41° 5
8′ 31.
2″-8
7° 4
3′ 16.
4″
Coo
kW
est F
oste
r Ave
nue/
Rid
gew
ayPa
int o
n a
met
al p
ost 1
45 ft
dow
nstre
am o
f a p
edes
trian
brid
ge o
ff of
W.
Fost
er A
ve. o
n th
e le
ft ba
nkde
bris
line
fair
41° 5
8′ 28.
5″-8
7° 4
3′ 16.
4″
Coo
kW
est F
oste
r Ave
nue/
Rid
gew
ayA
floo
d m
ark
disc
on
a tre
e 13
0 ft d
owns
tream
of a
ped
estri
an b
ridge
off
of
W. F
oste
r Ave
. on
the
left
bank
debr
is li
nefa
ir59
5.50
41° 5
8′ 28.
7″-8
7° 4
3′ 18.
0″
Coo
kW
est F
oste
r Ave
nue/
Rid
gew
ayA
floo
d m
ark
disc
on
a sy
cam
ore
tree
348 ft
ups
tream
of a
ped
estri
an b
ridge
of
f of W
. Fos
ter A
ve. o
n th
e rig
ht b
ank
debr
is li
nefa
ir41
° 58′ 2
8.7″
-87°
43′ 2
3.6″
Coo
kW
est F
oste
r Ave
nue/
Rid
gew
ayA
floo
d m
ark
disc
on
a po
wer
pol
e 16
0 ft u
pstre
am o
f a p
edes
trian
brid
ge o
ff of
W. F
oste
r Ave
. on
the
left
bank
in a
n al
ley
seed
line
/de
bris
line
fair
41° 5
8′ 27.
2″-8
7° 4
3′ 21.
7″
Coo
kne
ar L
awnd
ale
Pain
t 2.5
ft u
p an
abu
tmen
t dow
nstre
am o
f a b
ike
brid
ge o
n th
e rig
ht b
ank
seed
line
/de
bris
line
good
41° 5
8′ 26.
0″-8
7° 4
3′ 12.
2″
Coo
kne
ar L
awnd
ale
Penc
il an
d a
flag
1.0 ft
up
a fe
nce
post
100
ft d
owns
tream
of a
bik
e br
idge
on
the
right
ban
k ne
ar a
road
off
Law
ndal
ede
bris
line
exce
llent
41° 5
8′ 25.
0″-8
7° 4
3′ 12.
7″
Coo
kB
erna
rd S
treet
Pain
t 2.0
ft u
p an
I-be
am 2
0 ft d
owns
tream
of a
ped
estri
an b
ridge
on
the
right
ba
nkse
ed li
ne/
debr
is li
nego
od59
3.40
41° 5
8′ 18.
7″-8
7° 4
2′ 52.
9″

28 Flood of September 13–16, 2008, in Northeastern Illinois A
ppen
dix
1.
High
-Wat
er M
ark
Site
Des
crip
tion
and
Elev
atio
n at
Sel
ect S
tream
Rea
ches
, Flo
od o
f Sep
tem
ber 2
008,
Nor
thea
ster
n Ill
inoi
s.—
Cont
inue
d
Coun
tySt
reet
refe
renc
eH
igh-
wat
er m
ark
desc
ript
ion
Hig
h-w
ater
m
ark
type
Hig
h-w
ater
m
ark
ratin
g
Elev
atio
n
(ft a
bove
N
AVD
88)
Latit
ude
(deg
rees
, m
inut
es,
seco
nds)
Long
itude
(d
egre
es,
min
utes
, se
cond
s)
Coo
kB
erna
rd S
treet
Pain
t 1.5
ft u
p an
I-be
am 2
5 ft d
owns
tream
of a
ped
estri
an b
ridge
on
the
left
bank
nea
r Ber
nard
St.
seed
line
/de
bris
line
good
41° 5
8′ 19.
4″-8
7° 4
2′ 52.
8″
Coo
kSp
auld
ing
Aven
ue/
Kim
ball
Aven
uePa
int o
n a
conc
rete
reta
inin
g w
all 3
5 ft u
pstre
am o
f Kim
ball
Ave.
brid
ge o
n th
e le
ft ba
nkse
ed li
ne/
debr
is li
nefa
ir59
2.77
41° 5
8′ 19.
5″-8
7° 4
2′ 49.
4″
Coo
kSp
auld
ing
Aven
ue/
Kim
ball
Aven
ueA
floo
d m
ark
disc
on
a w
ood
reta
inin
g w
all 3
50 ft
dow
nstre
am o
f Kim
ball
Ave.
brid
ge o
n th
e le
ft ba
nkde
bris
line
exce
llent
41° 5
8′ 12.
5″-8
7° 4
2′ 44.
0″
Coo
kSp
auld
ing
Aven
ue/
Kim
ball
Aven
ueA
floo
d m
ark
disc
on
a tre
e 13
0 ft u
pstre
am o
f Spa
uldi
ng A
ve. b
rdig
e on
the
left
bank
debr
is li
nefa
ir41
° 58′ 2
4.2″
-87°
42′ 4
1.6″
Coo
kSp
auld
ing
Aven
ue/
Kim
ball
Aven
ueA
floo
d m
ark
disc
on
a tre
e 90
ft u
pstre
am o
f Spa
uldi
ng A
ve. b
ridge
on
the
left
bank
debr
is li
nefa
ir59
1.70
41° 5
8′ 24.
5″-8
7° 4
2′ 41.
3″
Coo
kK
edzi
ePa
int 6
.5 ft
up
a fe
nce
post
3 ft
dow
nstre
am o
f Ked
zie
brid
ge o
n th
e rig
ht
bank
debr
is li
nepo
or58
9.68
41° 5
8′ 28.
6″-8
7° 4
2′ 30.
8″
Coo
kA
lban
yPa
int o
n a
ston
e re
tain
ing
wal
l 70 ft
dow
nstre
am o
f a p
edes
trian
brid
ge o
n th
e rig
ht b
ank
mud
line
fair
41° 5
8′ 26.
8″-8
7° 4
2′ 21.
1″
Coo
kFo
ster
Ave
nue/
Alb
any
Pain
t on
a re
tain
ing
wal
l 53 ft
dow
nstre
am o
f Alb
any
brid
ge o
n th
e rig
ht
bank
debr
is li
neex
celle
nt41
° 58′ 2
4.0″
-87°
42′ 1
6.6″
Coo
kW
illow
Roa
dPa
int ~
5.0 ft
up
the
Will
ow R
d. e
xit r
amp
brid
ge w
ingw
all u
pstre
am o
f the
br
idge
on
the
right
ban
kse
ed li
neex
celle
nt63
7.05
42° 0
1′ 09.
7″-8
8° 1
5′ 39.
1″
Coo
kM
ilwau
kee A
venu
ePa
int 6
.5 ft
up
the
Milw
auke
e Ave
. brid
ge w
ingw
all u
pstre
am o
f the
brid
ge
on th
e rig
ht b
ank
seed
line
good
636.
1642
° 06′ 0
5.9″
-87°
53′ 0
2.7″
Coo
kN
orth
Riv
er R
oad
A fl
ood
mar
k di
sc 2
.0 ft
up
a st
aff g
age
dow
nstre
am o
f Milw
auke
e Ave
. on
the
right
ban
k an
d ea
st o
f N. R
iver
Rd.
mud
line
fair
42° 0
5′ 58.
7″-8
7° 5
3′ 23.
8″
Coo
kM
ilwau
kee A
venu
ePa
int a
nd a
flag
6.0
ft u
p th
e en
d of
a m
etal
pro
perty
fenc
e on
the
left
bank
mud
line
fair
42° 0
5′ 39.
9″-8
7° 5
3′ 10.
8″
Coo
kM
ilwau
kee A
venu
eA
floo
d m
ark
disc
3.0
-4.0
ft u
p a
wal
nut t
ree
on th
e le
ft ba
nk n
ear a
par
king
lo
tse
ed li
nego
od42
° 05′ 4
1.9″
-87°
53′ 0
9.0″
Coo
kW
est L
ake A
venu
ePa
int 4
.0 ft
up
the
upst
ream
side
of W
. Lak
e Ave
. brid
ge o
n th
e le
ft ba
nkse
ed li
nego
od63
9.13
42° 0
5′ 15.
3″-8
7° 5
3′ 13.
3″
Coo
kN
orth
Riv
er R
oad
A n
ail 1
.0 ft
up
a fe
nce
dow
nstre
am o
f E. K
ensi
ngto
n an
d on
the
right
ban
k ac
ross
N. R
iver
Rd.
(fur
ther
wes
t)m
ud li
nefa
ir42
° 04′ 4
2.7″
-87°
53′ 3
7.8″
Coo
kN
orth
Riv
er R
oad
A n
ail 1
.0 ft
up
a fe
nce
dow
nstre
am o
f E. K
ensi
ngto
n an
d on
the
right
ban
k ac
ross
N. R
iver
Rd.
(fur
ther
eas
t)m
ud li
nefa
ir42
° 04′ 4
2.7″
-87°
53′ 3
7.7″
Coo
kN
orth
Riv
er R
oad
Pain
t on
the
dow
nstre
am si
de o
f N. R
iver
Rd.
on
the
left
bank
seed
line
fair
635.
4042
° 04′ 3
9.2″
-87°
53′ 3
4.2″
Coo
kEa
st C
entra
l Roa
dPa
int o
n th
e do
wns
tream
side
of E
. Cen
tral R
d. o
n th
e rig
ht b
ank
seed
line
good
634.
6042
° 03′ 5
6.9″
-87°
53′ 1
4.4″
Coo
kEa
st G
olf R
oad
Pain
t on
the
sout
h si
de o
f the
R+R
brid
ge c
ross
ing
E. G
olf R
d. o
n th
e le
ft ba
nkse
ed li
ne/
debr
is li
nego
oda,
b632
.82
42° 0
3′ 14.
5″-8
7° 5
2′ 41.
6″
Coo
kEa
st G
olf R
oad
Pain
t on
the
dow
nstre
am si
de o
f E. G
olf R
d. b
ridge
on
the
right
ban
kse
ed li
ne/
debr
is li
neex
celle
nt63
3.55
42° 0
3′ 15.
5″-8
7° 5
3′ 15.
8″
Coo
kEa
st G
olf R
oad
A fl
ood
mar
k di
sc o
n a
pow
er p
ole
dow
nstre
am o
f the
R+R
brid
ge o
n th
e rig
ht b
ank
seed
line
/de
bris
line
good
42° 0
3′ 8.4
″-8
7° 5
2′ 56.
0″

Appendix 1 29A
ppen
dix
1.
High
-Wat
er M
ark
Site
Des
crip
tion
and
Elev
atio
n at
Sel
ect S
tream
Rea
ches
, Flo
od o
f Sep
tem
ber 2
008,
Nor
thea
ster
n Ill
inoi
s.—
Cont
inue
d
Coun
tySt
reet
refe
renc
eH
igh-
wat
er m
ark
desc
ript
ion
Hig
h-w
ater
m
ark
type
Hig
h-w
ater
m
ark
ratin
g
Elev
atio
n
(ft a
bove
N
AVD
88)
Latit
ude
(deg
rees
, m
inut
es,
seco
nds)
Long
itude
(d
egre
es,
min
utes
, se
cond
s)
Coo
kB
ig B
end
Driv
eA
floo
d m
ark
disc
3.5
ft u
p a
tree
on th
e rig
ht b
ank
in a
par
k ea
st o
f She
rman
seed
line
/de
bris
line
fair
632.
9042
° 02′ 5
3.6″
-87°
52′ 4
9.9″
Coo
kB
ig B
end
Driv
eA
mar
k on
a b
rick
light
pos
t in
fron
t of 1
964
Big
Ben
d D
r. on
the
right
ban
km
ud li
ne63
2.65
42° 0
2′ 55.
8″-8
7° 5
2′ 29.
9″
Coo
kB
ig B
end
Driv
ePa
int 2
.0 ft
up
a co
ncre
te w
all o
n th
e rig
ht b
ank
inbe
twee
n H
awth
orn
and
Big
Ben
d D
r.se
ed li
ne/
debr
is li
neex
celle
nt63
2.45
42° 0
2′ 53.
0″-8
7° 5
2′ 41.
2″
Coo
kR
and
Roa
dPa
int o
n th
e do
wns
tream
side
of R
and
Rd.
brid
ge o
n th
e le
ft ba
nkse
ed li
ne/
debr
is li
nego
od63
2.54
42° 0
2′ 39.
9″-8
7° 5
2′ 41.
7″
Coo
kR
and
Roa
dA
floo
d m
ark
disc
on
a tre
e 20
ft d
owns
tream
of R
and
Rd.
brid
ge o
n th
e rig
ht
bank
seed
line
/de
bris
line
poor
42° 0
2′ 40.
4″-8
7° 5
2′ 43.
5″
Coo
kR
and
Roa
dPa
int 3
.5 ft
up
a le
vee
wal
l 750
ft d
owns
tream
of R
and
Rd.
brid
ge o
n th
e le
ft ba
nkse
ed li
ne/
debr
is li
nego
od42
° 02′ 3
2.8″
-87°
52′ 4
0.7″
Coo
kM
iner
Stre
etPa
int 4
.5 ft
up
the
R+R
brid
ge p
ier d
owns
tream
of M
iner
St.
on th
e le
ft ba
nkse
ed li
ne/
debr
is li
nego
od63
1.68
42° 0
2′ 19.
7″-8
7° 5
2′ 56.
4″
Coo
kM
iner
Stre
etPa
int 2
.0 ft
up
the
dow
nstre
am si
de o
f Min
er S
t. br
idge
on
the
right
ban
kse
ed li
ne/
debr
is li
neex
celle
nt63
1.66
42° 0
2′ 21.
6″-8
7° 5
2′ 58.
8″
Coo
kSo
uth
Alg
onqu
in
Roa
dPa
int 2
.0 ft
up
an a
butm
ent 1
5 ft d
owns
tream
of S
. Alg
onqu
in R
d. b
ridge
on
the
left
bank
seed
line
/de
bris
line
fair
42° 0
1′ 53.
7″-8
7° 5
2′ 40.
0″
Coo
kSo
uth
Alg
onqu
in
Roa
dA
floo
d m
ark
disc
3.0
ft u
p a
pow
er p
ole
upst
ream
of S
. Alg
onqu
in R
d. o
n th
e le
ft ba
nk a
cros
s a c
amp
path
good
631.
2342
° 01′ 5
4.6″
-87°
52′ 3
2.8″
Coo
kB
erry
Lan
ePa
int 2
.0 ft
up
an e
lect
rical
box
at 1
500
Ber
ry L
n. o
n th
e rig
ht b
ank
seed
line
/de
bris
line
fair
630.
9742
° 01′ 3
7.2″
-87°
52′ 3
5.5″
Coo
kEa
st O
akto
n St
reet
Pain
t 2.0
ft u
p an
abu
tmen
t dow
nstre
am o
f E. O
akto
n St
. brid
ge o
n th
e le
ft ba
nkse
ed li
ne/
debr
is li
nefa
ir63
0.96
42° 0
1′ 29.
9″-8
7° 5
2′ 28.
1″
Coo
kI-
294
Pain
t 6.0
ft u
p an
abu
tmen
t dow
nstre
am o
f I-2
94 b
ridge
on
the
left
bank
seed
line
/de
bris
line
fair
42° 0
1′ 03.
7″-8
7° 5
1′ 58.
6″
Coo
kTo
uhy
Aven
uePa
int 2
0.0 ft
up
an a
butm
ent o
n th
e do
nwst
ream
side
of T
ouhy
Ave
. on
the
left
bank
seed
line
/de
bris
line
exce
llent
629.
8842
° 00′ 3
6.8″
-87°
51′ 3
8.4″
Coo
kD
evon
Ave
nue
Pain
t 20.
0 ft u
p an
abu
tmen
t 25 ft
dow
nstre
am o
f Dev
on A
ve. b
ridge
on
the
left
bank
seed
line
/de
bris
line
good
629.
4241
° 59′ 4
4.7″
-87°
51′ 3
2.1″
Coo
kH
iggi
ns R
oad
Pain
t on
the
abut
men
t on
the
dow
nstre
am si
de o
f Hig
gins
Rd.
brid
ge o
n th
e le
ft ba
nkse
ed li
ne/
debr
is li
nego
od41
° 59′ 1
9.8″
-87°
51′ 1
9.6″
Coo
kLa
wre
nce A
venu
ePa
int 3
.0 ft
up
an a
butm
ent o
n th
e do
wns
tream
side
of L
awre
nce A
ve. o
n th
e rig
ht b
ank
seed
line
/de
bris
line
exce
llent
627.
3341
° 57′ 5
7.7″
-87°
51′ 1
9.44
″
Coo
kLa
wre
nce A
venu
ePa
int 4
.0 ft
up
an a
butm
ent o
n th
e do
wns
tream
side
of L
awre
nce A
ve. o
n th
e le
ft ba
nkse
ed li
ne/
debr
is li
nego
od62
7.24
41° 5
7′ 57.
7″-8
7° 5
1′ 16.
5″
Coo
kIr
ving
Par
k R
oad
Pain
t 1.5
ft u
p a
guar
d ra
il on
the
dow
nstre
am si
de o
f Irv
ing
Park
Rd.
on
the
right
ban
k so
uth
of th
e ca
noe
laun
chgo
od62
6.39
41° 5
7′ 11.
6″-8
7° 5
1′ 21.
8″
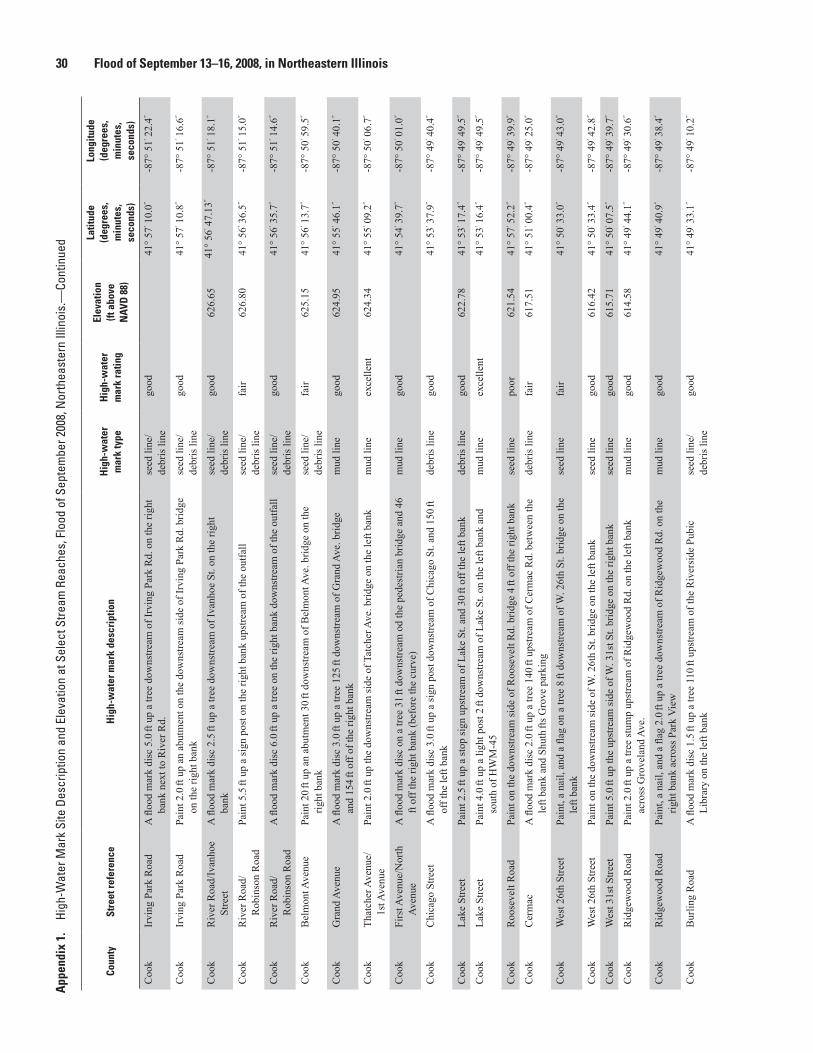
30 Flood of September 13–16, 2008, in Northeastern Illinois A
ppen
dix
1.
High
-Wat
er M
ark
Site
Des
crip
tion
and
Elev
atio
n at
Sel
ect S
tream
Rea
ches
, Flo
od o
f Sep
tem
ber 2
008,
Nor
thea
ster
n Ill
inoi
s.—
Cont
inue
d
Coun
tySt
reet
refe
renc
eH
igh-
wat
er m
ark
desc
ript
ion
Hig
h-w
ater
m
ark
type
Hig
h-w
ater
m
ark
ratin
g
Elev
atio
n
(ft a
bove
N
AVD
88)
Latit
ude
(deg
rees
, m
inut
es,
seco
nds)
Long
itude
(d
egre
es,
min
utes
, se
cond
s)
Coo
kIr
ving
Par
k R
oad
A fl
ood
mar
k di
sc 5
.0 ft
up
a tre
e do
wns
tream
of I
rvin
g Pa
rk R
d. o
n th
e rig
ht
bank
nex
t to
Riv
er R
d.se
ed li
ne/
debr
is li
nego
od41
° 57′ 1
0.0″
-87°
51′ 2
2.4″
Coo
kIr
ving
Par
k R
oad
Pain
t 2.0
ft u
p an
abu
tmen
t on
the
dow
nstre
am si
de o
f Irv
ing
Park
Rd.
brid
ge
on th
e rig
ht b
ank
seed
line
/de
bris
line
good
41° 5
7′ 10.
8″-8
7° 5
1′ 16.
6″
Coo
kR
iver
Roa
d/Iv
anho
e St
reet
A fl
ood
mar
k di
sc 2
.5 ft
up
a tre
e do
wns
tream
of I
vanh
oe S
t. on
the
right
ba
nkse
ed li
ne/
debr
is li
nego
od62
6.65
41° 5
6′ 47.
13″
-87°
51′ 1
8.1″
Coo
kR
iver
Roa
d/R
obin
son
Roa
dPa
int 5
.5 ft
up
a si
gn p
ost o
n th
e rig
ht b
ank
upst
ream
of t
he o
utfa
llse
ed li
ne/
debr
is li
nefa
ir62
6.80
41° 5
6′ 36.
5″-8
7° 5
1′ 15.
0″
Coo
kR
iver
Roa
d/R
obin
son
Roa
dA
floo
d m
ark
disc
6.0
ft u
p a
tree
on th
e rig
ht b
ank
dow
nstre
am o
f the
out
fall
seed
line
/de
bris
line
good
41° 5
6′ 35.
7″-8
7° 5
1′ 14.
6″
Coo
kB
elm
ont A
venu
ePa
int 2
0 ft u
p an
abu
tmen
t 30 ft
dow
nstre
am o
f Bel
mon
t Ave
. brid
ge o
n th
e rig
ht b
ank
seed
line
/de
bris
line
fair
625.
1541
° 56′ 1
3.7″
-87°
50′ 5
9.5″
Coo
kG
rand
Ave
nue
A fl
ood
mar
k di
sc 3
.0 ft
up
a tre
e 12
5 ft d
owns
tream
of G
rand
Ave
. brid
ge
and
154 ft
off
of th
e rig
ht b
ank
mud
line
good
624.
9541
° 55′ 4
6.1″
-87°
50′ 4
0.1″
Coo
kTh
atch
er A
venu
e/
1st A
venu
ePa
int 2
.0 ft
up
the
dow
nstre
am si
de o
f Tat
cher
Ave
. brid
ge o
n th
e le
ft ba
nkm
ud li
neex
celle
nt62
4.34
41° 5
5′ 09.
2″-8
7° 5
0′ 06.
7″
Coo
kFi
rst A
venu
e/N
orth
Av
enue
A fl
ood
mar
k di
sc o
n a
tree
31 ft
dow
nstre
am o
d th
e pe
dest
rian
brid
ge a
nd 4
6
ft of
f the
righ
t ban
k (b
efor
e th
e cu
rve)
mud
line
good
41° 5
4′ 39.
7″-8
7° 5
0′ 01.
0″
Coo
kC
hica
go S
treet
A fl
ood
mar
k di
sc 3
.0 ft
up
a si
gn p
ost d
owns
tream
of C
hica
go S
t. an
d 15
0 ft
off t
he le
ft ba
nkde
bris
line
good
41° 5
3′ 37.
9″-8
7° 4
9′ 40.
4″
Coo
kLa
ke S
treet
Pain
t 2.5
ft u
p a
stop
sign
ups
tream
of L
ake
St. a
nd 3
0 ft o
ff th
e le
ft ba
nkde
bris
line
good
622.
7841
° 53′ 1
7.4″
-87°
49′ 4
9.5″
Coo
kLa
ke S
treet
Pain
t 4.0
ft u
p a
light
pos
t 2 ft
dow
nstre
am o
f Lak
e St
. on
the
left
bank
and
so
uth
of H
WM
-45
mud
line
exce
llent
41° 5
3′ 16.
4″-8
7° 4
9′ 49.
5″
Coo
kR
oose
velt
Roa
dPa
int o
n th
e do
wns
tream
side
of R
oose
velt
Rd.
brid
ge 4
ft o
ff th
e rig
ht b
ank
seed
line
poor
621.
5441
° 57′ 5
2.2″
-87°
49′ 3
9.9″
Coo
kC
erm
acA
floo
d m
ark
disc
2.0
ft u
p a
tree
140 ft
ups
tream
of C
erm
ac R
d. b
etw
een
the
left
bank
and
Shu
th ft
s Gro
ve p
arki
ngde
bris
line
fair
617.
5141
° 51′ 0
0.4″
-87°
49′ 2
5.0″
Coo
kW
est 2
6th
Stre
etPa
int,
a na
il, a
nd a
flag
on
a tre
e 8 ft
dow
nstre
am o
f W. 2
6th
St. b
ridge
on
the
left
bank
seed
line
fair
41° 5
0′ 33.
0″-8
7° 4
9′ 43.
0″
Coo
kW
est 2
6th
Stre
etPa
int o
n th
e do
wns
tream
side
of W
. 26t
h St
. brid
ge o
n th
e le
ft ba
nkse
ed li
nego
od61
6.42
41° 5
0′ 33.
4″-8
7° 4
9′ 42.
8″
Coo
kW
est 3
1st S
treet
Pain
t 5.0
ft u
p th
e up
stre
am si
de o
f W. 3
1st S
t. br
idge
on
the
right
ban
kse
ed li
nego
od61
5.71
41° 5
0′ 07.
5″-8
7° 4
9′ 39.
7″
Coo
kR
idge
woo
d R
oad
Pain
t 2.0
ft u
p a
tree
stum
p up
stre
am o
f Rid
gew
ood
Rd.
on
the
left
bank
ac
ross
Gro
vela
nd A
ve.
mud
line
good
614.
5841
° 49′ 4
4.1″
-87°
49′ 3
0.6″
Coo
kR
idge
woo
d R
oad
Pain
t, a
nail,
and
a fl
ag 2
.0 ft
up
a tre
e do
wns
tream
of R
idge
woo
d R
d. o
n th
e rig
ht b
ank
acro
ss P
ark
Vie
wm
ud li
nego
od41
° 49′ 4
0.9″
-87°
49′ 3
8.4″
Coo
kB
urlin
g R
oad
A fl
ood
mar
k di
sc 1
.5 ft
up
a tre
e 11
0 ft u
pstre
am o
f the
Riv
ersi
de P
ubic
Li
brar
y on
the
left
bank
seed
line
/de
bris
line
good
41° 4
9′ 33.
1″-8
7° 4
9′ 10.
2″

Appendix 1 31A
ppen
dix
1.
High
-Wat
er M
ark
Site
Des
crip
tion
and
Elev
atio
n at
Sel
ect S
tream
Rea
ches
, Flo
od o
f Sep
tem
ber 2
008,
Nor
thea
ster
n Ill
inoi
s.—
Cont
inue
d
Coun
tySt
reet
refe
renc
eH
igh-
wat
er m
ark
desc
ript
ion
Hig
h-w
ater
m
ark
type
Hig
h-w
ater
m
ark
ratin
g
Elev
atio
n
(ft a
bove
N
AVD
88)
Latit
ude
(deg
rees
, m
inut
es,
seco
nds)
Long
itude
(d
egre
es,
min
utes
, se
cond
s)
Coo
kSt
ate
Stre
et/
154t
h St
reet
Pain
t 1.5
ft u
p an
abu
tnm
ent o
n th
e do
wns
tream
side
of S
tate
St.
brid
ge o
n th
e le
ft ba
nkde
bris
line
exce
llent
41° 3
6′ 58.
2″-8
7° 3
7′ 01.
5″
Coo
kSt
ate
Stre
et/
154t
h St
reet
A fl
ood
mar
k di
sc 4
.0 ft
up
a co
ttonw
ood
tree
65 ft
ups
tream
of S
tate
St.
brid
ge o
n th
e le
ft ba
nkde
bris
line
fair
41° 3
6′ 58.
0″-8
7° 3
7′ 00.
2 “
Coo
k15
9th
Stre
etA
floo
d m
ark
disc
3.0
ft u
p a
tree
1 ft d
owns
tream
of 1
59th
St.
brid
ge o
n th
e rig
ht b
ank
seed
line
exce
llent
41° 3
6′ 03.
8-8
7° 3
4′ 38.
3″
Coo
k15
9th
Stre
etPa
int 6
.0 ft
up
an a
butm
ent o
n th
e do
wns
tream
side
of 1
59th
St.
brid
ge o
n th
e rig
ht b
ank
seed
line
exce
llent
41° 3
6′ 03.
8″-8
7° 3
4′ 36.
4″
Coo
k15
9th
Stre
etPa
int 5
.0 ft
up
the
159t
h St
. brid
ge w
ingw
all d
owns
tream
of t
he b
ridge
on
the
left
bank
debr
is li
nefa
ir41
° 36′ 0
3.8″
-87°
34′ 4
1.0″
Coo
kR
oute
6/8
3 (T
orre
nce
Aven
ue)
Pain
t 7.2
ft u
p th
e To
rren
ce A
ve. b
ridge
win
gwal
l dow
nstre
am o
f the
brid
ge
on th
e rig
ht b
ank
seed
line
/de
bris
line
good
41° 3
5′ 41.
0″-8
7° 3
3′ 31.
6″
Coo
kB
urna
m A
venu
ePa
int 5
.5 ft
up
a re
tain
ing
wal
l 70 ft
dow
nstre
am o
f Bur
nam
Ave
. brid
ge o
n th
e le
ft ba
nkde
bris
line
exce
llent
/go
od41
° 35′ 1
1.8″
-87°
32′ 2
3.1″
Coo
kW
entw
orth
Ave
nue
A fl
ood
mar
k di
sc 7
.0 ft
up
a tre
e 20
.2 ft
ups
tream
of W
entw
orth
Ave
. brid
ge
near
the
right
ban
kse
ed li
nego
od41
° 35′ 0
5.4″
-87°
31′ 4
6.6″
Coo
kW
entw
orth
Ave
nue
Pain
t 4.8
ft u
p th
e W
entw
orth
Ave
. brid
ge w
ingw
all 8
ft d
owns
tream
of t
he
brid
ge o
n th
e le
ft ba
nkde
bris
line
good
41° 3
5′ 05.
4″-8
7° 3
1′ 48.
8″
Coo
kSt
ate
Stre
etPa
int 4
.0 ft
up
an a
butm
ent o
n th
e do
wns
tream
side
of S
tate
St.
brid
ge o
n th
e rig
ht b
ank
mud
line
good
41° 3
6′ 10.
1″-8
7° 3
6′ 57.
6″
Addi
son
Cree
k
Coo
kR
hode
s Ave
nue
Pain
t 2.5
ft u
p th
e el
ectri
c st
atio
n fe
nce
40 ft
dow
nstre
am fr
om a
wal
king
pa
th o
ff of
Rho
des A
ve. o
n th
e rig
ht b
ank
seed
line
/m
ud li
nego
od41
° 55′ 4
2.9″
-87°
54′ 3
7.1″
Coo
kFu
llerto
n Av
enue
Pain
t on
a co
ncre
te c
ulve
rt 28
ft u
pstre
am fr
om a
foot
pat
h of
f of F
ulle
rton
Ave.
on
the
right
ban
km
ud li
nefa
ir41
° 55′ 1
6.3″
-87°
54′ 3
1.7″
Coo
kA
utom
atic
Ele
ctric
D
rive
Pain
t on
the A
utom
atic
Ele
ctric
Dr.
brid
ge w
ingw
all d
owns
tream
of t
he
brid
ge o
n th
e rig
ht b
ank
seed
line
poor
41° 5
4′ 50.
9″-8
7° 5
4′ 18.
7″
Coo
kN
orth
Pra
ter A
venu
ePa
int o
n on
the
dow
nstre
am si
de o
f N. P
rate
r Ave
. brid
ge o
n th
e le
ft ba
nkse
ed li
nego
od41
° 54′ 3
0.8″
-87°
53′ 5
7.8″
Coo
kN
orth
Roy
Ave
nue
A fl
ood
mar
k di
sc so
uth
of p
layg
roun
d eq
uipm
ent 1
38 ft
dow
nstre
am o
f N.
Roy
Ave
. brid
ge o
n th
e rig
ht b
ank
mud
line
good
41° 5
4′ 32.
0″-8
7° 5
3′ 43.
7″
Coo
kN
orth
Rob
erta
Av
enue
A fl
ood
mar
k di
sc 0
.5 ft
up
a tre
e 77
ft d
owns
tream
of N
. Ror
berta
Ave
. br
idge
on
the
right
ban
km
ud li
nego
od63
9.56
41° 5
4′ 32.
2″-8
7° 5
3′ 35.
4″
Coo
kM
orse
Driv
ePa
int o
n co
ncre
te g
roun
d on
the
dow
nstre
am si
de o
f Mor
se D
r. br
idge
on
the
left
bank
mud
line
poor
41° 5
4′ 22.
2″-8
7° 5
3′ 27.
0″
Coo
kEa
st H
irsch
Ave
nue
Pain
t up
a 1.
0 ft u
p a
hand
rail
7 ft d
owns
tream
of E
. Hirs
ch A
ve. b
ridge
on
the
right
ban
km
ud li
ne41
° 54′ 1
1.5″
-87°
53′ 2
4.5″
Coo
kA
lley
betw
een
45th
an
d 46
th A
venu
ePa
int 3
.0 ft
up
a m
an h
ole
on th
e le
ft ba
nkm
ud li
nego
od41
° 54′ 0
.29″
-87°
53′ 1
7.0″

32 Flood of September 13–16, 2008, in Northeastern Illinois A
ppen
dix
1.
High
-Wat
er M
ark
Site
Des
crip
tion
and
Elev
atio
n at
Sel
ect S
tream
Rea
ches
, Flo
od o
f Sep
tem
ber 2
008,
Nor
thea
ster
n Ill
inoi
s.—
Cont
inue
d
Coun
tySt
reet
refe
renc
eH
igh-
wat
er m
ark
desc
ript
ion
Hig
h-w
ater
m
ark
type
Hig
h-w
ater
m
ark
ratin
g
Elev
atio
n
(ft a
bove
N
AVD
88)
Latit
ude
(deg
rees
, m
inut
es,
seco
nds)
Long
itude
(d
egre
es,
min
utes
, se
cond
s)
Coo
kN
orth
40t
h Av
enue
A fl
ood
mar
k di
sc 1
.0 ft
up
a po
wer
pol
e 2 ft
off
the
left
bank
nex
t to
an a
lley
mud
line
/de
bris
line
good
41° 5
3′ 55.
4″-8
7° 5
2′ 58.
8″
Coo
kN
orth
40t
h Av
enue
Pain
t 1.4
ft u
p a
fenc
e at
the
end
of N
. 40t
h Av
e. o
n th
e rig
ht b
ank
debr
is li
nego
od41
° 53′ 5
3.8″
-87°
52′ 5
6.3″
Coo
kN
orth
40t
h Av
enue
A m
ud li
ne 1
.4 ft
up
the
north
side
of 1
511
N. 4
0th
Ave.
hou
se o
n th
e of
f the
rig
ht b
ank
mud
line
good
41° 5
3′ 53.
4″-8
7° 5
2′ 55.
7″
Coo
kEa
ster
n/
R+R
brid
geA
nai
l and
floo
d m
ark
disc
on
the
dow
nstre
am si
de o
f the
Eas
tern
R+R
br
idge
on
the
right
ban
km
ud li
nego
od41
° 53′ 2
8.4″
-87°
52′ 1
7.4″
Coo
kSt
. Cha
rles R
oad
Pain
t 3.0
ft u
p on
the
dow
nstre
am si
de o
f St.
Cha
rles R
d. b
ridge
on
the
left
bank
debr
is li
nepo
or41
° 53′ 1
2.6″
-87°
52′ 1
3.8″
Coo
kH
arris
on S
treet
Pain
t on
the
conc
rete
146
ft d
owns
tream
of 3
0th
Ave.
brid
ge o
n th
e rig
ht
bank
mud
line
fair
41° 5
2′ 17.
8″-8
7° 5
2′ 11.
8″
Coo
kW
edge
woo
d R
oad
Pain
t 4 ft
10″ u
p th
e W
edge
woo
d R
d. b
ridge
pie
r dow
nstre
am o
f the
brid
ge
on th
e le
ft ba
nkm
ud li
nefa
ir41
° 52′ 1
3.6″
-87°
52′ 2
0.0″
Coo
kG
lads
tone
Stre
etPa
int o
n th
e G
alds
tone
St.
brid
ge w
ingw
all 5
ft d
owns
tream
of t
he b
ridge
on
the
left
bank
mud
line
fair
41° 5
2′ 01.
8″-8
7° 5
2′ 19.
9″
Coo
kG
ardn
er R
oad
A n
ail a
nd fl
ood
mar
k di
sc 4
ft 3
″ up
a tre
e 23
ft u
pstre
am o
f Gar
dner
Rd.
br
idge
on
the
right
ban
kfa
ir41
° 51′ 4
0.4″
-87°
52′ 0
3.7″
Coo
kW
est 2
1st A
venu
ePa
int o
n co
ncre
te g
roun
d 8 ft
dow
nstre
am o
f W. 1
2st A
ve. o
n th
e rig
ht b
ank
good
41° 5
1′ 04.
1″-8
7° 5
1′ 24.
0″
Salt
Cree
k
Coo
k31
st S
treet
Pain
t on
a 31
st S
t. br
idge
win
gwal
l 6 ft
dow
nstre
am o
f the
brid
ge o
n th
e le
ft ba
nkm
ud li
nefa
ir41
° 50′ 0
5.9″
-87°
50′ 3
3.5″
Coo
kM
onro
e Ave
nue
Pain
t on
a pi
er e
ast o
f Mon
roe A
ve. o
n th
e rig
ht b
ank
41° 4
9′ 46.
6″-8
7° 5
0′ 36.
9″
Coo
kW
ashi
ngto
nPa
int o
n a
Was
hing
ton
brid
ge w
ingw
all d
owns
tream
of t
he b
ridge
on
the
left
bank
seed
line
exce
llent
41° 4
9′ 39.
7″-8
7° 5
0′ 33.
6″
Coo
kB
rook
feild
Ave
nue
A m
ark
on th
e no
rth si
de o
f Bro
okfie
ld A
ve. b
ridge
on
the
wes
t ban
kse
ed li
ne/
debr
is li
neex
celle
nt41
° 49′ 2
1.8″
-87°
50′ 3
0.6″
Popl
ar C
reek
Coo
kVa
rsity
Driv
eA
nai
l on
a fe
nce
25 ft
dow
nstre
am o
f Var
sity
Dr.
on th
e le
ft ba
nkde
bris
line
good
42° 0
1′ 33.
0″-8
8° 1
5′ 02.
1″
Coo
kB
luff
City
Bou
leva
rdA
floo
d m
ark
disc
~4.
0 ft u
p a
tree
80 ft
dow
nstre
am o
f Blu
ff C
ity B
lvd.
br
idge
on
the
left
bank
good
42° 0
1′ 08.
6″-8
8° 1
5′ 38.
6″
Coo
kB
luff
City
Bou
leva
rdPa
int ~
5.0 ft
up
the
upst
ream
side
of B
luff
City
Blv
d. o
n th
e rig
ht b
ank
fair
42° 0
1′ 08.
6″-8
8° 1
5′ 38.
6″
Kan
eH
amm
ond
Aven
ueA
nai
l in
the
flood
pla
in 3
3 ft so
uth
of H
amm
ond
Ave.
and
nor
th o
f Pop
lar
Cre
ekgo
od42
° 00′ 5
5.2″
-88°
15′ 5
9.9″
Kan
eH
amm
ond
Aven
ueA
floo
d m
ark
disc
in th
e flo
od p
lain
53 ft
sout
h of
Ham
mon
d Av
e. a
nd n
orth
of
Pop
lar C
reek
nea
r a g
reen
hou
se ft
s fen
cego
od42
° 00′ 5
4.7″
-88°
16′ 0
4.6″

Appendix 1 33A
ppen
dix
1.
High
-Wat
er M
ark
Site
Des
crip
tion
and
Elev
atio
n at
Sel
ect S
tream
Rea
ches
, Flo
od o
f Sep
tem
ber 2
008,
Nor
thea
ster
n Ill
inoi
s.—
Cont
inue
d
Coun
tySt
reet
refe
renc
eH
igh-
wat
er m
ark
desc
ript
ion
Hig
h-w
ater
m
ark
type
Hig
h-w
ater
m
ark
ratin
g
Elev
atio
n
(ft a
bove
N
AVD
88)
Latit
ude
(deg
rees
, m
inut
es,
seco
nds)
Long
itude
(d
egre
es,
min
utes
, se
cond
s)
East
Bra
nch
DuPa
ge R
iver
DuP
age
Vete
ran′ s
Park
way
A n
ail,
flood
mar
k di
sc, a
nd fl
ag ~
2.5 ft
up
a br
oken
tree
lim
b 20
0 ft
upst
ream
of V
eter
an ft
s Pkw
y br
idge
on
the
right
ban
km
ud li
nepo
or63
5.18
41° 4
2′ 41.
4″-8
8° 0
7′ 38.
7″
DuP
age
Vete
ran′ s
Park
way
A n
ail a
nd fl
ag ~
3.0 ft
up
a de
ad tr
ee 1
25 ft
ups
tream
of V
eter
an ft
s Pkw
y br
idge
on
the
right
ban
km
ud li
nepo
or41
° 42′ 4
1.9″
-88°
07′ 3
9.3″
DuP
age
Roy
ce R
oad/
Wha
lon
Lake
Pain
t, a
nail,
and
a fl
ood
mar
k di
sc a
t a tr
ee st
ump
dow
nstre
am o
f Wha
lon
Lake
on
the
right
ban
km
ud li
ne/
debr
is li
nefa
ir64
2.78
41°
42′ 4
5.9″
-88°
05′ 4
7.4″
DuP
age
75th
Stre
et/H
ighw
ay
33Pa
int a
nd a
chi
sele
d m
ark
on th
e 75
th S
t. br
idge
win
gwal
l 10 ft
ups
tream
of
the
brid
ge o
n th
e rig
ht b
ank
debr
is li
nego
od/fa
ir41
° 44′ 5
9.8″
-88°
04′ 1
0.6″
DuP
age
Arli
ngto
n D
rive
A fl
ood
mar
k di
sc a
nd fl
ag 4
.0 ft
up
a tre
e 5 ft
ups
tream
of A
rling
ton
Dr.
brid
ge o
n th
e le
ft ba
nkse
ed li
nepo
or77
3.79
41° 5
8′ 29.
5″-8
8° 0
8′ 18.
8″
DuP
age
Arli
ngto
n D
rive
A fl
ood
mar
k di
sc a
nd fl
ag 5
.0 ft
up
a tre
e do
wns
tream
of A
rling
ton
Dr.
brid
ge o
n th
e rig
ht b
ank
debr
is li
nefa
ir77
2.91
41° 5
8′ 29.
4″-8
8° 0
8′ 20.
0″
DuP
age
Shic
k R
oad
A fl
ood
mar
k di
sc a
nd fl
ag 5
.0 ft
up
a tre
e 80
ft u
pstre
am o
f Shi
ck R
d. b
ridge
on
the
right
ban
kde
bris
line
fair
744.
0541
° 57′ 0
5.8″
-88°
10′ 5
7.4″
DuP
age
Shic
k R
oad
A fl
ood
mar
k di
sc a
nd fl
ag 4
.0 ft
up
a tre
e 60
ft d
owns
tream
of S
hick
Rd.
br
idge
on
the
right
ban
kde
bris
line
poor
41° 5
7′ 04.
2″-8
8° 1
0′ 57.
9″
DuP
age
Shic
k R
oad
A fl
ood
mar
k di
sc a
nd fl
ag 3
.0 ft
up
a tre
e 40
ft d
owns
tream
of S
hick
Rd.
B
ridge
on
the
left
bank
debr
is li
nepo
or74
3.23
41° 5
7′ 04.
4″-8
8° 1
0′ 57.
1″
DuP
age
Shic
k R
oad
A fl
ood
mar
k di
sc a
nd fl
ag 3
.0 ft
up
a tre
e 50
ft d
owns
tream
of S
hick
Rd.
B
ridge
on
the
left
bank
debr
is li
nepo
or74
3.12
41° 5
7′ 04.
3″-8
8° 1
0′ 57.
1″
DuP
age
Shic
k R
oad
A fl
ag o
n bi
ke b
ridge
30 ft
dow
nste
am o
f Shi
ck R
d. b
ridge
de
bris
line
poor
742.
9441
° 57′ 0
4.4″
-88°
10′ 5
7.9″
DuP
age
Arm
y Tr
ail R
oad
A fl
ood
mar
k di
sc a
nd fl
ag 6
.0 ft
up
a tre
e 60
ft u
pstre
am o
f Arm
y Tr
ail R
.d
brid
ge o
n th
e le
ft ba
nkde
bris
line
poor
740.
9041
° 56′ 3
8.9″
-88°
10′ 5
1.1″
DuP
age
Arm
y Tr
ail R
oad
A fl
ood
mar
k di
sc a
nd fl
ag 5
.0 ft
up
a tre
e 65
ft u
pstre
am o
f Arm
y Tr
ail R
d.
brid
ge o
n th
e rig
ht b
ank
debr
is li
nepo
or74
0.45
41° 5
6′ 39.
1″-8
8° 1
0′ 51.
8″
DuP
age
Arm
y Tr
ail R
oad
A fl
ood
mar
k di
sc a
nd fl
ag 5
.0 ft
up
a tre
e 60
ft u
pstre
am o
f Arm
y Tr
ail R
d.
brid
ge o
n th
e rig
ht b
ank
debr
is li
nepo
or74
0.79
41° 5
6′ 39.
0″-8
8° 1
0′ 51.
7″
DuP
age
Arm
y Tr
ail R
oad
A fl
ood
mar
k di
sc a
nd fl
ag 7
.0 ft
up
a tre
e 12
0 ft d
owns
tream
of A
rmy
Trai
l R
d. o
n th
e le
ft ba
nkde
bris
line
poor
741.
0041
° 56′ 3
6.6″
-88°
10′ 5
0.3″
DuP
age
Arm
y Tr
ail R
oad
A fl
ood
mar
k di
sc a
nd fl
ag 7
.0 ft
up
a tre
e 10
0 ft d
owns
tream
of A
rmy
Trai
l R
d. o
n th
e le
ft ba
nkde
bris
line
poor
740.
8241
° 56′ 3
6.8″
-88°
10′ 5
0.2″
DuP
age
Gen
eva
Roa
dA
floo
d m
ark
disc
and
flag
5.0
ft u
p a
tree
25 ft
ups
tream
of G
enev
a R
d.
brid
ge o
n th
e rig
ht b
ank
debr
is li
nepo
or72
0.44
41° 5
3′ 13.
6″-8
8° 0
9′ 34.
9″
DuP
age
Gen
eva
Roa
dA
floo
d m
ark
disc
and
flag
4.0
ft u
p a
tree
clus
ter 2
0 ft u
pstre
am o
f Gen
eva
Rd.
brid
ge o
n th
e rig
ht b
ank
debr
is li
nepo
or72
0.21
41° 5
3′ 13.
5″-8
8° 0
9′ 35.
0″

34 Flood of September 13–16, 2008, in Northeastern Illinois A
ppen
dix
1.
High
-Wat
er M
ark
Site
Des
crip
tion
and
Elev
atio
n at
Sel
ect S
tream
Rea
ches
, Flo
od o
f Sep
tem
ber 2
008,
Nor
thea
ster
n Ill
inoi
s.—
Cont
inue
d
Coun
tySt
reet
refe
renc
eH
igh-
wat
er m
ark
desc
ript
ion
Hig
h-w
ater
m
ark
type
Hig
h-w
ater
m
ark
ratin
g
Elev
atio
n
(ft a
bove
N
AVD
88)
Latit
ude
(deg
rees
, m
inut
es,
seco
nds)
Long
itude
(d
egre
es,
min
utes
, se
cond
s)
DuP
age
Bee
cher
Roa
dPa
int a
nd a
chi
sele
d m
ark
1.0 ft
up
an a
butm
ent 3
ft u
pstre
am o
f Bee
cher
Rd.
br
idge
on
the
left
bank
debr
is li
nefa
ir71
3.29
41° 5
2′ 09.
8″-8
8° 0
9′ 46.
1″
DuP
age
Bay
nes A
venu
eA
floo
d m
ark
disc
6.0
ft u
p un
der a
tree
bra
nch
300 ft
dow
nstre
am o
f dam
on
the
left
bank
seed
line
exce
llent
/go
od71
1.17
41° 5
2′ 16.
3″-8
8° 1
0′ 39.
8″
DuP
age
Hig
hway
38
A fl
ood
mar
k di
sc a
nd fl
ag o
n a
tree
3 ft d
owns
tream
of H
ighw
ay 3
8 br
idge
on
the
left
bank
debr
is li
nefa
ir70
7.36
41° 5
1′ 40.
4″-8
8° 1
1′ 32.
9″
DuP
age
Hig
hway
38
Wax
pen
cil m
ark
on a
n ab
utm
ent o
n th
e do
wns
tream
side
of H
ighw
ay 3
8 br
idge
on
the
left
bank
seed
line
poor
41° 5
1′ 40.
4″-8
8° 1
1′ 32.
8″
DuP
age
Hig
hway
38
A fl
ood
mar
k di
sc a
nd fl
ag 4
.0 ft
up
a tre
e 1 ft
dow
nstre
am o
f Hig
hway
38
on
the
left
bank
debr
is li
nefa
ir70
7.87
41° 5
1′ 40.
4″-8
8° 1
1′ 33.
0″
DuP
age
Hig
hway
38
A fl
ood
mar
k di
sc a
nd fl
ag 5
.0 ft
up
a tre
e 5 ft
ups
tream
of H
ighw
ay 3
8 br
idge
on
the
left
bank
debr
is li
nefa
ir70
7.72
41° 5
1′ 41.
1″-8
9° 1
1′ 32.
5″
DuP
age
Gar
y′ s M
ill R
oad
Wax
pen
cil m
ark
on st
reet
bea
m o
n th
e do
wns
tream
side
of G
ary ft
s Mill
Rd.
on
the
right
ban
km
ud li
nefa
irN
R41
° 51′ 2
9.5″
-88°
11′ 3
7.7″
DuP
age
Gar
y′ s M
ill R
oad
A fl
ood
mar
k di
sc ~
5.0
ft u
p on
smal
l tre
e 15
ft d
owns
tream
of G
ary ft
s Mill
R
d. b
ridge
on
the
right
ban
kde
bris
line
fair
707.
2341
° 51′ 2
9.3″
-88°
11′ 3
7.5″
DuP
age
Gar
y′ s M
ill R
oad
A fl
ood
mar
k di
sc ~
5.0
ft u
p on
smal
l tre
e 15
ft d
owns
tream
of G
ary ft
s Mill
R
d. b
ridge
on
the
right
ban
kde
bris
line
fair
707.
1241
° 51′ 2
9.4″
-88°
11′ 3
7.7″
DuP
age
Gar
y′ s M
ill R
oad
A fl
ood
mar
k di
sc ~
5.0
ft u
p on
smal
l tre
e 15
ft d
owns
tream
of G
ary ft
s Mill
R
d. b
ridge
on
the
right
ban
kde
bris
line
fair
707.
4041
° 51′ 2
9.5″
-88°
11′ 3
7.9″
DuP
age
Gar
y′ s M
ill R
oad
A fl
ood
mar
k di
sc ~
5.0
ft u
p on
smal
l tre
e 15
ft d
owns
tream
of G
ary ft
s Mill
R
d. b
ridge
on
the
right
ban
kde
bris
line
fair
707.
2941
° 51′ 2
9.7″
-88°
11′ 3
8.2″
DuP
age
Mac
k R
oad
A fl
ood
mar
k di
sc o
n th
e gr
avel
driv
e do
wns
tream
of M
ack
Rd.
and
85 ft
off
the
left
bank
debr
is li
nefa
irN
R41
° 50′ 3
2.4″
-88°
11′ 5
3.5″
DuP
age
Will
iam
s Roa
dA
floo
d m
ark
disc
on
the
upst
ream
side
of W
illia
ms R
d. 3
0 ft o
ff th
e rig
ht
bank
beat
en g
rass
poor
NR
41° 4
9′ 46.
4″-8
8° 1
1′ 25.
5″
DuP
age
Will
iam
s Roa
dA
floo
d m
ark
disc
2.7
ft u
p a
tree
upst
ream
of W
illia
ms R
d. b
ridge
10 ft
off
the
right
ban
km
ud li
nepo
or69
8.49
41° 4
9′ 46.
6″-8
8° 1
1′ 25.
5″
DuP
age
Will
iam
s Roa
dA
flag
30 ft
dow
nstre
am o
f Will
iam
s Rd.
brid
ge 3
0 ft o
ff th
e rig
ht b
ank
beat
en g
rass
poor
NR
41° 4
9′ 46.
3″-8
8° 1
1′ 24.
9″
DuP
age
Bat
avia
Roa
dPa
int 5
.0 ft
up
the
Bat
avia
Rd.
brid
ge w
ingw
all d
owns
tream
of t
he b
ridge
on
the
left
bank
mud
line
/de
bris
line
good
697.
5841
° 49′ 4
2.5″
-88°
11′ 0
5.9″
DuP
age
But
terf
eild
Roa
d/Ill
inoi
s R
oute
56
A fl
ag 2
.0 ft
up
a tre
e 30
ft d
owns
tream
of B
utte
rfiel
d R
d. p
edes
trian
brid
ge
on th
e rig
ht b
ank
debr
is li
nefa
irN
R41
° 49′ 2
9.5
-88°
10′ 4
4.1″
DuP
age
War
renv
ille
Roa
dPa
int 3
.0 ft
the
north
side
of a
hou
se 2
00 ft
dow
nstre
am o
f War
renv
ille
Rd.
ea
st o
f Riv
er R
d.pa
int
694.
2741
° 49′ 0
1.7″
-88°
10′ 2
0.1″
DuP
age
Die
hl S
treet
A fl
ag 2
.0 ft
up
a fe
nce
20 ft
dow
nstre
am o
f Dei
hl S
t. br
idge
on
the
left
bank
mud
line
fair
691.
7541
° 48′ 1
6.8″
-88°
10′ 3
6.5″
DuP
age
Die
hl S
treet
A fl
ag 3
.0 ft
up
a fe
nce
35 ft
ups
tream
of D
eihl
St.
brid
ge o
n th
e le
ft ba
nkm
ud li
nefa
ir69
1.22
41° 4
8′ 17.
7″-8
8° 1
0′ 35.
2″

Appendix 1 35A
ppen
dix
1.
High
-Wat
er M
ark
Site
Des
crip
tion
and
Elev
atio
n at
Sel
ect S
tream
Rea
ches
, Flo
od o
f Sep
tem
ber 2
008,
Nor
thea
ster
n Ill
inoi
s.—
Cont
inue
d
Coun
tySt
reet
refe
renc
eH
igh-
wat
er m
ark
desc
ript
ion
Hig
h-w
ater
m
ark
type
Hig
h-w
ater
m
ark
ratin
g
Elev
atio
n
(ft a
bove
N
AVD
88)
Latit
ude
(deg
rees
, m
inut
es,
seco
nds)
Long
itude
(d
egre
es,
min
utes
, se
cond
s)
DuP
age
Die
hl S
treet
A fl
ag 6
.0 ft
up
a tre
e 5 ft
dow
nstre
am o
f Dei
hl S
t. br
idge
on
the
left
bank
go
od69
1.98
41° 4
8′ 16.
9″-8
8° 1
0′ 36.
2″
DuP
age
Die
hl S
treet
A fl
ood
mar
k di
sc a
nd fl
ag 6
.0 ft
up
a tre
e 20
ft d
owns
tream
of D
iehl
St.
brid
ge o
n th
e le
ft ba
nkde
bris
line
good
691.
5041
° 48′ 1
6.9″
-88°
10′ 3
6.6″
DuP
age
Rey
mon
d D
rive
at
Riv
er R
oad
Pain
t on
a sp
illw
ay ro
ck 2
0 ft d
owns
tream
of t
he d
am o
n th
e rig
ht b
ank
debr
is li
nepo
or68
1.96
41° 4
7′ 04.
1″-8
8° 1
0′ 43.
0″
DuP
age
Rey
mon
d D
rive
at
Riv
er R
oad
A m
ark
7.0 ft
or 8
.0 ft
up
on a
tree
bra
nch
400 ft
dow
nstre
am o
f the
dam
on
the
right
ban
kde
bris
line
fair
NR
41° 4
7′ 05.
3-8
8° 1
0′ 36.
7″
DuP
age
Rey
mon
d D
rive
at
Riv
er R
oad
Pain
t 5.0
ft u
p th
e fe
nce
cora
er o
f dam
flow
on
the
upst
ream
side
of t
he d
am
debr
is li
nego
od69
2.10
41° 4
7′ 05.
7″-8
8° 1
0′ 42.
6″
DuP
age
Ogd
en A
venu
ePa
int 0
.55 ft
up
the
upst
ream
side
of t
he b
ridge
on
the
right
ban
kse
ed li
nefa
ir68
1.32
41° 4
6′ 54.
9″-8
8° 1
0′ 32.
2″
DuP
age
Ogd
en A
venu
eA
flag
on
a tre
e 8 ft
dow
nstre
am o
f Ogd
en R
d. b
ridge
on
the
right
ban
kde
bris
line
good
NR
41° 4
6′ 54.
2″-8
8° 1
0′ 31.
6″
DuP
age
Jeffe
rson
Ave
nue
A fl
ag 2
.5 ft
up
the
rem
ains
of a
tree
40 ft
dow
nstre
am o
f Jef
fers
on A
ve.
brid
ge o
n th
e rig
ht b
ank
mud
line
/de
bris
line
poor
NR
41° 4
6′ 21.
5″-8
8° 0
9′ 57.
4″
DuP
age
Hill
side
Roa
dA
flag
2.0
ft u
p a
smal
l tre
e 35
ft d
owns
tream
of H
illsi
de R
d. b
ridge
on
the
left
bank
debr
is li
nego
od66
4.95
41° 4
5′ 56.
4″-8
8° 0
8′ 50.
5″
DuP
age
Hill
side
Roa
dA
floo
d m
ark
disc
and
flag
2.0
ft u
p la
rge
tree
10 ft
ups
tream
of H
illsi
de R
d.
brid
ge o
n th
e rig
ht b
ank
debr
is li
nefa
irN
R41
° 45′ 5
7.3″
-88°
08′ 5
1.7″
DuP
age
Hob
son
Roa
dA
flag
3.0
ft u
p a
tree
25 ft
ups
tream
of h
obso
n R
d. b
ridge
on
the
left
bank
debr
is li
nego
od65
6.42
41° 4
5′ 02.
8″-8
8° 0
7′ 47.
4″
DuP
age
Hob
son
Roa
dA
flag
3.0
ft u
p a
mar
ker 2
0 ft u
pstre
am o
f Hob
son
Rd.
brid
ge o
n th
e le
ft ba
nkde
bris
line
good
41° 4
5′ 02.
7″-8
8° 0
7′ 47.
5″
DuP
age
Hob
son
Roa
dA
flag
3.0
ft u
p a
mar
ker 2
0 ft u
pstre
am o
f Hob
son
Rd.
brid
ge o
n th
e le
ft ba
nkde
bris
line
good
41° 4
5′ 02.
7″-8
8° 0
7′ 47.
5″
DuP
age
Hob
son
Roa
dA
floo
d m
ark
disc
3.0
ft u
p a
tree
20 ft
ups
tream
of H
obso
n R
d. b
ridge
on
the
left
bank
de
bris
line
fair
656.
4241
° 45′ 0
2.7″
-88°
07′ 4
7.5″
DuP
age
Bai
ly R
oad
A fl
ood
mar
k di
sc 3
.0 ft
up
a tre
e 30
ft u
ptre
am o
f Bai
ly R
d. b
ridge
on
the
right
ban
kse
ed li
nefa
ir65
2.75
41° 4
4′ 26.
2″-8
8° 0
7′ 37.
6″
DuP
age
Was
hing
ton
Stre
etA
floo
d m
ark
disc
2.8
ft u
p a
tree
67 ft
ups
tream
of W
ashi
ngto
n St
. brid
ge
and
8 ft a
way
from
the
right
ban
kde
bris
line
good
641.
9141
° 43′ 1
4.8″
-88°
07″ 5
5.4″
DuP
age
Fairv
eiw
Lan
e an
d W
est K
ings
ton
Lane
A fl
ood
mar
k di
sc 3
.0 ft
up
a pa
rk si
gn 3
4 ft fr
om W
. Kin
gsto
n Ln
. as y
ou
face
the
pond
seed
line
exce
llent
788.
6041
° 58′ 3
9.6″
-88°
12′ 0
0.1″
Will
Nap
er-P
lain
field
R
oad
Pain
t 3.8
ft u
p a
conc
rete
wal
l on
the
wes
t sid
e of
Pla
infe
ild N
aper
ville
Rd.
on
the
right
ban
km
ud li
nego
od62
3.65
41° 4
1′ 26.
9″-8
8° 1
0′ 00.
0″
Will
119t
h St
reet
Pain
t 0.5
ft u
p th
e 11
9th
St. (
Ferg
uson
Rd.
) brid
ge st
ruct
ure
dow
nstre
am o
f th
e br
idge
and
on
the
left
bank
mud
line
/de
bris
line
exce
llent
616.
9441
° 39′ 5
9.1″
-88°
10′ 5
6.7″
Will
Wes
t 135
th S
treet
A fl
ood
mar
k di
sc 4
.0 ft
up
a tre
e 68
m d
owns
tream
of W
. 135
th S
t. on
the
left
bank
nex
t to
a bo
at la
unch
.de
bris
line
exce
llent
610.
8241
° 38′ 1
2.3″
-88°
11′ 2
7.1″

36 Flood of September 13–16, 2008, in Northeastern Illinois A
ppen
dix
1.
High
-Wat
er M
ark
Site
Des
crip
tion
and
Elev
atio
n at
Sel
ect S
tream
Rea
ches
, Flo
od o
f Sep
tem
ber 2
008,
Nor
thea
ster
n Ill
inoi
s.—
Cont
inue
d
Coun
tySt
reet
refe
renc
eH
igh-
wat
er m
ark
desc
ript
ion
Hig
h-w
ater
m
ark
type
Hig
h-w
ater
m
ark
ratin
g
Elev
atio
n
(ft a
bove
N
AVD
88)
Latit
ude
(deg
rees
, m
inut
es,
seco
nds)
Long
itude
(d
egre
es,
min
utes
, se
cond
s)
Will
Nor
th D
ivis
ion
Stre
et/Il
linoi
s R
oute
59
A fl
ood
mar
k di
sc o
n a
tree
north
of a
trib
utar
y an
d 28
m w
est o
f Rou
te 5
9 (N
orth
Div
isio
n St
.) br
idge
mud
line
exce
llent
603.
3041
° 37′ 0
4.9″
-88°
12′ 1
0.8″
Will
Ren
wic
k R
oad
A fl
ood
mar
k di
sc 3
.0 ft
up
an o
ld p
ower
pol
e 12
ft u
pstre
am R
enw
ick
Rd.
on
the
left
bank
mud
line
good
597.
7441
° 35′ 3
2.9″
-88°
13′ 2
5.1″
Will
Cat
on F
arm
Roa
dA
floo
d m
ark
disc
3.3
ft u
p a
tree
75 ft
dow
nstre
am o
f Cat
on F
arm
Rd.
on
the
right
ban
km
ud li
nego
od58
9.46
41° 3
3′ 53.
6″-8
8° 1
1′ 23.
0″
Will
Cot
tage
road
/Illin
ois
Rou
te 5
9A
floo
d m
ark
disc
3.3
ft u
p a
pine
tree
29m
dow
nstre
am o
f Rou
te 5
9 (C
otte
ge S
t.) b
ridge
on
the
left
bank
debr
is li
neex
celle
ntN
R41
° 31′ 0
9.6″
-88°
11′ 5
6.9″
Will
Mou
nd R
oad
Pain
t 0.3
ft u
p th
e M
ound
Rd.
brid
ge su
ppor
t dow
nstre
am o
f the
brid
ge a
nd
on th
e le
ft ba
nkm
ud li
neex
celle
nt55
8.85
41° 2
9′ 32.
8″-8
8° 1
2′ 52.
9″
Will
Wes
t Sei
l Roa
dPa
int 3
.0 ft
up
a D
NR
sign
30 ft
dow
nstre
am o
f a b
ridge
on
the
right
ban
km
ud li
nefa
ir56
3.54
41° 3
0′ 26.
6″-8
8° 1
2′ 31.
2″
Will
Shep
ley
Roa
dPa
int 5
.5 ft
up
the
Shep
ley
Rd.
brid
ge w
ing
wal
l ups
tream
of t
he b
ridge
on
the
left
bank
mud
line
fair
538.
7241
° 28′ 0
5.1″
-88°
12′ 3
2.8″
Will
Riv
ers E
dge
Driv
eA
floo
d m
ark
disc
4.0
ft u
p a
tree
on th
e rig
ht b
ank
next
to a
n em
pty
lot o
ff of
Riv
ers E
dge
Rd.
mud
line
good
525.
1441
° 26′ 5
6.8″
-88°
14′ 3
9.2″
Will
Cha
nnah
on R
oad/
McE
villy
Roa
dPa
int 7
ft u
p th
e C
hann
ahon
Rd.
brid
ge w
ing
wal
l dow
nstre
am o
f the
brid
ge
and
on th
e rig
ht b
ank
debr
is li
nepo
or52
4.86
41° 2
6′ 53.
7″-8
8° 1
4′ 27.
0″
Will
Illin
ois M
ichi
gan
Trai
lPa
int o
n a
conc
rete
wal
l 20 ft
dow
nstre
am o
f the
I &
M T
rail
dam
on
the
right
ban
kse
ed li
nego
od52
0.72
41° 2
5′ 18.
2″-8
8° 1
3′ 43.
0″
Will
Illin
ois M
ichi
gan
Trai
lPa
int o
n a
stee
l wal
l 300
ft d
owns
tream
of t
he I
& M
Tra
il da
m o
n th
e rig
ht
bank
seed
line
good
520.
5541
° 25′ 1
5.7
-88°
13′ 4
3.0″
Will
Bla
ckbe
rry
Lane
A n
ail a
nd fl
ood
mar
k di
sc 0
.5 ft
up
a tre
e in
bet
wee
n th
e ro
ad, t
he ri
ver,
and
a pa
rkin
g lo
tm
ud li
nego
od50
9.58
41° 2
4′ 44.
0″-8
8° 1
3′ 31.
7″
Will
Brid
ge S
treet
A n
ail a
nd fl
ood
mar
k di
sc 2
.0 ft
up
a tre
e up
stre
am o
f Brid
ge S
t. br
idge
on
the
left
bank
debr
is li
nefa
ir51
3.81
41° 2
5′ 14.
1″-8
8° 1
3′ 38.
2″
Sout
h Br
anch
Kis
hwau
kee
Rive
r
DeK
alb
Gur
ler R
oad
A fl
ood
mar
k di
sc 3
.5 ft
up
a tre
e 35
ft d
owns
tream
of G
urle
r Rd.
brid
ge o
n th
e le
ft ba
nkde
bris
line
poor
41° 5
3′ 34.
4″-8
8° 4
7′ 09.
2″
DeK
alb
Tayl
or S
treet
A fl
ood
mar
k di
sc 1
.5 ft
up
a tre
e 15
0 ft d
owns
tream
of T
aylo
r St.
brid
ge o
n th
e le
ft ba
nkse
ed li
ne41
° 55′ 1
9.9″
-88°
45′ 5
9.4″
DeK
alb
Tayl
or S
treet
A fl
ood
mar
k di
sc 4
.0 ft
up
a tre
e 10
00 ft
ups
tream
of T
aylo
r St.
brid
ge a
cros
s a
bike
pat
h on
the
left
bank
debr
is li
ne41
° 55′ 1
2.6″
-88°
46′ 0
1.0″
DeK
alb
Luci
nda A
venu
eA
floo
d m
ark
disc
1.5
ft u
p a
larg
e tre
e 15
0 ft d
owns
tream
of L
ucin
da A
ve.
brid
ge o
n th
e rig
ht b
ank
debr
is li
nefa
ir41
° 56′ 1
2.4″
-88°
45′ 3
7.6″
DeK
alb
1st S
treet
Pain
t 2.0
ft u
p th
e up
stre
am si
de o
f 1st
St.
brid
ge o
n th
e le
ft ba
nkde
bris
line
41° 5
6′ 22.
3″-8
8° 4
4′ 59.
9″
DeK
alb
Hill
cres
t Stre
etPa
int 3
.0 ft
up
the
Hill
cres
t St.
brid
ge p
ier u
pstre
am o
f the
brid
ge o
n th
e le
ft ba
nkde
bris
line
good
41° 5
6′ 25.
7″-8
8° 4
4′ 46.
3″
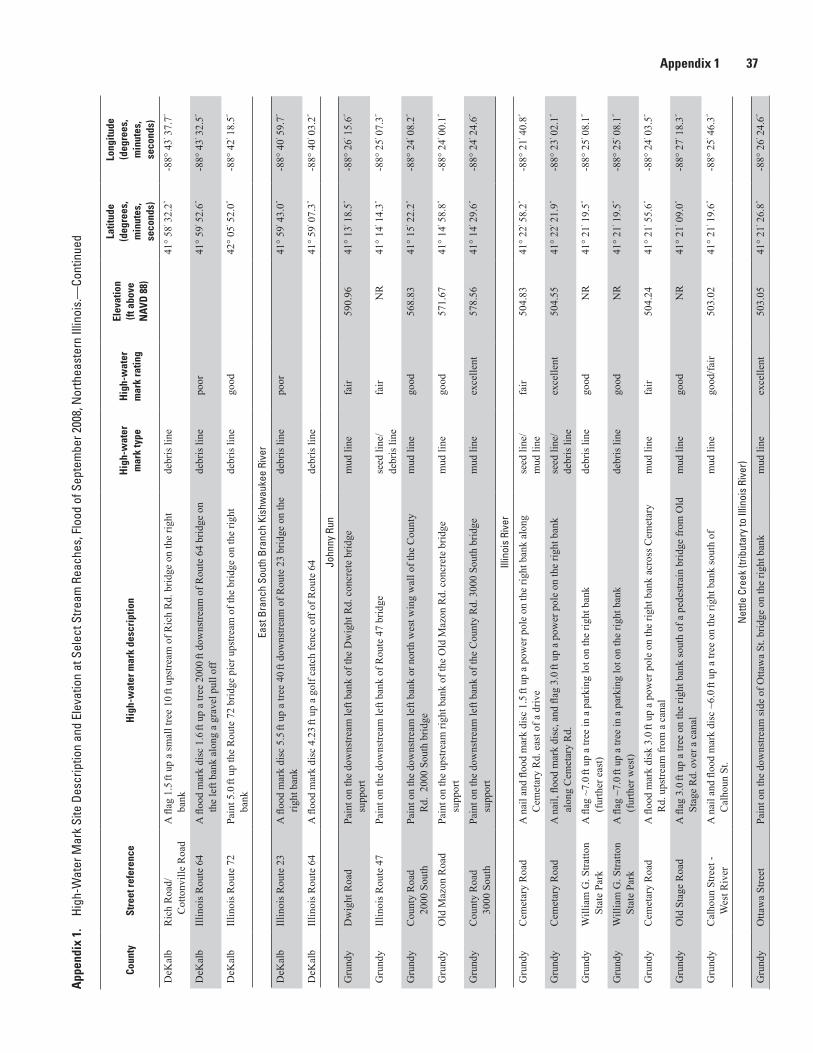
Appendix 1 37A
ppen
dix
1.
High
-Wat
er M
ark
Site
Des
crip
tion
and
Elev
atio
n at
Sel
ect S
tream
Rea
ches
, Flo
od o
f Sep
tem
ber 2
008,
Nor
thea
ster
n Ill
inoi
s.—
Cont
inue
d
Coun
tySt
reet
refe
renc
eH
igh-
wat
er m
ark
desc
ript
ion
Hig
h-w
ater
m
ark
type
Hig
h-w
ater
m
ark
ratin
g
Elev
atio
n
(ft a
bove
N
AVD
88)
Latit
ude
(deg
rees
, m
inut
es,
seco
nds)
Long
itude
(d
egre
es,
min
utes
, se
cond
s)
DeK
alb
Ric
h R
oad/
Cot
tonv
ille
Roa
dA
flag
1.5
ft u
p a
smal
l tre
e 10
ft u
pstre
am o
f Ric
h R
d. b
ridge
on
the
right
ba
nkde
bris
line
41° 5
8′ 32.
2″-8
8° 4
3′ 37.
7″
DeK
alb
Illin
ois R
oute
64
A fl
ood
mar
k di
sc 1
.6 ft
up
a tre
e 20
00 ft
dow
nstre
am o
f Rou
te 6
4 br
idge
on
the
left
bank
alo
ng a
gra
vel p
ull o
ffde
bris
line
poor
41° 5
9′ 52.
6″-8
8° 4
3′ 32.
5″
DeK
alb
Illin
ois R
oute
72
Pain
t 5.0
ft u
p th
e R
oute
72
brid
ge p
ier u
pstre
am o
f the
brid
ge o
n th
e rig
ht
bank
debr
is li
nego
od42
° 05′ 5
2.0″
-88°
42′ 1
8.5″
East
Bra
nch
Sout
h Br
anch
Kis
hwau
kee
Rive
r
DeK
alb
Illin
ois R
oute
23
A fl
ood
mar
k di
sc 5
.5 ft
up
a tre
e 40
ft d
owns
tream
of R
oute
23
brid
ge o
n th
e rig
ht b
ank
debr
is li
nepo
or41
° 59′ 4
3.0″
-88°
40′ 5
9.7″
DeK
alb
Illin
ois R
oute
64
A fl
ood
mar
k di
sc 4
.23 ft
up
a go
lf ca
tch
fenc
e of
f of R
oute
64
debr
is li
ne41
° 59′ 0
7.3″
-88°
40′ 0
3.2″
John
ny R
un
Gru
ndy
Dw
ight
Roa
dPa
int o
n th
e do
wns
tream
left
bank
of t
he D
wig
ht R
d. c
oncr
ete
brid
ge
supp
ort
mud
line
fair
590.
9641
° 13′ 1
8.5″
-88°
26′ 1
5.6″
Gru
ndy
Illin
ois R
oute
47
Pain
t on
the
dow
nstre
am le
ft ba
nk o
f Rou
te 4
7 br
idge
seed
line
/de
bris
line
fair
NR
41° 1
4′ 14.
3″-8
8° 2
5′ 07.
3″
Gru
ndy
Cou
nty
Roa
d
2000
Sou
thPa
int o
n th
e do
wns
tream
left
bank
or n
orth
wes
t win
g w
all o
f the
Cou
nty
Rd.
200
0 So
uth
brid
gem
ud li
nego
od56
8.83
41° 1
5′ 22.
2″-8
8° 2
4′ 08.
2″
Gru
ndy
Old
Maz
on R
oad
Pain
t on
the
upst
ream
righ
t ban
k of
the
Old
Maz
on R
d. c
oncr
ete
brid
ge
supp
ort
mud
line
good
571.
6741
° 14′ 5
8.8″
-88°
24′ 0
0.1″
Gru
ndy
Cou
nty
Roa
d
3000
Sou
thPa
int o
n th
e do
wns
tream
left
bank
of t
he C
ount
y R
d. 3
000
Sout
h br
idge
su
ppor
tm
ud li
neex
celle
nt57
8.56
41° 1
4′ 29.
6″-8
8° 2
4′ 24.
6″
Illin
ois
Rive
r
Gru
ndy
Cem
etar
y R
oad
A n
ail a
nd fl
ood
mar
k di
sc 1
.5 ft
up
a po
wer
pol
e on
the
right
ban
k al
ong
Cem
etar
y R
d. e
ast o
f a d
rive
seed
line
/m
ud li
nefa
ir50
4.83
41° 2
2′ 58.
2″-8
8° 2
1′ 40.
8″
Gru
ndy
Cem
etar
y R
oad
A n
ail,
flood
mar
k di
sc, a
nd fl
ag 3
.0 ft
up
a po
wer
pol
e on
the
right
ban
k al
ong
Cem
etar
y R
d.se
ed li
ne/
debr
is li
neex
celle
nt50
4.55
41° 2
2′ 21.
9″-8
8° 2
3′ 02.
1″
Gru
ndy
Will
iam
G. S
tratto
n St
ate
Park
A fl
ag ~
7.0 ft
up
a tre
e in
a p
arki
ng lo
t on
the
right
ban
k
(fur
ther
eas
t)de
bris
line
good
NR
41° 2
1′ 19.
5″-8
8° 2
5′ 08.
1″
Gru
ndy
Will
iam
G. S
tratto
n St
ate
Park
A fl
ag ~
7.0 ft
up
a tre
e in
a p
arki
ng lo
t on
the
right
ban
k
(fur
ther
wes
t)de
bris
line
good
NR
41° 2
1′ 19.
5″-8
8° 2
5′ 08.
1″
Gru
ndy
Cem
etar
y R
oad
A fl
ood
mar
k di
sk 3
.0 ft
up
a po
wer
pol
e on
the
right
ban
k ac
ross
Cem
etar
y R
d. u
pstre
am fr
om a
can
alm
ud li
nefa
ir50
4.24
41° 2
1′ 55.
6″-8
8° 2
4′ 03.
5″
Gru
ndy
Old
Sta
ge R
oad
A fl
ag 3
.0 ft
up
a tre
e on
the
right
ban
k so
uth
of a
ped
estra
in b
ridge
from
Old
St
age
Rd.
ove
r a c
anal
mud
line
good
NR
41° 2
1′ 09.
0″-8
8° 2
7′ 18.
3″
Gru
ndy
Cal
houn
Stre
et -
Wes
t Riv
erA
nai
l and
floo
d m
ark
disc
~6.
0 ft u
p a
tree
on th
e rig
ht b
ank
sout
h of
C
alho
un S
t.m
ud li
nego
od/fa
ir50
3.02
41° 2
1′ 19.
6″-8
8° 2
5′ 46.
3″
Net
tle C
reek
(trib
utar
y to
Illin
ois
Rive
r)
Gru
ndy
Otta
wa
Stre
etPa
int o
n th
e do
wns
tream
side
of O
ttaw
a St
. brid
ge o
n th
e rig
ht b
ank
mud
line
exce
llent
503.
0541
° 21′ 2
6.8″
-88°
26′ 2
4.6″
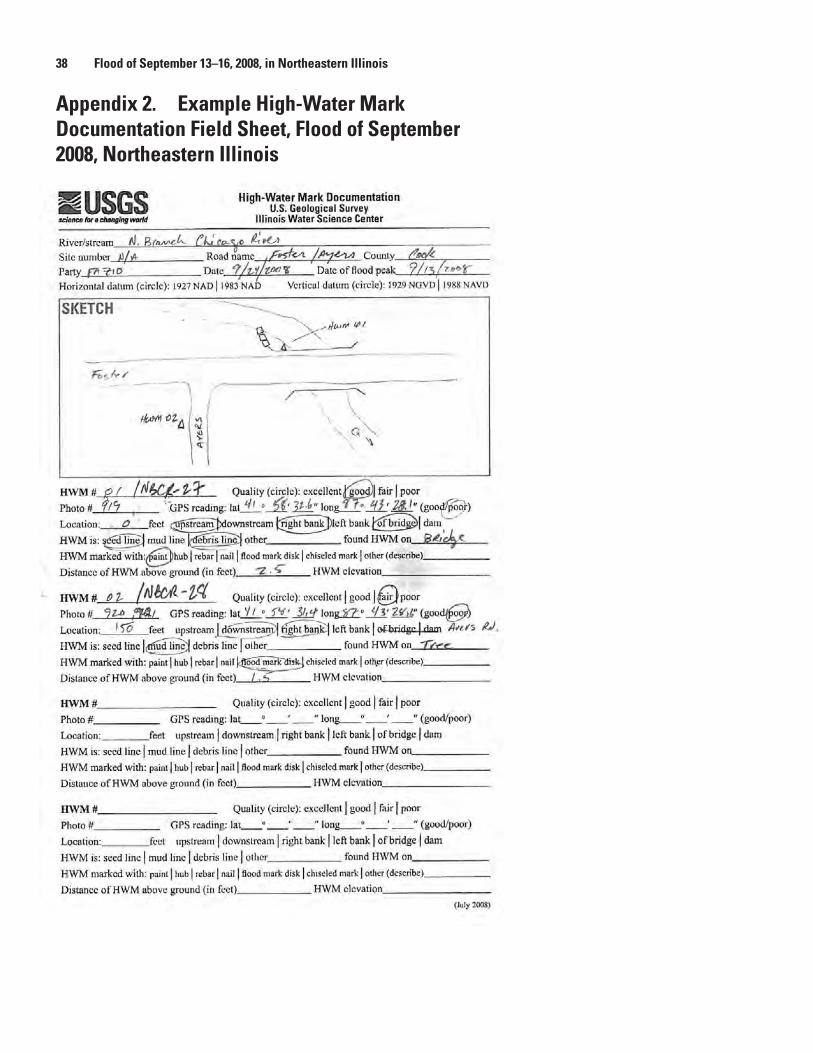
38 Flood of September 13–16, 2008, in Northeastern Illinois
Appendix 2. Example High-Water Mark Documentation Field Sheet, Flood of September 2008, Northeastern IllinoisAppendix 2. Example High-Water Mark Documentation Field Sheet, Flood of September2008, Northeastern Illinois
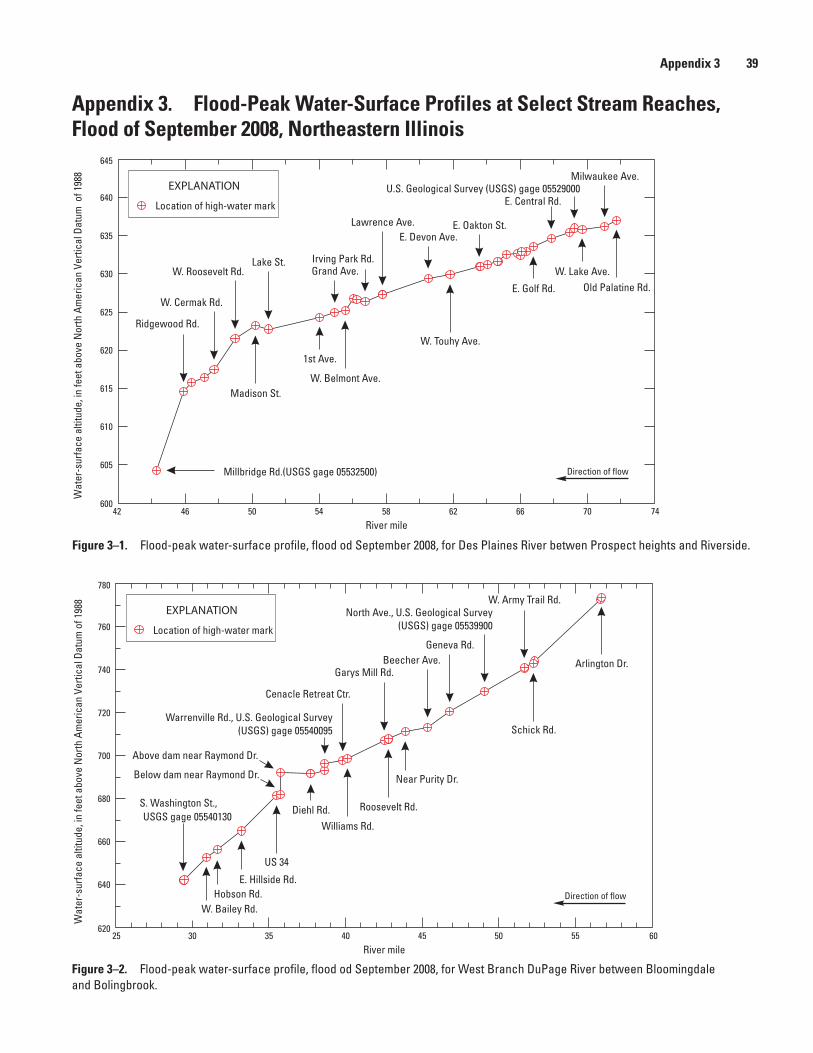
Appendix 3 39
Appendix 3. Flood-Peak Water-Surface Profiles at Select Stream Reaches, Flood of September 2008, Northeastern Illinois
Wat
er-s
urfa
ce a
ltitu
de, i
n fe
et a
bove
Nor
th A
mer
ican
Ver
tical
Dat
um o
f 198
8
River mile
Lawrence Ave.
W. Touhy Ave.
W. Belmont Ave.Madison St.
Millbridge Rd.(USGS gage 05532500)
Ridgewood Rd.
W. Cermak Rd.
E. Devon Ave.
Grand Ave.
1st Ave.
Lake St.W. Roosevelt Rd.
Irving Park Rd.
U.S. Geological Survey (USGS) gage 05529000
Old Palatine Rd.W. Lake Ave.
E. Golf Rd.
E. Oakton St.
E. Central Rd.
Milwaukee Ave.
Direction of flow
600
605
610
615
620
625
630
635
640
645
42 46 50 54 58 62 66 70 74
EXPLANATION
Location of high-water mark
Figure 3-1. Flood-peak water-surface profile, flood of September 2008, for Des Plaines River between Prospect Heights and Riverside.
Figure 3–1. Flood-peak water-surface profile, flood od September 2008, for Des Plaines River betwen Prospect heights and Riverside.
River mile
S. Washington St.,USGS gage 05540130
Arlington Dr.
Schick Rd.
Roosevelt Rd.
Cenacle Retreat Ctr.
Warrenville Rd.,age 05540095
U.S. Geological Survey(USGS) g
Williams Rd.Diehl Rd.
US 34
Hobson Rd.W. Bailey Rd.
E. Hillside Rd.
Above dam near Raymond Dr.
Below dam near Raymond Dr. Near Purity Dr.
Geneva Rd.Beecher Ave.
Garys Mill Rd.
North Ave.,age 05539900
U.S. Geological Survey(USGS) g
W. Army Trail Rd.
Direction of flow
620
640
660
680
700
720
740
760
780
25 30 35 40 45 50 55 60
Wat
er-s
urfa
ce a
ltitu
de, i
n fe
et a
bove
Nor
th A
mer
ican
Ver
tical
Dat
um o
f 198
8
EXPLANATION
Location of high-water mark
Figure 3-2. Flood-peak water-surface profile, flood of September 2008, for West Branch DuPage River between Bloomingdale and Bolingbrook.
Figure 3–2. Flood-peak water-surface profile, flood od September 2008, for West Branch DuPage River between Bloomingdale and Bolingbrook.

40 Flood of September 13–16, 2008, in Northeastern Illinois
River mile
N. Kedzie Ave.
N. Bernard St.
W. Touhy Ave.,
age 05536000U.S. Geological Survey(USGS) g
N. Central Ave.
N. Cicero Ave.
W. Foster Ave.
Direction of flow
585
590
595
600
605
610
615
620
42 44 46 48 50 52
W. Harts Rd.
Footpath inClayton F. SmithWoods Preserve
N. Forest Glen Ave.
USGS gage 05536105
Wat
er-s
urfa
ce a
ltitu
de, i
n fe
et a
bove
Nor
th A
mer
ican
Ver
tical
Dat
um o
f 198
8
EXPLANATION
Location of high-water mark
Figure 3-3. Flood-peak water-surface profile, flood of September 2008, for North Branch Chicago River near Park Ridge.
Figure 3–3. Flood-peak water-surface profile, flood od September 2008, for North Branch Chicago River near Park Ridge.
River mile
E. Reed Road
S. DwightRoad
E. Grand Ridge Road
S. Old Mazon Road
Direction of flow
565
570
575
580
585
590
595
3 4 5 6 7 8 9
Wat
er-s
urfa
ce a
ltitu
de, i
n fe
et a
bove
Nor
th A
mer
ican
Ver
tical
Dat
um o
f 198
8
EXPLANATION
Location of high-water mark
Figure 3-4. Flood-peak water-surface profile, flood of September 2008, for Johnny Run near Mazon.
Figure 3–4. Flood-peak water-surface profile, flood od September 2008, for Johnny Run near Mazon.

Appendix 3 41
River mile
N. Dwight Road
William G. StrattonState Park
Above PeacockSlough
Electrical linesbelow Aux Sable Creek
Direction of flow
502.5
503
503.5
504
504.5
505
262 263 264 265 266 267 268
Wat
er-s
urfa
ce a
ltitu
de, i
n fe
et a
bove
Nor
th A
mer
ican
Ver
tical
Dat
um o
f 198
8
EXPLANATION
Location of high-water mark
Figure 3-5. Flood-peak water-surface profile of September 2008, for Illinois River near Morris.
Figure 3–5. Flood-peak water-surface profile, flood od September 2008, for Illinois River near Morris.
0 1 2 3 4 5634
636
638
640
642
644
646
River mile
Naperville Road
Lisson Road
Royce Road,
age 05540250U.S. Geological Survey(USGS) g
Direction of flow
648
650
6 7
Wat
er-s
urfa
ce a
ltitu
de, i
n fe
et a
bove
Nor
th A
mer
ican
Ver
tical
Dat
um o
f 198
8
EXPLANATION
Location of high-water mark
Figure 3-6. Flood-peak water-surface profile, flood of September 2008, for East Branch DuPage River near Bolingbrook.Figure 3–6. Flood-peak water-surface profile, flood od September 2008, for East Branch DuPage River near Bolingbrook.

42 Flood of September 13–16, 2008, in Northeastern Illinois
0River mile
W. Seil Rd.
Mouth of DuPage River at Des Plaines RiverW. Bridge St.
McEvilly Rd.
W. Mound Rd.
Shepley Rd.
W. 119th St.E. 135th St.
N. Division St.
S. Naperville-Plainfiled Rd.
W. Renwick Rd.
W. Caton Farm Rd.
U.S. Geological Survey(USGS) Gage 05540500
Direction of flow
500
510
520
530
540
550
560
570
580
590
600
610
620
630
5 10 15 20 25 30
Wat
er-s
urfa
ce a
ltitu
de, i
n fe
et a
bove
Nor
th A
mer
ican
Ver
tical
Dat
um o
f 198
8
EXPLANATION
Location of high-water mark
Figure 3-7. Flood-peak water-surface profile, flood of September 2008, for DuPage River between Bolingbrook and Channahon.
Figure 3–7. Flood-peak water-surface profile, flood od September 2008, for DuPage River between Bolingbrook and Channahon.
Prepared by the Pembroke and Ohio Publishing Service Centers.
For more information concerning this report, contact:
DirectorU.S. Geological SurveyIllinois Water Science Center1201 W. University AvenueSuite 100Urbana, IL [email protected]
or visit our Web site at:http://il.water.usgs.gov

Fazio and Sharpe—Flood of Septem
ber 13–16, 2008, in Northeastern Illinois—
Data Series 726


