Företagsakademin, Henriksgatan 7 FIN-20500 Åbo
Exploratory Research Design
Secondary DataQualitative ResearchSurvey & Observation
Experiments

Företagsakademin, Henriksgatan 7 FIN-20500 Åbo
Primary vs. Secondary data• Primary data:
originated by the researcher for the specific purpose addressing the research problem
• Secondary data: data collected for some other purpose than the problm at hand
PrimaryData
Secon-daryData
CollectionPurpose
For the purpose at hand
For other problems
CollectionProcess
Very involved
Rapid and easy
CollectionCost
High Relatively low
CollectionTime
Long Short

Företagsakademin, Henriksgatan 7 FIN-20500 Åbo
Advantages and uses of SD1. Identifying the
problem2. Better define the
problem3. Develop and approach
to the problem4. Formulate an
appropriate research design
5. Answering certain research Qs and test some hypotheses
6. Interpret primary data more insightfully
• Rule: Examination of available SD is a prerequisite to the collection of primary data. Start with SD; collect PD only after the SD source yield marginal returns
Företagsakademin, Henriksgatan 7 FIN-20500 Åbo
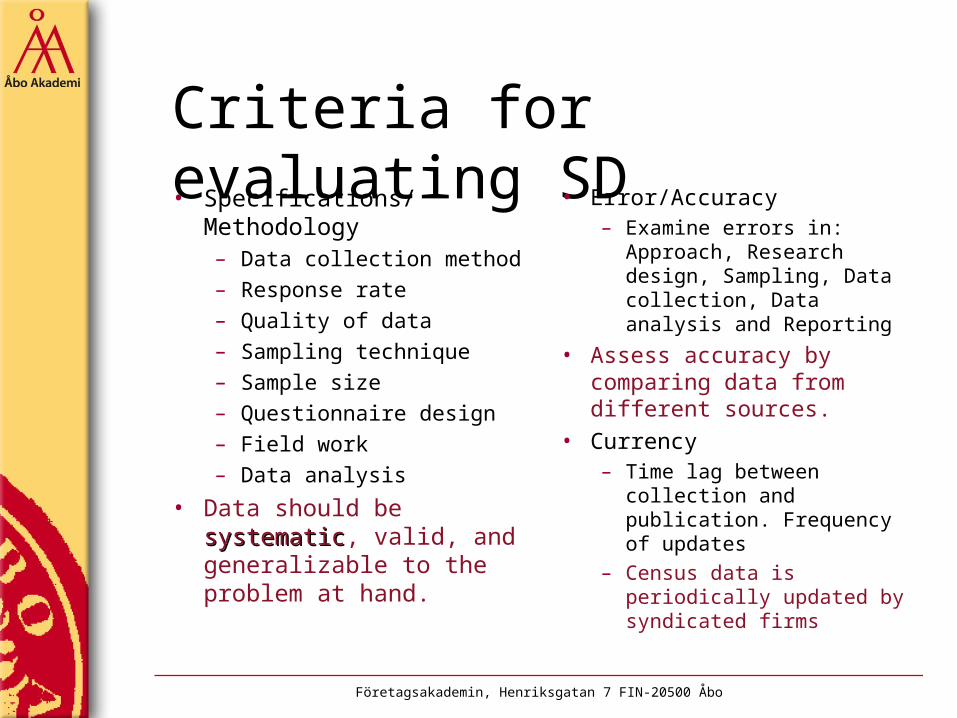
Criteria for evaluating SD• Specifications/
Methodology– Data collection method– Response rate– Quality of data– Sampling technique– Sample size– Questionnaire design– Field work– Data analysis
• Data should be systematicsystematic, valid, and generalizable to the problem at hand.
• Error/Accuracy– Examine errors in:
Approach, Research design, Sampling, Data collection, Data analysis and Reporting
• Assess accuracy by comparing data from different sources.
• Currency– Time lag between
collection and publication. Frequency of updates
– Census data is periodically updated by syndicated firms

Företagsakademin, Henriksgatan 7 FIN-20500 Åbo
Criteria for evaluating SD• Objective: Why were
the data collected, i.e. determine the relevance of the data
• Nature: Definition of key variables, units of measurement, categories used, relationships examined, i.e. reconfigure the data to increase their usefulness if possible.
• Dependability: Expertise, credibility, reputation, and trustworthiness of the source, i.e. Data should be obtained from an original rather than an acquired source
Företagsakademin, Henriksgatan 7 FIN-20500 Åbo
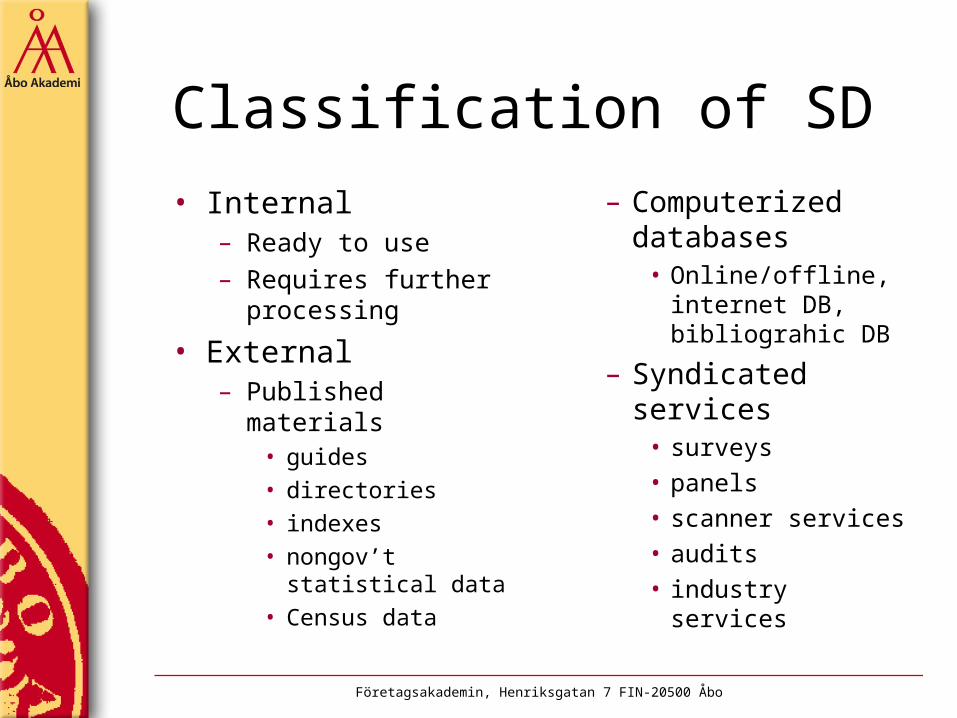
Classification of SD• Internal
– Ready to use– Requires further
processing
• External– Published materials
• guides• directories• indexes• nongov’t statistical
data• Census data
– Computerized databases
• Online/offline, internet DB, bibliograhic DB
– Syndicated services
• surveys• panels• scanner services• audits• industry services

Företagsakademin, Henriksgatan 7 FIN-20500 Åbo
A classification of Marketing research data
Secondary Data
Qualitative Data
Survey Data Observational and other Data
Descriptive
Experimental Data
Causal
Quantitative Data
Primary Data
Marketing Research Data
Företagsakademin, Henriksgatan 7 FIN-20500 Åbo
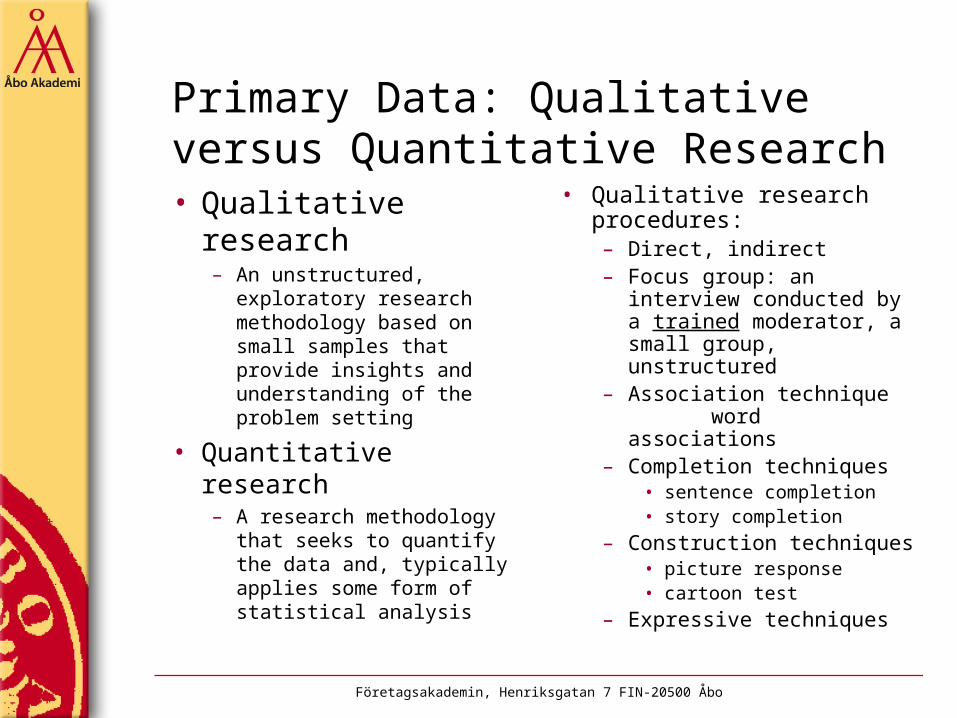
Primary Data: Qualitative versus Quantitative Research• Qualitative
research– An unstructured,
exploratory research methodology based on small samples that provide insights and understanding of the problem setting
• Quantitative research– A research methodology
that seeks to quantify the data and, typically applies some form of statistical analysis
• Qualitative research procedures:– Direct, indirect– Focus group: an
interview conducted by a trained moderator, a small group, unstructured
– Association techniqueword associations
– Completion techniques• sentence completion• story completion
– Construction techniques• picture response• cartoon test
– Expressive techniques

Företagsakademin, Henriksgatan 7 FIN-20500 Åbo
Focus Groups, Depth Interviews, projective techniques
Criteria Focus Groups
Depth Interviews
Projective techniques
Structure High Medium Low
Probing of respondent
Low High Medium
Moderator bias Medium High Low to High
Interpretation bias
Low Medium High
Subconscious info
Low Medium to high High
Innovative info High Medium Low
Sensitive info Low Medium High
Unusual behavior
No Some Yes
Usefulness Highly useful Useful Somewhat

Företagsakademin, Henriksgatan 7 FIN-20500 Åbo
Qualitative versus Quantitative Research
Qualitative Research
Quantitative Research
Objective To gain a qualitative understanding of the underlying reasons and motivations
To quantify the data and generalize the results from the sample to the population of interest
Sample Small number of non-representative cases
Large number of representative cases
Data collection
Unstructured Structured
Data analysis Non-statistical Statistical
Outcome Develop an initial understanding
Recommend a final course of action

Företagsakademin, Henriksgatan 7 FIN-20500 Åbo
Descriptive Research Design: Survey & Observation• Survey: A structured
questionnaire given to respondents and designed to elicit specific information
• Structured data collection: Use of formal questionnaire that presents questions in a prearranged order
• Fixed-alternative questions: Respondents are required to choose from a set of predetermined answers
• Survey Methods:– Telephone;
• traditional, computer-assisted
– Personal interviewing;
• In-home, Mall Intercept, computer-assisted
– Mail Interviewing;• mail, mail panel
– Electronic Intrvieweing;
• E-mail, Internet

Företagsakademin, Henriksgatan 7 FIN-20500 Åbo
Descriptive Research Design: Survey & Observation• Observation: the
recording of behavioral patterna of people, objects, and events in a systematic manner to obtain information about the phenomenon of interest
• Structured observation: observation techniques where the researcher defines the behavior to be observed and the methods by which they will be measured
• Unstructured observations: A researcher monitors all aspects of the phenomenon without specifying the details in advance
• Natural observations: observing behavior as it takes place in the environment
• Contrived observation: the behavior is observed in an artificial environment
• Disguised vs. undisguised observation
Företagsakademin, Henriksgatan 7 FIN-20500 Åbo
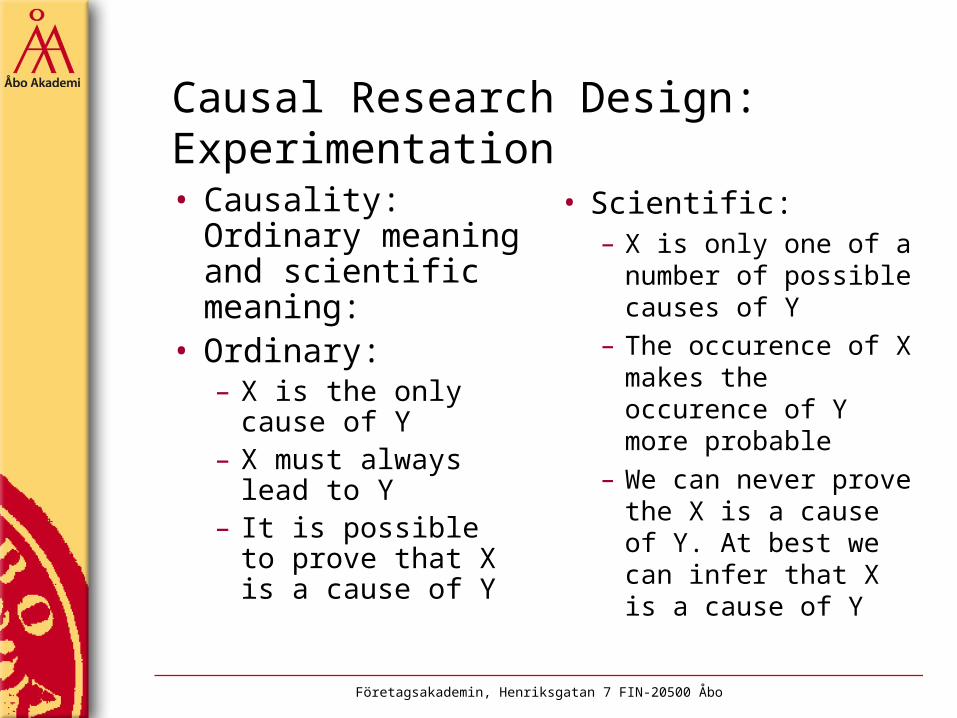
Causal Research Design: Experimentation• Causality:
Ordinary meaning and scientific meaning:
• Ordinary:– X is the only
cause of Y– X must always
lead to Y– It is possible to
prove that X is a cause of Y
• Scientific:– X is only one of a
number of possible causes of Y
– The occurence of X makes the occurence of Y more probable
– We can never prove the X is a cause of Y. At best we can infer that X is a cause of Y

Företagsakademin, Henriksgatan 7 FIN-20500 Åbo
Causal Research Design: Experimentation• Concomitant Variation: The
extent to which a cause X and an effect Y occur together is predicted by the hypothesis under consideration– Purchase of Fashion Clothing Y is
influenced by education X• The absence of initial evidence
of concomitant variation does not imply there is no causation

Företagsakademin, Henriksgatan 7 FIN-20500 Åbo
Can we prove high education cause high purchase?Education X
Purchase of Fashion Clothing Y
High Low Total
High 363 (73%)
137 (27%)
500 (100%)
Low 322 (64%)
178 (36%)
500 (100%)
Företagsakademin, Henriksgatan 7 FIN-20500 Åbo
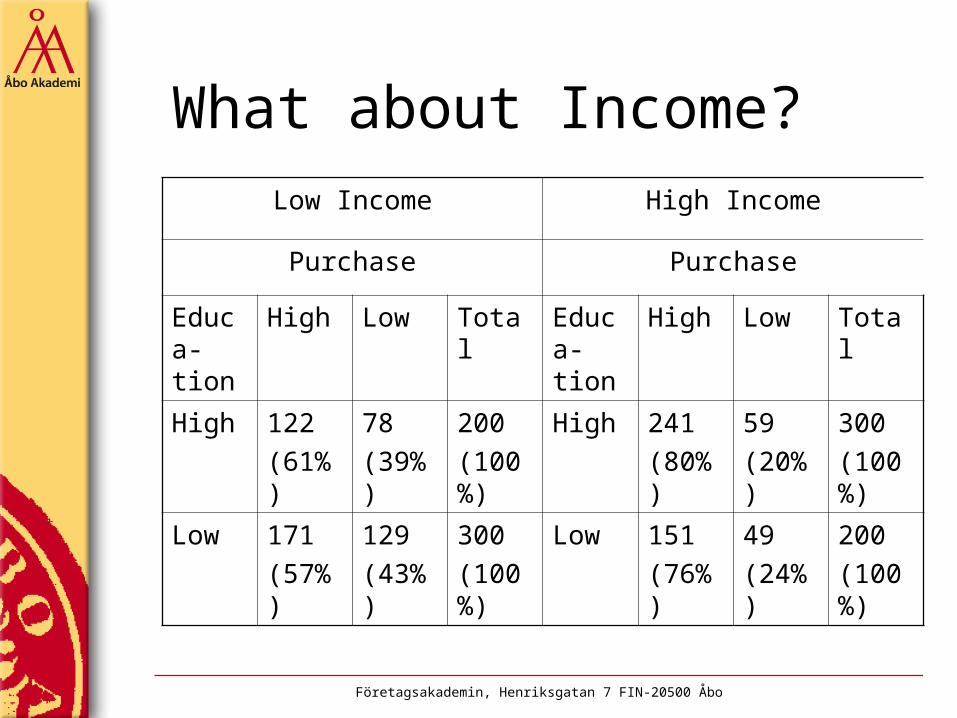
What about Income?Low Income High Income
Purchase Purchase
Educa-tion
High Low Total Educa-tion
High Low Total
High 122(61%)
78(39%)
200(100%)
High 241(80%)
59(20%)
300(100%)
Low 171(57%)
129(43%)
300(100%)
Low 151(76%)
49(24%)
200(100%)

Företagsakademin, Henriksgatan 7 FIN-20500 Åbo
Time order of occurence of variables• The causing event
must occur either before or simultaneously with the effect. It cannot occur afterwards!
• An effect cannot be produced by an event that occur after the effect has taken place!
• But: A variable can be both the cause and the effect in a causal relationship!
• Customer who shop frequently in a store is likely to have a credit card for that store. Also customers who have the card is likely to shop there more frequently

Företagsakademin, Henriksgatan 7 FIN-20500 Åbo
Definitions and Concepts
• Independent variables (treatments) (iv) are variables that are manipulated by the researcher and whose effects are measured and compared. These can be price levels, package designs, advertising themes, etc.
• Test unit are individuals, organizations, or other entities whose response to the independnt variables or treatments is being examined. Test units may include consumers, stores, geographic areas
Företagsakademin, Henriksgatan 7 FIN-20500 Åbo
Definitions and Concepts
• Dependent variables (dv) are the variables that measure the effect of the independent variable on the test unit. These variables may include, sales, profits, market share, brand, consumer choice, intentions to buy, etc.
• Extraneous or confounding variables are all variables other than the independent variables that affect the response of the test units. These variables can confound the dv. measures in a way that weakens or invalidates the results, e.g. store size, location, competitive effort. These variables have to be controlled for!
Företagsakademin, Henriksgatan 7 FIN-20500 Åbo
Definitions and Concepts
• Experiment is formed when the researcher manipulates one or more iv. and measures their effect on one or more dv. while controlling for the effect of confounding variables
• Experimental design is a set of procedures specifying– the test units and how they are to be divided
into homogeneous subsamples– what iv is to be manipulated– what dv are to be measured– how the confounding variabls are to be
controlled

Företagsakademin, Henriksgatan 7 FIN-20500 Åbo
Validity
• Internal validity is a measure of accuracy of an experiment. It measures whether an iv actually causes the effects on the dv
• External validity determines whether the cause-and-effect found in the experiment can be generalized

Företagsakademin, Henriksgatan 7 FIN-20500 Åbo
Confounding variables• History: events that
are external to the experiment but occur a the same time
• Maturation: changes in the test unit due to passage of time
• Testing effect:– main testing effect– interactive testing
effect
• Main testing effect: when a prior observation affects the latter. Affects the internal validity
• interactive testing effect: prior measurement affects the test unit’s response to the iv. Affects the external validity
Företagsakademin, Henriksgatan 7 FIN-20500 Åbo
Confounding variables
• Statistical regression: when respondents with extreme scores move closer to the average, i.e. the change in attitude is attributable to statistical regression rather than the treatment
• Selection bias: Improper assignment of test units to treatment
• Mortality: loss of a test unit while the experiment is in progress

Företagsakademin, Henriksgatan 7 FIN-20500 Åbo
Controlling confounding variables• Randomization• Matching• Statistical control: measuring
the confounding variable and adjusting for their effects
• Design control

Företagsakademin, Henriksgatan 7 FIN-20500 Åbo
Classification of experimental designs
Preexprimental True Experimental Quasi experimental Statistical
Experimetal designs
One-shot casestudy
One grouppre-posttest
Static group
Pretest-posttestcontrol group
Posttest-onlycontrol group
SolomonFour group
Time Series
Multiple Time Series
RandomizedBlocks
Latin Square
Factorial

Företagsakademin, Henriksgatan 7 FIN-20500 Åbo
Classification of experimental designs• Preexperimental
design do not control for confounding factors by randomization
• True experimental designs the researcher can randomly assign test units to experimental groups and assign treatment randomly to experimental groups
• quasi-experimental design is like the true experimental design BUT without full experimental control

Företagsakademin, Henriksgatan 7 FIN-20500 Åbo
Limitations of experimentation• Time• Cost• Administration• Application: Test marketing
– controlled test market– simulated test market


