Download - Fomc 20010627 Material

6/26-27/01 157
APPENDIX 1
Charts used by Mr. Kos.

3-Month Deposit Rates Page 1
March 1, 2001 - June 25, 2001 Current Deposit Rate and Rates Implied by Traded Forward Rate Agreements Percent Percent
3/1 3/15 3/29 4/12 4/26 5/10 5/24 6/7 6/21 3.50 3.75 4.00 4.25 4.50 4.75 5.00 5.25 5.50
3.50 3.75 4.00 4.25 4.50 4.75 5.00 5.25 5.50
United States
FOMC -50 bps 3/20
Inter-meeting -50 bps 4/18
FOMC -50 bps 5/15
LIBOR Fixing
3-Mo. Forward
9-Mo. Forward
3.50 3.75
4.00 4.25
4.50 4.75
5.00 5.25
5.50
3.50 3.75
4.00 4.25
4.50 4.75
5.00 5.25
5.50Euro-area ECB
-25 bps5/10
LIBOR Fixing
9-Mo. Forward
3-Mo. Forward
3/1 3/15 3/29 4/12 4/26 5/10 5/24 6/7 6/21
Japanese Government Yield Curve
0.00
0.25
0.50
0.75
1.00
1.25
1.50
0.00
0.25
0.50
0.75
1.00
1.25
1.50 Japan
05/15/01
03/1/01 06/25/01
3 mos 6 mos 1 yr 2 yr 3 yr 4 yr 5 yr 6 yr 7 yr 8 yr 9 yr 10 yr

Basis Points September 1, 2000 - June 25, 2001 Basis Points 100 100
FOMC 5/15 -50 bp
50 Germany 50 Japan
0 U.K. 0
-50 -50
-100 Canada
-100
-150 U.S.
-150
-200 -200 9/1 10/1 11/1 12/1 1/1 2/1 3/1 4/1 5/1 6/1
2-Year Swap Rates minus Central Bank Policy Rates Basis Points September 1, 2000 - June 25, 2001 Basis Points
120 FOMC 5/15
120 -50 bp
80 Euro-Area
80 U.S.
40 40 Japan
0 0
Canada -40 -40
U.K -80 . -80
-120 -120 9/1 10/1 11/1 12/1 1/1 2/1 3/1 4/1 5/1 6/1
Policy Rates: US: Federal Funds Rate (O/N), Euro area: Main refinancing rate (2-week), Japan: Overnight Call Rate, U.K.: Base Rate (O/N repo), Canada: Overnight Target (midpoint of bank rate and discount rate) Source: Bloomberg
Page 2
2-Year Government Yields minus Central Bank Policy Rates

U.S. Treasury Yields Page 3
March 1, 2001 - June 25, 2001 Percent Percent
3/1 3/15 3/29 4/12 4/26 5/10 5/24 6/7 6/21
U.S. Credit Spreads over Treasuries Basis Points March 1, 2001 - June 25, 2001 Basis Points
3.75
4.00
4.25
4.50
4.75
5.00
5.25
5.50
5.75
6.00
3.75
4.00
4.25
4.50
4.75
5.00
5.25
5.50
5.75
6.00
2-Year Note
10-Year Note
30-Year Bond Fed Funds Target
60
70
80
90
100
110
120
130
140
60
70
80
90
100
110
120
130
140
10-Year Fannie Mae Benchmark
10-Year Interest Rate Swaps
10-Year A1 Industrial Corporates
FOMC -50 bps 3/20
Inter-meeting -50 bps 4/18
FOMC -50 bps 5/15
3/1 3/15 3/29 4/12 4/26 5/10 5/24 6/7 6/21
High Yield and EMBI+ Spreads over Treasuries Basis Points March 1, 2001 - June 25, 2001 Basis Points
3/1 3/15 3/29 4/12 4/26 5/10 5/24 6/7 6/21
650
700
750
800
850
900
650
700
750
800
850
900
EMBI+
Merrill Lynch High Yield
FOMC -50 bps 3/20
Inter-meeting -50 bps 4/18
FOMC -50 bps 5/15
600 600

Index 4/17 = 100 125
120
115
110
105
100
95
4/17
Index 4/17 = 100
115
110
105
100
95 4/17
Percent 34
32
30
28
26
24
22
20 4/17
U.S. Equities April 17, 2001 - June 25, 2001
S&P 500 Index
Dow Jones Industrial Average
Nasdaq Composite Index
Russell 2000 Index
FOMC -50 bps5/15
5/1 5/15 5/29 6/12
Foreign Equities April 17, 2001 - June 25, 2001
FTSE 100 Index
DAX Index CAC 40 Index
Nikkei Mexican Bolsa
FOMC -50 bps5/15
5/1 5/15 5/29 6/12
Implied Volatility on the S&P 100 Futures April 17, 2001 - June 25, 2001
VIX Index
FOMC -50 bps5/15
5/1 5/15 5/29 6/12
Page 4
Index 4/17 = 100 125
120
115
110
105
100
95
6/26
Index 4/17 = 100
115
110
105
100
95 6/26
Percent 34
32
30
28
26
24
22
20 6/26

January 1, 1999 to June 25, 2001 Page 5
Dollars per Euro Euro-Dollar Exchange Rate Dollars per Euro
1.20 1.20
1.15 1.15
1.10 1.10
1.05 1.05
1.00 1.00
0.95 0.95
0.90 0.90
0.85 0.85
0.80 0.80 Jan-99 Apr-99 Jul-99 Oct-99 Jan-00 Apr-00 Jul-00 Oct-00 Jan-01 Apr-01
Dollar minus Euro Interest Rate Differentials Basis Points Basis Points
320 320 3-Month Libor Deposit Rate Spread
240 240
2-Year Swap Spread 160 160
80 80 10-Year Swap Spread
0 0
-80 -80 Jan-99 Apr-99 Jul-99 Oct-99 Jan-00 Apr-00 Jul-00 Oct-00 Jan-01 Apr-01
Percent One-Month and Twelve-Month Euro-Dollar Implied Volatilities Percent 17 17
1-Month 16 16
15 15
14 14
13 13
12 12
11 11 12-Month10 10
9 9
8 8
7 7 Jan-99 Apr-99 Jul-99 Oct-99 Jan-00 Apr-00 Jul-00 Oct-00 Jan-01 Apr-01

Page 6
Currency Component of M1 (excludes vault cash) $ Billions Seasonally Adjusted $ Billions
Dec Jan Feb Mar Apr May Jun Jul Aug Sep Oct Nov Dec 2000 2001
Total Outright Purchases and Net SOMA Expansion $ Billions $ Billions
525
535
545
555
565
575
525
535
545
555
565
575
Actuals Estimates as of May FOMC meeting (5% growth over forecast period)
Current Estimates (7% growth over forecast period)
80
70
60
50
40
30
20
10
0
Net Portfolio Expansion Purchases to Offset Redemptions 80
70
60
50
40
30
20
10
0 1996 1997 1998 1999 2000 2001 2001
May Current Forecast Forecast

6/26-27/01 158
APPENDIX 2
Charts used by Messrs. Sichel, Struckmeyer, Fuhrer, and Steindel.

STRICTLY CONFIDENTIAL (FR) CLASS II-FOMC
Material for
Staff Briefings on Productivity Developments
June 26, 2001


1995:Q1
1995:Q3
1996:Q1
1996:Q3
1997:Q1
1997:Q3
1998:Q1
1998:Q3
1999:Q1
1999:Q3
2000:Q1
2000:Q3
2001:Q1
Figure 1
Distribution of Quarterly Productivity Growth Rates 1995 – 2001:Q1,Nonfarm Business Sector
0
2
4
6
8
10
12
Num
ber
of Q
uart
ers
0
2
4
6
8
10
12
Num
ber
of Q
uart
ers
Mean = 2.468
--1 0 1 2 3 4 5 6 7 8
Productivity Growth Rate
Quarterly Growth of Nonfarm Business Sector Productivity, 1995 – 2001:Q1
-2
0
2
4
6
8
10
Perc
ent G
row
th
-2
0
2
4
6
8
10
Perc
ent G
row
th
Growth < 1.1
1.1 < Growth < 3.4
3.4 < Growth < 5.8
5.8 < Growth
Source: U.S. Bureau of Labor Statistics: Nonfarm Business Sector, Output per Hour (SAAR, percent change).
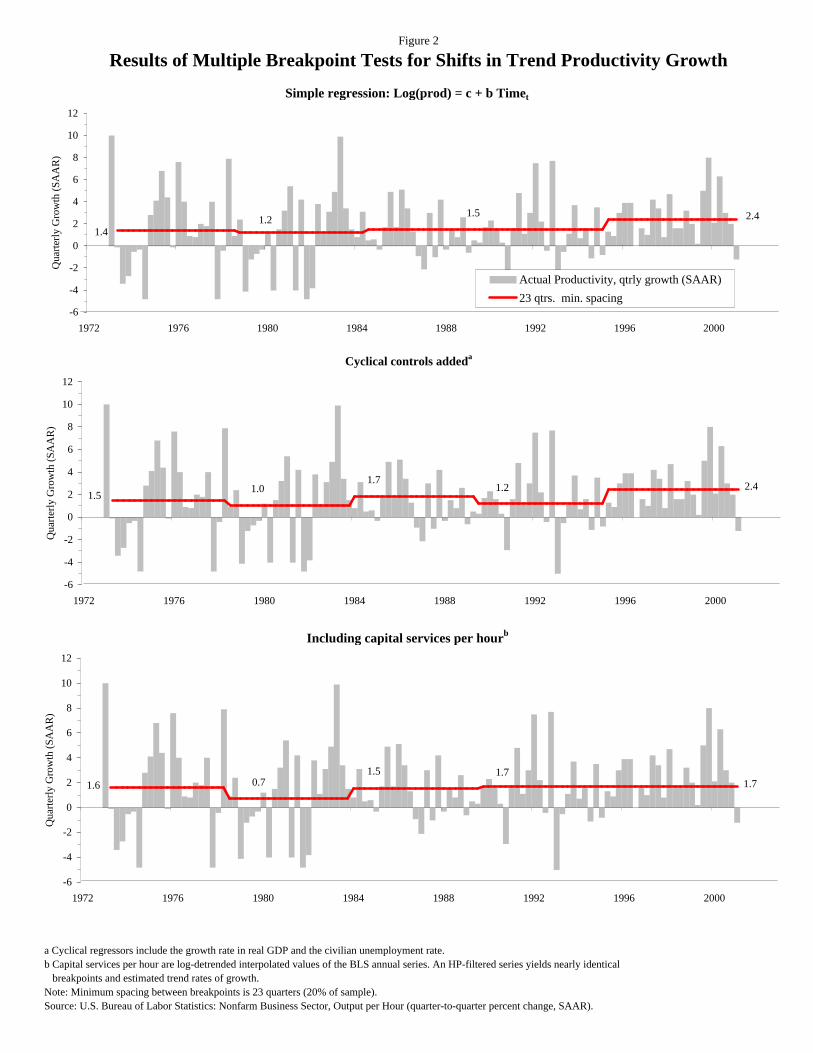
Figure 2
Results of Multiple Breakpoint Tests for Shifts in Trend Productivity GrowthQ
uart
erly
Gro
wth
(SA
AR
)
Simple regression: Log(prod) = c + b Timet
12
10
8
6
4
Actual Productivity, qtrly growth (SAAR)
23 qtrs. min. spacing
2.4
1.4 1.2
1.5 2
0
-2
-4
-6
1972 1976 1980 1984 1988 1992 1996 2000
Cyclical controls addeda
12
10
8
6
4
1972 1976 1980 1984 1988 1992 1996 2000
2.4 1.5
1.0 1.7
1.2
Qua
rter
ly G
row
th (
SAA
R)
Qua
rter
ly G
row
th (
SAA
R)
2
0
-2
-4
-6
Including capital services per hourb
12
10
8
6
4
2
0
-2
-4
-6
1972 1976 1980 1984 1988 1992 1996 2000
1.71.6 0.7 1.5 1.7
a Cyclical regressors include the growth rate in real GDP and the civilian unemployment rate. b Capital services per hour are log-detrended interpolated values of the BLS annual series. An HP-filtered series yields nearly identical
breakpoints and estimated trend rates of growth. Note: Minimum spacing between breakpoints is 23 quarters (20% of sample). Source: U.S. Bureau of Labor Statistics: Nonfarm Business Sector, Output per Hour (quarter-to-quarter percent change, SAAR).

1.0
2.0
3.0
5.0
1/25/19956/28/199511/8/19953/21/19968/15/199612/13/19965/15/19979/24/19971/28/19986/24/199811/12/19983/24/19998/18/199912/15/19995/11/20009/27/20001/25/20016/20/200110/31/2001
Figure 3
Structural Labor Productivity Growth Greenbook Forecasts vs. Real-Time "Actual" Productivity Data
6.0 6.0
Per
cent
Gro
wth
Per
cent
Gro
wth
Overall increase in 2001 forecast: + 1.4 percentage points
9/29/1999
8/16/2000
6/21/2001
Overall decrease
in
2001 forecast:
- 1.2 percentage
points
Memo: June 2001 Greenbook Structural Labor Productivity
(Q4/Q4 pct. change) 1999: 3.1 2000: 3.2 2001: 2.5
Real-Time Actual Productivity Data (average of most recent 4 quarters available at Greenbook publication, SAAR)
Average Greenbook Forecast for final two years in forecast horizon
Greenbook Forecast for 2001
Chain-weighted data begins Feb., 1996
4.0 4.0
0.0 0.0
Greenbook Publication Date
Source: Federal Reserve Board of Governors: Greenbook, Part 1; Nonfarm Business Sector, Output per Hour. Real-time data series is actual output
per hour (seasonally adjusted, at an annual rate), and is the average of the last 4 quarters available at the Greenbook's publication.
Forecasts are taken from the Greenbook, either from tables or from references to trends in structural labor productivity growth.
1.0
2.0
3.0
5.0

Table 1
Productivity Trends, 1960-2000
1960-1966 1967-1973 1974-1995 1996-2000
Labor Productivity Growth: Nonfarm Business 3.4 2.6 1.4 2.8 Nonfinancial Corporations 2.9 1.9 1.5 3.1 Manufacturing 2.7 3.0 2.7 4.9
Multifactor Productivity Growth BLS Estimates (Nonfarm Business): 2.5 1.6 0.4 1.1 Jorgenson-Stiroh Estimates (Private 1.4 0.9 0.3 1.0 (1996-1999)
Economy):

Table 2
Comments on Trend Productivity from Reports of the Council of Economic Advisors
“…the trend rate of increase in output per man-hour in the total economy is just over 2 ½ percent per year.” 1967, p. 44.
“…the trend rate of increase in output per man-hour in the total economy—private and public—is just over 2 ½ percent a year.” 1968, p. 68.
“…the trend rate of increase in aggregate productivity—private and public—has been about 2 ½ percent per year.” 1969, p. 66.
“In the private sector of the economy, [potential] output per man-hour is estimated to grow [from 1970 to 1975] by about 3.1 percent per year…” 1970, p.84
“The principal element in this computation [of the gross national product available] is an assumed 3percent trend rate of increase of productivity (output per labor-hour) in the private economy.” 1971, p. 94.

Chart 1Multifactor Productivity of Nonfarm Business
-4
-3
-2
-1
0
1
2
3
4
5
Perc
ent C
hang
e
-4
-3
-2
-1
0
1
2
3
4
5
1959 1961 1963 1965 1967 1969 1971 1973 1975 1977 1979 1981 1983 1985 1987 1989 1991 1993 1995 1997 1999 2001
Source: Bureau of Labor Statistics.

Chart 2Nonfarm Productivity Growth: Actual and Forecast
6
5
4
3
2
1
0
Forecast
Actual
-1 1966 1967 1968 1969 1970 1971 1972 1973 1974 1975 1976 1977 1978

Chart 3Nonfinancial Corporate Profits as a Percentage of Sector Gross Product
Q1-1960 Q1-1962 Q1-1964 Q1-1966 Q1-1968 Q1-1970 Q1-1972 Q1-1974 Q1-1976 Q1-1978 Q1-1980 3.0%
3.5%
4.0%
4.5%
5.0%
5.5%
6.0%
6.5%
7.0%

Chart 4Real Interest Rates and the S&P Earnings/Price Ratio
-4
-2
0
2
4
6
8
0
0.02
0.04
0.06
0.08
0.1
0.12
0.14
0.16
E/P Ratio Right Scale
Real 10-Year Rate Left Scale
Real Funds Rate Left Scale
Equilibrium Real Funds Rate
Q1-1960 Q1-1962 Q1-1964 Q1-1966 Q1-1968 Q1-1970 Q1-1972 Q1-1974 Q1-1976 Q1-1978 Q1-1980
Note: Real rates are nominal rates less four quarter growth in the core PCE price index. Equilibrium real funds rate estimated by Board staff using statistical filter.

6/26-27/01 159
APPENDIX 3
Charts used by Mr. Stockton, Mr. Wilcox, and Ms. Johnson.

STRICTLY CONFIDENTIAL (FR) CLASS II-FOMC
Material for
Staff Presentation on the Economic Outlook
June 26, 2001


Chart 2
Near-term Dynamics and the Industrial Sector
Inventory-Sales Ratio*
50
45
40
35 1998 1999 2000 2001
*Industrial Production system.
Computers and Communication Equipment Billions of dollars, ratio scale
24
21
18
15 1998 1999 2000 2001
Manufacturing Industrial Production Percent change, annual rate
90
60
30
+ 0 –
30 1998 1999 2000 2001 2002
Day’s Supply
Tech Sector
May
Three-month moving averages
Orders
Shipments
May
May
Quarterly
Tech (Computers, Communications, and Semiconductors)
Day’s Supply
Non-tech Sector
May
Three-month moving averages
Orders
Shipments May
May
Inventory-Sales Ratio*
60
59
58
57
56 1998 1999 2000 2001
*Industrial Production system, excludes transportation.
Other Equipment (ex. aircraft) Billions of dollars, ratio scale
48
46
44
42
40 1998 1999 2000 2001
Manufacturing Industrial Production Percent change, annual rate
8
4
+ 0 –
4
8 1998 1999 2000 2001 2002
Quarterly
Non-tech ex. Motor Vehicles

Chart 3
Near-term Developments
Sales of Light VehiclesMillions of units, annual rate
20 75Quarterly
Domestic
Foreign 7015
65
10
60
555
0 501998 1999 2000 2001
Housing StartsMillions of units, annual rate
2Quarterly
Singles
Multis 1.5
1
0.5
01998 1999 2000 2001
Initial ClaimsThousands
600Four-week moving average
500
June 16
400
300
2001989 1992 1995 1998 2001
Production and Day’s Supply of Light VehiclesDays Millions of units, annual rate
14Quarterly
Domestic production (right scale)
Day’s supply (left scale)
13
12
11
101998 1999 2000 20011998 1999 2000 2001
Total Real PCEBillions of 1996 dollars, ratio scale
7000
6700
6400
6100
5800
5500
52001998 1999 2000 2001
Payroll Employment ChangesThousands of employees
300
Monthly
Real PCE
Real PCE ex. tax effects
Three-month moving average
Manufacturing, wholesale trade, and help supply
Private service producing ex. wholesale trade and
help supply
May
May
200
100
+0–
100
2001998 1999 2000 2001


Chart 9
Outlook for Inflation
Actual and Structural Productivity Growth Unemployment Rate
1
0 –
+
1
2
3
4
5
6 Four-quarter percent change
Structural
3
4
5
6
7
8 Percent
Actual
Short-run effective NAIRU
1990 1993 1996 1999 2002 1990 1993 1996 1999 2002
PCE Energy Prices Inflation ExpectationsFour-quarter percent change Percent
30 3.6
Michigan SRCOne-year ahead, median
20
Q1
3.2
10 June
2.8 + 0 –
2.410
FRB Philadelphia One-year ahead
20 21995 1997 1999 2001 1995 1997 1999 2001
Inflation Four-quarter percent change
1995 1996 1997 1998 1999 2000 2001 20021
1.5
2
2.5
3
Core PCE
Core CPI - current methods
Core GDP


Chart 11
Exchange Rates and Interest Rates (Weekly data)
Nominal Exchange Rates Long-Term Interest Rates Foreign currency per U.S. dollar July 2, 1999 = 100 Percent
Major currencies*
Euro
Yen
130 8
1206
110
United States
Germany 4
100
290
Japan
80 0 1999 2000 2001 1999 2000 2001
*Trade-weighted average against major currencies.
Three-Month Interest Rates Eurocurrency Futures Yield Curves Percent Percent
United States
Euro Area
8As of June 25, 2001
Dollar
Yen
Euro
6
5
6
4
4 3
2
2
1Japan
0 0 1999 2000 2001 2001 2002
Broad Stock Price Indexes High-Tech Stock Price IndexesJuly 2, 1999 = 100 July 2, 1999 = 100
S&P 500
TOPIX
DJ Euro
160
NASDAQ JASDAQ
Neuer Markt
240
140 200
120 160
100 120
80 80
60 401999 2000 2001 1999 2000 2001

Chart 12
Trade Developments
Recent Developments: Exports and Imports Change in billions of dollars, SAAR
Q4-Q1 Mar-Apr
1. Goods Exports -5.2 -21.1
2. Capital goods 1.5 -17.6
of which:
3. Computers and semi. -5.4 -8.6
4. Automotive -5.5 0.4
5. Consumer goods 3.3 0.7
6. Other -4.5 -4.6
7. Services 1.8 -0.5
8. Total Goods and Services -3.3 -21.6
9. Good Imports -29.2 -32.5
10. Oil -10.1 5.9
11. Capital goods -11.7 -33.2
of which:
12. Computers and semi. -8.6 -13.7
13. Automotive -6.1 7.7
14. Consumer goods -0.9 -14.3
15. Other -0.4 1.4
16. Services 4.7 0.1
17. Total Goods and Services -24.4 -32.4
Oil Prices Dollars per barrel
Current WTI
Jan. Greenbook WTI
120
140
160
180
200
1999 2000 2001
Canada
Goods Exports by Region Billions of dollars, SAAR
40
60
80
100
120
1999 2000 2001
Mexico
Other L.A.
100
120
140
160
180
40
60
80
100
120
1999 2000 2001 120
140
160
180
200
1999 2000 2001 *Excludes gold.
Western Europe*
0
5
10
15
20
25
30
35
1999 2000 2001 2002 95
100
105
110
115
120
Real Exchange Rate Outlook* 1999Q1 = 100
Other Asia
Japan
Broad Dollar
Major Foreign
1999 2000 2001 2002 *Import/export weighted average.

Chart 13
Foreign Outlook
Real GDP Growth
2000
Percent change, SAAR*
United States Total foreign**
2001 2002
Foreign Real GDP Growth* Percent change, Q4/Q4
7 7
Industrial countries6
5
4
Asia Latin America
6
5
4
3 3
2 2
1 1
0 0 2000 2001 2002
*U.S. export weights.
H1
H2
Latin America Nominal Exchange Rates Stripped Brady Bond Yield Spreads over Foreign currency per U.S. dollar July 2, 1999 = 100 U.S. Treasuries Percentage points
Weekly
Argentina
Mexico
Brazil
140
Argentina
Mexico
Brazil
20Weekly
130 16
120 12
110 8
100 4
90 01999 2000 2001 1999 2000 2001
Industrial Production Real GDP Growth July 1997 = 100, SA Percent change, SAAR*
Argentina
Mexico Brazil
120
2000 2001 2002 H1 H2
115
110
1. Latin America** 4.8 0.4 2.9 4.1105
of which:100
2. Mexico 5.2 0.1 3.1 4.4
95 3. Brazil 4.2 1.2 2.0 2.9
4. Argentina -2.0 1.0 1.6 1.990
851997 1998 1999 2000 2001 *Years are Q4/Q4; half years are Q2/Q4 or Q4/Q2.
**U.S. export weights.
*Years are Q4/Q4; half years are Q2/Q4 or Q4/Q2. **U.S. export weights.

Chart 14
Asia
Nominal Exchange Rates Foreign currency per U.S. dollar July 2, 1999 = 100
Weekly
China
Korea
Thailand
125
120
115
110
105
100
95 Taiwan
90 1999 2000 2001
Offshore-Dollar Bond Yield Spreads over U.S. Treasuries Percentage points
8
6
4
2
0 1999 2000 2001
Daily Philippines
Thailand
Korea
Worldwide Semiconductor Shipments versus Asian Semiconductor Producer IP Billions of dollars
20
18
16
14
12
10
8 1995 1996 1997 1998 1999
Worldwide Semiconductor
Shipments
Asian Semiconductor Producer IP*
June 1996 = 100 150
140
130
120
110
100
90 2000 2001
*SA, 3-month moving average of Korean, Malaysian, Philippine, Singaporean, and Taiwanese IP weighted by shares of total U.S. exports.
Share of High-Tech Goods* Percent
in IP in Total Exports**
1. Korea 12 31
2. Taiwan 18 31
3. Singapore 47 55
4. Malaysia 20 57
5. Philippines 11 57
Real GDP Growth Percent change, SAAR*
2000 2001 2002 H1 H2
1. Developing Asia** 6.1 0.7 3.0 4.7 of which:
2. China 7.4 7.0 7.5 7.6 3. Korea 5.2 1.6 2.5 4.2 4. Taiwan 4.1 -1.4 1.0 3.8 5. Singapore 11.0 -5.8 4.0 5.7 6. Hong Kong 6.6 1.2 1.7 4.0
*Includes semiconductors, computers and components, and *Years are Q4/Q4; half years are Q2/Q4 or Q4/Q2. telecommunications equipment and parts. Data for some **U.S. export weights.
countries include other electronic and electrical devices.
**Data are 1998-2000 average. Data for Singapore are for 2000 only.

Chart 15
Industrial Countries
Industrial Production Business ConfidenceJuly 1999 = 100, SA 1999Q3 = 100 Diffusion index
Euro Area
Canada
Japan
110 110 10
108 5
100
106 0
104 90 -5
102 -10
80
100 -15
98 70 -20 1999 2000 2001 1999 2000 2001
Employment Consumer ConfidenceJuly 1999 = 100 Diffusion index 1999Q3 = 100
Canada
Japan
Euro Area
104 2 110
0 105
102
-2 100
100
-4 95
98 -6 90 1999 2000 2001 1999 2000 2001
Real GDP Growth Real Domestic Demand Growth Percent change, SAAR* Percent change, SAAR*
2000 2001 2002H1 H2
2000 2001 2002 H1 H2
Euro Area
Canada
Japan
Euro Area
Canada
Japan
1. Indust. countries** 3.1 1.4 1.8 2.7 1. Japan 2.5 -0.6 -1.4 0.9 of which:
2. Euro Area 2.3 0.8 2.0 2.5 2. Japan 2.5 -1.0 -1.3 1.0
3. Euro Area 2.9 1.8 1.9 2.6 3. United Kingdom 2.9 2.7 2.8 2.7
4. United Kingdom 2.6 1.6 2.4 2.6 4. Canada 2.7 1.4 2.8 3.0 5. Canada 3.5 1.9 2.4 3.1
*Years are Q4/Q4; half years are Q2/Q4 or Q4/Q2. *Years are Q4/Q4; half years are Q2/Q4 or Q4/Q2. **U.S. export weights.

Chart 16
External Sector
Determinants of Core Exports Percent change, Q4/Q4
Core export growth Contr. of for. GDP growth Contr. of rel. prices Ind. output gap growth
16
12
8
4
0
-4 2000 2001 2002
Real Export Growth Percent change, Q4/Q4
Determinants of Core Imports Percent change, Q4/Q4
20Core import growth Contr. of GDP growth Contr. of rel. prices 16
12
8
4
0 2000 2001 2002
Contribution to U.S. GDP Growth Percentage points
Exports Imports
3
2
1
0
-1
-2
-3 2000 2001 2002
1999 2000 2001 2002
Growth of real exports Growth of real imports 1. G & S 4.3 6.7 -0.9 5.1 1. G & S 12.0 11.3 0.5 7.3
Percentage point contribution Percentage point contribution 2. Services 0.1 0.8 0.3 1.6 2. Services 0.4 2.0 0.7 0.8 3. Goods 4.2 5.9 -1.2 3.5 3. Goods 11.6 9.3 -0.2 6.5
of which: of which: 4. Core* 2.3 3.6 -0.1 1.3 4. Core* 9.5 6.9 0.4 4.5
*Excludes computers and semiconductors.
Current Account Percent Billions of dollars
2002
Level
Percent of GDP
00
-200-2
-400-4
-600-6 1990 1992 1994 1996 1998 2000 2002
Real Import Growth Percent change, Q4/Q4
1999 2000 2001 2002
*Excludes computers, semiconductors, and oil.
Capital Flows Billions of dollars, AR
2000 2001Q1
Official capital, net 36 17Japanof which: 19 -11
Private capital, net 407 295 of which: For. purch. of U.S. sec. 433 591
Treasuriesof which: -53 2 U.S. purch. of for. sec. -125 -114 For. D.I. in U.S. 288 168 U.S. D.I. abroad -152 -144

Chart 17
ECONOMIC PRO JECTIONS FOR 2001
FOMC
Nominal GDP
February 2001
Range Central
Tendency
Staff
-------------Percen tage chang e, Q4 to Q4-----------
3¼ to 5
(3¾ to 5¼)
3½ to 4¼
(4 to 5)
3.6
(3.8)
Real GDP
February 2001
1 to 2
(2 to 2¾)
1¼ to 2
(2 to 2½)
1.4
(1.8)
PCE Prices
February 2001
2 to 3
(1¾ to 2½)
2 to 2½
(1¾ to 2¼)
2.0
(1.8)
--------------Average leve l, Q4, percen t--------------
Une mplo yme nt rate
February 2001
4¾ to 5
(4½ to 5)
4¾ to 5
(About 4½)
5.2
(5.2)
Central tendencies calculated by dropping high and low three from ranges.
ECONOMIC PRO JECTIONS FOR 2002
FOMC
Range Central Staff
Tendency
-------------Percen tage chang e, Q4 to Q4-----------
Nominal GDP 4½ to 6 5¼ to 5½ 5.3
Real GDP 3 to 3½ 3 to 3¼ 3.5
PCE Prices 1½ to 3 2 to 2½ 1.7
--------------Average leve l, Q4, percen t--------------
Une mplo yme nt rate 4½ to 5½ 4¾ to 5¼ 5.6


