
NRW Holdings Limited (ASX: NWH)ABN 95 118 300 217
Interim Financial ReportFor the Half-Year Ended31 December 2013
NRW Civil NRW Mining Drill & BlastEquipment
Refurbishment Facility
For
per
sona
l use
onl
y

1Interim Financial ReportFor the half-year ended 31 December 2013
APPENDIX 4DRESULTS FOR ANNOUNCEMENT TO THE MARKET
For the Half-Year Ended 31 December 2013
NRW Holdings LimitedACN 118 300 217
% Change up / (down)
Half-year ended 31 Dec 2013
$’000
Half-year ended 31 Dec 2012
$’000
Revenues from ordinary activities (35.74 %) 520,931 810,697
Profit from ordinary activities after tax attributable to members
(53.94 %) 22,376 48,575
Net profit for the period attributable to members (53.94 %) 22,376 48,575
Interim Dividend
Date dividend is payable 9 April 2014 28 March 2013
Record date to determine entitlements to dividend 12 March 2014 1 March 2013
Interim dividend payable per security (cents) 4.0 8.0
Franked amount of dividend per security (cents) 4.0 8.0
Ratios and Other Measures
Net tangible asset backing per ordinary security $1.19 $1.17
For
per
sona
l use
onl
y

Interim Financial ReportFor the half-year ended 31 December 2013
2
CORPORATE DIRECTORY
Directors Ian Burston – Non-executive Chairman
Michael Arnett – Non-executive Director
Julian Pemberton – Chief Executive Officer and Managing Director
John Cooper – Non-executive Director
Jeff Dowling – Non-executive Director
Company Secretary Kimberley Hyman
Registered Office 181 Great Eastern Highway
BELMONT WA 6104
Telephone: +61 8 9232 4200
Facsimile: +61 8 9232 4232
Email: [email protected]
Auditor Deloitte Touche Tohmatsu
Level 14
Woodside Plaza
240 St Georges Terrace
PERTH WA 6000
Share Registry Link Market Services Limited
Level 2
178 St Georges Terrace
PERTH WA 6000
Telephone: +61 8 9211 6652
Facsimile: +61 8 9211 6660
ASX Code NWH – NRW Holdings Limited Fully Paid Ordinary Shares
Web Page www.nrw.com.au
For
per
sona
l use
onl
y

3Interim Financial ReportFor the half-year ended 31 December 2013
CONTENTS
Directors’ report ......................................................................................................................................... 4
Auditor’s independence declaration ............................................................................................................ 7
Directors’ declaration .................................................................................................................................. 8
Condensed consolidated statement of profit or loss and other comprehensive income ............................... 9
Condensed consolidated statement of financial position ........................................................................... 10
Condensed consolidated statement of changes in equity ......................................................................... 11
Condensed consolidated statement of cash flows .................................................................................... 12
Notes to the financial statements .............................................................................................................. 13
Independent review report ........................................................................................................................ 18
For
per
sona
l use
onl
y
Interim Financial ReportFor the half-year ended 31 December 2013
4
DIRECTORS’ REPORT
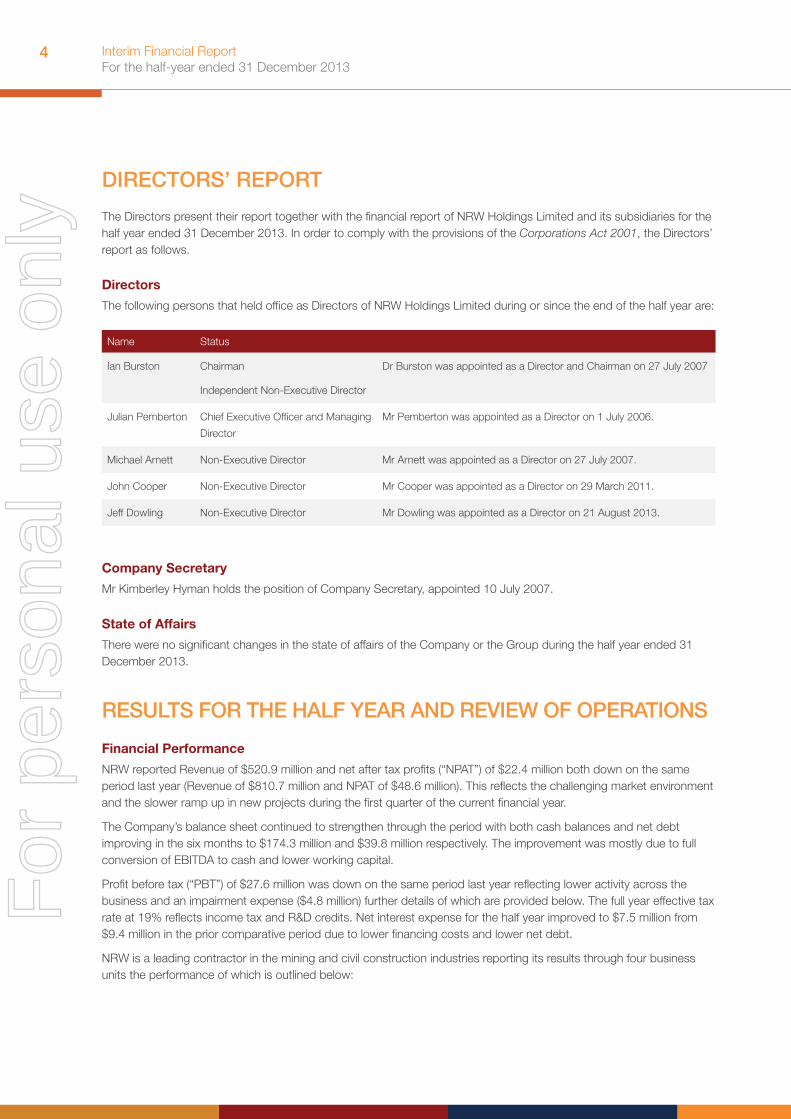
The Directors present their report together with the financial report of NRW Holdings Limited and its subsidiaries for the half year ended 31 December 2013. In order to comply with the provisions of the Corporations Act 2001, the Directors’ report as follows.
Directors
The following persons that held office as Directors of NRW Holdings Limited during or since the end of the half year are:
Name Status
Ian Burston Chairman
Independent Non-Executive Director
Dr Burston was appointed as a Director and Chairman on 27 July 2007
Julian Pemberton Chief Executive Officer and Managing
Director
Mr Pemberton was appointed as a Director on 1 July 2006.
Michael Arnett Non-Executive Director Mr Arnett was appointed as a Director on 27 July 2007.
John Cooper Non-Executive Director Mr Cooper was appointed as a Director on 29 March 2011.
Jeff Dowling Non-Executive Director Mr Dowling was appointed as a Director on 21 August 2013.
Company Secretary
Mr Kimberley Hyman holds the position of Company Secretary, appointed 10 July 2007.
State of Affairs
There were no significant changes in the state of affairs of the Company or the Group during the half year ended 31 December 2013.
RESULTS FOR THE HALF YEAR AND REVIEW OF OPERATIONS
Financial Performance
NRW reported Revenue of $520.9 million and net after tax profits (“NPAT”) of $22.4 million both down on the same period last year (Revenue of $810.7 million and NPAT of $48.6 million). This reflects the challenging market environment and the slower ramp up in new projects during the first quarter of the current financial year.
The Company’s balance sheet continued to strengthen through the period with both cash balances and net debt improving in the six months to $174.3 million and $39.8 million respectively. The improvement was mostly due to full conversion of EBITDA to cash and lower working capital.
Profit before tax (“PBT”) of $27.6 million was down on the same period last year reflecting lower activity across the business and an impairment expense ($4.8 million) further details of which are provided below. The full year effective tax rate at 19% reflects income tax and R&D credits. Net interest expense for the half year improved to $7.5 million from $9.4 million in the prior comparative period due to lower financing costs and lower net debt.
NRW is a leading contractor in the mining and civil construction industries reporting its results through four business units the performance of which is outlined below:
For
per
sona
l use
onl
y

5Interim Financial ReportFor the half-year ended 31 December 2013
NRW Civil Contracting
The Civil Division delivers high quality civil projects, including earthworks and concrete projects. The business secured a $620 million contract for the Roy Hill project to construct approximately 330 kilometres of main line heavy haul rail formation together with sidings and level crossing and associated works. Sales in the six months at $365.1 million were below the historic high levels reported last year and included work for Rio Tinto on a number of iron ore projects and earthworks for the Roy Hill mine site development. The business continued to deliver consistent margins (9.8%) resulting in EBIT of $35.7 million.
NRW Mining Services
The Mining Division provides coal and iron ore mining services throughout WA’s Pilbara region and Queensland’s Bowen Basin. Sales of $101.9 million were down on last year following the decision made by the client at the Middlemount coal mine to transition to a dry hire model and the loss of certain iron ore contracts as part of the industry majors cost improvement initiatives. Whilst EBIT reduced to $7.9 million reflecting the sales reduction it was pleasing to see an improvement in margins following cost restructuring initiatives implemented over the last 12 months.
Action Drill and Blast Pty Ltd
Action Drill & Blast (ADB) provides contract drill and blast services to mining (including iron ore and coal mining) and civil companies throughout Australia. Revenues of $52.0 million and EBIT of $1.2 million were below last year reflecting the downturn in the market and consequent underutilisation of assets. The business has secured a number of new contracts which is expected to improve utilisation in the second half.
Action Mining Services Pty Ltd
Action Mining Services (AMS) provides maintenance services to the mining and resources sectors including the fabrication of water and service trucks. Revenues in the business reduced to $15.6 million compared to $21.1 million in the prior comparative period reflecting a significant downturn in market activity. The lower revenues resulted in an operating loss of $0.4 million in the first half of the current financial year compared to an operating profit of $1.7 million in the corresponding period. The business is expected to recover to profit in the second half however reviews of the ongoing business have concluded that the current carrying value of Goodwill should be reduced by $4.8 million to reflect a more competitive market environment going forward. This impairment charge has been included in the half year result.
Balance Sheet, Operating Cash Flow and Capital Expenditure
Net assets increased to $361.3 million in the six month period. Cash balances improved by $43.3 million to $174.3 million whilst debt levels improved slightly to $214.1 million. The improved net debt balance was due to the operating result in the period, lower capital expenditure ($15.4 million), tax refunds and improvements in working capital balances partly driven by major project advances expected to be utilised through 2014. Capital expenditure mostly relates to conversion of existing drilling and civil fleet asset operating leases. Gearing improved to 11% as at 31 December 2013.
Outlook
The award of new contracts during the period, existing contracts which contribute to the $1.3 billion order book and a robust tender pipeline of $3.3 billion provide the basis for revenue growth in the second half and good visibility for FY15. The Group’s balance sheet, funding facilities and solid cash position provide a strong foundation for future organic growth and to continue to review potential acquisitions. Workforce levels have increased to 2,626 from 2,283 at June 2013 to meet the ramp up in work particularly on the Roy Hill contract in the second half. Revenue guidance for the full financial year is reconfirmed at $1.0 to $1.2 billion as advised at the Annual General Meeting of Shareholders in November 2013.
For
per
sona
l use
onl
y

Interim Financial ReportFor the half-year ended 31 December 2013
6
Dividend
The Directors have declared a fully franked interim dividend of 4.0 cents per share for the half year ended 31 December 2013. The dividend will be paid on 9 April 2014 on shares registered at 5.00pm on 12 March 2014.
Significant Events after Period End
No matter or circumstance has arisen since the end of the interim reporting period that has significantly affected, or may significantly affect, the Group’s operations, the results of those operations, or its state of affairs in future financial periods.
Auditor’s Independence Declaration
The Directors received the Auditor’s Independence Declaration from the auditor of the Company, which is included on page 7 of the half-year financial report.
Rounding of Amounts
The Company is of a type referred to in ASIC Class Order 98/0100 issued by ASIC and in accordance with that Class Order amounts in the Directors’ report and the Financial report are rounded off to the nearest thousand dollars, unless otherwise stated.
Signed in accordance with a resolution of Directors made pursuant to s.306(3) of the Corporations Act 2001.
On behalf of the Directors
Julian Pemberton Ian BurstonChief Executive Officer Chairman
Dated this 26 February 2014
For
per
sona
l use
onl
y

7Interim Financial ReportFor the half-year ended 31 December 2013
AUDITOR’S INDEPENDENCE DECLARATION
For
per
sona
l use
onl
y

Interim Financial ReportFor the half-year ended 31 December 2013
8
DIRECTORS’ DECLARATION
The Directors of the Company declare that:
(a) in the Directors’ opinion, there are reasonable grounds to believe that the Company will be able to pay its debts as and when they become due and payable; and
(b) in the Directors’ opinion, the attached financial statements and notes thereto are in accordance with the Corporations Act 2001, including compliance with the accounting standards and giving a true and fair view of the financial position and performance of the consolidated entity.
Signed in accordance with a resolution of the Directors made pursuant to s.303(5) of the Corporations Act 2001.
On behalf of the Directors
Julian Pemberton Ian Burston
Chief Executive Officer Chairman
Dated this 26 February 2014
For
per
sona
l use
onl
y

9Interim Financial ReportFor the half-year ended 31 December 2013
CONDENSED CONSOLIDATED STATEMENT OF PROFIT OR LOSS AND OTHER COMPREHENSIVE INCOME FOR THE HALF YEAR ENDED DECEMBER 2013
ConsolidatedHalf-year ended 31
December 2013 $’000
ConsolidatedHalf-year ended 31
December 2012 $’000
Revenue 520,931 810,697
Finance income 978 458
Finance costs (8,495) (9,859)
Materials and consumables used (99,031) (126,303)
Employee benefits expense (171,288) (247,674)
Subcontractor costs (100,470) (183,029)
Depreciation and amortisation expenses (24,494) (22,619)
Impairment expense (4,800) -
Plant and equipment costs (79,655) (144,350)
Other expenses (6,048) (7,972)
Profit before income tax 27,628 69,349
Income tax expense (5,252) (20,774)
Profit for the period 22,376 48,575
Other comprehensive income
Items that may be reclassified subsequently to profit or loss
Exchange differences arising on translation of foreign operations (2) (5)
Total comprehensive income 22,374 48,570
Profit Attributable to:
Equity holders of the Company 22,376 48,575
Total Comprehensive Income Attributable to:
Equity holders of the Company 22,374 48,570
Earnings per share (cents per share)
Basic earnings per share 8.0 17.8
Diluted earnings per share 8.0 17.7For
per
sona
l use
onl
y

Interim Financial ReportFor the half-year ended 31 December 2013
10
CONDENSED CONSOLIDATED STATEMENT OF FINANCIAL POSITION AS AT 31 DECEMBER 2013
NoteConsolidated
31 December 2013$’000
Consolidated30 June 2013
$’000
Assets
Current assets
Cash and cash equivalents 174,290 130,994
Trade and other receivables 156,242 205,052
Inventories 40,329 48,547
Current tax assets - 3,773
Other current assets 4,243 5,400
Total current assets 375,104 393,766
Non-current assets
Property, plant and equipment 372,038 387,696
Other intangible assets 9,571 8,126
Goodwill 19,617 24,417
Total non-current assets 401,226 420,239
Total assets 776,330 814,005
Liabilities
Current liabilities
Trade and other payables 144,956 196,939
Borrowings 52,567 52,379
Current tax liabilities 10,653 -
Provisions 15,758 16,139
Total current liabilities 223,934 265,457
Non-current liabilities
Borrowings 161,504 167,191
Provisions 1,343 1,201
Deferred tax liability 28,252 27,286
Total non-current liabilities 191,099 195,677
Total liabilities 415,033 461,135
Net assets 361,297 352,870
Equity
Contributed equity 3 156,432 156,432
Reserves 4 2,771 2,777
Retained earnings 5 202,094 193,661
Total equity 361,297 352,870
The accompanying notes are an integral part of these condensed consolidated financial statements.
For
per
sona
l use
onl
y
11Interim Financial ReportFor the half-year ended 31 December 2013
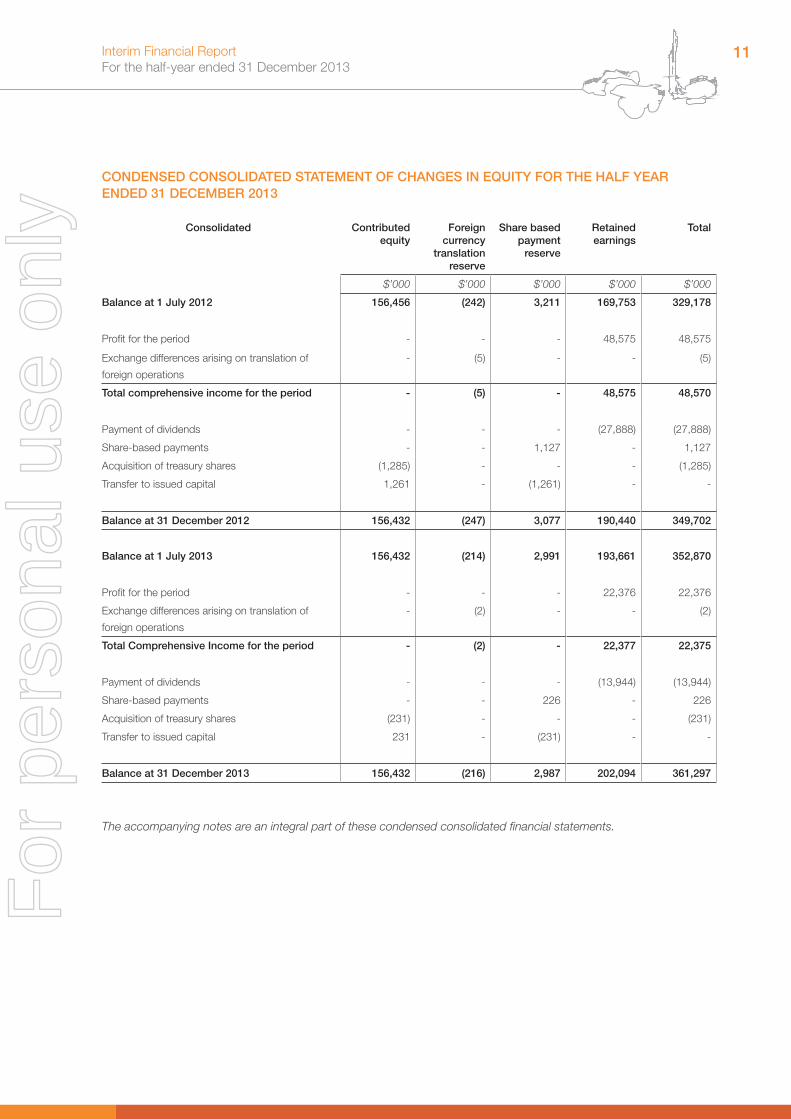
CONDENSED CONSOLIDATED STATEMENT OF CHANGES IN EQUITY FOR THE HALF YEAR ENDED 31 DECEMBER 2013
Consolidated Contributed equity
Foreign currency
translation reserve
Share based payment
reserve
Retained earnings
Total
$’000 $’000 $’000 $’000 $’000
Balance at 1 July 2012 156,456 (242) 3,211 169,753 329,178
Profit for the period - - - 48,575 48,575
Exchange differences arising on translation of
foreign operations
- (5) - - (5)
Total comprehensive income for the period - (5) - 48,575 48,570
Payment of dividends - - - (27,888) (27,888)
Share-based payments - - 1,127 - 1,127
Acquisition of treasury shares (1,285) - - - (1,285)
Transfer to issued capital 1,261 - (1,261) - -
Balance at 31 December 2012 156,432 (247) 3,077 190,440 349,702
Balance at 1 July 2013 156,432 (214) 2,991 193,661 352,870
Profit for the period - - - 22,376 22,376
Exchange differences arising on translation of
foreign operations
- (2) - - (2)
Total Comprehensive Income for the period - (2) - 22,377 22,375
Payment of dividends - - - (13,944) (13,944)
Share-based payments - - 226 - 226
Acquisition of treasury shares (231) - - - (231)
Transfer to issued capital 231 - (231) - -
Balance at 31 December 2013 156,432 (216) 2,987 202,094 361,297
The accompanying notes are an integral part of these condensed consolidated financial statements.
For
per
sona
l use
onl
y
Interim Financial ReportFor the half-year ended 31 December 2013
12
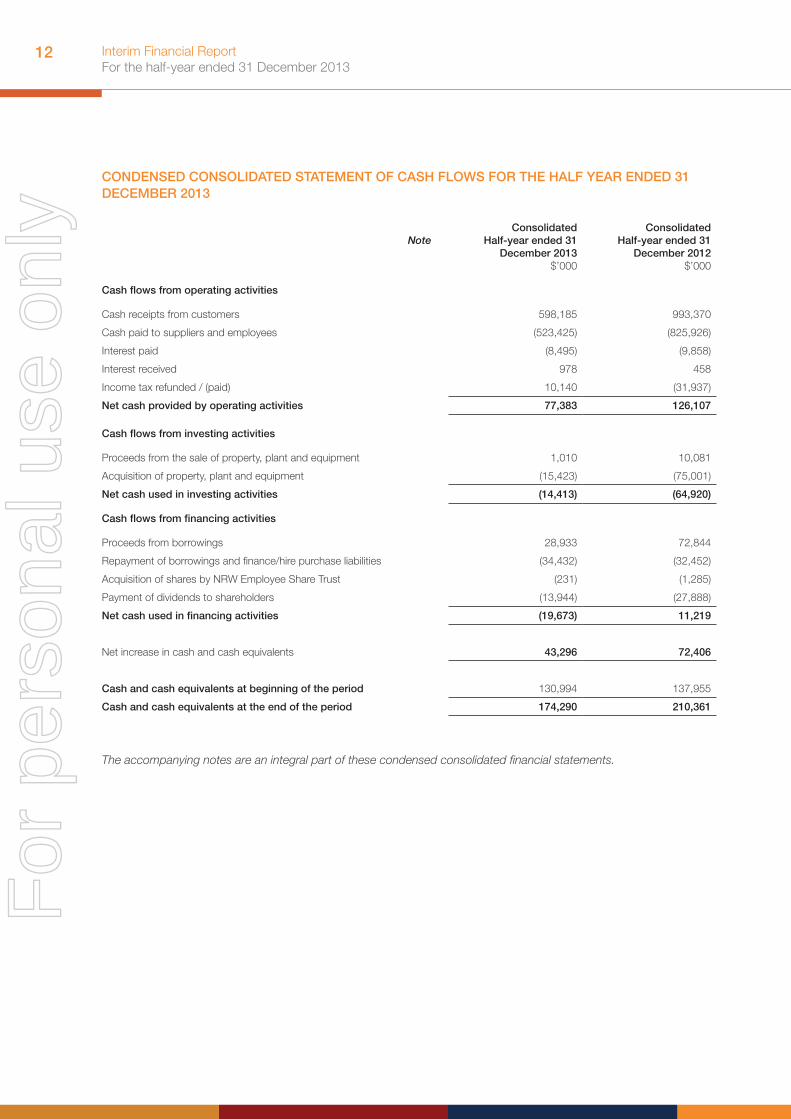
CONDENSED CONSOLIDATED STATEMENT OF CASH FLOWS FOR THE HALF YEAR ENDED 31 DECEMBER 2013
NoteConsolidated
Half-year ended 31 December 2013
$’000
ConsolidatedHalf-year ended 31
December 2012$’000
Cash flows from operating activities
Cash receipts from customers 598,185 993,370
Cash paid to suppliers and employees (523,425) (825,926)
Interest paid (8,495) (9,858)
Interest received 978 458
Income tax refunded / (paid) 10,140 (31,937)
Net cash provided by operating activities 77,383 126,107
Cash flows from investing activities
Proceeds from the sale of property, plant and equipment 1,010 10,081
Acquisition of property, plant and equipment (15,423) (75,001)
Net cash used in investing activities (14,413) (64,920)
Cash flows from financing activities
Proceeds from borrowings 28,933 72,844
Repayment of borrowings and finance/hire purchase liabilities (34,432) (32,452)
Acquisition of shares by NRW Employee Share Trust (231) (1,285)
Payment of dividends to shareholders (13,944) (27,888)
Net cash used in financing activities (19,673) 11,219
Net increase in cash and cash equivalents 43,296 72,406
Cash and cash equivalents at beginning of the period 130,994 137,955
Cash and cash equivalents at the end of the period 174,290 210,361
The accompanying notes are an integral part of these condensed consolidated financial statements.
For
per
sona
l use
onl
y

13Interim Financial ReportFor the half-year ended 31 December 2013
NOTES TO FINANCIAL STATEMENTS1. Significant Accounting Policies
(a) Statement of compliance
The half-year financial report is a general purpose financial report which has been prepared in accordance with the Corporations Act 2001 and AASB 134 ‘Interim Financial Reporting’.
Compliance with AASB 134 ensures compliance to International Financial Reporting Standards IAS 34 ‘Interim Financial Reporting’. The half-year report does not include notes of the type normally included in an annual financial report and shall be read in conjunction with the most recent annual financial report.
(b) Basis of Preparation
The condensed consolidated financial statements have been prepared on the basis of historical cost, except for financial instruments. Cost is based on the fair values of the consideration given in exchange for assets. All amounts are presented in Australian dollars, unless otherwise noted.
The company is a company of the kind referred to in ASIC Class Order 98/0100, dated 10 July 1998, and in accordance with that Class Order amounts in the directors’ report and the half-year financial report are rounded off to the nearest thousand dollars, unless otherwise indicated.
The accounting policies and methods of computation adopted in the preparation of the half-year financial report are consistent with those adopted and disclosed in the company’s 2013 annual financial report for the financial year ended 30 June 2013, except for the impact of the Standards and Interpretations described below.
Application of new and revised Accounting Standards
Standards and Interpretations adopted in the current year
The Group has adopted all of the new and revised Standards and Interpretations issued by the Australian Accounting Standards Board that are relevant to their operations and are effective for the current financial reporting period, being the half year ended 31 December 2013.
New and revised Standards and amendments thereof and Interpretations effective for the current half-year that are relevant to the Group include:
• AASB 10 ‘Consolidated Financial Statements’ and AASB 2011-7 ‘Amendments to Australian Accounting Standards arising from the consolidation and Joint Arrangements standards’
• AASB 11 ‘Joint Arrangements’ and AASB 2011-7 ‘Amendments to Australian Accounting Standards arising from the consolidation and Joint Arrangements standards’
• AASB 119 ‘Employee Benefits’ (2011) and AASB 2011-10 ‘Amendments to Australian Accounting Standards arising from AASB 119 (2011)’
• AASB 2012-2 ‘Amendments to Australian Accounting Standards – Disclosures – Offsetting Financial Assets and Financial Liabilities’F
or p
erso
nal u
se o
nly

Interim Financial ReportFor the half-year ended 31 December 2013
14
2. Segment Information
Information regarding these segments is reported below. The accounting policies for the reportable segments are the same as the Group’s accounting policies.
Segment results and segment assets include items directly attributable to a segment as well as those that can be allocated on a reasonable basis. Unallocated items comprise predominantly interest bearing loans, borrowings, and corporate assets and expenses. Inter-segment pricing is determined on an arm’s length basis.
(a) Reportable segments
The Board has identified the following reportable segments:
• Civil Contracting. The provision of civil infrastructure and other construction services including rail formation, concrete works, bulk earthworks and detailed road and tunnel construction.
• Mining Services. The provision of mining contracting services including earth moving, waste stripping, ore haulage and related ancillary services.
• Drilling and Blasting Services. The provision of services to meet internal and external requirements regarding drilling and blasting activities in Australia predominantly in civil and mining projects.
• Fabrication and Repair Services. The provision of equipment repairs, sandblasting and painting services, service truck and water tanker fabrication and import services, including quarantine cleaning and the marketing and sales of the fabricated water and service trucks.
For
per
sona
l use
onl
y

15Interim Financial ReportFor the half-year ended 31 December 2013
2. Segment Information (Continued)
(b) Segment Revenues and Profit
Segment Revenue Half-year ended
Segment Profit (Loss) Half-year ended
31 Dec 2013 31 Dec 2012 31 Dec 2013 31 Dec 2012
$’000 $’000 $’000 $’000
Civil Contracting 365,089 479,312 35,656 52,044
Mining Services 101,912 272,380 7,943 14,954
Drilling & Blasting Services 52,012 94,026 1,222 14,391
Fabrication & Repair Services 15,590 21,087 (400) 1,734
Eliminations (13,672) (56,108) - -
Total for continuing operations 520,931 810,697 44,421 83,123
Other unallocated expenses (9,276) (4,373)
Net finance costs (7,517) (9,401)
Income tax expense (5,252) (20,774)
Profit for the period 22,376 48,575
(c) Segment Assets
Segment Assets
31 Dec 2013 30 June 2013
$’000 $’000
Civil Contracting 361,758 291,422
Mining Services 284,112 395,788
Drilling & Blasting Services 63,744 52,782
Fabrication & Repair Services 33,257 41,720
Other unallocated assets (1) 33,459 32,292
Consolidated assets 776,330 814,005
(1) Represents corporate head office and systems improvement costs that cannot be allocated to other segments.
3. Contributed equity
Ordinary shares No.
Consolidated Half-year ended
31 December 2013
$’000 No.
Consolidated Full-year ended 30
June 2013 $’000
Balance at the beginning of the period 278,877,219 156,432 278,888,011 156,456
Acquisition of treasury shares (146,011) (231) (586,641) (1,285)
Transfer to contributed equity 146,011 231 575,849 1,261
Balance at the end of the period 278,877,219 156,432 278,877,219 156,432
Fully paid ordinary shares carry one vote per share and carry the right to dividends.
During the half-year, the Group acquired 146,011 ordinary shares for $230,564 and reissued 146,011 ordinary shares for $230,564 on vesting of performance rights.
For
per
sona
l use
onl
y

Interim Financial ReportFor the half-year ended 31 December 2013
16
4. Reserves
ConsolidatedHalf-year ended 31
December 2013$’000
ConsolidatedFull-year ended
30 June 2013$’000
Share based payment reserve 2,987 2,991
Foreign currency reserve (216) (214)
Total reserves 2,771 2,777
ConsolidatedHalf-year ended 31
December 2013$’000
ConsolidatedFull-year ended
30 June 2013$’000
Share based payment reserve
Balance at the beginning of the financial year 2,991 3,211
Shares issued for vested rights (231) (1,261)
Share based payments 227 1,042
Balance at the end of the financial year 2,987 2,991
ConsolidatedHalf-year ended 31
December 2013$’000
ConsolidatedFull-year ended 30
June 2013$’000
Foreign currency translation reserve
Balance at the beginning of the financial year (214) (242)
Exchange differences arising on translation of foreign operations (2) 28
Balance at the end of the financial year (216) (214)
Exchange differences arising on translation of the foreign controlled entity are taken to the foreign currency translation reserve. The reserve is recognised in the income statement when the foreign operation is disposed of.
5. Retained earnings
Notes ConsolidatedHalf-year ended 31
December 2013$’000
ConsolidatedFull-year ended 30
June 2013$’000
Balance at the beginning of the period 193,661 169,753
Net profit attributable to members of the parent entity 22,376 74,107
Dividends paid 6 (13,944) (50,199)
Balance at the end of the period 202,094 193,661For
per
sona
l use
onl
y

17Interim Financial ReportFor the half-year ended 31 December 2013
6. DividendsDuring the period, NRW Holdings Limited made the following dividend payments:
Consolidated Half-year ended 31
December 2013
Consolidated Half-year ended 31
December 2012
Cents per share $’000 Cents per share $’000
Fully paid ordinary shares
Final dividend 5.00 13,944 10.00 27,889
On 26 February 2014, the Directors declared a fully franked interim dividend of 4 cents per share to the holders of fully paid ordinary shares in respect of the half-year ended 31 December 2013, to be paid to shareholders on 9 April 2014. This dividend has not been included as a liability in these financial statements. The total estimated dividend to be paid is $11,155,089.
7. Borrowings
During the period, the Group maintained its working capital and asset financing facilities. The facilities are available by way of overdraft, finance lease, operating lease, hire purchase agreement or secured progressive draw.
8. Subsequent events
There has been no significant event that has occurred between the balance date and the date of this report that has significantly affected, or may significantly affect the operations of the economic entity, the results of these operations or the state of affairs of the entity in future periods.
For
per
sona
l use
onl
y
Interim Financial ReportFor the half-year ended 31 December 2013
18
INDEPENDENT REVIEW REPORT
For
per
sona
l use
onl
y

19Interim Financial ReportFor the half-year ended 31 December 2013
For
per
sona
l use
onl
y


