
annual report 2009
For
per
sona
l use
onl
y

Chairman’s Address 3
Shareholder Information 4
Annual Financial Report 7
Corporate Governance Statement 63
Corporate Directory Inside Back Cover
1
contents
For
per
sona
l use
onl
y

This Page Left Blank Intentionally
For
per
sona
l use
onl
y

Dear Shareholder,
In November 2008 we published on the ASX and our website a comprehensive Development Plan for the Ocean grownBarramundi fish farming business operated by your company.
This showed that the company needed to harvest at least 2 million kilograms of whole fish a year in order to become selffunding and profitable.
Once we reach the harvest target of 2 million kilograms a year, the business will be self sustaining and could grow toharvest levels of 5 million kilograms a year, which – based on domestic sales alone, could generate free cash of over $20million a year.
The techniques developed by your Company could be rolled out on many other sites throughout the Kimberley region andNorthern Territory of Australia. The cost to shareholders of achieving these goals was estimated to be in the order of $20million over a three year period, predominately in the building up of farm biomass.
The biggest independent Stockbroking firm in Australia, Patersons, produced a report saying that if the company couldfund this growth it could unlock significant value, yet despite this and subsequent initial funding the share price hasremained around 6 cents a share.
Revenue has now increased to around $4 million a year. Sea cages hold over $7 million dollars worth of fish at the presenttime. The company has now been successfully growing fish for over four years without any significant incident of disease.
Huge strides have been achieved in every aspect of the company’s business and in addition an option has been securedwith the Tiwi Islanders over potentially wonderful grow out sites in the Tiwi Islands off Darwin providing a diversity of sitelocation possibly with a lower operating cost base and improved market logistics.
The company now represents about 80% of all finfish aquaculture interests in Western Australia and its product, OceanGrown Cone Bay Barramundi has become the Australian benchmark. If the development can continue to be funded, thiscompany will emerge as a major force in this industry over the next few years.
The company’s staff continue to be magnificent and my thanks go to them for all the hard and constructive work.
Finally my thanks also go to Professor Mehdi Doroudi who served us so well for many years as a director before beingappointed Executive Director of Aquaculture in the Department of Primary Industry and Resources, South Australia.
Yours faithfully
MARINE PRODUCE AUSTRALIA LTD
Miles KennedyNon Executive Chairman
29 October 2009
chairman’s address
3
For
per
sona
l use
onl
y

1. Capital Structure
Ordinary share capital
195,664,648 ordinary fully paid shares held by
924 shareholders
All issued ordinary shares carry one vote per
Share and carry the right to receive dividends
when declared.
Options
309,055 unlisted options held by 2 holders
Unlisted options expiring 30 June 2010 exercisable at $3.00.
15,000,000 unlisted options held by 2 holders
Unlisted options expiring 28 September 2012 exercisable at $0.20
2. Substantial Holder
Shareholder Number of securities Percentage
Lasborough Investments Ltd 61,534,000 31.45%
Denise Hutton 39,807,238 20.34%
shareholder information
4
3. Distribution of Shareholders as at 27 October 2009
distribution analysis ordinary fully paid shares
1 - 1,000 110
1,001 - 5,000 288
5,001 - 10,000 147
10,001 - 100,000 298
100,001 - and over 81
Total holders 924
As at 27 October 2009, there are 546 fully paid ordinary shareholders holding less than a marketable parcel.
For
per
sona
l use
onl
y

4. Twenty largest shareholders of each class of quoted securities as at 27 October 2009
holder name number held percentage
Lasborough Investments Ltd
Denise Hutton
Weybridge Pty Ltd
Maxima Pearling Co Pty Ltd
Faustus Nominees Pty Ltd
ANZ Nominees Ltd
K C S Super Pty Ltd
Jennifer Westbrook
JP Super Pty Ltd
I E Props Pty Ltd
Resource Development Co Pty Ltd
JCO Investments Pty Ltd
Pagodatree Investments Ltd
Sunbeam Opportunities Ltd
Guy Westbrook
Millstream Management Pty Ltd
Zell Pty Ltd
MAK Super WA Pty Ltd
Colbern Fiduciary Nominees Pty Ltd
Asian Action Management Ltd
61,534,000
39,807,238
13,931,574
13,333,333
13,140,571
6,173,135
3,021,540
2,083,333
2,000,000
1,669,265
1,426,749
1,343,474
1,324,940
1,200,000
1,000,000
1,000,000
1,000,000
1,000,000
940,000
845,250
31.45%
20.34%
7.12%
6.81%
6.72%
3.15%
1.54%
1.06%
1.02%
0.85%
0.73%
0.69%
0.68%
0.61%
0.51%
0.51%
0.51%
0.51%
0.48%
0.43%
167,774,402 85.72%
5
5. On-Market Buy-Back
The company does not have a current buy-back plan.
For
per
sona
l use
onl
y

This Page Left Blank Intentionally
For
per
sona
l use
onl
y

Annual Financial Report
Year Ended 30 June 2009 Marine Produce Australia Limited
(ASX: MPA)
ABN 70 091 805 480
For
per
sona
l use
onl
y

1 | P a g e
CONTENTS PAGE
DIRECTORS’ REPORT 2
LEAD AUDITOR’S INDEPENDENCE DECLARATION 17
INCOME STATEMENTS 18
BALANCE SHEETS 19
STATEMENTS OF CHANGES IN EQUITY 20
STATEMENTS OF CASH FLOWS 21
NOTES TO THE FINANCIAL STATEMENTS 22
DIRECTORS’ DECLARATION 52
AUDITOR’S INDEPENDENT AUDIT REPORT 53
For
per
sona
l use
onl
y

2 | P a g e
DIRECTORS’ REPORT
For the year ended 30 June 2009 The directors present their report together with the financial report of Marine Produce Australia Limited (the Company or MPA) and of the Group, being the Company and its subsidiaries, for the financial year ended 30 June 2009 and the auditor’s report thereon.
1 Directors
The directors of the Company at any time during or since the end of the financial year are:
Mr Miles Kennedy Non-Executive Chairman B. Juris Reappointed 11 June 2008
Mr Kennedy has held directorships of Australian listed companies for over 25 years. He is the non-executive Chairman of Sandfire Resources NL and Resource and Investment NL and director of Lonrho Mining Limited. He was previously the executive Chairman of Kimberley Diamond Company NL and non-executive Chairman of Blina Diamonds NL. He has extensive experience in the management of public companies with specific emphasis in the resources industry. He is a Barrister and Solicitor of the Supreme Court of Western Australia and the High Court of Australia. He is also an Attorney of the Supreme Court of South Africa.
Mr John Hutton Non-Executive Director Reappointed 14 August 2006
Mr Hutton has a background in accounting and finance. He has experience in merchant banking, accounting, financial planning and tax related matters. He is a Director of Maxima Pearling Company Pty Ltd and also holds non-executive directorship roles with Sandfire Resources NL and Resource and Investment NL. He is a member of the Australian Institute of Company Directors.
Dr Tor Theunissen Independent Non-Executive Director Appointed 17 December 2007
Dr Theunissen is the principal of a management consulting company that specialises in the strategic planning and resourcing of new projects. He is an experienced public company director and a former Chairman of Marine Produce Australia Limited.
Prof Mehdi Doroudi Independent Non-Executive Director Appointed 18 December 2007 Resigned 24 June 2009
Professor Doroudi holds a DVM degree in Veterinary Medicine and a PhD degree in Aquaculture and has worked in the fields of fisheries and aquaculture as a policy maker, an academic researcher and as an industry consultant in policy advice, science innovation and commercial operation for the last 20 years.
Mr Nicholas Miller Managing Director Reappointed 14 August 2006 Resigned 21 October 2008
Mr Miller is Managing Director of Maxima Pearling Company Pty Ltd, one of the largest producers of South Sea Pearls in Australia. He is highly regarded in the aquaculture and pearling industries, with his experience and knowledge extending into the management of marine assets, pearl oyster hatcheries and spat production methods. Mr Miller has held senior management positions with a number of aquaculture companies.
2 Company secretary
Ms Jean Mathie Company Secretary Appointed 14 August 2006
Ms Mathie has extensive experience as a senior legal secretary and holds the role of company secretary with other publically listed companies.
For
per
sona
l use
onl
y

3 | P a g e
3 Directors’ meetings
The number of directors’ meetings and number of meetings attended by each of the directors of the Company during the financial year are:
Board Meetings
Director Attended Held while a director
Mr M Kennedy 4 4
Mr J R Hutton 4 4
Dr T Theunissen 4 4
Prof M Doroudi 3 4
Mr N Miller 1 1
4 Remuneration report
Directors and executive officers’ remuneration – audited
4.1 Principles of compensation
Remuneration of directors and executives is referred to as compensation throughout this report. Compensation levels for key management personnel and the Company Secretary, and relevant key management personnel of the Group are competitively set to attract and retain appropriately qualified and experienced directors and executives. The Board obtains independent advice on the appropriateness of compensation packages of both the Company and the Group, given trends in comparative companies both locally and internationally and the objectives of the Company’s compensation strategy. The compensation structures are designed to attract suitably qualified candidates, reward the achievement of strategic objectives, and achieve the broader outcome of creation of value for shareholders. Compensation packages include a mix of fixed compensation, equity-based compensation, performance-based compensation as well as employer contributions to superannuation funds. Shares and options may only be issued to directors subject to approval by shareholders in general meeting. The Board has no established retirement or redundancy schemes.
Fixed compensation
Fixed compensation consists of base compensation as well as employer contributions to superannuation funds. Compensation levels are reviewed annually by the Board through a process that considers individual and overall performance of the Group. In addition external consultants provide analysis and advice to ensure the directors’ and senior executives’ compensation is competitive in the market place. A senior executives’ compensation is also reviewed on promotion.
Performance-linked compensation (Short-term incentive bonus)
Currently there are no performance linked short-term incentives (STIs) for key management personnel. Details of the nature and amount of each major element of remuneration of each director of the Company and each of the key management personnel (including most highly remunerated executives) are outlined in section 4.2. Key management personnel have authority and responsibility for planning, directing and controlling the activities of the company and the Group, including directors of the company and other executives. Key management personnel include the five most highly remunerated directors and executives for the company and the Group (S300A).
Non-executive directors
Total compensation for all non-executive directors is not to exceed $250,000 per annum and is set based on advice from external advisors with reference to fees paid to other non-executive directors of comparable companies. Non-executive directors do not receive performance related compensation.
For
per
sona
l use
onl
y

4 | P a g e
4.2 Director’s and executives remuneration (Company and Consolidated) – audited
Details of the nature and amount of each major element of remuneration of each director of the company and each of the named company executives and relevant group executives who receive the highest remuneration and other key management personnel are:
Short-term Post-
employment
Termination Benefits
$
Share-based
payments
Total
$
Proportion of remuneration performance
related
%
Value of options as
proportion of remuneration
%
Salary & fees
$
STI cash
bonus
$
Non- monetary benefits
$
Total
$
Superannuation benefits
$
Other long term
$
Options and rights
$
Directors
Non-executive directors
Mr M A Kennedy (Chairman) (appointed 11 June 2008)
2009 63,681 - - 63,681 5,731 - - - 69,412 - -
2008 28,125 - - 28,125 - - - - 28,125 - -
Mr J R Hutton (reappointed 14 August 2006)
2009 30,769 - - 30,769 2,769 - - - 33,538 - -
2008 12,147 - - 12,147 50,000 - - - 62,147 - -
Dr Tor Theunissen (appointed 17 December 2007)
2009 30,000 - - 30,000 - - - - 30,000 - -
2008 16,250 - - 16,250 - - - - 16,250 - -
Prof Mehdi Doroudi (appointed 18 Dec 2007, resigned 24 June 2009)
2009 30,000 - - 30,000 - - - - 30,000 - -
2008 16,250 - - 16,250 - - - - 16,250 - -
Mr J Drummond (appointed 14 August 2006 resigned 17 December 2007)
2009 1,378 - - 1,378 - - - - 1,378 - -
2008 44,960 - - 44,960 9,335 - - - 54,295 - -
Executive directors
Mr N Miller * (Managing Director)
(reappointed 14 August 2006, resigned 21 October 2008)
2009 - - - - - - - - - - -
2008 81,250 - - 81,250 7,313 - - - 88,563 - -
For
per
sona
l use
onl
y

5 | P a g e
4.2 Director’s and executives remuneration (Company and Consolidated) – audited
Short-term Post-
employment
Termination Benefits
$
Share-based
payments
Total
$
Proportion of remuneration performance
related
%
Value of options as
proportion of remuneration
%
Salary & fees
$
STI cash
bonus
$
Non- monetary benefits
$
Total
$
Superannuation benefits
$
Other long term
$
Options and rights
$
Executives
J Mathie COMPANY SECRETARY (appointed 14 August 2006)
2009 30,769 - - 30,769 2,769 - - - 33,538 - -
2008 16,778 - - 16,778 1,510 - - - 18,288 - -
G Westbrook GENERAL MANAGER - OPERATIONS
2009 153,846 - - 153,846 13,846 - - - 167,692 - -
2008 147,527 - - 147,527 13,277 - - - 160,804 - -
M Fitzgerald ** CHIEF FINANCIAL OFFICER
2009 256,304 - - 256,304 - - - - 256,304 - -
2008 - - - - - - - - - - -
Total KMP remuneration 2009 596,747 - - 596,747 25,115 - - - 621,862 - -
2008 363,287 - - 363,287 81,435 - - - 444,722 - -
* Fees were paid to Maxima Fish Farms Pty Ltd for services provided by N. Miller – see note 30 to the financial accounts.
** Fees were paid to Resource Development Company Pty Ltd for services provided by M Fitzgerald – see note 30 to the financial accounts.
For
per
sona
l use
onl
y

6 | P a g e
4.3 Equity instruments - audited
(i) Shares granted as compensation
In December 2007, 200,000 shares were issued to Dr Tor Theunissen for services rendered in preparation of various management reports and strategies. These shares were issued prior to his appointment as a director of the Company. No shares were issued to directors, executives or key management personnel during the reporting period or previous reporting period. During August 2009, 2,000,000 shares were issued to key management personnel and contractors of the Company in payment of services rendered.
(ii) Options and rights over equity instruments granted as compensation
No options were granted to directors, executives or key management personnel during the reporting period or previous reporting period. No options have been granted since the end of the financial year.
(ii) Modification of terms of equity-settled share-based payment transactions
No terms of equity-settled share-based payment transactions (including options and rights granted as compensation to a key management person) have been altered or modified by the issuing entity during the reporting period or the prior period.
(iii) Exercise of options granted as compensation
No options were exercised during the reporting period or the prior period. No options lapsed in the current or prior period.
5 Principal activities
The principal activities of the Group during the course of the financial year were the growth and sale of Barramundi by aquaculture means. This required further investment in aquaculture assets and continuing research of technologies and market developments to cultivate fish. The Group’s objectives are stated within the operating and financial review.
6 Operating and financial review
(i) Operating Review - 2009
Review of 2009
Achievements Disappointments
20% increase in annual harvesting and sales volumes at average 3kg per fish
Increasing demand and harvest levels combined with lack of funding for fish growth depleted farm biomass for the first three quarters of the period (resumed full feeding for last quarter)
Increase in farm biomass to 626,000t by the end of June 2009 – further growth +700,000t
Withdrawal from some sales markets due to lack of fish supply and size
Detailed 10 year Development Plan for the business Delays in securing Development plan funding with market uncertainty
Orders placed for conversion of 12 cages (60m) with 720t capacity to 9 cages (80m) with 1,080t capacity to house increasing fish biomass
High operational costs in first three quarters due to lack of growth
Mobilisation of two additional blow feeders, high pressure net cleaner and electronic fish counters. Order for in water fish sizing system to allow automated weight sampling of fish without handling
Severe weather events in Northern Australia in late 2008 (in WA, NT and QLD) caused road closures, which limited the ability to maintain regular supplies of fish feed and also caused loss of fish from some cages
Maintenance of strong price premium and orders continue to exceed available supply
Shortage of size fish at end of year limiting sales volumes – next size group expected to start around the end of the September 2009 quarter
Expanded 1,000t operating licence imminent
For
per
sona
l use
onl
y
7 | P a g e
MPA has further increased harvest output from the Cone Bay marine farm while continuing to receive praise and premium prices for the high quality, freshness and consistence of its ocean grown Barramundi. Demand for product has exceeded our capacity to supply. Sufficient fish stocks are available to increase production with further funding. Targeted expenditure on capital equipment will also allow larger cage holding capacities, grading equipment for increased fish harvest size and consistency, and further harvest system upgrades to further improve product quality. FARMING OPERATIONS Nursery Growth and survival have been in line with expectations, with high quality fish transferred to the marine nursery cages. The marine nursery cage system has allowed transfer of fish from the shore based nursery at a much smaller size, and thereafter to sea cages at a larger size. It also facilitates easier grading of small fish and more uniform size at stocking, all of which contributes to increased production capacity and lowering of production costs. MPA plans to commission its own hatchery facility in Broome, Western Australia, which when operational will allow the hatchery and nursery functions to be completed at that site prior to the transfer of fingerlings to the farming operations at reduced cost. Marine Farm Performance of fish stock was strong during the early part of the reporting period, but difficulties in securing feed in a timely manner saw a decline in growth rates through to the end of the third quarter. Harvest volume for the half year was 440,000 kg (2008: 363,000 kg). Average harvest weight remained in the 3 kg range for the period. Due to reduced feeding, a net decrease in total farm biomass was recorded from 645,000 kg at the start of the period to 480,000 kg as at December 2008. Biomass has since been restored to 626,000 kg by June 2009. Fish health has continued to be outstanding, with no significant disease or parasite issues occurring on the marine farm facility. Any minor disease issues with juvenile stock are usually associated with cannibalistic and aggressive behavior during this stage. Marine farm staff strive to continually improve fish performance, and have continued to develop improved fish handling strategies for harvesting and grading activities. The change from steel to heavy duty plastic nets has been a continued success. Although more expensive, plastic nets have approximately five times the service life of steel nets and do not suffer the problems caused by heavy weight and corrosion. They are significantly easier to handle and clean, and are less likely to remove scales from fish during handling. The main requirement for the upcoming period is to secure finance to allow our Development Plan to meet farm production potential. The large number of small fish on site can then be on grown to full market size, allowing the farm to significantly increase production over the next 18 months to 2 years. It is also our aim to purchase a centralised feeding system, subject to funding, to allow more controlled feeding and a reduction in logistics and maintenance costs. These systems are a proven solution to reducing costs in major aquaculture centres. Environmental Monitoring and Management MPA’s revised Environmental Monitoring and Management (EMMP) program has operated throughout the period as required under the marine farm licence. Results continue to show that farming activities have no measurable impact on the environment in Cone Bay, and that the ecosystem remains in a healthy state. Marketing and Sales Barramundi sales – 2008/2009
Quarter September 2008 December 2008 March 2009 June 2009 Total YTD
Sales (‘000kg) 93 127 140 62 422
Sales ($million) 1.0 1.3 1.4 0.6 4.3
Sales slowed during the colder winter months in line with the seasonal nature of fish sales and reduced availability of larger fish (greater than 2.5kg) following previous feed rationing and a strong summer sales season.
For
per
sona
l use
onl
y

8 | P a g e
MPA’s farmed fish maintains its position as the premium Barramundi on the Australian market, with customer feedback indicating regular supply and consistent high quality as major reason for purchasing our product. For this reason, higher prices of up to $3 per kilogram have been maintained over our competitors’ products. We thank Westmore Seafoods for the important role they have played in attaining and maintaining this position. During the reporting period any remaining factors influencing product quality have been identified and plans put in place to even further improve the harvesting and packing process. We are confident that customers will see these additional improvements, further cementing our reputation as a supplier of high quality product.
(ii) OUTLOOK FOR 2010
FARM BIOMASS GROWTH As previously reported MPA is continuing to restore and grow farm biomass with the elimination of the forced feed rationing program in the first half of the 2009 financial year. Further fish growth has been recorded for the period April to July 2009 for a closing farm biomass approaching 700,000kg, represented by approximately 1 million fish, with sufficient fish now on the farm to cover the first two years of the proposed Development Plan and move toward 2,000,000 kg of biomass. 1 MILLION KG PRODUCTION LICENCE MPA has received notice from the Office of the Appeals Convenor within the WA Department of Environment that all appeals against the proposed 1 million kg production licence have been satisfactorily dealt with and the new licence conditions have been set. There does not appear to be any other matter to hold up progress and the company therefore believes that the issue of the new licence to Maxima Pearling Company Pty Ltd (accessed by MPA through an Access Agreement with Maxima) is imminent. COMMERCIAL TRIALS Feed trials Background Feed formulations for Barramundi have historically been based on growth trials using fish of less than 1 kilogram. This compares to MPA’s target harvest size of fish of 3.5 kg. The same feed formulations are fed to Barramundi at all sizes up to 3.5 kg, a situation that is likely to result in sub-optimum growth and feed conversion ratios (FCR or feed:growth), leading to the opportunity to change feed formulations above the 1 kg level. Trials recently conducted by researcher scientists within Fisheries WA, showed that Barramundi over 1 kg are able to grow considerably more quickly when fed diets with increased lipid (oil) content. During this project, fish fed the diet with the highest lipid content grew from a weight of 1.1 to 2.1 kg in just 8 weeks. When these growth rates are adjusted for the ocean-based conditions at Cone Bay, Barramundi weight would exceed 5.4 kg after 2 years, compared to a current achievement of around 3.4 kg for the same period (60% faster growth). Also, feed conversion ratios during the trial were less than 1.4:1 compared to 1.8:1 on our farm using existing diets. Potential impact The major improvement to production costs comes with higher average weight, which can be recognised by harvesting fish after a shorter growing period, by selling the extra weight, or by a combination of both. Reducing FCR from 1.8:1 to 1.4:1 means that for every kilogram of fish grown, over 20% less feed is required and the cost of fish production is reduced by up to $2 per kg, a material impact for a farm targeting 5 million kg of biomass and annual harvest. Commercial trial budget In an effort to realise these gains, a commercial trial comparing growth of fish fed on the existing diet with fish fed on a diet containing higher levels of lipid (oil) is planned under commercial production conditions at Cone Bay. The trial will be conducted over an estimated 12 month period following the order of trial cages and feed manufacture and will directly overlap with MPA’s biomass growth plans under its announced Development Plan. Estimated cost of the commercial trial (subject to funding):
Fish food $2.0 million
Bank of cages, nets, automatic feeder (8 cages) $1.8 million
Total estimated cost of trial $3.8 million
For
per
sona
l use
onl
y

9 | P a g e
The trial will be run to compare results from the existing feed formulation (4 cages) to the new formulation (4 cages) as well as variations to optimise stocking densities across each set of cages. Conclusion The Development Plan has been formulated on the assumed growth rates and FCR of the existing feed for all fish up to the 3.5kg target harvest level. The results expected from this commercial trial will dramatically improve the economics of MPA’s operations. New net and net weighting system trials MPA is finalising arrangements to undertake a trial of four marine brass nets (each 80m circumference with a 120,000kg biomass capacity) to investigate life spans under high flow conditions and resistance to marine biofouling in tropical marine waters. Use of brass nets generally results in the effective elimination of the need for continuous net cleaning as well as enhanced security against predators, at a higher capital cost. A second trial is also planned with the existing and additional Kikko plastic nets, involving the addition of rigid base framing and weight rings. This trial is expected to deliver the following benefits: - Improved net shape and volume under all conditions
- More cost effective net cleaning by providing tighter net surface
- Improved predator protection
BROOME HATCHERY DEVELOPMENT PLANS Hatchery land lease application MPA has applied for a lease with the Western Australian Department of Fisheries, for two adjoining blocks of a combined size of 10,000m2 (1Ha) within the Broome Tropical Aquaculture Park (“BTAP”), northern Western Australia, close to the Barramundi farming operations at Cone Bay off Derby. MPA plans to develop a tropical marine finfish hatchery as a key element of the broader Cone Bay Development Plan. One of the major impediments to the expansion plans for its marine farm in the Kimberley Region has been the lack of reliable local supply of juvenile Barramundi. The BTAP provides the following infrastructure to each site as part of the nominal head lease fees: - Filtered sea water
- Saline bore water
- Fresh water
- Waste water discharge
- Access to industrial power
- Planning approval
The expected benefits to MPA in developing its own hatchery facility are: - Development of a commercial tropical marine finfish hatchery as an essential element to support substantial
growth for MPA and in the sea cage finfish aquaculture sector
- Focus hatchery production to ensure meeting the needs of the marine farm through the careful timing of
production and culling of poor performing stock
- Support the development of community-based commercial aquaculture projects
- Reduce disease risk by reducing reliance on barramundi fingerlings sourced from other states
- Reduced cost for sourced Barramundi fingerlings into the farming operations
- Allow the commencement of research trials into a Selective Breeding Program (SBP) for Barramundi, to further
improve growth rates, feed conversion and product quality
- Potential joint input from Kimberley TAFE to strengthen juvenile production and provide industry focused
aquaculture training and employment, including for local indigenous people
- Potential for further hatchery development and commercial production of other finfish species
- Potential commercial sales and restocking for recreational fishing
For
per
sona
l use
onl
y

10 | P a g e
Capital and operating expenditure is estimated to be $3 million over the initial three year period, included with the Development Plan funding requirements, which will be utilised for: - Building construction costs
- Live food production
- Incubation and larval rearing
- Broodstock holding facilities
- Nursery facilities (including water recirculation and treatment plant) to be relocated from the Cone Bay farm
- Backup power supply and alarm facilities
- Employment and operating costs
MPA expects that the new hatchery facility will be cost neutral against the current method of sourcing and transporting Barramundi fingerlings from Darwin in the Northern Territory, while delivering the expected operational benefits listed above. TIWI ISLANDS DUE DILIGENCE SUCCESSFULLY COMPLETED The Tiwi Islands Project exclusive due diligence period has concluded, with a final letter on MPA’s intention to proceed issued to the Tiwi Land Council (TLC). MPA has indicated to the TLC that it has completed its preliminary due diligence work on the project and sees no significant impediments to the development of a marine farm at Snake Bay, Melville Island, subject to final farm design, approvals and funding arrangements. MPA has secured its intention and extended the exclusivity period to the end of May 2010. As reported previously, this opportunity has the potential to make a significant contribution to MPA’s longer-term growth objectives, including adding further annual biomass harvest capacity to MPA’s operations. MPA is continuing discussions with the TLC with the view of concluding appropriate commercial and funding arrangements for the development of a Barramundi farming operation at Snake Bay, Melville Island.
(iii) EXPANSION PLANS
INCREASE HARVEST CAPACITY The Group has significant expansion plans which involve additional operating expenditure for the grow-out and restocking of fish stocks to enable the Group to expand its harvest capacity to a targeted level of 2,000,000kg per annum by June 2012. Further capital expenditure will be required for investment in: - Increase in cage capacity and moorings
- Expand grading capacity for marine farm and nursery
- Upgrade harvest line to increase throughput and improve animal welfare
- Install centralised feeding systems and remote monitoring technology
- Purchase high capacity net cleaning equipment
- Expand the licence application program for additional farming sites
This increase in scale will require additional funding to provide operational efficiencies necessary for the commercialisation of the fish farming business to increase the long term cash operating margins of the business.
LICENCING APPROVALS
To achieve continued growth towards commercial quantities of sales the Group will require licensing approvals to grow and harvest adequate quantities of fish. The relevant government agencies are presently considering applications to increase the existing licence and add further licences.
(iv) REVIEW OF FINANCIAL RESULTS
RESULTS FROM OPERATING ACTIVITIES AND LOSS FOR THE PERIOD
The Group’s result from operating activities for the reporting period was a loss of $5,634,000 (2008: $1,967,000). The loss for the period was $8,143,000 (2008: $3,545,000) including impairment of property, plant and equipment and intangible assets of $3,123,000 (2008: $Nil) and depreciation and amortisation of $459,000 (2008: $415,000).
For
per
sona
l use
onl
y

11 | P a g e
The results from operating activities included:
In thousands of AUD 12 months
ended 6 months
ended 6 months
ended
Consolidated Jun 2009 Jun 2009 Dec 2008
Losses from farming operations (3,976) (640) (3,336)
Administration and marketing expenses (1,658) (791) (867)
Results from operating activities (5,634) (1,431) (4,203)
In thousands of AUD and kg 12 months
ended 6 months
ended 6 months
ended
Consolidated Jun 2009 Jun 2009 Dec 2008
Farm cash operating costs (AUD) 7,613 3,828 3,785
Fish biomass growth before harvest (kg) 421 349 72
Farm cash operating cost per kg 18.08 10.97 52.57
The second half of the reporting period delivered improved financial and operational results with the halting of feed rationing. This had an immediate positive impact on farm cash operating cost per kg as this reduced below $11 per kg from the unsustainable levels seen in the first half of the reporting period, where practically no fish growth was recorded. Following on from this pleasing second half result, current farm cash operating cost per kg has reduced further to below $8 per kg against a +$10 per kg gross sales price which sets the business up well for improved financial results in the 2010 financial year. On 28 August 2009 the Group released its Appendix 4E Preliminary Final Report under ASX Listing Rule 4.3A for the 12 months ended 30 June 2009 and further updated the market on its results and position in a supplementary prospectus dated 8 September 2009. The following table reconciles the results as released in the Preliminary Final Report to the results contained within this Annual Financial Report:
In thousands of AUD 12 months
ended
Consolidated Jun 2009
Loss for the period as per Appendix 4E Preliminary Final Report (4,875)
Impairment of property, plant and equipment (2,666)
Impairment of intangible assets (457)
Additional loss from change in fair value of biological assets (103)
Additional depreciation and amortisation of assets (42)
Loss for the period as per Annual Financial Report (8,143)
LOSS PER SHARE Basic loss per share for the reporting period was $0.091 per share (2008: $0.068). Basic loss per share from continuing operations for the reporting period was $0.091 per share (2008: $0.049). REVENUE Revenue from sales Revenue from the sale of fish was $4,322,000 for the period (2008: $3,245,000), an increase in year-on-year sales of 33%.
For
per
sona
l use
onl
y

12 | P a g e
Harvest levels have continued to increase with 440,000 kg of fish harvest for the period (2008: 363,000 kg) and 422,000 kg sold (2008: 323,000 kg). Biological assets A reduction in fish biomass compared to the corresponding prior period increase resulted from the decrease in biological assets resulting from the ration feeding of fish held in sea cages (affecting growth) in the first half of the reporting period and first quarter of 2009 and the impact of continuing increased harvest levels resulting from the demand for the Company’s product. OPERATING COSTS Overall operating costs and net cash used in operating activities Unit operating costs have been above expectation with a reduction in fish growth (feeding) reducing the cost efficiency of the farm. Net cash used in operating activities of $3,327,000 (2008: $3,875,000) represents the difference between proceeds from the sale of harvested fish against the cash outlay for the acquisition and grow-out of fish biomass and other operating expenses. The investment in farm biomass was limited during the period by the reduced availability of development capital for the business. The Company’s Development Plan requires significantly larger net outflow to increase the biomass of the farming operations to provide cost efficiencies and increased cash operating margins. The resulting closing biomass is held as a biological asset in the balance sheet and provides the base for future fish growth and profitability. Raw materials and consumables Sourcing and transport of fish feed is a significant operating cost for the farming operation. The group expects to achieve more favourable unit pricing for feed, transport and other major variable cost elements with expanding scale of operations and automated feeding systems. Personnel expenses Increasing labour costs, particularly in the remote Western Australian labour market, have affected the operation with labour more difficult and more expensive to source. The group’s expansion plans are designed to increase automation and reduce the group’s need for significant additional labour. Savings to personnel expenses have been made when the opportunity has arisen, driven predominantly by targeted capital expenditure on automation. Administration and marketing expenses Administration and marketing costs have reduced as a percentage of overall cash outflows as the farming operations have increased in scale over the past two years. Further expansion is expected to further reduce overhead costs combined with increased emphasis on product promotion and logistics. OTHER TRANSACTIONS Issue of shares, payables and loans An amount of $788,000 payable by the Company to Denise Hutton and Maxima Pearling Pty Ltd, both related parties of the Company, was settled through the issue of 13,140,571 ordinary shares in the Company under the entitlements issue completed during the reporting period at $0.06 per share. Of this amount, $650,000 related to a trade creditor balance and a further $138,000 related to repayment of interest bearing loans. An amount of $275,000 was loaned to the Company by Guy Westbrook, General Manager, during the period. Of this amount, $125,000 was settled through the issue of 2,083,333 ordinary shares in the Company under the entitlements issue completed during the period at $0.06 per share. The remaining $150,000 was repaid in cash during the reporting period. Refer to Note 22 for further information. Issue of options relating to share placement During July 2008, the Company issued 10,000,000 options to acquire ordinary shares following approval at a General Meeting of shareholders on 18 July 2008. These options were issued to Lasborough Investments Limited for no cash consideration in combination with a placement of shares to them during the previous corresponding period. The fair value of these options has been determined using the Black Scholes valuation model as $526,000, which has been transferred from share capital to reserves during the reporting period.
For
per
sona
l use
onl
y

13 | P a g e
Issue of shares to Patersons Securities Ltd During July 2008, the Company issued 1,100,000 shares to Patersons Securities Ltd in payment of fees for corporate services carried out on behalf of the Company.
(v) REVIEW OF FINANCIAL CONDITION
Material uncertainty regarding continuation as a going concern The Group’s result from operating activities for the reporting period was a loss of $5,634,000 (2008: $1,967,000). The loss from continuing operations was $8,143,000 (2008: $2,537,000). At 30 June 2009, the Group had a working capital surplus of $1,946,000, represented significantly by biological assets of $4,724,000. Current liabilities at balance date included $2,712,000 due to Denise Hutton and Mathry Pty Ltd (an entity related to Denise Hutton), relation to Director John Hutton, which is secured by the assets of the Group and is repayable on demand. Subsequent to year end Denise Hutton has provided a commitment to the Group that she nor Mathry will demand repayment if such repayment will adversely affect the ability of the Company to meet its liabilities as and when they fall due. Further working capital and funding for capital expenditure is required to enable the Cone Bay farm to initially operate at breakeven and then to grow to a scale required to achieve: - Self funding operations - Fish grow-out of current holdings to targeted harvest size
- Large scale consistent supply of Barramundi products to domestic and export markets
- Economies of scale and cost efficiencies
- Improved, sustainable returns to shareholders, and
- Indigenous employment initiatives
The Development Plan dictates that the business needs to harvest and sell significantly less than the projected total fish biomass growth during the 2010 financial year to continue to expand the biomass of the farm to a sustainable level above 1,200 tonnes of biomass and following that to an initial target level of 2,000 tonnes. This planned biomass expansion, predominantly of the fish currently on hand, is subject to further licensing approvals and will require significant additional investment capital. To achieve the planned expansion the Group will require additional working capital to meet ongoing operations. The Company plans to raise up to $12,000,000 to fund its planned expansion strategy and reduce its debt levels over the 15 months beginning July 2009. In this regard, on 18 August 2009 the company announced and issued a prospectus for a pro rata non-renounceable entitlement issue of 111,386,427 new shares at $0.06 each on the basis of one new share for each 1 share held to raise up to $6,683,000 before costs. The entitlements issue was partly underwritten by Denise Hutton and Lasborough Investments Limited on the terms set out in separate underwriting agreements, with each effectively agreeing to apply and pay for a total of 40,000,000 new shares each for a combined commitment of $4,800,000. Loan funds were received subsequent to year end and as at the date of this report have been repaid through the issue of shares at $0.06 per share as follows:
Lender
Balance at 30 June 2009
$
Loaned in subsequent to
period end $
Issue of shares under entitlements issue
$
Balance following issue of shares
$
Denise Hutton
2,112,000
-
(1,600,000)
512,000
Mathry Pty Ltd 600,000 - - 600,000
Sub total 2,712,000 - (1,600,000) 1,112,000 Lasborough - 2,400,000 (2,400,000) -
Total 2,712,000 2,400,000 (4,000,000) 1,112,000
A further amount of $257,000 was received under the entitlements issue in addition to the commitments received from the underwriters, for a total raising of $5,057,000 before costs of the issue. Further equity or debt funding of up to $7,000,000 is likely to be required within the next 12 months to continue the planned high rate of farm development and fish growth. Of the $4,800,000 commitment received, an amount of $800,000 has been paid to Maxima Pearling Company Pty Ltd under their access agreement with the Group via the issue of shares to Maxima as sub-underwriter to Denise Hutton.
For
per
sona
l use
onl
y

14 | P a g e
The Group has the ability to slow its expansion strategy and harvest additional fish at less than the current targeted 3kg harvest size to maintain sufficient cash reserves, with a resulting potentially significant reduction of the scale of the operations until further funding becomes available. The financial statements have been prepared on a going concern basis which the directors believe to be appropriate. The directors are confident that the Group will be able to source sufficient funding to continue as a going concern and continue to pay its debts as and when they fall due based on the support received from major shareholder groups and the positive outlook for business development and resulting shareholder returns. Should further fund raising be unsuccessful and the company not be able to otherwise secure funding from other capital raisings or other alternative funding arrangements, there is material uncertainty which may cast significant doubt as to whether the company and Group will be able to continue as a going concern and continue to pay its debts as and when they fall due. If the Group is unable to continue as a going concern, it will be required to realise its assets and extinguish its liabilities other than in the ordinary course of business and at amounts that may be different to those stated in the financial report. This includes, but is not limited to, the Group’s major assets, being its biological assets, which represent 75% of the Group’s current assets and 63% of the Group’s total assets.
(vi) SIGNIFICANT CHANGES IN THE STATE OF AFFAIRS
Significant changes in the state of affairs of the Group during the reporting period: EQUITY FUNDING
Share issues Shares Cash
$
Offset of debt by issue of
shares $
Services
$
Total
$
Placements
8,800,000
708,000
-
-
708,000
Entitlement Issue 40,230,723 1,500,000 913,000 - 2,413,000 Paterson Securities Ltd
1,100,000 - - 66,000 66,000
Total 50,130,723 2,208,000 913,000 66,000 3,187,000
DEBT FUNDING Related party debt funding during the reporting period:
Facility Opening 1 July 2008
Assignment Drawn Repaid in cash
Repaid in shares
Closing 30 June 2009
Faustus Nominees (i)
1,000,000
(1,000,000)
-
-
-
-
Denise Hutton (ii) - 1,000,000 1,250,000 - (138,000) 2,112,000 Mathry (ii) - - 600,000 - - 600,000 Guy Westbrook
- - 275,000 (150,000) (125,000) -
Total 1,000,000 - 2,125,000 (150,000) (263,000) 2,712,000
(i) In February 2008, $1,000,000 was drawn under a 12 month loan agreement with Faustus Nominees Pty Ltd, an
entity related to Mr Hutton, a director of the company. The loan was assigned to Denise Hutton during the
reporting period and is secured by a charge over the assets of the Group.
(ii) Denise Hutton is related to Mr Hutton, a director of the company, and is associated with Mathry Pty Ltd.
For
per
sona
l use
onl
y

15 | P a g e
CORPORATE During October 2008, Mr Nick Miller resigned as an executive director of the Company. During June 2009, Professor Mehdi Doroudi resigned as a non-executive director of the Company. SUBSEQUENT EVENTS Non-renounceable entitlement issue On 18 August 2009 the company announced and issued a prospectus for a pro rata non-renounceable entitlement issue of 111,386,427 new shares at $0.06 each on the basis of one new share for each 1 share held to raise up to $6,683,000 before costs to reduce debt levels and continue towards commercialisation of the Group’s farming operations. A total of $5,057,000 was raised under the entitlements issue representing 84,278,221 new shares issued – refer Note (V) above for further details. Loan funding During July 2009, an amount of $150,000 was loaned to the Company by Guy Westbrook, General Manager, and repaid during August 2009. During July and August 2009, a total of $2,400,000 was loaned to the Company by Lasborough coinciding with its funding level in its entitlement issue underwriting agreement, repaid in full via the issue of shares – refer Note (V) above for further details. Issue of shares During August 2009, 2,000,000 shares at $0.06 per share were issued to management and contractors of the Company in payment of services rendered to the value of $120,000 representing the fair value of services provided and the market price of shares at that time. Other than the matters discussed above, there has not arisen in the interval between the end of the financial year and the date of this report any item, transaction or event of a material and unusual nature likely, in the opinion of the directors of the Company, to affect significantly the operations of the Group, the results of those operations, or the state of affairs of the consolidated entity, in future financial years, other than the concern expressed earlier regarding liquidity and funding. Subsidiaries, associates and joint ventures
As at 1 July 2008, the Group acquired and gained control of Maxima Fish Farms Pty Ltd. This entity did not contribute materially to the results for the period. No member of the Group held an interest in, or participated in the results of an associate or joint venture.
7 Dividends
No dividends were paid or declared during the current or prior financial years.
8 Directors’ interests
The relevant interest of each director in the shares, debentures, interests in registered schemes and rights or options over such instruments issued by the companies within the consolidated entity and other related bodies corporate, as notified by the directors to the Australian Stock Exchange in accordance with S205G(1) of the Corporations Act 2001, at the date of this report is as follows: Marine Produce Australia Limited Ordinary shares Options over ordinary shares
Mr J Hutton 27,817,378 -
Mr M Kennedy 2,509,753 -
Dr T Theunissen 614,917 -
For
per
sona
l use
onl
y

16 | P a g e
9 Indemnification and insurance of officers and auditors
Indemnification
The Company has agreed to indemnify the following current directors of the Company; Mr M Kennedy, Mr J Hutton and Dr T Theunissen and the following former directors, Mr N Miller, Mr J Drummond, Mr A Zimpel, Mr K Simich, Mr M Firmin, Mr P Fraser and Prof M Doroudi against all liabilities to another person (other than the Company or related body corporate) that may arise from their position as directors of the Company and its controlled entities, except where the liability arises out of conduct involving a lack of good faith. The agreement stipulates that the Company will meet the full amount of any such liabilities, including costs and expenses. The Company has also agreed to indemnify the current directors of its controlled entities for all liabilities to another person (other than the Company or related body corporate) that may arise from their position, except where the liability arises out of conduct involving a lack of good faith. The agreement stipulates that the Company will meet the full amount of any such liabilities, including costs and expenses.
Insurance premiums
Since the end of the previous financial year the Company has paid insurance premiums in respect of directors’ and officers’ liability and legal expenses’ insurance contracts, for current and former directors and officers, including senior executives of the Company and directors, senior executives of and secretaries of its controlled entities. The insurance premiums relate to:
- Costs and expenses incurred by the relevant officers in defending proceedings, whether civil or criminal and whatever their outcome; and
- Other liabilities that may arise from their position, with the exception of conduct involving a wilful breach of duty or improper use of information or position to gain personal advantage.
The value of the premium paid is not disclosed subject to an existing confidentiality agreement between the insurer and the directors of the company.
10 Lead auditor’s independence declaration
The lead auditor’s independence declaration is set out on page 17 and forms part of the directors’ report for the financial year ended 30 June 2009.
11 Rounding off
The Company is of a kind referred to in ASIC Class Order 98/100 dated 10 July 1998 and in accordance with that Class Order, amounts in the financial report and directors’ report have been rounded off to the nearest thousand dollars, unless otherwise stated. Signed in accordance with a resolution of the directors:
Miles Kennedy Non-executive Chairman Dated at Perth this 30th day of September 2009.
For
per
sona
l use
onl
y

For
per
sona
l use
onl
y

18 | P a g e
INCOME STATEMENTS
FOR THE YEAR ENDED 30 JUNE 2009
Consolidated Company
In thousands of AUD Note 2009 2008 2009 2008
Continuing operations
Revenue from sales 4,322 3,245 - -
Cost of sales (4,322) (3,245) - -
Profit on sales - - - -
Growth in fish biomass:
Net gain from acquisitions and growth 3,510 6,263 - -
Raw materials and consumables (5,581) (5,126) - -
Farm personnel expenses 8 (2,037) (1,805) - -
Fair value loss on biological assets (4,108) (668) - -
Administrative and marketing expenses (1,658) (1,321) (425) (459)
Other income 132 22 15 22
Other expenses 9 - - (8,717) (3,545)
Results from operating activities (5,634) (1,967) (9,127) (3,982)
Finance income 7 33 7 32
Finance expenses 6 (226) (593) (209) -
Net finance income (expense) (219) (560) (202) 32
Impairment of property, plant and equipment 7 (2,666) - (87) -
Impairment of intangible assets 7 (457) - - -
Depreciation and amortisation (459) (415) (19) -
Loss before income tax (9,435) (2,942) (9,435) (3,950)
Income tax benefit 11 1,292 405 1,292 405
Loss from continuing operations (8,143) (2,537) (8,143) (3,545)
Discontinued operation 5
Impairment of property plant and equipment and intangibles
- (1,008) - -
Loss for the period (8,143) (3,545) (8,143) (3,545)
Loss per share 12
Basic and diluted loss per share (cents) (9.1) (6.8)
Continuing operations
Basic and diluted loss per share (cents) (9.1) (4.9)
The notes to the financial statements are an integral part of these consolidated financial statements.
For
per
sona
l use
onl
y

19 | P a g e
BALANCE SHEETS
AS AT 30 JUNE 2009
Consolidated Company
In thousands of AUD Note 2009 2008 2009 2008
Assets
Cash and cash equivalents 13 89 310 70 213
Trade and other receivables 14 575 896 30 -
Current tax assets 11 661 405 661 405
Inventories 15 267 227 - -
Biological assets 16 4,724 5,448 - -
Other assets 18 37 18 18
Total current assets 6,334 7,323 779 636
Receivables 14 - - 5,204 8,819
Investments 17 - - - -
Property, plant and equipment 7/19 1,150 3,915 - 86
Intangible assets 7/20 - 482 - -
Total non-current assets 1,150 4,397 5,204 8,905
Total assets 7,484 11,720 5,983 9,541
Liabilities
Trade and other payables 21 1,593 2,525 172 398
Loans and borrowings 22 2,712 1,000 2,712 1,000
Employee benefits 23 83 55 3 3
Total current liabilities 4,388 3,580 2,887 1,401
Net assets 3,096 8,140 3,096 8,140
Equity
Share capital 24 28,828 26,255 28,828 26,255
Reserves 25(ii) 1,014 488 1,014 488
Accumulated losses (26,746) (18,603) (26,746) (18,603)
Total equity 3,096 8,140 3,096 8,140
The notes to the financial statements are an integral part of these consolidated financial statements. F
or p
erso
nal u
se o
nly

20 | P a g e
STATEMENTS OF CHANGES IN EQUITY
FOR THE YEAR ENDED 30 JUNE 2009
In thousands of AUD Note Share capital
Share based payments
reserve Accumulated
losses Total equity Consolidated
Balance at 1 July 2007 25,126 - (15,058) 10,068
Total income and expense recognised directly in equity - - - -
Loss for the period - - (3,545) (3,545)
Total recognised income and expense - - (3,545) (3,545)
Share based payments 6(i) - 488 - 488
Shares issues 1,159 - - 1,159
Share issue costs (30) - - (30)
Balance at 30 June 2008 26,255 488 (18,603) 8,140
Balance at 1 July 2008 26,255 488 (18,603) 8,140
Total income and expense recognised directly in equity - - - -
Loss for the period - - (8,143) (8,143)
Total recognised income and expense - - (8,143) (8,143)
Issue of options 25(ii) (526) 526 - -
Share issues 24 3,187 - - 3,187
Share issue costs (88) - - (88)
Balance at 30 June 2009 28,828 1,014 (26,746) 3,096
Company
Balance at 1 July 2007 25,126 - (15,058) 10,068
Total income and expense recognised directly in equity - - - -
Loss for the period - - (3,545) (3,545)
Total recognised income and expense - - (3,545) (3,545)
Share based payments 6 - 488 - 488
Shares issues 1,159 - - 1,159
Share issue costs (30) - - (30)
Balance at 30 June 2008 26,255 488 (18,603) 8,140
Balance at 1 July 2008 26,255 488 (18,603) 8,140
Total income and expense recognised directly in equity - - - -
Loss for the period - - (8,143) (8,143)
Total recognised income and expense - - (8,143) (8,143)
Issue of options 25(ii) (526) 526 - -
Share issues 24 3,187 - - 3,187
Share issue costs (88) - - (88)
Balance at 30 June 2009 28,828 1,014 (26,746) 3,096
The notes to the financial statements are an integral part of these consolidated financial statements.
For
per
sona
l use
onl
y

21 | P a g e
STATEMENTS OF CASH FLOWS
FOR THE YEAR ENDED 30 JUNE 2009
Consolidated Company
In thousands of AUD Note 2009 2008 2009 2008
Cash flows from operating activities
Cash receipts 4,491 2,852 648 738
Cash paid to suppliers and employees (8,978) (7,120) (652) (459)
Cash from (used in) operations (4,487) (4,268) (4) 279
Interest received 7 34 7 32
Income tax receipts 1,029 341 1,029 341
Other income received 124 18 19 18
Net cash from (used in) operating activities 29 (3,327) (3,875) 1,051 670
Cash flows from investing activities
Proceeds from sale of property, plant and equipment 5 - 3,262 - -
Acquisitions of intangible assets (15) (52) - -
Acquisitions of property, plant and equipment (801) (1,907) (13) -
Net cash from (used in) investing activities (816) 1,303 (13) -
Cash flows from financing activities
Proceeds from issue of share capital 24 2,208 1,126 2,208 1,126
Payment of transaction costs (88) (30) (88) (30)
Proceeds from borrowings 6(i) - 3,000 - 3,000
Repayment of borrowings 6(i) - (3,000) - (3,000)
Proceeds from borrowings – related party 22 2,125 1,000 2,125 1,000
Repayment of borrowings – related party 22 (150) - (150) -
Interest paid on borrowings – related party (173) (106) (173) (106)
Loans to subsidiaries 14 - - (5,103) (3,311)
Net cash from (used in) financing activities 3,922 1,990 (1,181) (1,321)
Net increase (decrease) in cash and cash equivalents
(221) (582) (143) (651)
Cash and cash equivalents at 1 July 310 892 213 864
Cash and cash equivalents at 30 June 13 89 310 70 213
The notes to the financial statements are an integral part of these consolidated financial statements.
For
per
sona
l use
onl
y

22 | P a g e
NOTES TO THE FINANCIAL STATEMENTS
1. Reporting entity
Marine Produce Australia Limited (the Company) is a company domiciled in Australia. The address of the Company’s registered office is 12 Walker Avenue, West Perth WA 6005. The consolidated financial statements of the Company as at and for the year ended 30 June 2009 comprise the Company and its subsidiaries (together referred to as the ‘Group’ and individually as ‘Group entities’). The Group is involved in the aquaculture industry, specifically the farming of Barramundi fish in sea cages in North West Western Australia.
2. Basis of preparation
(a) Statement of compliance
The financial report is a general purpose financial report which has been prepared in accordance with Australian Accounting Standards (AASBs) (including Australian Interpretations) adopted by the Australian Accounting Standards Board (AASB) and the Corporations Act 2001. The consolidated financial report of the Group and the financial report of the Company comply with International Financial Reporting Standards (IFRSs) and interpretations adopted by the International Accounting Standards Board (IASB). The financial statements were approved and authorised for issue by the Board of Directors on 29
th September 2009.
(b) Basis of measurement
The consolidated financial statements have been prepared on the historical cost basis except for the following: - Biological assets are measured at fair value less estimated selling costs The methods used to determine fair values are discussed further in Note (p).
(c) Functional and presentation currency
These consolidated financial statements are presented in Australian Dollars, which is the Company’s functional currency and the functional currency of the majority of the Group. The Company is of a kind referred to in ASIC Class Order 98/100 dated 10 July 1998 and in accordance with that Class Order, all financial information presented in Australian Dollars has been rounded to the nearest thousand dollars, unless otherwise stated.
(d) Use of estimates and judgements
The preparation of financial statements requires management to make judgements, estimates and assumptions that affect the application of accounting policies and reported amounts of assets, liabilities, income and expenses. Actual results may differ from those estimates. Estimates and underlying assumptions are reviewed on an ongoing basis. Revisions to accounting estimates are recognised in the period in which the estimate is revised and in any future periods affected. In particular, information about significant areas of estimation uncertainty and critical judgements in applying accounting policies that have the most significant effect on the amount recognised in the financial statements are described in the following notes: - Note 16 - Biological assets - Note 25 - Share-based payments - Note 7 - Impairment of assets
(e) Going concern
Material uncertainty regarding continuation as a going concern The Group’s result from operating activities for the reporting period was a loss of $5,634,000 (2008: $1,967,000). The loss from continuing operations was $8,143,000 (2008: $2,537,000). At 30 June 2009, the Group had a working capital surplus of $1,946,000, represented significantly by biological assets of $4,724,000.
For
per
sona
l use
onl
y

23 | P a g e
Current liabilities at balance date included $2,712,000 due to Denise Hutton and Mathry Pty Ltd (an entity related to Denise Hutton), relation to Director John Hutton, which is secured by the assets of the Group and is repayable on demand. Subsequent to year end Denise Hutton has provided a commitment to the Group that she nor Mathry will demand repayment if such repayment will adversely affect the ability of the Company to meet its liabilities as and when they fall due. Further working capital and funding for capital expenditure is required to enable the Cone Bay farm to initially operate at breakeven and then to grow to a scale required to achieve: - Self funding operations - Fish grow-out of current holdings to targeted harvest size
- Large scale consistent supply of Barramundi products to domestic and export markets
- Economies of scale and cost efficiencies
- Improved, sustainable returns to shareholders, and
- Indigenous employment initiatives
The Development Plan dictates that the business needs to harvest and sell significantly less than the projected total fish biomass growth during the 2010 financial year to continue to expand the biomass of the farm to a sustainable level above 1,200 tonnes of biomass and following that to an initial target level of 2,000 tonnes. This planned biomass expansion, predominantly of the fish currently on hand, is subject to further licensing approvals and will require significant additional investment capital. To achieve the planned expansion the Group will require additional working capital to meet ongoing operations. The Company plans to raise up to $12,000,000 to fund its planned expansion strategy and reduce its debt levels over the 15 months beginning July 2009. In this regard, on 18 August 2009 the company announced and issued a prospectus for a pro rata non-renounceable entitlement issue of 111,386,427 new shares at $0.06 each on the basis of one new share for each 1 share held to raise up to $6,683,000 before costs. The entitlements issue was partly underwritten by Denise Hutton and Lasborough Investments Limited on the terms set out in separate underwriting agreements, with each effectively agreeing to apply and pay for a total of 40,000,000 new shares each for a combined commitment of $4,800,000. Loan funds were received subsequent to year end and as at the date of this report have been repaid through the issue of shares as follows:
Lender
Balance at 30 June 2009
$
Loaned in subsequent to
period end $
Issue of shares under entitlements issue
$
Balance following issue of shares
$
Denise Hutton
2,112,000
-
(1,600,000)
512,000
Mathry Pty Ltd 600,000 - - 600,000
Sub total 2,712,000 - (1,600,000) 1,112,000 Lasborough - 2,400,000 (2,400,000) -
Total 2,712,000 2,400,000 (4,000,000) 1,112,000
A further amount of $257,000 was received under the entitlements issue in addition to the commitments received from the underwriters, for a total raising of $5,057,000 before costs of the issue. Further equity or debt funding of up to $7,000,000 is likely to be required within the next 12 months to continue the planned high rate of farm development and fish growth. Of the $4,800,000 commitment received, an amount of $800,000 has been paid to Maxima Pearling Company Pty Ltd under their access agreement with the Group via the issue of shares to Maxima as sub-underwriter to Denise Hutton. The Group has the ability to slow its expansion strategy and harvest additional fish at less than the current targeted 3kg harvest size to maintain sufficient cash reserves, with a resulting potentially significant reduction of the scale of the operations until further funding becomes available. The financial statements have been prepared on a going concern basis which the directors believe to be appropriate. The directors are confident that the Group will be able to source sufficient funding to continue as a going concern and continue to pay its debts as and when they fall due based on the support received from major shareholder groups and the positive outlook for business development and resulting shareholder returns. Should further fund raising be unsuccessful and the company not be able to otherwise secure funding from other capital raisings or other alternative funding arrangements, there is material uncertainty which may cast significant doubt as to whether the company and Group will be able to continue as a going concern and continue to pay its debts as and when they fall due.
For
per
sona
l use
onl
y

24 | P a g e
If the Group is unable to continue as a going concern, it will be required to realise its assets and extinguish its liabilities other than in the ordinary course of business and at amounts that may be different to those stated in the financial report. This includes, but is not limited to, the Group’s major assets, being its biological assets, which represent 75% of the Group’s current assets and 63% of the Group’s total assets.
3. Significant accounting policies
The accounting policies set out below have been applied consistently to all periods presented in these consolidated financial statements, and have been applied consistently by Group entities. Certain comparative amounts have been reclassified to conform with the current year’s presentation. Management has restated the 2008 comparative figures, with regards to other income, cost of sales and the resultant adjustment to the fair value gain on biological assets, to align with the disclosures for 2009. In management’s view this better reflects the biological assets accounting standard requirements and internal management report processes. The following standards, amendments to standards and interpretations have been identified as those which may impact the entity in the period of initial application. They are available for early adoption at 30 June 2009, but have not been applied in preparing this financial report.
Revised AASB 3 Business Combinations (2008) incorporates the following changes that are likely to be relevant to the Group’s operations:
- The definition of a business has been broadened, which is likely to result in more acquisitions being treated as business combinations
- Contingent consideration will be measured at fair value, with subsequent changes therein recognised in profit or loss
- Transaction costs, other than share and debt issue costs, will be expensed as incurred - Any pre-existing interest in the acquiree will be measured at fair value with the gain or loss recognised in
profit or loss - Any non-controlling (minority) interest will be measured at either fair value, or at its proportionate
interest in the identifiable assets and liabilities of the acquiree, on a transaction-by-transaction basis. Revised AASB 3, which becomes mandatory for the Group’s 30 June 2010 financial statements, will be applied
prospectively and therefore there will have no impact on prior periods in the Group’s 2010 consolidated financial statement.
Amended AASB 127 Consolidated and Separate Financial Statements (2008) requires accounting for changes in ownership interests by the Group in a subsidiary, while maintaining control, to be recognised as an equity transaction. When the Group loses control of a subsidiary, any interest retained in the former subsidiary will be measured at fair value with the gain or loss recognised in profit or loss. The amendments to AASB 127, which become mandatory for the Group’s 30 June 2010 financial statements are not expected to have a significant impact on the consolidated financial statements.
AASB 8 Operating Segments introduces the “management approach” to segment reporting. AASB 8, which becomes mandatory for the Group’s 30 June 2010 financial statements, will require a change in the presentation on and disclosure of segment information based on the internal reports regularly reviewed by the Group’s Chief Financial Decision Maker in order assess each segment’s performance and to allocate resources to them. The Group currently operates in one business segment and in one geographical segment and does not expect AASB 8 to have a significant impact on the consolidated financial statements.
Revised AASB 101 Presentation of Financial Statements (2007) introduces the term total comprehensive income, which represents changes in equity during a period other than changes resulting from transactions with owners in their capacity as owners. Total comprehensive income may be presented in either a single statement of comprehensive income (effectively combining both the income statement and all non-owner changes in equity in a single statement) or, in an income statement and a separate statement of comprehensive income. Revised AASB 101, which becomes mandatory for the Group’s 30 June 2010 financial statements, is expected to have a significant impact on the presentation of the consolidated financial statements.
Revised AASB 123 Borrowing Costs removes the option to expense borrowing costs and requires that an entity capitalise borrowing costs directly attributable to the acquisition, construction or production of a qualifying asset as part of the cost of that asset. The revised AASB 123 will become mandatory for the Group’s 30 June 2010 financial statements and will have a limited impact on the consolidated financial statements.
AASB 2008-1 Amendments to Australian Accounting Standard – Share-based Payment: Vesting Conditions and Cancellations clarifies the definition of vesting conditions, introduces the concept of non-vesting conditions, requires non-vesting conditions to be reflected in grant-date fair value and provides the accounting treatment for non-vesting conditions and cancellations. The amendments to AASB 2 will be mandatory for the Group’s 30 June 2010 financial statements, with retrospective application. The Group has not yet determined the potential effect of the amendment.
AASB 2008-5 Amendments to Australian Accounting Standards arising from the Annual Improvements Process and 2008-6 Further Amendments to Australian Accounting Standards arising from The Annual Improvements Process affect various AASBs resulting in minor changes for presentation, disclosure, recognition and measurement purposes. The amendments, which become mandatory for the Group’s 30 June 2010 financial statements, are not expected to have any impact on the financial statements.
For
per
sona
l use
onl
y

25 | P a g e
AASB 2008-7 Amendments to Accounting Standards – Cost of an Investment in a Subsidiary, Jointly Controlled Entity or Associate changes the recognition and measurement of dividend receipts as income and addresses the accounting of a newly formed parent entity in the separate financial statements. The amendments become mandatory for the Group’s 30 June 2010 financial statements. The Group has not yet determined the potential impact of the amendments.
AASB 2008-8 Amendments to Australian Accounting Standard – Eligible Hedged Items clarifies the effect of using options as hedging instruments and the circumstances which inflation risk can be hedged. The amendments become mandatory for the Group’s 30 June 2010 financial statements, with retrospective application. The revised standard will have no impact on the Group’s consolidated financial statements.
(a) Basis of consolidation
Subsidiaries
Subsidiaries are entities controlled by the Group. Control exists when the Group has the power, directly or indirectly, to govern the financial and operating policies of an entity so as to obtain benefits from its activities. In assessing control, potential voting rights that presently are exercisable or convertible are taken into account. The financial statements of subsidiaries are included in the consolidated financial statements from the date that control commences until the date that control ceases. The accounting policies of subsidiaries have been changed when necessary to align them with the policies adopted by the Group. In the Company’s financial statements, investments in subsidiaries are carried at cost.
Transactions eliminated on consolidation
Intra-group balances and any unrealised income and expenses arising from intra-group transactions, are eliminated in preparing the consolidated financial statements. Unrealised gains arising from transactions with equity accounted investees are eliminated against the investment to the extent of the Group’s interest in the investee. Unrealised losses are eliminated in the same way as unrealised gains, but only to the extent that there is no evidence of impairment. Gains and losses are recognised when the contributed assets are consumed or sold by the equity accounted investees or, if not consumed or sold by the equity accounted investee, when the Group’s interest in such entities is disposed of.
(b) Property, plant and equipment
Recognition and measurement
Items of property, plant and equipment are measured at cost less accumulated depreciation and accumulated impairment losses. Cost includes expenditure that is directly attributable to the acquisition of the asset. The cost of self-constructed assets includes the cost of materials, direct labour, the initial estimate, where relevant, of the costs of dismantling and removing the items and restoring the site on which they are located, and an appropriate proportion of production overheads. Certain items of property, plant and equipment that had been revalued to fair value on or prior to 1 July 2004, the date of transition to Australian Accounting Standards – AIFRSs, are measured on the basis of deemed cost, being the carrying amount at that date. When parts of an item of property, plant and equipment have different useful lives, they are accounted for as separate items (major components) of property, plant and equipment. Borrowing costs related to the acquisition or construction of qualifying assets are recognised in the Income Statement as incurred. Gains and losses on disposal of an item of property, plant and equipment are determined by comparing the proceeds from disposal with the carrying amount of property, plant and equipment and are recognised net within “other income” in the Income Statement.
Subsequent costs
The Group recognises in the carrying amount of an item of property, plant and equipment the cost of replacing part of such an item when that cost is incurred if it is probable that the future economic benefits embodied within the item will flow to the Group and the cost of the item can be measured reliably. All other costs are recognised in the income statement as an expense incurred.
For
per
sona
l use
onl
y

26 | P a g e
Depreciation
With the exception of freehold land and development assets, depreciation is charged to the income statement on an adjusted reducing balance basis over the estimated useful lives of each part of an item of property, plant and equipment. Land is not depreciated. The estimated useful lives in the current and comparative periods are as follows:
Buildings 40 years Plant and equipment 5 - 12 years Fixtures and fittings 5 – 10 years Major components 3 – 5 years Boats 15 years
Depreciation methods, useful lives and residual values are reviewed at each reporting date.
(c) Intangible assets
Development assets
Expenditure on research activities, undertaken with the prospect of gaining new scientific or technical knowledge and understanding, is recognised in the income statement as incurred. Expenditure on development activities, whereby research findings are applied to a plan or design for the production of new or substantially improved products and processes, is capitalised only if the product or process is technically and commercially feasible, future economic benefits are probable, and the Group has sufficient resources and intent to complete development. The expenditure capitalised includes the cost of materials, direct labour and an appropriate proportion of overheads. Other development expenditure is recognised in the income statement as an expense as incurred. Capitalised development expenditure is stated at cost less accumulated amortisation and impairment losses (see accounting policy (f)). Borrowing costs related to the development of qualifying assets are recognised in the income statement as incurred.
Subsequent expenditure
Subsequent expenditure on capitalised intangible assets is capitalised only when it increases the future economic benefits embodied in the specific asset to which it relates. All other expenditure is expensed as incurred.
Amortisation
Amortisation is charged to the income statement on a straight-line basis over the estimated useful lives of intangible assets unless such lives are indefinite. Intangible assets with an indefinite useful life are systematically tested for impairment at each balance sheet date. Other intangible assets are amortised from the date they are available for use. The estimated useful life of intangible assets in the current and comparative periods is 10 years.
(d) Biological assets
Biological assets relating to aquaculture activities and products are stated at fair value less estimated selling costs, with any resultant gain or loss recognised in the income statement. Fair value is determined based on estimated market sales price. Selling costs include all costs that would be necessary to sell the assets, including costs necessary to get the assets to market. As the fair value of the assets is based on its present location and condition, the company applies direct costing to estimate fair value of barramundi in cages where they have not yet reached a saleable size.
(e) Inventories
Inventories are measured at the lower of cost and net realisable value. Net realisable value is the estimated selling price in the ordinary course of business, less the estimated costs of completion and selling expenses. The cost attributed to harvested barramundi is equal to the fair value less estimated point of sale costs previously recorded in biological assets at the date of harvest, determined in accordance with the accounting policy for biological assets (see accounting policy (d)). Any change in value at the date of harvest is recognised in the income statement. Once harvested, barramundi inventories are accounted for as normal inventories.
For
per
sona
l use
onl
y

27 | P a g e
The cost of other inventories is based on the first-in first-out principle and includes expenditure incurred in acquiring the inventories and bringing them to their existing location and condition. Cost includes an appropriate share of overheads based on normal operating capacity.
(f) Impairment
The carrying amounts of the Group’s assets, other than biological assets (see accounting policy (d)), inventories (see accounting policy (e)) and deferred tax assets (see accounting policy (l)) are reviewed at each balance sheet date to determine whether there is any indication of impairment. If any such indication exists, the asset’s recoverable amount is estimated. For goodwill, assets that have an indefinite useful life and intangible assets that are not yet available for use, the recoverable amount is estimated at each balance sheet date. An impairment loss is recognised whenever the carrying amount of an asset or its cash-generating unit exceeds its recoverable amount. Impairment losses are recognised in the income statement, unless an asset has previously been revalued, in which case the impairment loss is recognised as a reversal to the extent of that previous revaluation with any excess recognised through profit or loss. Impairment losses recognised in respect of cash-generating units are allocated first to reduce the carrying amount of any goodwill allocated to cash-generating units (group of units) and then, to reduce the carrying amount of the other assets in the unit (group of units) on a pro rata basis.
Calculation of recoverable amount
The recoverable amount of the Group’s investments and receivables carried at amortised cost is calculated as the present value of estimated future cash flows, discounted at the original effective interest rate (ie the effective interest rate computed at initial recognition of these financial assets). Receivables with a short duration are not discounted. Impairment of receivables is not recognised until objective evidence is available that a loss event has occurred. Significant receivables are individually assessed for impairment. Impairment testing of receivables that are not impaired individually is performed by placing them into portfolios of receivables with similar risk profiles and undertaking a collective assessment of impairment. Non-significant receivables are not individually assessed. Instead, impairment testing is performed by placing non-significant receivables in portfolios of similar risk profiles based on objective evidence from historical experience adjusted to for any effects of conditions existing at each balance sheet date. The recoverable amount of other assets is the greater of their fair value less costs to sell and value in use. In assessing value in use, the estimated future cash flows are discounted to their present value using a pre-tax discount rate that reflects current market assessments of the time value of money and the risks specific to the asset. For an asset that does not generate largely independent cash inflows, the recoverable amount is determined for the cash-generating unit to which the asset belongs.
Reversals of impairment
Impairment losses, other than in respect of goodwill, are reversed when there is an indication that the impairment loss has decreased or no longer exists and there has been a change in the estimate used to determine the recoverable amount.
An impairment loss in respect of goodwill is not reversed. An impairment loss in respect of a held-to-maturity security or receivable carried at amortised cost is reversed if the subsequent increase in recoverable amount can be related objectively to an event after the impairment loss was recognised via profit and loss. An impairment loss in respect of an investment in an equity instrument classified as available for sale is not reversed through profit or loss. If the fair value of a debt instrument classified as available-for-sale increases and the increase can be objectively related to an event occurring after the impairment loss was recognised in profit or loss, the impairment loss shall be reversed, with the amount of the reversal recognised in profit or loss. An impairment loss is reversed only to the extent that the asset’s carrying amount does not exceed the carrying amount that would have been determined, net of depreciation or amortisation, if no impairment loss has been recognised.
(g) Non-current assets held for sale and discontinued operations
Immediately before classification as held for sale, the measurement of the assets and liabilities in the disposal group is brought up-to-date in accordance with applicable accounting standards. Then, on initial classification as held for sale, non-current assets and disposal groups are recognised at the lower of carrying amount and fair value less costs to sell.
For
per
sona
l use
onl
y

28 | P a g e
Impairment losses on initial classification as held for sale are included in profit or loss, even when there is a revaluation. The same applies to gains and losses on subsequent remeasurement. A discontinued operation is a component of the Group’s business that represents a separate major line of business or geographical area of operations. Classification as a discontinued operation occurs upon disposal or when the operation meets the criteria to be classified as held-for-sale, if earlier.
(h) Employee benefits
Defined contribution plans
A defined contribution plan is a post-employment benefit plan under which an entity pays fixed contributions into a separate entity and will have no legal or constructive obligation to pay further amounts. Obligations for contributions to defined contribution superannuation funds are recognised as an expense in profit or loss as and when they fall due.
Short-term benefits
Liabilities for employee benefits for wages, salaries and annual leave that are expected to be settled within 12 months of the reporting date represent present obligations resulting from employees’ services provided to reporting date, are calculated at undiscounted amounts based on remuneration wage and salary rates that the Group expects to pay as at the reporting date including related on-costs, such as workers compensation, insurance and payroll tax. Non-monetary benefits, such as medical care, housing, cars and free or subsidised goods and services, are expensed based on the net marginal cost to the Group as the benefits are taken by the employees.
Share-based payment transactions
The share option programme allows Group employees to acquire shares of the Company. The fair value of options granted is recognised as an employee expense with a corresponding increase in equity. The fair value is measured at grant date and spread over the period during which the employees become unconditionally entitled to options. The fair value of the options granted is measured using a Black Scholes model, taking into account the terms and conditions upon which the options were granted. The amount recognised as an expense is adjusted to reflect the actual number of share options that vest except where forfeiture is only due to share prices not achieving the threshold for vesting. Share-based payment arrangements in which the Group receives goods or services as consideration for its own equity instruments are accounted for as equity-settled share-based payment transactions, regardless of how the equity instruments are obtained by the Group. Any goods or services that are settled by way of issue of the Group's own equity instruments are measured at the fair value of the goods and services provided.
Termination benefits
Termination benefits are recognised as an expense when the Group is demonstrably committed, without realistic possibility of withdrawal, to a formal detailed plan to terminate employment before the normal retirement date. Termination benefits for voluntary redundancies are recognised if the Group has made an offer encouraging voluntary redundancy, it is probable that the offer will be accepted, and the number of acceptances can be estimated reliably.
(i) Provisions
A provision is recognised in the balance sheet when the Group has a present legal or constructive obligation as a result of a past event, and it is probable that an outflow of economic benefits will be required to settle the obligation. Provisions are determined by discounting the expected future cash flows at a pre-tax rate that reflects current market assessments of the time value of money and, where appropriate, the risks specific to the liability.
(j) Revenue
Sale of goods
Revenue from the sale of goods is recognised in the income statement when the significant risks and rewards of ownership have been transferred to the buyer. No revenue is recognised if there are significant uncertainties regarding recovery of the consideration due, the costs incurred or to be incurred cannot be measured reliably, there is a risk of return of goods or there is continuing management involvement with the goods. Transfers of risks and rewards vary depending on the individual terms of the contract of sale. For sales of Barramundi, transfer usually occurs when the product is received by the customer.
For
per
sona
l use
onl
y

29 | P a g e
Gain from change in fair value of biological assets
Biological assets relating to aquaculture activities and products are stated at fair value less estimated point-of-sale costs, with any resultant gain or loss recognised in the income statement. Point-of-sale costs include all costs that would be necessary to sell the assets, including costs necessary to get the assets to market. As the fair value of the assets is based on its present location and condition, the company applies direct costing to estimate fair value of barramundi in cages where they have not yet reached a saleable size.
(k) Expenses
Financing income and expenses
Net financing costs comprise interest payable on borrowings (calculated using the effective interest method), fair value of share-based payments attributable to financing facilities and interest receivable on funds invested that are recognised in the income statement. Borrowing costs are expensed as incurred and included in net financing costs. Interest income is recognised in the income statement as it accrues, using the effective interest method.
(l) Income tax
Income tax on profit or loss for the year comprises current and deferred tax. Income tax is recognised in the income statement except to the extent that it relates to items recognised directly in equity, in which case it is recognised in equity. Current tax is the expected tax payable on the taxable income for the year, using tax rates enacted or substantively enacted at the balance sheet date, and any adjustment to tax payable in respect of previous years. Research and development assistance is recognised as an income tax benefit in the year in which it is earned. The corresponding receivable is held within current tax assets. Deferred tax is provided using the balance sheet liability method, providing for temporary differences between the carrying amounts of assets and liabilities for financial reporting purposes and the amounts used for taxation purposes. The following temporary differences are not provided for: initial recognition of goodwill, the initial recognition of assets or liabilities that affect neither accounting or taxable profit, and differences relating to investments in subsidiaries to the extent that they will probably not reverse in the foreseeable future. The amount of deferred tax provided is based on the expected manner of realisation or settlement of the carrying amount of assets and liabilities, using tax rates enacted or substantively enacted at the balance sheet date.
A deferred tax asset is recognised only to the extent that it is probable that the future taxable profits will be available against which the asset can be utilised. Deferred tax assets are reduced to the extent that it is no longer probable that the related tax benefit will be realised. Tax consolidation The Company and its wholly-owned Australian resident entities have formed a tax-consolidated group with effect from 1 July 2004 and are therefore taxed as a single entity from that date. The head entity within the tax-consolidated group is Marine Produce Australia Limited. Current tax expense/income and deferred tax assets arising from unused tax losses of the subsidiaries is assumed by the head entity and are recognised in the separate financial statements of the members of the tax consolidated group using the “separate tax payer within group” approach by reference to the carrying amount of assets and liabilities in the separate financial statements of each entity and the tax values applying under tax consolidation. Any current tax liabilities (or assets) and deferred tax assets arising from unused tax losses of the subsidiaries is assumed by the head entity in the tax consolidated group and are recognised as amounts payable (receivable) to (from) other entities in the tax-consolidated group in conjunction with any tax funding arrangement amounts (refer below). Any difference between these amounts is recognised by the Company as an equity contribution or distribution. The Company recognises deferred tax assets arising from unused tax losses of the tax-consolidated group to the extent that it is probable that future taxable profits of the tax-consolidated group will be available against which the asset can be utilised. Any subsequent period adjustments to deferred tax assets arising from unused tax losses as a result of revised assessments of the probability of recoverability is recognised by the head entity only.
For
per
sona
l use
onl
y

30 | P a g e
Nature of tax funding arrangements and tax sharing arrangements
The head entity, in conjunction with other members of the tax-consolidated group, has not entered into a tax funding or sharing arrangement with members of the tax-consolidated group in respect of tax amounts.
(m) Segment reporting
A segment is a distinguishable component of the Group that is engaged either in providing products or services (business segment), or in providing products or services within a particular economic environment (geographical segment), which is subject to risks and rewards that are different from those of other segments.
(n) Goods and services tax
Revenue, expenses and assets are recognised net of the amount of goods and services tax (GST), except where the amount of GST incurred is not recoverable from the taxation authority. In these circumstances, the GST is recognised as part of the cost of acquisition of the asset or as part of the expense. Receivables and payables are stated with the amount of GST included. The net amount of GST recoverable from, or payable to, the ATO is included as a current asset or liability in the balance sheet. Cash flows are included in the statement of cash flows on a gross basis. The GST components of cash flows arising from investing and financing activities which are recoverable from, or payable to, the ATO are classified as operating cash flows.
(o) Earnings per share
The Group presents basic and diluted earning per share (EPS) data for its ordinary shares. Basic EPS is calculated by dividing the profit or loss attributable to ordinary shareholders of the Company by the weighted average number of ordinary shares outstanding during the period. Diluted EPS is determined by adjusting the profit or loss attributable to ordinary shareholders and the weighted average number of ordinary shares outstanding for the effects of all dilutive potential ordinary shares, which comprise convertible notes and share options granted to employees.
(p) Determination of fair values
A number of the Company’s accounting policies and disclosures require the determination of fair value, for both financial and non-financial assets and liabilities. Fair values have been determined for measurement and/or disclosure purposes based on the following methods. When applicable, further information about the assumptions made in determining fair values of assets and liabilities are disclosed in the notes specific to that asset or liability.
Biological assets
The fair value of fish is set out in Note 3(d).
Trade and other receivables
The fair value of trade and other receivables is estimated as the present value of future cash flows, discounted at the market rate of interest at the reporting date.
Share based payment transactions
The fair value of employee and director share options is measured using the Black-Scholes formula. Measurement inputs include share price on measurement date, exercise price of the instrument, expected volatility (based on weighted average historical volatility adjusted for changes expected due to publically available information), weighted average expected life of the instruments (based on historical experience and general option holder behaviour), expected dividends, and the risk-free interest rate (based on government bonds). Service and non-market performance conditions attaching to the transactions are not taken into account in determining fair value.
(q) Financial instruments
Non-derivative financial instruments
Non-derivative financial instruments comprise investments in equity and debt securities, trade and other receivables, cash and cash equivalents, loans and borrowings, and trade and other payables.
Non-derivative financial instruments are recognised initially at fair value plus, for instruments not at fair value through profit or loss, any directly attributable transaction costs. Subsequent to initial recognition non-derivative financial instruments are measured as described below.
For
per
sona
l use
onl
y

31 | P a g e
A financial instrument is recognised if the Group becomes a party to the contractual provisions of the instrument. Financial assets are derecognised if the Group’s contractual rights to the cash flows from the financial assets expire or if the Group transfers the financial asset to another party without retaining control or substantially all risks and rewards of the asset. Regular way purchases and sales of financial assets are accounted for at trade date, i.e., the date that the Group commits itself to purchase or sell the asset. Financial liabilities are derecognised if the Group’s obligations specified in the contract expire or are discharged or cancelled.
Cash and cash equivalents comprise cash balances and call deposits. Bank overdrafts that are repayable on demand and form an integral part of the Group’s cash management are included as a component of cash and cash equivalents for the purpose of the statement of cash flows.
Accounting for finance income and expense is discussed in note (k).
Held-to-maturity investments
If the Group has the positive intent and ability to hold debt securities to maturity, then they are classified as held-to-maturity. Held-to-maturity investments are measured at amortised cost using the effective interest method, less any impairment losses.
Other
Other non-derivative financial instruments are measured at amortised cost using the effective interest method, less any impairment losses.
Share capital
Ordinary shares
Ordinary shares are classified as equity. Incremental costs directly attributable to the issue of ordinary shares and share options are recognised as a deduction from equity, net of any tax effects.
Dividends
Dividends are recognised as a liability in the period in which they are declared.
4 Segment reporting
For the years ended 30 June 2008 and 30 June 2009 the Group has undertaken one activity being the farming of Barramundi at Cone Bay in the Buccaneer Archipelago, North West of Western Australia. As a result no separate business segments are reported.
5 Discontinued operation
In 2007 the carrying amount of assets held for sale in the prawn business segment was $4,323,116. The assets had been classified as held for sale in the balance sheet. The measurement of the recoverable amount for these assets was made based on the estimated net value the Group could realise the sale of the assets. This property was disposed of during the previous reporting period, with an amount of $1,008,000 recognised for impairment prior to sale.
The prawn farming operation located in Darwin was classified as a discontinued operation in 2007 with the associated assets classified as assets held for sale in the balance sheet. This resulted from the decision of the Group’s Board in December 2006 to consider the sale of the associated assets due to the prawn farm being uneconomical at 12 hectares of renovated ponds. These assets were sold during 2008.
Cash flows from discontinued operation
Consolidated Company
In thousands of AUD 2009 2008 2009 2008
Net cash from investing activities - 3,262 - -
Effect of disposal on the financial position of the group
Consolidated Company
In thousands of AUD 2009 2008 2009 2008
Property plant & equipment - (4,323) - -
Impairment - 1,008 - -
Consideration received in cash - 3,315 - -
For
per
sona
l use
onl
y

32 | P a g e
Results of discontinued operation
Consolidated Company
In thousands of AUD 2009 2008 2009 2008
Revenue - - - -
Other income - - - -
Expenses - (1,008) - -
Results from operating activities - (1,008) - -
Income tax expense - - - -
Results from operating activities, net of income tax - (1,008) - -
Basic loss per share (cents) - (2.0) - -
Diluted loss per share (cents) - (2.0) - -
6 Finance expenses
Consolidated Company
In thousands of AUD 2009 2008 2009 2008
Fair value of options issued under a loan agreement (i) - 488 - 488
Transfer of fair value of options to controlled entity - - - (488)
Interest expense (ii) 226 105 209 -
226 593 209 -
(i) Fair value of options issued under a loan agreement Loan facility During the previous reporting period, WU Investments Pty Ltd granted the Company a loan facility of up to $3,000,000 subject to the terms and conditions contained in a loan agreement entered into between the Company and the lender. Performance of the Company’s obligations under the loan agreement was guaranteed by Aussie Prawns Pty Ltd, a wholly owned subsidiary of the Company, and secured by a first mortgage over Aussie Prawn’s prawn operations in the Northern Territory. During the previous reporting period the Company borrowed $3,000,000 under the loan facility and repaid these funds in full from the consideration received on the sale of the prawn farm. On 28 September 2007, shareholders in general meeting voted to approve the issue of 5 million $0.02 options expiring 28 September 2012 to acquire ordinary shares in the Company in consideration for the lender agreeing to grant the loan facility to the Group. The issue of these options, based on Black-Scholes option valuation model, resulted in the recognition of financial expenses of $488,000 in the income statement and balance sheet equity reserves.
(ii) Interest expense
Interest charges paid and accrued to Faustus Nominees Pty Ltd, Denise Hutton and Mathry Pty Ltd, all related to director John Hutton, for the provision of secured working capital facilities – Refer to Note 22 for further details of movements, terms and conditions of these facilities.
For
per
sona
l use
onl
y
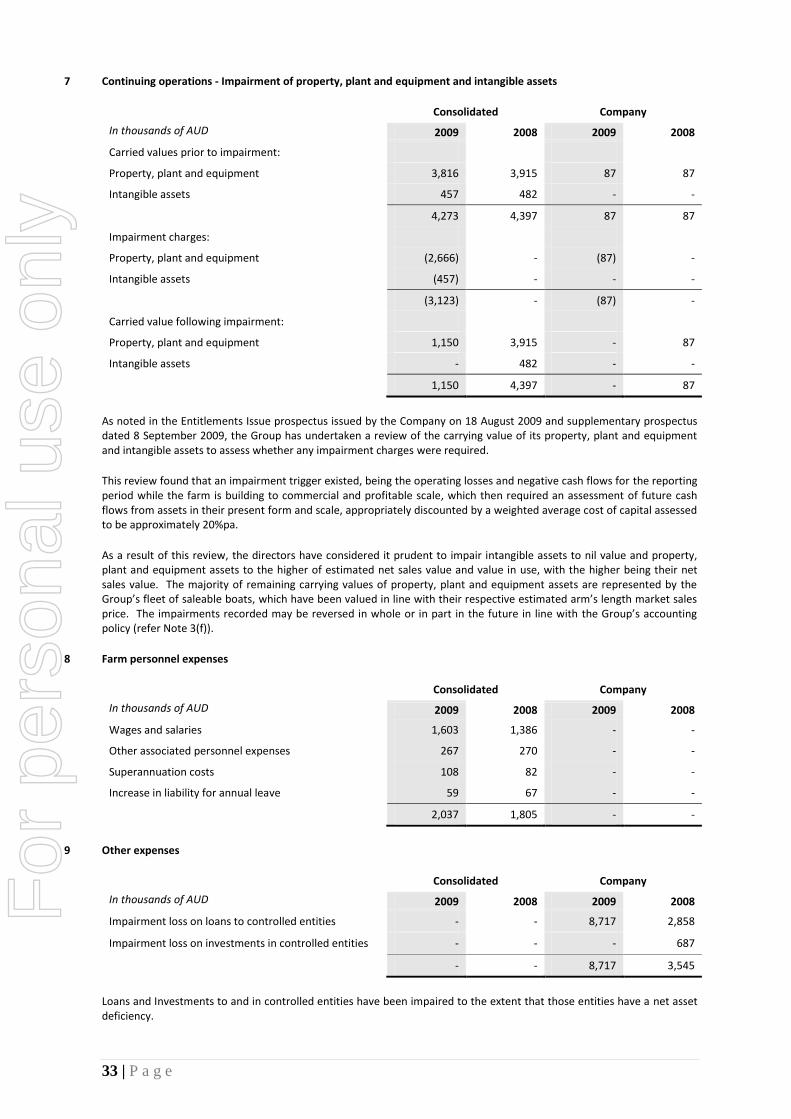
33 | P a g e
7 Continuing operations - Impairment of property, plant and equipment and intangible assets
Consolidated Company
In thousands of AUD 2009 2008 2009 2008
Carried values prior to impairment:
Property, plant and equipment 3,816 3,915 87 87
Intangible assets 457 482 - -
4,273 4,397 87 87
Impairment charges:
Property, plant and equipment (2,666) - (87) -
Intangible assets (457) - - -
(3,123) - (87) -
Carried value following impairment:
Property, plant and equipment 1,150 3,915 - 87
Intangible assets - 482 - -
1,150 4,397 - 87
As noted in the Entitlements Issue prospectus issued by the Company on 18 August 2009 and supplementary prospectus dated 8 September 2009, the Group has undertaken a review of the carrying value of its property, plant and equipment and intangible assets to assess whether any impairment charges were required.
This review found that an impairment trigger existed, being the operating losses and negative cash flows for the reporting period while the farm is building to commercial and profitable scale, which then required an assessment of future cash flows from assets in their present form and scale, appropriately discounted by a weighted average cost of capital assessed to be approximately 20%pa.
As a result of this review, the directors have considered it prudent to impair intangible assets to nil value and property, plant and equipment assets to the higher of estimated net sales value and value in use, with the higher being their net sales value. The majority of remaining carrying values of property, plant and equipment assets are represented by the Group’s fleet of saleable boats, which have been valued in line with their respective estimated arm’s length market sales price. The impairments recorded may be reversed in whole or in part in the future in line with the Group’s accounting policy (refer Note 3(f)).
8 Farm personnel expenses
Consolidated Company
In thousands of AUD 2009 2008 2009 2008
Wages and salaries 1,603 1,386 - -
Other associated personnel expenses 267 270 - -
Superannuation costs 108 82 - -
Increase in liability for annual leave 59 67 - -
2,037 1,805 - -
9 Other expenses
Consolidated Company
In thousands of AUD 2009 2008 2009 2008
Impairment loss on loans to controlled entities - - 8,717 2,858
Impairment loss on investments in controlled entities - - - 687
- - 8,717 3,545
Loans and Investments to and in controlled entities have been impaired to the extent that those entities have a net asset deficiency.
For
per
sona
l use
onl
y
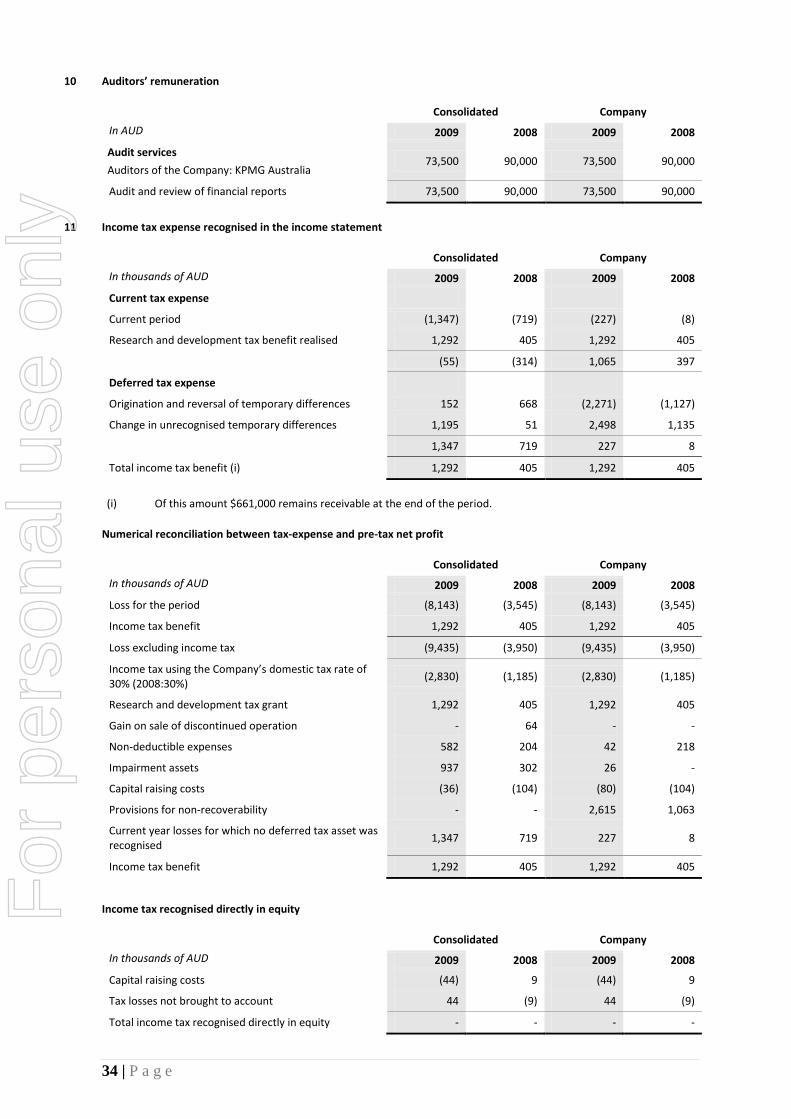
34 | P a g e
10 Auditors’ remuneration
Consolidated Company
In AUD 2009 2008 2009 2008
Audit services
Auditors of the Company: KPMG Australia 73,500 90,000 73,500 90,000
Audit and review of financial reports 73,500 90,000 73,500 90,000
11 Income tax expense recognised in the income statement
Consolidated Company
In thousands of AUD 2009 2008 2009 2008
Current tax expense
Current period (1,347) (719) (227) (8)
Research and development tax benefit realised 1,292 405 1,292 405
(55) (314) 1,065 397
Deferred tax expense
Origination and reversal of temporary differences 152 668 (2,271) (1,127)
Change in unrecognised temporary differences 1,195 51 2,498 1,135
1,347 719 227 8
Total income tax benefit (i) 1,292 405 1,292 405
(i) Of this amount $661,000 remains receivable at the end of the period.
Numerical reconciliation between tax-expense and pre-tax net profit
Consolidated Company
In thousands of AUD 2009 2008 2009 2008
Loss for the period (8,143) (3,545) (8,143) (3,545)
Income tax benefit 1,292 405 1,292 405
Loss excluding income tax (9,435) (3,950) (9,435) (3,950)
Income tax using the Company’s domestic tax rate of 30% (2008:30%)
(2,830) (1,185) (2,830) (1,185)
Research and development tax grant 1,292 405 1,292 405
Gain on sale of discontinued operation - 64 - -
Non-deductible expenses 582 204 42 218
Impairment assets 937 302 26 -
Capital raising costs (36) (104) (80) (104)
Provisions for non-recoverability - - 2,615 1,063
Current year losses for which no deferred tax asset was recognised
1,347 719 227 8
Income tax benefit 1,292 405 1,292 405
Income tax recognised directly in equity
Consolidated Company
In thousands of AUD 2009 2008 2009 2008
Capital raising costs (44) 9 (44) 9
Tax losses not brought to account 44 (9) 44 (9)
Total income tax recognised directly in equity - - - -
For
per
sona
l use
onl
y

35 | P a g e
12 Loss per share
Basic and diluted loss per share
Consolidated
2009
2008
From continuing operations (cents) (9.1) (4.9)
From discontinued operations (cents) - (1.9)
Loss per share (9.1) (6.8)
The calculation of basic loss per share at 30 June 2009 was based on the loss attributable to ordinary shareholders of $8,143,000 (2008: $3,545,000) and weighted average number of ordinary shares during the financial year ended 30 June 2009 of 89,736,141 (2008: 52,178,931). The Group is in a loss making position and it is unlikely that the conversion to, calling of, or subscription for, ordinary share capital in respect of potential ordinary shares would lead to a diluted earnings per share that shows an inferior view of the earnings per share. For this reason, the diluted loss per share is the same as the basic loss per share.
13 Cash and cash equivalents
Consolidated Company
In thousands of AUD 2009 2008 2009 2008
Cash at bank 89 310 70 213
Cash in the statement of cash flows 89 310 70 213
The Group’s exposure to interest rate risk and a sensitivity analysis for financial assets and liabilities are disclosed in Note 26.
14 Trade and other receivables
Consolidated Company
In thousands of AUD 2009 2008 2009 2008
Current
Trade receivables 535 706 - -
Other receivables 3 5 24 -
GST receivable 37 185 6 -
575 896 30 -
Non-current
Loans to controlled entities - - 21,245 16,142
Provision for non recovery of loans - - (16,041) (7,323)
- - 5,204 8,819
The Group’s exposure to credit and currency risks and impairment losses related to trade and other receivables are disclosed in Note 26.
15 Inventories
Consolidated Company
In thousands of AUD 2009 2008 2009 2008
Stock of feed - at cost 151 68 - -
Consumable stock - at cost 15 20 - -
Harvested fish stock - at net realisable value 101 139 - -
267 227 - -
For
per
sona
l use
onl
y

36 | P a g e
16 Biological assets
Consolidated
In thousands
Barramundi (kg)
Barramundi ($)
2009 2008 2009 2008
Balance at 1 July 645 486 5,448 2,430
Increase due to growth 421 522 3,207 5,886
Increase due to acquisitions - - 303 377
Decrease due to harvest (440) (363) (4,234) (3,245)
Balance at 30 June 626 645 4,724 5,448
(i) Group exposure to risk
Aquaculture contains elements of significant risk. The ultimate success of aquaculture depends, amongst other things, on the availability to obtain a sufficient yield of juveniles from hatcheries and harvesting an economic yield from a marketable size, the possibility of high mortality rates due to a variety of factors, maintenance of the necessary licences, adhering to other government regulations, conditions and approvals, obtaining and servicing suitable funding arrangements.
The performance of the Group’s aquaculture operations, and the value of the Group’s biological assets, could be impacted by a number of factors, including:
- Weather conditions - Possibility of disease and high mortality rates - Price of and market for its products - Exchange rates affecting international market pricing - Unexpected developments in aquaculture development and operating costs - General economic and stock market conditions in Australia and worldwide, particularly relating to the
availability of capital - Access to sufficient funding to allow grow-out to marketable size
The Group is exposed to a number of risks related to its Barramundi farming operations, which can be summarized into the following key areas:
Regulatory and environmental risks
The Group is subject to laws and regulations of Australia, and specifically Western Australia. The Group has established environmental policies and procedures aimed at compliance with local environmental and other laws. Management performs regular reviews to identify environmental risks and to ensure that the systems in place are adequate to manage those risks.
Supply and demand risks
The Group is exposed to risks arising from fluctuations in the price and sales volume of fish. Where possible the Group manages this risk by aligning its harvest volume to market supply and demand. Management performs regular industry trend analysis to ensure that the Group’s pricing structure is in line with the market and to ensure that projected harvest volumes are consistent with the expected demand.
For
per
sona
l use
onl
y

37 | P a g e
Climate and other risks
The Group’s fish farm is exposed to the risk of damage from climatic conditions, diseases, and other forces. The Group has processes in place aimed at monitoring and mitigating those risks, including regular inspections of the fish and associated infrastructure assets. The Group also insures itself against damage to its assets caused by natural disasters such as cyclones.
Basis of estimation and valuation
The measurement of the number, weight and value of fish stock involves:
- Sample counting of fish in cages during splitting and harvesting operations - Sample weighing of fish in cages and extrapolation of results to total holding in sampled cage - Current market values and selling costs
In line with industry practice there is a degree of estimation in these processes which requires management and staff to make judgments, estimates and assumptions that affect the reported quantities and value of the Group’s biological assets. Fish numbers are estimated allowing for cannibalism, stock losses and under delivery of small fish at time of purchase. Actual results, for example at later harvest, may differ positively or negatively from those estimates. The estimates and assumptions applied are reviewed on an ongoing basis.
17 Investments
Consolidated Company
In thousands of AUD 2009 2008 2009 2008
Investments in controlled entities - at cost - - 4,292 4,292
Less impairment - - (4,292) (4,292)
- - - -
For
per
sona
l use
onl
y

38 | P a g e
18 Deferred tax assets and liabilities
Movement in temporary differences during the year
In thousands of AUD Balance 1 July 2007
Recognised in loss
Recognised in equity
Balance 30 June 2008
Recognised in loss
Recognised in equity
Balance 30 June 2009
Consolidated
Property, plant and equipment (26) 7 - (19) (866) - (885)
Receivables (102) (17) - (119) 119 - -
Intangible assets 292 12 - 304 (757) - (453)
Available for sale financial assets 404 (404) - - - - -
Payables 89 (114) - (25) 15 - (10)
Provisions 14 (30) - (16) (9) - (25)
Capital raising costs 120 - 9 129 - (44) 85
Tax loss carry-forwards (5,385) (253) - (5,638) (1,031) - (6,669)
(4,594) (799) 9 (5,384) (2,529) (44) (7,957)
Deferred tax assets not brought to account
4,594 799 (9) 5,384 2,529 44 7,957
- - - - - - -
Company
Property, plant and equipment (10) (1) - (11) (25) - (36)
Receivables (1,339) (977) - (2,316) (2,496) (4,812)
Financial assets at their value (1,082) (206) - (1,288) - - (1,288)
Payables (73) 49 - (25) 23 (2)
Provisions (1) - - (1) - - (1)
Capital Raising costs 120 - 9 129 - (44) 85
(2,385) (1,135) 9 (3,512) (2,498) (44) (6,054)
Deferred tax assets not brought to account
2,385 1,135 (9) 3,512 2,498 44 6,054
- - - - - - -
For
per
sona
l use
onl
y

39 | P a g e
18 Deferred tax assets and liabilities
Movement in unrecognised deferred tax assets and liabilities during the year
In thousands of AUD Balance 1 July 2007
Additions Balance
30 June 2008 Additions
Balance 30 June 2009
Consolidated
Taxable temporary differences (919) 486 (433) 348 (85)
Deductible temporary differences 128 50 178 1,195 1,373
Tax income losses 4,602 253 4,855 1,049 5,904
Tax capital losses 784 - 784 (19) 765
4,594 789 5,384 2,574 7,957
Company
Taxable temporary differences (120) (8) (129) 44 (85)
Deductible temporary differences 2,505 1,135 3,641 2,498 6,139
2,385 1,127 3,512 2,542 6,054
As at the date of this report the availability of carry forward losses has not been fully determined. With the exception of the amount recognised above no deferred tax asset balance has been recognised in respect of these losses.
For
per
sona
l use
onl
y

40 | P a g e
19 Property, plant and equipment
Consolidated Company
In thousands of AUD Land and buildings
Plant and equipment
Infrastructure Total Land and buildings
Plant and equipment
Infrastructure Total
Cost or deemed cost
Balance at 1 July 2007 - 2,683 - 2,683 - 113 - 113
Acquisitions - 1,845 - 1,845 - 82 - 82
Balance at 30 June 2008 - 4,528 - 4,528 - 195 - 195
Balance at 1 July 2008 - 4,528 - 4,528 - 195 - 195
Acquisitions - 303 - 303 - 13 - 13
Balance at 30 June 2009 - 4,831 - 4,831 - 208 - 208
For
per
sona
l use
onl
y

41 | P a g e
19 Property, plant and equipment
Consolidated Company
In thousands of AUD Land and buildings
$
Plant and equipment
$
Infrastructure Total Land and buildings
$
Plant and equipment
$
Infrastructure Total
Depreciation and impairment losses
Balance at 1 July 2007 - 308 - 308 - 91 - 91
Depreciation charge for the year - 305 - 305 - 18 - 18
Balance at 30 June 2008 - 613 - 613 - 109 - 109
Balance at 1 July 2008 - 613 - 613 - 109 - 109
Impairment losses (Note 7) - 2,666 - 2,666 - 87 - 87
Depreciation charge for the year - 402 - 402 - 12 - 12
Balance at 30 June 2009 - 3,681 - 3,682 - 208 - 208
Carrying amounts
At 1 July 2007 - 2,375 - 2,375 - 113 - 113
At 30 June 2008 - 3,915 - 3,915 - 87 - 87
At 1 July 2008 - 3,915 - 3,915 - 87 - 87
At 30 June 2009 (Note 7) - 1,150 - 1,150 - - - -
For
per
sona
l use
onl
y

42 | P a g e
20 Intangible assets
Development assets Consolidated Company
In thousands of AUD Barramundi Prawn
Total Barramundi Prawn
Total
Cost
Balance at 1 July 2007 559 894 1,453 - - -
Additions 43 - 43 - - -
Balance at 30 June 2008 602 894 1,496 - - -
Balance at 1 July 2008 602 894 1,496 - - -
Additions 15 - 15 - - -
Balance at 30 June 2009 617 894 1,511 - - -
Amortisation and impairment losses
Balance at 1 July 2007 80 894 974 - - -
Amortisation for the year 40 - 40 - - -
Balance at 30 June 2008 120 894 1,014 - - -
- - -
Balance at 1 July 2008 120 894 1,014 - - -
Amortisation for the year 40 - 40 - - -
Impairment loss (Note 7) 457 - 457 - - -
Balance at 30 June 2009 617 894 1,511 - - -
Carrying amounts - - -
At 1 July 2007 479 - 479 - - -
At 30 June 2008 482 - 482 - - -
At 1 July 2008 482 - 482 - - -
At 30 June 2009 (Note 7) - - - - - -
21 Trade and other payables
Consolidated Company
In thousands of AUD 2009 2008 2009 2008
Trade payables 1,445 2,275 56 178
Other payables and accrued expenses 148 250 116 220
1,593 2,525 172 398
The Group’s exposure to currency and liquidity risk related to trade and other payables is disclosed in Note 26.
For
per
sona
l use
onl
y

43 | P a g e
22 Loans and borrowings
Consolidated Company
In thousands of AUD 2009 2008 2009 2008
Secured interest-bearing loans – related parties 2,712 1,000 2,712 1,000
2,712 1,000 2,712 1,000
Related party debt funding during the period:
Facility In thousands of AUD
Opening 30 June 2008
Assignment Drawn in cash
Repaid in cash
Repaid in shares
Closing 30 June 2009
Faustus Nominees (i)
1,000
(1,000)
-
-
-
-
Denise Hutton (i) - 1,000 1,250 - (138) 2,112 Mathry Pty Ltd (i) - - 600 - - 600 Guy Westbrook
- - 275 (150) (125) -
Total 1,000 - 2,125 (150) (263) 2,712
This note provides information about the contractual terms of the Company’s and Group’s interest-bearing loans and borrowings, which are measured at amortised cost. For more information about the Company’s and Group’s exposure to interest rate and liquidity risk, see Note 26.
(i) Denise Hutton and Mathry Pty Ltd Loans
During the period the Company entered into loan facilities of up to $2,750,000 with Denise Hutton and her associated entity Mathry Pty Ltd. Under this arrangement Faustus Nominees Pty Ltd assigned its rights under its existing loan to Denise Hutton. The loans accrue interest at a rate of 12 per cent per annum, are at call and are secured by a charge over the assets of the Group.
The repayment of loans in shares is based on the market value of the shares at that time.
The Company has repaid part of the loans subsequent to year end as part of an entitlements issue – refer note 31.
(ii) Guy Westbrook Loan
Guy Westbrook loaned the Company a total of $275,000 during the period on a short term non-interest bearing basis.
The repayment of loans in shares is based on the market value of the shares at that time.
The Company has drawn and repaid further amounts subsequent to year end - refer note 31.
23 Employee benefits
Current
Consolidated Company
In thousands of AUD 2009 2008 2009 2008
Provision for annual leave 83 55 3 3
(i) Defined superannuation contribution funds
The Group makes contributions to defined contribution superannuation funds. The amount recognised as an expense during the period was $108,000 (2008: $82,000).
(ii) Share based payments
Other than as stated in Note 22, no share based payments were made to employees during the period.
For
per
sona
l use
onl
y

44 | P a g e
24 Share capital
Company
Ordinary
Shares Options
2009 2008 2009 2008
On issue at 1 July (i) 59,255,704 51,554,753 6,309,055 5,979,300
Issued for cash consideration (ii) 49,030,723 7,500,000 - -
Issued for no cash consideration (ii) 1,100,000 200,000 10,000,000 5,000,000
Options exercised - 951 - (951)
Options lapsed - - - (4,669,294)
On issue at 30 June – fully paid 109,386,427 59,255,704 16,309,055 6,309,055
(i) During July 2008 the issued capital of the company was consolidated on a 10:1 basis. Shares and options within
this report are disclosed on a post-consolidated basis.
(ii) Share issues $ in thousands of AUD
Shares
No
Cash consideration
$
Creditor offset
$
Loan offset
$
For services
$
Total
$
Placements
8,800,000
708
-
-
708
Entitlement Issue 40,230,723 1,500 650 263 - 2,413 Paterson Securities Ltd
1,100,000 - - - 66 66
Total 50,130,723 2,208 650 263 66 3,187
An amount of $788,000 payable by the Company to Denise Hutton and Maxima Pearling Pty Ltd, both related parties of the Company, was settled through the issue of 13,140,571 ordinary shares under the entitlements issue completed during the reporting period. Of this amount, $650,000 related to a trade creditor balance with Maxima Pearling Pty Ltd, a related party, and a further $138,000 related to repayment of interest bearing loans.
An amount of $275,000 was loaned to the Company by Guy Westbrook, General Manager, during the period. Of this amount, $125,000 was settled through the issue of 2,083,333 ordinary shares in the Company under the entitlements issue completed during the period. The remaining $150,000 was repaid in cash during the reporting period.
The holders of ordinary shares are entitled to receive dividends as declared from time to time and are entitled to one vote per share at meetings of the Company. All shares rank equally with regard to the Company’s residual assets.
Dividends
No dividends were proposed or paid during the current or previous financial year.
25 Share-based payments
(i) Issue of shares During July 2008, the Company issued 1,100,000 shares to Patersons Securities Ltd in payment of fees for corporate services carried out on behalf of the Company to the value of $66,000 at $0.06 per share.
(ii) Issue of share options During July 2008, the Company issued 10,000,000 options to acquire ordinary shares following approval at a General Meeting of shareholders on 18 July 2008. These options were issued to Lasborough Investments Limited for no cash consideration in combination with a placement of shares to them during the previous corresponding period. The fair value of these options has been determined using the Black Scholes valuation model as $526,000, which has been transferred from share capital to reserves during the reporting period.
26 Financial risk management
Exposure to credit and interest rate risks arises in the normal course of the Group’s businesses. The Group and Company is not exposed to foreign currency risk as sales, purchases and borrowings are made in the functional currency, being AUD.
For
per
sona
l use
onl
y

45 | P a g e
The Company and Group have exposure to the following risks from their use of financial instruments:
- Credit risk
- Liquidity risk
- Market risk
- Interest rate risk This note presents information about the Company’s and Group’s exposure to each of the above risks, their objectives, policies and processes for measuring and managing risk, and the management of capital. Further quantitative disclosures are included throughout this financial report. The Board of Directors has overall responsibility for the establishment and oversight of the risk management framework. Risk management policies are established to identify and analyse the risks faced by the Company and Group, to set appropriate risk limits and controls, and to monitor risks and adherence to limits. Risk management policies and systems are reviewed to reflect changes in market conditions and the Company’s and Group’s activities. The Company and Group, through their training and management standards and procedures, aim to develop a disciplined and constructive control environment in which all employees understand their roles and obligations.
(i) Credit risk
Credit risk is the risk of financial loss to the Group if a customer or counterparty to a financial instrument fails to meet its contractual obligations, and arises principally from the Group’s receivables from customers and investment securities. For the Company it arises from receivables due from its subsidiary companies.
Exposure to credit risk
The carrying amount of the Group’s financial assets represents the maximum credit exposure. The Groups maximum exposure to credit risk at the reporting date was:
Carrying amount
In thousands of AUD 2009 2008
Trade and other receivables 575 896
Current tax assets 661 405
Cash and cash equivalents 89 310
1,325 1,611
Trade and other receivables
The Company’s and Group’s exposure to credit risk is influenced mainly by the individual characteristics of each customer. The demographics of the Group’s customer base, including the default risk of the industry. The Group’s revenue is not significantly attributable to sales transactions with a single customer. Goods are sold subject to retention of title clauses, so that in the event of non-payment the Group may have a secured claim. The Group does not require collateral in respect of trade and other receivables. The Group’s maximum exposure to credit risk for trade receivables at the reporting date by geographic region, being within Australia, was $535,000 (2008: $706,000). All sales are made to wholesale customers. The Company does not carry any trade receivables (2008: nil).
For
per
sona
l use
onl
y

46 | P a g e
Impairment losses
The Group’s receivables are past due $458,000 (2008: $384,000). The ageing of the Group’s receivables at the reporting date was:
Gross Impairment Gross Impairment
In thousands of AUD 2009 2009 2008 2008
Not past due 77 - 322 -
Past due 0-30 days 116 - 384 -
Past due 31-120 days 92 - - -
Past due 121 days 250 - - -
535 - 706 -
Based on historic default rates, the Group believes that no impairment is necessary in respect of trade receivables not past due or past due as these amounts relate to customers that have a good credit history with the Group.
(ii) Liquidity risk
Liquidity risk is the risk that the Group will not be able to meet its financial obligations as they fall due. The Group’s approach to managing liquidity is to ensure, as far as possible, that it will always have sufficient liquidity to meet its liabilities when due, under both normal and stressed conditions, without incurring unacceptable losses or risking damage to the Group’s reputation. The Group projects revenue and costs, which assists it in monitoring cash flow requirements and optimising its cash return on investments. Typically the Group seeks to ensure that it has sufficient cash on demand to meet expected operational expenses for a period of at least 30 days, including the servicing of financial obligations; this excludes the potential impact of extreme circumstances that cannot reasonably be predicted, such as natural disasters. The following are the contractual maturities of financial liabilities, including estimated interest payments and excluding the impact of netting agreements:
Consolidated 2009
In thousands of AUD
Carrying amount
Contractual cash flows
6 months or less
6-12 months 1-2 years 2-5 years
More than 5 years
Non-derivative financial liabilities
Secured loans 2,712 2,712 2,712 - - - -
Trade and other payables
1,593 1,593 1,593 - - - -
4,305 4,305 4,305 - - - -
Consolidated 2008
In thousands of AUD
Carrying amount
Contractual cash flows
6 months or less
6-12 months 1-2 years 2-5 years
More than 5 years
Non-derivative financial liabilities
Secured loans 1,000 1,070 - 1,070 - - -
Trade and other payables
2,525 2,525 2,525 - - - -
3,525 3,595 2,525 1,070 - - -
For
per
sona
l use
onl
y

47 | P a g e
Company 2009
In thousands of AUD
Carrying amount
Contractual cash flows
6 months or less
6-12 months 1-2 years 2-5 years
More than 5 years
Secured loans 2,712 2,712 2,712 - - - -
Trade and other payables
172 172 172 - - - -
2,884 2,884 2,884 - - - -
Company 2008
In thousands of AUD
Secured loans 1,000 1,070 - 1,070 - - -
Trade and other payables
398 398 398 - - - -
1,398 1,468 398 1,070 - - -
(iii) Market risk
Market risk is the risk that changes in market prices, such as interest rates will affect the Group’s income or the value of its holdings of financial instruments. The objective of market risk management is to manage and control market risk exposures within acceptable parameters, while optimising the return.
(iv) Interest rate risk
At the reporting date the interest rate profile of the Company’s and the Group’s interest-bearing financial instruments was:
Consolidated Carrying amount
Company Carrying amount
In thousands of AUD 2009 2008 2009 2008
Fixed rate instruments
Financial assets 89 310 70 213
Financial liabilities (2,712) (1,000) (2,712) (1,000)
(2,623) (690) (2,642) (787)
Fair value sensitivity analysis for fixed rate instruments
The Group does not account for any fixed rate financial assets and liabilities at fair value through profit or loss. Therefore a change in interest rates at the reporting date would not affect profit or loss.
A change of 100 basis points in interest rates would have increased or decreased the Group’s equity by an immaterial amount in the current and prior period.
Fair values
Fair values versus carrying amounts
The fair value of financial assets and liabilities, together with the carrying amounts shown in the balance sheet, are as follows:
Consolidated 2009 2008
In thousands of AUD Carrying amount
Fair value Carrying amount
Fair value
Trade and other receivables 575 575 896 896
Current tax assets 661 661 405 405
Cash and cash equivalents 89 89 310 310
Secured loans (2,712) (2,712) (1,000) (1,000)
Trade and other payables (1,593) (1,593) (2,525) (2,525)
(2,980) (2,980) (1,914) (1,914)
For
per
sona
l use
onl
y

48 | P a g e
Company 2009 2008
In thousands of AUD Carrying amount
Fair value Carrying amount
Fair value
Trade and other receivables 30 30 - -
Current tax assets 661 661 405 405
Cash and cash equivalents 70 70 213 213
Loans to subsidiaries 5,204 5,204 8,819 8,819
Secured loans (2,712) (2,712) (1,000) (1,000)
Trade and other payables (172) (172) (398) (398)
3,081 3,081 8,420 8,420
Interest rates used for determining fair value
Estimated cash flows have not been discounted to determine fair value as all financial assets and liabilities, except for inter-Group assets and liabilities, are expected to be settled within 12 months. Inter-group assets and liabilities are held at no higher than the net asset value of the subsidiary company.
(v) Capital management
The Board’s policy is to maintain a working capital base so as to maintain investor, creditor and market confidence. Practices have been established to ensure: - Capital and operating expenditure and revenue commitments above a certain size obtain prior Board approval; - Financial exposures are controlled; - Business transactions are properly authorised and executed; - The quality and integrity of personnel; and - Financial reporting accuracy and compliance with the financial reporting regulatory framework. There were no changes in the Group’s approach to working capital management during the year. Neither the Company nor any of its subsidiaries are subject to externally imposed capital requirements. Refer Note 2(e) for the directors’ assessment of going concern.
27 Capital and other commitments
In thousands of AUD Consolidated Company
2009 2008 2009 2008
Capital expenditure commitments
Plant and equipment
Contracted but not provided for and payable within one year
601 - 601 -
28 Consolidated entities
Country of Incorporation Ownership interest
2009 2008
Parent entity
Marine Produce Australia Limited
Subsidiaries
Tiger International Management Pty Ltd Australia 100% 100%
MPA Fish Farms Pty Ltd Australia 100% 100%
MPA Marketing Pty Ltd Australia 100% 100%
Tiger International Hatchery Pty Ltd Australia 100% 100%
Aussie Prawns Pty Ltd Australia 100% 100%
Maxima Fish Farms Pty Ltd Australia 100% -
For
per
sona
l use
onl
y

49 | P a g e
As at 1 July 2008, the Group acquired and gained control of Maxima Fish Farms Pty Ltd. This entity did not contribute materially to the results for the period. In the financial statements of the Company, investments in controlled entities are measured at cost less impairment and included with other financial assets. The Company has no jointly controlled entities.
29 Reconciliation of cash flows from operating activities
Consolidated Company
In thousands of AUD 2009 2008 2009 2008
Loss for the period (8,143) (3,545) (8,143) (3,545)
Adjustments for:
Depreciation and amortisation 459 363 19 -
Impairment loss 3,123 1,008 8,804 3,545
Fair value of options issued - 488 - -
Shares issued for services 716 33 716 -
Operating loss before changes in working capital and provisions
(3,845) (1,653) 1,396 -
(Increase)/decrease in biological assets 724 (3,018) - -
(Increase)/decrease in trade and other receivables 321 (515) (30) (16)
(Increase)/decrease in current tax assets (256) - (256) -
(Increase)/decrease in loans to controlled entities - - - 654
(Increase)/decrease in inventories (40) (87) - -
(Increase)/decrease in other assets 19 (18) - -
Increase/(decrease) in trade and other payables (278) - (59) -
Increase/(decrease) in provisions and employee benefits
28 9 - (1)
Net cash from/(used in) operating activities (3,327) (3,875) 1,051 670
Refer to Notes 22 and 24 for details of non-cash financing and operating transactions involving the issue of shares.
30 Related parties
The following were key management personnel of the Group at any time during the reporting period and unless otherwise indicated in the directors’ report were key management personnel for the entire period:
Non-executive directors Executive directors Executives
Mr M Kennedy (Chairman) Mr N Miller (Managing Director) Mr G Westbrook (General Manager)
Mr J Hutton Ms J Mathie (Secretary)
Dr T Theunissen Mr M Fitzgerald (Chief Financial Officer)
Prof M Doroudi
Individual directors and executives compensation disclosures
Information regarding individual directors and executives compensation and some equity instruments disclosures as permitted by Corporations Regulation 2M.3.03 is provided in the remuneration report section of the directors’ report.
For
per
sona
l use
onl
y

50 | P a g e
Other key management personnel transactions
The aggregate amounts recognised during the year relating to key management personnel and their related parties were as follows:
Key management personnel and their related parties
Transaction Consolidated Company
In AUD 2009 2008 2009 2008
Mr M Kennedy Resource Development Company Pty Ltd
CFO and Secretarial
Services 256,304 12,500 256,304 12,500
Mr J Hutton and Mr N Miller
Maxima Pearling Co Pty Ltd and
Maxima Fish Farms Pty Ltd
Services and materials supplied Cone Bay
534,982 673,621 - -
Mr J Hutton Ustov Pty Ltd
Rent and variables
24,500 24,500 - -
Mr J Hutton Kimberley Palm Factory
Rent and variables
10,000 - - -
Prof M Doroudi Doroudi Consultants
Directors Fees
30,000 21,260 30,000 21,260
Dr T Theunissen Psytec Management Services
Directors Fees
30,000 16,250 30,000 16,250
Amounts receivable from and payable to key management personnel and other related parties at reporting date arising from the transactions were as follows:
Consolidated Company
In AUD 2009 2008 2009 2008
Assets and liabilities arising from the above transaction
Other related parties
Current receivables 116,663 - - -
Key management personnel
Current receivables - - - -
Other related parties
Current payables (471,778) (529,298) - -
Total payments/total liabilities (355,115) (529,298) - -
From time to time, key management personnel of the Company or its controlled entities, or their related entities, may purchase goods from the Group. These purchases are of the same terms and conditions as those entered into by other consolidate entity employees or customers and are trivial or domestic in nature. Subsidiaries
Loans are made by the Company to wholly owned subsidiaries. With the exception of the specific transactions noted below, loans outstanding between the Company and its controlled entities are callable on demand, have no fixed date of repayment and are non-interest bearing. To 30 June 2009, such loans to subsidiaries totalled $21,245,000 (2008: $16,142,000). These loans have been recognised as a non-current receivable of $5,204,000 (2008: $8,819,000) after provision for non-recovery. Interest-free loans made by the Company to its subsidiaries are repayable on demand. F
or p
erso
nal u
se o
nly

51 | P a g e
Shares and options over equity instruments
There are no options over ordinary shares in Marine Produce Australia Limited held, directly, indirectly or beneficially, by key management personnel, including their related parties at balance date or during the period.
The movement during the reporting period in the number of ordinary shares in Marine Produce Australia Limited held, directly, indirectly or beneficially, by each key management person, including their related parties is as follows: SHARES
Held at 1 July 2008 or date of
appointment
Granted as compensation
Purchases/(Sales) Held at
30 June 2009 or resignation
Directors Mr M Kennedy 1,181,770 - 827,983 2,009,753 Mr J R Hutton 13,812,308 - 13,812,308 27,624,616 Mr N Miller 645,525 - - 645,525 Dr T Theunissen 400,000 - 214,917 614,917 Prof M Doroudi 72,000 - - 72,000 Officers Mr G Westbrook - - 2,083,333 2,083,333 Mr M Fitzgerald - - 63,250 63,250 Ms J Mathie - - - -
Held at 1 July 2007 or date of
appointment
Granted as compensation
Purchases/(Sales) Held at
30 June 2008 or resignation
Directors Mr M Kennedy 1,181,770 - - 1,181,770 Mr J R Hutton 4,212,998 - 9,599,310 13,812,308 Mr N Miller 645,525 - - 645,525 Dr T Theunissen 330,000 - 70,000 400,000 Prof M Doroudi 72,000 - - 72,000 Mr J Drummond 133,000 - (130,000) 3,000 Officers Mr G Westbrook - - - - Ms J Mathie - - - -
31 Subsequent events
Non-renounceable entitlement issue
On 18 August 2009 the company announced and issued a prospectus for a pro rata non-renounceable entitlement issue of 111,386,427 new shares at $0.06 each on the basis of one new share for each 1 share held to raise up to $6,683,000 before costs to reduce debt levels and continue towards commercialisation of the Group’s farming operations. A total of $5,057,000 was raised under the entitlements issue representing 84,278,221 new shares issued – refer Note 2(e) for further details.
Loan funding
During July 2009, an amount of $150,000 was loaned to the Company by Guy Westbrook, General Manager, and repaid during August 2009. During July and August 2009, a total of $2,400,000 was loaned to the Company by Lasborough coinciding with its funding level in its entitlement issue underwriting agreement, repaid in full via the issue of shares – refer Note 2(e) for further details.
Issue of shares
During August 2009, 2,000,000 shares at $0.06 per share were issued to management and contractors of the Company in payment of services rendered to the value of $120,000 representing the fair value of services provided and the market price of shares at that time. Other than the matters discussed above, there has not arisen in the interval between the end of the financial year and the date of this report any item, transaction or event of a material and unusual nature likely, in the opinion of the directors of the Company, to affect significantly the operations of the Group, the results of those operations, or the state of affairs of the consolidated entity, in future financial years, other than the concern expressed earlier regarding liquidity and funding.
For
per
sona
l use
onl
y

52 | P a g e
DIRECTORS’ DECLARATION
1. In the opinion of the directors of Marine Produce Australia Limited (“the Company”):
(a) the financial statements and notes, and the Remuneration Report in the Directors’ report, set out on pages 3
to 6, are in accordance with the Corporations Act 2001, including:
(i) giving a true and fair view of the Company’s and the Group’s financial position as at 30 June 2009 and of their performance, for the financial year ended on that date; and
(ii) complying with Australian Accounting Standards (including the Australian Accounting Interpretations)
and the Corporations Regulations 2001;
(b) the financial report also complies with International Financial Reporting Standards as disclosed in note 2(a) (c) as a result of the matters described in note 2(e) there are reasonable grounds to believe that the Company will
be able to pay its debts as and when they become due and payable.
2. The directors have been given the declarations required by section 295A of the Corporations Act 2001 from the General Manager – Operations and Chief Financial Officer for the financial year ended 30 June 2009.
Signed in accordance with a resolution of the directors: Dated at Perth this 30
th day of September 2009.
Miles Kennedy Non-executive Chairman
For
per
sona
l use
onl
y

For
per
sona
l use
onl
y

For
per
sona
l use
onl
y
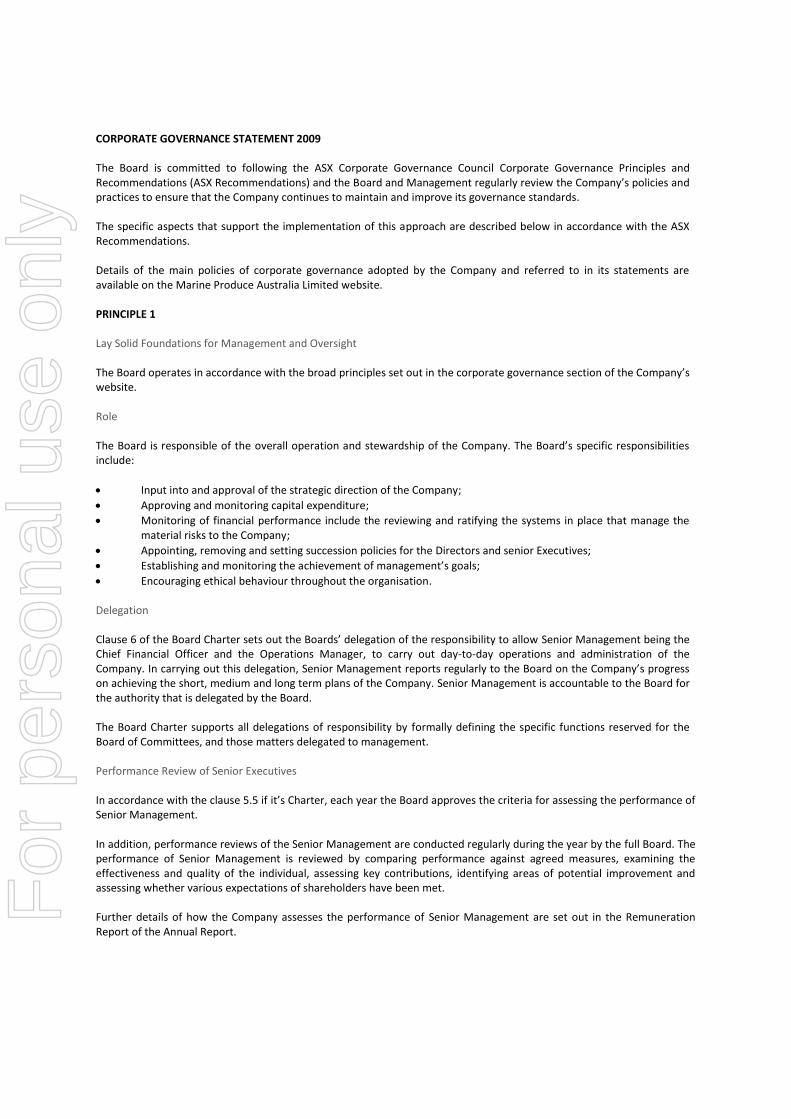
CORPORATE GOVERNANCE STATEMENT 2009 The Board is committed to following the ASX Corporate Governance Council Corporate Governance Principles and Recommendations (ASX Recommendations) and the Board and Management regularly review the Company’s policies and practices to ensure that the Company continues to maintain and improve its governance standards. The specific aspects that support the implementation of this approach are described below in accordance with the ASX Recommendations. Details of the main policies of corporate governance adopted by the Company and referred to in its statements are available on the Marine Produce Australia Limited website. PRINCIPLE 1 Lay Solid Foundations for Management and Oversight The Board operates in accordance with the broad principles set out in the corporate governance section of the Company’s website. Role The Board is responsible of the overall operation and stewardship of the Company. The Board’s specific responsibilities include:
Input into and approval of the strategic direction of the Company;
Approving and monitoring capital expenditure;
Monitoring of financial performance include the reviewing and ratifying the systems in place that manage the material risks to the Company;
Appointing, removing and setting succession policies for the Directors and senior Executives;
Establishing and monitoring the achievement of management’s goals;
Encouraging ethical behaviour throughout the organisation.
Delegation Clause 6 of the Board Charter sets out the Boards’ delegation of the responsibility to allow Senior Management being the Chief Financial Officer and the Operations Manager, to carry out day-to-day operations and administration of the Company. In carrying out this delegation, Senior Management reports regularly to the Board on the Company’s progress on achieving the short, medium and long term plans of the Company. Senior Management is accountable to the Board for the authority that is delegated by the Board. The Board Charter supports all delegations of responsibility by formally defining the specific functions reserved for the Board of Committees, and those matters delegated to management. Performance Review of Senior Executives In accordance with the clause 5.5 if it’s Charter, each year the Board approves the criteria for assessing the performance of Senior Management. In addition, performance reviews of the Senior Management are conducted regularly during the year by the full Board. The performance of Senior Management is reviewed by comparing performance against agreed measures, examining the effectiveness and quality of the individual, assessing key contributions, identifying areas of potential improvement and assessing whether various expectations of shareholders have been met. Further details of how the Company assesses the performance of Senior Management are set out in the Remuneration Report of the Annual Report.
For
per
sona
l use
onl
y

PRINCIPLE 2 Structure the Board to Add Value Board Composition The Board strives to ensure that it is comprised of strongly performing individuals of the utmost integrity whose complementary skills, experience, qualifications and personal characteristics are suited to the Company’s needs. The Company’s Constitution provides for a minimum of three and a maximum of ten Directors. At the commencement of the 2009 financial year, the Board comprised four Directors. A profile of each Director, including their skills, experience, relevant expertise, special responsibilities and the date each Director was appointed to the Board of the Company is set out in the Directors’ Report of the 2009 Annual Report. Independence At present the Board does not comprise a majority of independent directors. The Board defines ‘independence’ in accordance with the ASX Recommendations. In order to ensure that any ‘interests’ of a Director in a matter to be considered by the Board are known by each Director, each Director had contracted with the Company to disclose any relationships, duties or interests held that may give rise to a potential conflict. Directors are required to adhere strictly to constraints on their participation and voting in relation to any matters in which they may have an interest. Each Director is required by the Company to declare on an annual basis the details of any financial or other relevant interests that they may have in the Company. The Chairman Our Chairman is a Non-Executive Director. The Chairman is responsible for the leadership of the Board and to ensure that the Board functions effectively. The Nomination and Remuneration Committee The full Board of the Company carries out the duties of the Nomination and Remuneration Committee. Selection and Appointment of Directors The full Board considers and identifies candidates who may be qualified to become Directors. The nomination of all new Directors including the Managing Director is considered by the full Board. The Board assesses the nominees against a range of specific criteria including their experience, professional skills, potential conflicts of interest and the requirement for independence. All new appointments to the Board are subject to shareholder approval. Retirement and Re-election of Directors The Company’s constitution requires one-third of the Directors (rounded down to the next lowest number) to retire by rotation at each general meeting (AGM). In selecting the Directors to retire the Board has regard to a number of factors including the optimal composition of the Board having regard to the on-going needs of the Company, the skills and experience of the Directors, their potential conflict of interests, and the length of time the Director has held office. A Director must retire in any event at the third AGM since he or she was last elected or re-elected. Retiring Directors may offer themselves for re-election. The Managing Director is not subject to retirement by rotation and is not to be taken into account in determining the number of Directors required retiring by rotation. Director Induction and Education The Company has a process to educate new Directors about the nature of the business, current issues, the corporate strategy and the expectations of the Company concerning the performance of the Directors. Directors are given access to continuing education opportunities to update and enhance their skills and knowledge.
For
per
sona
l use
onl
y

It is the practice of Directors to visit the Company’s aquaculture sites and meet with management to gain a better understanding of the business on a regular basis. New Directors also receive a letter of appointment which outlines their main responsibilities and provides new Directors with a broad range of information about the Company. Independent Professional Advice and Access to Company Information Directors have a right to access to all relevant Company information and, subject to prior consultation with the Chairman, may seek independent advice from suitably qualified advisors at the Company’s expense. Evaluating Board Performance The criterion for the evaluation of each Director is their contribution to specific Board objectives, including the following:
Setting corporate strategies;
Identification, analysis and responses to risks and issues;
Monitoring of the Company’s progress against its business objectives;
Understanding and analysis of the Board papers presented by management;
Use of industry, financial and broad knowledge to add value to the deliberations of the Board.
Board Committees The Board considers that the Company is not currently of a size, nor are its affairs of such complexity to justify the formation of separate or special committees at this time. The Board as a whole is able to address the governance aspects of the full scope of the Company’s activities and to ensure that it adherers to appropriate ethical standards. The full Board currently holds meetings at least four times a year and at such other times as may be necessary to address any general or specific matters as required. When Company’s activities increase in size, scope and nature, the appointment of separate or special committees will be reviewed by the Board and implemented if appropriate. PRINCIPLE 3 Promote Ethical and Responsible Decision-Making The Board acknowledges the need for continued maintenance of a professional standard of a corporate governance practice and ethical conduct by all Directors and employees of the Company. The Board and the Company’s employees are expected to uphold the highest levels of integrity and professional behaviour in their relationships with all of the Company’s stakeholders. Code of Conduct The code describes standards for appropriate ethical and professional behaviour for all Directors, employees and contractors working for the Company. The Code of Conduct requires all Directors, employees and contractors to conduct business with the highest ethical standards including compliance with the law and to report any interest that may give rise to a conflict of interest. Breaches of the Code of Conduct are taken seriously by the Company. The Code of Conduct is made available to all employees. Values The Company has also implemented a set of values designed as a guide by the Directors and all employees in their day-to-day dealings with each other, competitors, customers and the community. The values established are summarised under the headings Respect, Integrity, Action and Results. Trading in the Company’s Shares To safeguard against insider trading the Company’s Securities Trading policy prohibits Directors and employees from trading the Company’s securities if they are aware of any information that would be expected to have a material effect on the price of the Company’s securities.
For
per
sona
l use
onl
y

Directors must consult with the Chairman of the Board, or in his absence or conflict, the Deputy Chairman, before dealing in shares or other securities of the Company. Dealings (whether purchases or sales) in the Company’s shares or other securities by related personnel may not be carried out other than in the dealing “window”, being the period commencing 2 days and ending 2 days following the date of announcement of the Company annual or half yearly results or a major announcement leading to a fully informed market. “Major” is defined as an announcement that may as a direct result, affect the share price, or an announcement affecting the operations of the Company. If within that period any further announcement arises that may separately affect the share price, the Chairman or in his absence the Deputy may impose a lock-down period on the ability to trade. All related persons must give details of any acquisitions or disposal of shares or other securities in the Company, within one business day to the Company Secretary of the Company. All related persons must ensure that they at all times observe the insider trading rules of the Corporations Act. The Company discloses to ASX any transaction conducted by the Directors in the Company’s securities in accordance with the ASX Listing Rules. PRINCIPLE 4 Safeguard Integrity in Financial Reporting The full Board forms the Company’s Audit Committee. The Board acknowledges that it does not at this stage comply with ASX recommendation 4.1. PRINCIPLE 5 Make Timely Balanced Disclosure The Company is committed to providing relevant up-to-date information to its shareholders and the broader investment community in accordance with the continuous disclosure requirements under the ASX Listing Rules and the Corporations Act. The Board has authorised the Chief Financial Officer and Company Secretary as the Disclosure Officers, to ensure that information is released by the Company in a timely and accurate fashion. To supplement the Continuous Disclosure Policy the Board has also approved Disclosure Protocols and Procedures to provide further guidance to staff on understanding and complying with the Company’s continuous disclosure obligations. PRINCIPAL 6 Respect the Right of Shareholders The Board aims to ensure that shareholders are informed of all information necessary to assess the performance of the Company. The Board Shareholder Communication Policy which outlines the process through which the Company will endeavour to ensure timely and accurate information is provided equally to all shareholders. Information is communicated to Shareholders through:
The annual report which is available to all shareholders (in both hardcopy and electronic form);
The release to the ASX and on the Company’s website, of the half yearly financial report, quarterly production and activities report and other information, including ASX releases in accordance with the Company’s continuous disclosure obligations;
Providing information on the Company’s website about the Company, including the Charters that govern the Board and Board Committees, the Company’s key policies, statutory reports of the last 2 years and releases to the ASX;
The release to ASX and the Company’s website of all Company presentations made during briefings conducted with analysts and institutions from time to time.
For
per
sona
l use
onl
y

Shareholders are also encouraged to attend the AGM and use the opportunity to ask questions. Questions can be lodged prior to the meeting by completing the relevant form accompanying the notice of meeting. The Company makes every endeavour to respond to the most commonly asked questions. The external auditor attends the meeting and is available to answer questions in relation to the conduct of audit. PRINCIPLE 7 Recognise and Manage Risk The Company is exposed to numerous risks across its business, most of which are common to the mining industry. The Company’s commitment and approach to managing these risks is outlined in the Company’s Risk Management Policy and is on the Company’s website. The Board receives reporting on the control mechanisms which are designed and implemented by management to ensure that the safety, environment, legal and reputation risks faced by the Company are identified, assessed and managed. The Board also reviews and assesses the adequacy of the Company’s internal control and financial management systems and accounting and business policies. The Board is given further assurance on the Company’s financial management systems through the Company’s independent internal audit function. Senior management are responsible for risk management in their respective areas of accountability. They ensure that procedures exist to monitor risks and, through observation and audit, gain assurance that affective controls are implemented and consistently applied. The Board has recognised the need to implement a common risk management framework across the group. The Company is in the process of developing this framework. This process includes the implementation at all sites of the Company’s Sustainability Standards. These are comprehensive sets of standards that provide a systematic approach to the management of Safety, Health, Environment and Community related risks. Management Reporting and Certifications Management reports to the Board on the material business risks faced by the Company, the effectiveness of the Company’s risk management and internal control system, and the Company is management of its material business risks. The Chief Executive Officer and Chief Financial Officer has declared in writing to the Board that the financial records of the Company for 2009 have been properly maintained and present a true and fair view of the Company’s financial position and financial results, in accordance with the Corporations Act and the relevant accounting standards. The reporting and control mechanisms support the written certifications given by the Chief Executive Officer and Chief Financial Officer to the Board annually, that the Company’s financial reports are based on a sound system of risk management and internal control and that the system is operating effectively in all material respects in relation to financial reporting risks. PRINCIPLE 8 Remunerate Fairly and Responsibly The Board provides recommendations and directions for the Company’s remuneration practices. The Board, as the Remuneration Committee, ensures that a significant proportion of each Senior Manager’s Remuneration is linked to his or her performance and the Company’s performance. Performance reviews are conducted regularly to assess the performance of Senior Managers and to determine the proportion of remuneration that will be ‘at risk’ for the upcoming year. For further details on this see Remuneration Report within the 2009 Annual Report. Board Remuneration The total annual remuneration paid to Non-Executive Directors may not exceed the limit set by the shareholders at an AGM. The remuneration of the Non-Executive Directors is fixed rather than variable. Further details in relation to Director Remuneration are set out in the Remuneration Report within the 2009 Annual Report.
For
per
sona
l use
onl
y

australian business number
70 091 805 480
board of directors
miles kennedy – non-executive chairman
john hutton – non-executive director
tor theunissen – non-executive director
company secretary
jean mathie
registered office and principleplace of business
12 walker avenue
west perth 6005
western australia
postal address
po box 1008
west perth 6872
western australia
communication details
telephone: (+61 8 ) 9321 9200
facsimile: (+61 8 ) 9321 9300
email: [email protected]
web: www.marineproduce.com
asx code
mpa ordinary fully paid shares
auditors
KPMG
central park
152 – 158 st georges terrace
perth 6000
western australia
lawyers
drummond law
48 matheson road
applecross 6153
western australia
telephone: (+61 8 ) 9364 9016
facsimile: (+61 8 ) 9364 7973
email: [email protected]
share registry
security transfer registrars pty ltd
770 canning highway
applecross 6153
western australia
telephone: (+61 8 ) 9315 2333
facsimile: (+61) 9315 2233
securities exchange
australian securities exchange
2 the esplanade
Perth 6000
western australia
corporate directoryF
or p
erso
nal u
se o
nly


