
Supply Chain Videocast
Ford's New Approach to Supplier Risk Management
Today’s Panel
• Dr. David Simchi-Levi
– Professor of Engineering Systems,
MIT
• Michael Sanders
– Procurement Manager, Ford
What We’ll Cover …
• Introduction
The Risk Exposure Index
• Supplier Segmentation
Automotive Manufacturer
• Wrap-up
3
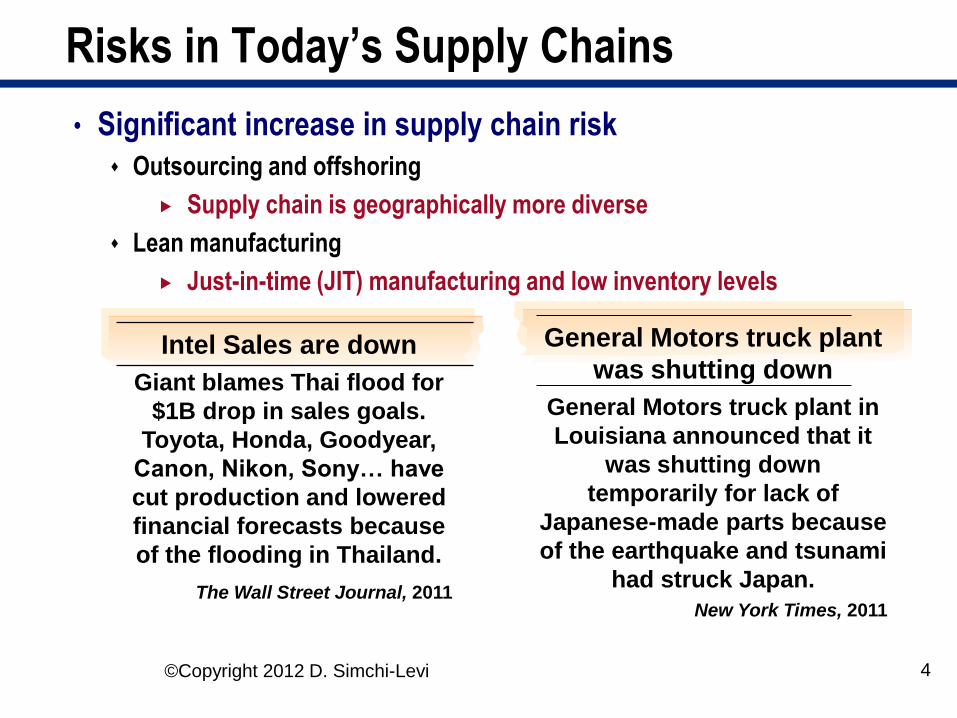
Risks in Today’s Supply Chains
• Significant increase in supply chain risk
Outsourcing and offshoring
Supply chain is geographically more diverse
Lean manufacturing
Just-in-time (JIT) manufacturing and low inventory levels
4
General Motors truck plant
was shutting down
General Motors truck plant in
Louisiana announced that it
was shutting down
temporarily for lack of
Japanese-made parts because
of the earthquake and tsunami
had struck Japan.
New York Times, 2011
Intel Sales are down
Giant blames Thai flood for
$1B drop in sales goals.
Toyota, Honda, Goodyear,
Canon, Nikon, Sony… have
cut production and lowered
financial forecasts because
of the flooding in Thailand.
The Wall Street Journal, 2011
©Copyright 2012 D. Simchi-Levi

Risks in Today’s Supply Chains
• Significant increase in supply chain risk
Outsourcing and offshoring
Supply chain is geographically more diverse
Lean manufacturing
Just-in-time (JIT) manufacturing and low inventory levels
0
50
100
150
200
250
Quake/Tsunami Floods Tornadoes Floods
Japan Thailand USA Australia
Natural Disasters 2011 Cost ($B)
5

Worldwide Natural Disasters 1980-2011 Source: Munich Re
Hurricane Katrina,
2005
6

Supply Chain Disruption and Stock Performance
• Mattel, the world’s largest toy maker;
• Recalled 18 million toys made in China on August 2007;
• The reason: hazards such as lead paint
$-
$0.50
$1.00
$1.50
$2.00
$2.50 2
00
3Q
3
20
03
Q4
20
04
Q1
20
04
Q2
20
04
Q3
20
04
Q4
20
05
Q1
20
05
Q2
20
05
Q3
20
05
Q4
20
06
Q1
20
06
Q2
20
06
Q3
20
06
Q4
20
07
Q1
20
07
Q2
20
07
Q3
20
07
Q4
20
08
Q1
20
08
Q2
20
08
Q3
20
08
Q4
Hasbro
Mattel
Stock Performance ($1 invested in 2003)
Product Recall
7

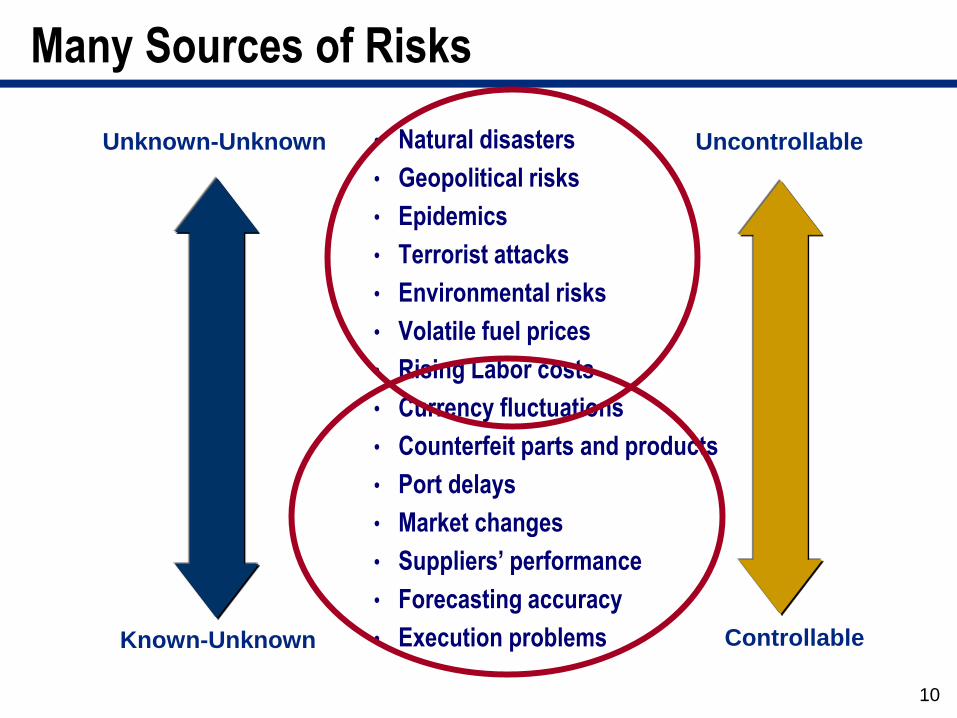
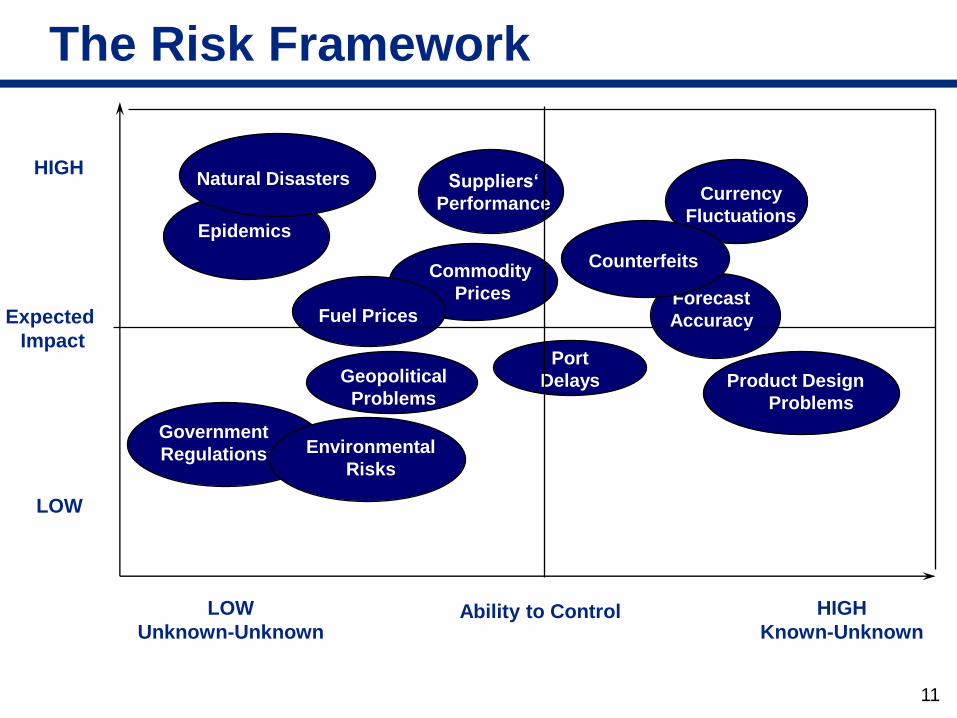
Many Sources of Risks
• Natural disasters
• Geopolitical risks
• Epidemics
• Terrorist attacks
• Environmental risks
• Volatile fuel prices
• Rising Labor costs
• Currency fluctuations
• Counterfeit parts and products
• Port delays
• Market changes
• Suppliers’ performance
• Forecasting accuracy
• Execution problems
Unknown-Unknown
Known-Unknown
Uncontrollable
Controllable
8

Many Sources of Risks
• Natural disasters
• Geopolitical risks
• Epidemics
• Terrorist attacks
• Environmental risks
• Volatile fuel prices
• Rising Labor costs
• Currency fluctuations
• Counterfeit parts and products
• Port delays
• Market changes
• Suppliers’ performance
• Forecasting accuracy
• Execution problems
Unknown-Unknown
Known-Unknown
Uncontrollable
Controllable
9
Many Sources of Risks
• Natural disasters
• Geopolitical risks
• Epidemics
• Terrorist attacks
• Environmental risks
• Volatile fuel prices
• Rising Labor costs
• Currency fluctuations
• Counterfeit parts and products
• Port delays
• Market changes
• Suppliers’ performance
• Forecasting accuracy
• Execution problems
Unknown-Unknown
Known-Unknown
Uncontrollable
Controllable
10
Epidemics
Fuel Prices
Geopolitical
Problems
Currency
Fluctuations
Commodity
Prices
Port
Delays Product Design
Problems
Forecast
Accuracy
Suppliers‘
Performance
The Risk Framework
Expected
Impact
Ability to Control LOW
Unknown-Unknown
HIGH
HIGH
Known-Unknown
LOW
Counterfeits
Government
Regulations
Natural Disasters
Environmental
Risks
11

Epidemics
Fuel Prices
Geopolitical
Problems
Currency
Fluctuations
Commodity
Prices
Port
Delays Product Design
Problems
Forecast
Accuracy
Suppliers‘
Performance
The Risk Framework
Expected
Impact
Ability to Control LOW
Unknown-Unknown
HIGH
HIGH
Known-Unknown
LOW
Counterfeits
Government
Regulations
Natural Disasters
Environmental
Risks
12
Epidemics
Fuel Prices
Geopolitical
Problems
Currency
Fluctuations
Commodity
Prices
Port
Delays Product Design
Problems
Forecast
Accuracy
Suppliers‘
Performance
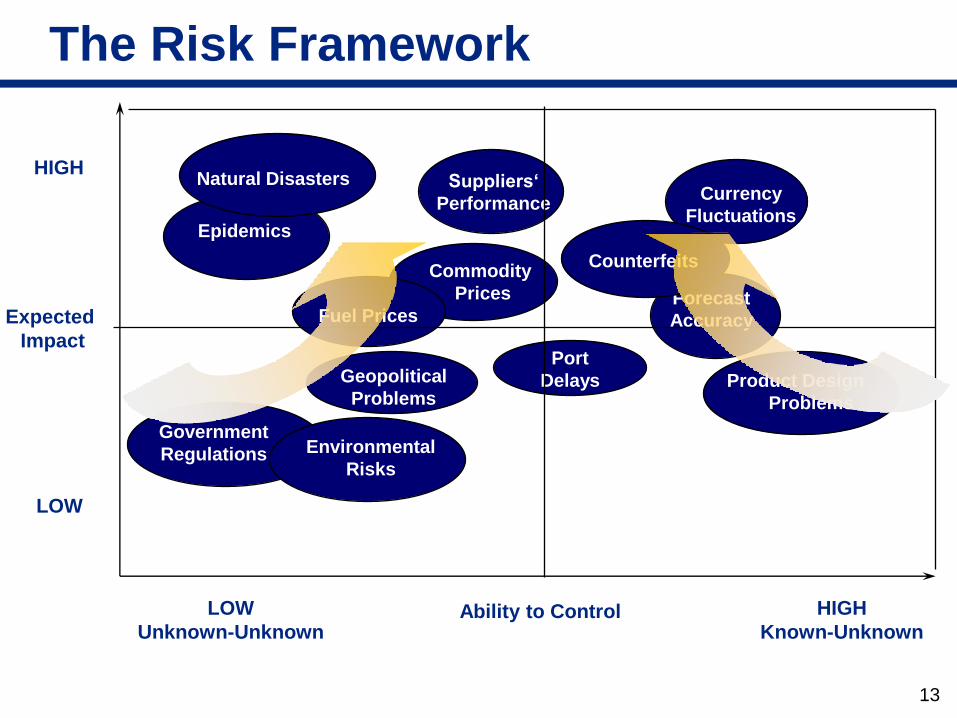
The Risk Framework
Expected
Impact
Ability to Control LOW
Unknown-Unknown
HIGH
HIGH
Known-Unknown
LOW
Counterfeits
Government
Regulations
Natural Disasters
Environmental
Risks
13

Managing Supply Chain Risk: The Challenge
• Very difficult to predict many sources of risk, especially
the unknown-unknown
• Impact of disruption can be devastating
• Large investment in identifying every possible risk in the
supply chain
• Existing tools and techniques have been inadequate
Mostly ad-hoc, intuition, gut feeling
Exposure to risk may reside in unlikely places
May lead to the wrong actions and waste resources
No ability to prioritize mitigation investment
14

Case Study 1: The Risk Exposure Index
• High tech manufacturing company
• Contract manufacturers in Asia
• Assembly plants in North America
• Many suppliers all over the world
• Sells its products directly and through distributors
15

Case Study 1: The Risk Exposure Index
Tier 1 Tier 2+
US Port
Assembly Plants
Assembly Customers
TL
LTL
Distributors
Contract Manufacturers
US Suppliers
Printed Circuit Board
Chipset Manufacturer
Raw Material Suppliers
16
Stores
Distributors
Distribution

Case Study 1: The Risk Exposure Index
Tier 1 Tier 2+
US Port
Assembly Plants
Assembly Customers
TL
LTL
Distributors
Contract Manufacturers
US Suppliers
Printed Circuit Board
Chipset Manufacturer
Raw Material Suppliers
17
Stores
Distributors
• Time-To-Recovery (TTR): The time it takes to recover to full functionality after a disruption
• Financial Impact (FI): Lost sales during TTR
Distribution

Case Study 1: The Risk Exposure Index
Distribution Tier 1 Tier 2+
US Port
Assembly Plants
Assembly Customers
TL
LTL
Distributors
Contract Manufacturers
US Suppliers
Printed Circuit Board
Chipset Manufacturer
Raw Material Suppliers
18
Stores
Distributors
• Time-To-Recovery (TTR): The time it takes to recover to full functionality after a disruption
• Financial Impact (FI): Lost sales during TTR
$400M
$100M $1.5B
$100M $2.5B
$400M
$300M

Case Study 1: The Risk Exposure Index
Distribution Tier 1 Tier 2+
US Port
Assembly Plants
Assembly Customers
TL
LTL
Distributors
Contract Manufacturers
US Suppliers
Printed Circuit Board
Chipset Manufacturer
Raw Material Suppliers
19
Stores
Distributors
• Time-To-Recovery (TTR): The time it takes to recover to full functionality after a disruption
• Financial Impact (FI): Lost sales during TTR
• The Risk Exposure Index (REI) is the maximum FI over all nodes in the supply chain
$400M
$100M $1.5B
$100M $2.5B
$400M
$300M

The Benefits of using the Risk Exposure Index
• It provides a $ measure of risk--it estimate the cost of
risk;
• It is based on the entire network rather;
• It avoids the need to forecast the unknown-unknown;
• It forces a discussion to understand why TTR for similar
facilities or suppliers is different;
• It forces a process to reduce TTR in various stages of
the supply chain;
• It makes sure you have a good understanding of supply
chain dependencies.
20

What We’ll Cover …
• Introduction
The Risk Exposure Index
• Supplier Segmentation
Automotive Manufacturer
• Wrap-up
21

Forecast
Accuracy
Supply
Risk
Competitive
Position: • Advantage
• Parity
• Disadvantage
Innovation Speed
Possible Decisions:
• Dual Sourcing
• Long Term Contracts
• Maximize Flexibility
• Minimize Lead Time
• Minimize Total Landed
Cost
• Option Contracts
• Portfolio Approach
• Strategic Partnering
Financial
Impact
Price
Risk
Drivers of the Procurement Strategy
22
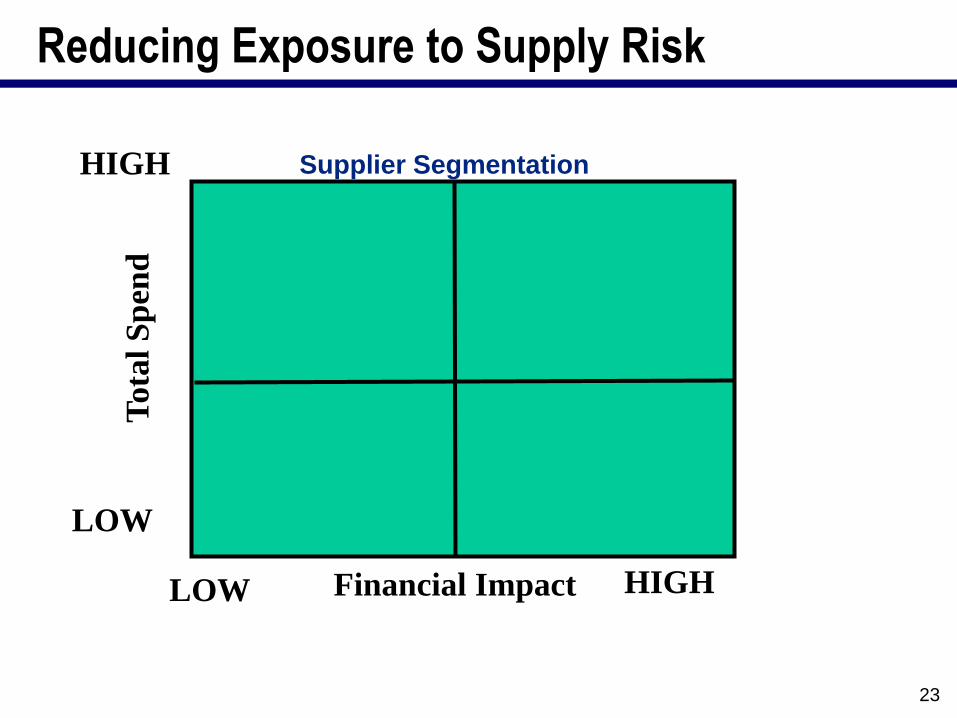
HIGH
LOW
LOW HIGH Financial Impact
Tota
l S
pen
d
Supplier Segmentation
Reducing Exposure to Supply Risk
23

HIGH
LOW
LOW HIGH Financial Impact
• Inventory
• Long term contracts
Tota
l S
pen
d
Supplier Segmentation
Reducing Exposure to Supply Risk
24

HIGH
LOW
LOW HIGH Financial Impact
• Inventory
• Long term contracts
• Partnerships
• Risk sharing contracts
• Track performance
• Share experience
• Business Continuity
Plans
Tota
l S
pen
d
Supplier Segmentation
Reducing Exposure to Supply Risk
25

HIGH
LOW
LOW HIGH Financial Impact
• Inventory
• Long term contracts
• Partnerships
• Risk sharing contracts
• Track performance
• Share experience
• Business Continuity
Plans
Tota
l S
pen
d
Supplier Segmentation
Reducing Exposure to Supply Risk
26

HIGH
LOW
LOW HIGH Financial Impact
• Inventory
• Long term contracts
• Partnerships
• Risk sharing contracts
• Track performance
• Share experience
• Business Continuity
Plans
• Inventory
• Dual sourcing/sites
• Flexibility
• Standard Components
•Track Performance
Tota
l S
pen
d
Supplier Segmentation
Reducing Exposure to Supply Risk
27

Ford Motor Company
• US manufacturing company
• Global Network with plants all over the world
28
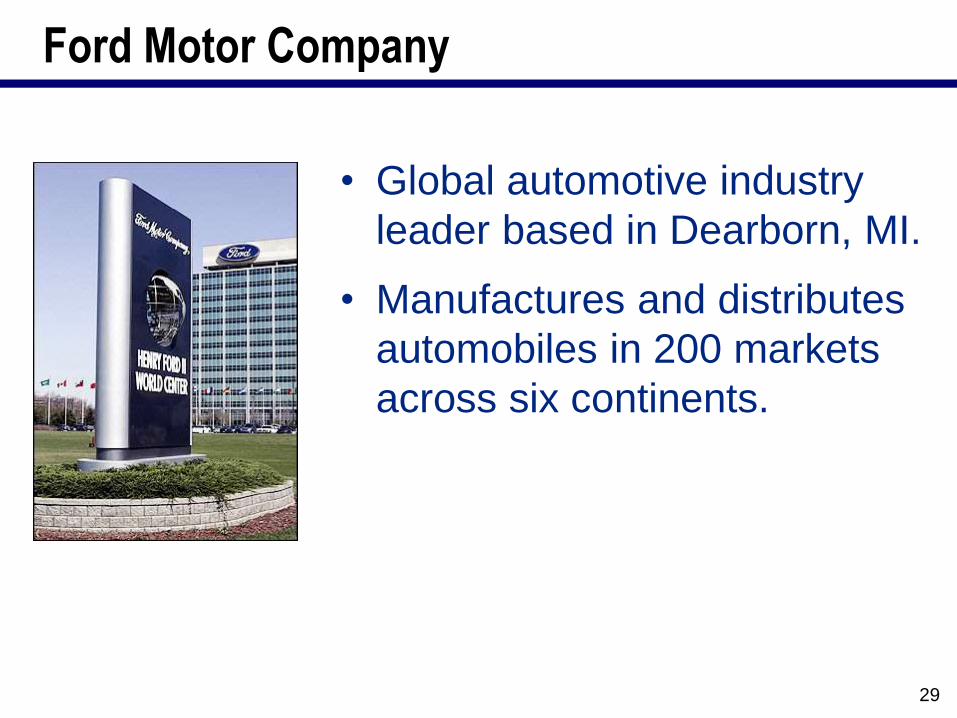
Ford Motor Company
• Global automotive industry
leader based in Dearborn, MI.
• Manufactures and distributes
automobiles in 200 markets
across six continents.
29

Ford Supply Chain
Tier 1 Tier 2 Tier 3+
West Coast
East Coast
North American Assembly Plants
Assembly Dealers
Truck
Train
North American Engine Plants
Transmission Plants
Stamping Plants
APA Suppliers
EU Suppliers
NA Suppliers
Forging Plants
Casting Plants
APA Suppliers
EU Suppliers
NA Suppliers
NA Sheet Steel Suppliers
APA Suppliers
NA Steel Bar Suppliers
EU Suppliers
NA Suppliers
Evonik - CDT PA12
Fuel / Break line suppliers
30

Supplier Segmentation at Ford
• Initial implementation: North America Supply Chain
Exposure index and supplier site costs
• Evaluate on Time to Recover(TTR) for Tier 1 and Tier 2+
suppliers serving North America plants
Two types of TTR:
1. TTR in which the supplier’s production facility is
lost;
2. TTR associated with supplier’s facility and tooling
are lost
Assumed type 1 TTR in this study
• Use Financial Impact information and component price to
identify mitigation strategies
31

The Model—North America Supply Chain
Multi-Tier Network Long Lead times from some suppliers Complex BOM structure Components are shared across multiple
assemblies ~4K Tier 1 suppliers sites ~55K different parts
Two types of TTR information: One in which the supplier’s production facility is lost; second associated with supplier’s facility and tooling are lost.
Tier 2 Tier 1 Assembly Plants Dealers
32
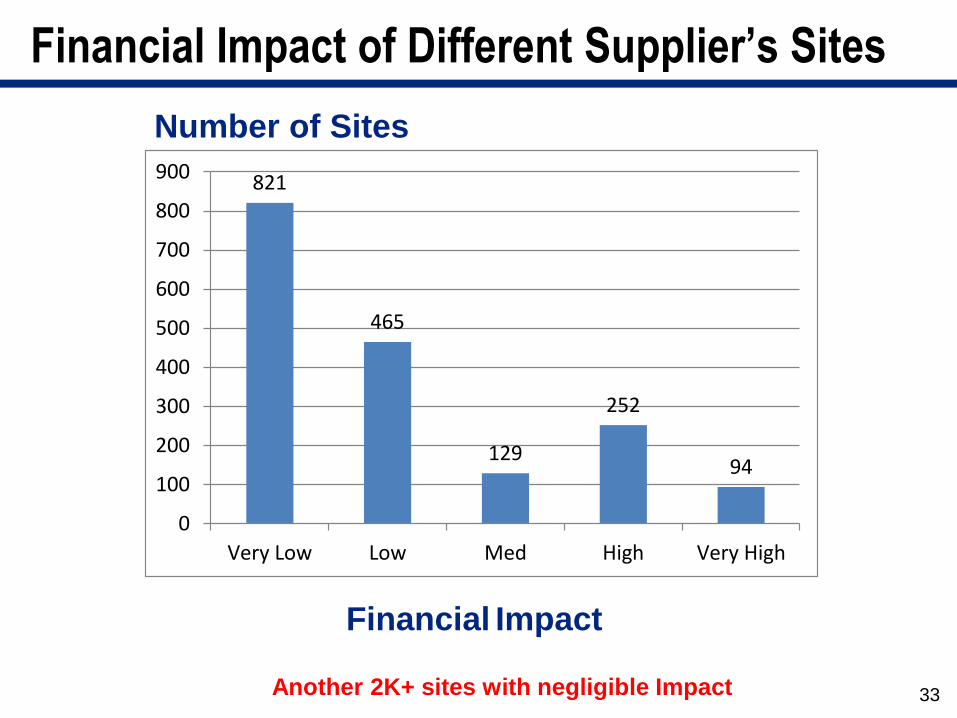
821
465
129
252
94
0
100
200
300
400
500
600
700
800
900
Very Low Low Med High Very High
Financial Impact of Different Supplier’s Sites
Number of Sites
Financial Impact
Another 2K+ sites with negligible Impact 33

20000 40000 60000 80000 100000 120000 140000
Most Important 1000 Supplier Site
Disruption Impact and Total Spend by Supplier Facility
(Number of Vehicles Effected)
To
tal
Sp
en
d b
y S
up
pli
er
Sit
e
Disclaimer: Data shown here is for demonstration only . It does not represent real numbers used in analysis
34
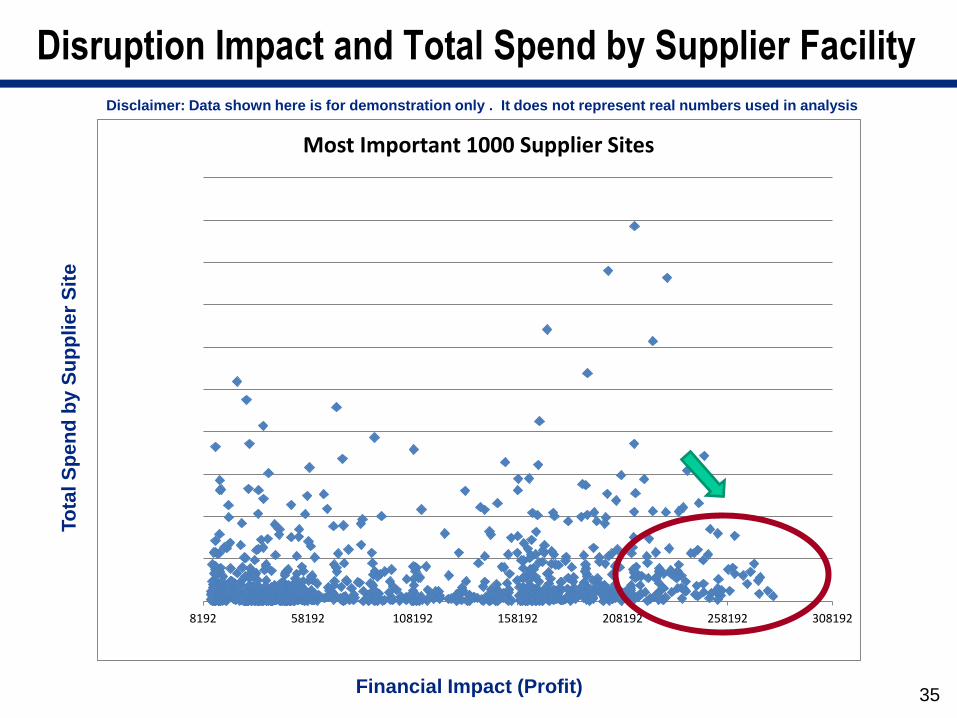
Disruption Impact and Total Spend by Supplier Facility
Financial Impact (Profit)
8192 58192 108192 158192 208192 258192 308192
Most Important 1000 Supplier Sites
To
tal
Sp
en
d b
y S
up
pli
er
Sit
e
Disclaimer: Data shown here is for demonstration only . It does not represent real numbers used in analysis
35

Supplier Segmentation
Financial Impact (Profit)
8192 58192 108192 158192 208192 258192 308192
Most Important 1000 Supplier Sites
To
tal
Sp
en
d b
y S
up
pli
er
Sit
e
Disclaimer: Data shown here is for demonstration only . It does not represent real numbers used in analysis
36

Supplier Segmentation
Financial Impact (Profit)
8192 58192 108192 158192 208192 258192 308192
Most Important 1000 Supplier Sites
To
tal
Sp
en
d b
y S
up
pli
er
Sit
e
• Long Term Contracts
• Track Inventory
• Partnership
• Risk Sharing Contracts
• Track Performance
• Require Multiple Sites
• Inventory
• Dual Sourcing
• New Product Design
Disclaimer: Data shown here is for demonstration only . It does not represent real numbers used in analysis
37

Supplier Segmentation
Financial Impact (Profit)
8192 58192 108192 158192 208192 258192 308192
Most Important 1000 Supplier Sites
To
tal
Sp
en
d b
y S
up
pli
er
Sit
e
• Long Term Contracts
• Track Inventory
• Partnership
• Risk Sharing Contracts
• Track Performance
• Require Multiple Sites
• Inventory
• Dual Sourcing
• New Product Design
Disclaimer: Data shown here is for demonstration only . It does not represent real numbers used in analysis
38
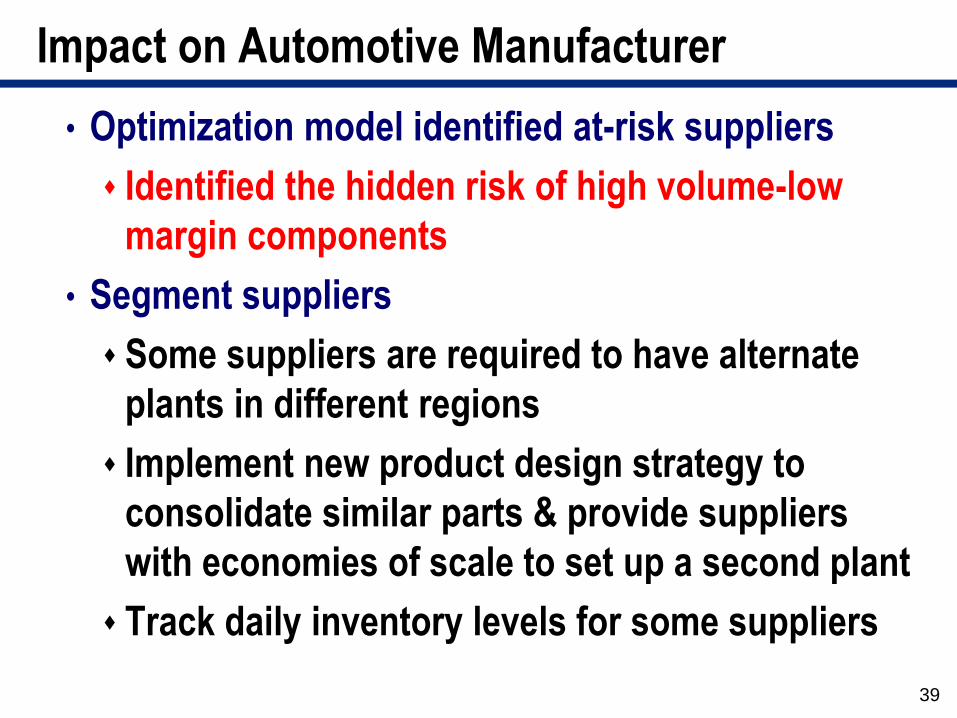
Impact on Automotive Manufacturer
• Optimization model identified at-risk suppliers
Identified the hidden risk of high volume-low
margin components
• Segment suppliers
Some suppliers are required to have alternate
plants in different regions
Implement new product design strategy to
consolidate similar parts & provide suppliers
with economies of scale to set up a second plant
Track daily inventory levels for some suppliers
39
Acknowledgement
• MIT
Prof. David Simchi-Levi
Dr. Yehua Wei (now at Duke)
Dr. William Schmidt (now at Cornel)
• Ford Motor Company
Research and Advanced Engineering
Dr. Oleg Gusikhin, Technical Leader
Dr. Don Zhang, Technical Expert
Purchasing
Keith Combs, Director
Steve Faraci, Manager
Michael Sanders, Manager
IT
Yao Ge, Technical Expert
40

Resources
• Dr. David Simchi-Levi, MIT
– 617-253-6160
• Michael Sanders, Ford
• Dan Gilmore, SCDigest
Copyright SCDigest


