FOREIGN CURRENCY DEBT, DEVALUATION AND RECOVERY IN THE GREAT DEPRESSION
MICHAEL BORDORUTGERS & NBER
CHRISTOPHER M. MEISSNERUNIVERSITY OF CALIFORNIA, DAVIS & NBER

Foreign currency debt thought to raise “financial fragility” (cf. Asian Crisis and 2007-08 in Eastern Europe)
“Original sin” afflicted emergers and even center countries in the 19th century, in the inter-war, and even now
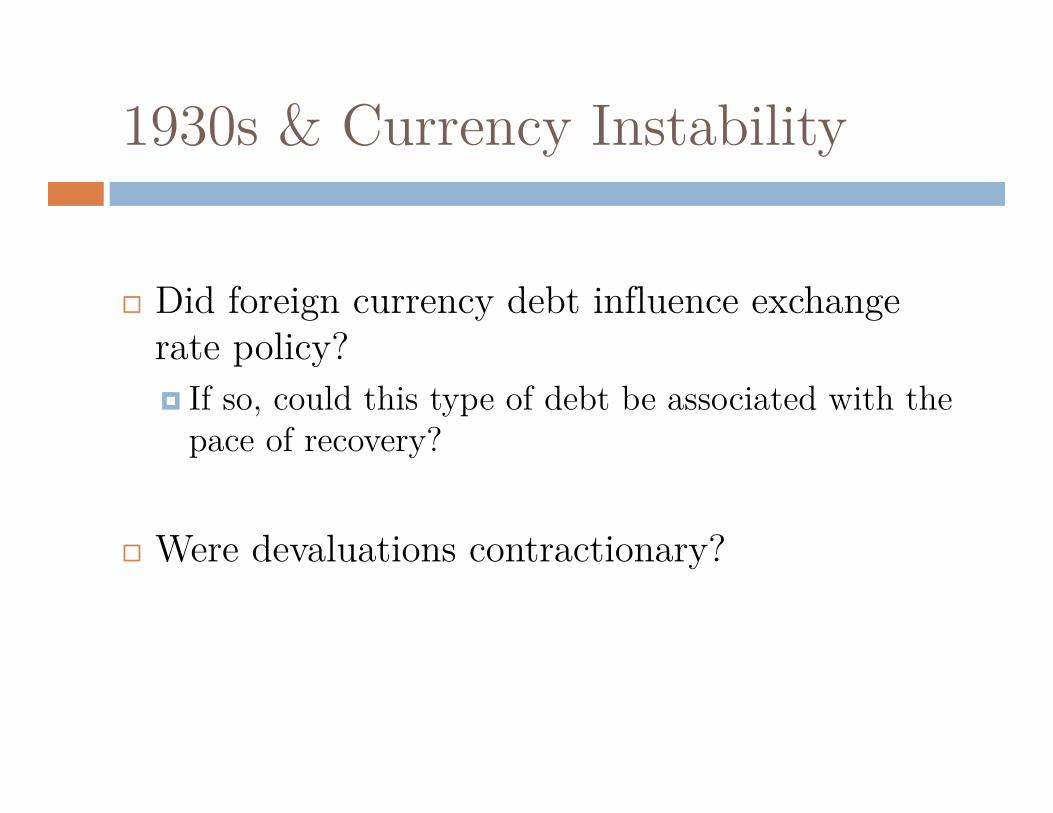
1930s & Currency Instability
Did foreign currency debt influence exchange rate policy? If so, could this type of debt be associated with the
pace of recovery?
Were devaluations contractionary?

Outline
The Great Depression and Exchange Rates Redux The Great Depression and Debt Redux
Modern Views on Devaluations and Output
Foreign Currency Debt and Exchange Rate Policy
Exchange Rates, Foreign Currency Debt and Recovery
(very) Tentative Conclusion
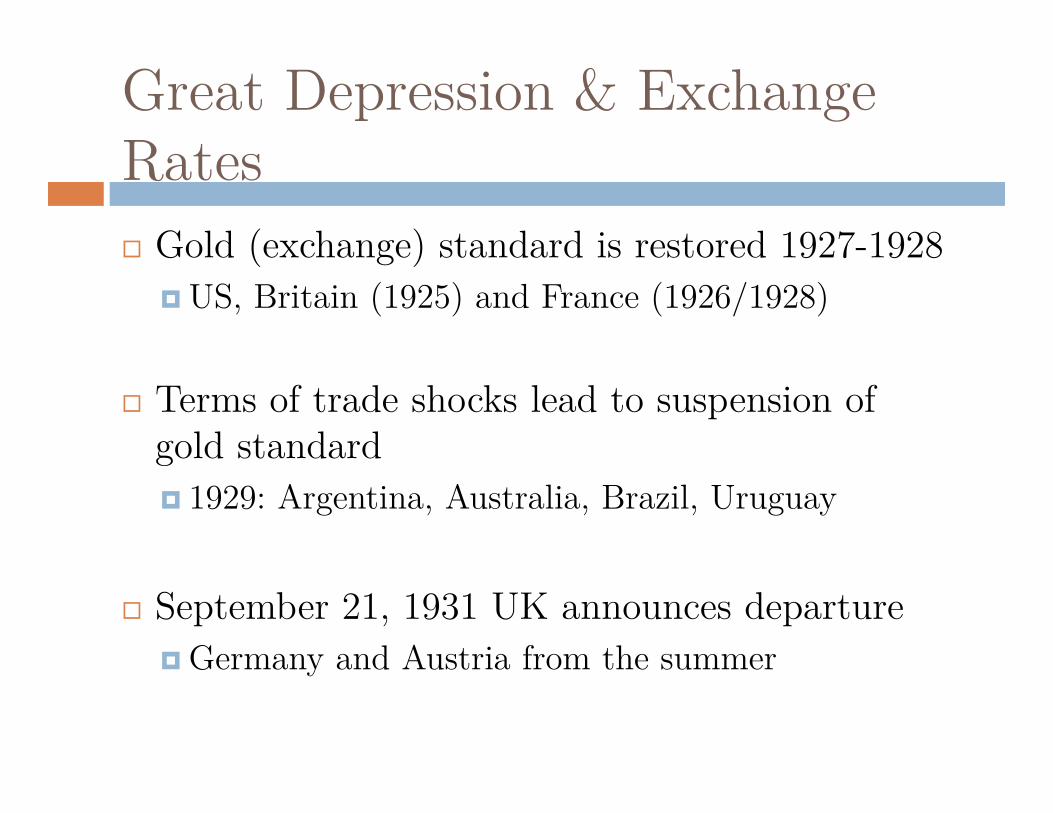
Great Depression & Exchange Rates Gold (exchange) standard is restored 1927-1928
US, Britain (1925) and France (1926/1928)
Terms of trade shocks lead to suspension of gold standard 1929: Argentina, Australia, Brazil, Uruguay
September 21, 1931 UK announces departure Germany and Austria from the summer

0 10 20 30 40Number of Countries on Gold
1940193919381937193619351934193319321931193019291928192719261925192419231922192119201919

Great Depression & Exchange Rates The gold standard transmitted a shock and
delayed recovery (Choudhri and Kochin, 1980; Eichengreen and
Sachs, 1985; Campa, 1990)
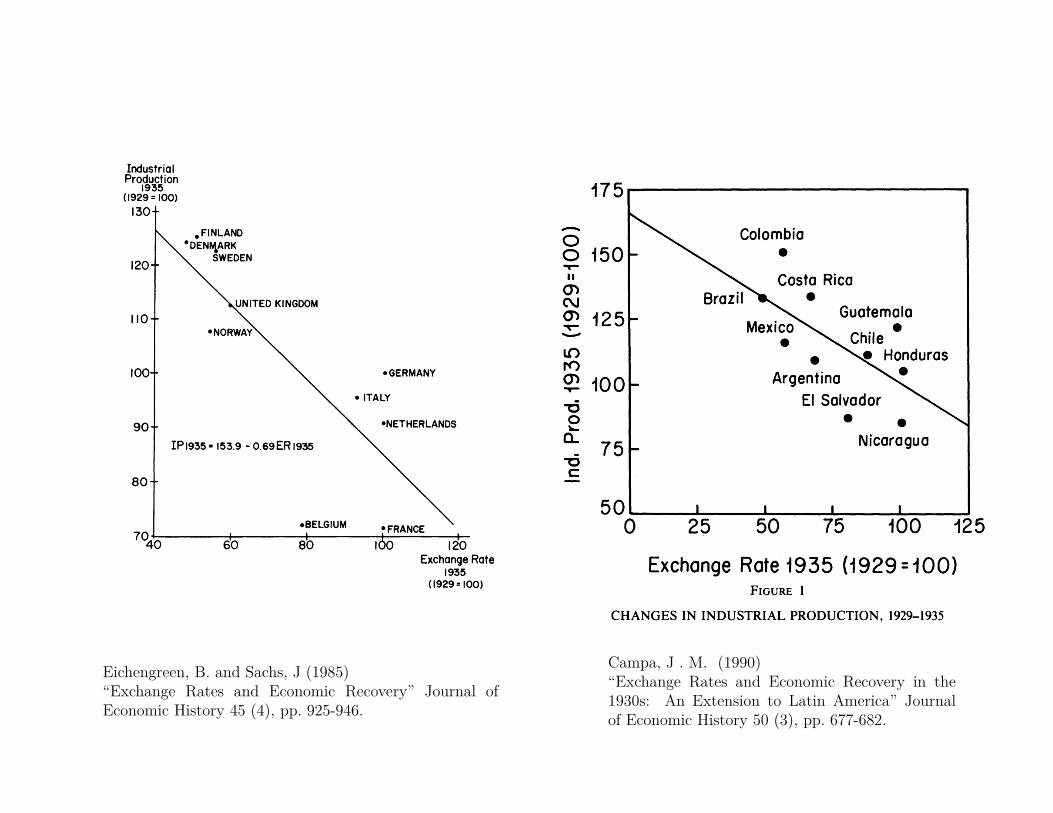
Eichengreen, B. and Sachs, J (1985)“Exchange Rates and Economic Recovery” Journal ofEconomic History 45 (4), pp. 925-946.
Campa, J . M. (1990)“Exchange Rates and Economic Recovery in the1930s: An Extension to Latin America” Journalof Economic History 50 (3), pp. 677-682.

Great Depression & Exchange Rates
But, countries continued to opt for fixed exchange rates Sterling bloc Canada/US Gold Bloc
Depreciation can be contractionary under heavy F.C. debt burdens. So, did the response to exchange rates depend on the level of F.C. debt?
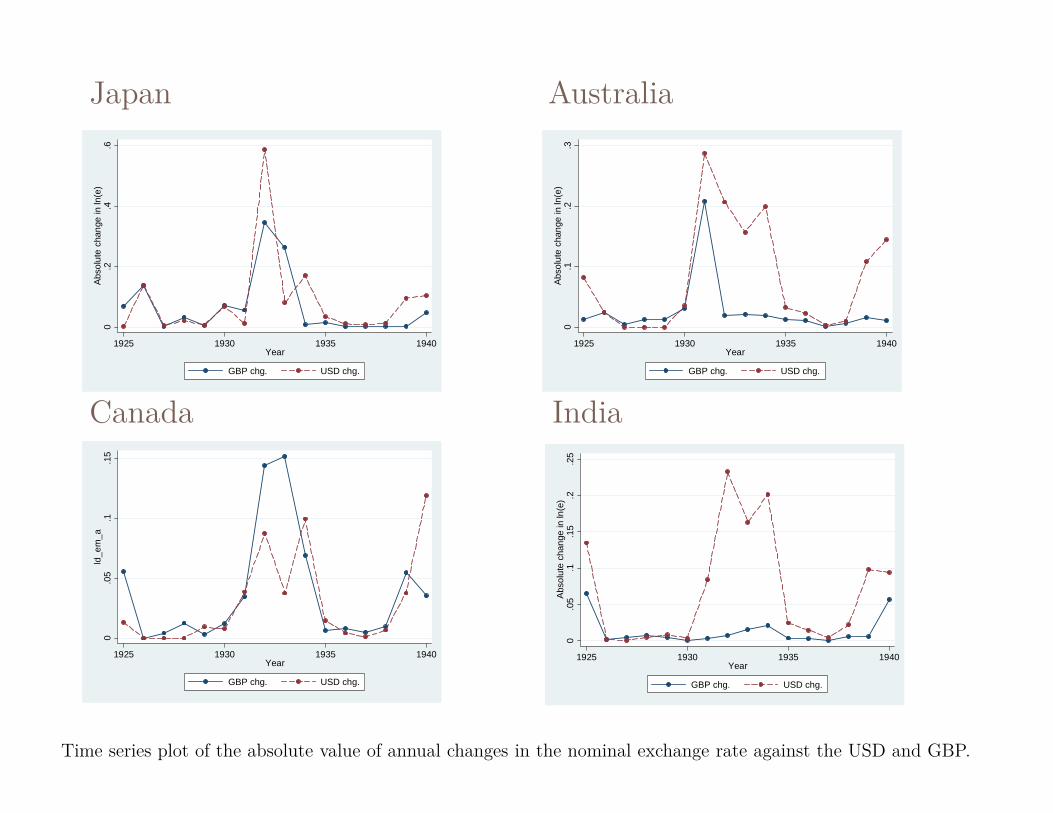
Japan
Time series plot of the absolute value of annual changes in the nominal exchange rate against the USD and GBP.
0.2
.4.6
Abso
lute
cha
nge
in ln
(e)
1925 1930 1935 1940Year
GBP chg. USD chg.
0.1
.2.3
Abso
lute
cha
nge
in ln
(e)
1925 1930 1935 1940Year
GBP chg. USD chg.
Australia0
.05
.1.1
5ld
_em
_a
1925 1930 1935 1940Year
GBP chg. USD chg.
Canada
0.0
5.1
.15
.2.2
5Ab
solu
te c
hang
e in
ln(e
)
1925 1930 1935 1940Year
GBP chg. USD chg.
India

Debt Default and the Great Depression Default commonly seen as a response to (massive) terms
of trade shocks Many in Latin America
Special cases: Germany- War debts Inter-allied war loans (most were forgiven or left
unpaid) USA: abrogates gold clause in 1933
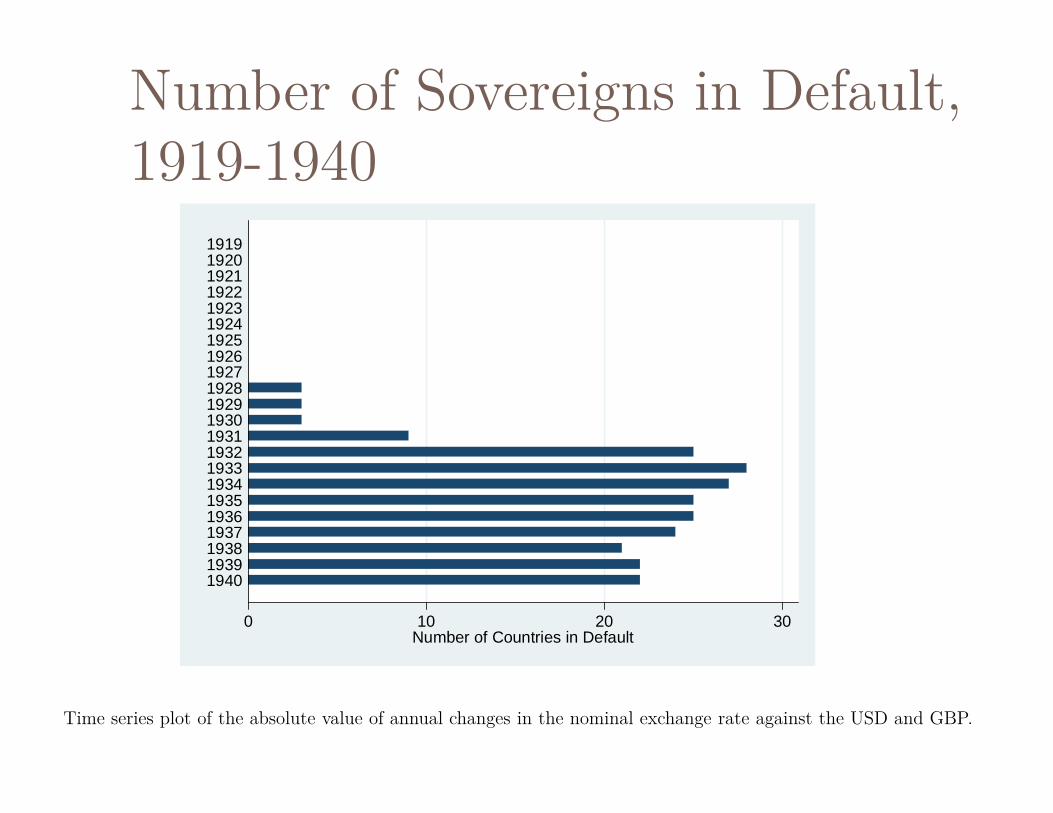
Number of Sovereigns in Default, 1919-1940
Time series plot of the absolute value of annual changes in the nominal exchange rate against the USD and GBP.
0 10 20 30Number of Countries in Default
1940193919381937193619351934193319321931193019291928192719261925192419231922192119201919

Debt Default and the Great Depression
What was the economic cost of default vs. repaying under lower terms of trade/ depreciated exchange rate? Eichengreen and Portes report a positive relationship
between recovery and default

“Original Sin” as a problem
Cespedes, Chang and Velasco “IS-LM-BP (in the Pampas)”
Standard expenditure switching effect of depreciation
Assume credit market frictions: the risk premium rises as the exchange rate depreciates Net worth falls as the exchange rate depreciates
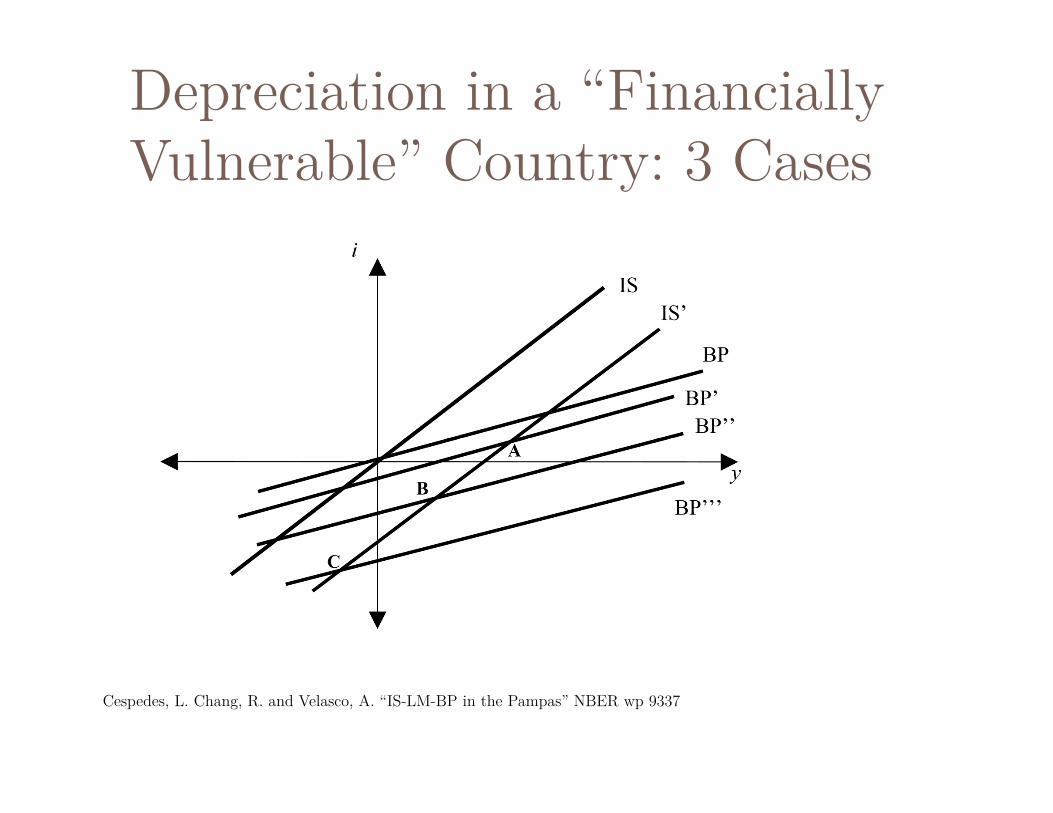
Depreciation in a “Financially Vulnerable” Country: 3 Cases
Cespedes, L. Chang, R. and Velasco, A. “IS-LM-BP in the Pampas” NBER wp 9337

Original Sin in History
Original sin was on the scene in the 19th
century.
Despite suffering from OS, the US, Australia, Canada, NZ + others avoided the currency drop/debt default scenario
Other countries: Spain, Italy, Argentina, Brazil had more difficulty even with lower levels of foreign currency/gold debt
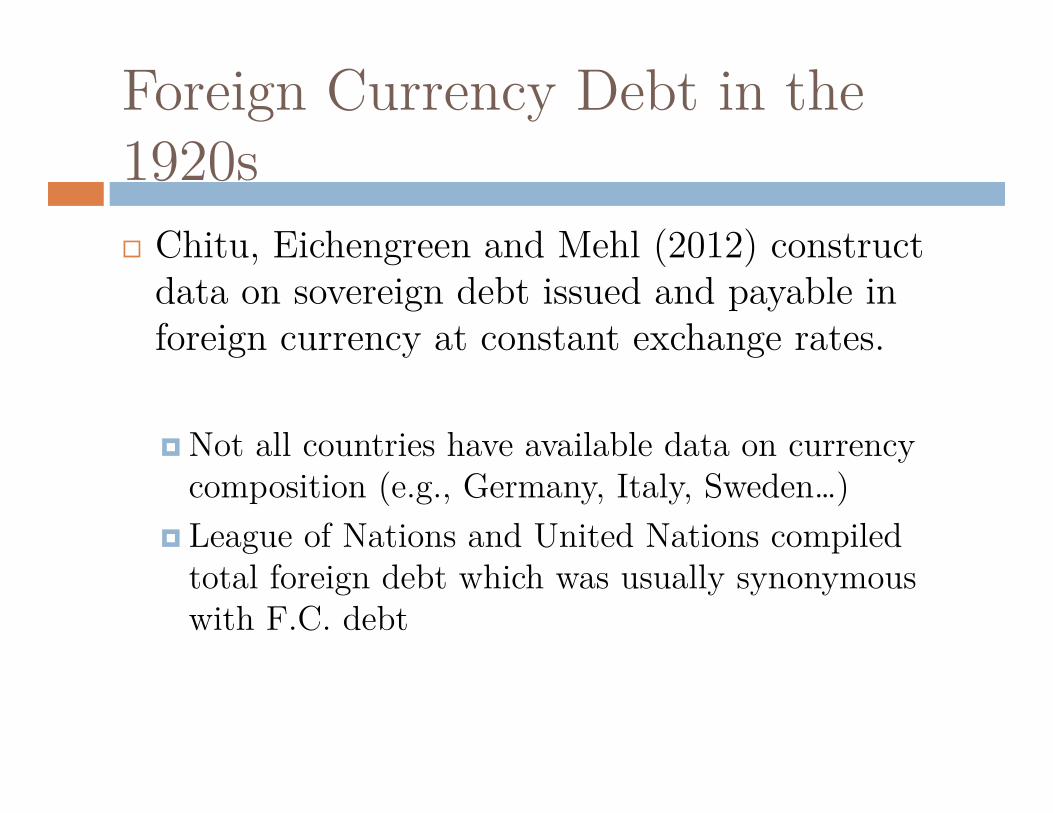
Foreign Currency Debt in the 1920s Chitu, Eichengreen and Mehl (2012) construct
data on sovereign debt issued and payable in foreign currency at constant exchange rates.
Not all countries have available data on currency composition (e.g., Germany, Italy, Sweden…)
League of Nations and United Nations compiled total foreign debt which was usually synonymous with F.C. debt

Foreign Currency Debt/Exports, 1928
Chitu, L. Eichengreen, B. Mehl, A. “When did the Dollar Overtake Sterling as the Leading International Currency? Evidence from the BondMarkets” NBER WP 18097. based on United Nations (1948) “Public Debt, 1914-1946”
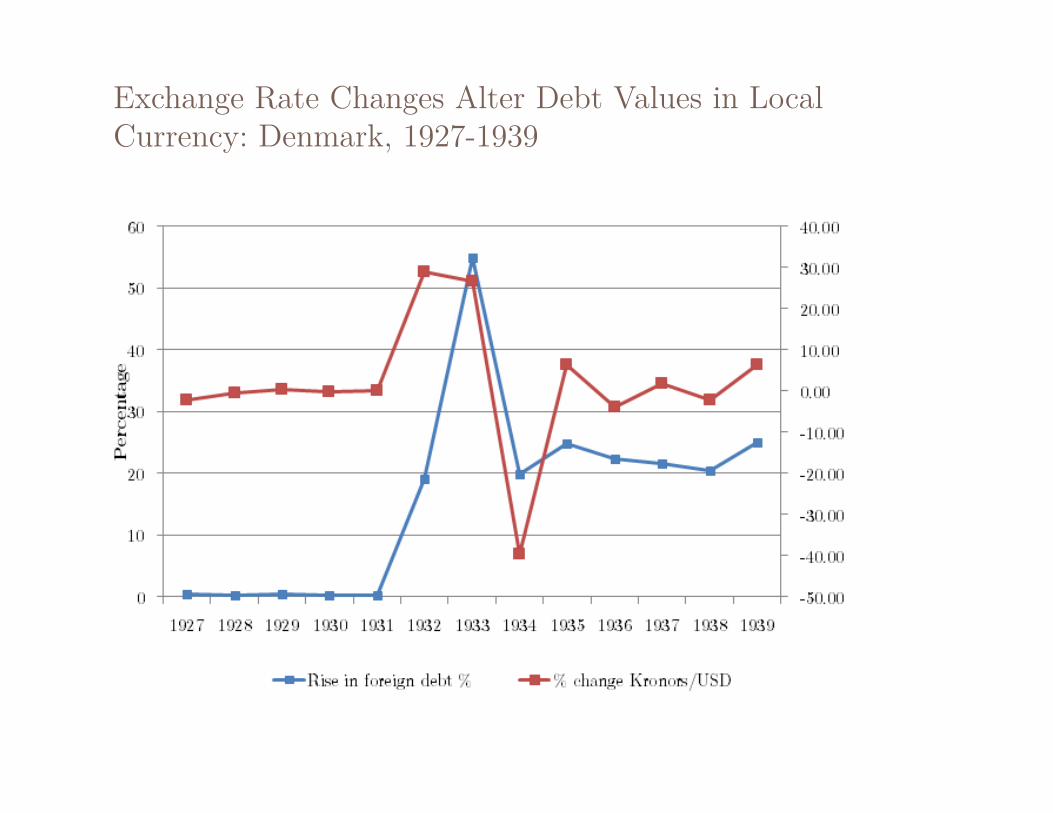
Exchange Rate Changes Alter Debt Values in Local Currency: Denmark, 1927-1939

Exports and the ratio of foreign currency debt to exports, New Zealand, 1925-1940
22.
53
3.5
44.
5F.
C D
ebt/E
xpor
ts
1000
1200
1400
1600
1800
Expo
rts in
USD
1925 1930 1935 1940Year
exports - USD F.C. Debt/Exports
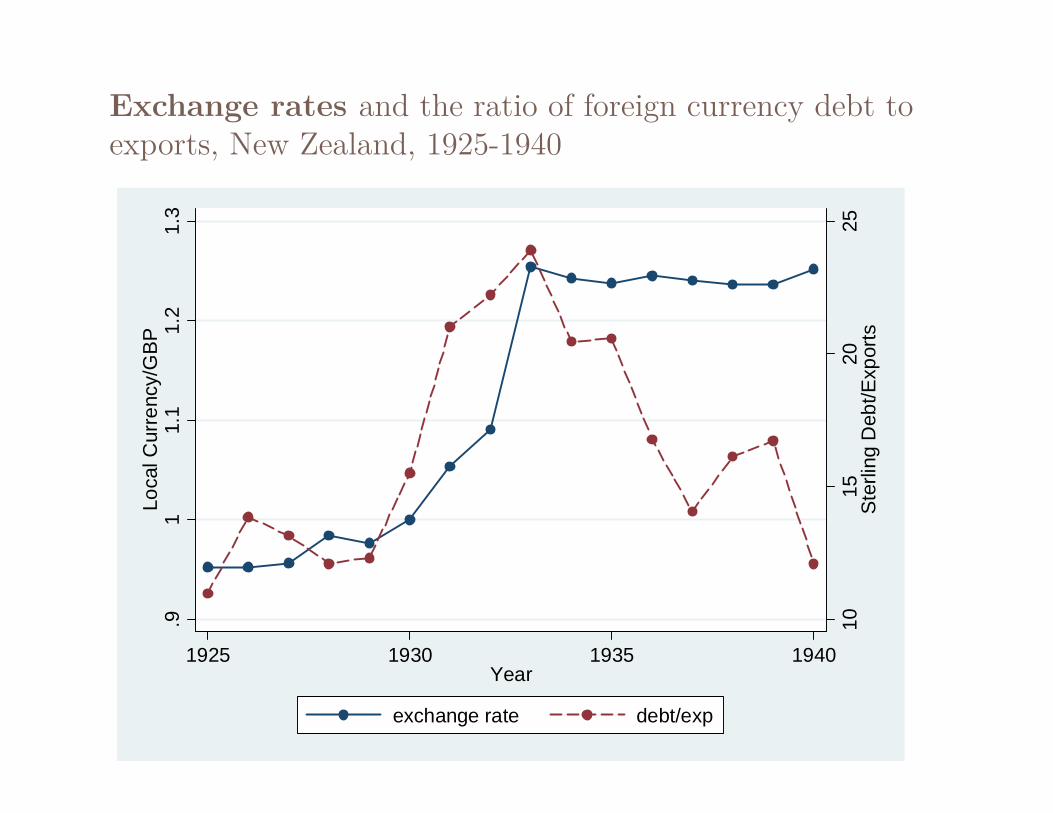
Exchange rates and the ratio of foreign currency debt to exports, New Zealand, 1925-1940
1015
2025
Ste
rling
Deb
t/Exp
orts
.91
1.1
1.2
1.3
Loca
l Cur
renc
y/G
BP
1925 1930 1935 1940Year
exchange rate debt/exp
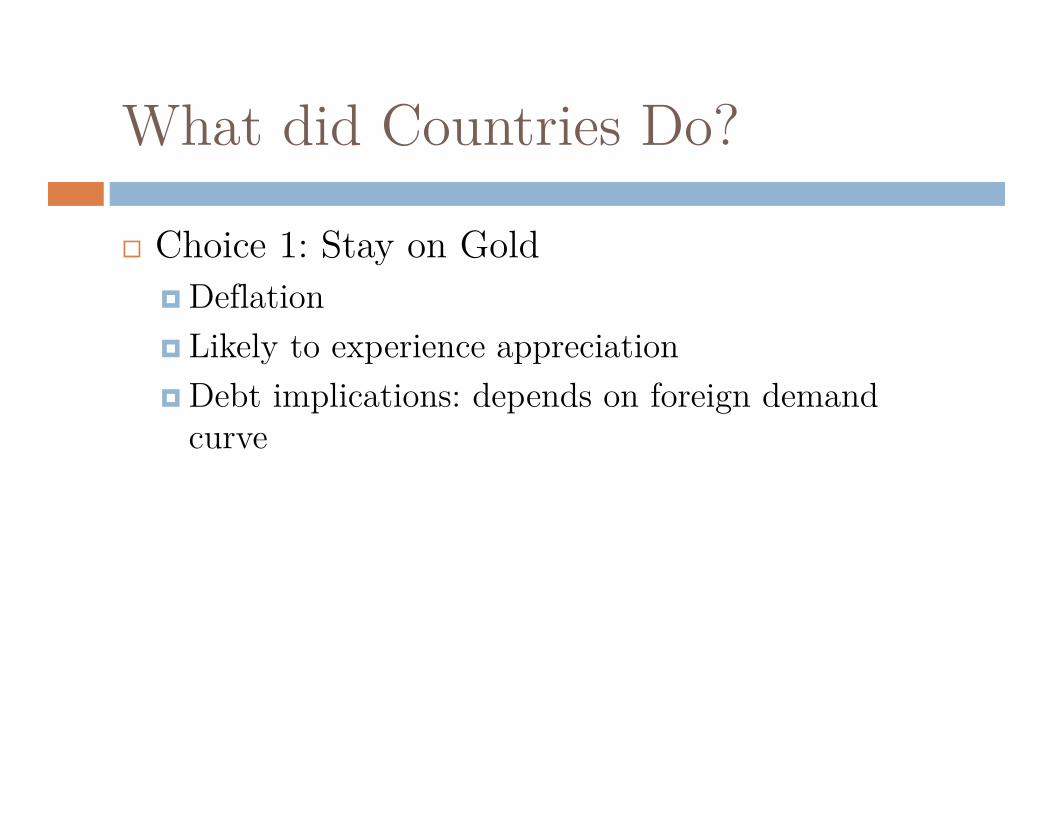
What did Countries Do?
Choice 1: Stay on Gold Deflation Likely to experience appreciation Debt implications: depends on foreign demand
curve
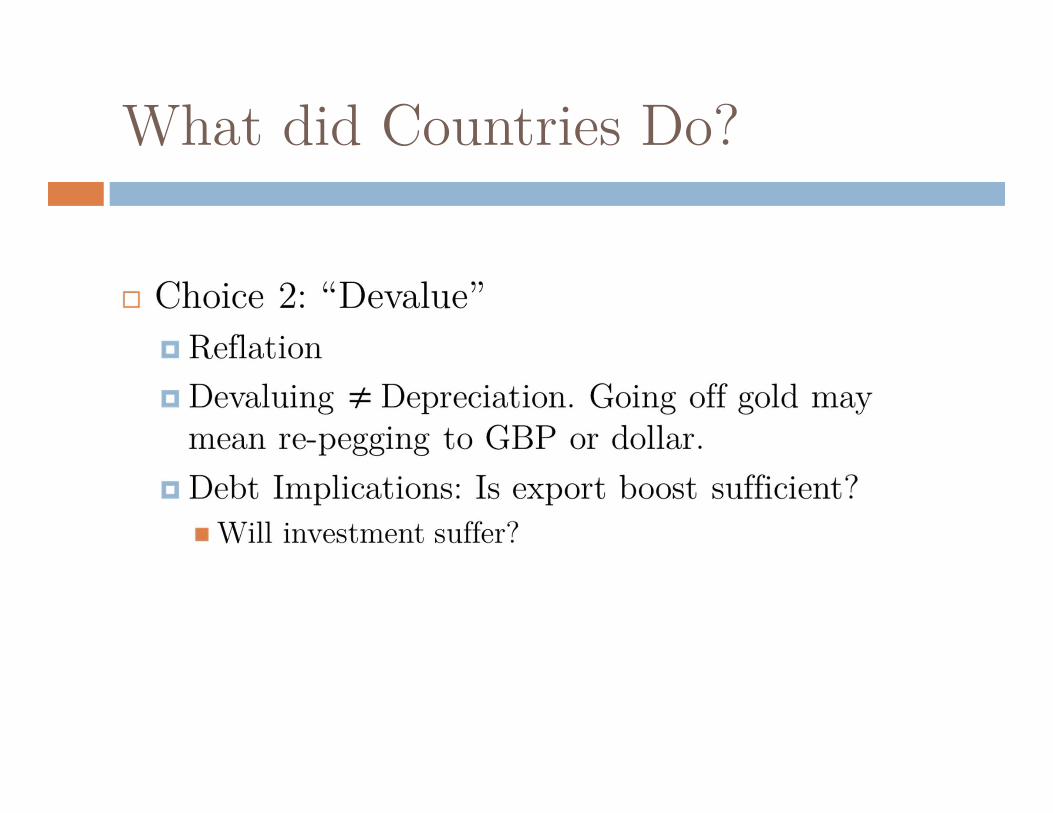
What did Countries Do?

What did Countries Do?
Choice 3: “Default” Debt Implications: clears the debt, but additional
funding may not be available. May or may not be associated with devaluation
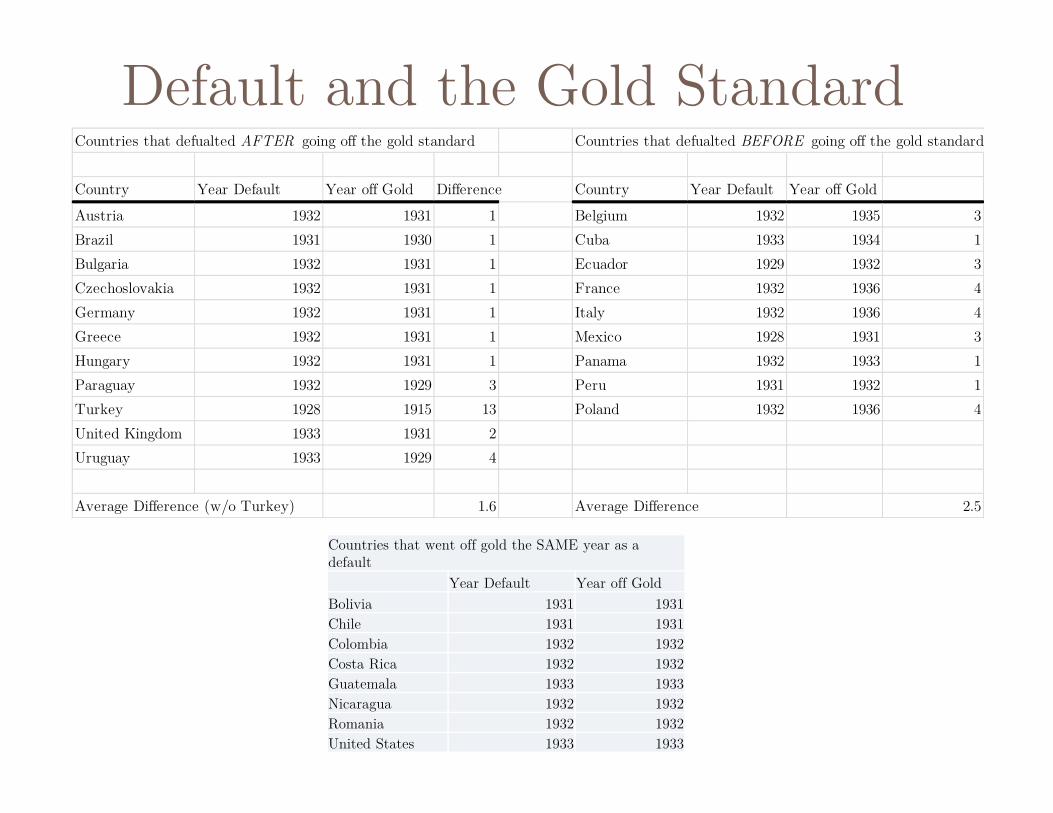
Countries that defualted AFTER going off the gold standard Countries that defualted BEFORE going off the gold standard
Country Year Default Year off Gold Difference Country Year Default Year off Gold
Austria 1932 1931 1 Belgium 1932 1935 3Brazil 1931 1930 1 Cuba 1933 1934 1Bulgaria 1932 1931 1 Ecuador 1929 1932 3Czechoslovakia 1932 1931 1 France 1932 1936 4Germany 1932 1931 1 Italy 1932 1936 4Greece 1932 1931 1 Mexico 1928 1931 3Hungary 1932 1931 1 Panama 1932 1933 1Paraguay 1932 1929 3 Peru 1931 1932 1Turkey 1928 1915 13 Poland 1932 1936 4United Kingdom 1933 1931 2Uruguay 1933 1929 4
Average Difference (w/o Turkey) 1.6 Average Difference 2.5
Default and the Gold Standard
Countries that went off gold the SAME year as a default
Year Default Year off GoldBolivia 1931 1931Chile 1931 1931Colombia 1932 1932Costa Rica 1932 1932Guatemala 1933 1933Nicaragua 1932 1932Romania 1932 1932United States 1933 1933
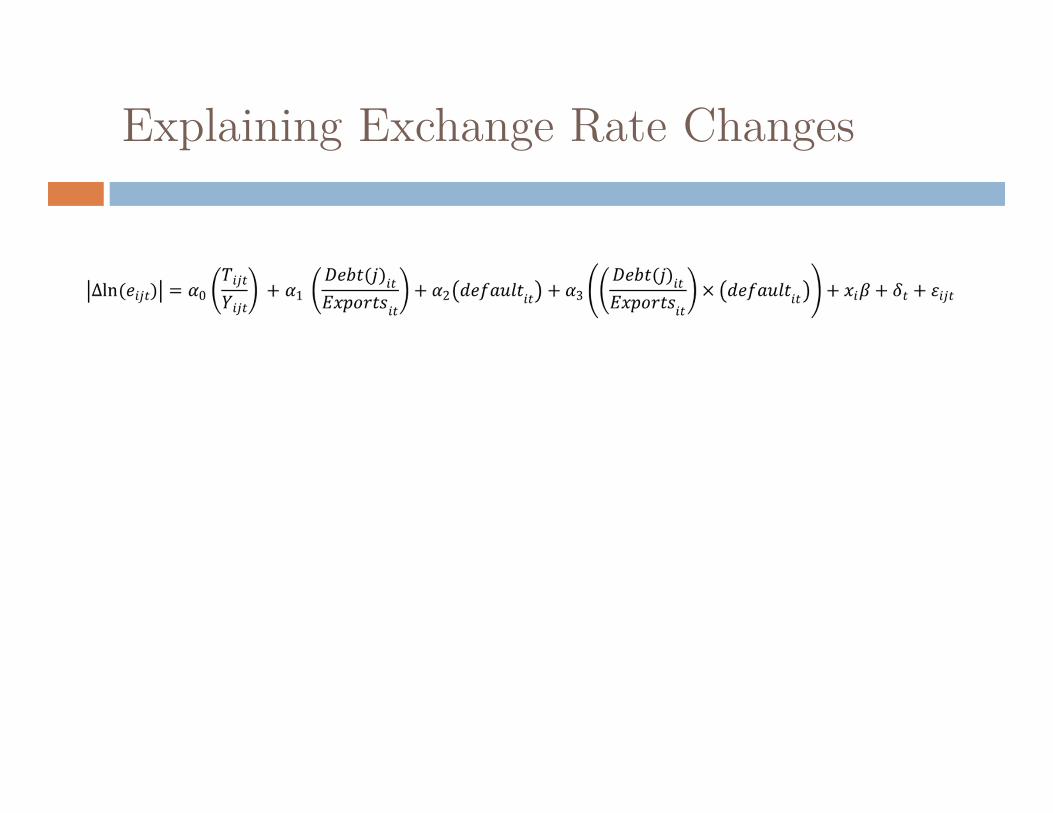
Explaining Exchange Rate Changes
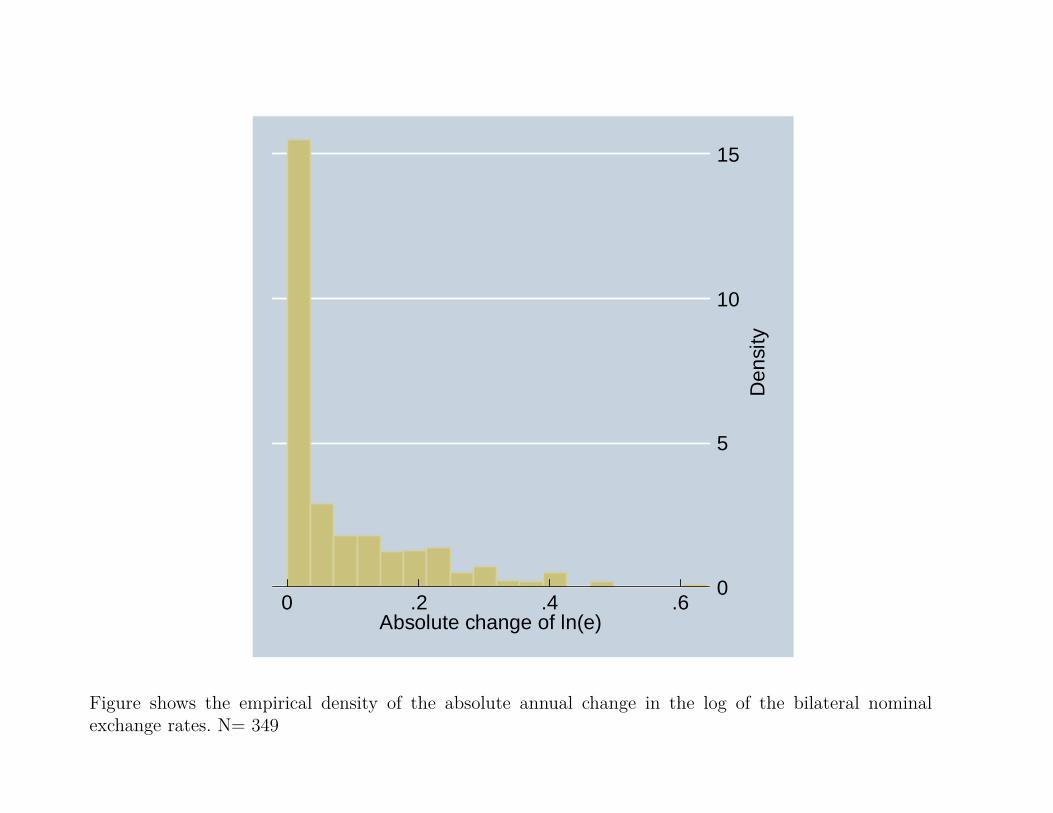
0
5
10
15
Den
sity
0 .2 .4 .6Absolute change of ln(e)
Figure shows the empirical density of the absolute annual change in the log of the bilateral nominalexchange rates. N= 349

Explaining Exchange Rate Changes: Panel Model

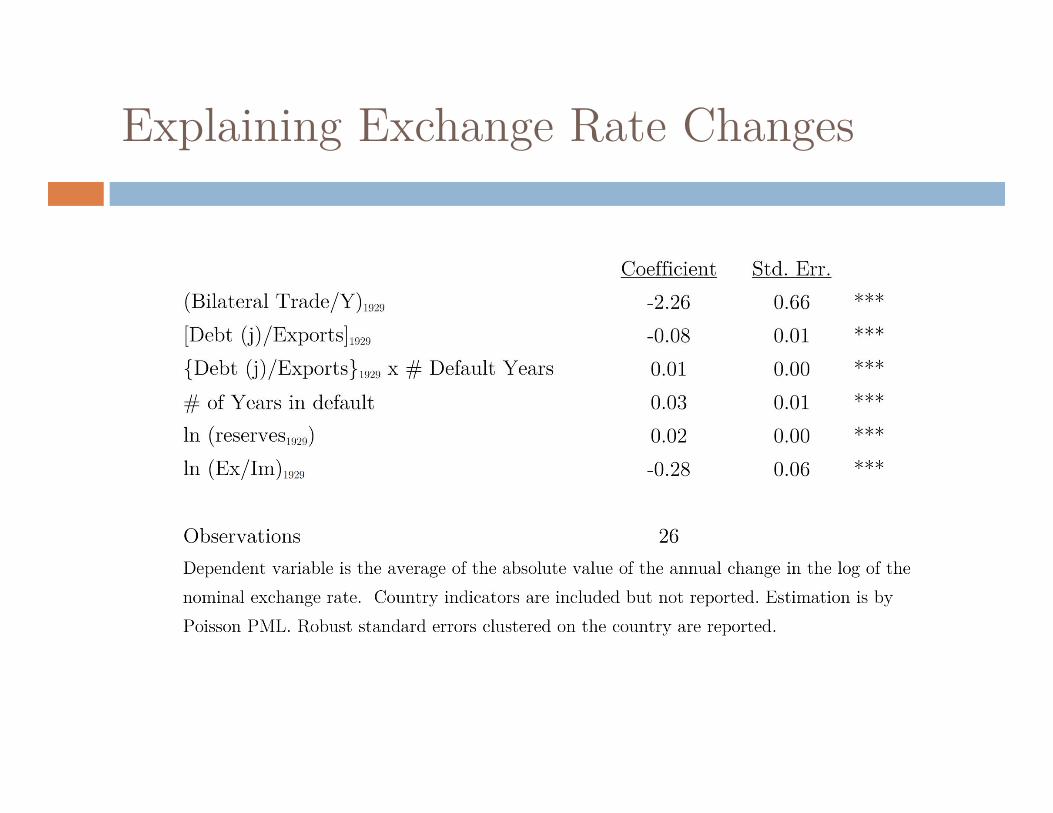
Explaining Exchange Rate Changes
Figure shows the (conditional) relationship between the absolute annual change in the log of thebilateral nominal exchange rate and debt denominated in GBP or USD. Estimation is a linear OLSregression. Robust standard error is reported.
Australia
AustraliaAustralia
Australia
Australia
AustraliaAustralia
Australia
Australia
Australia
Portugal
Portugal
Australia
PortugalPortugal
PortugalAustralia
Portugal
PortugalPortugal
Portugal
Portugal
Portugal
Portugal
PortugalPortugal
Portugal
AustraliaBrazilBrazil
Brazil
Belgium
CanadaCanada
Brazil
Denmark
France
France
United States
France
FinlandBrazilFrance
Belgium
Denmark
CanadaCanada
Denmark
France
France
Japan
United States
Japan
Belgium
France
FinlandFrance
CanadaBrazil
CanadaCanada
BelgiumFinland
Belgium
Finland
Japan
France
France
FranceDenmark
NetherlandsFranceFrance
Brazil
BelgiumSwitzerlandDenmarkJapan
FinlandDenmarkCanadaCanadaBelgium
France
France
France
France
Belgium
Switzerland
Finland
Denmark
Switzerland
United KingdomUnited StatesArgentina
FranceFrance
Argentina
Switzerland
FranceNorway
Argentina
Denmark
France
Brazil
Denmark
Denmark
FranceFrance
Belgium
Canada
Belgium
BrazilUnited States
United States
DenmarkUnited StatesUnited States
Norway
Finland
Norway
Netherlands
Brazil
United KingdomNorway
Brazil
Brazil
Netherlands
Argentina
Norway
Belgium
BelgiumNorwayUnited KingdomFinland
Canada
Brazil
NetherlandsSwitzerland
Netherlands
Netherlands
Brazil
Argentina
Brazil
Netherlands
Norway
Brazil
Norway
Brazil
Switzerland
Switzerland
Belgium
Argentina
BrazilBelgiumNorway
Switzerland
NorwayNetherlandsUnited KingdomCanadaNetherlandsNorwayUnited Kingdom
Argentina
Brazil
Argentina
Argentina
Netherlands
NorwayNorwayUnited States
Canada
Netherlands
Brazil
Netherlands
Argentina
Norway
Netherlands
Switzerland
Switzerland
NetherlandsSwitzerland
Norway
Argentina
NorwayNorway
Netherlands
NetherlandsNetherlandsArgentina
NetherlandsNorwayNorwayUnited KingdomBrazil
Netherlands
Brazil
Netherlands
Switzerland
FinlandUnited Kingdom
Brazil
Norway
Norway
Switzerland
Netherlands
Switzerland
Norway
Argentina
NorwaySwitzerland
Argentina
SwitzerlandNetherlandsSwitzerlandNorway
Switzerland
Finland
Switzerland
Switzerland
Switzerland
Netherlands
Finland
Netherlands
Finland
Netherlands
Argentina
United Kingdom
Switzerland
United Kingdom
Norway
Argentina
Switzerland
Brazil
Argentina
NetherlandsSwitzerland
Switzerland
CanadaDenmarkArgentina
Denmark
Netherlands
United KingdomSwitzerlandUnited StatesNorwayNetherlands
NetherlandsBelgium
FinlandNetherlands
FinlandNorway
Switzerland
Belgium
NorwayNorway
United States
Belgium
United States
United Kingdom
Argentina
United States
Finland
Belgium
Denmark
Norway
Belgium
Canada
Finland
BelgiumJapan
Finland
Belgium
Belgium
Finland
United States
Denmark
Denmark
CanadaCanadaBelgium
BelgiumBelgium
Japan
Argentina
FinlandBelgium
Belgium
CanadaDenmarkDenmarkDenmark
Belgium
Denmark
Denmark
United StatesUnited States
Japan
CanadaCanada
CanadaJapanFinlandDenmarkCanada
Canada
CanadaPortugal
Brazil
France
BrazilFrance
France
Brazil
Brazil
AustraliaAustraliaBrazilPortugalFrance
Portugal
France
Brazil
France
AustraliaPortugal
Portugal
PortugalPortugalAustralia
Portugal
Portugal
AustraliaFrance
Portugal
Portugal
PortugalPortugal
PortugalAustralia
Australia
Portugal
Australia
AustraliaAustralia
Australia
-.20
.2.4
Abs
olut
e %
cha
nge
e
-10 0 10 20Bilateral Debt/Exports
coef = -.00263555, (robust) se = .00030588, t = -8.62
Explaining Exchange Rate Changes
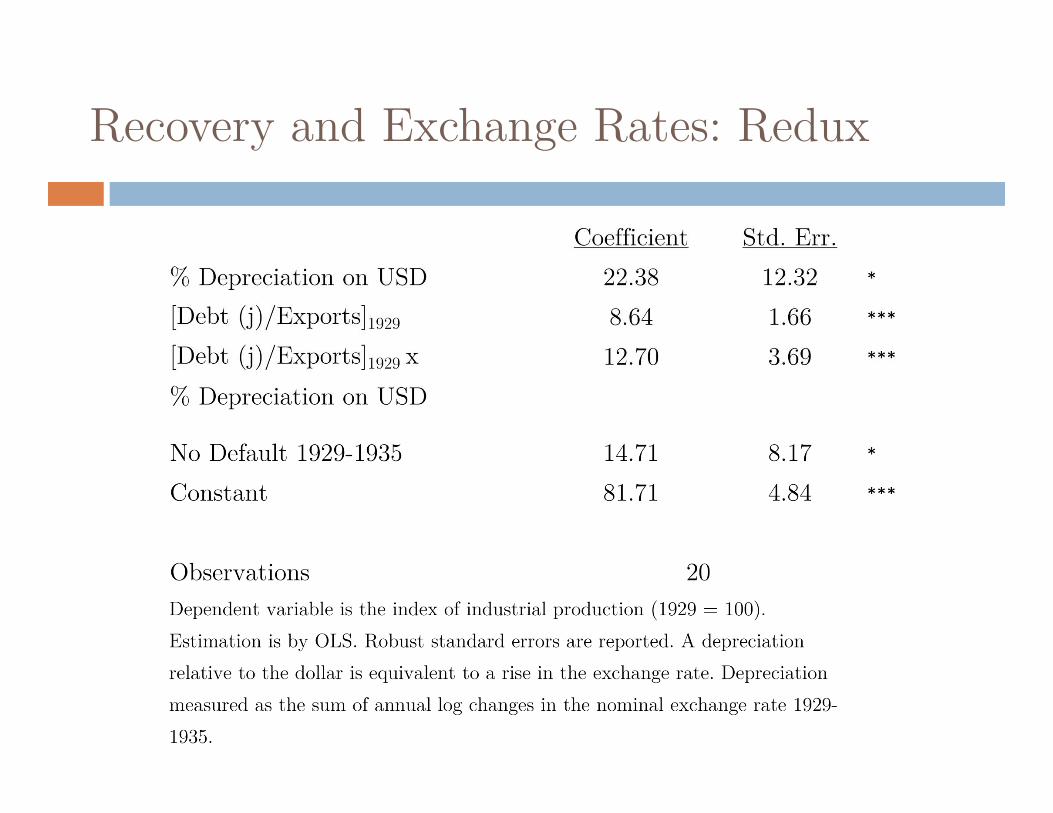
Recovery and Exchange Rates: Redux

Recovery and Exchange Rates: Redux
050
100
150
200
ma
rgin
al e
ffect
of
cha
nge
in e
0 .5 1 1.5 2 2.5 3 3.5 4 4.5 5 5.5 6 6.5 7 7.5 8 8.5 9 9.5 10Foreign Currency Debt/Exports
Figure shows the marginal impact on change in IP (1929-1935) of depreciation against USD at various levels offoreign currency debt/exports.
New Zealand
40% fall in GBP price of exports 9m GBP in interest due.
This raised the burden of interest payments by 2/3
“New Zealand is linked with Great Britain by strong ties of sentiment, trade and debt, and it would be inadvisable to make any permanent change in the basis of New Zealand currency without full discussion of the matter with the British authorities” Eventually the nominal depreciation was about 30%
Australia
68% fall in export prices in gold terms by 1931-32
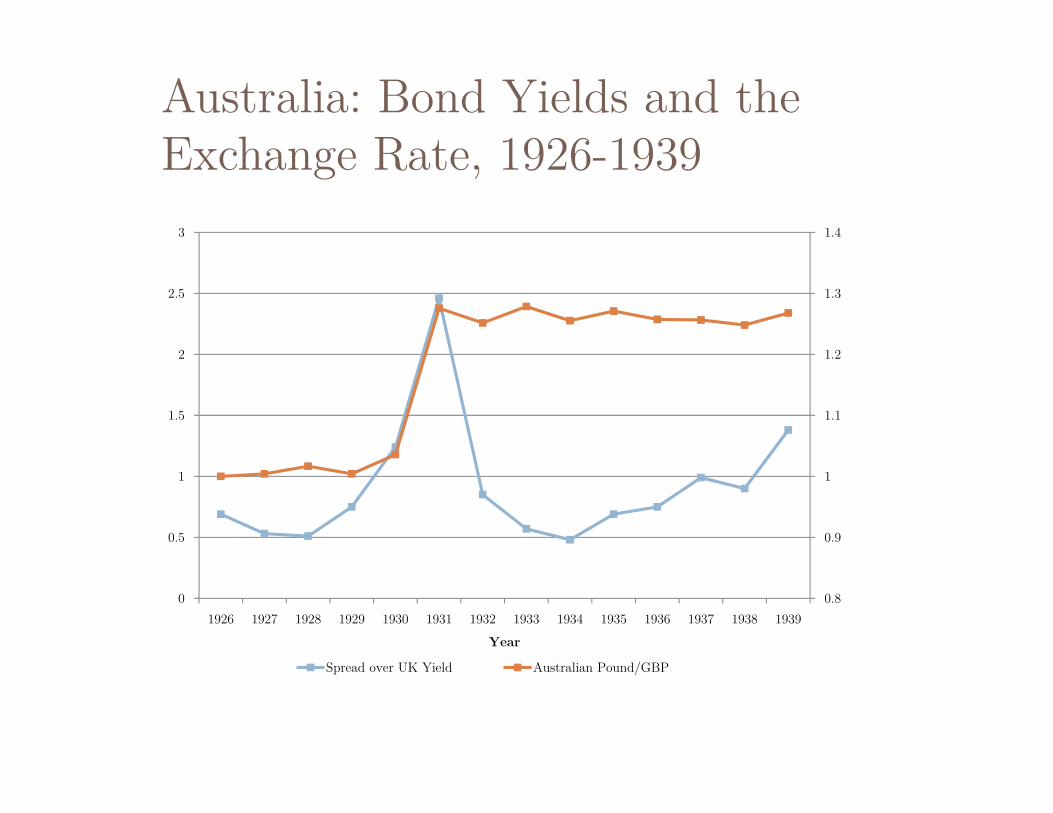
25% depreciation of Australian pound from 1930-maintained against sterling after 9/1931
Debt: internal conversion + war debt relief
One idea: issue a loan in London to compensate exporters Default risk rises
Bond yields in Australia reportedly fell from June 1931
0.8
0.9
1
1.1
1.2
1.3
1.4
0
0.5
1
1.5
2
2.5
3
1926 1927 1928 1929 1930 1931 1932 1933 1934 1935 1936 1937 1938 1939
Year
Spread over UK Yield Australian Pound/GBP
Australia: Bond Yields and the Exchange Rate, 1926-1939

Argentina: Bond Yields and the Exchange Rate, 1927-1935
0
0.5
1
1.5
2
2.5
3
0
0.5
1
1.5
2
2.5
3
3.5
4
4.5
1927 1928 1929 1930 1931 1932 1933 1934 1935
Pesos/USD ARG-US spread
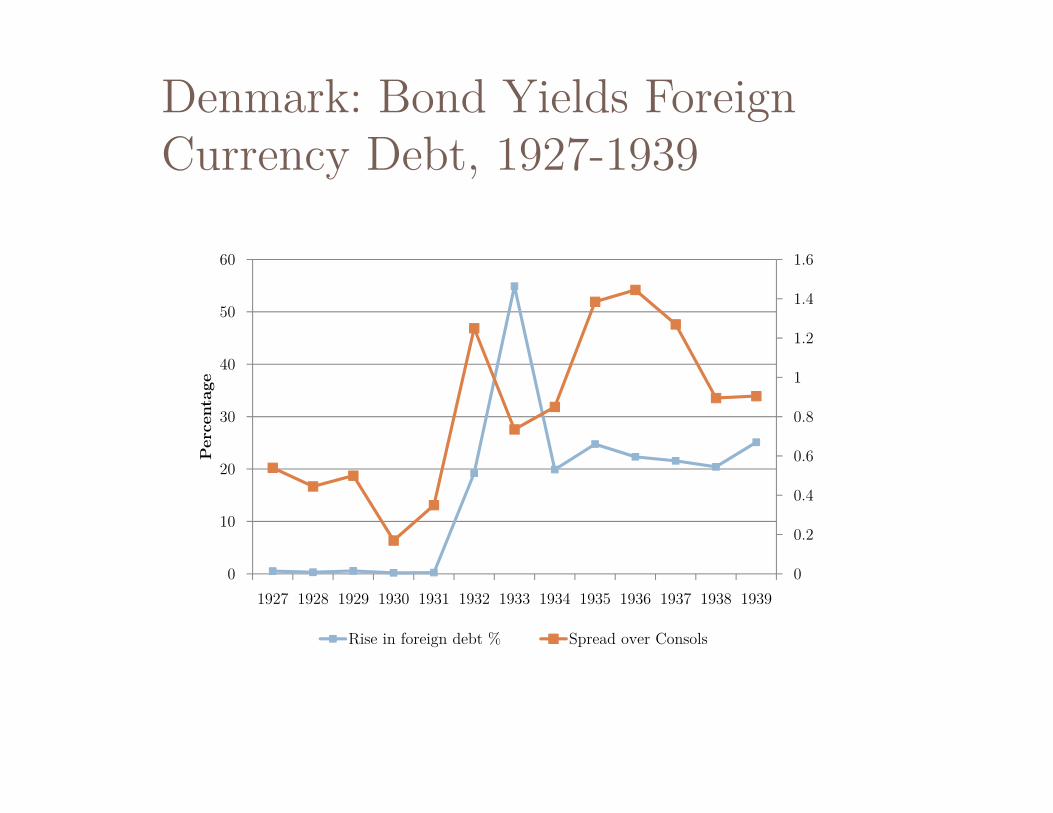
Denmark: Bond Yields Foreign Currency Debt, 1927-1939
0
0.2
0.4
0.6
0.8
1
1.2
1.4
1.6
0
10
20
30
40
50
60
1927 1928 1929 1930 1931 1932 1933 1934 1935 1936 1937 1938 1939
Per
cent
age
Rise in foreign debt % Spread over Consols

Discussion
Small open-economies took three routes Depreciation Default Gold standard
On average, foreign currency debt was associated with greater exchange rate stability
If depreciation was associated with recovery it appears that expenditure switching effects dominated any hypothesized capital market frictions May depend on country characteristics The role of the center


