
FOREST CHANGE DETECTION IN ‘EUA, TONGA
GIS/Remote Sensing Conference (27 – 30 NOVENBER 2012) Suva
Steven HamaniForestry Division (MAFFF)[email protected]

Overview GIS/GPS TRAINING AERIAL PHOTOS OF ‘EUA 1991 VERY HIGH RESOLUTION SATELLITE IMAGE 2005

Introduction This presentation shows change detection of ‘Eua Island in
Tonga and it is mainly on Woodland, Broadleaved and Conifer Forest Plantation.
The forest change detection shows the alteration of forest cover from 1991 to 2005
It is based on aerial photographs recorded in 1991 and a very high resolution satellite image data recorded in 2005.

GIS/GPS TRAINING • MapInfo
• Hand held Garmin

After the training few forest clearings were GPS and the rest were digitized but only on Woodland, Broadleaved and Conifer Forest
Plantation

Aerial photographs of ‘Eua recorded in 1991• Scanned & saved as TIFF files• Converting these TIFF files into ERDAS IMG files and then
Rectified• Stitching images• Then an image enhancement process heightened the contrast
between the vegetation type• All of the above tasks were done in ERDAS software

Digitizing
• Forest area for aerial photographs 1991 and 2005 image QuickBird image data were digitized using MapInfo software
• The digitizing is based on forest area only and other land cover classes were not delineated

Forest and non-forest on aerial photographs recordedin 1991. The different forest types were not delineated
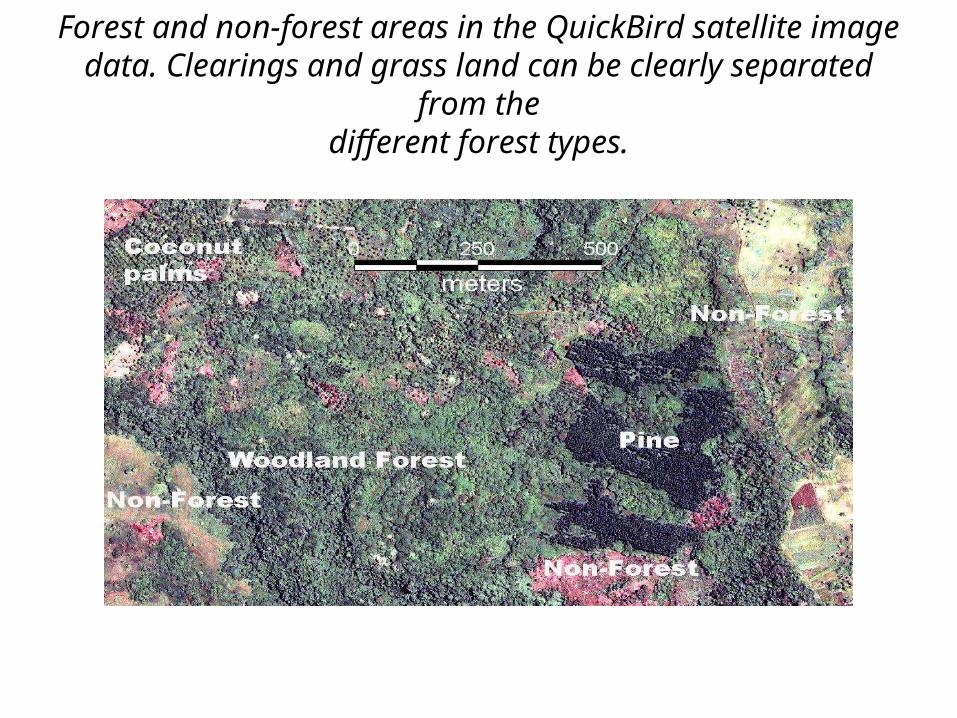
Forest and non-forest areas in the QuickBird satellite imagedata. Clearings and grass land can be clearly separated from the
different forest types.

Overlaying Process
• MapInfo vector data were converted from MapInfo TAB file format to DXF file format
• DXF files were imported to ERDAS as annotation files re-established the projection information and converted to raster data layer
• This complicated process is currently• the only way to convert from vector to raster and raster data
environment is necessary for the subsequent overlay process.

1991
2005
0UTPUT
The MapInfo vector data were converted from MapInfo TAB file format to DXF file format.
The DXF files were imported to ERDAS as annotation files re-established the projection information and converted to raster data layer.
This complicated process is currently the only way to convert from vector to raster and raster data environment is necessary for the subsequent overlay process.
The final step is running both image 1991 and 2005 on model maker in order to show the forest cover and change.
This allows to see and analyze the area of a) stable forest (forest 1991 and 2005) b) deforestation (1991 forest and 2005 non-forest) and c) reforestation (1991 non-forest and 2005 forest).
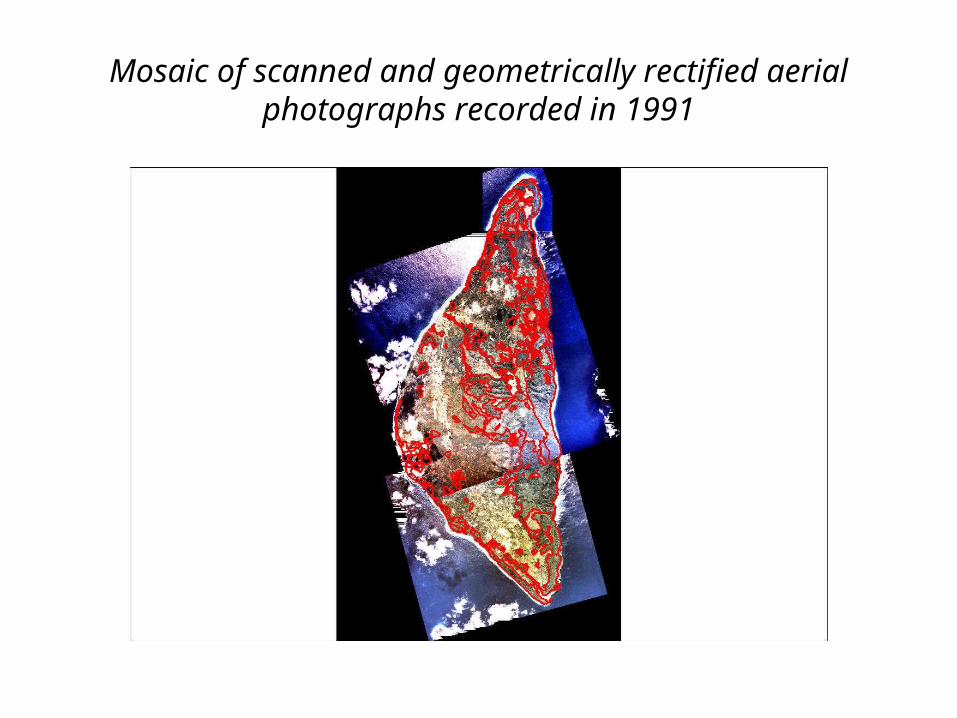
Mosaic of scanned and geometrically rectified aerial photographs recorded in 1991

QuickBird VHR resolution Satellite image of Eua with forest coverRecorded in 2005

Change Detection Map of Eua Island.
• Red = deforestation, • Yellow = reforestation, • Green= stable forest • Grey = non-forest 1991 and 2005

Area Calculation
Class Name No of Pixels Hectares
Stable Forest 68000
Reforestation 10335
Deforestation 11201

Map of Tonga

THANKS
• I would like to acknowledge GIZ for funding the training and completion of the forest change detection of Eua Island.
• I would also like to acknowledge SPC/SOPAC, GIS Unit especially Dr. Wolf and his staffs for their assistance.

THANK YOU
QUESTIONS


