
From Make-Use to Symmetric I-O Tables: An Assessment of
Alternative Technology Assumptions
Jiemin Guo, Ann M. Lawson, and Mark A. Planting
Bureau of Economic Analysis
U.S. Department of Commerce
October, 2002

Overview
From Leontief model to UN make-use model
Two basic technology assumptions BEA two-step mixed assumption approach Assessments and evaluations

Background, Issues, and Past Research
Two Input-Output Models Leontief Model (symmetric) Make-Use Model (asymmetric)
Two assumptions Commodity Technology Assumption (CTA) Industry Technology Assumption (ITA);
Over view of past research

Treatment of Secondary Product in the U.S. Input-Output Accounts
U.S. compiles I-O accounts using make-use format since 1972 benchmark tables;
BEA uses a two-step “mixed” technology assumption to create symmetric tables;Step one – “redefinition process”, under
commodity technology assumption (CTA);Step two – Transfer remaining secondary
products mechanically, using ITA.

Data
• For 1992 US benchmark I-O tables, there are two data sets– Alternative make-use tables (Before
redefinitions)– Traditional make-use tables (after
redefinitions)

Total Output, Primary Products, and Secondary Products
Table 3.--Primary and Secondary Output in the Traditional andAlternative Use and Make Tables for 1992
[Millions of dollar]
Total output Primary outputSecondary
outputTraditional 10,053,978 9,564,735 489,243Alternative 10,053,978 9,315,355 738,623
• Secondary products consist 7% of total output before redefinition;• About 1/3 of secondary products were moved to their primary
products, based on CTA;• The remaining 2/3 secondary products are treated as homogeneous
within producing industries, therefore will be transferring to there respective producing industries mechanically, using ITA.

Tests to Evaluate Procedures
Alternative proceduresTable 4.–Alternative Procedures Examined for Redefining Secondary Products
Source data ITA CTA
Before redefinition
( A U and A V)Procedure IT
After redefinition Procedure CT(method used by BEA)( T U and T V)
Form of mechanical redefinitions used to prepare symmetric tables
Procedure IA Procedure CA
Tests to Evaluate Procedures (Cont.)
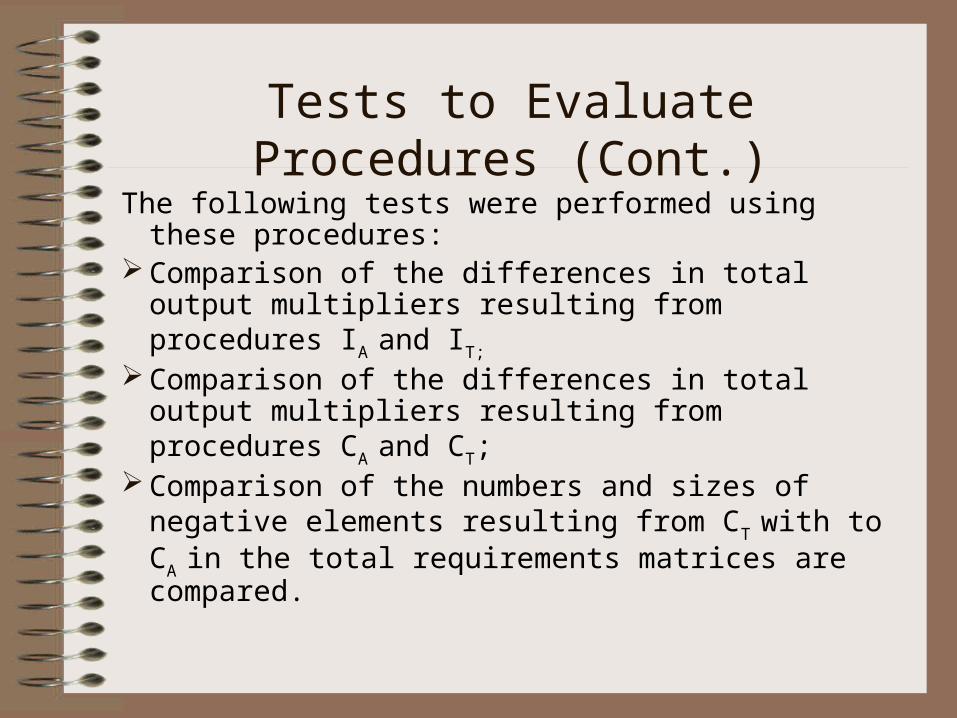
The following tests were performed using these procedures:
Comparison of the differences in total output multipliers resulting from procedures IA and IT;
Comparison of the differences in total output multipliers resulting from procedures CA and CT;
Comparison of the numbers and sizes of negative elements resulting from CT with to CA in the total requirements matrices are compared.
K Index
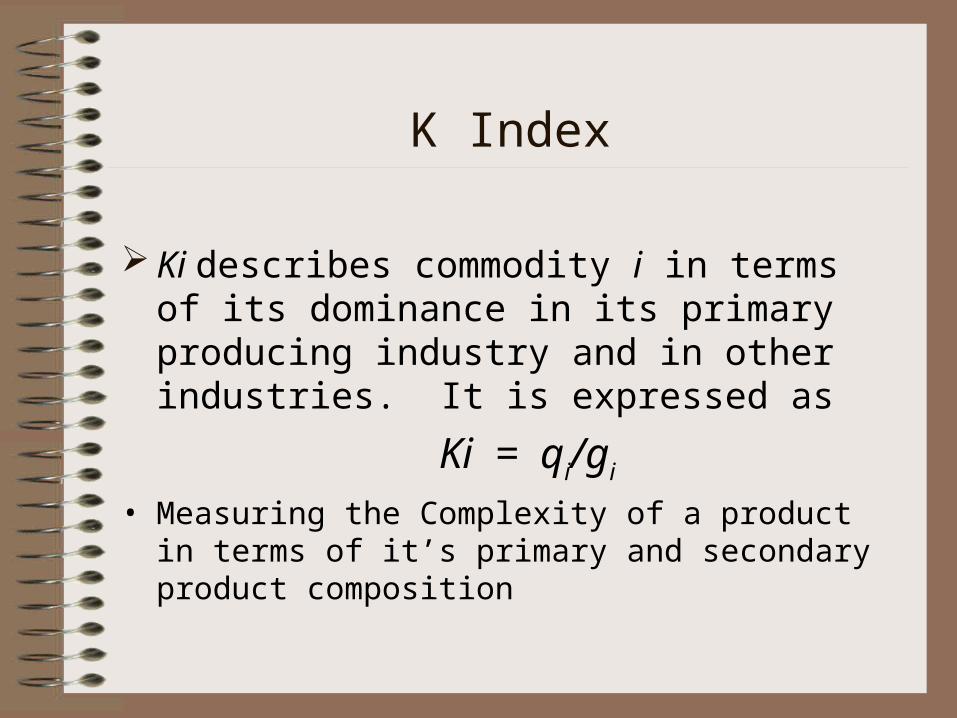
Ki describes commodity i in terms of its dominance in its primary producing industry and in other industries. It is expressed as
Ki = qi/gi • Measuring the Complexity of a product in terms of it’s
primary and secondary product composition
Empirical Results
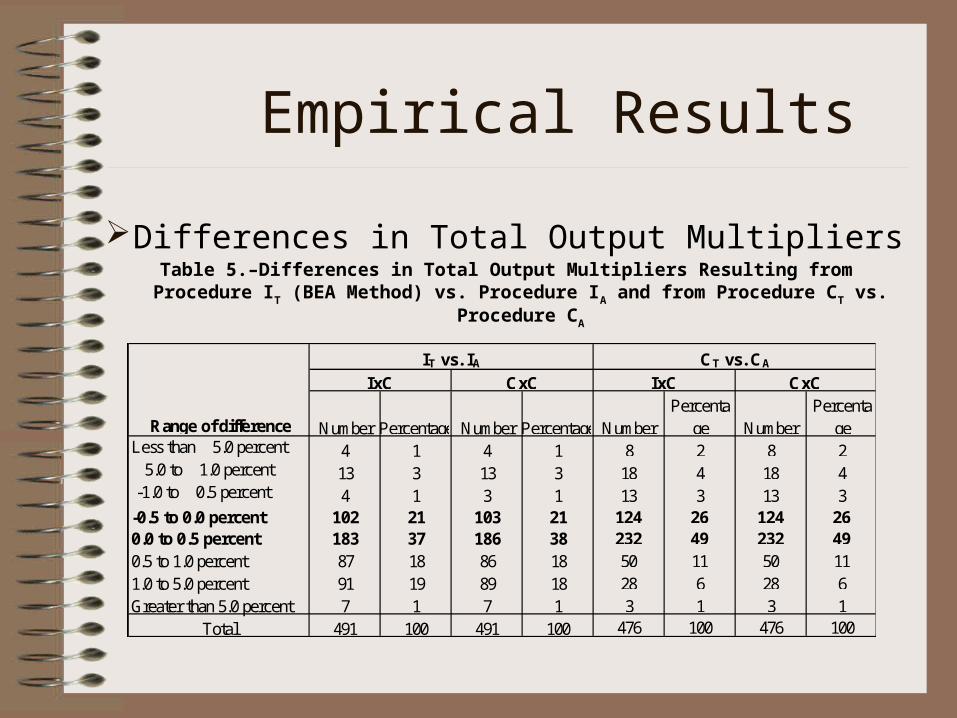
Differences in Total Output MultipliersTable 5.–Differences in Total Output Multipliers Resulting from Procedure IT
(BEA Method) vs. Procedure IA and from Procedure CT vs. Procedure CA
Number Percentage Number Percentage NumberPercenta
ge NumberPercenta
geLess than 5.0 percent 4 1 4 1 8 2 8 2
5.0 to 1.0 percent 13 3 13 3 18 4 18 4 -1.0 to 0.5 percent 4 1 3 1 13 3 13 3-0.5 to 0.0 percent 102 21 103 21 124 26 124 260.0 to 0.5 percent 183 37 186 38 232 49 232 490.5 to 1.0 percent 87 18 86 18 50 11 50 111.0 to 5.0 percent 91 19 89 18 28 6 28 6Greater than 5.0 percent 7 1 7 1 3 1 3 1
Total 491 100 491 100 476 100 476 100
IT vs. IA
Range of difference
CT vs. CA
IxC CxC IxC CxC

Empirical Results (cont.)
Changes in Negative Cells
Table 7.--Numbers and Sums of Values of Negative Coefficients in the Total Requirements Matrices Resulting from Procedure CA and Procedure CT
Number Value Number Value Number Value Number ValueC x C 18,774 -10 16,868 -10.5 -1,906 -0.5 -10 1I x C 42,932 -83 38,612 -77.2 -4,320 5.8 -10 -7
Difference (percent)Matrix
Procedure CA Procedure CT Difference

Empirical Results (cont.)
K Values and Sources of Negatives from CTAThe top negative values from CTA are linked to
high or low K valuesA concentration in the input sectors (columns) with
the largest negative coefficients was found, such as Radio and TV broadcasting and Newspapers, which have the lowest K values among over 400 products
The sectors with larger than 1.0 K values appeared most frequently in the rows (supplying).

Conclusions
Conclusions For 1992, the U.S. Benchmark I-O Accounts show that
secondary products represented only about 7 percent of total gross output ($739 billion out of total $10,054 billion);
The choice of method does not greatly affect the total multipliers for economic-impact analyses.
For some commodities and industries, the choice between BEA’s two-step method and a one-step method does make a large difference.

Conclusions (cont.)
Disagreement about what causes negative values to occur and what methods can be used to produce “ideal” results without negative values.
Test results suggest that hand redefinitions of nonhomogeneous secondary products, using the CTA, can reduce the frequency of negative values, compared with using the CTA to transfer all secondary products mechanically.
Most large negative values in the total requirements matrices, resulting from the CTA, are related to secondary products that represent either a large proportion of an industry’s total output or of a commodity’s total output.

Recommendations for Future Study
Has the BEA identified those secondary products that require hand adjustments, using the CTA, from all other secondary products that require only a mechanical transfer, is appropriate, using the ITA? If the hand adjustments, using the CTA, results in only a 10 percent reduction in the frequency of negative values, is this an indicator that additional secondary products require hand adjustments?
If a hybrid solution is optimal for handling secondary products, is there an effective test to distinguish between those secondary products that require hand adjustments, using the CTA, and all other secondary products for which the mechanical transfer, using the ITA, is more appropriate?
Are large negative values resulting from the CTA indicators that classification and/or measure errors have occurred in the original data—that is, that the source data should be re-examined?


