Download - From national to regional grid planning
Fortum Energy Review, November 2019
Differences and harmonisation opportunities in the operations of the Nordic TSOs
From national to regional grid planning
From national to Nordic transmission system operations
F ortum is a true Nordic elec-tricity company with a pres-ence in all Nordic and Baltic price areas through electricity production and/or consump-
tion. We are a strong advocator for a fully harmonised Nordic regional elec-tricity market, as we – through our geo-graphical presence – are able to witness the Nordic benefit (“Nordisk Nytta”) that the common electricity market delivers every day to our societies. The Nordic electricity market enables the imple-mentation of the Nordic countries’ high ambitions for climate neutrality, energy transition and electrification of indus-tries at a lower cost than if each country were to optimise the electricity market from a national perspective.
Fortum favours an efficient, compet-itive and market-driven regional power market where producers and consumers have an equal level playing field relat-ing to market operations and market access. Fortum’s own experience and this report show, however, that this objec-tive is currently not fully materialised. A level playing field is not always equal throughout the regional market because
Foreword
transmission infrastructure and system operations are often optimised differently in the various Nordic countries.
This report, written by Pöyry on Fortum’s assignment, reveals that the Nordic Transmission System Operators (TSOs) have different historical and oper-ational perspectives. Grid investments are primarily driven by national interests and prioritisation. Even in joint projects where Nordic cost-benefit methodology is used, national interests often take precedence over common benefits. There are also clear differences in the approach to the existence and management of congestion in the transmission grid. In addition, present balancing tools are not harmonised across the Nordic TSOs. Finally, the transparency of information about the market is not disclosed in a systematic way across the TSOs.
Many of the differences can be explained by the fact that the legislative framework for regulating TSO obligations is not the same across the Nordic coun-tries, and hence there is room for national perspectives and interpretations.
Fortum's assessment, based on the findings of the report, is that there are
still many harmonisation opportunities for Nordic grid operations and planning. Fortum believes that farsighted and trans-parent grid planning decreases the uncer-tainty of investment decisions for market participants as well as the overall cost of the energy transition and electrification of our industries. All Nordic countries aim to become climate neutral during the 2030s. This means thousands of megawatts of renewable energy investments requiring new grid infrastructure and better sys-tem operation so as to not endanger the energy transition.
Fortum encourages the Nordic TSOs and Nordic policy makers to accelerate the harmonisation of operation and plan-ning and to increase the overall co-oper-ation inside the region, in order to ensure that the underlying physical infrastruc-ture facilitates efficient energy markets and a cost-effective energy transition.
Fortum thanks Pöyry for writing this report and all the people interviewed for taking the time to share their thoughts. Fortum hopes this report will provide a good basis for continued discussion on enhancing the Nordic Electricity Market and Power System.
Fortum Energy Review 2019
Key Fortum messages based on the findings of the Pöyry report:
The internal electricity market with well-developed grid infrastructure, both internal and cross-border, is a key enabler for reaching climate neutrality by 2050 through energy transition and electrification. How the co-operation of transmission system operators evolves in the coming years will be of crucial importance if we are to reach these objectives as cost-efficiently as possible.
Fortum believes that the regional Nordic electricity market is a key enabler for the Nordic countries’ high ambitions for climate neutrality, energy transition and electrification at a lower cost than if each country were to optimise the electricity market from a national perspective. In order to realise the full potential of the Nordic electricity market, the Nordic countries should proceed from developing common market rules to harmonising the regional system operation and planning.
Our messages are primarily targeted to the Nordic policy makers, regulators, TSOs and other stakeholders, but they are equally applicable at the EU level.
• Energy transition and electrification will require
significant strengthening of the regional grid trans-
mission system.
• Farsighted and transparent grid planning
decreases the uncertainty of investment decisions
for market participants and the overall cost of the
energy transition and electrification.
• Enhancing and harmonising the TSO operations
and regulations at the regional level requires strong
political backing.
• A co-ordinated regional approach in grid planning
should be based on top-down optimisation of grid
development. The regional plan should be more
than a compilation of national plans.
• The socio-economic benefits of grid investments
should be assessed from the regional perspective
rather than from the national perspective.
• Congestion revenues should be invested in grid
development to reduce existing bottlenecks.
• A separate regional financing hub should be
established where congestion revenues would be
collected. These pooled resources should be used
to remove bottlenecks from the most congested
areas.
• There should be a clear target to decrease the num-
ber of price areas in the Nordic power market.
• Nordic balancing markets should be harmonised
and the number of balancing market places
reduced. Market access to balancing market places
should be equal and technology neutral.
• Market information should be disclosed in a sys-
tematic and transparent way across the Nordic
TSOs.
• The Nordic Regional Security Co-ordination (RSC)
should be strengthened to be the real co-ordination
centre for Nordic system operations and planning.
3
Fortum Energy Review 2019

Fortum Energy ReviewNovember 2019
Publisher:Fortum Corporation
Keilalahdentie 2–4
02150 Espoo, Finland
tel. +358 10 4511
Authors:Stephen Woodhouse, Pöyry
Juha P. Leinonen, Pöyry
Fortum, Public Affairs: Merja Paavola
tel. +358 50 396 1161
Fortum, Trading and Asset Optimisation:Simon-Erik Ollus
tel. +358 40 179 0166
More of Fortum’s positions on topical energy issues:www.fortum.com > About us >
Our company > Public affairs
4
Fortum Energy Review 2019
Contents
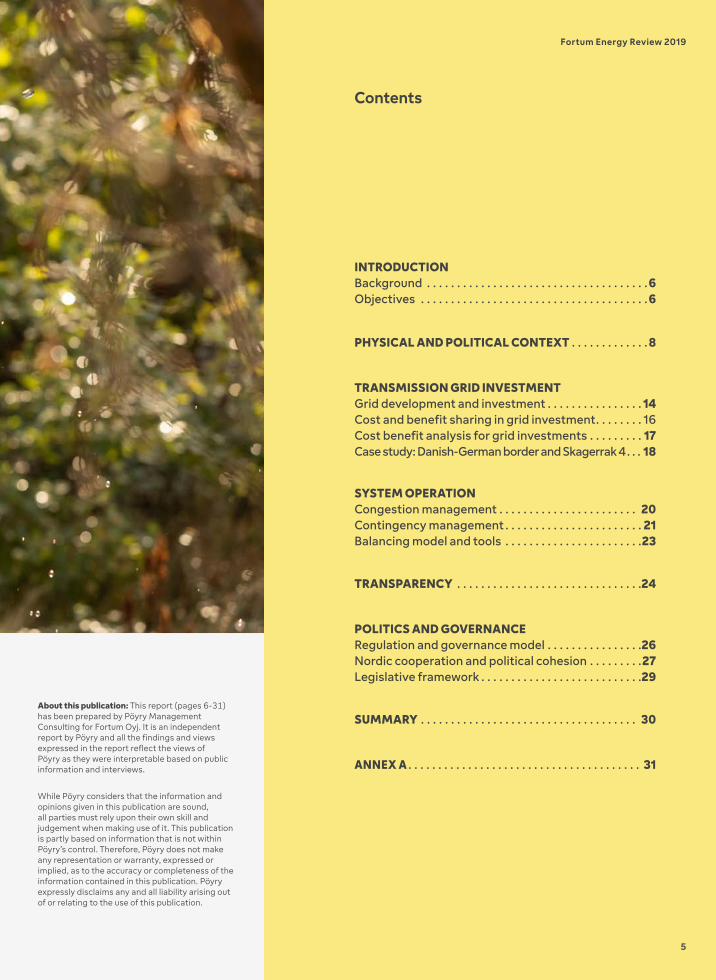
INTRODUCTION Background . . . . . . . . . . . . . . . . . . . . . . . . . . . . . . . . . . . . .6 Objectives . . . . . . . . . . . . . . . . . . . . . . . . . . . . . . . . . . . . . .6
PHYSICAL AND POLITICAL CONTEXT . . . . . . . . . . . . . 8
TRANSMISSION GRID INVESTMENT Grid development and investment . . . . . . . . . . . . . . . . 14 Cost and benefit sharing in grid investment . . . . . . . . 16 Cost benefit analysis for grid investments . . . . . . . . . 17 Case study: Danish-German border and Skagerrak 4 . . . 18
SYSTEM OPERATION Congestion management . . . . . . . . . . . . . . . . . . . . . . . 20 Contingency management . . . . . . . . . . . . . . . . . . . . . . . 21 Balancing model and tools . . . . . . . . . . . . . . . . . . . . . . .23
TRANSPARENCY . . . . . . . . . . . . . . . . . . . . . . . . . . . . . . .24
POLITICS AND GOVERNANCE Regulation and governance model . . . . . . . . . . . . . . . .26 Nordic cooperation and political cohesion . . . . . . . . .27 Legislative framework . . . . . . . . . . . . . . . . . . . . . . . . . . .29
SUMMARY . . . . . . . . . . . . . . . . . . . . . . . . . . . . . . . . . . . . 30
ANNEX A . . . . . . . . . . . . . . . . . . . . . . . . . . . . . . . . . . . . . . . 31
About this publication: This report (pages 6-31)has been prepared by Pöyry Management Consulting for Fortum Oyj. It is an independent report by Pöyry and all the findings and views expressed in the report reflect the views of Pöyry as they were interpretable based on public information and interviews.
While Pöyry considers that the information and opinions given in this publication are sound, all parties must rely upon their own skill and judgement when making use of it. This publication is partly based on information that is not within Pöyry’s control. Therefore, Pöyry does not make any representation or warranty, expressed or implied, as to the accuracy or completeness of the information contained in this publication. Pöyry expressly disclaims any and all liability arising out of or relating to the use of this publication.
5
Fortum Energy Review 2019
Background
N ordic TSOs have a pivotal role in the electricity system, with responsibil-ity for system operation and transmission grid
development as well as key aspects of design of the electricity markets. Despite a strong history of collabora-tion, the organisational arrangements, governance structures and ways of performing statutory tasks differ signif-icantly between the Nordic TSOs. These differences are due to the historical background and physical reality of the transmission systems as well as differ-ences in national legislation and energy policy. Such differences may inhibit further steps to harmonise and integrate the Nordic and wider European elec-tricity market, despite declared political intentions.
Harmonisation and integration of national electricity markets as a single Nordic regional market has so far been voluntary, and to date each step has provided benefits for each country fairly evenly. After the simple ‘win-win’ joint initiatives of the early days of coop-eration, the benefits of further steps towards harmonisation may not be shared as equally. However, the eco-nomic benefits from further harmonisa-tion and co-operation are still large and will increase further as the electricity systems continue to transform in sup-port of decarbonised economies.
One key area is grid development and investment, which is frequently driven by national legislation and politics, when a regional approach could yield better outcomes. The Nordic grid devel-opment plans are compilations based on national plans and consensus, not (solely) on integrated analysis and com-mon socio-economic trade-off. Previous
cross-border investments have given mutual benefit; but increasingly the ben-efits of additional investments are asym-metric; and within the range of plausible future outcomes one of the countries may actually face welfare losses arising from the investment.
Investments are considered indi-vidually and despite the TSOs having considerable freedom to share costs and congestion revenues in innovative ways, there tends to be limited support from the country with less to gain (and more to lose).
Nordic TSOs are the key enablers of Nordic electricity market harmoni-sation. Ultimately, their operations are governed by the set of European and national legislation, statutory license obligations, and a number of regulatory priorities and incentives – topped with the national political expectations. This may lead to the situation where transmission infrastructure and system operations are optimised differently in the various Nordic countries. This report aims to shine a light on the dif-ferences between Nordic TSOs, their underlying drivers of behaviour, and to highlight the issue that the Nordic energy system would benefit from a more harmonised regional perspective.
ObjectivesThe purpose of the study is to under-stand the behaviour, and underlying obligations and incentives of the Nor-dic TSOs; specifically how and in what circumstances these support Nordic regional (or wider European) interests, or give precedence to national require-ments. Our aim is to support an open discussion on the differences in Nordic TSOs’ operations in a way that makes it possible to help stakeholders better understand the situation of the TSOs
and their behaviours and also to iden-tify areas where TSOs could align more closely to deliver Nordic (and European) benefits. More detailed objectives of the study are as follows:• to bring up the main differences in
Nordic TSO operations, rules and practices as-is;
• to understand and explain differ-ences and the underlying drivers behind the differences;
• to understand how the differences may be explained by TSOs’ national or regional interests; and
• to make high level recommendations for opportunities to witness and obtain Nordic socio-economic bene-fit (“Nordisk Nytta”).Our purpose is to support construc-
tive debate around the activities of the Nordic TSOs and how the differences are reflected in the Nordic cooperation. While differences are discussed, we do not assess or compare the ways in which Nordic TSOs are executing their statutory tasks. Neither do we sug-gest solutions for the issues where the differences may lead to unoptimised solutions.
For the market parties, the study is intended to increase the understanding of the perspectives of Nordic TSOs. Sometimes there is criticism on the TSO operations and the pace of Nordic harmonisation from the market parties, even though a lot of good development has happened over the years. We have observed this perception in our own mul-ti-client work on Nordic market design. In order to understand the whole, the reader has to understand the national and Nordic context.
For the TSOs, the study provides material to discuss opportunities for harmonisation that result in Nordic socio-economic benefit. The report also
1 Introduction
6
Fortum Energy Review 2019
brings up the views of key stakeholders on the further cooperation and harmoni-sation of Nordic TSOs operations.
Public authorities such as ministries and national regulatory authorities (NRAs) can benefit from the study by understanding better their vital role in promoting cooperation and harmonisa-tion in the Nordic electricity market.
The study is based on public infor-mation and a series of interviews. Public information has been collected from many data sources such as financial
statements and presentations of TSOs, network development plans, and stud-ies, reports and statistics by ENTSO-E and other international and national organisation and regulatory authori-ties. Interviews were conducted with TSOs, ministries and NRAs in each of the Nordic countries and also with the Nordic Regional Security Coordinator during June and July 2019. A list of inter-viewees can be found in Annex A, and we are very grateful for their supportive cooperation.
7
Fortum Energy Review 2019
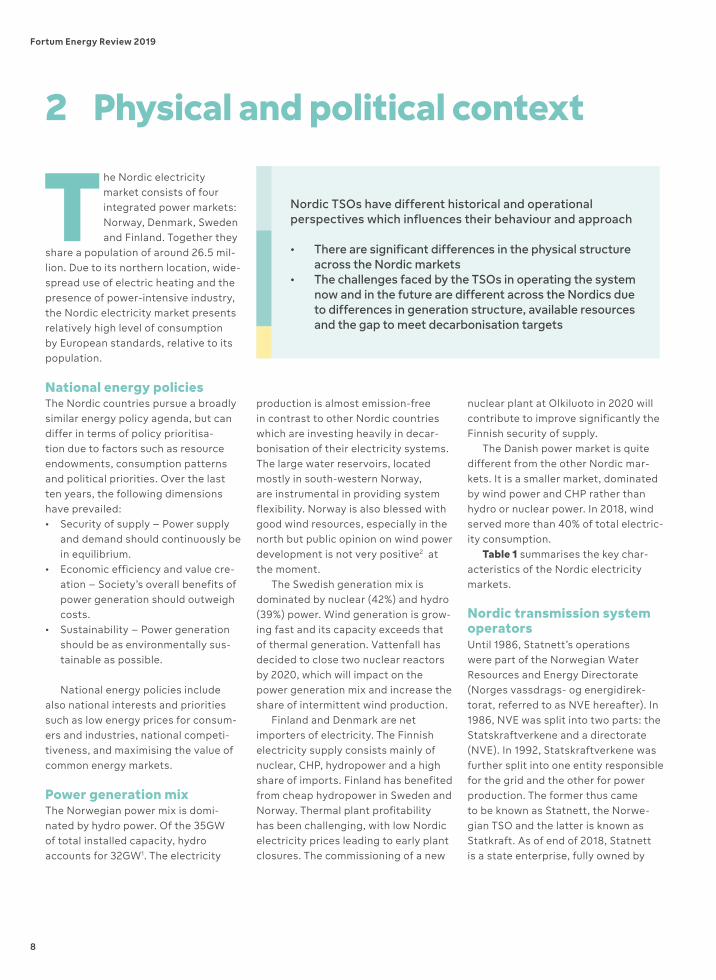
Nordic TSOs have different historical and operational perspectives which influences their behaviour and approach
• There are significant differences in the physical structure across the Nordic markets
• The challenges faced by the TSOs in operating the system now and in the future are different across the Nordics due to differences in generation structure, available resources and the gap to meet decarbonisation targets
T he Nordic electricity market consists of four integrated power markets: Norway, Denmark, Sweden and Finland. Together they
share a population of around 26.5 mil-lion. Due to its northern location, wide-spread use of electric heating and the presence of power-intensive industry, the Nordic electricity market presents relatively high level of consumption by European standards, relative to its population.
National energy policiesThe Nordic countries pursue a broadly similar energy policy agenda, but can differ in terms of policy prioritisa-tion due to factors such as resource endowments, consumption patterns and political priorities. Over the last ten years, the following dimensions have prevailed: • Security of supply – Power supply
and demand should continuously be in equilibrium.
• Economic efficiency and value cre-ation – Society’s overall benefits of power generation should outweigh costs.
• Sustainability – Power generation should be as environmentally sus-tainable as possible.
National energy policies include also national interests and priorities such as low energy prices for consum-ers and industries, national competi-tiveness, and maximising the value of common energy markets.
Power generation mixThe Norwegian power mix is domi-nated by hydro power. Of the 35GW of total installed capacity, hydro accounts for 32GW1. The electricity
production is almost emission-free in contrast to other Nordic countries which are investing heavily in decar-bonisation of their electricity systems. The large water reservoirs, located mostly in south-western Norway, are instrumental in providing system flexibility. Norway is also blessed with good wind resources, especially in the north but public opinion on wind power development is not very positive2 at the moment.
The Swedish generation mix is dominated by nuclear (42%) and hydro (39%) power. Wind generation is grow-ing fast and its capacity exceeds that of thermal generation. Vattenfall has decided to close two nuclear reactors by 2020, which will impact on the power generation mix and increase the share of intermittent wind production.
Finland and Denmark are net importers of electricity. The Finnish electricity supply consists mainly of nuclear, CHP, hydropower and a high share of imports. Finland has benefited from cheap hydropower in Sweden and Norway. Thermal plant profitability has been challenging, with low Nordic electricity prices leading to early plant closures. The commissioning of a new
nuclear plant at Olkiluoto in 2020 will contribute to improve significantly the Finnish security of supply.
The Danish power market is quite different from the other Nordic mar-kets. It is a smaller market, dominated by wind power and CHP rather than hydro or nuclear power. In 2018, wind served more than 40% of total electric-ity consumption.
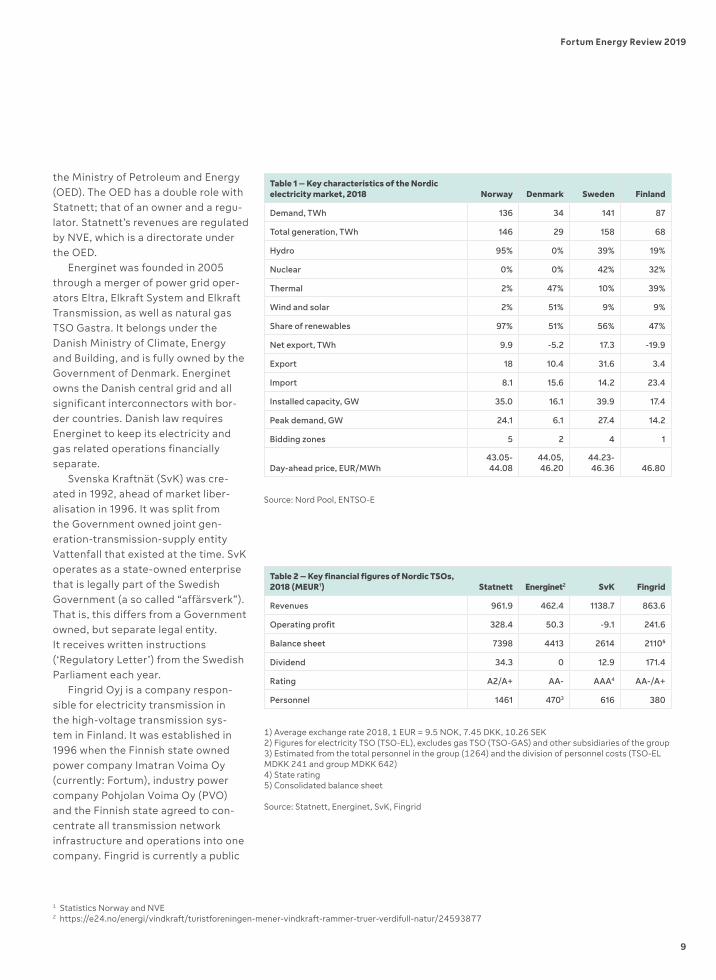
Table 1 summarises the key char-acteristics of the Nordic electricity markets.
Nordic transmission system operators Until 1986, Statnett’s operations were part of the Norwegian Water Resources and Energy Directorate (Norges vassdrags- og energidirek-torat, referred to as NVE hereafter). In 1986, NVE was split into two parts: the Statskraftverkene and a directorate (NVE). In 1992, Statskraftverkene was further split into one entity responsible for the grid and the other for power production. The former thus came to be known as Statnett, the Norwe-gian TSO and the latter is known as Statkraft. As of end of 2018, Statnett is a state enterprise, fully owned by
2 Physical and political context
8
Fortum Energy Review 2019
the Ministry of Petroleum and Energy (OED). The OED has a double role with Statnett; that of an owner and a regu-lator. Statnett’s revenues are regulated by NVE, which is a directorate under the OED.
Energinet was founded in 2005 through a merger of power grid oper-ators Eltra, Elkraft System and Elkraft Transmission, as well as natural gas TSO Gastra. It belongs under the Danish Ministry of Climate, Energy and Building, and is fully owned by the Government of Denmark. Energinet owns the Danish central grid and all significant interconnectors with bor-der countries. Danish law requires Energinet to keep its electricity and gas related operations financially separate.
Svenska Kraftnät (SvK) was cre-ated in 1992, ahead of market liber-alisation in 1996. It was split from the Government owned joint gen-eration-transmission-supply entity Vattenfall that existed at the time. SvK operates as a state-owned enterprise that is legally part of the Swedish Government (a so called “affärsverk”). That is, this differs from a Government owned, but separate legal entity. It receives written instructions (‘Regulatory Letter’) from the Swedish Parliament each year.
Fingrid Oyj is a company respon-sible for electricity transmission in the high-voltage transmission sys-tem in Finland. It was established in 1996 when the Finnish state owned power company Imatran Voima Oy (currently: Fortum), industry power company Pohjolan Voima Oy (PVO) and the Finnish state agreed to con-centrate all transmission network infrastructure and operations into one company. Fingrid is currently a public
Table 2 – Key financial figures of Nordic TSOs, 2018 (MEUR1) Statnett Energinet2 SvK Fingrid
Revenues 961.9 462.4 1138.7 863.6
Operating profit 328.4 50.3 -9.1 241.6
Balance sheet 7398 4413 2614 21105
Dividend 34.3 0 12.9 171.4
Rating A2/A+ AA- AAA4 AA-/A+
Personnel 1461 4703 616 380
1) Average exchange rate 2018, 1 EUR = 9.5 NOK, 7.45 DKK, 10.26 SEK2) Figures for electricity TSO (TSO-EL), excludes gas TSO (TSO-GAS) and other subsidiaries of the group3) Estimated from the total personnel in the group (1264) and the division of personnel costs (TSO-EL MDKK 241 and group MDKK 642)4) State rating5) Consolidated balance sheet
Source: Statnett, Energinet, SvK, Fingrid
Table 1 – Key characteristics of the Nordic electricity market, 2018 Norway Denmark Sweden Finland
Demand, TWh 136 34 141 87
Total generation, TWh 146 29 158 68
Hydro 95% 0% 39% 19%
Nuclear 0% 0% 42% 32%
Thermal 2% 47% 10% 39%
Wind and solar 2% 51% 9% 9%
Share of renewables 97% 51% 56% 47%
Net export, TWh 9.9 -5.2 17.3 -19.9
Export 18 10.4 31.6 3.4
Import 8.1 15.6 14.2 23.4
Installed capacity, GW 35.0 16.1 39.9 17.4
Peak demand, GW 24.1 6.1 27.4 14.2
Bidding zones 5 2 4 1
Day-ahead price, EUR/MWh43.05-44.08
44.05, 46.20
44.23-46.36 46.80
Source: Nord Pool, ENTSO-E
1 Statistics Norway and NVE2 https://e24.no/energi/vindkraft/turistforeningen-mener-vindkraft-rammer-truer-verdifull-natur/24593877
9
Fortum Energy Review 2019
10
Fortum Energy Review 2019
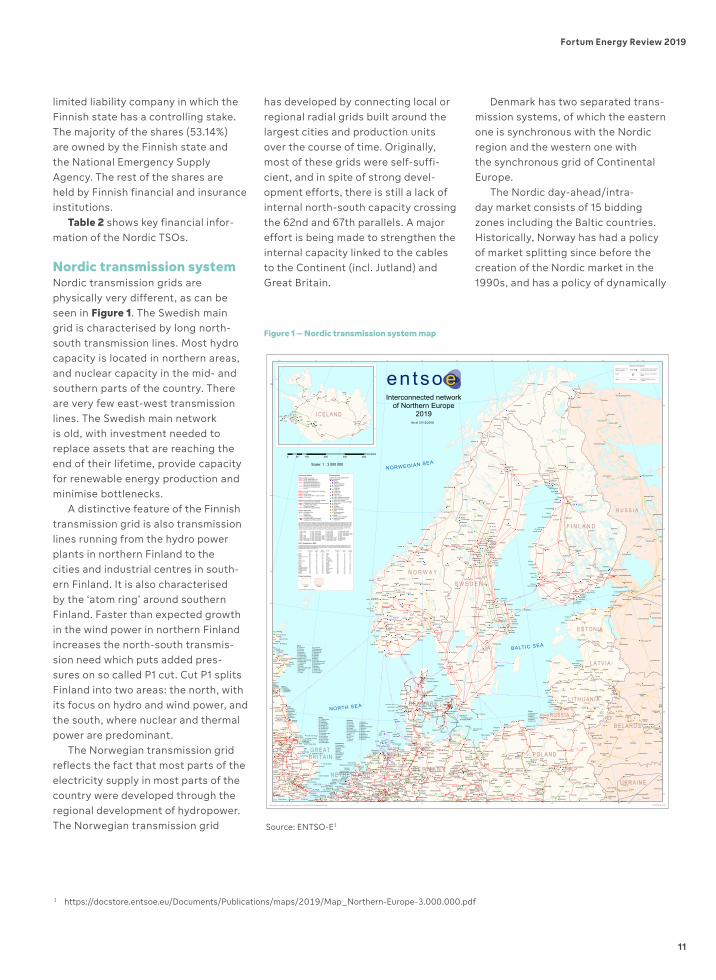
Denmark has two separated trans-mission systems, of which the eastern one is synchronous with the Nordic region and the western one with the synchronous grid of Continental Europe.
The Nordic day-ahead/intra-day market consists of 15 bidding zones including the Baltic countries. Historically, Norway has had a policy of market splitting since before the creation of the Nordic market in the 1990s, and has a policy of dynamically
has developed by connecting local or regional radial grids built around the largest cities and production units over the course of time. Originally, most of these grids were self-suffi-cient, and in spite of strong devel-opment efforts, there is still a lack of internal north-south capacity crossing the 62nd and 67th parallels. A major effort is being made to strengthen the internal capacity linked to the cables to the Continent (incl. Jutland) and Great Britain.
limited liability company in which the Finnish state has a controlling stake. The majority of the shares (53.14%) are owned by the Finnish state and the National Emergency Supply Agency. The rest of the shares are held by Finnish financial and insurance institutions.
Table 2 shows key financial infor-mation of the Nordic TSOs.
Nordic transmission systemNordic transmission grids are physically very different, as can be seen in Figure 1. The Swedish main grid is characterised by long north-south transmission lines. Most hydro capacity is located in northern areas, and nuclear capacity in the mid- and southern parts of the country. There are very few east-west transmission lines. The Swedish main network is old, with investment needed to replace assets that are reaching the end of their lifetime, provide capacity for renewable energy production and minimise bottlenecks.
A distinctive feature of the Finnish transmission grid is also transmission lines running from the hydro power plants in northern Finland to the cities and industrial centres in south-ern Finland. It is also characterised by the ‘atom ring’ around southern Finland. Faster than expected growth in the wind power in northern Finland increases the north-south transmis-sion need which puts added pres-sures on so called P1 cut. Cut P1 splits Finland into two areas: the north, with its focus on hydro and wind power, and the south, where nuclear and thermal power are predominant.
The Norwegian transmission grid reflects the fact that most parts of the electricity supply in most parts of the country were developed through the regional development of hydropower. The Norwegian transmission grid
G E R M A N Y
R U S S I A
GREATBRITAIN
ESTONIA
LATVIA
L ITHUANIA
POLAND
DENMARK
NETHERLANDS
RUSSIA
BELARUS
UKRAINE
N O R W A Y
S W E D E N
F I N L A N D
GB (3)
11
09
01 S. Manchester02 Bredbury03 Stalybridge04 Stocksbridge05 Neepsend06 Sheffield City07 Jordanthorpe08 Wincobank09 Pitsmoor10 Templeborough11 Thurcroft12 West Melton13 Ferrybridge14 Monk Fryston15 Eggborough16 Thorpe Marsh
Drumderg
Brinsworth
08
07
Lutsk pivnichna
Poland
ELSTA
Ens
Ełk
Nea
Opsa
Iver
Keadby
Hollandse kust zuid
Sloecentral Amer
Lint
Doel
Lida
Rossj
Stornorrfors
Drevlyanka
Syas
Kostomuksha
Mory
Oslo
Feda
Sima
Rana
Alta
EulaArpe
Unna
Kiel
Salo
Kymi
Vidzy
Grain
Cowes
Blythe
Keith
HurstFleet Tilburg
Claus C
Brode
Braek
Eeklo Noord
Rivne
LisovaKovel
Mozir
Pinsk
Sege
Letsi
Nikel
Titan
Pskov
Konin
Turów
Narew
Chełm
Mokre
Płock
Janów
Rożki
HasleRød
Sauda
Utena
Neris
Rhede
Ragow
Marke
Siems
Wahle
Elsen
Roxel
Diele
VoslappWedel
Farge
Lieto
Koria
Espoo
Jämsä
HikiäRauma
Ivalo
Balti EJPüssi
Tartu
PaideKiisa Emergency PP
Sindi
Harku
Eesti EJ
Trige
Tjele
Askær
Kassø
Liosna
Nereta
Cleve Hill
Thanet
Clunie
Crystal Rig
Brigg
Warley
Pelham
Eccles
Norton
Elland
Hutton
01
Sundon
01
Bolney
Cowley
Didcot
CDCL
Almere
Bergum
Zwolle
Centrale Diemen
Velsen 24/25
Holque Izegem
Hrabiv
Grodno
Slutskaya
Stärnö
Ajaure
Ritsem
Loukhi
Adamów
SłupskWierzbięcino
PuławyLublin
Zamość
Kielce
Zgierz
Recław
Police
Glinki
Dunowo
Ostrów
Czarna
Gorzów
Żydowo
Pątnów
Halden
Bergen
Salten
Ofoten
Narvik
Jonava
Alytus
Kaunas
Imanta
Līksna
Vörden
Wessin
Meppen
Pulgar
Lubmin
Thyrow
Taucha
Lübeck
Audorf/Süd
Lehrte
Meißen
Eickum
Borken
Nehden
Gronau
15
Ohligs
Utfort
Reuter
Mehrum
Heyden
Voerde
Imatra
Kopula
Forssa
Ulvila
Utanen
Nuojua
Sellee
Oshmani
Pabradė
Postavy
Zarasai
Alūksne
Ruusmäe
Kemsley
Walpole
Kintore
1204
Enderby
Tealing
Padiham
03
Whitegate
Nechells
02
12
Rowdown
13
Chessington
Amersham Main
Laleham
St. Johns Wood
Bramley
Coryton
Killingholme
MeedenWeiwerd
Hengelo
Boxmeer
Crayestein
Warande
Brest-2
Lapichi
Polock
Vitebsk
Borisov
Smorgon
Brest-1
Borgvik
Sovetsk
Segezha
Chudovo
Wrocław
Olsztyn
Miłosna
Aniołów
Leśniów
Krajnik
Sylling
Aurland
Ørskog
Nedre Røssåga
Lauksargiai
Vėjas 1
Benaičiai
BtB
Vilnius
Telšiai
Bitėnai
RēzekneAizkraukle
ViskaļiBrocēni
Grobiņa
Baltic 1
SylWin
BorWin
HelWin
AlphaVentus
DolWin
Enniger
Boxberg
Marzahn
Güstrow
Görries
Krümmel
Hattorf
Kiel/West
Kiel-Süd
Hamburg-NordKummerfeld
Lahe
Stadorf
Godenau
Itzehoe
Dollern
Sottrum
Wilster
Wechold
Lage
Waldeck
Hagermarsch
Hesseln
Emden/Ost
11Bixterheide
Altenkleusheim
12
09
Mündelheim
07
16
Pfalzdorf
1819
20
21
StöckenEmsland
Rostock
Grohnde
Huntorf
Rönkhausen
Toppila
AnttilaMussalo
Inkoo
Kellosaari
Toivila
Tuovila
Utsjoki
RakvereAruküla
Fraugde
Ferslev
Malling
Nesterov
Kybartai
Voronovo
Podoljci
ParovėjaSt. Fillans
Clashindarroch
Offerton
Bramford
Ninfield
Lackenby
Thornton
Coventry
Rochdale
Bushbury
Lovedean
Melksham
Sizewell
Drakelow
Moerdijk
Lelystad
Oostzaan
Borssele
Woestyne Van Eyck
HezeMercator
Zhytomyrska
Koziatyn
Miradino
Stolbtsy
Forsmark
Svartbyn
Ringhals
Hisingen
Suoyarvi
Połaniec
Ołtarzew
Towarowa
RogowiecPiotrków
Gdańsk I
Jasiniec
Plewiska
Mikułowa
Żukowice
Kirkenes
Skogfoss
Eidfjord
Pagėgiai
Šiauliai
Klaipėda
Putinai
Valmiera
Alfstedt
Bärwalde
Preilack
StreumenSchmölln
Pasewalk
Lüneburg
Schkopau
Brokdorf
Veltheim
Alholmen
Lielahti
Vuosaari
Naantali
Isohaara
Isoniemi
Tammisto
Alajärvi
Alapitkä
Jylkkä
Keminmaa
Horns Rev 1
Idomlund
Kalveliai
Tornehamn
Hart Moor
Sellindge
Immingham
Torness
13
Lynemouth
Braintree
Saltholme
Tynemouth
14
Kirkstall
Poppleton
Westfield
BerkswellFeckenham
Wymondley
Rye House
Dungeness
Peterhead
WillingtonEemshaven
Westerlee
Louwsmeer
Zeyerveen
Hessenweg
Bleiswijk
Dodewaard
EindhovenZandvliet
MandarinsEchinghen
Ringvaart Radyvyliv
Kalijnaja
Vaple
Stockholm
Kruseberg
Sortavalskaya
Lyaskelya
Kondopoga
Vykhodnoy
Kozienice
Ostrołęka B
Białystok
Ostrowiec
Piaseczno
Sochaczew
Radkowice
Pabianice
Trębaczew
Czerwonak
Polkowice
Morzyczyn
Bełchatów
Żarnowiec
Samnanger
Stavanger
Liastølen
Orkdal
Svartisen
Balsfjord
Panevėžys
Jurbarkas
Salaspils
Rīgas
Würgassen
Bentwisch
Graustein
Vierraden
Wuhlheide
Perleberg
Herrenwyk
Buschhaus
Göttingen
Hardegsen
Blockland
St. Hülfe
Gütersloh
Ovenstädt
Twistetal
Wolfsburg
Flensburg
Helmstedt
Erzhausen
Bergkamen
Olkiluoto
Kristiina
Meri-Pori
Kymijärvi
Hanasaari
Suomenoja
Uusnivala
Huittinen
Visulahti
YllikkäläLavianvuori
Seinäjoki
Vuolijoki
Haapavesi
Pyhäkoski
Vajukoski
Kingstrup
Fourstones
Tullo
Causeymire
FawleyCHP
Hill of Towie
Skelton G.
Mossmorran
Hartlepool
Greystones
Stoneywood
Spennymoor
Osbaldwick
Cellarhead
Beddington
Staythorpe
Drax
Prinses Amalia
Wateringen
Gelderland
Oudehaske
Doetinchem
Amer 9
CentraleMaasvlakte
Lage Weide
Rodenhuize Shepetivka
Lutsk Pivdenna
Osipovichi
Koljadichi
Molodechno
Oskarshamn
Kimstad
Skogssäter
Olenegorsk
Abramowice
Podolszyce
DolnaOdra
Ulla-Førre
Tonstad
Tunnsjødal
Hammerfest
Lietuvos E
Mažeikiai
Ķeguma HES
Daugavpils
Lauchstädt
Ibbenbüren
Wustermark
Gleidingen
Conneforde
Lüstringen
Unterweser
Lippendorf
Hallendorf
Tahkoluoto
Wisaforest
Salmisaari
Petäjävesi
Nurmijärvi
HuutokoskiVihtavuori
Pyhänselkä
Seitakorva
Kokkosniva
Vaskiluoto
BjæverskovFynsværket
Leipalingis
Šalčininkai
Didžiasalis
Tsirguliina
Bicker Fenn
Glens of Foundland
Quixwood
West Boldon
Eaton Socon
Botley Wood
East Caydon
Stella West
West Burton
Simonshaven
Herdersbrug
Massenhoven
Novovolynsk
Mogilev 220
Beloruskaja
Ivatsevichi
Harsprånget
Monchegorsk
Vyborgskaya
Severnaya-330
Toruń Elana
Sunndalsøra
Kruonio HAE
Rīgas TEC 2
Rīgas TEC 1
Pļaviņu HES
Hamburg-Süd
Jänschwalde
Wilmersdorf
Lüdershagen
Dresden-Süd
WolmirstedtAlgermissen
Förderstedt
Brunsbüttel
Ganderkesee
Bergshausen
Keljonlahti
Seitenoikea
Pirttikoski
Taivalkoski
Ossauskoski
Asnæsværket
NorwichMain
Burwell Main
Grimsby West
Blackhillock
High Marnham
Vierverlaten
Les attaques
Mikashevichi
Järpströmmen
Gatchinskaya
Petrozavodsk
Ondskaya HPP-4
Pasikurowice
Stalowa Wola
Kristiansand
Varangerbotn
Ignalina
Stendal West
Hamburg-Ost
Niederlangen
Landesbergen
Naistenlahti
Martinlaakso
Petäjäskoski
Valajaskoski
Landerupgård
Ensted
Stevens Croft
Peterborough
Bradford West
06
Rivnenska NPP
Novgorodskaya
Kol'skaya NPP
Starorusskaya
PiłaKrzewina
Olsztyn Mątki
Kielce Piaski
Gdańsk Błonie
Freiberg/Nord
IvenSiedenbrünzow
HannoverWest
Paderborn-Süd
Sandershausen
Westerkappeln
Werne-Stockum
Wilhelmshaven
Vanttauskoski
Iru
Esbjergværket
Patford Bridge
Spalding North
Great Yarmouth
Little Barford
Merwerdekanaal
MinskajaTEC 5
Svetlogorskaja
Leningradskaya
Medvezh'egorsk
Kaitakoski HPP-4
Yugo-Zapadnaya
Novosokol'niki
Kingiseppskaya
Velikoretskaya
Pskovskaya TPP
LesznoGronowo
SchwarzePumpe
Wolkramshausen
Stigsnæs
Vester Hassing
Greater Gabbard
Khmelnytska NPP
Zelvenskaja
Baranovichi
Kamennogorskaya
Putkinskaya HPP-9
Knyazhegubskaya
WłocławekAzoty
PoznańPołudnie
Klostermansfeld
Cloppenburg Ost
Studstrupværket
Canterbury
DobrotvirskaTPP
LukomlskajaGRES
Saint-Petersburg
Petrozavodskmash
Huta Częstochowa
BydgoszczZachód
Putlitz
Eisenhüttenstadt
BrandenburgWest
Großschwab-hausen
BerjezovskajaGRES
ZhlobinZapadnaja
BobrujskajaTEC 2
Grudziądz Węgrowo
Bertikow
MogilevskajaTEC 2
Vostotsnaya
Svetlogorskaja TEC
Novopolotskaja TEC
Kirishskaya TPP
BełchatówKopalnia
Nordjyllandsværket
Svetogorskaya HPP-11
Krivoporozhskaya HPP-14
WindparkSchönewalde
Nizhne-Svirskaya HPP-9
Borisoglebskaya HPP-8
Severo-Zapadnaya CHPP
Serebryanskaya HPP-15
Kaliningradskaya CHPP-2
Anholt
Grodnenskaja TEC
Mogilev-Severni
16
Elstree10 09
Malchow
Linde
Opladen
1310
Neurath
Lippborg1722
05
Hams Hall
0803
15
Beverwijk
Barsebäck
Joachimów
Bišuciems
Hattingen08
Pikkarala
Grangetown
14
Culham Jet
11
MaasbrachtGravelines
Neuenhagen
Wehrendorf
Kusenhorst
14
Länsisalmi
Cockenzie
Penmanshiel
12
South Humber Bank
Creyke Beck
Littlebrook
10
Hagenwerder
Hennigsdorf
Niederrhein
02
07
13
04
W. Weybridge
TeufelsbruchKlein Ilsede
Gersteinwerk
Frimmersdorf
11 Rayleigh Main
Hawthorne Pit
South Shields
BielefeldOst
Bechterdissen
Skærbækværket
05
Friedrichshain
Geertruidenberg
LeightonBuzzard
Braunschweig Nord
H.C.Ørsted-værketAmager-værket
Knippegroen
01 Bertrange02 Bascharage03 Belval04 Oxylux05 Esch06 Schifflange07 Berchem08 Heisdorf09 Sotel10 Blooren
København
Luxembourg
Nursling
14
01 Komorowice02 Czeczot03 Bieruń04 Jaworzno III05 Łaziska06 Kopanina
06
Grendon
10
Kalix
Hanekenfähr
Polsum
2324
Elverlingsen
Baltic 2
00 Zukunft01 Siersdorf02 Oberzier03 Paffendorf04 Neurath05 Niederaußem06 Rommerskirchen07 Gohrpunkt08 Norf09 St. Peter10 Eller11 Osterath12 Dülken
13 Selbeck14 Büscherhof15 Eiberg16 Rosenblumendelle17 Scholven18 Witten19 Koepchenwerk20 Kruckel21 Elmenhorst22 Dortmund23 Pöppinghausen24 Bochum
Germany
Rødsand 2Rødsand 1
Horns Rev 2Revsing
Valka
Endrup
Charlottenburg Lichterfelde
Emden/BorßumMaade
Adamselv
Kvænangsbotn
Guolasjakka
Skibotn
Straumsmo
Innset
Sildvik
Kobbelv
Skomen
Trollheim
Grana
Brattset
Litjfossen
Ulset
Aura
Rendalen
HarpefossenNedre Vinstra
Øvre Vinstra
JostedalSkagen-Fortun
Leirdøla
Årøy
Borgund
Heimsil 1Heimsil 2
Nes
Refsdal
Åskara
Høyanger
Steinsland
Dale Evanger
Mauranger
Hove
Mongstad
Blåfalli
Oksla
Tysso
Røldal NovleKvanndalKjela
Vemork Såheim
Songa
Vinje
SundsbarmTokke
Karstø
Hylen
SaurdalKvilldal
Holen
UvdalNore
Hekni
Brokke
Finndøla
Fjone
Jørundland
SolhomTjørhom
Kvinen
RoskreppDuge
Tjodan
Ana-Sira
Lindome
Senneby
Tingsbacka
Untra
Anjala
Joutseno
Kaanaa
Kaukas
Kaukopää
Neste Porvoo
Kemi
Kirkniemi
Joensuu
Kuusaanniemi
Kuusankoski Mertaniemi
Metsä-Rauma
Nuottasaari
Loviisa
Pursiala
Uimaharju
Veitsiluoto
Äänekoski
Harjavalta
Jylhämä
Melo
Pamilo
Pälli
Raasakka
15
Moorburg
Reuter West
Niederwartha
PCK Schwedt
Tainionkoski
TotalExxon
Bligh bankBank Zonder Naam
Vietas
SeitevarePorjus
LiggaMessaure
Gejmån GardikforsJuktan
Stalon Grundfors
Storbäck
Vagfors
Blåsjön
Linnvasselv
Junsterforsen
GäddedeKorsselbränna
Bågede
Havsnäs
Stenkullafors
Åsele
Hällby
Näverede
Gulsele
DegerforsenLångbjörnLasele
Storfinnforsen
Ramsele Kilforsen
BetåsenNämforsen
Forsmo
Hjälta
Tuggen
MolidenKattstrupeforsen
Midskog
Stugun
Svarthålsforsen
Gammalänge
Moforsen
Stensjön
OldenJuveln
MörsilSällsjö
Krångede Stadsforsen
Hölleforsen
Järkvissle
Långå
Trångfors
Sveg
Rätan
Turinge
ÅngeTorpshammar
Järnvägsforsen
Nysäter
Hällsjö
Bandsjö
LjusdalLaforsen
Dönje
Söderala
Ockelbo
BäsnaRepbäcken
Hofors
Horndal
Ängsberg
Finnböle
Valbo
StackboDannebo
Morgårdshammar
Lindbacka
Hallsberg
Himmeta
Arosverket
Finnslätten
Starfors
BredåkerTuna
Hallstavik
Malsta
Åker
Hamra Odensala
Gråska
Vallentuna
EkuddenSolberga
Hall
Kolbotten
Hedenlunda
Glan
TimmersdalaMoholm
Kolstad
KilandaBarkeryd
Tenhult
Uddebo
Stenkullen
Strömma
Horred
Häradsbo
BrearedAlvesta
Nybro
HemsjöKarlshamm
Söderåsen
Arrie
Högåsen
Forsse
BoländernaPlenninge
Łomża
Siso
Lomi
Brattsberg
Driva
Smøla
Hitra
Bessakerfjellet
Grytten
Tafjord
Framruste
Tyin
LomenÅbjøra
Bagn
Torpa
Hunderfossen
Kaggefoss
Rånåfossen
Kykkelsrud
Vamma
Hjartdøla
Høg-Jæren
Steinfoss
Pątnów II PP
Westereems
ECW
Den Haag
Ijmond
Grodno Juznaya
Hurva
Borrby
Tsentralnaya
Siedlce UjrzanówMościska
Żerań CHP
Siekierki CHP
Kromolice
Tymień
KarścinoPobłocie
Karcino
Tychowo (1)
Margonin
Dychów
SchoonebeekNAM
Bornholm
Tume
Winergy VPVentspils
Pątnów PP
WłocławekPłockCHP
Wrocław CHP
Gdańsk 2 CHP
Poznań-Karolin CHP
Lublin-Wrotków CHP
ZielonaGóra CHP
Aulepa
Dörpen/West
Heide/West
beta
alpha
alpha
beta
betaalpha
Riffgat
EemshavenRobbenplaat
Horns Rev 3
Kriegers Flakalpha
gamma
gamma
Sandtorstraße
Kangasala
Kristinestad
Gordonstown Hill
Mid Hill
Lincs
London Array
Bardy-Dygowo
Darłowo
Čiūteliai
Ełk BIS
Inhausen
Nordergründe
Tessenderlo
Stevin
Inesco
Belorusskaya AE
SevernajaTEC 4
D.Les
Kondopoga (16)
Ust'-Luga
Luzhskaya
Novgorodskaya CHPP
Fardal in Sogn
Höljes
Charlottenberg
Eidskog
Lutufallet
Mörap
Krustpils
Paldiski
Stanisławów
Pągów
Chwiram
Hirvisuo
Aikengall
Ratcliffe-on-Soar
Blaiken
Trattberget
Råbäcken
FlensburgJardelund
Götzdorf
Altentreptow/Nord
Horta
Szczecin CHPSheringham Shoal
Thornton bank
Kuolajärvi
Isokangas
Bräcke
Mörttjärnberget
Nordiåsen
Östansjö
Kilingi-Nomme
Marszewo
GdańskPrzyjaźń
Pelplin
ŻydowoKierzkowo
Korsze
Pomorzany
Iłża II
Šyša
Camster
Burn of Whilk
Gordonbush
Boulfruich
Boyndie
Rothes I
Dummuies
Markinch
Humber GatewayHedon
King’s Lynn
Westermost Rough
Altentreptow/Süd
Putlitz/Süd
Parchim/Süd
Heinersdorf
Gransee
Jessen/Nord
Wilton
17
Bergeforsen
Krokströmmen
Trängslet
Älvkarleby
Trollhättan
Ryaverket
Öresundsverket
Linköping
Händelöverket
Åbyverket
Värtaverket
Uppsala
Loviseholm
Harrsele
Högnäs
Kvistforsen
Gallejaur
Bastusel
Djuptjärn
Akkats
Porsi
Laxede
Ohlensehlen
Süderdonn
Wikinger
Arkona-BeckenSüdost
Zelenogorskaya
Nygard
Banie
Korytnica
Krobia
Osieki
Auvere EJ
Baczyna
Włocławek CHP
Rilland
Strepeikiai
Kreivėnai
Geišiai
Šiauduva
Didšiliai
Sūdėnai
Kunigiškiai
Panevėžio E
MūšaKabaldikai
Kiisa
Peittoo
Metsälä
Torkkola
Santavuori
Mustilankangas
Tohkoja
Sarvankangas
Kivivaara Peuravaara
Myllykangas
Simo
NemoGezelle
Van Maerlant
Borssele 1-4
Lillo
Borssele 30
Krimpen
MaastroomRijnmond
Maasvlakte
CentraleRotterdam Eurogen
ROCA
Luchterduinen
Hollandse kust Noord
Egmondaan Zee
Hemweg 8 & 9Diemen
Maxima Centrale
Fryslan
Magnum
Delfzijl Zuid
Claus AMeerhout
Mitte
Niedervieland
LubiechniaWielka
Resko 2
Lubartów
Orłowo
Shoreham
Canterbury North
1819
20
Gunfleet Sands II
Gunfleet Sands I
Scroby Sands
Sutton Bridge
Bustleholm
Inner DowsingStoke Bardolph
Cottam
Saltend South
Chesterfield
Aldwarke
15
16
GB (2)
01 Earlstoun02 Glenlee03 Carsfad04 Kendoon05 Dalswinton06 Galawhistle07 Calder Water08 Andershaw09 Black Law Extension10 Fallago Rig11 Toddleburn12 Fallago13 Pogbie14 Dun Law Extension15 Keiths Hill16 Shrubhill17 Currie
TeessideTod Point
Long Park
Smeaton
18 Longannet19 Grangemouth20 Bonnybridge21 Easterhouse22 Glasgow23 Giffnock24 Neilston25 Busby26 Whitelee27 East Kilbride South28 West Browncastle29 Strathaven30 Wishaw31 Newarthill32 Clydes Mill33 Harburn Head34 Tormywheel
Persley
Edintore
Rothes IIBeinn Tharsuinn
Baillie & Bernaheig
Leningradskaya NPP
Koporskaya
Herslev
Gørløse
Avedøreværket
Kyndbyværket
Namskogan
Strinda
KlæbuSurna
Vågåmo
Ørsta
Ålfoten
Moskog
Hovegård
Gemini
MeyGen
Corby
Kolsvik
Trofors
Bardufoss
Ådal
Ringerike
Follo
Flesaker
Tegneby
Tveiten
Grenland Porsgrund
Bamble
Lindås
Åfjord
Snilldal
Teglstrupgård
Husum/Nord
50HzTTenneT DE
Rentel bank
Walsum
Wyszków
Darbenai
Garenfeld
DattelnLippe
Pregol'skayaTPP
Handewitt
T-Point
Spittal
Beatrice
Hywind
Thurso South
6
2
(220
)
330
420
150
15
3
Nord Balt
SylWin1
NordLink - 525 kV
KS 1
Nor
Ned
- 45
0 kV
BorWin2
North Sea Link 5
00 kV
BorWin1
SwePol
11
DolW
in2
BorW
in3
DolW
in1
350 SK 3
275
275
18
Cobr
a ca
ble
8
250 SK 1+2
HelWin2
HelWin1
26
Riffgat
Fenno-Skan 2 (500kV)
285 KS 2
CO
BRA
cabl
e
DolWin3
285
210
BritNed - 450 kV
SK3 350 kV
Estlink 2
19
ÅL-Link (80 kV)
20
380+
220
400 kV
SK 1 & 2 250 kV
SK4 500 kV
400kV
alpha ventus
Cai
thne
ss M
oray
HVD
C
120
110
150
kV A
C
275 kV
Konti-Skan
(60 kV)
150 k (Estlink)
380+150
KON
TEK
275kV
275kV
220+
110
Wah
le-M
eckl
ar
Operates as 220 kV (single circuit)
220
220
Nordergründe
Fenn
o-Sk
an 1
400
kV
Temporary out of operation
Baltic
Cab
le 4
00 k
V
Balti
c C
able
400
kV
Connection line refers to one of 13 units
4 circuits
L543
BO
YS
-HA
E
Operates as 220 kV
(60 kV)BOYS-HAE
110 kV
110
kV
Radial operationRadial operation
One circuit (to Olsztyn) operates as 220 kV
One circuit (to Olsztyn) operates as 220 kV
VYK-MBT380
DES-W
EW220
Dol
Win
3D
olW
in 3
275k
V
Temporary out of operation
275kV
400kV
275kV
275kV
400k
V
North Sea Link 5
00 kV
Nor
Ned
- 45
0 kV
Cai
thne
ss M
oray
HV
DC
275kV
400kV
275kV
275kV
Nord Balt
400kV
275kV
400kV
18
275kV
275kV
275kV
220
400kV
400kV
400kV
275kV
220
275kV
275kV
275kV
275kV
SK4 500 kV
275k
V
400k
V
110
400k
V
18
275kV
SwePol
400kV
275kV
400k
V
275kV
400kV
400kV
400kV
275k
V
275kV
275kV
275kV
400kV
400k
V
400kV
275kV
400kV
400k
V
400kV
400kV
275k
V
400kV
Fenn
o-Sk
an 2
(500
kV)
400k
V
400k
V
400kV
400kV
380+
220
275kV
330
400kV
400kV
400kV27
5kV
210
275kV
275kV
400kV
275kV
400kV
400kV
400k
V
150
k (E
stlin
k)
400kV400kV400kV
400kV
110
400kV
220+110
400kV
150 kV AC
275kV
275k
V
275k
V
275kV
275kV
400k
V
400kV
Estlink 2
275kV
275kV
275k
V
400kV
275kV
330
400kV
400kV
275kV
275k
V
400kV
400kV
275kV
400kV
275kV
275kV
275kV
275kV275k
V
150
kV A
C
275kV
400k
V
275k
V
400kV
275k
V
275kV400kV
275k
V
275k
V27
5kV
275k
V
400kV
275k
V
275kV
400kV
400k
V
275k
V
400kV
Baltic Cable 400 kV
275kV
8
275kV
18
400kV
400kV
ÅL-Link (80 kV)
400k
V
400k
V
400k
V
400kV
150
400kV
400k
V
400k
V
275kV
110
275k
V
400kV
275kV
275kV
275kV
275kV
400kV
Fenno-Skan 1 400 kV
110
275kV
275kV
400kV
275k
V
275kV
275kV
400kV
400k
V
275k
V
275k
V
400k
V
275kV
275kV
BritNed - 450 kV
400kV
275kV
400kV
400kV
400kV
400kV
275kV
400kV
400kV275k
V
380+220
400kV
400kV
400kV
110
400kV
275k
V
400kV
400k
V
275kV
400kV
400kV
275k
V
400k
V
275kV
275kV
70°N
65°N
60°N
55°N
50°N
70°N
65°N
60°N
55°N
50°N
40°E35°E30°E25°E20°E15°E10°E5°E0°5°W10°W
40°E
35°E
30°E
25°E20°E15°E10°E5°E0°
5°W
10°W
Scale: 1 : 3 000 000
Information compiled under the responsibility of the ENTSO-E Data Expert Group.
Interconnected networkof Northern Europe
2019As of 31/12/2018
ICELANDREY SVA
KRA
FLJ
BUR
SUL
SIG
HRA
VAF
SOGKOL
NES
KOROLD
BLA
ESK
VAT
BRE
FIT
HEL
GEH
PRE HOL
TEH
EYV
HRY
RAN
VAR
HRU
LAVGLE
GED
MJO
RAU
HAM
THR
BakkiHNJ
SI3 HR1
LV2
SU2
VF1
HF1
SI2
FI2
HR1
65°N
65°N
15°W
20°W25°W
15°W20°W
25°W
© ENTSO-E 2019
Source of information
ENTSO-E members andobserver members
Russia
Ukraine
European Network of TransmissionSystem Operators for Electricity
System Operators of the UPS ofRussia
UKRENERGO National PowerCompany
BALTIC SEA
NORTH SEA
NORWEGIAN SEA
Lines and cables Power plantsDifferent voltages (colours) 750 kV transmission line 500 kV transmission line 380-400 kV transmission line 300-330 kV transmission line 220-275 kV transmission line 110-150 kV transmission line DC-line
Symbols for under operation andunder construction Biogas Biomass Brown coal/Lignite Coal derived gas Fossil fuel Fossil gas Fossil oil Fossil peat Geothermal Hard coal Hydro marine Hydro mixed pump storage Hydro pure pump storage Hydro pure storage Hydro run of river and pondage Mixed fuels Nuclear Oil shale Other fossil fuel Other (not listed) Solar Solar photovoltaic Solar thermic Waste Waste (non renewable) Waste (renewable) Wind farm
Different lines (for all voltages) under operation 1 circuit Double circuit Double circuit with 1 circuit mounted >= 3 circuits
Additional information for all lines and voltages Under construction (dashed) Underground (for onshore lines and cables) Currently used voltage Temporary voltage Numeral as explained below
Connection line Substation Phase shifter Converter station Converter station back-to-back Substation(s) & Power plant(s)
Other elements
The map is a comprehensive illustration of the interconnected networks, it shows existing elements and those under construc-tion: power plants, converters, substations and high-voltage cables/lines with towers designed for voltages of a) 220 kV andhigher b) 110 kV to 150 kV in the areas of Cyprus, Denmark, Iceland, Israel/PA and Norway and c) 110 kV to 150 kV if theselines cross national frontiers and are operated by TSOs. If the operation voltage differs from that indicated by the colour, thisvoltage is given alongside the line. Lines with more than 2 circuits bear a numeral that is explained below. The first numberindicates the number of circuits and the voltage at the final stage of construction (depending on the design of towers); thenumerals in brackets indicate the number of circuits and the voltage at the present stage of construction.
1 1x380 + 2x220 2 2x380 + 2x220 3 3x380 4 4x380 5 4x380 + 2x220 6 2x380 + 1x220 7 2x380 + 4x220 8 2x380 + 2x220 (1x380) 9 2x380 + 2x220 (2x380)10 2x380 + 4x220 (4x220)
11 2x380 + 2x220 (1x220)12 2x380 + 2x220 (2x220)13 2x380 + 2x220 (3x220)14 2x380 + 2x220 (4x220)15 2x380 + 2x220 (1x380 + 1x220)16 2x380 + 2x220 (1x380 + 2x220)17 2x380 + 2x220 (1x380 + 3x220)18 2x380 + 2x220 (2x380 + 1x220)19 1x380 + 2x220 (1x380 + 1x220)20 1x380 + 2x220 (1x220)
21 4x380 (1x220)22 4x380 (2x220)23 4x380 (3x220)24 4x380 (1x380)25 4x380 (2x380)26 4x380 (3x380)27 4x380 (1x380 + 1x220)28 4x380 (1x380 + 2x220)29 4x380 (1x380 + 3x220)30 4x380 (2x380 + 1x220
31 4x380 (2x380 + 2x220)32 4x380 (3x380 + 1x220)33 4x380 + 2x220 (2x380 + 1x220)34 4x380 + 2x220 (3x380 + 2x220)35 4x380 + 2x220 (2x380)36 3x22037 4x220 (1x220)38 4x220 (2x220)39 4x220 (3x220)40 4x220
NGC threshold in MWAll existing power plants and those under construction with NGC (Net Generating Capacity) equal or higher than the valuesindicated in the following table are displayed on the map even if they are not connected to the high-voltage network. CHP(Combined Heat & Power) classification (coal, natural gas, biomass ...) is based on main fuel. The third column of the tablebelow indicates the visibility of CHP by country.
AlbaniaAustriaBelgiumBosnia & HerzegovinaBulgariaCroatiaCyprusCzech RepublicDenmarkEstoniaFinlandFranceFYROMGB (England & Wales)GB (Northern Ireland)GB (Scotland South)GB (Scotland North)GermanyGreeceHungary
10010010010075
1001001501001001001501001001003010
20010050
2050
1005060403030
10050508050
100503010
1005050
n.a.yesyesnoyesyesn.a.yesyesyesyesyesyesyesyesyesyesyesyesyes
IcelandIrelandItalyLatviaLithuaniaLuxembourgMontenegroThe NetherlandsNorwayPolandPortugalRomaniaRussiaSerbiaSlovak RepublicSloveniaSpainSwedenSwitzerlandTurkey*
1010010010010010010010050
20010010080
1001008065
100100100
1050504030505050505050504550
1001050
10010050
non.a.n.a.noyesyesnonononoyesyesyesyesyesyesnon.a.non.a.
Country Non renew- Renew- CHPsable able included
Country Non renew- Renew- CHPsable able included
Power systems
Other powersystems
ENTSO-Emembers*
*TEIAŞ is an ENTSO-E observer member
220
(220)
15
0 100 200 300 40050Kilometers
Figure 1 – Nordic transmission system map
Source: ENTSO-E1
1 https://docstore.entsoe.eu/Documents/Publications/maps/2019/Map_Northern-Europe-3.000.000.pdf
11
Fortum Energy Review 2019Fortum Plastics Review 2019

changing the zones as a response to changes in regional supply situations. This is at odds with the EU policy, but there is temporary a Norwegian exemption. Market splitting is used to deal with major and long-term con-gestions in the regional and central grid system, or possible lack of energy in defined geographical areas. At the moment Norway is divided into five day-ahead/intraday areas1.
SvK divided Sweden into four bid-ding zones in 2011. The aim of intro-ducing bidding zones was to delimit congestion points within the Swedish electricity system and allow electricity trading to adjust to effectively avail-able transmission capacity through market prices, rather than through arbitrary curtailment measures at the borders2. The commitments set by the European Commission in 2010 are binding on SvK for ten years3.
Finland has opted for another approach. Based on the electricity market act, Fingrid shall plan and construct the main grid in a way that the transmission capacity is sufficient to keep the whole country as a single bidding zone. Two exceptions to the obligations are specified in the act.
Eastern Denmark and Western Denmark are always treated as two dif-ferent bidding zones because Denmark belongs to two synchronous areas.
Nordic TSOs have jointly launched a regular review of existing bidding zone configuration as required in reg-ulation (EU) 2015/1222 on establishing a guideline on capacity allocation
and congestion management4. In the proposed configuration regarding Sweden, a modified SE4 is introduced in the Stockholm Metropolitan Area. The current SE3 is expanded to include the remaining area of current SE4. In Norway a split of NO4 is proposed, and a new NO6 is introduced. No cross-border bidding zones have been suggested. For Denmark and Finland no alternative configuration will be assed at this stage.
Investments in main gridAs can be seen in Figure 2, Statnett has invested heavily during the last few years. Large investments are partly explained by the construction of cross-border interconnectors to Ger-many and to the UK. The cross-bor-der interconnectors currently under construction align well with Norway’s energy policy to enable closer inte-gration with neighbouring markets and increase the value of Norwegian renewables and foster closer co-op-
1 https://www.nordpoolgroup.com/globalassets/download-center/day-ahead/elspot-area-change-log.pdf2 https://europa.eu/rapid/press-release_IP-10-425_en.htm?locale=en3 https://ec.europa.eu/competition/antitrust/cases/dec_docs/39351/39351_1223_4.pdf4 https://www.statnett.no/contentassets/f4a33c4dd9504acbb44399298d8aa822/nordic-bzrr-alternative-configuration.pdf
Note: 2009–2018 realised investments, 2019–2028 planned investments. The period 2016-2028 is as reported in the NGDP 2019 and the other historical data is from the TSOs’ annual reports.Note: Energinet’s historical figures are corporate level investments excluding acquisitions, but include smaller investments to the gas grid infrastructure on top of the transmission infrastructure.Source: Statnett, Energinet, SvK, Fingrid
Figure 2 – Investment of Nordic TSOs, 2009–2028 (MEUR)
0
200
400
600
800
1000
Statnett Energinett SvK Fingrid
2009
2010
2011
2012
2013
2014
2015
2016
2017
2018
2019
2020
2021
2022
2023
2024
2025
2026
2027
2028
12
Fortum Energy Review 2019
Table 3 – Congestion income (MEUR) 2014 2015 2016 2017 2018
Statnett 96.6 119.2 125.9 110.4 100.1
Energinet 71.6 74.0 55.5 72.3 75.4
SvK 128.8 221.1 115.6 135.5 158.1
Fingrid 51.2 90.9 39.9 25.8 29.7
Total 348.2 505.2 336.9 344.1 363.3
Source: Statnett, Energinet, SvK, Fingrid
eration. Investments are expected to decline in the coming years.
A distinctive feature of SvK’s and Energinet’s investments is a great annual fluctuation. As the Swedish transmission network is old, large investments are planned in the coming years. In total, SvK’s investment plan for 2018-2027 includes investments of SEK 45 billion (around EUR 4500m).
Fingrid’s investments in the main grid have been quite stable in recent years and there are no major changes expected in the near future. During the period 2019-2028, Fingrid intends to invest EUR 1200m to ensure the suffi-ciency of the grid capacity and system reliability. One of the main objectives of the plan is to keep Finland as a sin-gle bidding zone which requires strong connections in order to balance varia-tions in production and consumption.
The majority of this investment will therefore be used to reinforce cross-border connections and north-south transmission capacity.
Congestion income is one metric for the adequacy of transmission capacity and market efficiency. In the Nordic countries, congestion income has totalled EUR 300-400million in recent
years (Table 3). There has been some yearly variation depending on the production surplus in the Nordic area among other things. SvK and Statnett are the Nordic TSOs with the highest yearly congestion income. The use of congestion income is discussed in chapter 3.1.
13
Fortum Energy Review 2019

Grid investments are subject to national interests and prioritisation
• Grid planning is seen as the least coordinated Nordic TSO activity
• Grid initiatives do not always progress. TSOs are good in making long range plans but not so good in implementing them
• Prioritisation of Nordic grid investment is a vague subject• Investment decisions are ultimately always national• One or several bidding zones – national or TSO objective?
Do the bidding zone differences reflect the structural congestion?
Grid development and InvestmentDuring the interviews it was mentioned by many that grid planning and invest-ment is probably the least coordinated activity between the Nordic TSOs. A variety of reasons were given for this view despite the fact that Nordic TSOs are involved in preparing grid develop-ment plans on many different levels:• The ENTSO-E Union-wide ten-year
network development plan is pub-lished biennially (TYNDP). A separate regional investment plan for the Baltic Sea region is also published. In addition, the European Commission publishes Baltic Energy Market Inter-connection Plan (BEMIP) focusing on the Nordic and Baltic Sea region.
• The Nordic Grid Development Plan describes the ongoing and future investments in the Nordic grid1. The plan is published by the Nordic TSOs at the request of the Nordic Council of Ministers.
• National grid development plans developed by each TSO.
The planning and investment pro-cesses described above are linked and feed into each other, to some extent. For example, the Nordic grid develop-ment plan is supposed to function as a complementary bridge between the national planning processes and the ENTSO-E TYNDP. When Nordel was integrated into ENTSO-E in 2009, the existing structures for planning and operations were transferred to ENTSO-E (i.e. Regional Group Nordic) as opposed to markets which were kept as a Nordic structure (i.e. Market Steering Group). Based on the interviews there were some issues relating to the roles and coordination in Nordic grid planning processes vis-à-vis European processes. The common Nordic Planning Group (NPG) was re-established in 2014 and uses the ENTSO-E scenarios as a start-ing point for deeper Nordic analysis. NPG is a joint grid planning group con-sisting of members from the four TSOs.
The preparation of network develop-ment plans is statutory at the first two levels described above but the plans by themselves are not binding on TSOs. The
next step in the investment process is that each case is studied in detail by the respective TSOs. At this stage additional analysis and sensitivities are carried out but the process for agreeing inputs for the analysis is not clear. In addition, more local aspects related to invest-ments including local grid reinforce-ments are assessed.
All of this means that the position of a TSO on investments can change as the process develops. Any final recom-mendations on investments are made on a bilateral basis before being submit-ted to relevant national authorities for approval. In this way investment deci-sions can ultimately be seen as national and unilateral.
The responsibility for decision mak-ing is ultimately political. Each Nordic TSO has its own national regulatory framework and processes to prepare the national grid development plan and approve grid investments to be implemented. The final decision making power of cross-border interconnectors is outside the Nordic TSOs. In Norway, for major grid decisions, the decision making authority is, due to high level of conflict, sometimes elevated from the NVE to the Ministry and to the Government (Council of Ministers), and in some cases even to Parliament (in particular related to major cross-border cables). In Denmark, the Ministry of Climate, Energy and Utilities has the decision making authority. In Finland, Ministry of Economic Affairs and Employment is responsible for decision making of cross-border interconnectors. In Sweden, the Parliament takes deci-sions on TSO investments.
As a result, TSO by itself or NRA or ministry can stop analysis for intercon-nectors that might not be a priority. During the interviews, it was mentioned that Nordic TSOs are now more focused
3 Transmission grid investment
1 https://www.fingrid.fi/globalassets/dokumentit/fi/tiedotteet/lehdistotiedotteet/stet0126_nordic_grid_dp_2019.pdf2 Shall be applied from 1 January 2020. Regulation (EC) No 714/2009 is repealed.
14
Fortum Energy Review 2019

on internal investments in grid and interconnectors to the continent than new interconnectors between Nordic regions. Part of the reason was due to prioritisation. That is, new connections e.g. for new data centres were seen to bring more benefit than building new interconnectors, for which the benefits were seen as small. It can also be the case that one border is prioritised over another. E.g. it was also mentioned that a previous Danish minister had prior-itised cross-border connections with Germany more than with Sweden.
It was also noted that new invest-ments are often delayed and are not always in line with Nordic market devel-opment. Access to capital was not seen as an issue for TSOs regarding new investments. A more relevant issue was seen to be around availability of the sup-ply chain e.g. construction companies, resources etc. It was also noted that Nordic TSOs are also in different phases of grid investment.
The use of congestion incomeAs shown in the Figure 3 the Nordic countries have different approaches to accounting and using the congestion income. In Finland, since 2016, Fingrid has not presented congestion income as turnover in profit and loss statement. The congestion income is included in the bal-ance sheet. Fingrid has been using con-gestion income only to fund grid invest-ments. Statnett has no separate account for congestion income. All investment is made by spending tariff income and all of the congestion income has been spent to lower transmission tariffs. Sweden and Denmark have used larger shares of congestion income on lowering transmis-sion tariffs or save revenues in a separate account. In addition to the different approaches, also the significance of the matter is seen in different ways.
The forthcoming internal electricity market Regulation (2019/9432) states the procedure for the distribution of congestion income and directs TSOs to use congestion income to make suf-ficient cross-border capacity available and when this criterion has been fulfilled revenues can be used to support tariffs.
Based on the recent study by ENTSO-E, the unit transmission tariffs of Statnett and Fingrid are low compared
to most European TSOs (Table 4). SvK’s tariffs are one of the lowest in Europe but they are not fully comparable due to different network structure.
Table 4 – Unit Transmission Tariffs in 2019 Statnett Energinet SvK Fingrid
Unit transmission tariffs €/MWh
- 330 kV and above 6.21 11.05 3.37 5.26
- 220-150 kV 6.21 11.05 3.37 5.26
- 132-50 kV 6.21 11.05 0.001 5.26
Sharing of network operator charges, %
- Generation 29.0 4.3 36.0 18.6
- Load 71.0 95.7 64.0 81.4
1) Not fully comparable with other due to network structure
Source: ENTSO-E (June 2019)
Source: ENTSO-E, Study supporting the impact assessment concerning transmission tariffs and congestion income policies, 2017
Figure 3 – Spending of congestion revenues, 2011-2015 (annual average)
Capacity guarantees
Capacity investments
Transmission tariffs
Saved on accountFr
ance
Italia
Ger
man
yN
ethe
rland
sSw
itzer
land
Gre
at B
ritai
nSw
eden
Nor
way
Den
mar
kAu
stria
Spai
nSl
oven
iaH
unga
ryBe
lgiu
mFi
nlan
dBu
lgar
iaG
reec
e
Slov
ak R
epub
licSe
rbia
Pola
ndEs
toni
aLa
tvia
Irela
ndRo
man
ia
Czec
h Re
publ
icM
aked
onia
Alba
nia
Croa
tiaM
onte
negr
oPo
rtug
al
Bosn
ia H
erze
govi
naLi
thua
nia
350 M€
300 M€
250 M€
200 M€
150 M€
100 M€
50 M€
0 M€
15
Fortum Energy Review 2019
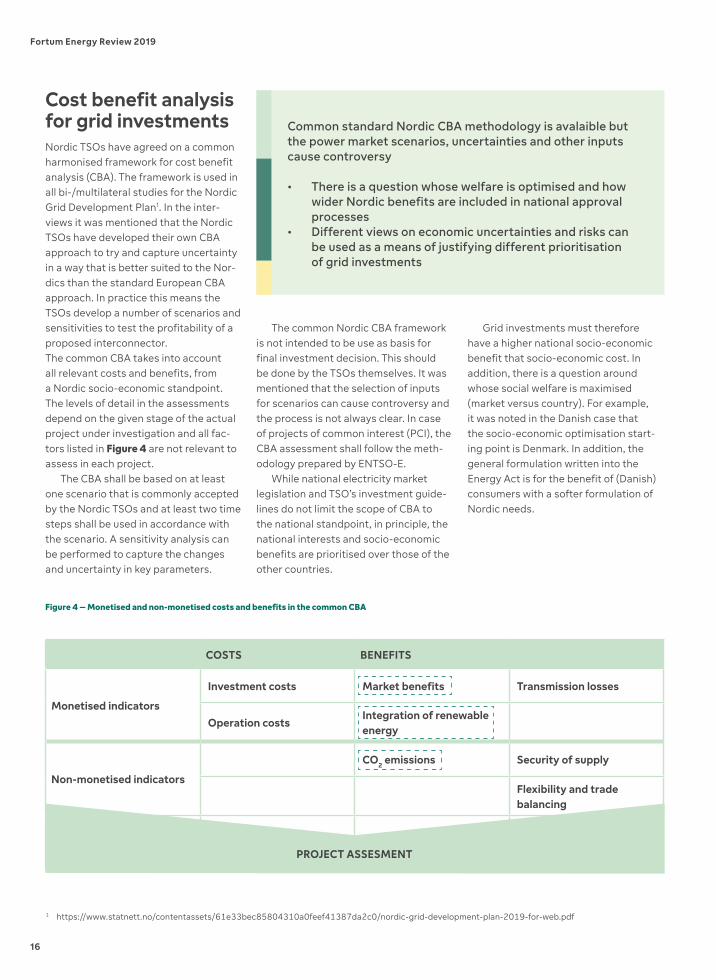
Cost benefit analysis for grid investmentsNordic TSOs have agreed on a common harmonised framework for cost benefit analysis (CBA). The framework is used in all bi-/multilateral studies for the Nordic Grid Development Plan1. In the inter-views it was mentioned that the Nordic TSOs have developed their own CBA approach to try and capture uncertainty in a way that is better suited to the Nor-dics than the standard European CBA approach. In practice this means the TSOs develop a number of scenarios and sensitivities to test the profitability of a proposed interconnector.The common CBA takes into account all relevant costs and benefits, from a Nordic socio-economic standpoint. The levels of detail in the assessments depend on the given stage of the actual project under investigation and all fac-tors listed in Figure 4 are not relevant to assess in each project.
The CBA shall be based on at least one scenario that is commonly accepted by the Nordic TSOs and at least two time steps shall be used in accordance with the scenario. A sensitivity analysis can be performed to capture the changes and uncertainty in key parameters.
Common standard Nordic CBA methodology is avalaible but the power market scenarios, uncertainties and other inputs cause controversy
• There is a question whose welfare is optimised and how wider Nordic benefits are included in national approval processes
• Different views on economic uncertainties and risks can be used as a means of justifying different prioritisation of grid investments
Grid investments must therefore have a higher national socio-economic benefit that socio-economic cost. In addition, there is a question around whose social welfare is maximised (market versus country). For example, it was noted in the Danish case that the socio-economic optimisation start-ing point is Denmark. In addition, the general formulation written into the Energy Act is for the benefit of (Danish) consumers with a softer formulation of Nordic needs.
The common Nordic CBA framework is not intended to be use as basis for final investment decision. This should be done by the TSOs themselves. It was mentioned that the selection of inputs for scenarios can cause controversy and the process is not always clear. In case of projects of common interest (PCI), the CBA assessment shall follow the meth-odology prepared by ENTSO-E.
While national electricity market legislation and TSO’s investment guide-lines do not limit the scope of CBA to the national standpoint, in principle, the national interests and socio-economic benefits are prioritised over those of the other countries.
Figure 4 – Monetised and non-monetised costs and benefits in the common CBA
COSTS BENEFITS
Monetised indicators
Investment costs Market benefits Transmission losses
Operation costsIntegration of renewable energy
Non-monetised indicators
CO2 emissions Security of supply
Flexibility and trade balancing
PROJECT ASSESMENT
1 https://www.statnett.no/contentassets/61e33bec85804310a0feef41387da2c0/nordic-grid-development-plan-2019-for-web.pdf
16
Fortum Energy Review 2019
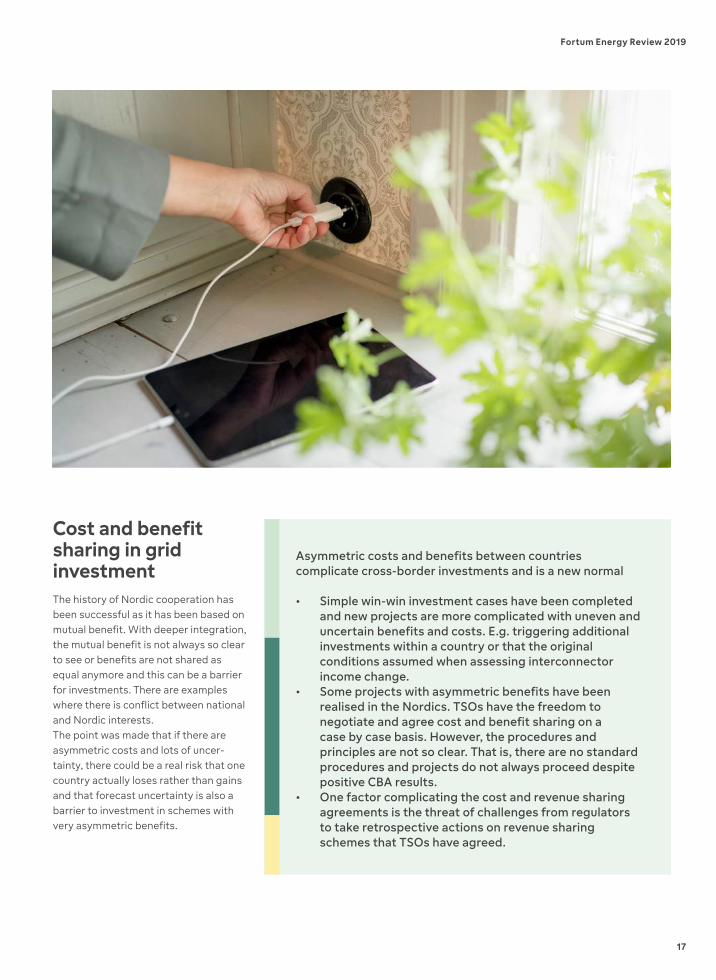
Cost and benefit sharing in grid investmentThe history of Nordic cooperation has been successful as it has been based on mutual benefit. With deeper integration, the mutual benefit is not always so clear to see or benefits are not shared as equal anymore and this can be a barrier for investments. There are examples where there is conflict between national and Nordic interests.The point was made that if there are asymmetric costs and lots of uncer-tainty, there could be a real risk that one country actually loses rather than gains and that forecast uncertainty is also a barrier to investment in schemes with very asymmetric benefits.
Asymmetric costs and benefits between countries complicate cross-border investments and is a new normal
• Simple win-win investment cases have been completed and new projects are more complicated with uneven and uncertain benefits and costs. E.g. triggering additional investments within a country or that the original conditions assumed when assessing interconnector income change.
• Some projects with asymmetric benefits have been realised in the Nordics. TSOs have the freedom to negotiate and agree cost and benefit sharing on a case by case basis. However, the procedures and principles are not so clear. That is, there are no standard procedures and projects do not always proceed despite positive CBA results.
• One factor complicating the cost and revenue sharing agreements is the threat of challenges from regulators to take retrospective actions on revenue sharing schemes that TSOs have agreed.
17
Fortum Energy Review 2019
Denmark and Norway are linked by
4 cables – Skagerrak 1-4 that run
between DK1 and NO2 price areas.
Skagerrak cables 1-2 were laid in 1977
and Skagerrak 3 in 1993. The combined
capacity of SK1-3 is 1000MW. In 2009,
the fourth cable (Skagerrak 4 – “SK4”)
of 700MW capacity was agreed to be
developed in partnership between
Energinet and Statnett. Licenses were
approved in June 2010 (Norway, OED).
Commercial operation began at the end
of 2014.
The costs of SK4 were split equally
between Energinet and Statnett. But,
as the benefits of the cable were seen
to fall mostly to Denmark then two
revenue sharing mechanisms were
introduced.
The first revenue sharing mechanism
was an ancillary service agreement, the
structure of which reflects the sale of
Norwegian aFRR to Energinet over the
first 5 years of operation i.e. 100MW of
capacity on SK4 is reserved for aFRR1.
The Danish Energy Authority provided
conditional approval for the arrange-
ment and then based on the results of
an investigation into the social benefits
after the first year of operation, can-
celled the arrangement from 1 January
2018 and requested the TSOs to put
a more dynamic reservation mecha-
nism in place. Statnett and Energinet
appealed to the Danish Energy Board
Danish-German border and Skagerrak 4
of Appeal who then decided that the
reservation for exchange of aFRR could
continue until the end of 2019. During
the appeal, the TSOs cited the impor-
tance of the arrangement as a prerequi-
site for Statnett’s investment in SK42.
The second part of the revenue shar-
ing agreement is that Statnett receives
congestion income from DK-DE border.
In practice this means there is an agree-
ment between Energinet and Statnett
that links congestion income on the
DK-DE border to a payment to Stat-
nett. This is because when decisions
about SK4 investments were made, the
alternative for Statnett was to build a
cable between Norway and Germany.
In addition, at that time cross-border
capacity to Germany was assumed to be
available. The outturn has shown lower
availability of cross-border capacity
and a mechanism has been introduced
to increase cross-border capacity to
the market between Denmark and
Germany.
Historically, availability of inter-
connector capacity to the day-ahead
market on the DK1-DE border has been
low due to internal bottlenecks in the
German system. In 2017 the Danish
and German Ministries and Regula-
tors issued a joint declaration stating
the aim of gradually increasing the
cross-border capacity allocated to
the day-ahead market between West
Case study
Denmark and Germany. There is a stepwise
target (to 2020) to reach certain minimum
capacities of cross-border capacity that
will be made available to the market in each
hour. The respective TSOs (Energinet and
Tennet) are responsible for implement-
ing the declaration. The requirement to
open capacity to market participants is
addressed in the Clean Energy Package
(minimum of 70% capacity).
In times where physical congestion
restricts cross-border capacity, the
Danish and German TSOs will carry out
countertrading to secure the minimum
capacities (in the case of DK1 mostly down
regulation using special regulation). This
releases virtual capacity to the day-ahead
market rather than physical capacity and
so impacts financial trading rather than
physical flows.
A design feature of special regulation
is that it should not impact the balancing
market. Special regulation is selected
after bids for normal balancing have been
selected. Energinet submitted a report to
the Danish regulator in early Spring 2019 on
possible evidence of gaming and monitor-
ing is ongoing3.
1 https://www.statnett.no/contentassets/ee224b0a208b4814a4c0f047a2257feb/interconnector-license-applications.pdf2 https://www.statnett.no/en/about-statnett/news-and-press-releases/News-archive-2018/
danish-authorities-rule-to-continue-capacity-reservation/3 https://en.energinet.dk/-/media/BE76CDEDF65D47B287006B256F2DD440.
pdf?la=en&hash=CC2809B3F4910EDC84087DD094C512F04A279EF5
18
Fortum Energy Review 2019
19
Fortum Energy Review 2019
4 System operation
S ystem operation is a TSO activity with the most effective Nordic coopera-tion excluding times of dis-turbances. This is because
the operational area is less political and focuses on the need for control as an essential part of operating the Nordic system. However, at times of concern for system security, there is less collabora-tion and a perception that the TSOs will act conservatively to protect their own national consumers.
Congestion managementCongestion management covers the following circumstances:• a situation where capacity made
available to the market between zones cannot be physically realised;
• a situation in which limited intrazonal capacity (essentially assumed to be unlimited in spot markets) cannot accommodate the scheduled pat-terns of generation and demand; and
• how the TSOs deal with grid con-straints due to disturbances or forced outages.
In the Nordic market the TSOs use various measures to relieve internal bot-tlenecks within price zones. Congestions also occur between price zones and are managed using countertrade.
The approach for countertrade used by Energinet on the German border is to use special regulation (as described in the case study). Six
There is no common approach to dealing with congestion in the main grid
• The philosophy of planning for and dealing with congestion is not consistent
• A common merit order for managing re-dispatch on a Nordic basis is missing
• There is limited transparency towards the market around how congestion is dealt with in the short and long run
different countertrade approaches were assessed during an impact assessment. Nordic TSOs also held a workshop on the possibility of extending the special regulation to include other Nordic bids which fed into the impact assessment. SvK and Statnett did not agree that it was possible to extend the market area for special regulation to include other Nordic market areas. The reasoning was that additional imbalances from Germany would pose operational challenges to manage frequency quality and security of supply due to internal constraints in both the Norwegian (generally) and Swedish system (West Coast Cut)1.
Due to the physical difference in grid structure between areas in the Nordic grid, it is clear that not all TSOs have the same problems with congestion management, nor the same tools to deal with the problem2. For example, in Finland and Denmark the grid is strong resulting in fewer congestions than e.g. Norway or Sweden but the system
does not have the same level of flexible resources leading to a focus on develop-ing demand side response. Norway has many internal grid constraints and must deal with congestions despite having flexible reservoir hydro assets leading to low re-dispatch costs to deal with internal congestions. The Swedish grid has systematic constraints in the West Coast Corridor which is often cited as a reason why interconnector capacity is restricted3. As a whole the Nordics have adopted an active balancing philosophy that is structured around the need to deal with internal congestions4.
1 Section 4.3 of impact assessment: https://energinet.dk/-/media/Energinet/Presse-JNR/DK-Nyheder-dokumenter-2017/DK1-DE-Countertrade-models-Collected-Impact-Assessment.PDF
2 https://www.nordpoolgroup.com/message-center-container/newsroom/tso-news/2016/q4/no.-332016---updated-routine-for-congestion-management-for-the-west-coast-corridor-in-sweden/
3 https://www.svk.se/siteassets/om-oss/rapporter/2018/transmission-capacity-available-to-the-market-q1_2018.pdf4 https://www.svk.se/contentassets/bc60c82ceaec44c0b9ffbf3ee2126adf/nordic-balancing-philosophy-160616-final_external.pdf5 https://nordic-rsc.net/6 ENTSO-E. Available at: https://www.eles.si/Portals/0/News/ENTSO-E_PowerFacts_2019.pdf7 http://forsyningstilsynet.dk/fileadmin/Filer/0_-_Nyt_site/EL/Sekretariatsafgoerelser/2018/OEvrige_afgoerelser/CCM_Norden/Bilag_6_-_DUR_EV_Ei_
CCR_agreement_on_future_RfA_10_July_2018.pdf
20
Fortum Energy Review 2019
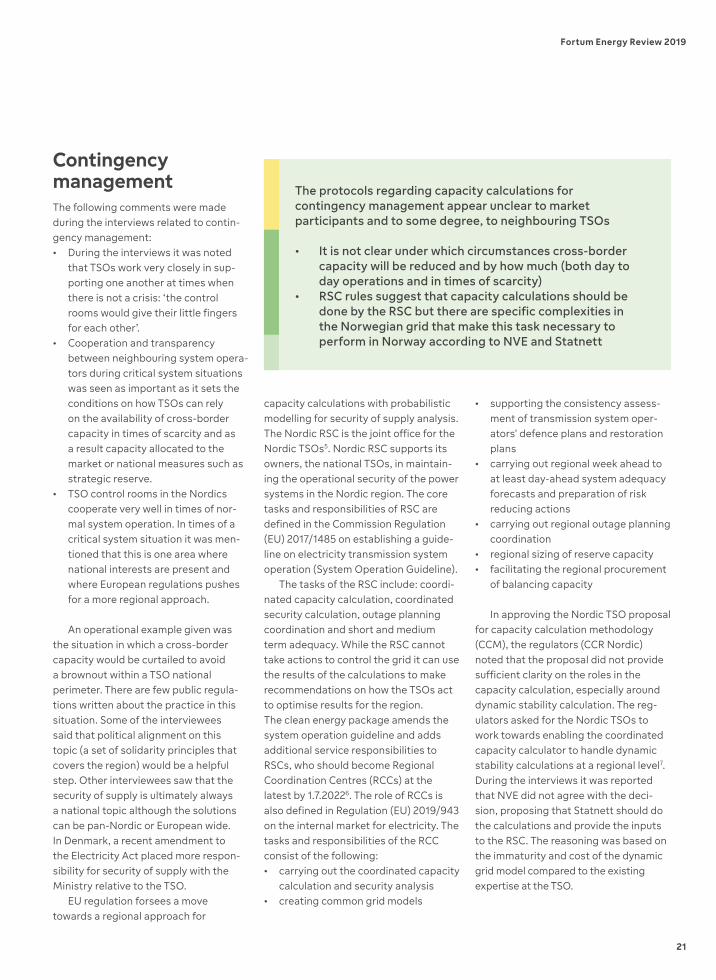
Contingency managementThe following comments were made during the interviews related to contin-gency management:• During the interviews it was noted
that TSOs work very closely in sup-porting one another at times when there is not a crisis: ‘the control rooms would give their little fingers for each other’.
• Cooperation and transparency between neighbouring system opera-tors during critical system situations was seen as important as it sets the conditions on how TSOs can rely on the availability of cross-border capacity in times of scarcity and as a result capacity allocated to the market or national measures such as strategic reserve.
• TSO control rooms in the Nordics cooperate very well in times of nor-mal system operation. In times of a critical system situation it was men-tioned that this is one area where national interests are present and where European regulations pushes for a more regional approach.
An operational example given was the situation in which a cross-border capacity would be curtailed to avoid a brownout within a TSO national perimeter. There are few public regula-tions written about the practice in this situation. Some of the interviewees said that political alignment on this topic (a set of solidarity principles that covers the region) would be a helpful step. Other interviewees saw that the security of supply is ultimately always a national topic although the solutions can be pan-Nordic or European wide. In Denmark, a recent amendment to the Electricity Act placed more respon-sibility for security of supply with the Ministry relative to the TSO.
EU regulation forsees a move towards a regional approach for
capacity calculations with probabilistic modelling for security of supply analysis. The Nordic RSC is the joint office for the Nordic TSOs5. Nordic RSC supports its owners, the national TSOs, in maintain-ing the operational security of the power systems in the Nordic region. The core tasks and responsibilities of RSC are defined in the Commission Regulation (EU) 2017/1485 on establishing a guide-line on electricity transmission system operation (System Operation Guideline).
The tasks of the RSC include: coordi-nated capacity calculation, coordinated security calculation, outage planning coordination and short and medium term adequacy. While the RSC cannot take actions to control the grid it can use the results of the calculations to make recommendations on how the TSOs act to optimise results for the region.The clean energy package amends the system operation guideline and adds additional service responsibilities to RSCs, who should become Regional Coordination Centres (RCCs) at the latest by 1.7.20226. The role of RCCs is also defined in Regulation (EU) 2019/943 on the internal market for electricity. The tasks and responsibilities of the RCC consist of the following:• carrying out the coordinated capacity
calculation and security analysis• creating common grid models
The protocols regarding capacity calculations for contingency management appear unclear to market participants and to some degree, to neighbouring TSOs
• It is not clear under which circumstances cross-border capacity will be reduced and by how much (both day to day operations and in times of scarcity)
• RSC rules suggest that capacity calculations should be done by the RSC but there are specific complexities in the Norwegian grid that make this task necessary to perform in Norway according to NVE and Statnett
• supporting the consistency assess-ment of transmission system oper-ators' defence plans and restoration plans
• carrying out regional week ahead to at least day-ahead system adequacy forecasts and preparation of risk reducing actions
• carrying out regional outage planning coordination
• regional sizing of reserve capacity• facilitating the regional procurement
of balancing capacity
In approving the Nordic TSO proposal for capacity calculation methodology (CCM), the regulators (CCR Nordic) noted that the proposal did not provide sufficient clarity on the roles in the capacity calculation, especially around dynamic stability calculation. The reg-ulators asked for the Nordic TSOs to work towards enabling the coordinated capacity calculator to handle dynamic stability calculations at a regional level7. During the interviews it was reported that NVE did not agree with the deci-sion, proposing that Statnett should do the calculations and provide the inputs to the RSC. The reasoning was based on the immaturity and cost of the dynamic grid model compared to the existing expertise at the TSO.
21
Fortum Energy Review 2019

Source: Statnett, Energinet, SvK, Fingrid
Table 5 – Reserve products offered by the TSOs Statnett Energinet SvK Fingrid
FCR-N
- bid size Usually min 1MW
Max 3MW for aggregated
portfolios
Min 0.1MW Min 0.1MW
- activation Automatically at 49.9–50.1Hz.
For loads 50% 5s and 100% 30s
DK2: 100% 150s Automatically at 49.9–50.1Hz.
63% 60s and 100 % 3min
Automatically at 49.9–50.1Hz.
100% 3min
FCR-D
- bid size Usually min 1MW
Max 3MW for aggregated
portfolios
Min 0.1MW Min 1MW
- activation Automatically when frequency
below 49.9Hz. For loads, 50%
5s and 100% 30s
DK2: 50% 5s and 100% 30s
Automatically when frequency
below 49.9Hz. 50 % 5s and
100% 30s
Power plants: If below 49.5Hz
50% 5s and 100% 30s
aFRR
- bid size Min 5MW Max 10MW for aggregated
portfolios
Min 5MW Min 5MW
- activation 100% 2min DK1: 100% 15min Automatically at 49.9–50.1Hz.
63% 60s and 100 % 3min
Automatically at 49.9–50.1Hz.
100% 3min
mFRR
- bid size - Max 10MW for aggregated
portfolios
Min 10MW (5 MW in SE4)
Min 5MW
- activation - 100% 15min 100% 15min 100% 15min
Strategic reserves None. 647MW RKOM and an
agreement of a capacity
of 215MW in critical
situations.
Currently none. Considering a temporary
one to Eastern Denmark
752MW 729MW
TSO’s own production capacity 180MW gas turbines to
decommissioned
- 690MW gas turbines
953MW
1 Nordic Market Design Forum – Feasibility study. Final report September 2017. https://www.poyry.com/sites/default/files/media/related_material/nordicmarketdesign_finalreport_v200.pdf
2 BRS for Nordic trading system: A market model for data exchange. November 21st, 2018. https://www.ediel.org/SiteAssets/Sider/NEGCommonDocuments/Nordic%20Trading%20System%20BRS%201r6C%20-%2020181121.pdf
22
Fortum Energy Review 2019
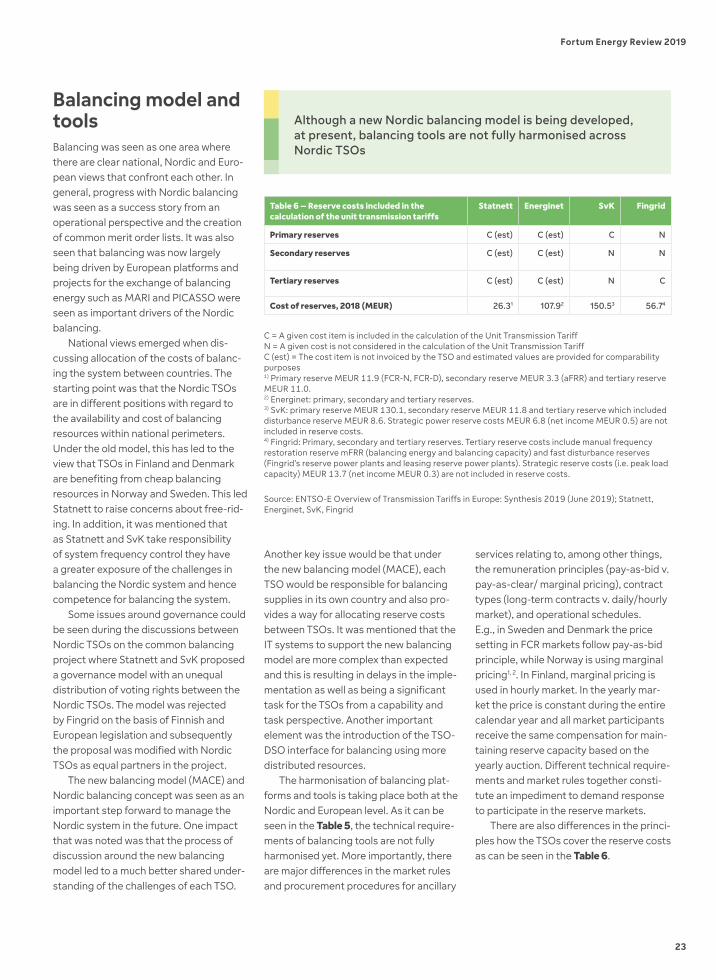
Balancing model and tools Balancing was seen as one area where there are clear national, Nordic and Euro-pean views that confront each other. In general, progress with Nordic balancing was seen as a success story from an operational perspective and the creation of common merit order lists. It was also seen that balancing was now largely being driven by European platforms and projects for the exchange of balancing energy such as MARI and PICASSO were seen as important drivers of the Nordic balancing.
National views emerged when dis-cussing allocation of the costs of balanc-ing the system between countries. The starting point was that the Nordic TSOs are in different positions with regard to the availability and cost of balancing resources within national perimeters. Under the old model, this has led to the view that TSOs in Finland and Denmark are benefiting from cheap balancing resources in Norway and Sweden. This led Statnett to raise concerns about free-rid-ing. In addition, it was mentioned that as Statnett and SvK take responsibility of system frequency control they have a greater exposure of the challenges in balancing the Nordic system and hence competence for balancing the system.
Some issues around governance could be seen during the discussions between Nordic TSOs on the common balancing project where Statnett and SvK proposed a governance model with an unequal distribution of voting rights between the Nordic TSOs. The model was rejected by Fingrid on the basis of Finnish and European legislation and subsequently the proposal was modified with Nordic TSOs as equal partners in the project.
The new balancing model (MACE) and Nordic balancing concept was seen as an important step forward to manage the Nordic system in the future. One impact that was noted was that the process of discussion around the new balancing model led to a much better shared under-standing of the challenges of each TSO.
Although a new Nordic balancing model is being developed, at present, balancing tools are not fully harmonised across Nordic TSOs
Another key issue would be that under the new balancing model (MACE), each TSO would be responsible for balancing supplies in its own country and also pro-vides a way for allocating reserve costs between TSOs. It was mentioned that the IT systems to support the new balancing model are more complex than expected and this is resulting in delays in the imple-mentation as well as being a significant task for the TSOs from a capability and task perspective. Another important element was the introduction of the TSO-DSO interface for balancing using more distributed resources.
The harmonisation of balancing plat-forms and tools is taking place both at the Nordic and European level. As it can be seen in the Table 5, the technical require-ments of balancing tools are not fully harmonised yet. More importantly, there are major differences in the market rules and procurement procedures for ancillary
services relating to, among other things, the remuneration principles (pay-as-bid v. pay-as-clear/ marginal pricing), contract types (long-term contracts v. daily/hourly market), and operational schedules. E.g., in Sweden and Denmark the price setting in FCR markets follow pay-as-bid principle, while Norway is using marginal pricing1, 2. In Finland, marginal pricing is used in hourly market. In the yearly mar-ket the price is constant during the entire calendar year and all market participants receive the same compensation for main-taining reserve capacity based on the yearly auction. Different technical require-ments and market rules together consti-tute an impediment to demand response to participate in the reserve markets.
There are also differences in the princi-ples how the TSOs cover the reserve costs as can be seen in the Table 6.
Table 6 – Reserve costs included in the calculation of the unit transmission tariffs
Statnett Energinet SvK Fingrid
Primary reserves C (est) C (est) C N
Secondary reserves C (est) C (est) N N
Tertiary reserves C (est) C (est) N C
Cost of reserves, 2018 (MEUR) 26.31 107.92 150.53 56.74
C = A given cost item is included in the calculation of the Unit Transmission TariffN = A given cost is not considered in the calculation of the Unit Transmission TariffC (est) = The cost item is not invoiced by the TSO and estimated values are provided for comparability purposes 1) Primary reserve MEUR 11.9 (FCR-N, FCR-D), secondary reserve MEUR 3.3 (aFRR) and tertiary reserve MEUR 11.0.2) Energinet: primary, secondary and tertiary reserves.3) SvK: primary reserve MEUR 130.1, secondary reserve MEUR 11.8 and tertiary reserve which included disturbance reserve MEUR 8.6. Strategic power reserve costs MEUR 6.8 (net income MEUR 0.5) are not included in reserve costs.4) Fingrid: Primary, secondary and tertiary reserves. Tertiary reserve costs include manual frequency restoration reserve mFRR (balancing energy and balancing capacity) and fast disturbance reserves (Fingrid's reserve power plants and leasing reserve power plants). Strategic reserve costs (i.e. peak load capacity) MEUR 13.7 (net income MEUR 0.3) are not included in reserve costs.
Source: ENTSO-E Overview of Transmission Tariffs in Europe: Synthesis 2019 (June 2019); Statnett, Energinet, SvK, Fingrid
23
Fortum Energy Review 2019
5 Transparency
Information about the state of the market is not revealed in a systematic way across the TSOs
• Common Nordic conditions about transparency in critical situations of supply and demand are lacking
• Capacity calculation at borders is unclear, especially in times of scarcity
A ll the Nordic TSOs have statutory obligations to develop and facilitate electricity market, and they are committed to
this task. Transparency of the electricity market information is a key element in improving the functioning of the elec-tricity market. ENTSO-E has introduced a European-wide transparency platform to facilitate access to information by all market participants and stakeholders in promoting the transparency goals of the EU’s internal energy market1. ENTSO-E transparency platform is based on the regulation (EU) 543/2013 on submission and publication of data in electricity market.
Transparency in situations where capacity on interconnectors is changing leaves room for improvement, as does the overall calculation of transmission capacity. This can be due to planned events (maintenance) or unplanned events e.g. congestion management. It can also be due to TSOs contingency planning. For example, congestion in the West Coast Corridor in Sweden is the main reason for limited availability in interconnectors between Sweden and Denmark (SE4-DK2), Sweden and Norway (SE3-NO1), and Sweden and Germany (SE4-DE) – this is partly because congestion in this area cannot be solved using countertrade2.
The approach to transparency and trust in the market in critical market situations (e.g. scarcity) varies across the TSOs. One main difference between
Nordic TSOs relates to the availability of real-time market information. For exam-ple, since 2016 Fingrid has been publish-ing balancing power price information (the last balancing price) in times of system scarcity where Finland is decou-pled into a separate region, subject to volume limits on the remaining number of up and down regulation bids. In summer 2019 the pilot was extended and the limit on remaining MW bids was removed meaning that the last activated balancing power bid will be published in Finland when the Finnish area is decoupled3. Other examples include 6 months pilot that enables intraday gate closure time of 0 minutes in Finland4 and the publication of names of reserve suppliers by reserve products. In the past, the Nordic TSOs have had a common strategic initiative to “set data free” but it didn’t progress. Now each TSO has developed own open data accesses based on national starting points and needs.
This is because Fingrid views that the price generated in the electricity market effectively guides the short-term
electricity generation and consumption decisions as well as long-term invest-ments of the market players.
It was clear that not all TSOs see the need to publish balancing prices in times of scarcity. The reasons given include other priorities (such as ongoing IT projects) or then that the publication of balancing prices raises the potential for self-balancing actions which can cause complications for system operation in weaker grid areas.
Two drivers that were taken as a pos-itive sign for transparency development in the future were the development of the RSC and also the Nordic balancing model via the new IT vehicle for develop-ing the balancing model, Fifty IT and also the common discussions on the balanc-ing model that the TSOs would have. The lack of transparency is not always due to TSOs protecting their own system and data but simply a lack of data.
1 https://transparency.entsoe.eu/dashboard/show2 https://www.svk.se/siteassets/om-oss/rapporter/2019/swedish-interconnectors-monitoring-report-no15.pdf3 https://www.fingrid.fi/en/pages/news/news/2019/fingrid-increases-real-time-market-information-about-balancing-power/4 https://www.fingrid.fi/globalassets/dokumentit/fi/sahkomarkkinat/reservit/reserve_suppliers.pdf
24
Fortum Energy Review 2019

25
Fortum Energy Review 2019
6 Politics and governance
The interviews highlighted clear differences of approach on issues with a strong national dimension: e.g. topics such as security
of supply and grid investments not always being economically driven. Some interviewees highlighted differences in the political oversight and governance of the TSOs as key drivers for the national approaches. As an example, each of the countries has recently published its own national energy vision. However, it was also frequently stated that common Nordic vision and solutions are increas-ingly important to support the energy transition.
Regulation and governance modelAs Nordic Member States of the EU, the legislative framework for TSO respon-sibilities and tasks is broadly similar in Denmark, Sweden and Finland. Norway is not an EU member but it has adopted the EU’s Third Energy Package and therefore complies with the terms set in it. While EU/EC regulations have a direct application in the EU, in Norway, they must be enforced through the EEA (European Economic Area) process and the Norwegian law. Under the EEA treaty, Norway has also the right to refuse the adoption of EU rules.
The primary legislation governing TSO’s operation is inherently general in nature giving room for national per-spectives to emerge as a means of control. Issues around security of supply, national welfare and energy policy are the most nationally driven topics and highly political issues. Secondary legisla-tion, on the other hand, is typically more detailed, giving further room for national differences.
All the Nordic TSOs have statutory responsibility for the transmission
The legislative framework for regulating TSO obligations and tasks is similar in many but not all areas across Nordic countries and there is room for national perspectives and interpretations
• The roles of TSO, NRA and ministry are broadly the same, but the responsibilities, decision making power and political influence may differ
• Governance structures give room for national perspectives and decision-making processes to emerge as a means of control
grid and system operation as well as electricity market development. TSOs’ responsibilities are expanding also to the retail market development through operation of centralised information exchange systems (‘Data Hubs”). On the other hand, there are also many differ-ences in TSO’s responsibilities and oper-ations. For example, SvK is responsible for the supervisory guidance for the local authorities in dam security issues. Statnett owns a transportation company responsible for transport of heavy and valuable components to the Norwegian energy and power industry. Energinet operates also as a gas TSO for Denmark.
National regulatory institutions gov-erning TSO operations are comparable at a general level in Nordic countries: the Ministry or government/parliament issues and approves the laws and the NRA is responsible for regulatory meth-ods and tariff setting principles, and supervises that the TSO operations comply with the law. However, some differences exist in NRAs’ rights to issue secondary legislation. E.g. NVE has the authority to issue regulations on eco-nomic and technical reporting, network revenues, market access and network
tariffs, non-discriminatory behaviour, customer information, metering, settle-ment and billing, system responsibility, quality of supply and the organised physical power exchange (Nord Pool). Some of these responsibilities are directly under the Ministry in other Nordic countries.
There are also major differences in the TSOs’ governance structures. Statnett is a state enterprise fully owned by the OED. The Ministry has a double role with Statnett; that of an owner and a regulator through NVE. NVE was seen to be growing more independent from the Ministry albeit with some notes about acceptance of EU requirements.
Energinet is a public company belonging under the Danish Ministry of Climate, Energy and Utilities, and is fully owned by the Government of Denmark. Energinet recently had roles separated into system operator and transmission operator. The transmission operator has a relatively simple price control regu-lation while the system operator has socio-economic objectives. The system operator is responsible for forward plan-ning and orders services from the trans-mission operator when investments are
26
Fortum Energy Review 2019
needed. In this way the system operator decides on the ‘market v grid’. This approach was developed to overcome suspected bias towards capex solutions and clarify roles and responsibilities. SvK is a part of the state directly, not just owned by the state. Every year, SvK receives regulation letters from the gov-ernment setting out tasks set out by the government (rather than the Minister). The regulatory letter also includes eco-nomic targets, including return, maxi-mum leverage and the share of return that SvK provides to Government.
Fingrid is a public limited liability company in which the Finnish state has a controlling stake. As a public limited liability company Fingrid’s operations are regulated also by the Limited Liability Companies Act (624/2006) and other applicable legislation, as well as the articles of association.
During the interviews it was com-mented that under a common high level structure the differences in the govern-ance model between TSOs can have an effect on the way TSOs act and make decisions. These differences relate to the political influence, way of developing common national view, decision making power, and the involvement of the minis-tries and NRAs in TSOs’ operating activi-ties, i.e. how independent TSOs are.
Nordic cooperation and political cohesion
The Electricity Market Group (EMG) is a working group under the Nordic Council of Ministers, where Nordic Energy Research acts as a secretariat. The group commissions analyses and provides advice to the Energy Ministers of the Nordic countries and has e.g. acted as coordinators of the harmoni-sation process in the Nordic electricity market on behalf of the Nordic Council of Ministers.
There are also a number of discussion groups that have been set up to raise topics and discuss challenges on the Nordic level; e.g. directors of regulators, TSOs and Ministries meet every year. At
There are a number of platforms and processes to support and promote Nordic cooperation and harmonisation but there are different views on their effectiveness and the underlying development needs
• Some are pleased with the current state of cooperation; others see that Nordic cooperation cannot live on historical merits
• Nordic TSOs are reacting to EU requirements and there is an emphasis on common interpretation of European requirements
• There are different views on the current level of political commitment to Nordic cooperation
• There is a general lack of political cohesion across the Nordic market regarding energy policy
the same time some commented that there was some underwhelming support for the Nordic Forum and for the RSC.
The Energy Regulators Regional Forum (ERRF) is cooperation and coordination platform established by NordREG in 2017 to facilitate common and consistent national decisions to be made by each Nordic energy regulator, according to network codes and binding guidelines.
The Nordic Electricity Market Forum is a new cooperation platform initiated by Nordic Council of Ministers for closer dialogue between the different types of stakeholders within the Nordic elec-tricity market . The first forum was held in November 2018 in which a new vision for the Nordic electricity market was ini-tiated together with a roadmap to 2030. The vision was discussed and endorsed by the Nordic Energy Ministers at the Nordic Energy Ministerial meeting in June 2019. At the forum, a list of long-term-objectives and medium- and short-term targets in five key areas were identified for achieving the common vision. In addition, many concrete imme-diate (2019-2020) and further (2021-) action points were depicted, the most important of which relate to the follow-ing areas:
• Development of transparent grid planning process taking into account fair distribution of costs when Nor-dic projects in the region are highly beneficial from a Nordic perspective (“Nordic welfare”), but less beneficial from a national perspective;
• Implementation of Nordic Balancing model and other market reforms, and the upgrading of the market rules and procedures to enable that all flexible assets can actively contribute to function of the Nordic power system;
• Increased transparency on (close to) real-time system operation and reporting on major incidents to the markets, and clear and efficient price signals guiding grid investments and internalising the risk of inadequacy;
• Strengthening of the one common Nordic voice in interacting and influ-encing in the EU; and
• Coordinated and transparent Nordic processes to implement EU/EC regu-lation and rules.
In addition to the cooperation platforms above, Nordic TSOs are cooperating with each other at many levels, e.g. the Nordic RSC is the joint office for the Nor-dic TSOs established 2017 (see 4.2).
27
Fortum Energy Review 2019
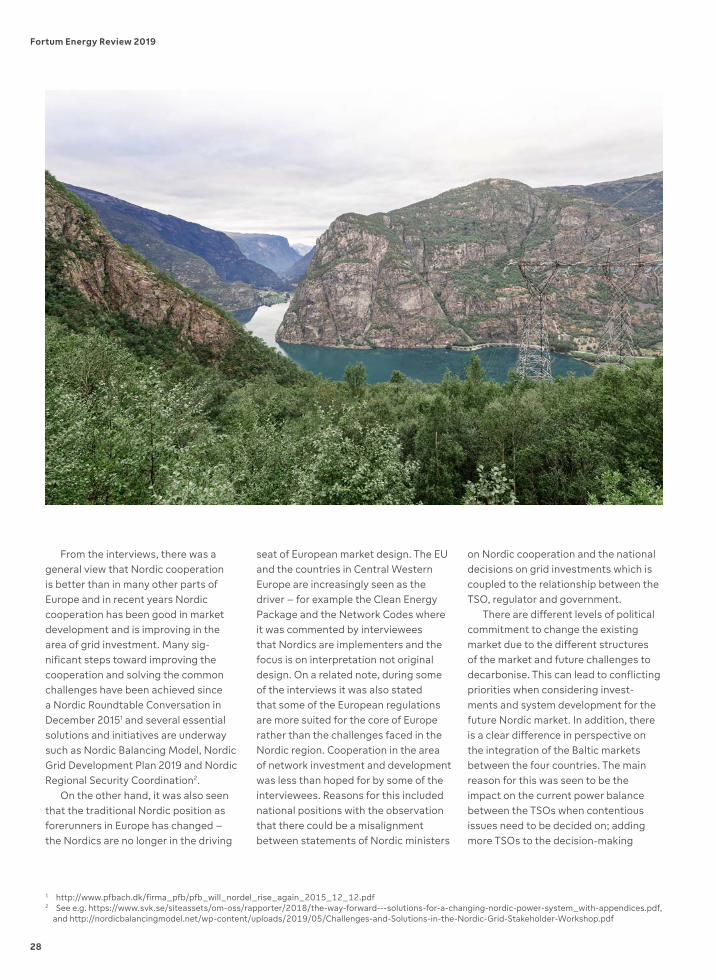
1 http://www.pfbach.dk/firma_pfb/pfb_will_nordel_rise_again_2015_12_12.pdf2 See e.g. https://www.svk.se/siteassets/om-oss/rapporter/2018/the-way-forward---solutions-for-a-changing-nordic-power-system_with-appendices.pdf,
and http://nordicbalancingmodel.net/wp-content/uploads/2019/05/Challenges-and-Solutions-in-the-Nordic-Grid-Stakeholder-Workshop.pdf
From the interviews, there was a general view that Nordic cooperation is better than in many other parts of Europe and in recent years Nordic cooperation has been good in market development and is improving in the area of grid investment. Many sig-nificant steps toward improving the cooperation and solving the common challenges have been achieved since a Nordic Roundtable Conversation in December 20151 and several essential solutions and initiatives are underway such as Nordic Balancing Model, Nordic Grid Development Plan 2019 and Nordic Regional Security Coordination2.
On the other hand, it was also seen that the traditional Nordic position as forerunners in Europe has changed – the Nordics are no longer in the driving
seat of European market design. The EU and the countries in Central Western Europe are increasingly seen as the driver – for example the Clean Energy Package and the Network Codes where it was commented by interviewees that Nordics are implementers and the focus is on interpretation not original design. On a related note, during some of the interviews it was also stated that some of the European regulations are more suited for the core of Europe rather than the challenges faced in the Nordic region. Cooperation in the area of network investment and development was less than hoped for by some of the interviewees. Reasons for this included national positions with the observation that there could be a misalignment between statements of Nordic ministers
on Nordic cooperation and the national decisions on grid investments which is coupled to the relationship between the TSO, regulator and government.
There are different levels of political commitment to change the existing market due to the different structures of the market and future challenges to decarbonise. This can lead to conflicting priorities when considering invest-ments and system development for the future Nordic market. In addition, there is a clear difference in perspective on the integration of the Baltic markets between the four countries. The main reason for this was seen to be the impact on the current power balance between the TSOs when contentious issues need to be decided on; adding more TSOs to the decision-making
28
Fortum Energy Review 2019

process would mean a majority voting system, meaning that each TSO would lose its veto. Examples included the rule on making 70% of capacity available to the market, another was 15min imbal-ance settlement period. Therefore some saw the value of Nordic cooperation as being able to form a common negotiat-ing front with Brussels.
Legislative frameworkNordic cooperation and harmonisation has been founded on the principles of voluntary and mutual benefit. The Louisiana Declaration in 1995 took the first step towards the Nordic market. In 2004 the Akureyri Declaration called for enhanced cooperation between Nordic TSOs. By the Copenhagen Declaration in 2010, the prime ministers in the Nor-dic countries made a declaration to strengthen Nordic cooperation in the field of electricity and grid investment planning3.
As already stated before, cooperative actions taken to date have provided benefits for each country. In the future, however, the benefits (and costs) of fur-ther harmonisation may not be shared as equally. Most of the low-hanging fruit are already captured. At the same time EU is taking a lead in electricity market development and as noted in the Ollila report4, “developments in European regulation serve as the umbrella under which the Nordic electricity market is structured”. In a way this also means that decisions affecting the Nordic TSOs are taken elsewhere and not always in the Nordic mutual interest.
The national regulations give room for national perspectives and interpreta-tions. There are also differences across the Nordic countries how the Nordic cooperation has been incorporated into the national legislation. National interests are visible also in the national
energy visions and policies which impact on the Nordic cooperation. E.g., in the roadmap for reaching the Nordic elec-tricity market vision it is stated that the roadmap does not necessarily reflect the priorities of each national government.
There is no such a thing as common Nordic regulation. Neither there are any institutions to enact pan-Nordic regu-lation. In practice, the harmonisation of the Nordic regulation takes gradually place through implementing EU legis-lation. EU legislation is common to all TSOs but the degree of implementation may differ to some extent, except for EU regulation that becomes immediately enforceable as law in all member states immediately5. ERRF is an example of a Nordic cooperation platform to facilitate common and consistent interpretations of EU legislation as emphasised in the roadmap for reaching the Nordic elec-tricity market vision.
During the interviews it was com-mented that there are differences in Nordic regulation and regulatory views: some are more competition oriented, others are more from the energy regula-tion perspective. There was also a view that harmonised Nordic regulation was not needed or even possible due to the different national perspectives.
Strong political will and commitment is seen as a more plausible way for pushing Nordic cooperation rather than common Nordic regulation
• Harmonisation of Nordic regulation is challenging. Differences in national legislation exist as well as in implementation of EU regulation. Moreover, there is often some freedom to interpret the national legislation to favour or disfavour Nordic interest or initiatives.
• Future cooperation could be built around a common vision based on mutual benefit
Harmonisation of Nordic regulation was seen by some to take place through EU regulation. A complicating factor was related to the interpretation of EU legislation by different regulators and the multi-layered nature means direc-tives can be interpreted in a way that enables national interests to be secured. There was a view that the Nordic way is more around interpretation whereas the Brussels approach was more prescrip-tive (i.e. to enforce the wording of what was agreed). NordREG was seen as quite weak in implementing cross-border regulations. In this situation is was also noted that ACER can be used to play the role of enforcer when there is disa-greement between national regulators meaning that the European view (that happened to be in line with national views) would prevail. It was also men-tioned that as Norway is not a member of the EU then EU legislation needs to be written into Norwegian law which some-times takes more time than expected.
3 Statsministermøde i Nordisk Ministerråd (NMR) om elmarkedet den 2. november 2010.4 https://www.nordicenergy.org/wp-content/uploads/2017/08/Nordic-Energy-Co-operation-Strong-today-stronger-tomorrow.pdf5 Position of Norway, see 6.1.
29
Fortum Energy Review 2019
SummaryThe Nordic countries formed the world’s first integrated cross-border electricity market in 1996, founded on the sharing of mutual benefits. Its design formed the blueprint for the European Target Model, which is the basis for electricity trading and transmission access across the entire EU. The Nordic energy vision was refreshed in 2010 with a series of political statements. However, in recent years, Nordic collaborative activities have visibly slowed, and European elec-tricity market design has been led by other countries with different drivers. The Nordic TSOs – previously forerun-ners in cross-border market collabora-tion – have been dealing with very dif-ferent priorities from each other, and at times their discussions have spilled into public argument.
To meet the challenges of the energy transition towards a zero-carbon econ-omy, even deeper partnership will be needed; to resolve topics with less straightforward win-win outcomes than previous joint initiatives. If the Nordic energy transition is to be a success, col-laboration between TSOs in all aspects of system planning and operation must be at the heart of it.
Nordic TSOs have common denom-inators but they also differ from each other in many respects such as physical and political context, energy policy, legislation, and their ownership and governance structure. The purpose of the study is to understand obligations and the incentives of the Nordic TSOs, and how and in what circumstances their observed behaviour supports Nordic regional interests or gives precedence to national requirements. Our aim is to support an open and constructive debate around the Nordic TSOs and how the differences are reflected in the Nordic cooperation and harmonisation.
The key findings of the study can be summarised in the following points:
Physical and political context Nordic TSOs have different histori-
cal and operational perspectives which influence their behaviour and approach.
Transmission grid investment Grid investments are subject to
national interests and prioritisation; for future shared investments, the
asymmetric distribution of costs and benefits between countries is a new nor-mal and complicates discussions: there are few simple ‘win-win’ cases;
in evaluating shared investments, a common Nordic cost-benefit meth-odology is used but freedom over data inputs for risk analysis permits national interests to take precedence over com-mon benefits.
Congestion and contingency management
there are national differences in approach to the existence and manage-ment of congestion in the main trans-mission grid;
the protocols regarding network capacity calculations for contingency management appear unclear to market participants and (to some degree), to neighbouring TSOs;
although a new Nordic balancing model is being developed; at present, balancing tools are not fully harmonised across Nordic TSOs.
Transparency information about the state of the
market is not revealed in a systematic way across the TSOs.
Politics and governance the legislative framework for regulat-
ing TSO obligations and tasks is similar in many but not all areas across Nordic countries and there is room for national perspectives and interpretations;
there are a number of platforms and processes to support and promote Nordic cooperation and harmonisation but there are different views on their effectiveness and the underlying development needs;
strong political will and commitment is seen as a more plausible way for pushing Nordic cooperation rather than common Nordic regulation (which is considered unachievable), but there is doubt whether it is enough to drive deep collaboration.
Despite many challenges and further harmonisation needs, Nordic coopera-tion is better than in many other parts of Europe and is improving in many areas. Many significant steps toward improving cooperation and solving the common challenges have been achieved including initiatives such as Nordic Bal-ancing Model, Nordic Grid Development Plan 2019 and Nordic Regional Security Coordination. On the other hand, the traditional Nordic position as forerun-ners in Europe has been challenged – the Nordics are no longer in the driving seat of European market design.
Nordic cooperation and harmonisa-tion continue to have a significant role in the electricity market development regionally and European-wide. Common Nordic solutions are essential to sup-porting the energy transition. Nordic cooperation is also becoming increas-ingly necessary as being able to form a common negotiating front with Brussels.
Nordic cooperation and harmonisa-tion has been founded on the principles of voluntary and mutual benefit. New tools and a lot of political commitment are needed in an environment of uneven and uncertain benefits and costs, as each further commitment considered in isolation has the potential to benefit one country at the expense of another. It is only with a view of the wider perspective that the mutually beneficial actions can be taken towards a future energy alliance.
30
Fortum Energy Review 2019
ANNEX A
Interviewees
NorwayStatnett
• Gunnar G. Løvås, Executive Vice President Market and System Operation
NVE
• Ove Flataker, Director – Energy Market Regulation Department
• Vivi Mathiesen , Head of Section – Wholesale market
DenmarkEnerginet
• Søren Dupont Kristensen, CEO Energinet Elsystemansvar
Energistyrelsen
• Markus Hüber, Special Advisor
• Lars Nielsen, Head of Division
• Sharissa Funk, Advisor
Forsyningstilsynet
• Carsten Smids, Director
SwedenSvenska Kraftnät
• Niclas Damsgaard, Chief strategist, System Operator Division
Regeringskansliet
• Magnus Blümer, Enhetschef på Regeringskansliet, Infrastrukturdepartementet
Energimarknadsinspektionen
• Anne Vadasz Nilsson, Director General
FinlandFingrid Oyj
• Jukka Ruusunen, President & CEO
Ministry of Economic Affairs and Employment
• Riku Huttunen, Director General
Energy Authority
• Simo Nurmi, Director General
• Jarno Lamponen, Chief Specialist, Markets, Market Development
Nordic RSC• Jens Møller Birkebæk, Daily Manager
31
Fortum Energy Review 2019


