y
Fuel Cell Power Model for CHP and CHHP Economics and Performance Analysis
Darlene StewardDarlene Steward
amp
Mike PenevMike Penev
National Renewable Energy Laboratory
March 30 2010
NRELPR-560-47915
NREL is a national laboratory of the US Department of Energy Office of Energy Efficiency and Renewable Energy operated by the Alliance for Sustainable Energy LLC
This presentation does not contain any proprietary confidential or otherwise restricted information
Outline
Fuel cell basicsbasics
Costs and incentive values shown in this presentation were developed for demonstration purpose only F l C ll Fuel Cell
Power Model introduction
Dairy case studytutorialstudytutorial
Fuel Cell Basics
S O SO C
Fuel Cell General Types
bull Proton Exchange (PEM) ndash membrane fuel H2 ndash system fuel hydrogen low CO syngas
bull Phosphoric Acid (PAFC) ndash membrane fuel H2 ndash system fuel syngas
bull Solid Oxide (SO( FC)) ndash membrane fuel H2 CO CH4
bull Molten Carbonate (MCFC) ndash membrane fuel H2 CO CH4
bull Others ndash direct methanol (DMFC) ndash alkaline (AFC)
MCFC Basics
Schematic of MCFC operation (EGampG Technical Services 2004)
MCFC System Configuration
Fuel Cell Power Model Introduction
FCpower Model
httpwwwhydrogenenergygovfc_power_analysishtml 1 WARRANTY DISCLAIMER THE SOFTWARE IS SUPPLIED AS IS WITHOUT WARRANTY OF ANY KIND THE COPYRIGHT HOLDER THE UNITED STATES THE UNITED STATES DEPARTMENT OF ENERGY AND THEIR EMPLOYEES (1) DISCLAIM ANY WARRANTIES EXPRESS OR IMPLIED INCLUDING BUT NOT LIMITED TO ANY IMPLIED WARRANTIES OF MERCHANTABILITY FITNESS FOR A PARTICULAR PURPOSE TITLE OR NON-INFRINGEMENT (2) DO NOT ASSUME ANY LEGAL LIABILITY OR RESPONSIBILITY FOR THE ACCURACY COMPLETENESS OR USEFULNESS OF THE SOFTWARE (3) DO NOT REPRESENT THAT USE OF THE SOFTWARE WOULD NOT INFRINGE PRIVATELY OWNED RIGHTS (4) DO NOT WARRANT THAT THE SOFTWARE WILL FUNCTION UNINTERRUPTED THAT IT IS ERROR-FREE OR THAT ANY ERRORS WILL BE CORRECTED
2 LIMITATION OF LIABILITY IN NO EVENT WILL THE COPYRIGHT HOLDER THE UNITED STATES THE UNITED STATES DEPARTMENT OF ENERGY OR THEIR EMPLOYEES BE LIABLE FOR ANY INDIRECT INCIDENTAL CONSEQUENTIAL SPECIAL OR PUNITIVE DAMAGES OF ANY KIND OR NATURE INCLUDING BUT NOT LIMITED TO LOSS OF PROFITS OR LOSS OF DATA FOR ANY REASON WHATSOEVER WHETHER SUCH LIABILITY IS ASSERTEDINCLUDING BUT NOT LIMITED TO LOSS OF PROFITS OR LOSS OF DATA FOR ANY REASON WHATSOEVER WHETHER SUCH LIABILITY IS ASSERTED ON THE BASIS OF CONTRACT TORT (INCLUDING NEGLIGENCE OR STRICT LIABILITY) OR OTHERWISE EVEN IF ANY OF SAID PARTIES HAS BEEN WARNED OF THE POSSIBILITY OF SUCH LOSS OR DAMAGES
Overview of Combined Heat amp Power Concept
Electricity Power
Natural Gas
Power
Heat
Natural GasNatural Gas or Biogas Fuel Cell
Excess power generated by the fuel cell is fed to the grid
National Renewable Energy Laboratory Innovation for Our Energy Future 9
Dispatch Sequence for Electricity Generation
Heat
OUTPUTSINPUTS ENERGY CONVERSIONS
Fuel peak burner
heat sink
Water
FuelFC SYSTEM + H2
Electricity
Water
Fuel
H2-FC
Grid Hydrogen
H2-storage
electrolyzer
renewablesSunWindSunWindSunWindSunWind
Grid
2 g
National Renewable Energy Laboratory Innovation for Our Energy Future10
Electricity
Dispatch Sequence for Electricity Generation
Heat
OUTPUTSINPUTS ENERGY CONVERSIONS
Fuel peak burner
heat sink use minimal fuel
cell power use additional fuel cell power
Water
FuelFC SYSTEM + H2
Electricity
Water
Fuel FC SYSTEM + H2
1 2
H2-FC use grid
Grid Hydrogen
H2-storage
electrolyzer
renewablesSunWindSunWindSunWindSunWind
Grid 3
National Renewable Energy Laboratory Innovation for Our Energy Future11
2 g
Technology Selection for Hourly Energy Analysis
Heat
OUTPUTSINPUTS ENERGY CONVERSIONS
Fuel peak burner
heat sink
Electricity
Water
Fuel FC SYSTEM + H2
H2-FC
Grid
SunWind
Hydrogen
renewables H2-storage
electrolyzer
2 g
National Renewable Energy Laboratory Innovation for Our Energy Future 12
t t
E ectric ty Demand (kW)Heat Demand (kW)Hydrogen Demand (kW)
Electricity Demand (kW)Heat Demand (kW)Hydrogen Demand (kW)
Electric ty Demand (kW)
1 2 3 4 5 6 7 8 9 10 11 12 13 14 15 16 17 18 19 20 21 22 23 241 2 3 4 5 6 7 8 9 10 11 12 13 14 15 16 17 18 19 20 21 22 23 24
ydrog (k )
1 2 3 4 5 6 7 8 9 10 11 12 13 14 15 16 17 18 19 20 21 22 23 24
Heat Demand (kW)Hydrogen Demand (kW)
1 2 3 4 5 6 7 8 9 10 11 12 13 14 15 16 17 18 19 20 21 22 23 24
Electricity Demand (kW)Heat Demand (kW)Hydrogen Demand (kW)
Integration of Demand Profiles Renewables Availability amp Grid Cost Structure
6
8
10
12
14
l i
6
8
10
12
14
8
10
12
14
i 10
12
14
El i i D d (kW) 10
12
14
HOURLY DEMANDS Enter Process Specifications (default values will be provided)
Download or enter hourly demand profiles
0
2
4
0
2
4
6 H en Demand W
0
2
4
6
0
2
4
6
8
0
2
4
6
8 Electricity Demand (kW) Heat Demand (kW) Hydrogen Demand (kW)
Download or enter hourly demand profiles Download or enter hourly renewable energy profiles Enter grid electricity price profile (peaking price structure) Enter equipment capital costs Enter equipment capacity operating parameters and operating costs
heat sink
1 2 3 4 5 6 7 8 9 10 11 12 13 14 15 16 17 18 19 20 21 22 23 24 p g
peak burner
FC SYSTEM + H2 PRICE SCHEDULES
ENERGY FLOWS ($)
electrolyzer
H2-FC
Renewables H2-storage
bull Grid electricity (hourly)y ( y) bull Fuel prices bull Water price
bull Delivered electricity bull Delivered heat bull Delivered hydrogen bull Used fuel bull Used grid electricity bull Used grid electricity bull Sales to grid
National Renewable Energy Laboratory Innovation for Our Energy Future 13
p
Y
FCPower Model Hourly Energy Analysis Module
Cost of Energy Output
New Hourly Energy
Feed and Utility Prices
Hourly Solar Wind Profiles
Yearly
Cost of Purchased Electricity amp Heat
Financial Inputs
New Hourly Energy Supply amp Demand Analysis Module
Physical Cost
Electricity Heat H d
early Cash Flow
Analysis
Heat
Credit for ldquoAvoidedrdquo Electricity
Property Data
Cost Inputs Hydrogen
Demand Profiles
amp Heat Purchase
Greenhouse GasGas Emissions
Energy analysis done for 8760 h of one year
H2A model inputs H2A database
National Renewable Energy Laboratory Innovation for Our Energy Future 14
User inputs
Biogas Case Study
System Being Considered
Gas CleanupPlug-flowPlug flow
anaerobic digester
Electricity Fuel Cell
1000 cows HeatHeat
Solids SeparationSeparation
(bedding + fertilizer)
Methane Sources in the Sacramento Area
bull About 55 MW of electricity could b ld be generatted fromd f digester methane
bull Rule of thumb 1 cow = 200 W electricity
National Renewable Energy Laboratory Innovation for Our Energy Future 17
Flow
Quick Start ndash 4 steps
Title
Title Molten Carbonate Fuel Cell Case Study Authors Darlene Steward Mike Penev Contact Darlene Steward
Contact phone 303 275 3837 Contact e-mail darlene_stewardnrelgov
Organization NREL Date 1-Aug-09
Web site
Process Flow
Click Process Flow Diagram 1
Diagram
bull Fill out Input Sheet completelybull Click Run Hourly Energy Profilebutton3
View Results 42 bull Configure system bull Click Input sheet
button
Fuel
INPUTS
Burner
Heat sink
SELECT ENERGY SUBSYSTEMS amp RUN OPTIONS
Grid
Water
Fuel
Sun
Fuel cell system + PSA
PV
Electrolyzer
H2-FC
H2-storage
System Component Selection
Wind Turbines
Electricity
OUTPUTS
Heat
Hydrogen
TRUE TRUE FALSE
Peak Burner Fuel Cell System Electrolyzer
Input Sheet
Economic Evaluation of a Fuel Cell at a Dairy
Hypothetical facility profile bull 1000 cows housed in a free-stall barn
Biogas system bull Manure collection bull Plug-flow anaerobic digester bull Biogas collection and purification bull Digester waste press separatorDigester waste press separator
bull Windrow composting of solids bull Field application of water
F l ll tFuel cell system bull Molten carbonate fuel cell (MCFC) produces electricity and heat bull Electricity not used on site is fed to the gridy g
National Renewable Energy Laboratory Innovation for Our Energy Future 19
Information Needed
Capital cost OampM Life Performance - Digester - Gas cleanup
- Fuel cell system
IncentivesIncentives - Federal incentives
- State incentives
On-site energy demands - Electricity hourly
- Heat hourly (includingg di gester)) y ( g
Energy costs - Electricity centkWh
H $MMBTU- Heat $MMBTU
Energy amp Material Values Units Value
Methane production Btu CH4day cow (kWh CH4daycow)
45218 (1325)
Electricity production (assuming 45 average electrical efficiency for fuel cell)
kWhdaycow ~6
Usable heat production (assuming 75 total efficiency for fuel cell)
kWhdaycow ~4
Finished compost Cubic yardsyear cow 332 Electricity required for digester operation
kWhcowday ~1
Heat required for operation of kWhcowday ~1 chillers (for milk) and heating of the digester 0014 tons chilling per cow per day per hour of milking
National Renewable Energy Laboratory Innovation for Our Energy Future 21
Sources Martin John H Jr A Comparison of Dairy Cattle Manure Management With and Without Anaerobic Digestion and Biogas Utilization EPA AgSTAR Program June 2004 EPA AgSTAR Handbook Second Edition
Cost Values Units Value for 1000
cow farm Digester system installed $K = [563(number of cows) + 1170 cost 678064]103
Hydrogen sulfide removal of total project capital cost ($K)
45 (64)
Utility hookup of total project capital cost ($K)
79 (112)
MCFC uninstalled cost $kW ($K) 300 kW system 2500 (750)
Federal tax incentive $K 324
CA SGIP using renewable $K $4 50W for FC gt 30kW 1 350 CA SGIP using renewable fuel
$K $450W for FC gt 30kW using renewable fuel
1350
High end of cost range assumed for fuel cell purity requirements 250 kW system would be required for 6kWhdaycow average production
Post-digestion solids of total project capital cost 69 (98) separation system ($K) Hydrogen sulfide removal of total project capital cost 4 5 (64)
Sources Martin John H Jr A Comparison of Dairy Cattle Manure Management With and Without Anaerobic Digestion and Biogas Utilization EPA AgSTAR Program June 2004 EPA AgSTAR Handbook Second Edition
National Renewable Energy Laboratory Innovation for Our Energy Future 22
Step 1
Title
Click Process Flow Diagram 1
Title Molten Carbonate Fuel Cell Case Study Authors Darlene Steward Mike Penev
Process Flow
Diagram
Authors Darlene Steward Mike Penev Contact Darlene Steward
Contact phone 303 275 3837 Contact e-mail darlene_stewardnrelgov
Organization NREL Date 1-Aug-09
Web site
Simpple jjust click
Model users are first directed to this screen
Step 2 Selecting Hardware bull Configure system bull Click Input sheet
button2 INPUTS OUTPUTS
Heat sink Heat
SELECT ENERGY SUBSYSTEMS amp RUN OPTIONS
Electricity
Water
Fuel
Fuel Burner
Fuel cell system + PSA
Grid
Hydrogen
Electrolyzer
H2-FC
Sun PV H2-storage
Wind Turbines
System Component Selection TRUE TRUE FALSE
Peak Burner Fuel Cell System Electrolyzer
Input Sheet
bull The Fuel CCell SSystem analysis is active by deffault bull Burner evaluation should also be selected
Step 3 Entering Detailed Specifications
bull The ldquoInput_Sheet_Templaterdquo sheet is the main modelsheet is the main model interface
bull The subsequent slides willThe subsequent slides will describe each section of the interface
bull Tools and defaults are available for most values
bull A lot of customization is possible for special case evaluations
n and follow the directions
Step 3A Entering Specifications Molten Carbonate Fuel Cell Power Model v10
Molten carbonate fuel cell combined heat hydrogen and power installation for a large hotel in Los Angeles View Description
Table of Contents
View and edit project information Use default values Project Info Use Default
Values
Cell color coding key Import and export data and perform analyses
Run hourly energy calculations and calculate cost
Toolkit Key
Run Hourly Energy Profile
Technical Operating Parameters and Specifications
Financial Input Values
Capital Costs
Fixed Operating Costs
Calculate energy cost with existing hourly energy profile
Calculate Cost
Variable Operating Costs - Energy Feedstocks Utilities and Byproducts
Variable Operating Costs - Other Materials and Byproducts
Variable Operating Costs - Other Variable Operating Costs
Sheets for electricity heat deman
and d
Technical Operating Parameters and Specifications
Building type large hotel ca los angel
Notes
To import load profiles for a new location click the Toolkit butto
specificatioBuilding type large_hotel_ca_los_angel
es
Building location LOS_ANGELESCA Total yearly electricity load (kWhyear) 2006040 Total yearly heat load (kWhyear) 2104728 Total yearly hydrogen demand (kgyear) 31025
To import load profiles for a new location click the Toolkit button and follow the directions for importing new load profiles
n
bull First input is specifying electricity and heat demands bull Estimates call for 1 kWh cow-day = 42 kW for heat and electricity
Step 3B Input Electric and Heat Demands
AC Demand Heat Demand
benc
hmar
k_la
rge
_hot
el_c
a_l
os_a
ngel
esc
svbe
nchm
ark_
lar
ge_h
otel
_ca_
los
_ang
eles
cs
v
(hourly electric demand) (hourly heat demand)
420 42 0 420 420 420 Year 2008 420 Jan 1 day of week Tuesday 420 Demand maximum (kW) 420 420 Demand minimum (kW) 420 420 Demand average (kW) 420 420 Demand Stdev (kW) 00 420 Demand total (kWhyear) 367920 420 420 420 420 420 420 42 0 420 420 420 420 420 420 420 420 420
420 420 420 420 420 420 420 42 0 420 420 420 420 420 420 420 42 0 420 420 420 420 420 420 420 420 420
Demand maximum (kW) 420 Demand minimum (kW) 420 Demand average (kW) 420 Demand Stdev (kW) 00 D d t t l (kWh Demand total (kWhy)) 367920 0 3679200
bull Input 42 kW for each hour for both the electricity and heat demands bull Go back to the Input_Sheet_Template sheet
t
Step 3C Economic criteria specification FiFinanciial Input VValues l I l Reference year 2005
2010
1
100
0
0
0038
20
20
100
100
40
50
10
10
19
100
60
350
3890
15
Default Assumed startup year Length of construction period (years) of capital spent in 1st year of construction of capital spent in 2nd year of construction of capital spent in 3rd year of construction of capital spent in 4th year of construction Startup time (years) Plant life (years) Default Analysis period (years) Default equity financing () Default Interest rate on debt if applicable () Debt period (years) of fixed operating costs during startup ()
of revenues during startup () of variable operating costs during startup () Decommissioning costs ( of initial capital investment) Default Salvage value ( of initial capital investment) Default Inflation rate () Default After-tax real IRR () Default State taxes () Default Federal taxes () Default Total tax rate () Working capital ( of yearly change in operating costs) Default
bull Verify and update economic assumptions
_
Step 3D Capital Costs
Direct Capital Cost Specification (ldquoInput_Sheet_Templaterdquo tab)( p _ p )
Direct capital costs (enter costs on equipment sheet)
High-temperature fuel cell andor reformer process direct capital cost ($)($)
Electrolyzer direct capital cost ($)
$2339362 Go to Detail Sheet
No ectedNott SS eellected
Hydrogen fuel cell direct capital cost ($) No ectedNott SS eellected
Auxiliary heater direct capital cost ($) $0 Unlink
Solar (PV) direct capital cost ($) No ectedNott SS eellected
Wind turbine(s) direct capital cost ($) No ectedNott SS eellected
Hydrogen compression storage and dispensing direct capital cost ($)
Total direct capital costs $2339362
No ectedNott SS eellected
bull This section provides links to the fuel cell system and hydrogen storage tabs
Step 3E Remove Hydrogen Co-production H
yddro
gen
Dem
and
( o
f tot
al d
aily
de Hydrogen Demand
(ldquoH2 Demandrdquo tab)
Enter zero for daily hydrogen demand
00 00 00 00 Average daily hydrogen demand 0 kgday 00 Hourly Hydrogen Demand Statistics ( of avg daily demand) 00 Maximum 5000 00 Minimum 000 0 0 500 AAverage 4 1 417 00 Standard deviation 1382 00 Surge above the system average demand 00000 00 Friday average above weekly average () 00000 00 Adjusted average daily demand 0 kgday 00 00 00 0 0 00
500 00
bull Remove all hydrogen demand by zeroing daily H2 demand bull Remove all capital cost for hydrogen dispensing
Hydrogen Storage Costs (ldquoHydrogen Storagerdquo tab)
Enter zero for all hydrogen dispensing costs
Baseline Uninstalled Installation Cost Baseline Installed Major PiecesSystems of Equipment Costs Factor Costs
Low-pressure storage tanks p g $ - 130 $ - Cascade storage tanks $ - 130 $ - Compressor cost $ - 120 $ - Dispensers $ - 120 $ - Electrical upgrades $ - 220 $ - Control and safety equipment $ - 120 $ - 300 ft pipeline to filling station $ - 100 $ -
$ - $ - $ - $ -
Totals $ - $ -
Step 3F Fuel Cell Capacity
Fuel Cell Specifications (ldquoFuel Cell Systemrdquo tab)
Enter fuel cell capacity
FUEL CELL SYSTEM SPECIFICATIONS Descriptions
( y )
Maximum electricity output rating kW 3000 AC average demand
Minimum electricity output rating kW 2490
Efficiency of H2 production (kW H2 produced kW CHP heat reduced) Efficiency of H2 production (kW H2 produced kW CHP heat reduced) 96 96 Coefficient is derived from matching thermodynamic models Coefficient is derived from matching thermodynamic models
Efficiency of H2 over-production (kW H2 produced additional kW fuel consumed) 80 Coefficient is derived from matching thermodynamic models
Maximum fraction of heat converteable to hydrogen 065 Coefficient is derived from matching thermodynamic models
Maximum amount of hydrogen over-production as fraction of H2 production 050 Coefficient is derived from matching thermodynamic models
bull Maximum FC capacity of 300 is a good fit with available digester gas bull 83 of 300 kW allows for utilization factor specification = 249 kW of min rating bull Remainingg coefficients are not impportant for this analyysis as theyy are for H22 co-pproduction
Step 3G Inputting System Costs
Fuel Cell Cost Specifications ((ldquoFuel Cell Syystemrdquo tab))
INVESTMENT (Inputs REQUIRED in
Major PiecesSystems of Equipment Fuel cell CHP equipment uninstalled cost Fuel cell CHP equipment uninstalled cost Plug Flow Digester System Digester engineering and installation Total ancillary systems
Post-digestion solids separation system Hydrogen sulfide treatment Utility hookup Utility hookup
Totals
Baseline Uninstalled
Costs
$$ 750 000 750000
$ 1166477 $
247435
$ 97560 $ 63626 $$ 111699111699
$
2436796
Enter fuel cell digester gas cleanupp costs
Installation Cost Baseline Factor Installed Costs
1 20 120 $$ 900 000 900000 000 $ -100 $ 1166477
$ - 100 $ 97560 100 $ 63626 100100 $$ 111699111699
$ -$ -$
-
$ 2339362
bull This sheet would contain all hardware capital costsThis sheet would contain all hardware capital costs bull If installed costs are used enter installation cost factors of 10
_
$ $
Step 3H Input Indirect Capital Costs
Indirect Capital Costs Specification ((ldquoInput_Sheet_Tempplaterdquo tab)p _ )
Indirect depreciable capital costs Site preparation ($)
Engineering amp design ($) Engineering amp design ($)
Process contingency ($) Project contingency ($) Other (depreciable) capital ($) One-time licensing fees ($) ) g ( Up-front permitting costs ($)
Total indirect capital costs Total Direct amp Indirect Capital Investment
$233936
$163 755 $163755
$0 $116968
$0 $0
$70181 $584840
$2924202
The power model provides default values for each value aboveThe power model provides default values for each value above but it can be overridden
late
late
Step 3I Incentives Specification Incentives Specification (ldquoInput_Sheet_Templaterdquo tab)
Federal Tax Incentives and credits (enter as positive numbers) Incentive Federal business energy tax credit - fuel cells ($)
Federal alternative fuel infrastructure tax credit ($)
Federal combined heat and power tax credit ($)
Federal business energy tax credit - solar ($)
Federal business energygy tax credit - wind (($))
Other one-time tax incentive credits ($)
Total incentives and credits
$324000
$0
Calculate
Calculate
Calculate
Calcu
C lCalcul t SGIP
$1350000 Enter as a positive number
$1674000
bull Federal tax incentive is 30 of capital or 3 000 $kW whichever is lessFederal tax incentive is 30 of capital or 3000 $kW whichever is less bull Self Generation Incentive Program (SGIP) is a CA program that pays up to 4500 $kW of installed capacity of renewable electric production
Step 3J Specifying Fixed Operating Costs
Fixed Operating Costs Specifications
(ldquoInput_Sheet_Templaterdquo tab) Fixed Operating Costs Production facility plant staff (number of FTEs) Burdened labor cost including overhead ($man-hr) Production facility labor cost $year Storagedispensing labor required (hoursyear) Storagedispensing labor cost ($man-hr) Storagedispensing labor cost ($year) GampA rate ( of labor cost)
$0
00 $000
$0 20
$0 $2339
2 $25004
$0$0
$46787
$0
$000 $74131
Default GampA ($year) Licensing permits and fees ($year) Property tax and insurance rate ( of total capital investment) Default Property taxes and insurance ($year) Rent ($year)
Material costs for maintenance and repairs ($year)
Production maintenance and repairs ($year)
Forecourt maintenance and repairs ($year)
Other fees ($year) Other fixed OampM costs ($year)
Total fixed operating costs
bullbull Note that some costs for hydrogen production would not applyNote that some costs for hydrogen production would not apply bull For this analysis we assumed that the fuel cell is installed onsite - so land leasing is not needed
$
Step 3K Feedstock Cost Specification
Commercial Natural Gas
No $10150
Commercial Electricity metric rarr Electricity_metric
Look up base prices for each year No Enter base electricity price ($(2005)kWh) 0124
Byproduct electricity pricing Select price type Enter base electricity price ($(2005)kWh)
Specify local electricity sell-back rates
Energy Feedstocks Utilities and Byproducts Select the price table to use
AEO 2005 High A Case
Reforming fuel cell fuel specification
Commercial Natural Gas_metric rarrLook up prices for each year Enter fuel price ($(2005)MMBtu) Fuel pprice (($((2005))kWh))
Auxiliary heater (peak burner) fuel specification
Commercial Natural Gas_metric rarrLook up prices for each year Enter fuel price ($(2005)MMBtu)
Edit grid electricity import price matrix
Grid electricity base prices Commercial Electricity_metric rarr
Edit
Feedstock Costs (ldquoInput_Sheet_Templaterdquo tab)
Enter zero for natural gas cost
Commercial Natural Gas
No $0000 $0000
Specify local electricity rates
Time of Day 0124
bull Water costs can be specified as well but they are typically relatively low bull Note Detailed grid cost structure can be accommodated by this model
t
Step 3L Verify Other Variable Operating Costs
Other Variable Operating Costs Other variable operating costs (eg environmental surcharges) ($year) $0
Other material costs ($year) $0 Grid peak charges ($year) $0Grid peak charges ($year) $0
Waste treatment costs ($year)
Solid waste disposal costs ($year) Total unplanned replacement capital cost factor ( of total direct d i bl )
150 depreciable costsyear) Royalties ($year) $000 Operator profit ($year) $000 Subsidies and tax incentives based on production ($year) $000 Refueling station OampM costs ($year)
Total variable operating costs excluding fuel ($year)
$172
bull Note that this is the place to define maintenance costs (15 of cap is default) bull Detailed capital cost replacements can be specified within the ldquoReplacement Costsrdquo sheet bull At this point the model specifications are complete
Step 4 Running and Results ldquoInput_Sheet_Templaterdquo tab
Table of Contents
f View and edit project information
Cell color coding key
Use default values
Import and export data and perform analyses
Run hourly energy calculations and Run Hourly
Technical Operating Parameters and Specifications
Financial Input Values
Capital Costs
Calculate energy cost with existing hourly energy profile
calculate cost
Project Info Use Default
Values
Key Toolkit
Energy Profile
Calculate Cost
Capital Costs
Once all inputs are complete click here
bull Running the model performs an hourly energy analysis bull After energy analysis is complete economic analysis and emissions are evaluated bull Completed running will place you on the results tab
Reviewing Results
t
Analysis Results for 1000 Cow Dairy
1000 cow dairy Electricity (kWhy) Heat (kWhy)
U d iUsed onsite 367 920 367920 367 920 367920
Sold 1810190
T t lTotal 2 178 1102178110 367 920 367920
Overall system efficiency is 54 based on heat used Utilization of available heat is only 26
National Renewable Energy Laboratory Innovation for Our Energy Future 40
Analysis Results for 1000 Cow Dairy
Baseline system energy costs (without to installation of fuel cell) Electricity ($year)
Usage and Demand charges $
55461
Commercial Natural Gas ($year) $
14157
Hydrogen (supplied by forecourt SMR system)system)
$
-
Hydrogen price = $0kg Total baseline system energy cost per year $
69618
Cost of natural gas for chillers would be $14157year
CHHP System Annualized Costs CHHP System Annualized Costs F l ll Fuel cell Annualized costs combined heatCapital costs $92806 Decommissioning costs $1176 and power system Fixed OampM Fixed OampM $14422$14422 with an 8 5 with an 85 Feedstock costs $0 internal rate ofOther raw material costs $0 Byproduct credits -$43590 return Other variable costs $8 Supplementary electricity $$2702 Supplementary heat $0 Total $67525
National Renewable Energy Laboratory Innovation for Our Energy Future 41
GHG Emissions Comparison
GHG Emissions Comparison
10000000
~515000 g of CO2eq would be emitted if the digester methane were
5000000
est
er
CH
4
digester methane were vented
-5000000
000 Base Case (wo digester) g
CO2eqmmBtu Digester with Fuel Cell (g
CO2eqmmBtu)
mm
Btu
Dig
e
-10000000
g C
O2
eq
m
-15000000
GHG Emissions from manure management GHG Emissions from biogas recovery
GHG Emissions from bioggas processingg avoided emissions - electricity generation p y g
avoided emissions - heat utilization
Data Source CARB Detailed California-Modified GREET Pathway for Liquefied Natural Gas (NG) from Dairy Digester BioGas CARB Stationary Source Division Version 20 September 23 2009
National Renewable Energy Laboratory Innovation for Our Energy Future 42
Thank You Contact InformationContact Information Darlenestewardnrelgov Michaelpenevnrelgov
National Renewable Energy Laboratory Innovation for Our Energy Future 43
- Fuel Cell Power Model for CHP and CHHPEconomics and Performance Analysis
- Outline
- Fuel Cell Basics
- Fuel Cell General Types
- MCFC Basics
- MCFC System Configuration
- Fuel Cell Power Model Introduction
- FCpower Model
- Overview of Combined Heat amp PowerConcept
- Dispatch Sequence for Electricity Generation
- Technology Selection for Hourly Energy Analysis
- Dispatch Sequence for Electricity Generation
- Integration of Demand Profiles Renewables Availability ampGrid Cost Structure
- FCPower Model Hourly Energy Analysis Module
- Biogas Case Study
- System Being Considered
- Methane Sources in the Sacramento Area
- Quick Start ndash 4 steps
- Economic Evaluation of a Fuel Cell at a Dairy
- Information Needed
- Energy amp Material Values
- Cost Values
- Step 1
- Step 2 Selecting Hardware
- Step 3 Entering Detailed Specifications
- Step 3A Entering Specifications
- Step 3B Input Electric and Heat Demands benchmark_large_
- Step 3C Economic criteria specification
- Step 3D Capital Costs
- Step 3E Remove Hydrogen Co-production
- Step 3F Fuel Cell Capacity
- Step 3G Inputting System Costs
- Step 3H Input Indirect Capital Costs
- Step 3I Incentives Specification
- Step 3J Specifying Fixed Operating Costs
- Step 3K Feedstock Cost Specification
- Step 3L Verify Other Variable Operating Costs
- Step 4 Running and Results
- Reviewing Results
- Analysis Results for 1000 Cow Dairy
- Analysis Results for 1000 Cow Dairy
- GHG Emissions Comparison
- Thank You
-
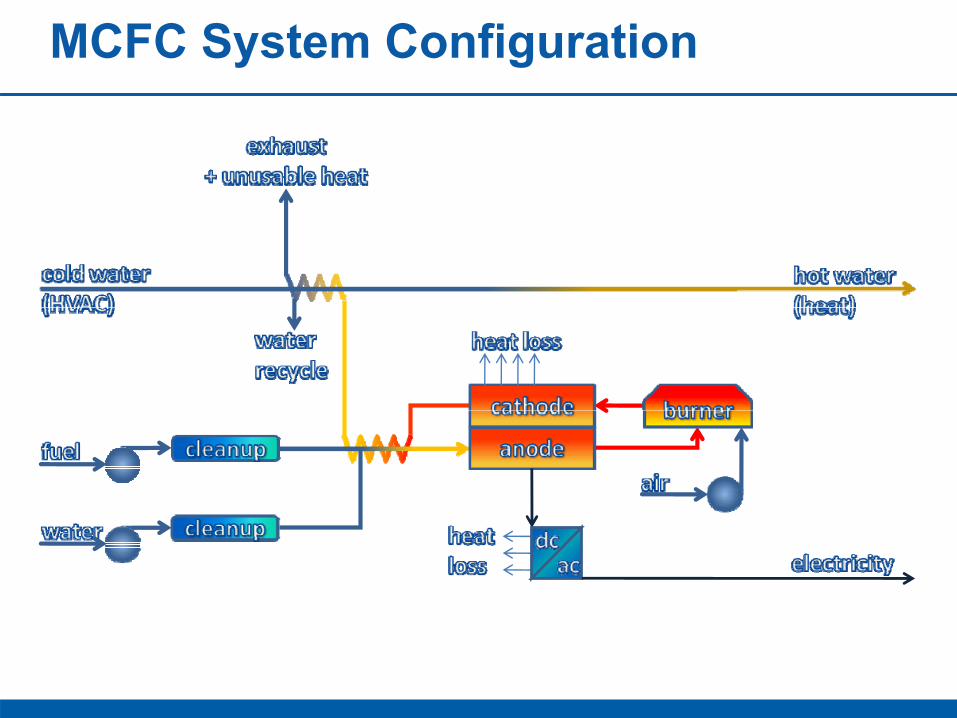
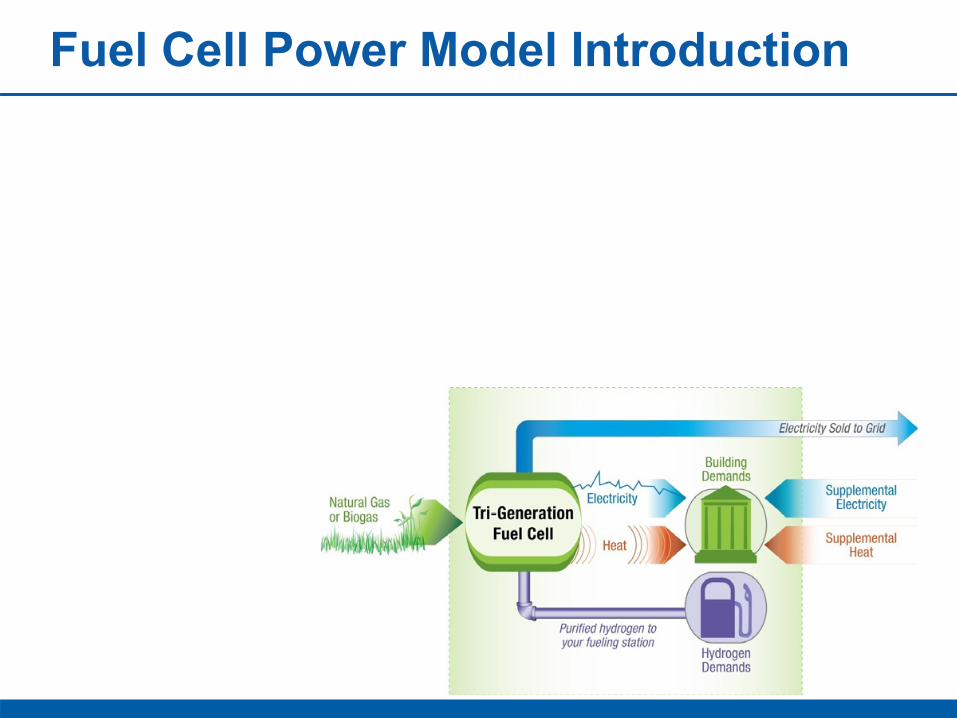
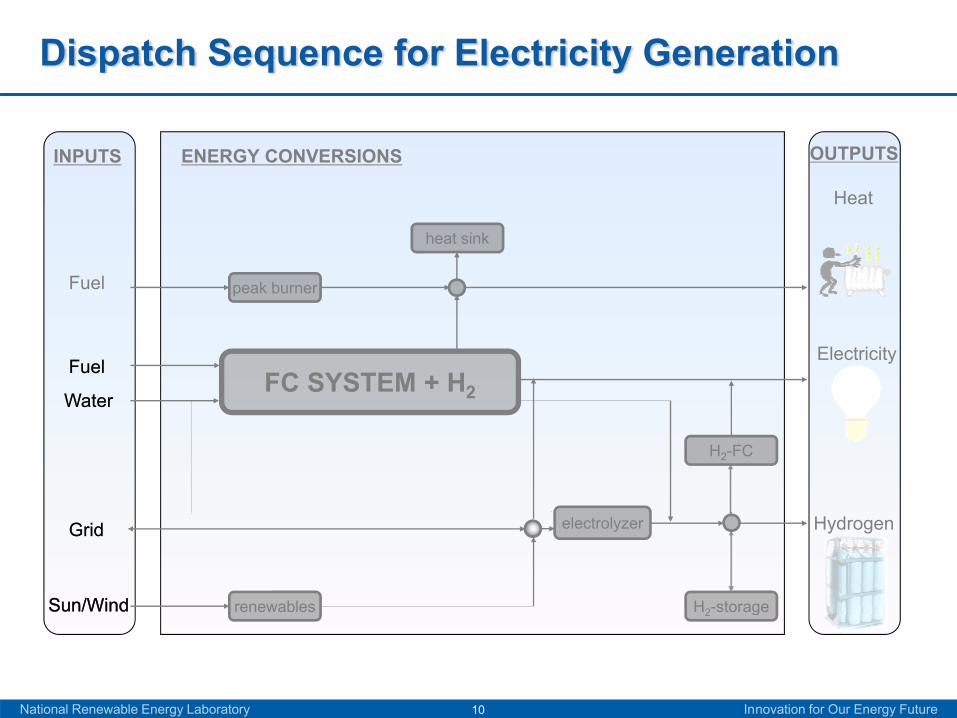
Dispatch Sequence for Electricity Generation
Heat
OUTPUTSINPUTS ENERGY CONVERSIONS
Fuel peak burner
heat sink
Water
FuelFC SYSTEM + H2
Electricity
Water
Fuel
H2-FC
Grid Hydrogen
H2-storage
electrolyzer
renewablesSunWindSunWindSunWindSunWind
Grid
2 g
National Renewable Energy Laboratory Innovation for Our Energy Future10
Electricity
Dispatch Sequence for Electricity Generation
Heat
OUTPUTSINPUTS ENERGY CONVERSIONS
Fuel peak burner
heat sink use minimal fuel
cell power use additional fuel cell power
Water
FuelFC SYSTEM + H2
Electricity
Water
Fuel FC SYSTEM + H2
1 2
H2-FC use grid
Grid Hydrogen
H2-storage
electrolyzer
renewablesSunWindSunWindSunWindSunWind
Grid 3
National Renewable Energy Laboratory Innovation for Our Energy Future11
2 g
Technology Selection for Hourly Energy Analysis
Heat
OUTPUTSINPUTS ENERGY CONVERSIONS
Fuel peak burner
heat sink
Electricity
Water
Fuel FC SYSTEM + H2
H2-FC
Grid
SunWind
Hydrogen
renewables H2-storage
electrolyzer
2 g
National Renewable Energy Laboratory Innovation for Our Energy Future 12
t t
E ectric ty Demand (kW)Heat Demand (kW)Hydrogen Demand (kW)
Electricity Demand (kW)Heat Demand (kW)Hydrogen Demand (kW)
Electric ty Demand (kW)
1 2 3 4 5 6 7 8 9 10 11 12 13 14 15 16 17 18 19 20 21 22 23 241 2 3 4 5 6 7 8 9 10 11 12 13 14 15 16 17 18 19 20 21 22 23 24
ydrog (k )
1 2 3 4 5 6 7 8 9 10 11 12 13 14 15 16 17 18 19 20 21 22 23 24
Heat Demand (kW)Hydrogen Demand (kW)
1 2 3 4 5 6 7 8 9 10 11 12 13 14 15 16 17 18 19 20 21 22 23 24
Electricity Demand (kW)Heat Demand (kW)Hydrogen Demand (kW)
Integration of Demand Profiles Renewables Availability amp Grid Cost Structure
6
8
10
12
14
l i
6
8
10
12
14
8
10
12
14
i 10
12
14
El i i D d (kW) 10
12
14
HOURLY DEMANDS Enter Process Specifications (default values will be provided)
Download or enter hourly demand profiles
0
2
4
0
2
4
6 H en Demand W
0
2
4
6
0
2
4
6
8
0
2
4
6
8 Electricity Demand (kW) Heat Demand (kW) Hydrogen Demand (kW)
Download or enter hourly demand profiles Download or enter hourly renewable energy profiles Enter grid electricity price profile (peaking price structure) Enter equipment capital costs Enter equipment capacity operating parameters and operating costs
heat sink
1 2 3 4 5 6 7 8 9 10 11 12 13 14 15 16 17 18 19 20 21 22 23 24 p g
peak burner
FC SYSTEM + H2 PRICE SCHEDULES
ENERGY FLOWS ($)
electrolyzer
H2-FC
Renewables H2-storage
bull Grid electricity (hourly)y ( y) bull Fuel prices bull Water price
bull Delivered electricity bull Delivered heat bull Delivered hydrogen bull Used fuel bull Used grid electricity bull Used grid electricity bull Sales to grid
National Renewable Energy Laboratory Innovation for Our Energy Future 13
p
Y
FCPower Model Hourly Energy Analysis Module
Cost of Energy Output
New Hourly Energy
Feed and Utility Prices
Hourly Solar Wind Profiles
Yearly
Cost of Purchased Electricity amp Heat
Financial Inputs
New Hourly Energy Supply amp Demand Analysis Module
Physical Cost
Electricity Heat H d
early Cash Flow
Analysis
Heat
Credit for ldquoAvoidedrdquo Electricity
Property Data
Cost Inputs Hydrogen
Demand Profiles
amp Heat Purchase
Greenhouse GasGas Emissions
Energy analysis done for 8760 h of one year
H2A model inputs H2A database
National Renewable Energy Laboratory Innovation for Our Energy Future 14
User inputs
Biogas Case Study
System Being Considered
Gas CleanupPlug-flowPlug flow
anaerobic digester
Electricity Fuel Cell
1000 cows HeatHeat
Solids SeparationSeparation
(bedding + fertilizer)
Methane Sources in the Sacramento Area
bull About 55 MW of electricity could b ld be generatted fromd f digester methane
bull Rule of thumb 1 cow = 200 W electricity
National Renewable Energy Laboratory Innovation for Our Energy Future 17
Flow
Quick Start ndash 4 steps
Title
Title Molten Carbonate Fuel Cell Case Study Authors Darlene Steward Mike Penev Contact Darlene Steward
Contact phone 303 275 3837 Contact e-mail darlene_stewardnrelgov
Organization NREL Date 1-Aug-09
Web site
Process Flow
Click Process Flow Diagram 1
Diagram
bull Fill out Input Sheet completelybull Click Run Hourly Energy Profilebutton3
View Results 42 bull Configure system bull Click Input sheet
button
Fuel
INPUTS
Burner
Heat sink
SELECT ENERGY SUBSYSTEMS amp RUN OPTIONS
Grid
Water
Fuel
Sun
Fuel cell system + PSA
PV
Electrolyzer
H2-FC
H2-storage
System Component Selection
Wind Turbines
Electricity
OUTPUTS
Heat
Hydrogen
TRUE TRUE FALSE
Peak Burner Fuel Cell System Electrolyzer
Input Sheet
Economic Evaluation of a Fuel Cell at a Dairy
Hypothetical facility profile bull 1000 cows housed in a free-stall barn
Biogas system bull Manure collection bull Plug-flow anaerobic digester bull Biogas collection and purification bull Digester waste press separatorDigester waste press separator
bull Windrow composting of solids bull Field application of water
F l ll tFuel cell system bull Molten carbonate fuel cell (MCFC) produces electricity and heat bull Electricity not used on site is fed to the gridy g
National Renewable Energy Laboratory Innovation for Our Energy Future 19
Information Needed
Capital cost OampM Life Performance - Digester - Gas cleanup
- Fuel cell system
IncentivesIncentives - Federal incentives
- State incentives
On-site energy demands - Electricity hourly
- Heat hourly (includingg di gester)) y ( g
Energy costs - Electricity centkWh
H $MMBTU- Heat $MMBTU
Energy amp Material Values Units Value
Methane production Btu CH4day cow (kWh CH4daycow)
45218 (1325)
Electricity production (assuming 45 average electrical efficiency for fuel cell)
kWhdaycow ~6
Usable heat production (assuming 75 total efficiency for fuel cell)
kWhdaycow ~4
Finished compost Cubic yardsyear cow 332 Electricity required for digester operation
kWhcowday ~1
Heat required for operation of kWhcowday ~1 chillers (for milk) and heating of the digester 0014 tons chilling per cow per day per hour of milking
National Renewable Energy Laboratory Innovation for Our Energy Future 21
Sources Martin John H Jr A Comparison of Dairy Cattle Manure Management With and Without Anaerobic Digestion and Biogas Utilization EPA AgSTAR Program June 2004 EPA AgSTAR Handbook Second Edition
Cost Values Units Value for 1000
cow farm Digester system installed $K = [563(number of cows) + 1170 cost 678064]103
Hydrogen sulfide removal of total project capital cost ($K)
45 (64)
Utility hookup of total project capital cost ($K)
79 (112)
MCFC uninstalled cost $kW ($K) 300 kW system 2500 (750)
Federal tax incentive $K 324
CA SGIP using renewable $K $4 50W for FC gt 30kW 1 350 CA SGIP using renewable fuel
$K $450W for FC gt 30kW using renewable fuel
1350
High end of cost range assumed for fuel cell purity requirements 250 kW system would be required for 6kWhdaycow average production
Post-digestion solids of total project capital cost 69 (98) separation system ($K) Hydrogen sulfide removal of total project capital cost 4 5 (64)
Sources Martin John H Jr A Comparison of Dairy Cattle Manure Management With and Without Anaerobic Digestion and Biogas Utilization EPA AgSTAR Program June 2004 EPA AgSTAR Handbook Second Edition
National Renewable Energy Laboratory Innovation for Our Energy Future 22
Step 1
Title
Click Process Flow Diagram 1
Title Molten Carbonate Fuel Cell Case Study Authors Darlene Steward Mike Penev
Process Flow
Diagram
Authors Darlene Steward Mike Penev Contact Darlene Steward
Contact phone 303 275 3837 Contact e-mail darlene_stewardnrelgov
Organization NREL Date 1-Aug-09
Web site
Simpple jjust click
Model users are first directed to this screen
Step 2 Selecting Hardware bull Configure system bull Click Input sheet
button2 INPUTS OUTPUTS
Heat sink Heat
SELECT ENERGY SUBSYSTEMS amp RUN OPTIONS
Electricity
Water
Fuel
Fuel Burner
Fuel cell system + PSA
Grid
Hydrogen
Electrolyzer
H2-FC
Sun PV H2-storage
Wind Turbines
System Component Selection TRUE TRUE FALSE
Peak Burner Fuel Cell System Electrolyzer
Input Sheet
bull The Fuel CCell SSystem analysis is active by deffault bull Burner evaluation should also be selected
Step 3 Entering Detailed Specifications
bull The ldquoInput_Sheet_Templaterdquo sheet is the main modelsheet is the main model interface
bull The subsequent slides willThe subsequent slides will describe each section of the interface
bull Tools and defaults are available for most values
bull A lot of customization is possible for special case evaluations
n and follow the directions
Step 3A Entering Specifications Molten Carbonate Fuel Cell Power Model v10
Molten carbonate fuel cell combined heat hydrogen and power installation for a large hotel in Los Angeles View Description
Table of Contents
View and edit project information Use default values Project Info Use Default
Values
Cell color coding key Import and export data and perform analyses
Run hourly energy calculations and calculate cost
Toolkit Key
Run Hourly Energy Profile
Technical Operating Parameters and Specifications
Financial Input Values
Capital Costs
Fixed Operating Costs
Calculate energy cost with existing hourly energy profile
Calculate Cost
Variable Operating Costs - Energy Feedstocks Utilities and Byproducts
Variable Operating Costs - Other Materials and Byproducts
Variable Operating Costs - Other Variable Operating Costs
Sheets for electricity heat deman
and d
Technical Operating Parameters and Specifications
Building type large hotel ca los angel
Notes
To import load profiles for a new location click the Toolkit butto
specificatioBuilding type large_hotel_ca_los_angel
es
Building location LOS_ANGELESCA Total yearly electricity load (kWhyear) 2006040 Total yearly heat load (kWhyear) 2104728 Total yearly hydrogen demand (kgyear) 31025
To import load profiles for a new location click the Toolkit button and follow the directions for importing new load profiles
n
bull First input is specifying electricity and heat demands bull Estimates call for 1 kWh cow-day = 42 kW for heat and electricity
Step 3B Input Electric and Heat Demands
AC Demand Heat Demand
benc
hmar
k_la
rge
_hot
el_c
a_l
os_a
ngel
esc
svbe
nchm
ark_
lar
ge_h
otel
_ca_
los
_ang
eles
cs
v
(hourly electric demand) (hourly heat demand)
420 42 0 420 420 420 Year 2008 420 Jan 1 day of week Tuesday 420 Demand maximum (kW) 420 420 Demand minimum (kW) 420 420 Demand average (kW) 420 420 Demand Stdev (kW) 00 420 Demand total (kWhyear) 367920 420 420 420 420 420 420 42 0 420 420 420 420 420 420 420 420 420
420 420 420 420 420 420 420 42 0 420 420 420 420 420 420 420 42 0 420 420 420 420 420 420 420 420 420
Demand maximum (kW) 420 Demand minimum (kW) 420 Demand average (kW) 420 Demand Stdev (kW) 00 D d t t l (kWh Demand total (kWhy)) 367920 0 3679200
bull Input 42 kW for each hour for both the electricity and heat demands bull Go back to the Input_Sheet_Template sheet
t
Step 3C Economic criteria specification FiFinanciial Input VValues l I l Reference year 2005
2010
1
100
0
0
0038
20
20
100
100
40
50
10
10
19
100
60
350
3890
15
Default Assumed startup year Length of construction period (years) of capital spent in 1st year of construction of capital spent in 2nd year of construction of capital spent in 3rd year of construction of capital spent in 4th year of construction Startup time (years) Plant life (years) Default Analysis period (years) Default equity financing () Default Interest rate on debt if applicable () Debt period (years) of fixed operating costs during startup ()
of revenues during startup () of variable operating costs during startup () Decommissioning costs ( of initial capital investment) Default Salvage value ( of initial capital investment) Default Inflation rate () Default After-tax real IRR () Default State taxes () Default Federal taxes () Default Total tax rate () Working capital ( of yearly change in operating costs) Default
bull Verify and update economic assumptions
_
Step 3D Capital Costs
Direct Capital Cost Specification (ldquoInput_Sheet_Templaterdquo tab)( p _ p )
Direct capital costs (enter costs on equipment sheet)
High-temperature fuel cell andor reformer process direct capital cost ($)($)
Electrolyzer direct capital cost ($)
$2339362 Go to Detail Sheet
No ectedNott SS eellected
Hydrogen fuel cell direct capital cost ($) No ectedNott SS eellected
Auxiliary heater direct capital cost ($) $0 Unlink
Solar (PV) direct capital cost ($) No ectedNott SS eellected
Wind turbine(s) direct capital cost ($) No ectedNott SS eellected
Hydrogen compression storage and dispensing direct capital cost ($)
Total direct capital costs $2339362
No ectedNott SS eellected
bull This section provides links to the fuel cell system and hydrogen storage tabs
Step 3E Remove Hydrogen Co-production H
yddro
gen
Dem
and
( o
f tot
al d
aily
de Hydrogen Demand
(ldquoH2 Demandrdquo tab)
Enter zero for daily hydrogen demand
00 00 00 00 Average daily hydrogen demand 0 kgday 00 Hourly Hydrogen Demand Statistics ( of avg daily demand) 00 Maximum 5000 00 Minimum 000 0 0 500 AAverage 4 1 417 00 Standard deviation 1382 00 Surge above the system average demand 00000 00 Friday average above weekly average () 00000 00 Adjusted average daily demand 0 kgday 00 00 00 0 0 00
500 00
bull Remove all hydrogen demand by zeroing daily H2 demand bull Remove all capital cost for hydrogen dispensing
Hydrogen Storage Costs (ldquoHydrogen Storagerdquo tab)
Enter zero for all hydrogen dispensing costs
Baseline Uninstalled Installation Cost Baseline Installed Major PiecesSystems of Equipment Costs Factor Costs
Low-pressure storage tanks p g $ - 130 $ - Cascade storage tanks $ - 130 $ - Compressor cost $ - 120 $ - Dispensers $ - 120 $ - Electrical upgrades $ - 220 $ - Control and safety equipment $ - 120 $ - 300 ft pipeline to filling station $ - 100 $ -
$ - $ - $ - $ -
Totals $ - $ -
Step 3F Fuel Cell Capacity
Fuel Cell Specifications (ldquoFuel Cell Systemrdquo tab)
Enter fuel cell capacity
FUEL CELL SYSTEM SPECIFICATIONS Descriptions
( y )
Maximum electricity output rating kW 3000 AC average demand
Minimum electricity output rating kW 2490
Efficiency of H2 production (kW H2 produced kW CHP heat reduced) Efficiency of H2 production (kW H2 produced kW CHP heat reduced) 96 96 Coefficient is derived from matching thermodynamic models Coefficient is derived from matching thermodynamic models
Efficiency of H2 over-production (kW H2 produced additional kW fuel consumed) 80 Coefficient is derived from matching thermodynamic models
Maximum fraction of heat converteable to hydrogen 065 Coefficient is derived from matching thermodynamic models
Maximum amount of hydrogen over-production as fraction of H2 production 050 Coefficient is derived from matching thermodynamic models
bull Maximum FC capacity of 300 is a good fit with available digester gas bull 83 of 300 kW allows for utilization factor specification = 249 kW of min rating bull Remainingg coefficients are not impportant for this analyysis as theyy are for H22 co-pproduction
Step 3G Inputting System Costs
Fuel Cell Cost Specifications ((ldquoFuel Cell Syystemrdquo tab))
INVESTMENT (Inputs REQUIRED in
Major PiecesSystems of Equipment Fuel cell CHP equipment uninstalled cost Fuel cell CHP equipment uninstalled cost Plug Flow Digester System Digester engineering and installation Total ancillary systems
Post-digestion solids separation system Hydrogen sulfide treatment Utility hookup Utility hookup
Totals
Baseline Uninstalled
Costs
$$ 750 000 750000
$ 1166477 $
247435
$ 97560 $ 63626 $$ 111699111699
$
2436796
Enter fuel cell digester gas cleanupp costs
Installation Cost Baseline Factor Installed Costs
1 20 120 $$ 900 000 900000 000 $ -100 $ 1166477
$ - 100 $ 97560 100 $ 63626 100100 $$ 111699111699
$ -$ -$
-
$ 2339362
bull This sheet would contain all hardware capital costsThis sheet would contain all hardware capital costs bull If installed costs are used enter installation cost factors of 10
_
$ $
Step 3H Input Indirect Capital Costs
Indirect Capital Costs Specification ((ldquoInput_Sheet_Tempplaterdquo tab)p _ )
Indirect depreciable capital costs Site preparation ($)
Engineering amp design ($) Engineering amp design ($)
Process contingency ($) Project contingency ($) Other (depreciable) capital ($) One-time licensing fees ($) ) g ( Up-front permitting costs ($)
Total indirect capital costs Total Direct amp Indirect Capital Investment
$233936
$163 755 $163755
$0 $116968
$0 $0
$70181 $584840
$2924202
The power model provides default values for each value aboveThe power model provides default values for each value above but it can be overridden
late
late
Step 3I Incentives Specification Incentives Specification (ldquoInput_Sheet_Templaterdquo tab)
Federal Tax Incentives and credits (enter as positive numbers) Incentive Federal business energy tax credit - fuel cells ($)
Federal alternative fuel infrastructure tax credit ($)
Federal combined heat and power tax credit ($)
Federal business energy tax credit - solar ($)
Federal business energygy tax credit - wind (($))
Other one-time tax incentive credits ($)
Total incentives and credits
$324000
$0
Calculate
Calculate
Calculate
Calcu
C lCalcul t SGIP
$1350000 Enter as a positive number
$1674000
bull Federal tax incentive is 30 of capital or 3 000 $kW whichever is lessFederal tax incentive is 30 of capital or 3000 $kW whichever is less bull Self Generation Incentive Program (SGIP) is a CA program that pays up to 4500 $kW of installed capacity of renewable electric production
Step 3J Specifying Fixed Operating Costs
Fixed Operating Costs Specifications
(ldquoInput_Sheet_Templaterdquo tab) Fixed Operating Costs Production facility plant staff (number of FTEs) Burdened labor cost including overhead ($man-hr) Production facility labor cost $year Storagedispensing labor required (hoursyear) Storagedispensing labor cost ($man-hr) Storagedispensing labor cost ($year) GampA rate ( of labor cost)
$0
00 $000
$0 20
$0 $2339
2 $25004
$0$0
$46787
$0
$000 $74131
Default GampA ($year) Licensing permits and fees ($year) Property tax and insurance rate ( of total capital investment) Default Property taxes and insurance ($year) Rent ($year)
Material costs for maintenance and repairs ($year)
Production maintenance and repairs ($year)
Forecourt maintenance and repairs ($year)
Other fees ($year) Other fixed OampM costs ($year)
Total fixed operating costs
bullbull Note that some costs for hydrogen production would not applyNote that some costs for hydrogen production would not apply bull For this analysis we assumed that the fuel cell is installed onsite - so land leasing is not needed
$
Step 3K Feedstock Cost Specification
Commercial Natural Gas
No $10150
Commercial Electricity metric rarr Electricity_metric
Look up base prices for each year No Enter base electricity price ($(2005)kWh) 0124
Byproduct electricity pricing Select price type Enter base electricity price ($(2005)kWh)
Specify local electricity sell-back rates
Energy Feedstocks Utilities and Byproducts Select the price table to use
AEO 2005 High A Case
Reforming fuel cell fuel specification
Commercial Natural Gas_metric rarrLook up prices for each year Enter fuel price ($(2005)MMBtu) Fuel pprice (($((2005))kWh))
Auxiliary heater (peak burner) fuel specification
Commercial Natural Gas_metric rarrLook up prices for each year Enter fuel price ($(2005)MMBtu)
Edit grid electricity import price matrix
Grid electricity base prices Commercial Electricity_metric rarr
Edit
Feedstock Costs (ldquoInput_Sheet_Templaterdquo tab)
Enter zero for natural gas cost
Commercial Natural Gas
No $0000 $0000
Specify local electricity rates
Time of Day 0124
bull Water costs can be specified as well but they are typically relatively low bull Note Detailed grid cost structure can be accommodated by this model
t
Step 3L Verify Other Variable Operating Costs
Other Variable Operating Costs Other variable operating costs (eg environmental surcharges) ($year) $0
Other material costs ($year) $0 Grid peak charges ($year) $0Grid peak charges ($year) $0
Waste treatment costs ($year)
Solid waste disposal costs ($year) Total unplanned replacement capital cost factor ( of total direct d i bl )
150 depreciable costsyear) Royalties ($year) $000 Operator profit ($year) $000 Subsidies and tax incentives based on production ($year) $000 Refueling station OampM costs ($year)
Total variable operating costs excluding fuel ($year)
$172
bull Note that this is the place to define maintenance costs (15 of cap is default) bull Detailed capital cost replacements can be specified within the ldquoReplacement Costsrdquo sheet bull At this point the model specifications are complete
Step 4 Running and Results ldquoInput_Sheet_Templaterdquo tab
Table of Contents
f View and edit project information
Cell color coding key
Use default values
Import and export data and perform analyses
Run hourly energy calculations and Run Hourly
Technical Operating Parameters and Specifications
Financial Input Values
Capital Costs
Calculate energy cost with existing hourly energy profile
calculate cost
Project Info Use Default
Values
Key Toolkit
Energy Profile
Calculate Cost
Capital Costs
Once all inputs are complete click here
bull Running the model performs an hourly energy analysis bull After energy analysis is complete economic analysis and emissions are evaluated bull Completed running will place you on the results tab
Reviewing Results
t
Analysis Results for 1000 Cow Dairy
1000 cow dairy Electricity (kWhy) Heat (kWhy)
U d iUsed onsite 367 920 367920 367 920 367920
Sold 1810190
T t lTotal 2 178 1102178110 367 920 367920
Overall system efficiency is 54 based on heat used Utilization of available heat is only 26
National Renewable Energy Laboratory Innovation for Our Energy Future 40
Analysis Results for 1000 Cow Dairy
Baseline system energy costs (without to installation of fuel cell) Electricity ($year)
Usage and Demand charges $
55461
Commercial Natural Gas ($year) $
14157
Hydrogen (supplied by forecourt SMR system)system)
$
-
Hydrogen price = $0kg Total baseline system energy cost per year $
69618
Cost of natural gas for chillers would be $14157year
CHHP System Annualized Costs CHHP System Annualized Costs F l ll Fuel cell Annualized costs combined heatCapital costs $92806 Decommissioning costs $1176 and power system Fixed OampM Fixed OampM $14422$14422 with an 8 5 with an 85 Feedstock costs $0 internal rate ofOther raw material costs $0 Byproduct credits -$43590 return Other variable costs $8 Supplementary electricity $$2702 Supplementary heat $0 Total $67525
National Renewable Energy Laboratory Innovation for Our Energy Future 41
GHG Emissions Comparison
GHG Emissions Comparison
10000000
~515000 g of CO2eq would be emitted if the digester methane were
5000000
est
er
CH
4
digester methane were vented
-5000000
000 Base Case (wo digester) g
CO2eqmmBtu Digester with Fuel Cell (g
CO2eqmmBtu)
mm
Btu
Dig
e
-10000000
g C
O2
eq
m
-15000000
GHG Emissions from manure management GHG Emissions from biogas recovery
GHG Emissions from bioggas processingg avoided emissions - electricity generation p y g
avoided emissions - heat utilization
Data Source CARB Detailed California-Modified GREET Pathway for Liquefied Natural Gas (NG) from Dairy Digester BioGas CARB Stationary Source Division Version 20 September 23 2009
National Renewable Energy Laboratory Innovation for Our Energy Future 42
Thank You Contact InformationContact Information Darlenestewardnrelgov Michaelpenevnrelgov
National Renewable Energy Laboratory Innovation for Our Energy Future 43
- Fuel Cell Power Model for CHP and CHHPEconomics and Performance Analysis
- Outline
- Fuel Cell Basics
- Fuel Cell General Types
- MCFC Basics
- MCFC System Configuration
- Fuel Cell Power Model Introduction
- FCpower Model
- Overview of Combined Heat amp PowerConcept
- Dispatch Sequence for Electricity Generation
- Technology Selection for Hourly Energy Analysis
- Dispatch Sequence for Electricity Generation
- Integration of Demand Profiles Renewables Availability ampGrid Cost Structure
- FCPower Model Hourly Energy Analysis Module
- Biogas Case Study
- System Being Considered
- Methane Sources in the Sacramento Area
- Quick Start ndash 4 steps
- Economic Evaluation of a Fuel Cell at a Dairy
- Information Needed
- Energy amp Material Values
- Cost Values
- Step 1
- Step 2 Selecting Hardware
- Step 3 Entering Detailed Specifications
- Step 3A Entering Specifications
- Step 3B Input Electric and Heat Demands benchmark_large_
- Step 3C Economic criteria specification
- Step 3D Capital Costs
- Step 3E Remove Hydrogen Co-production
- Step 3F Fuel Cell Capacity
- Step 3G Inputting System Costs
- Step 3H Input Indirect Capital Costs
- Step 3I Incentives Specification
- Step 3J Specifying Fixed Operating Costs
- Step 3K Feedstock Cost Specification
- Step 3L Verify Other Variable Operating Costs
- Step 4 Running and Results
- Reviewing Results
- Analysis Results for 1000 Cow Dairy
- Analysis Results for 1000 Cow Dairy
- GHG Emissions Comparison
- Thank You
-

Electricity
Dispatch Sequence for Electricity Generation
Heat
OUTPUTSINPUTS ENERGY CONVERSIONS
Fuel peak burner
heat sink use minimal fuel
cell power use additional fuel cell power
Water
FuelFC SYSTEM + H2
Electricity
Water
Fuel FC SYSTEM + H2
1 2
H2-FC use grid
Grid Hydrogen
H2-storage
electrolyzer
renewablesSunWindSunWindSunWindSunWind
Grid 3
National Renewable Energy Laboratory Innovation for Our Energy Future11
2 g
Technology Selection for Hourly Energy Analysis
Heat
OUTPUTSINPUTS ENERGY CONVERSIONS
Fuel peak burner
heat sink
Electricity
Water
Fuel FC SYSTEM + H2
H2-FC
Grid
SunWind
Hydrogen
renewables H2-storage
electrolyzer
2 g
National Renewable Energy Laboratory Innovation for Our Energy Future 12
t t
E ectric ty Demand (kW)Heat Demand (kW)Hydrogen Demand (kW)
Electricity Demand (kW)Heat Demand (kW)Hydrogen Demand (kW)
Electric ty Demand (kW)
1 2 3 4 5 6 7 8 9 10 11 12 13 14 15 16 17 18 19 20 21 22 23 241 2 3 4 5 6 7 8 9 10 11 12 13 14 15 16 17 18 19 20 21 22 23 24
ydrog (k )
1 2 3 4 5 6 7 8 9 10 11 12 13 14 15 16 17 18 19 20 21 22 23 24
Heat Demand (kW)Hydrogen Demand (kW)
1 2 3 4 5 6 7 8 9 10 11 12 13 14 15 16 17 18 19 20 21 22 23 24
Electricity Demand (kW)Heat Demand (kW)Hydrogen Demand (kW)
Integration of Demand Profiles Renewables Availability amp Grid Cost Structure
6
8
10
12
14
l i
6
8
10
12
14
8
10
12
14
i 10
12
14
El i i D d (kW) 10
12
14
HOURLY DEMANDS Enter Process Specifications (default values will be provided)
Download or enter hourly demand profiles
0
2
4
0
2
4
6 H en Demand W
0
2
4
6
0
2
4
6
8
0
2
4
6
8 Electricity Demand (kW) Heat Demand (kW) Hydrogen Demand (kW)
Download or enter hourly demand profiles Download or enter hourly renewable energy profiles Enter grid electricity price profile (peaking price structure) Enter equipment capital costs Enter equipment capacity operating parameters and operating costs
heat sink
1 2 3 4 5 6 7 8 9 10 11 12 13 14 15 16 17 18 19 20 21 22 23 24 p g
peak burner
FC SYSTEM + H2 PRICE SCHEDULES
ENERGY FLOWS ($)
electrolyzer
H2-FC
Renewables H2-storage
bull Grid electricity (hourly)y ( y) bull Fuel prices bull Water price
bull Delivered electricity bull Delivered heat bull Delivered hydrogen bull Used fuel bull Used grid electricity bull Used grid electricity bull Sales to grid
National Renewable Energy Laboratory Innovation for Our Energy Future 13
p
Y
FCPower Model Hourly Energy Analysis Module
Cost of Energy Output
New Hourly Energy
Feed and Utility Prices
Hourly Solar Wind Profiles
Yearly
Cost of Purchased Electricity amp Heat
Financial Inputs
New Hourly Energy Supply amp Demand Analysis Module
Physical Cost
Electricity Heat H d
early Cash Flow
Analysis
Heat
Credit for ldquoAvoidedrdquo Electricity
Property Data
Cost Inputs Hydrogen
Demand Profiles
amp Heat Purchase
Greenhouse GasGas Emissions
Energy analysis done for 8760 h of one year
H2A model inputs H2A database
National Renewable Energy Laboratory Innovation for Our Energy Future 14
User inputs
Biogas Case Study
System Being Considered
Gas CleanupPlug-flowPlug flow
anaerobic digester
Electricity Fuel Cell
1000 cows HeatHeat
Solids SeparationSeparation
(bedding + fertilizer)
Methane Sources in the Sacramento Area
bull About 55 MW of electricity could b ld be generatted fromd f digester methane
bull Rule of thumb 1 cow = 200 W electricity
National Renewable Energy Laboratory Innovation for Our Energy Future 17
Flow
Quick Start ndash 4 steps
Title
Title Molten Carbonate Fuel Cell Case Study Authors Darlene Steward Mike Penev Contact Darlene Steward
Contact phone 303 275 3837 Contact e-mail darlene_stewardnrelgov
Organization NREL Date 1-Aug-09
Web site
Process Flow
Click Process Flow Diagram 1
Diagram
bull Fill out Input Sheet completelybull Click Run Hourly Energy Profilebutton3
View Results 42 bull Configure system bull Click Input sheet
button
Fuel
INPUTS
Burner
Heat sink
SELECT ENERGY SUBSYSTEMS amp RUN OPTIONS
Grid
Water
Fuel
Sun
Fuel cell system + PSA
PV
Electrolyzer
H2-FC
H2-storage
System Component Selection
Wind Turbines
Electricity
OUTPUTS
Heat
Hydrogen
TRUE TRUE FALSE
Peak Burner Fuel Cell System Electrolyzer
Input Sheet
Economic Evaluation of a Fuel Cell at a Dairy
Hypothetical facility profile bull 1000 cows housed in a free-stall barn
Biogas system bull Manure collection bull Plug-flow anaerobic digester bull Biogas collection and purification bull Digester waste press separatorDigester waste press separator
bull Windrow composting of solids bull Field application of water
F l ll tFuel cell system bull Molten carbonate fuel cell (MCFC) produces electricity and heat bull Electricity not used on site is fed to the gridy g
National Renewable Energy Laboratory Innovation for Our Energy Future 19
Information Needed
Capital cost OampM Life Performance - Digester - Gas cleanup
- Fuel cell system
IncentivesIncentives - Federal incentives
- State incentives
On-site energy demands - Electricity hourly
- Heat hourly (includingg di gester)) y ( g
Energy costs - Electricity centkWh
H $MMBTU- Heat $MMBTU
Energy amp Material Values Units Value
Methane production Btu CH4day cow (kWh CH4daycow)
45218 (1325)
Electricity production (assuming 45 average electrical efficiency for fuel cell)
kWhdaycow ~6
Usable heat production (assuming 75 total efficiency for fuel cell)
kWhdaycow ~4
Finished compost Cubic yardsyear cow 332 Electricity required for digester operation
kWhcowday ~1
Heat required for operation of kWhcowday ~1 chillers (for milk) and heating of the digester 0014 tons chilling per cow per day per hour of milking
National Renewable Energy Laboratory Innovation for Our Energy Future 21
Sources Martin John H Jr A Comparison of Dairy Cattle Manure Management With and Without Anaerobic Digestion and Biogas Utilization EPA AgSTAR Program June 2004 EPA AgSTAR Handbook Second Edition
Cost Values Units Value for 1000
cow farm Digester system installed $K = [563(number of cows) + 1170 cost 678064]103
Hydrogen sulfide removal of total project capital cost ($K)
45 (64)
Utility hookup of total project capital cost ($K)
79 (112)
MCFC uninstalled cost $kW ($K) 300 kW system 2500 (750)
Federal tax incentive $K 324
CA SGIP using renewable $K $4 50W for FC gt 30kW 1 350 CA SGIP using renewable fuel
$K $450W for FC gt 30kW using renewable fuel
1350
High end of cost range assumed for fuel cell purity requirements 250 kW system would be required for 6kWhdaycow average production
Post-digestion solids of total project capital cost 69 (98) separation system ($K) Hydrogen sulfide removal of total project capital cost 4 5 (64)
Sources Martin John H Jr A Comparison of Dairy Cattle Manure Management With and Without Anaerobic Digestion and Biogas Utilization EPA AgSTAR Program June 2004 EPA AgSTAR Handbook Second Edition
National Renewable Energy Laboratory Innovation for Our Energy Future 22
Step 1
Title
Click Process Flow Diagram 1
Title Molten Carbonate Fuel Cell Case Study Authors Darlene Steward Mike Penev
Process Flow
Diagram
Authors Darlene Steward Mike Penev Contact Darlene Steward
Contact phone 303 275 3837 Contact e-mail darlene_stewardnrelgov
Organization NREL Date 1-Aug-09
Web site
Simpple jjust click
Model users are first directed to this screen
Step 2 Selecting Hardware bull Configure system bull Click Input sheet
button2 INPUTS OUTPUTS
Heat sink Heat
SELECT ENERGY SUBSYSTEMS amp RUN OPTIONS
Electricity
Water
Fuel
Fuel Burner
Fuel cell system + PSA
Grid
Hydrogen
Electrolyzer
H2-FC
Sun PV H2-storage
Wind Turbines
System Component Selection TRUE TRUE FALSE
Peak Burner Fuel Cell System Electrolyzer
Input Sheet
bull The Fuel CCell SSystem analysis is active by deffault bull Burner evaluation should also be selected
Step 3 Entering Detailed Specifications
bull The ldquoInput_Sheet_Templaterdquo sheet is the main modelsheet is the main model interface
bull The subsequent slides willThe subsequent slides will describe each section of the interface
bull Tools and defaults are available for most values
bull A lot of customization is possible for special case evaluations
n and follow the directions
Step 3A Entering Specifications Molten Carbonate Fuel Cell Power Model v10
Molten carbonate fuel cell combined heat hydrogen and power installation for a large hotel in Los Angeles View Description
Table of Contents
View and edit project information Use default values Project Info Use Default
Values
Cell color coding key Import and export data and perform analyses
Run hourly energy calculations and calculate cost
Toolkit Key
Run Hourly Energy Profile
Technical Operating Parameters and Specifications
Financial Input Values
Capital Costs
Fixed Operating Costs
Calculate energy cost with existing hourly energy profile
Calculate Cost
Variable Operating Costs - Energy Feedstocks Utilities and Byproducts
Variable Operating Costs - Other Materials and Byproducts
Variable Operating Costs - Other Variable Operating Costs
Sheets for electricity heat deman
and d
Technical Operating Parameters and Specifications
Building type large hotel ca los angel
Notes
To import load profiles for a new location click the Toolkit butto
specificatioBuilding type large_hotel_ca_los_angel
es
Building location LOS_ANGELESCA Total yearly electricity load (kWhyear) 2006040 Total yearly heat load (kWhyear) 2104728 Total yearly hydrogen demand (kgyear) 31025
To import load profiles for a new location click the Toolkit button and follow the directions for importing new load profiles
n
bull First input is specifying electricity and heat demands bull Estimates call for 1 kWh cow-day = 42 kW for heat and electricity
Step 3B Input Electric and Heat Demands
AC Demand Heat Demand
benc
hmar
k_la
rge
_hot
el_c
a_l
os_a
ngel
esc
svbe
nchm
ark_
lar
ge_h
otel
_ca_
los
_ang
eles
cs
v
(hourly electric demand) (hourly heat demand)
420 42 0 420 420 420 Year 2008 420 Jan 1 day of week Tuesday 420 Demand maximum (kW) 420 420 Demand minimum (kW) 420 420 Demand average (kW) 420 420 Demand Stdev (kW) 00 420 Demand total (kWhyear) 367920 420 420 420 420 420 420 42 0 420 420 420 420 420 420 420 420 420
420 420 420 420 420 420 420 42 0 420 420 420 420 420 420 420 42 0 420 420 420 420 420 420 420 420 420
Demand maximum (kW) 420 Demand minimum (kW) 420 Demand average (kW) 420 Demand Stdev (kW) 00 D d t t l (kWh Demand total (kWhy)) 367920 0 3679200
bull Input 42 kW for each hour for both the electricity and heat demands bull Go back to the Input_Sheet_Template sheet
t
Step 3C Economic criteria specification FiFinanciial Input VValues l I l Reference year 2005
2010
1
100
0
0
0038
20
20
100
100
40
50
10
10
19
100
60
350
3890
15
Default Assumed startup year Length of construction period (years) of capital spent in 1st year of construction of capital spent in 2nd year of construction of capital spent in 3rd year of construction of capital spent in 4th year of construction Startup time (years) Plant life (years) Default Analysis period (years) Default equity financing () Default Interest rate on debt if applicable () Debt period (years) of fixed operating costs during startup ()
of revenues during startup () of variable operating costs during startup () Decommissioning costs ( of initial capital investment) Default Salvage value ( of initial capital investment) Default Inflation rate () Default After-tax real IRR () Default State taxes () Default Federal taxes () Default Total tax rate () Working capital ( of yearly change in operating costs) Default
bull Verify and update economic assumptions
_
Step 3D Capital Costs
Direct Capital Cost Specification (ldquoInput_Sheet_Templaterdquo tab)( p _ p )
Direct capital costs (enter costs on equipment sheet)
High-temperature fuel cell andor reformer process direct capital cost ($)($)
Electrolyzer direct capital cost ($)
$2339362 Go to Detail Sheet
No ectedNott SS eellected
Hydrogen fuel cell direct capital cost ($) No ectedNott SS eellected
Auxiliary heater direct capital cost ($) $0 Unlink
Solar (PV) direct capital cost ($) No ectedNott SS eellected
Wind turbine(s) direct capital cost ($) No ectedNott SS eellected
Hydrogen compression storage and dispensing direct capital cost ($)
Total direct capital costs $2339362
No ectedNott SS eellected
bull This section provides links to the fuel cell system and hydrogen storage tabs
Step 3E Remove Hydrogen Co-production H
yddro
gen
Dem
and
( o
f tot
al d
aily
de Hydrogen Demand
(ldquoH2 Demandrdquo tab)
Enter zero for daily hydrogen demand
00 00 00 00 Average daily hydrogen demand 0 kgday 00 Hourly Hydrogen Demand Statistics ( of avg daily demand) 00 Maximum 5000 00 Minimum 000 0 0 500 AAverage 4 1 417 00 Standard deviation 1382 00 Surge above the system average demand 00000 00 Friday average above weekly average () 00000 00 Adjusted average daily demand 0 kgday 00 00 00 0 0 00
500 00
bull Remove all hydrogen demand by zeroing daily H2 demand bull Remove all capital cost for hydrogen dispensing
Hydrogen Storage Costs (ldquoHydrogen Storagerdquo tab)
Enter zero for all hydrogen dispensing costs
Baseline Uninstalled Installation Cost Baseline Installed Major PiecesSystems of Equipment Costs Factor Costs
Low-pressure storage tanks p g $ - 130 $ - Cascade storage tanks $ - 130 $ - Compressor cost $ - 120 $ - Dispensers $ - 120 $ - Electrical upgrades $ - 220 $ - Control and safety equipment $ - 120 $ - 300 ft pipeline to filling station $ - 100 $ -
$ - $ - $ - $ -
Totals $ - $ -
Step 3F Fuel Cell Capacity
Fuel Cell Specifications (ldquoFuel Cell Systemrdquo tab)
Enter fuel cell capacity
FUEL CELL SYSTEM SPECIFICATIONS Descriptions
( y )
Maximum electricity output rating kW 3000 AC average demand
Minimum electricity output rating kW 2490
Efficiency of H2 production (kW H2 produced kW CHP heat reduced) Efficiency of H2 production (kW H2 produced kW CHP heat reduced) 96 96 Coefficient is derived from matching thermodynamic models Coefficient is derived from matching thermodynamic models
Efficiency of H2 over-production (kW H2 produced additional kW fuel consumed) 80 Coefficient is derived from matching thermodynamic models
Maximum fraction of heat converteable to hydrogen 065 Coefficient is derived from matching thermodynamic models
Maximum amount of hydrogen over-production as fraction of H2 production 050 Coefficient is derived from matching thermodynamic models
bull Maximum FC capacity of 300 is a good fit with available digester gas bull 83 of 300 kW allows for utilization factor specification = 249 kW of min rating bull Remainingg coefficients are not impportant for this analyysis as theyy are for H22 co-pproduction
Step 3G Inputting System Costs
Fuel Cell Cost Specifications ((ldquoFuel Cell Syystemrdquo tab))
INVESTMENT (Inputs REQUIRED in
Major PiecesSystems of Equipment Fuel cell CHP equipment uninstalled cost Fuel cell CHP equipment uninstalled cost Plug Flow Digester System Digester engineering and installation Total ancillary systems
Post-digestion solids separation system Hydrogen sulfide treatment Utility hookup Utility hookup
Totals
Baseline Uninstalled
Costs
$$ 750 000 750000
$ 1166477 $
247435
$ 97560 $ 63626 $$ 111699111699
$
2436796
Enter fuel cell digester gas cleanupp costs
Installation Cost Baseline Factor Installed Costs
1 20 120 $$ 900 000 900000 000 $ -100 $ 1166477
$ - 100 $ 97560 100 $ 63626 100100 $$ 111699111699
$ -$ -$
-
$ 2339362
bull This sheet would contain all hardware capital costsThis sheet would contain all hardware capital costs bull If installed costs are used enter installation cost factors of 10
_
$ $
Step 3H Input Indirect Capital Costs
Indirect Capital Costs Specification ((ldquoInput_Sheet_Tempplaterdquo tab)p _ )
Indirect depreciable capital costs Site preparation ($)
Engineering amp design ($) Engineering amp design ($)
Process contingency ($) Project contingency ($) Other (depreciable) capital ($) One-time licensing fees ($) ) g ( Up-front permitting costs ($)
Total indirect capital costs Total Direct amp Indirect Capital Investment
$233936
$163 755 $163755
$0 $116968
$0 $0
$70181 $584840
$2924202
The power model provides default values for each value aboveThe power model provides default values for each value above but it can be overridden
late
late
Step 3I Incentives Specification Incentives Specification (ldquoInput_Sheet_Templaterdquo tab)
Federal Tax Incentives and credits (enter as positive numbers) Incentive Federal business energy tax credit - fuel cells ($)
Federal alternative fuel infrastructure tax credit ($)
Federal combined heat and power tax credit ($)
Federal business energy tax credit - solar ($)
Federal business energygy tax credit - wind (($))
Other one-time tax incentive credits ($)
Total incentives and credits
$324000
$0
Calculate
Calculate
Calculate
Calcu
C lCalcul t SGIP
$1350000 Enter as a positive number
$1674000
bull Federal tax incentive is 30 of capital or 3 000 $kW whichever is lessFederal tax incentive is 30 of capital or 3000 $kW whichever is less bull Self Generation Incentive Program (SGIP) is a CA program that pays up to 4500 $kW of installed capacity of renewable electric production
Step 3J Specifying Fixed Operating Costs
Fixed Operating Costs Specifications
(ldquoInput_Sheet_Templaterdquo tab) Fixed Operating Costs Production facility plant staff (number of FTEs) Burdened labor cost including overhead ($man-hr) Production facility labor cost $year Storagedispensing labor required (hoursyear) Storagedispensing labor cost ($man-hr) Storagedispensing labor cost ($year) GampA rate ( of labor cost)
$0
00 $000
$0 20
$0 $2339
2 $25004
$0$0
$46787
$0
$000 $74131
Default GampA ($year) Licensing permits and fees ($year) Property tax and insurance rate ( of total capital investment) Default Property taxes and insurance ($year) Rent ($year)
Material costs for maintenance and repairs ($year)
Production maintenance and repairs ($year)
Forecourt maintenance and repairs ($year)
Other fees ($year) Other fixed OampM costs ($year)
Total fixed operating costs
bullbull Note that some costs for hydrogen production would not applyNote that some costs for hydrogen production would not apply bull For this analysis we assumed that the fuel cell is installed onsite - so land leasing is not needed
$
Step 3K Feedstock Cost Specification
Commercial Natural Gas
No $10150
Commercial Electricity metric rarr Electricity_metric
Look up base prices for each year No Enter base electricity price ($(2005)kWh) 0124
Byproduct electricity pricing Select price type Enter base electricity price ($(2005)kWh)
Specify local electricity sell-back rates
Energy Feedstocks Utilities and Byproducts Select the price table to use
AEO 2005 High A Case
Reforming fuel cell fuel specification
Commercial Natural Gas_metric rarrLook up prices for each year Enter fuel price ($(2005)MMBtu) Fuel pprice (($((2005))kWh))
Auxiliary heater (peak burner) fuel specification
Commercial Natural Gas_metric rarrLook up prices for each year Enter fuel price ($(2005)MMBtu)
Edit grid electricity import price matrix
Grid electricity base prices Commercial Electricity_metric rarr
Edit
Feedstock Costs (ldquoInput_Sheet_Templaterdquo tab)
Enter zero for natural gas cost
Commercial Natural Gas
No $0000 $0000
Specify local electricity rates
Time of Day 0124
bull Water costs can be specified as well but they are typically relatively low bull Note Detailed grid cost structure can be accommodated by this model
t
Step 3L Verify Other Variable Operating Costs
Other Variable Operating Costs Other variable operating costs (eg environmental surcharges) ($year) $0
Other material costs ($year) $0 Grid peak charges ($year) $0Grid peak charges ($year) $0
Waste treatment costs ($year)
Solid waste disposal costs ($year) Total unplanned replacement capital cost factor ( of total direct d i bl )
150 depreciable costsyear) Royalties ($year) $000 Operator profit ($year) $000 Subsidies and tax incentives based on production ($year) $000 Refueling station OampM costs ($year)
Total variable operating costs excluding fuel ($year)
$172
bull Note that this is the place to define maintenance costs (15 of cap is default) bull Detailed capital cost replacements can be specified within the ldquoReplacement Costsrdquo sheet bull At this point the model specifications are complete
Step 4 Running and Results ldquoInput_Sheet_Templaterdquo tab
Table of Contents
f View and edit project information
Cell color coding key
Use default values
Import and export data and perform analyses
Run hourly energy calculations and Run Hourly
Technical Operating Parameters and Specifications
Financial Input Values
Capital Costs
Calculate energy cost with existing hourly energy profile
calculate cost
Project Info Use Default
Values
Key Toolkit
Energy Profile
Calculate Cost
Capital Costs
Once all inputs are complete click here
bull Running the model performs an hourly energy analysis bull After energy analysis is complete economic analysis and emissions are evaluated bull Completed running will place you on the results tab
Reviewing Results
t
Analysis Results for 1000 Cow Dairy
1000 cow dairy Electricity (kWhy) Heat (kWhy)
U d iUsed onsite 367 920 367920 367 920 367920
Sold 1810190
T t lTotal 2 178 1102178110 367 920 367920
Overall system efficiency is 54 based on heat used Utilization of available heat is only 26
National Renewable Energy Laboratory Innovation for Our Energy Future 40
Analysis Results for 1000 Cow Dairy
Baseline system energy costs (without to installation of fuel cell) Electricity ($year)
Usage and Demand charges $
55461
Commercial Natural Gas ($year) $
14157
Hydrogen (supplied by forecourt SMR system)system)
$
-
Hydrogen price = $0kg Total baseline system energy cost per year $
69618
Cost of natural gas for chillers would be $14157year
CHHP System Annualized Costs CHHP System Annualized Costs F l ll Fuel cell Annualized costs combined heatCapital costs $92806 Decommissioning costs $1176 and power system Fixed OampM Fixed OampM $14422$14422 with an 8 5 with an 85 Feedstock costs $0 internal rate ofOther raw material costs $0 Byproduct credits -$43590 return Other variable costs $8 Supplementary electricity $$2702 Supplementary heat $0 Total $67525
National Renewable Energy Laboratory Innovation for Our Energy Future 41
GHG Emissions Comparison
GHG Emissions Comparison
10000000
~515000 g of CO2eq would be emitted if the digester methane were
5000000
est
er
CH
4
digester methane were vented
-5000000
000 Base Case (wo digester) g
CO2eqmmBtu Digester with Fuel Cell (g
CO2eqmmBtu)
mm
Btu
Dig
e
-10000000
g C
O2
eq
m
-15000000
GHG Emissions from manure management GHG Emissions from biogas recovery
GHG Emissions from bioggas processingg avoided emissions - electricity generation p y g
avoided emissions - heat utilization
Data Source CARB Detailed California-Modified GREET Pathway for Liquefied Natural Gas (NG) from Dairy Digester BioGas CARB Stationary Source Division Version 20 September 23 2009
National Renewable Energy Laboratory Innovation for Our Energy Future 42
Thank You Contact InformationContact Information Darlenestewardnrelgov Michaelpenevnrelgov
National Renewable Energy Laboratory Innovation for Our Energy Future 43
- Fuel Cell Power Model for CHP and CHHPEconomics and Performance Analysis
- Outline
- Fuel Cell Basics
- Fuel Cell General Types
- MCFC Basics
- MCFC System Configuration
- Fuel Cell Power Model Introduction
- FCpower Model
- Overview of Combined Heat amp PowerConcept
- Dispatch Sequence for Electricity Generation
- Technology Selection for Hourly Energy Analysis
- Dispatch Sequence for Electricity Generation
- Integration of Demand Profiles Renewables Availability ampGrid Cost Structure
- FCPower Model Hourly Energy Analysis Module
- Biogas Case Study
- System Being Considered
- Methane Sources in the Sacramento Area
- Quick Start ndash 4 steps
- Economic Evaluation of a Fuel Cell at a Dairy
- Information Needed
- Energy amp Material Values
- Cost Values
- Step 1
- Step 2 Selecting Hardware
- Step 3 Entering Detailed Specifications
- Step 3A Entering Specifications
- Step 3B Input Electric and Heat Demands benchmark_large_
- Step 3C Economic criteria specification
- Step 3D Capital Costs
- Step 3E Remove Hydrogen Co-production
- Step 3F Fuel Cell Capacity
- Step 3G Inputting System Costs
- Step 3H Input Indirect Capital Costs
- Step 3I Incentives Specification
- Step 3J Specifying Fixed Operating Costs
- Step 3K Feedstock Cost Specification
- Step 3L Verify Other Variable Operating Costs
- Step 4 Running and Results
- Reviewing Results
- Analysis Results for 1000 Cow Dairy
- Analysis Results for 1000 Cow Dairy
- GHG Emissions Comparison
- Thank You
-
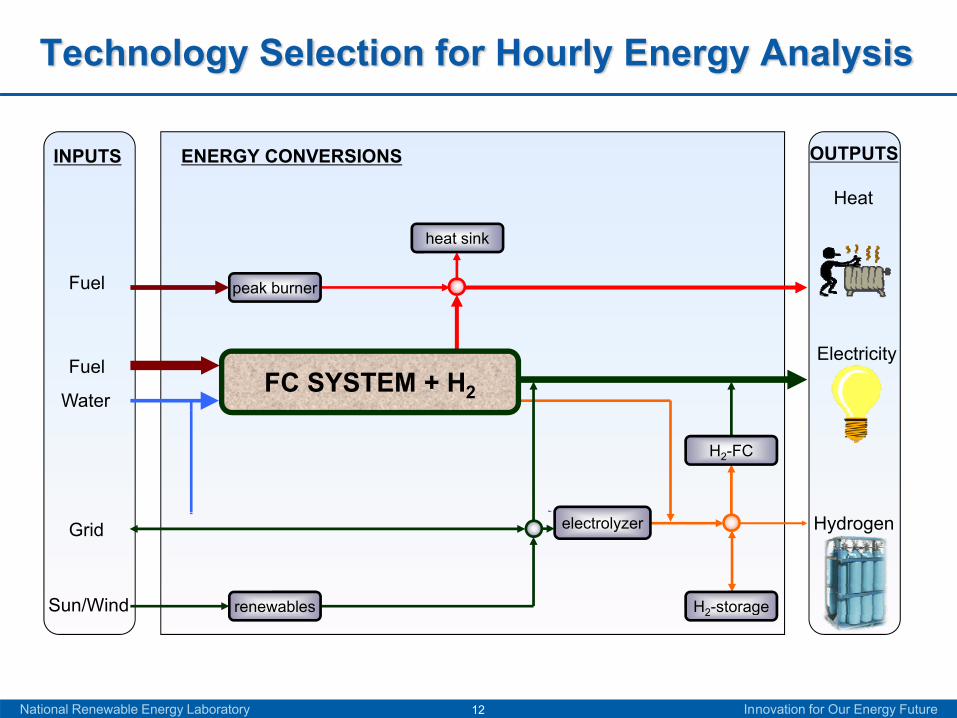
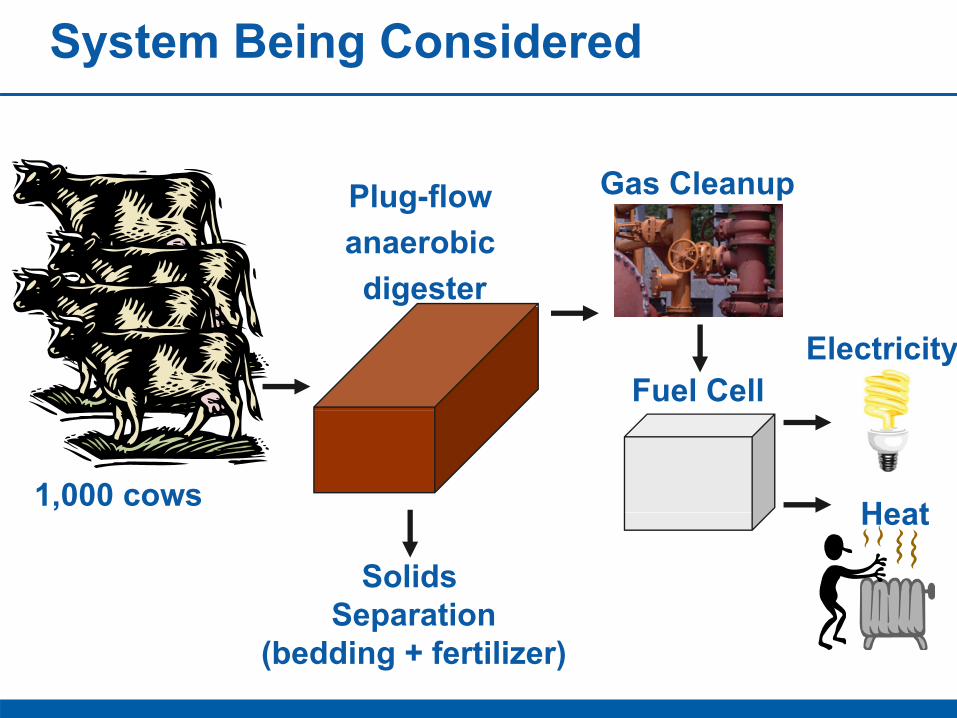
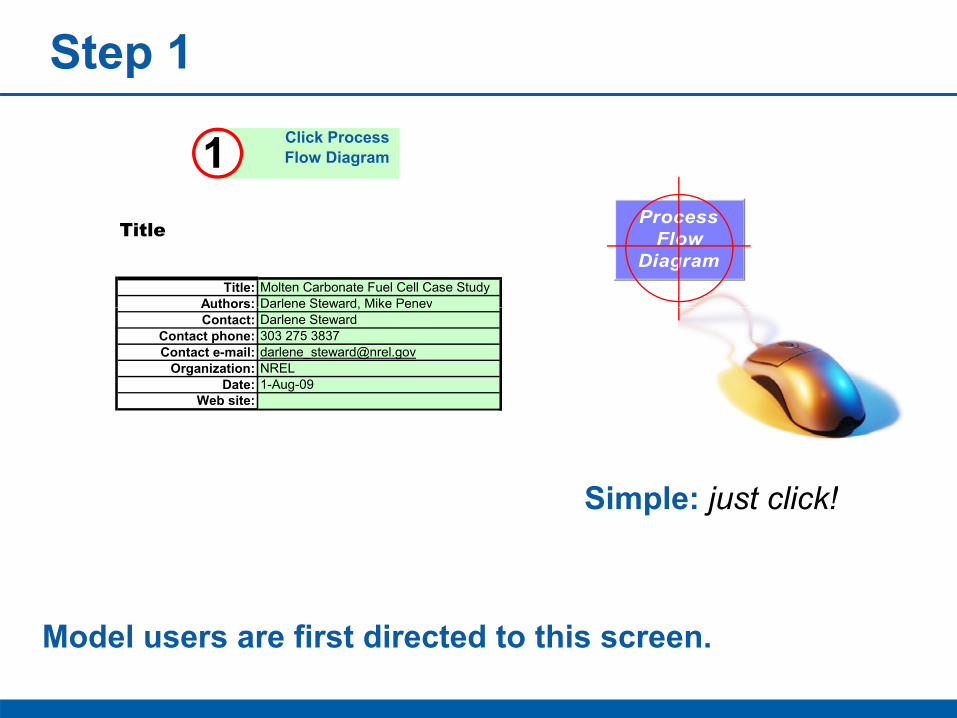
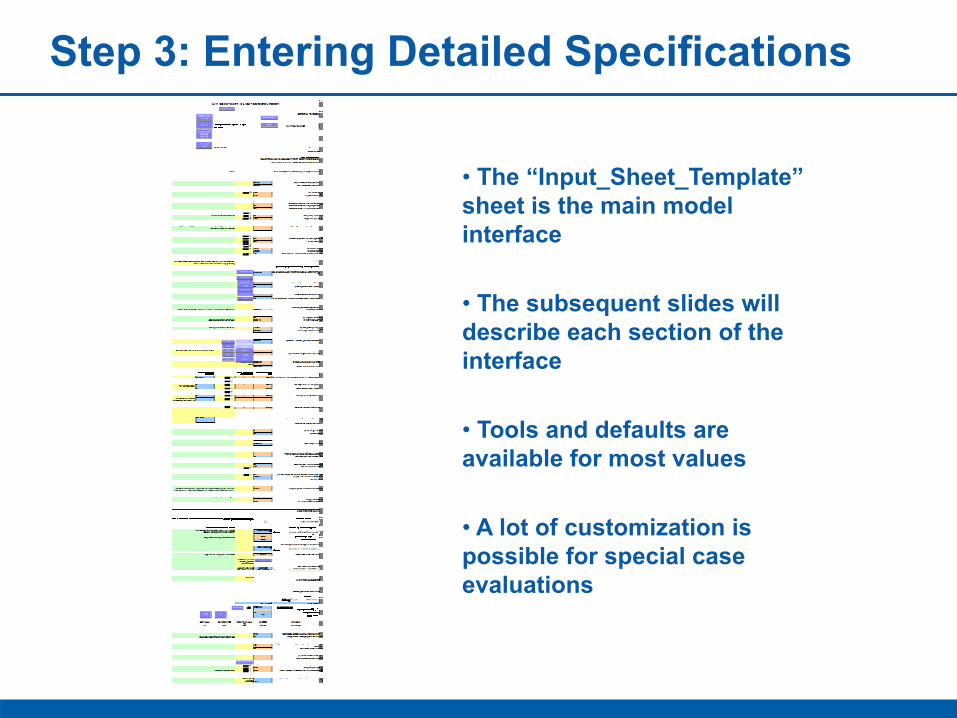

t
Step 3C Economic criteria specification FiFinanciial Input VValues l I l Reference year 2005
2010
1
100
0
0
0038
20
20
100
100
40
50
10
10
19
100
60
350
3890
15
Default Assumed startup year Length of construction period (years) of capital spent in 1st year of construction of capital spent in 2nd year of construction of capital spent in 3rd year of construction of capital spent in 4th year of construction Startup time (years) Plant life (years) Default Analysis period (years) Default equity financing () Default Interest rate on debt if applicable () Debt period (years) of fixed operating costs during startup ()
of revenues during startup () of variable operating costs during startup () Decommissioning costs ( of initial capital investment) Default Salvage value ( of initial capital investment) Default Inflation rate () Default After-tax real IRR () Default State taxes () Default Federal taxes () Default Total tax rate () Working capital ( of yearly change in operating costs) Default
bull Verify and update economic assumptions
_
Step 3D Capital Costs
Direct Capital Cost Specification (ldquoInput_Sheet_Templaterdquo tab)( p _ p )
Direct capital costs (enter costs on equipment sheet)
High-temperature fuel cell andor reformer process direct capital cost ($)($)
Electrolyzer direct capital cost ($)
$2339362 Go to Detail Sheet
No ectedNott SS eellected
Hydrogen fuel cell direct capital cost ($) No ectedNott SS eellected
Auxiliary heater direct capital cost ($) $0 Unlink
Solar (PV) direct capital cost ($) No ectedNott SS eellected
Wind turbine(s) direct capital cost ($) No ectedNott SS eellected
Hydrogen compression storage and dispensing direct capital cost ($)
Total direct capital costs $2339362
No ectedNott SS eellected
bull This section provides links to the fuel cell system and hydrogen storage tabs
Step 3E Remove Hydrogen Co-production H
yddro
gen
Dem
and
( o
f tot
al d
aily
de Hydrogen Demand
(ldquoH2 Demandrdquo tab)
Enter zero for daily hydrogen demand
00 00 00 00 Average daily hydrogen demand 0 kgday 00 Hourly Hydrogen Demand Statistics ( of avg daily demand) 00 Maximum 5000 00 Minimum 000 0 0 500 AAverage 4 1 417 00 Standard deviation 1382 00 Surge above the system average demand 00000 00 Friday average above weekly average () 00000 00 Adjusted average daily demand 0 kgday 00 00 00 0 0 00
500 00
bull Remove all hydrogen demand by zeroing daily H2 demand bull Remove all capital cost for hydrogen dispensing
Hydrogen Storage Costs (ldquoHydrogen Storagerdquo tab)
Enter zero for all hydrogen dispensing costs
Baseline Uninstalled Installation Cost Baseline Installed Major PiecesSystems of Equipment Costs Factor Costs
Low-pressure storage tanks p g $ - 130 $ - Cascade storage tanks $ - 130 $ - Compressor cost $ - 120 $ - Dispensers $ - 120 $ - Electrical upgrades $ - 220 $ - Control and safety equipment $ - 120 $ - 300 ft pipeline to filling station $ - 100 $ -
$ - $ - $ - $ -
Totals $ - $ -
Step 3F Fuel Cell Capacity
Fuel Cell Specifications (ldquoFuel Cell Systemrdquo tab)
Enter fuel cell capacity
FUEL CELL SYSTEM SPECIFICATIONS Descriptions
( y )
Maximum electricity output rating kW 3000 AC average demand
Minimum electricity output rating kW 2490
Efficiency of H2 production (kW H2 produced kW CHP heat reduced) Efficiency of H2 production (kW H2 produced kW CHP heat reduced) 96 96 Coefficient is derived from matching thermodynamic models Coefficient is derived from matching thermodynamic models
Efficiency of H2 over-production (kW H2 produced additional kW fuel consumed) 80 Coefficient is derived from matching thermodynamic models
Maximum fraction of heat converteable to hydrogen 065 Coefficient is derived from matching thermodynamic models
Maximum amount of hydrogen over-production as fraction of H2 production 050 Coefficient is derived from matching thermodynamic models
bull Maximum FC capacity of 300 is a good fit with available digester gas bull 83 of 300 kW allows for utilization factor specification = 249 kW of min rating bull Remainingg coefficients are not impportant for this analyysis as theyy are for H22 co-pproduction
Step 3G Inputting System Costs
Fuel Cell Cost Specifications ((ldquoFuel Cell Syystemrdquo tab))
INVESTMENT (Inputs REQUIRED in
Major PiecesSystems of Equipment Fuel cell CHP equipment uninstalled cost Fuel cell CHP equipment uninstalled cost Plug Flow Digester System Digester engineering and installation Total ancillary systems
Post-digestion solids separation system Hydrogen sulfide treatment Utility hookup Utility hookup
Totals
Baseline Uninstalled
Costs
$$ 750 000 750000
$ 1166477 $
247435
$ 97560 $ 63626 $$ 111699111699
$
2436796
Enter fuel cell digester gas cleanupp costs
Installation Cost Baseline Factor Installed Costs
1 20 120 $$ 900 000 900000 000 $ -100 $ 1166477
$ - 100 $ 97560 100 $ 63626 100100 $$ 111699111699
$ -$ -$
-
$ 2339362
bull This sheet would contain all hardware capital costsThis sheet would contain all hardware capital costs bull If installed costs are used enter installation cost factors of 10
_
$ $
Step 3H Input Indirect Capital Costs
Indirect Capital Costs Specification ((ldquoInput_Sheet_Tempplaterdquo tab)p _ )
Indirect depreciable capital costs Site preparation ($)
Engineering amp design ($) Engineering amp design ($)
Process contingency ($) Project contingency ($) Other (depreciable) capital ($) One-time licensing fees ($) ) g ( Up-front permitting costs ($)
Total indirect capital costs Total Direct amp Indirect Capital Investment
$233936
$163 755 $163755
$0 $116968
$0 $0
$70181 $584840
$2924202
The power model provides default values for each value aboveThe power model provides default values for each value above but it can be overridden
late
late
Step 3I Incentives Specification Incentives Specification (ldquoInput_Sheet_Templaterdquo tab)
Federal Tax Incentives and credits (enter as positive numbers) Incentive Federal business energy tax credit - fuel cells ($)
Federal alternative fuel infrastructure tax credit ($)
Federal combined heat and power tax credit ($)
Federal business energy tax credit - solar ($)
Federal business energygy tax credit - wind (($))
Other one-time tax incentive credits ($)
Total incentives and credits
$324000
$0
Calculate
Calculate
Calculate
Calcu
C lCalcul t SGIP
$1350000 Enter as a positive number
$1674000
bull Federal tax incentive is 30 of capital or 3 000 $kW whichever is lessFederal tax incentive is 30 of capital or 3000 $kW whichever is less bull Self Generation Incentive Program (SGIP) is a CA program that pays up to 4500 $kW of installed capacity of renewable electric production
Step 3J Specifying Fixed Operating Costs
Fixed Operating Costs Specifications
(ldquoInput_Sheet_Templaterdquo tab) Fixed Operating Costs Production facility plant staff (number of FTEs) Burdened labor cost including overhead ($man-hr) Production facility labor cost $year Storagedispensing labor required (hoursyear) Storagedispensing labor cost ($man-hr) Storagedispensing labor cost ($year) GampA rate ( of labor cost)
$0
00 $000
$0 20
$0 $2339
2 $25004
$0$0
$46787
$0
$000 $74131
Default GampA ($year) Licensing permits and fees ($year) Property tax and insurance rate ( of total capital investment) Default Property taxes and insurance ($year) Rent ($year)
Material costs for maintenance and repairs ($year)
Production maintenance and repairs ($year)
Forecourt maintenance and repairs ($year)
Other fees ($year) Other fixed OampM costs ($year)
Total fixed operating costs
bullbull Note that some costs for hydrogen production would not applyNote that some costs for hydrogen production would not apply bull For this analysis we assumed that the fuel cell is installed onsite - so land leasing is not needed
$
Step 3K Feedstock Cost Specification
Commercial Natural Gas
No $10150
Commercial Electricity metric rarr Electricity_metric
Look up base prices for each year No Enter base electricity price ($(2005)kWh) 0124
Byproduct electricity pricing Select price type Enter base electricity price ($(2005)kWh)
Specify local electricity sell-back rates
Energy Feedstocks Utilities and Byproducts Select the price table to use
AEO 2005 High A Case
Reforming fuel cell fuel specification
Commercial Natural Gas_metric rarrLook up prices for each year Enter fuel price ($(2005)MMBtu) Fuel pprice (($((2005))kWh))
Auxiliary heater (peak burner) fuel specification
Commercial Natural Gas_metric rarrLook up prices for each year Enter fuel price ($(2005)MMBtu)
Edit grid electricity import price matrix
Grid electricity base prices Commercial Electricity_metric rarr
Edit
Feedstock Costs (ldquoInput_Sheet_Templaterdquo tab)
Enter zero for natural gas cost
Commercial Natural Gas
No $0000 $0000
Specify local electricity rates
Time of Day 0124
bull Water costs can be specified as well but they are typically relatively low bull Note Detailed grid cost structure can be accommodated by this model
t
Step 3L Verify Other Variable Operating Costs
Other Variable Operating Costs Other variable operating costs (eg environmental surcharges) ($year) $0
Other material costs ($year) $0 Grid peak charges ($year) $0Grid peak charges ($year) $0
Waste treatment costs ($year)
Solid waste disposal costs ($year) Total unplanned replacement capital cost factor ( of total direct d i bl )
150 depreciable costsyear) Royalties ($year) $000 Operator profit ($year) $000 Subsidies and tax incentives based on production ($year) $000 Refueling station OampM costs ($year)
Total variable operating costs excluding fuel ($year)
$172
bull Note that this is the place to define maintenance costs (15 of cap is default) bull Detailed capital cost replacements can be specified within the ldquoReplacement Costsrdquo sheet bull At this point the model specifications are complete
Step 4 Running and Results ldquoInput_Sheet_Templaterdquo tab
Table of Contents
f View and edit project information
Cell color coding key
Use default values
Import and export data and perform analyses
Run hourly energy calculations and Run Hourly
Technical Operating Parameters and Specifications
Financial Input Values
Capital Costs
Calculate energy cost with existing hourly energy profile
calculate cost
Project Info Use Default
Values
Key Toolkit
Energy Profile
Calculate Cost
Capital Costs
Once all inputs are complete click here
bull Running the model performs an hourly energy analysis bull After energy analysis is complete economic analysis and emissions are evaluated bull Completed running will place you on the results tab
Reviewing Results
t
Analysis Results for 1000 Cow Dairy
1000 cow dairy Electricity (kWhy) Heat (kWhy)
U d iUsed onsite 367 920 367920 367 920 367920
Sold 1810190
T t lTotal 2 178 1102178110 367 920 367920
Overall system efficiency is 54 based on heat used Utilization of available heat is only 26
National Renewable Energy Laboratory Innovation for Our Energy Future 40
Analysis Results for 1000 Cow Dairy
Baseline system energy costs (without to installation of fuel cell) Electricity ($year)
Usage and Demand charges $
55461
Commercial Natural Gas ($year) $
14157
Hydrogen (supplied by forecourt SMR system)system)
$
-
Hydrogen price = $0kg Total baseline system energy cost per year $
69618
Cost of natural gas for chillers would be $14157year
CHHP System Annualized Costs CHHP System Annualized Costs F l ll Fuel cell Annualized costs combined heatCapital costs $92806 Decommissioning costs $1176 and power system Fixed OampM Fixed OampM $14422$14422 with an 8 5 with an 85 Feedstock costs $0 internal rate ofOther raw material costs $0 Byproduct credits -$43590 return Other variable costs $8 Supplementary electricity $$2702 Supplementary heat $0 Total $67525
National Renewable Energy Laboratory Innovation for Our Energy Future 41
GHG Emissions Comparison
GHG Emissions Comparison
10000000
~515000 g of CO2eq would be emitted if the digester methane were
5000000
est
er
CH
4
digester methane were vented
-5000000
000 Base Case (wo digester) g
CO2eqmmBtu Digester with Fuel Cell (g
CO2eqmmBtu)
mm
Btu
Dig
e
-10000000
g C
O2
eq
m
-15000000
GHG Emissions from manure management GHG Emissions from biogas recovery
GHG Emissions from bioggas processingg avoided emissions - electricity generation p y g
avoided emissions - heat utilization
Data Source CARB Detailed California-Modified GREET Pathway for Liquefied Natural Gas (NG) from Dairy Digester BioGas CARB Stationary Source Division Version 20 September 23 2009
National Renewable Energy Laboratory Innovation for Our Energy Future 42
Thank You Contact InformationContact Information Darlenestewardnrelgov Michaelpenevnrelgov
National Renewable Energy Laboratory Innovation for Our Energy Future 43
- Fuel Cell Power Model for CHP and CHHPEconomics and Performance Analysis
- Outline
- Fuel Cell Basics
- Fuel Cell General Types
- MCFC Basics
- MCFC System Configuration
- Fuel Cell Power Model Introduction
- FCpower Model
- Overview of Combined Heat amp PowerConcept
- Dispatch Sequence for Electricity Generation
- Technology Selection for Hourly Energy Analysis
- Dispatch Sequence for Electricity Generation
- Integration of Demand Profiles Renewables Availability ampGrid Cost Structure
- FCPower Model Hourly Energy Analysis Module
- Biogas Case Study
- System Being Considered
- Methane Sources in the Sacramento Area
- Quick Start ndash 4 steps
- Economic Evaluation of a Fuel Cell at a Dairy
- Information Needed
- Energy amp Material Values
- Cost Values
- Step 1
- Step 2 Selecting Hardware
- Step 3 Entering Detailed Specifications
- Step 3A Entering Specifications
- Step 3B Input Electric and Heat Demands benchmark_large_
- Step 3C Economic criteria specification
- Step 3D Capital Costs
- Step 3E Remove Hydrogen Co-production
- Step 3F Fuel Cell Capacity
- Step 3G Inputting System Costs
- Step 3H Input Indirect Capital Costs
- Step 3I Incentives Specification
- Step 3J Specifying Fixed Operating Costs
- Step 3K Feedstock Cost Specification
- Step 3L Verify Other Variable Operating Costs
- Step 4 Running and Results
- Reviewing Results
- Analysis Results for 1000 Cow Dairy
- Analysis Results for 1000 Cow Dairy
- GHG Emissions Comparison
- Thank You
-
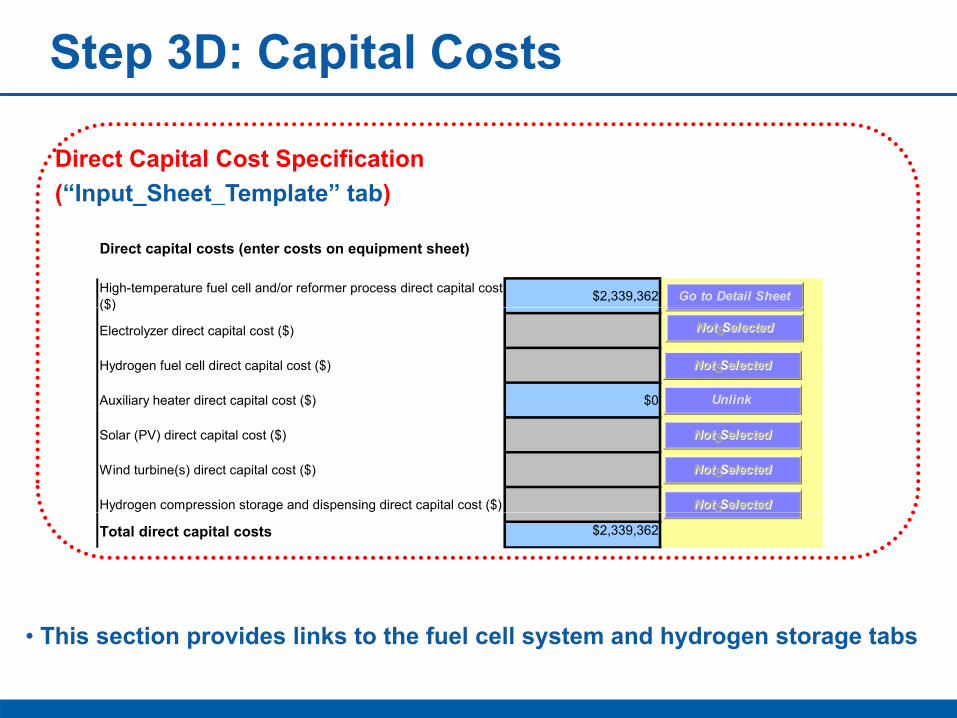
_
Step 3D Capital Costs
Direct Capital Cost Specification (ldquoInput_Sheet_Templaterdquo tab)( p _ p )
Direct capital costs (enter costs on equipment sheet)
High-temperature fuel cell andor reformer process direct capital cost ($)($)
Electrolyzer direct capital cost ($)
$2339362 Go to Detail Sheet
No ectedNott SS eellected
Hydrogen fuel cell direct capital cost ($) No ectedNott SS eellected
Auxiliary heater direct capital cost ($) $0 Unlink
Solar (PV) direct capital cost ($) No ectedNott SS eellected
Wind turbine(s) direct capital cost ($) No ectedNott SS eellected
Hydrogen compression storage and dispensing direct capital cost ($)
Total direct capital costs $2339362
No ectedNott SS eellected
bull This section provides links to the fuel cell system and hydrogen storage tabs
Step 3E Remove Hydrogen Co-production H
yddro
gen
Dem
and
( o
f tot
al d
aily
de Hydrogen Demand
(ldquoH2 Demandrdquo tab)
Enter zero for daily hydrogen demand
00 00 00 00 Average daily hydrogen demand 0 kgday 00 Hourly Hydrogen Demand Statistics ( of avg daily demand) 00 Maximum 5000 00 Minimum 000 0 0 500 AAverage 4 1 417 00 Standard deviation 1382 00 Surge above the system average demand 00000 00 Friday average above weekly average () 00000 00 Adjusted average daily demand 0 kgday 00 00 00 0 0 00
500 00
bull Remove all hydrogen demand by zeroing daily H2 demand bull Remove all capital cost for hydrogen dispensing
Hydrogen Storage Costs (ldquoHydrogen Storagerdquo tab)
Enter zero for all hydrogen dispensing costs
Baseline Uninstalled Installation Cost Baseline Installed Major PiecesSystems of Equipment Costs Factor Costs
Low-pressure storage tanks p g $ - 130 $ - Cascade storage tanks $ - 130 $ - Compressor cost $ - 120 $ - Dispensers $ - 120 $ - Electrical upgrades $ - 220 $ - Control and safety equipment $ - 120 $ - 300 ft pipeline to filling station $ - 100 $ -
$ - $ - $ - $ -
Totals $ - $ -
Step 3F Fuel Cell Capacity
Fuel Cell Specifications (ldquoFuel Cell Systemrdquo tab)
Enter fuel cell capacity
FUEL CELL SYSTEM SPECIFICATIONS Descriptions
( y )
Maximum electricity output rating kW 3000 AC average demand
Minimum electricity output rating kW 2490
Efficiency of H2 production (kW H2 produced kW CHP heat reduced) Efficiency of H2 production (kW H2 produced kW CHP heat reduced) 96 96 Coefficient is derived from matching thermodynamic models Coefficient is derived from matching thermodynamic models
Efficiency of H2 over-production (kW H2 produced additional kW fuel consumed) 80 Coefficient is derived from matching thermodynamic models
Maximum fraction of heat converteable to hydrogen 065 Coefficient is derived from matching thermodynamic models
Maximum amount of hydrogen over-production as fraction of H2 production 050 Coefficient is derived from matching thermodynamic models
bull Maximum FC capacity of 300 is a good fit with available digester gas bull 83 of 300 kW allows for utilization factor specification = 249 kW of min rating bull Remainingg coefficients are not impportant for this analyysis as theyy are for H22 co-pproduction
Step 3G Inputting System Costs
Fuel Cell Cost Specifications ((ldquoFuel Cell Syystemrdquo tab))
INVESTMENT (Inputs REQUIRED in
Major PiecesSystems of Equipment Fuel cell CHP equipment uninstalled cost Fuel cell CHP equipment uninstalled cost Plug Flow Digester System Digester engineering and installation Total ancillary systems
Post-digestion solids separation system Hydrogen sulfide treatment Utility hookup Utility hookup
Totals
Baseline Uninstalled
Costs
$$ 750 000 750000
$ 1166477 $
247435
$ 97560 $ 63626 $$ 111699111699
$
2436796
Enter fuel cell digester gas cleanupp costs
Installation Cost Baseline Factor Installed Costs
1 20 120 $$ 900 000 900000 000 $ -100 $ 1166477
$ - 100 $ 97560 100 $ 63626 100100 $$ 111699111699
$ -$ -$
-
$ 2339362
bull This sheet would contain all hardware capital costsThis sheet would contain all hardware capital costs bull If installed costs are used enter installation cost factors of 10
_
$ $
Step 3H Input Indirect Capital Costs
Indirect Capital Costs Specification ((ldquoInput_Sheet_Tempplaterdquo tab)p _ )
Indirect depreciable capital costs Site preparation ($)
Engineering amp design ($) Engineering amp design ($)
Process contingency ($) Project contingency ($) Other (depreciable) capital ($) One-time licensing fees ($) ) g ( Up-front permitting costs ($)
Total indirect capital costs Total Direct amp Indirect Capital Investment
$233936
$163 755 $163755
$0 $116968
$0 $0
$70181 $584840
$2924202
The power model provides default values for each value aboveThe power model provides default values for each value above but it can be overridden
late
late
Step 3I Incentives Specification Incentives Specification (ldquoInput_Sheet_Templaterdquo tab)
Federal Tax Incentives and credits (enter as positive numbers) Incentive Federal business energy tax credit - fuel cells ($)
Federal alternative fuel infrastructure tax credit ($)
Federal combined heat and power tax credit ($)
Federal business energy tax credit - solar ($)
Federal business energygy tax credit - wind (($))
Other one-time tax incentive credits ($)
Total incentives and credits
$324000
$0
Calculate
Calculate
Calculate
Calcu
C lCalcul t SGIP
$1350000 Enter as a positive number
$1674000
bull Federal tax incentive is 30 of capital or 3 000 $kW whichever is lessFederal tax incentive is 30 of capital or 3000 $kW whichever is less bull Self Generation Incentive Program (SGIP) is a CA program that pays up to 4500 $kW of installed capacity of renewable electric production
Step 3J Specifying Fixed Operating Costs
Fixed Operating Costs Specifications
(ldquoInput_Sheet_Templaterdquo tab) Fixed Operating Costs Production facility plant staff (number of FTEs) Burdened labor cost including overhead ($man-hr) Production facility labor cost $year Storagedispensing labor required (hoursyear) Storagedispensing labor cost ($man-hr) Storagedispensing labor cost ($year) GampA rate ( of labor cost)
$0
00 $000
$0 20
$0 $2339
2 $25004
$0$0
$46787
$0
$000 $74131
Default GampA ($year) Licensing permits and fees ($year) Property tax and insurance rate ( of total capital investment) Default Property taxes and insurance ($year) Rent ($year)
Material costs for maintenance and repairs ($year)
Production maintenance and repairs ($year)
Forecourt maintenance and repairs ($year)
Other fees ($year) Other fixed OampM costs ($year)
Total fixed operating costs
bullbull Note that some costs for hydrogen production would not applyNote that some costs for hydrogen production would not apply bull For this analysis we assumed that the fuel cell is installed onsite - so land leasing is not needed
$
Step 3K Feedstock Cost Specification
Commercial Natural Gas
No $10150
Commercial Electricity metric rarr Electricity_metric
Look up base prices for each year No Enter base electricity price ($(2005)kWh) 0124
Byproduct electricity pricing Select price type Enter base electricity price ($(2005)kWh)
Specify local electricity sell-back rates
Energy Feedstocks Utilities and Byproducts Select the price table to use
AEO 2005 High A Case
Reforming fuel cell fuel specification
Commercial Natural Gas_metric rarrLook up prices for each year Enter fuel price ($(2005)MMBtu) Fuel pprice (($((2005))kWh))
Auxiliary heater (peak burner) fuel specification
Commercial Natural Gas_metric rarrLook up prices for each year Enter fuel price ($(2005)MMBtu)
Edit grid electricity import price matrix
Grid electricity base prices Commercial Electricity_metric rarr
Edit
Feedstock Costs (ldquoInput_Sheet_Templaterdquo tab)
Enter zero for natural gas cost
Commercial Natural Gas
No $0000 $0000
Specify local electricity rates
Time of Day 0124
bull Water costs can be specified as well but they are typically relatively low bull Note Detailed grid cost structure can be accommodated by this model
t
Step 3L Verify Other Variable Operating Costs
Other Variable Operating Costs Other variable operating costs (eg environmental surcharges) ($year) $0
Other material costs ($year) $0 Grid peak charges ($year) $0Grid peak charges ($year) $0
Waste treatment costs ($year)
Solid waste disposal costs ($year) Total unplanned replacement capital cost factor ( of total direct d i bl )
150 depreciable costsyear) Royalties ($year) $000 Operator profit ($year) $000 Subsidies and tax incentives based on production ($year) $000 Refueling station OampM costs ($year)
Total variable operating costs excluding fuel ($year)
$172
bull Note that this is the place to define maintenance costs (15 of cap is default) bull Detailed capital cost replacements can be specified within the ldquoReplacement Costsrdquo sheet bull At this point the model specifications are complete
Step 4 Running and Results ldquoInput_Sheet_Templaterdquo tab
Table of Contents
f View and edit project information
Cell color coding key
Use default values
Import and export data and perform analyses
Run hourly energy calculations and Run Hourly
Technical Operating Parameters and Specifications
Financial Input Values
Capital Costs
Calculate energy cost with existing hourly energy profile
calculate cost
Project Info Use Default
Values
Key Toolkit
Energy Profile
Calculate Cost
Capital Costs
Once all inputs are complete click here
bull Running the model performs an hourly energy analysis bull After energy analysis is complete economic analysis and emissions are evaluated bull Completed running will place you on the results tab
Reviewing Results
t
Analysis Results for 1000 Cow Dairy
1000 cow dairy Electricity (kWhy) Heat (kWhy)
U d iUsed onsite 367 920 367920 367 920 367920
Sold 1810190
T t lTotal 2 178 1102178110 367 920 367920
Overall system efficiency is 54 based on heat used Utilization of available heat is only 26
National Renewable Energy Laboratory Innovation for Our Energy Future 40
Analysis Results for 1000 Cow Dairy
Baseline system energy costs (without to installation of fuel cell) Electricity ($year)
Usage and Demand charges $
55461
Commercial Natural Gas ($year) $
14157
Hydrogen (supplied by forecourt SMR system)system)
$
-
Hydrogen price = $0kg Total baseline system energy cost per year $
69618
Cost of natural gas for chillers would be $14157year
CHHP System Annualized Costs CHHP System Annualized Costs F l ll Fuel cell Annualized costs combined heatCapital costs $92806 Decommissioning costs $1176 and power system Fixed OampM Fixed OampM $14422$14422 with an 8 5 with an 85 Feedstock costs $0 internal rate ofOther raw material costs $0 Byproduct credits -$43590 return Other variable costs $8 Supplementary electricity $$2702 Supplementary heat $0 Total $67525
National Renewable Energy Laboratory Innovation for Our Energy Future 41
GHG Emissions Comparison
GHG Emissions Comparison
10000000
~515000 g of CO2eq would be emitted if the digester methane were
5000000
est
er
CH
4
digester methane were vented
-5000000
000 Base Case (wo digester) g
CO2eqmmBtu Digester with Fuel Cell (g
CO2eqmmBtu)
mm
Btu
Dig
e
-10000000
g C
O2
eq
m
-15000000
GHG Emissions from manure management GHG Emissions from biogas recovery
GHG Emissions from bioggas processingg avoided emissions - electricity generation p y g
avoided emissions - heat utilization
Data Source CARB Detailed California-Modified GREET Pathway for Liquefied Natural Gas (NG) from Dairy Digester BioGas CARB Stationary Source Division Version 20 September 23 2009
National Renewable Energy Laboratory Innovation for Our Energy Future 42
Thank You Contact InformationContact Information Darlenestewardnrelgov Michaelpenevnrelgov
National Renewable Energy Laboratory Innovation for Our Energy Future 43
- Fuel Cell Power Model for CHP and CHHPEconomics and Performance Analysis
- Outline
- Fuel Cell Basics
- Fuel Cell General Types
- MCFC Basics
- MCFC System Configuration
- Fuel Cell Power Model Introduction
- FCpower Model
- Overview of Combined Heat amp PowerConcept
- Dispatch Sequence for Electricity Generation
- Technology Selection for Hourly Energy Analysis
- Dispatch Sequence for Electricity Generation
- Integration of Demand Profiles Renewables Availability ampGrid Cost Structure
- FCPower Model Hourly Energy Analysis Module
- Biogas Case Study
- System Being Considered
- Methane Sources in the Sacramento Area
- Quick Start ndash 4 steps
- Economic Evaluation of a Fuel Cell at a Dairy
- Information Needed
- Energy amp Material Values
- Cost Values
- Step 1
- Step 2 Selecting Hardware
- Step 3 Entering Detailed Specifications
- Step 3A Entering Specifications
- Step 3B Input Electric and Heat Demands benchmark_large_
- Step 3C Economic criteria specification
- Step 3D Capital Costs
- Step 3E Remove Hydrogen Co-production
- Step 3F Fuel Cell Capacity
- Step 3G Inputting System Costs
- Step 3H Input Indirect Capital Costs
- Step 3I Incentives Specification
- Step 3J Specifying Fixed Operating Costs
- Step 3K Feedstock Cost Specification
- Step 3L Verify Other Variable Operating Costs
- Step 4 Running and Results
- Reviewing Results
- Analysis Results for 1000 Cow Dairy
- Analysis Results for 1000 Cow Dairy
- GHG Emissions Comparison
- Thank You
-
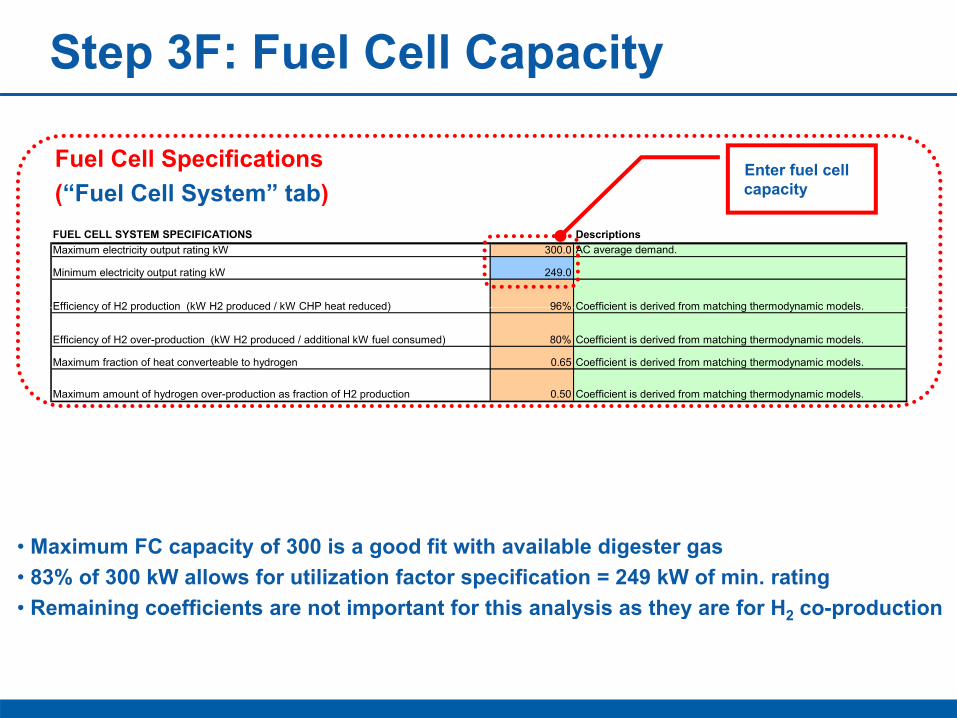
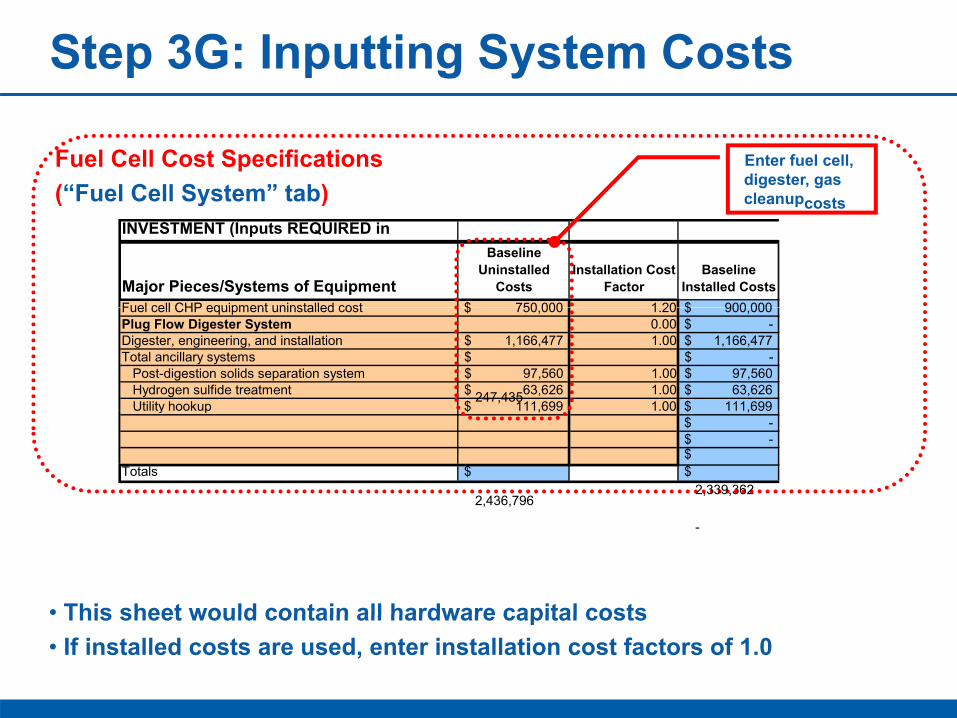
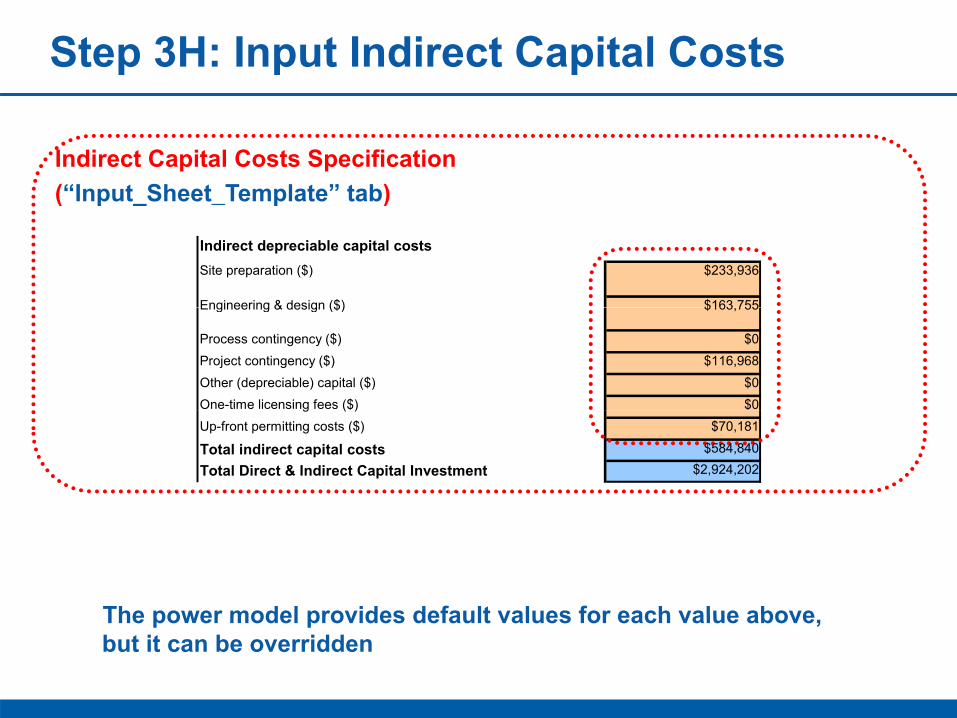
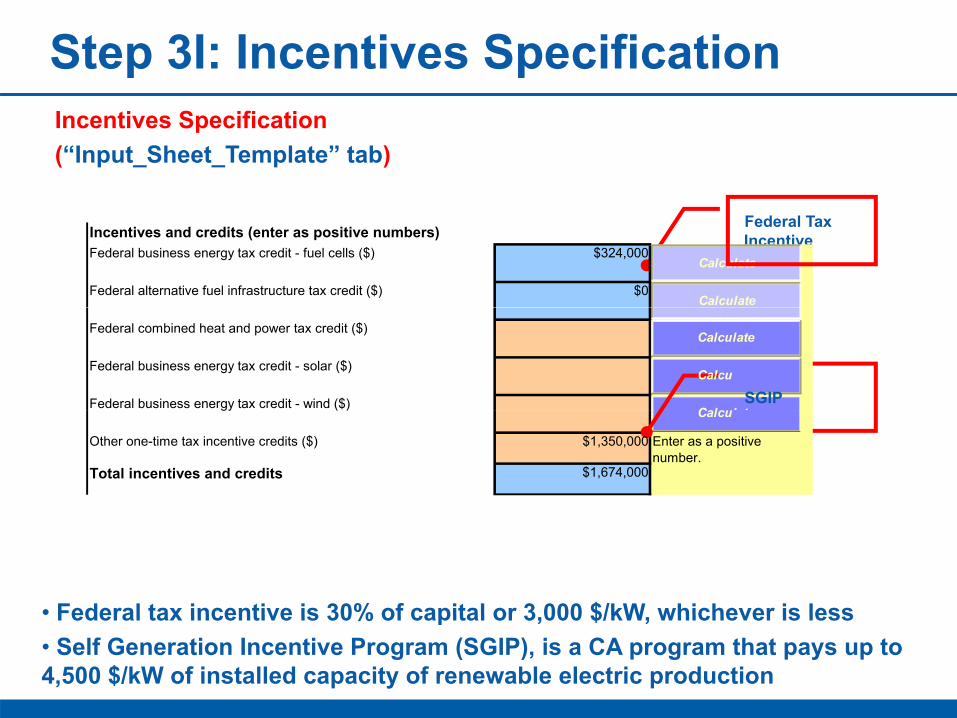
late
late
Step 3I Incentives Specification Incentives Specification (ldquoInput_Sheet_Templaterdquo tab)
Federal Tax Incentives and credits (enter as positive numbers) Incentive Federal business energy tax credit - fuel cells ($)
Federal alternative fuel infrastructure tax credit ($)
Federal combined heat and power tax credit ($)
Federal business energy tax credit - solar ($)
Federal business energygy tax credit - wind (($))
Other one-time tax incentive credits ($)
Total incentives and credits
$324000
$0
Calculate
Calculate
Calculate
Calcu
C lCalcul t SGIP
$1350000 Enter as a positive number
$1674000
bull Federal tax incentive is 30 of capital or 3 000 $kW whichever is lessFederal tax incentive is 30 of capital or 3000 $kW whichever is less bull Self Generation Incentive Program (SGIP) is a CA program that pays up to 4500 $kW of installed capacity of renewable electric production
Step 3J Specifying Fixed Operating Costs
Fixed Operating Costs Specifications
(ldquoInput_Sheet_Templaterdquo tab) Fixed Operating Costs Production facility plant staff (number of FTEs) Burdened labor cost including overhead ($man-hr) Production facility labor cost $year Storagedispensing labor required (hoursyear) Storagedispensing labor cost ($man-hr) Storagedispensing labor cost ($year) GampA rate ( of labor cost)
$0
00 $000
$0 20
$0 $2339
2 $25004
$0$0
$46787
$0
$000 $74131
Default GampA ($year) Licensing permits and fees ($year) Property tax and insurance rate ( of total capital investment) Default Property taxes and insurance ($year) Rent ($year)
Material costs for maintenance and repairs ($year)
Production maintenance and repairs ($year)
Forecourt maintenance and repairs ($year)
Other fees ($year) Other fixed OampM costs ($year)
Total fixed operating costs
bullbull Note that some costs for hydrogen production would not applyNote that some costs for hydrogen production would not apply bull For this analysis we assumed that the fuel cell is installed onsite - so land leasing is not needed
$
Step 3K Feedstock Cost Specification
Commercial Natural Gas
No $10150
Commercial Electricity metric rarr Electricity_metric
Look up base prices for each year No Enter base electricity price ($(2005)kWh) 0124
Byproduct electricity pricing Select price type Enter base electricity price ($(2005)kWh)
Specify local electricity sell-back rates
Energy Feedstocks Utilities and Byproducts Select the price table to use
AEO 2005 High A Case
Reforming fuel cell fuel specification
Commercial Natural Gas_metric rarrLook up prices for each year Enter fuel price ($(2005)MMBtu) Fuel pprice (($((2005))kWh))
Auxiliary heater (peak burner) fuel specification
Commercial Natural Gas_metric rarrLook up prices for each year Enter fuel price ($(2005)MMBtu)
Edit grid electricity import price matrix
Grid electricity base prices Commercial Electricity_metric rarr
Edit
Feedstock Costs (ldquoInput_Sheet_Templaterdquo tab)
Enter zero for natural gas cost
Commercial Natural Gas
No $0000 $0000
Specify local electricity rates
Time of Day 0124
bull Water costs can be specified as well but they are typically relatively low bull Note Detailed grid cost structure can be accommodated by this model
t
Step 3L Verify Other Variable Operating Costs
Other Variable Operating Costs Other variable operating costs (eg environmental surcharges) ($year) $0
Other material costs ($year) $0 Grid peak charges ($year) $0Grid peak charges ($year) $0
Waste treatment costs ($year)
Solid waste disposal costs ($year) Total unplanned replacement capital cost factor ( of total direct d i bl )
150 depreciable costsyear) Royalties ($year) $000 Operator profit ($year) $000 Subsidies and tax incentives based on production ($year) $000 Refueling station OampM costs ($year)
Total variable operating costs excluding fuel ($year)
$172
bull Note that this is the place to define maintenance costs (15 of cap is default) bull Detailed capital cost replacements can be specified within the ldquoReplacement Costsrdquo sheet bull At this point the model specifications are complete
Step 4 Running and Results ldquoInput_Sheet_Templaterdquo tab
Table of Contents
f View and edit project information
Cell color coding key
Use default values
Import and export data and perform analyses
Run hourly energy calculations and Run Hourly
Technical Operating Parameters and Specifications
Financial Input Values
Capital Costs
Calculate energy cost with existing hourly energy profile
calculate cost
Project Info Use Default
Values
Key Toolkit
Energy Profile
Calculate Cost
Capital Costs
Once all inputs are complete click here
bull Running the model performs an hourly energy analysis bull After energy analysis is complete economic analysis and emissions are evaluated bull Completed running will place you on the results tab
Reviewing Results
t
Analysis Results for 1000 Cow Dairy
1000 cow dairy Electricity (kWhy) Heat (kWhy)
U d iUsed onsite 367 920 367920 367 920 367920
Sold 1810190
T t lTotal 2 178 1102178110 367 920 367920
Overall system efficiency is 54 based on heat used Utilization of available heat is only 26
National Renewable Energy Laboratory Innovation for Our Energy Future 40
Analysis Results for 1000 Cow Dairy
Baseline system energy costs (without to installation of fuel cell) Electricity ($year)
Usage and Demand charges $
55461
Commercial Natural Gas ($year) $
14157
Hydrogen (supplied by forecourt SMR system)system)
$
-
Hydrogen price = $0kg Total baseline system energy cost per year $
69618
Cost of natural gas for chillers would be $14157year
CHHP System Annualized Costs CHHP System Annualized Costs F l ll Fuel cell Annualized costs combined heatCapital costs $92806 Decommissioning costs $1176 and power system Fixed OampM Fixed OampM $14422$14422 with an 8 5 with an 85 Feedstock costs $0 internal rate ofOther raw material costs $0 Byproduct credits -$43590 return Other variable costs $8 Supplementary electricity $$2702 Supplementary heat $0 Total $67525
National Renewable Energy Laboratory Innovation for Our Energy Future 41
GHG Emissions Comparison
GHG Emissions Comparison
10000000
~515000 g of CO2eq would be emitted if the digester methane were
5000000
est
er
CH
4
digester methane were vented
-5000000
000 Base Case (wo digester) g
CO2eqmmBtu Digester with Fuel Cell (g
CO2eqmmBtu)
mm
Btu
Dig
e
-10000000
g C
O2
eq
m
-15000000
GHG Emissions from manure management GHG Emissions from biogas recovery
GHG Emissions from bioggas processingg avoided emissions - electricity generation p y g
avoided emissions - heat utilization
Data Source CARB Detailed California-Modified GREET Pathway for Liquefied Natural Gas (NG) from Dairy Digester BioGas CARB Stationary Source Division Version 20 September 23 2009
National Renewable Energy Laboratory Innovation for Our Energy Future 42
Thank You Contact InformationContact Information Darlenestewardnrelgov Michaelpenevnrelgov
National Renewable Energy Laboratory Innovation for Our Energy Future 43
- Fuel Cell Power Model for CHP and CHHPEconomics and Performance Analysis
- Outline
- Fuel Cell Basics
- Fuel Cell General Types
- MCFC Basics
- MCFC System Configuration
- Fuel Cell Power Model Introduction
- FCpower Model
- Overview of Combined Heat amp PowerConcept
- Dispatch Sequence for Electricity Generation
- Technology Selection for Hourly Energy Analysis
- Dispatch Sequence for Electricity Generation
- Integration of Demand Profiles Renewables Availability ampGrid Cost Structure
- FCPower Model Hourly Energy Analysis Module
- Biogas Case Study
- System Being Considered
- Methane Sources in the Sacramento Area
- Quick Start ndash 4 steps
- Economic Evaluation of a Fuel Cell at a Dairy
- Information Needed
- Energy amp Material Values
- Cost Values
- Step 1
- Step 2 Selecting Hardware
- Step 3 Entering Detailed Specifications
- Step 3A Entering Specifications
- Step 3B Input Electric and Heat Demands benchmark_large_
- Step 3C Economic criteria specification
- Step 3D Capital Costs
- Step 3E Remove Hydrogen Co-production
- Step 3F Fuel Cell Capacity
- Step 3G Inputting System Costs
- Step 3H Input Indirect Capital Costs
- Step 3I Incentives Specification
- Step 3J Specifying Fixed Operating Costs
- Step 3K Feedstock Cost Specification
- Step 3L Verify Other Variable Operating Costs
- Step 4 Running and Results
- Reviewing Results
- Analysis Results for 1000 Cow Dairy
- Analysis Results for 1000 Cow Dairy
- GHG Emissions Comparison
- Thank You
-
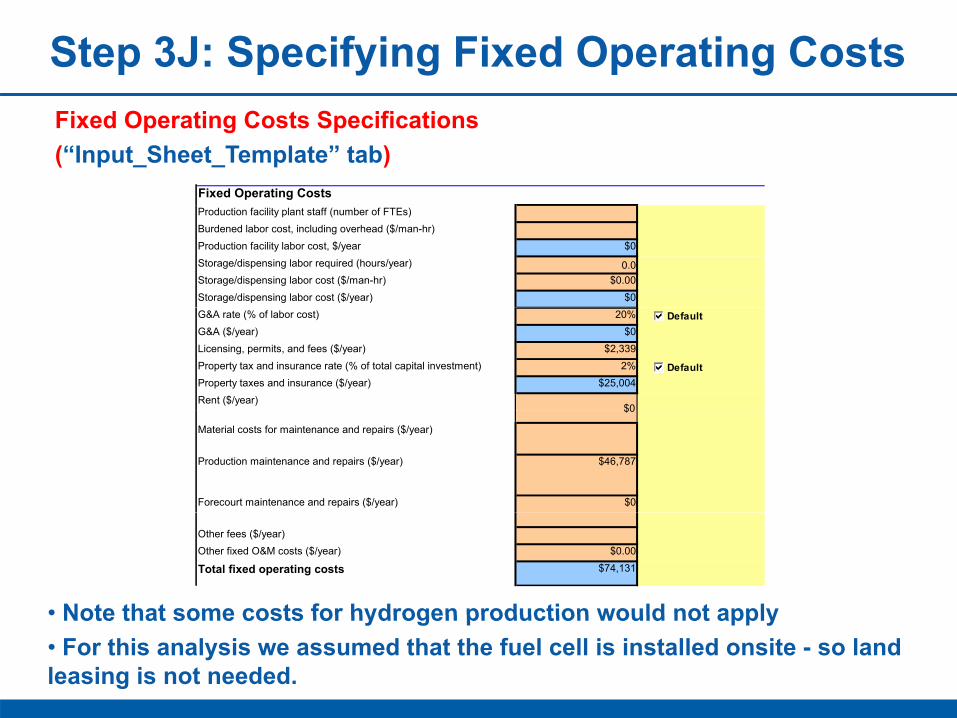

$
Step 3K Feedstock Cost Specification
Commercial Natural Gas
No $10150
Commercial Electricity metric rarr Electricity_metric
Look up base prices for each year No Enter base electricity price ($(2005)kWh) 0124
Byproduct electricity pricing Select price type Enter base electricity price ($(2005)kWh)
Specify local electricity sell-back rates
Energy Feedstocks Utilities and Byproducts Select the price table to use
AEO 2005 High A Case
Reforming fuel cell fuel specification
Commercial Natural Gas_metric rarrLook up prices for each year Enter fuel price ($(2005)MMBtu) Fuel pprice (($((2005))kWh))
Auxiliary heater (peak burner) fuel specification
Commercial Natural Gas_metric rarrLook up prices for each year Enter fuel price ($(2005)MMBtu)
Edit grid electricity import price matrix
Grid electricity base prices Commercial Electricity_metric rarr
Edit
Feedstock Costs (ldquoInput_Sheet_Templaterdquo tab)
Enter zero for natural gas cost
Commercial Natural Gas
No $0000 $0000
Specify local electricity rates
Time of Day 0124
bull Water costs can be specified as well but they are typically relatively low bull Note Detailed grid cost structure can be accommodated by this model
t
Step 3L Verify Other Variable Operating Costs
Other Variable Operating Costs Other variable operating costs (eg environmental surcharges) ($year) $0
Other material costs ($year) $0 Grid peak charges ($year) $0Grid peak charges ($year) $0
Waste treatment costs ($year)
Solid waste disposal costs ($year) Total unplanned replacement capital cost factor ( of total direct d i bl )
150 depreciable costsyear) Royalties ($year) $000 Operator profit ($year) $000 Subsidies and tax incentives based on production ($year) $000 Refueling station OampM costs ($year)
Total variable operating costs excluding fuel ($year)
$172
bull Note that this is the place to define maintenance costs (15 of cap is default) bull Detailed capital cost replacements can be specified within the ldquoReplacement Costsrdquo sheet bull At this point the model specifications are complete
Step 4 Running and Results ldquoInput_Sheet_Templaterdquo tab
Table of Contents
f View and edit project information
Cell color coding key
Use default values
Import and export data and perform analyses
Run hourly energy calculations and Run Hourly
Technical Operating Parameters and Specifications
Financial Input Values
Capital Costs
Calculate energy cost with existing hourly energy profile
calculate cost
Project Info Use Default
Values
Key Toolkit
Energy Profile
Calculate Cost
Capital Costs
Once all inputs are complete click here
bull Running the model performs an hourly energy analysis bull After energy analysis is complete economic analysis and emissions are evaluated bull Completed running will place you on the results tab
Reviewing Results
t
Analysis Results for 1000 Cow Dairy
1000 cow dairy Electricity (kWhy) Heat (kWhy)
U d iUsed onsite 367 920 367920 367 920 367920
Sold 1810190
T t lTotal 2 178 1102178110 367 920 367920
Overall system efficiency is 54 based on heat used Utilization of available heat is only 26
National Renewable Energy Laboratory Innovation for Our Energy Future 40
Analysis Results for 1000 Cow Dairy
Baseline system energy costs (without to installation of fuel cell) Electricity ($year)
Usage and Demand charges $
55461
Commercial Natural Gas ($year) $
14157
Hydrogen (supplied by forecourt SMR system)system)
$
-
Hydrogen price = $0kg Total baseline system energy cost per year $
69618
Cost of natural gas for chillers would be $14157year
CHHP System Annualized Costs CHHP System Annualized Costs F l ll Fuel cell Annualized costs combined heatCapital costs $92806 Decommissioning costs $1176 and power system Fixed OampM Fixed OampM $14422$14422 with an 8 5 with an 85 Feedstock costs $0 internal rate ofOther raw material costs $0 Byproduct credits -$43590 return Other variable costs $8 Supplementary electricity $$2702 Supplementary heat $0 Total $67525
National Renewable Energy Laboratory Innovation for Our Energy Future 41
GHG Emissions Comparison
GHG Emissions Comparison
10000000
~515000 g of CO2eq would be emitted if the digester methane were
5000000
est
er
CH
4
digester methane were vented
-5000000
000 Base Case (wo digester) g
CO2eqmmBtu Digester with Fuel Cell (g
CO2eqmmBtu)
mm
Btu
Dig
e
-10000000
g C
O2
eq
m
-15000000
GHG Emissions from manure management GHG Emissions from biogas recovery
GHG Emissions from bioggas processingg avoided emissions - electricity generation p y g
avoided emissions - heat utilization
Data Source CARB Detailed California-Modified GREET Pathway for Liquefied Natural Gas (NG) from Dairy Digester BioGas CARB Stationary Source Division Version 20 September 23 2009
National Renewable Energy Laboratory Innovation for Our Energy Future 42
Thank You Contact InformationContact Information Darlenestewardnrelgov Michaelpenevnrelgov
National Renewable Energy Laboratory Innovation for Our Energy Future 43
- Fuel Cell Power Model for CHP and CHHPEconomics and Performance Analysis
- Outline
- Fuel Cell Basics
- Fuel Cell General Types
- MCFC Basics
- MCFC System Configuration
- Fuel Cell Power Model Introduction
- FCpower Model
- Overview of Combined Heat amp PowerConcept
- Dispatch Sequence for Electricity Generation
- Technology Selection for Hourly Energy Analysis
- Dispatch Sequence for Electricity Generation
- Integration of Demand Profiles Renewables Availability ampGrid Cost Structure
- FCPower Model Hourly Energy Analysis Module
- Biogas Case Study
- System Being Considered
- Methane Sources in the Sacramento Area
- Quick Start ndash 4 steps
- Economic Evaluation of a Fuel Cell at a Dairy
- Information Needed
- Energy amp Material Values
- Cost Values
- Step 1
- Step 2 Selecting Hardware
- Step 3 Entering Detailed Specifications
- Step 3A Entering Specifications
- Step 3B Input Electric and Heat Demands benchmark_large_
- Step 3C Economic criteria specification
- Step 3D Capital Costs
- Step 3E Remove Hydrogen Co-production
- Step 3F Fuel Cell Capacity
- Step 3G Inputting System Costs
- Step 3H Input Indirect Capital Costs
- Step 3I Incentives Specification
- Step 3J Specifying Fixed Operating Costs
- Step 3K Feedstock Cost Specification
- Step 3L Verify Other Variable Operating Costs
- Step 4 Running and Results
- Reviewing Results
- Analysis Results for 1000 Cow Dairy
- Analysis Results for 1000 Cow Dairy
- GHG Emissions Comparison
- Thank You
-

t
Step 3L Verify Other Variable Operating Costs
Other Variable Operating Costs Other variable operating costs (eg environmental surcharges) ($year) $0
Other material costs ($year) $0 Grid peak charges ($year) $0Grid peak charges ($year) $0
Waste treatment costs ($year)
Solid waste disposal costs ($year) Total unplanned replacement capital cost factor ( of total direct d i bl )
150 depreciable costsyear) Royalties ($year) $000 Operator profit ($year) $000 Subsidies and tax incentives based on production ($year) $000 Refueling station OampM costs ($year)
Total variable operating costs excluding fuel ($year)
$172
bull Note that this is the place to define maintenance costs (15 of cap is default) bull Detailed capital cost replacements can be specified within the ldquoReplacement Costsrdquo sheet bull At this point the model specifications are complete
Step 4 Running and Results ldquoInput_Sheet_Templaterdquo tab
Table of Contents
f View and edit project information
Cell color coding key
Use default values
Import and export data and perform analyses
Run hourly energy calculations and Run Hourly
Technical Operating Parameters and Specifications
Financial Input Values
Capital Costs
Calculate energy cost with existing hourly energy profile
calculate cost
Project Info Use Default
Values
Key Toolkit
Energy Profile
Calculate Cost
Capital Costs
Once all inputs are complete click here
bull Running the model performs an hourly energy analysis bull After energy analysis is complete economic analysis and emissions are evaluated bull Completed running will place you on the results tab
Reviewing Results
t
Analysis Results for 1000 Cow Dairy
1000 cow dairy Electricity (kWhy) Heat (kWhy)
U d iUsed onsite 367 920 367920 367 920 367920
Sold 1810190
T t lTotal 2 178 1102178110 367 920 367920
Overall system efficiency is 54 based on heat used Utilization of available heat is only 26
National Renewable Energy Laboratory Innovation for Our Energy Future 40
Analysis Results for 1000 Cow Dairy
Baseline system energy costs (without to installation of fuel cell) Electricity ($year)
Usage and Demand charges $
55461
Commercial Natural Gas ($year) $
14157
Hydrogen (supplied by forecourt SMR system)system)
$
-
Hydrogen price = $0kg Total baseline system energy cost per year $
69618
Cost of natural gas for chillers would be $14157year
CHHP System Annualized Costs CHHP System Annualized Costs F l ll Fuel cell Annualized costs combined heatCapital costs $92806 Decommissioning costs $1176 and power system Fixed OampM Fixed OampM $14422$14422 with an 8 5 with an 85 Feedstock costs $0 internal rate ofOther raw material costs $0 Byproduct credits -$43590 return Other variable costs $8 Supplementary electricity $$2702 Supplementary heat $0 Total $67525
National Renewable Energy Laboratory Innovation for Our Energy Future 41
GHG Emissions Comparison
GHG Emissions Comparison
10000000
~515000 g of CO2eq would be emitted if the digester methane were
5000000
est
er
CH
4
digester methane were vented
-5000000
000 Base Case (wo digester) g
CO2eqmmBtu Digester with Fuel Cell (g
CO2eqmmBtu)
mm
Btu
Dig
e
-10000000
g C
O2
eq
m
-15000000
GHG Emissions from manure management GHG Emissions from biogas recovery
GHG Emissions from bioggas processingg avoided emissions - electricity generation p y g
avoided emissions - heat utilization
Data Source CARB Detailed California-Modified GREET Pathway for Liquefied Natural Gas (NG) from Dairy Digester BioGas CARB Stationary Source Division Version 20 September 23 2009
National Renewable Energy Laboratory Innovation for Our Energy Future 42
Thank You Contact InformationContact Information Darlenestewardnrelgov Michaelpenevnrelgov
National Renewable Energy Laboratory Innovation for Our Energy Future 43
- Fuel Cell Power Model for CHP and CHHPEconomics and Performance Analysis
- Outline
- Fuel Cell Basics
- Fuel Cell General Types
- MCFC Basics
- MCFC System Configuration
- Fuel Cell Power Model Introduction
- FCpower Model
- Overview of Combined Heat amp PowerConcept
- Dispatch Sequence for Electricity Generation
- Technology Selection for Hourly Energy Analysis
- Dispatch Sequence for Electricity Generation
- Integration of Demand Profiles Renewables Availability ampGrid Cost Structure
- FCPower Model Hourly Energy Analysis Module
- Biogas Case Study
- System Being Considered
- Methane Sources in the Sacramento Area
- Quick Start ndash 4 steps
- Economic Evaluation of a Fuel Cell at a Dairy
- Information Needed
- Energy amp Material Values
- Cost Values
- Step 1
- Step 2 Selecting Hardware
- Step 3 Entering Detailed Specifications
- Step 3A Entering Specifications
- Step 3B Input Electric and Heat Demands benchmark_large_
- Step 3C Economic criteria specification
- Step 3D Capital Costs
- Step 3E Remove Hydrogen Co-production
- Step 3F Fuel Cell Capacity
- Step 3G Inputting System Costs
- Step 3H Input Indirect Capital Costs
- Step 3I Incentives Specification
- Step 3J Specifying Fixed Operating Costs
- Step 3K Feedstock Cost Specification
- Step 3L Verify Other Variable Operating Costs
- Step 4 Running and Results
- Reviewing Results
- Analysis Results for 1000 Cow Dairy
- Analysis Results for 1000 Cow Dairy
- GHG Emissions Comparison
- Thank You
-
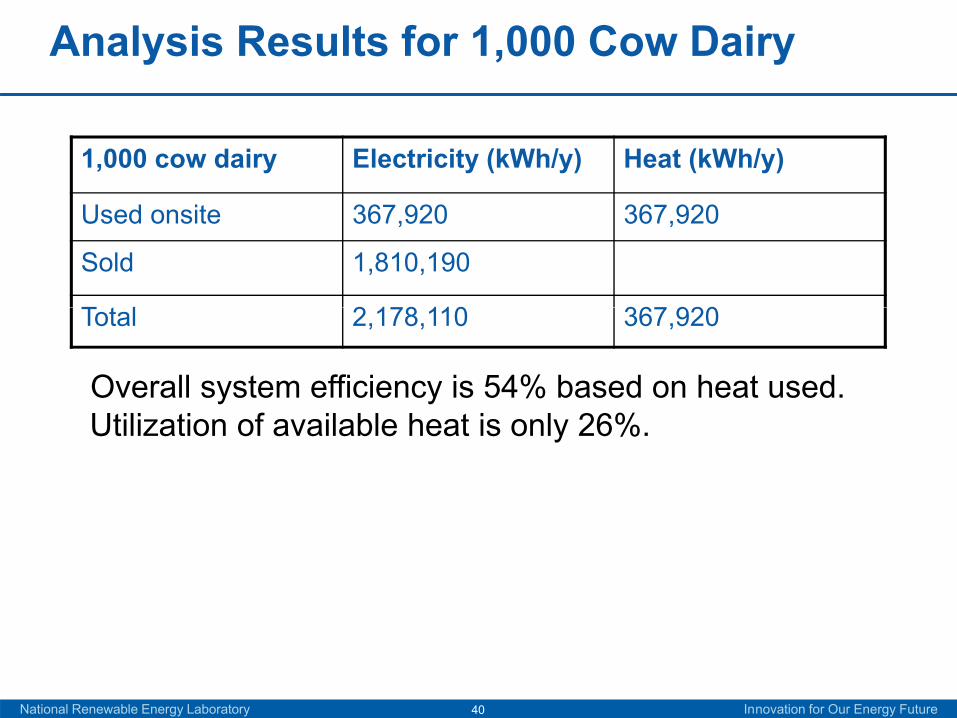
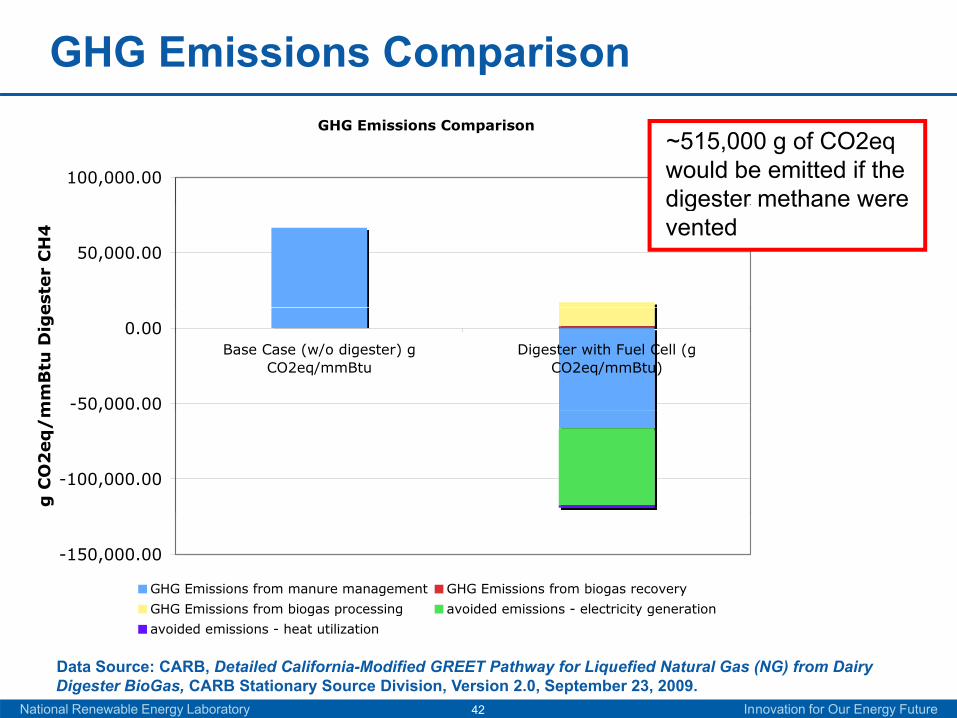
GHG Emissions Comparison
GHG Emissions Comparison
10000000
~515000 g of CO2eq would be emitted if the digester methane were
5000000
est
er
CH
4
digester methane were vented
-5000000
000 Base Case (wo digester) g
CO2eqmmBtu Digester with Fuel Cell (g
CO2eqmmBtu)
mm
Btu
Dig
e
-10000000
g C
O2
eq
m
-15000000
GHG Emissions from manure management GHG Emissions from biogas recovery
GHG Emissions from bioggas processingg avoided emissions - electricity generation p y g
avoided emissions - heat utilization
Data Source CARB Detailed California-Modified GREET Pathway for Liquefied Natural Gas (NG) from Dairy Digester BioGas CARB Stationary Source Division Version 20 September 23 2009
National Renewable Energy Laboratory Innovation for Our Energy Future 42
Thank You Contact InformationContact Information Darlenestewardnrelgov Michaelpenevnrelgov
National Renewable Energy Laboratory Innovation for Our Energy Future 43
- Fuel Cell Power Model for CHP and CHHPEconomics and Performance Analysis
- Outline
- Fuel Cell Basics
- Fuel Cell General Types
- MCFC Basics
- MCFC System Configuration
- Fuel Cell Power Model Introduction
- FCpower Model
- Overview of Combined Heat amp PowerConcept
- Dispatch Sequence for Electricity Generation
- Technology Selection for Hourly Energy Analysis
- Dispatch Sequence for Electricity Generation
- Integration of Demand Profiles Renewables Availability ampGrid Cost Structure
- FCPower Model Hourly Energy Analysis Module
- Biogas Case Study
- System Being Considered
- Methane Sources in the Sacramento Area
- Quick Start ndash 4 steps
- Economic Evaluation of a Fuel Cell at a Dairy
- Information Needed
- Energy amp Material Values
- Cost Values
- Step 1
- Step 2 Selecting Hardware
- Step 3 Entering Detailed Specifications
- Step 3A Entering Specifications
- Step 3B Input Electric and Heat Demands benchmark_large_
- Step 3C Economic criteria specification
- Step 3D Capital Costs
- Step 3E Remove Hydrogen Co-production
- Step 3F Fuel Cell Capacity
- Step 3G Inputting System Costs
- Step 3H Input Indirect Capital Costs
- Step 3I Incentives Specification
- Step 3J Specifying Fixed Operating Costs
- Step 3K Feedstock Cost Specification
- Step 3L Verify Other Variable Operating Costs
- Step 4 Running and Results
- Reviewing Results
- Analysis Results for 1000 Cow Dairy
- Analysis Results for 1000 Cow Dairy
- GHG Emissions Comparison
- Thank You
-


