Fuel reactivity controlled compression ignition (RCCI):a pathway to controlled high-efficiency cleancombustionS L Kokjohn*, R M Hanson, D A Splitter, and R D Reitz
Department of Mechanical Engineering, The University of Wisconsin–Madison, Madison, Wisconsin, USA
The manuscript was received on 25 August 2010 and was accepted after revision for publication on 15 November 2010.
DOI: 10.1177/1468087411401548
Abstract: A fuel reactivity controlled compression ignition (RCCI) concept is demonstrated asa promising method to achieve high efficiency – clean combustion. Engine experiments wereperformed in a heavy-duty test engine over a range of loads. Additionally, RCCI engine experi-ments were compared to conventional diesel engine experiments. Detailed computational fluiddynamics modelling was then used to explain the experimentally observed trends. Specifically,it was found that RCCI combustion is capable of operating over a wide range of engine loadswith near zero levels of NOx and soot, acceptable pressure rise rate and ringing intensity, andvery high indicated efficiency. For example, a peak gross indicated efficiency of 56 per cent wasobserved at 9.3 bar indicated mean effective pressure and 1300 rev/min. The comparisonbetween RCCI and conventional diesel showed a reduction in NOx by three orders of magni-tude, a reduction in soot by a factor of six, and an increase in gross indicated efficiency of 16.4per cent (i.e. 7.9 per cent more of the fuel energy was converted to useful work). The simulationresults showed that the improvement in fuel conversion efficiency was due both to reductionsin heat transfer losses and improved control over the start- and end-of-combustion.
Keywords: engine performance, fuel efficiency, thermal efficiency, HCCI, PCCI, combustion,
pollutant emissions reduction
1 INTRODUCTION
Rising fuel costs and a focus on reduction of green-
house gases has driven the need for increased effi-
ciency from the internal combustion engine. This
need for increased efficiency has placed the diesel
or CI engine (note that all acronyms are defined in
the Appendix) in the spotlight due to its superior
fuel efficiency compared to SI engines. However,
under conventional diesel operation, regions of the
combustion chamber pass through both rich and
lean high-temperature regions, forming soot and
NOx, respectively. Soot can be effectively reduced
through the use of a DPF; however, DPFs require
periodic regeneration (i.e. removal of collected
soot), which often increases fuel consumption.
Additionally, since diesel engines generally operate
lean of stoichiometric, UHC and CO are generally
not available to reduce NOx to nitrogen using
a TWC. Several attempts have been made to operate
CI engines stoichiometric such that a TWC can be
used for NOx reduction [1]; however, these efforts
generally resulted in poor fuel economy; thus
removing the CI engine’s advantages over the SI
engine. In addition to stoichiometric-TWC NOx
reduction, forms of NOx after-treatment compatible
with lean operation exist (i.e. LNT and SCR). An
LNT is essentially a TWC reformulated to enhance
storage of NOx during lean operation [2]. As such,
LNTs provide NOx reduction in a very similar
manner as a conventional TWC; that is, NOx is
reduced to N2 through reactions with products of
*Corresponding author: Department of Mechanical Engineering,
The University of Wisconsin–Madison, 1011 Engineering
Research Building 1500 Engineering Dr. Madison, WI 53711
USA
email: [email protected]
SPECIAL ISSUE PAPER 209
Int. J. Engine Res. Vol. 12

rich combustion (CO, HC, and H2) [2]. An engine
relying on an LNT for NOx reduction must periodi-
cally operate rich to reduce the stored NOx; thus,
fuel efficiency is reduced. In contrast to LNT tech-
nology, SCR technology can be used for NOx reduc-
tion without the need to operate rich; thus the fuel
economy benefits of the lean-burn CI engine are
retained. However, similar to the required periodic
rich operation of LNT technology, SCR technology
requires the introduction of a reducing agent (urea).
The urea is stored on the vehicle and is injected
into the exhaust system, providing no useful work;
thus the consumed urea used for NOx reduction
can be considered additional ‘fuel’ consumption.
Considering the presented discussion it is clear
that to maximize overall engine efficiency, an
engine should minimize the need for after-treat-
ment-type emissions reduction. Accordingly, reduc-
tion of NOx and soot in-cylinder has been
investigated by many researchers. Most of the cur-
rent strategies can be lumped into the category of
premixed LTC. Lower combustion temperatures
result in NOx reduction due to the high activation
energy of NO formation reactions [3]. In addition,
utilizing long ignition delay times allows adequate
time for mixing prior to the start of combustion;
thus, rich regions are reduced and soot formation is
inhibited. Many researchers have shown that HCCI
and PCCI concepts are promising techniques for
simultaneous NOx and soot reduction [4–10]. In
addition to significant NOx and soot reductions,
premixed LTC operation can provide fuel efficiency
advantages due to reduced combustion duration
and lower HT losses. In the past HCCI and PCCI
combustion generally suffered from high levels of
CO and UHC emissions; however, in recent years
several researchers have demonstrated boosted
HCCI and PCCI combustion featuring nearly 100
per cent combustion efficiency [7, 11, 12]. These
improvements came through the use of piston
designs featuring minimum crevice volumes as well
as highly boosted operation.
Due to the existing fuel infrastructure, most
HCCI and PCCI research has been conducted using
either strictly gasoline or diesel fuel. However, in
their neat forms, each fuel has specific advantages
and shortcomings for PCI operation. Gasoline has
a high volatility; thus, evaporation is rapid and
a premixed charge can be obtained using PFI.
Furthermore, Kalghatgi [13] and Kalghatgi et al.
[14, 15] have shown promising emissions and per-
formance results using a gasoline partially PCI
strategy. In their work, gasoline’s resistance to auto-
ignition (i.e. low cetane number) was exploited to
extend the pre-combustion mixing time in order to
achieve simultaneous reductions in NOx and soot
emissions. However, other researchers (e.g. [16, 17])
have shown that the poor auto-ignition qualities of
gasoline can make it difficult to achieve combustion
at low-load conditions. Conversely, diesel fuel has
superior auto-ignition qualities; however, this can
result in difficulty controlling the combustion phas-
ing as engine load is increased. Therefore, when
neat diesel fuel is used in a PCI strategy, high levels
of EGR are required to phase combustion appropri-
ately [10].
Experiments performed by Bessonette et al. [18]
have suggested that the best fuel for HCCI opera-
tion may have auto-ignition qualities between that
of diesel fuel and gasoline. Using a compression
ratio of 12:1 and a fuel with a derived cetane
number of ~27 (i.e. a gasoline boiling range fuel
with an octane number of 80.7), they were able to
extend the HCCI operating range to 16 bar BMEP –
a 60 per cent increase in the maximum achievable
load compared to operation using traditional diesel
fuel. Furthermore, their results showed that low-
load operation, below 2 bar BMEP, required
a derived cetane number of ~45 (i.e. traditional
diesel fuel). Thus, it may be beneficial to explore
HCCI operation using fuel blends optimized for
specific operating conditions.
Inagaki et al. [19] investigated dual-fuel PCI opera-
tion as a means for reducing the EGR requirements of
PCI strategies. Using premixed iso-octane and direct
injected diesel fuel, they were able to operate in PCI
mode at 12 bar IMEP. Furthermore, they showed that
stratification of fuel reactivity (rather than only equiv-
alence ratio) resulted in reduced rates of heat release
and reasonable combustion noise.
Based on the work of Bessonette et al. [18] and
Inagaki et al. [19], it is likely that different fuel blends
will be required at different operating conditions (e.g.
a high cetane fuel at light load and a low cetane fuel
at high load). Thus, it is desirable to have the capabil-
ity to operate with fuel blends covering the spectrum
from neat gasoline to neat diesel fuel depending on
the operating regime. This work proposes PFI of gaso-
line and early cycle DI of diesel fuel.
HCCI combustion is a kinetically controlled pro-
cess; therefore, the combustion phasing is very sen-
sitive to charge gas temperature. In the laboratory,
where intake temperature and EGR can be precisely
controlled, single-fuel HCCI combustion can dem-
onstrate very promising results. However, in prac-
tice the charge gas temperature of practical engines
depends on many factors and varies with speed,
load, and operating environment. To understand
the motivation for investigating in-cylinder fuel
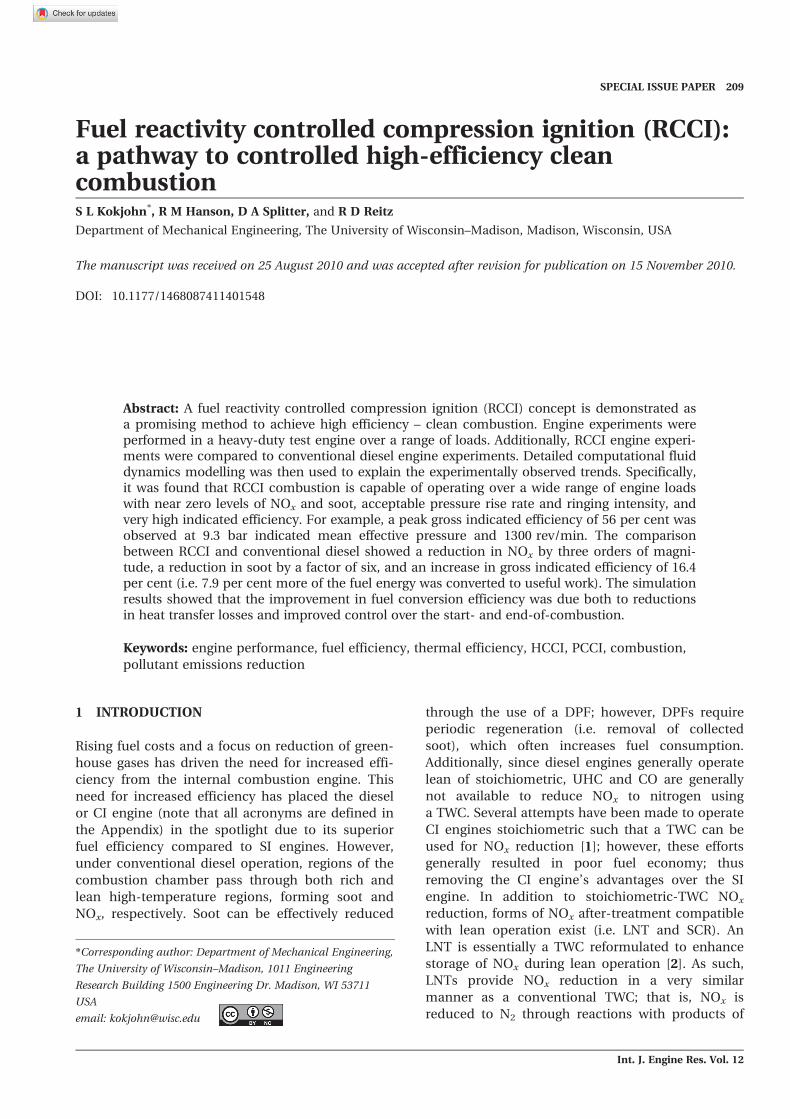
blending, Fig. 1 shows constant-volume ignition
210 S L Kokjohn, R M Hanson, D A Splitter, and R D Reitz
Int. J. Engine Res. Vol. 12
delay calculations using a PRF mechanism devel-
oped by Ra and Reitz [20] for neat iso-octane, neat
n-heptane, and a 50-50 blend of iso-octane and n-
heptane. For optimum thermal efficiency, the
combustion phasing must be precisely controlled
and to maintain high efficiency an engine must be
able to accommodate changes in the operating
conditions (e.g. charge temperature) while main-
taining the optimum combustion phasing. Figure 1
shows that, since each fuel has a unique ignition
delay–temperature curve, each fuel will be limited
to a narrow operating range where peak efficiency
can be achieved. For example, if a representative
temperature of 750 K is selected and the ignition
delay that is required to achieve the optimum
combustion phasing is ~40� CA, neat diesel fuel
would provide the optimum fuel reactivity to
achieve peak efficiency. However, if the operating
conditions changed such that the representative
temperature increased to 800 K, neat diesel fuel
would result in overly advanced combustion phas-
ing, increased HT losses, and reduced thermal effi-
ciency. However, by using in-cylinder fuel
blending, peak efficiency could be maintained by
moving from neat diesel fuel to a 50-50 blend of
diesel and gasoline.
2 EXPERIMENTAL SETUP
A single cylinder, HD diesel engine based on
a Caterpillar 3401 SCOTE was used for all engine
experiments in this study. The engine specifications
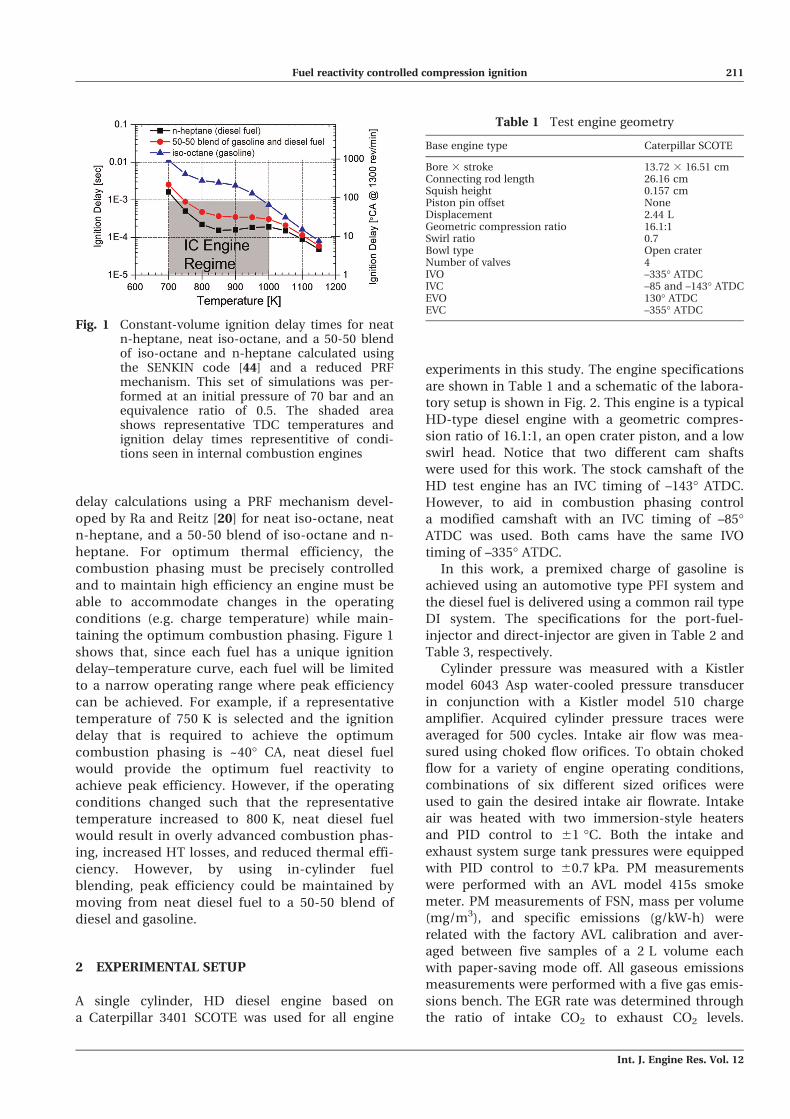
are shown in Table 1 and a schematic of the labora-
tory setup is shown in Fig. 2. This engine is a typical
HD-type diesel engine with a geometric compres-
sion ratio of 16.1:1, an open crater piston, and a low
swirl head. Notice that two different cam shafts
were used for this work. The stock camshaft of the
HD test engine has an IVC timing of –143� ATDC.
However, to aid in combustion phasing control
a modified camshaft with an IVC timing of –85�ATDC was used. Both cams have the same IVO
timing of –335� ATDC.
In this work, a premixed charge of gasoline is
achieved using an automotive type PFI system and
the diesel fuel is delivered using a common rail type
DI system. The specifications for the port-fuel-
injector and direct-injector are given in Table 2 and
Table 3, respectively.
Cylinder pressure was measured with a Kistler
model 6043 Asp water-cooled pressure transducer
in conjunction with a Kistler model 510 charge
amplifier. Acquired cylinder pressure traces were
averaged for 500 cycles. Intake air flow was mea-
sured using choked flow orifices. To obtain choked
flow for a variety of engine operating conditions,
combinations of six different sized orifices were
used to gain the desired intake air flowrate. Intake
air was heated with two immersion-style heaters
and PID control to 61 �C. Both the intake and
exhaust system surge tank pressures were equipped
with PID control to 60.7 kPa. PM measurements
were performed with an AVL model 415s smoke
meter. PM measurements of FSN, mass per volume
(mg/m3), and specific emissions (g/kW-h) were
related with the factory AVL calibration and aver-
aged between five samples of a 2 L volume each
with paper-saving mode off. All gaseous emissions
measurements were performed with a five gas emis-
sions bench. The EGR rate was determined through
the ratio of intake CO2 to exhaust CO2 levels.
Fig. 1 Constant-volume ignition delay times for neatn-heptane, neat iso-octane, and a 50-50 blendof iso-octane and n-heptane calculated usingthe SENKIN code [44] and a reduced PRFmechanism. This set of simulations was per-formed at an initial pressure of 70 bar and anequivalence ratio of 0.5. The shaded areashows representative TDC temperatures andignition delay times representitive of condi-tions seen in internal combustion engines
Table 1 Test engine geometry
Base engine type Caterpillar SCOTE
Bore 3 stroke 13.72 3 16.51 cmConnecting rod length 26.16 cmSquish height 0.157 cmPiston pin offset NoneDisplacement 2.44 LGeometric compression ratio 16.1:1Swirl ratio 0.7Bowl type Open craterNumber of valves 4IVO –335� ATDCIVC –85 and –143� ATDCEVO 130� ATDCEVC –355� ATDC
Fuel reactivity controlled compression ignition 211
Int. J. Engine Res. Vol. 12
Gaseous emissions were averaged for 30 s after
attaining steady state operation.
The EGR system consists of an electrically driven
supercharger and a diesel particulate filter to pre-
vent fouling of the EGR cooler and supercharger.
The EGR supercharger was implemented as a pump
to maintain constant EGR levels with constant
surge tank pressures as the DPF fills.
Commercially available 91.6 antiknock index
((R + M)/2) gasoline and ultra-low sulfur diesel fuel
with a cetane number of 46 was used for all tests.
Table 4 and Table 5 show an independent lab anal-
ysis of the fuel properties.
3 COMPUTATIONAL MODEL
Computations were performed using the KIVA-3v
release 2 coding [21] with improvements to many
physical and chemistry models developed at the
ERC [22–25]. The KIVA-3v code is coupled with the
CHEMKIN II solver for detailed chemistry calcula-
tions. In this study the chemistry of gasoline and
diesel fuel are represented by that of iso-octane and
n-heptane, respectively. A reduced reaction mecha-
nism made up of 45 species and 142 reactions [20]
describes the combined oxidation of n-heptane and
iso-octane. Note that many studies (e.g. Ra and
Reitz [26]) have shown that the combustion charac-
teristics of gasoline and diesel are closely repre-
sented by iso-octane (i.e. PRF 100) and n-heptane
(i.e. PRF 0), respectively. This approach has also
been shown to yield acceptable agreement for
blends of gasoline and diesel fuel (e.g. Kokjohn
et al. [6], Hanson et al. [27], and Splitter et al. [28]).
Fig. 2 Diagram of the engine laboratory setup. The premixed fuel is delivered through the PFI ofTable 2 and the direct-injected fuel is delivered through a common rail fuel injected asspecified in Table 3.
Table 2 Port fuel injector specifications
Steady flow rate at 3 bar 12.5 cc/sIncluded spray angle 15�Fuel pressure 5.17 bar
212 S L Kokjohn, R M Hanson, D A Splitter, and R D Reitz
Int. J. Engine Res. Vol. 12
The physical properties (for spray and mixing pro-
cesses) of diesel fuel are represented by tetrade-
cane. Of course, the multi-component vaporization
of the diesel fuel used in the experiments is not
captured by this approach (i.e. the distillation curve
of diesel fuel is not reproduced). It is possible that
the differences between single- and multi-
component vaporization result in differences in the
fuel distribution prior to and during combustion.
PCCI combustion has been shown to be very sensi-
tive to the mixture preparation details (e.g. Opat
et al. [10]); therefore, the simplified vaporization
model should be borne in mind when accessing the
observed differences between the simulations and
experiments. However, this approach has been used
in numerous studies and has been shown to yield
acceptable results. For example, Shuai et al. [29]
compared model predicted fuel distributions to fuel
distributions acquired using planar laser-induced
fluorescence in an optically accessible engine oper-
ating in a low-temperature combustion mode. They
showed that, under low-temperature combustion
conditions, the spray models used in the current
study accurately reproduced the measured fuel
distribution.
Soot is predicted using a phenomenological soot
model [25] based on the approach of Hiroyasu and
Kadota [30]. The soot model used in the present
study uses acetylene as an inception species, which
allows the soot model to be coupled to the chemis-
try solver through the addition of 13 reactions
involving acetylene. NOx emissions are predicted
using a reduced NO mechanism [31] consisting of
four additional species and 12 reactions.
The spray model employed in this study uses the
LDEF approach. In order to reduce the grid size
dependency of the LDEF spray model and allow
accurate spray simulation on a relatively coarse
grid, the Gasjet model of Abani et al. [23] is used to
model the relative velocity between the droplets
and gas phase in the near nozzle region. Their
approach assumes that the relative velocity between
a droplet and the gas phase is equal to that between
the droplet and a turbulent gas-jet with the same
mass and momentum of that of the injected fuel.
Droplet breakup is modelled using the hybrid
KH – RT model described by Beale and Reitz [22].
The droplet collision model is based on O’Rourke’s
model; however, a radius of influence method is
used to determine the possible collision partners to
further reduce mesh dependency [32]. In addition,
the collision model was expanded by Munnannur
[32] to include a more comprehensive range of col-
lision outcomes. The current implementation of the
droplet collision model considers the effects of
bounce, coalescence, and fragmenting and non-
fragmenting separations. Droplet interactions with
the wall are considered through a wall film submo-
del [33, 34], which includes the effects associated
with splash, film spreading, and motion due to
inertia.
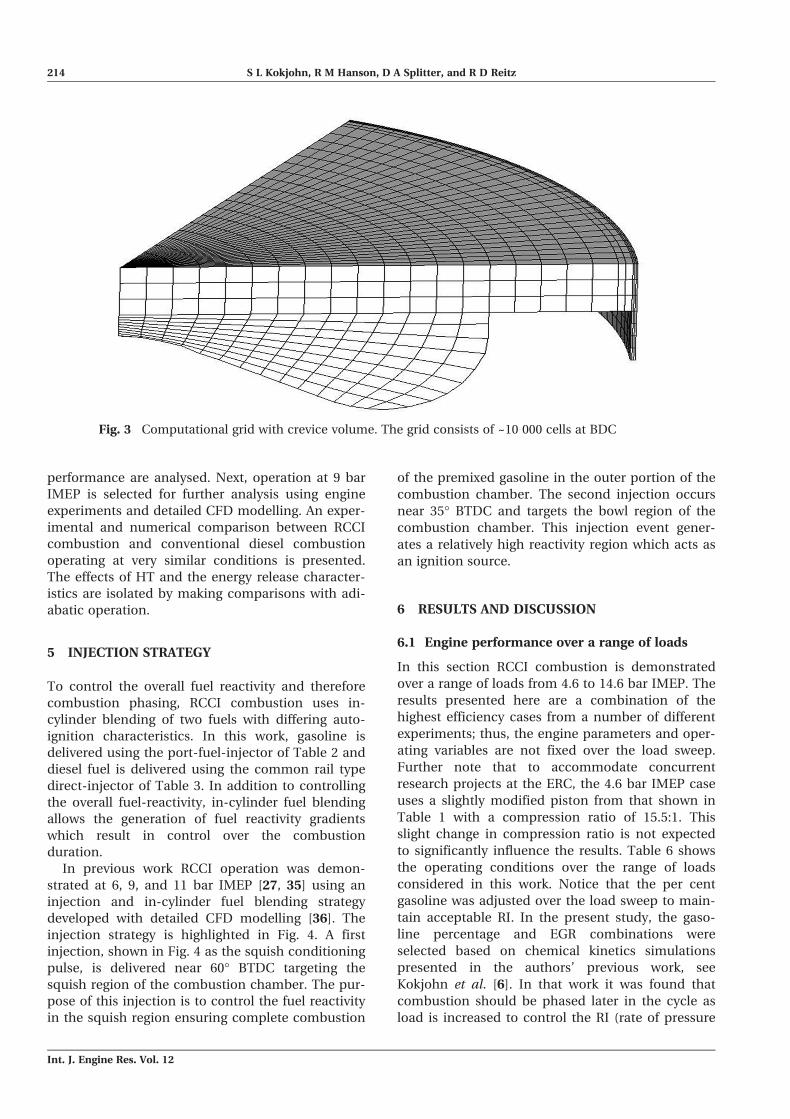
Simulations were performed using the three-
dimensional computational grid shown in Fig. 3. To
reduce the computational burden, a 60� sector
mesh (corresponding to a single nozzle hole of the
six hole injector of this study) with periodic bound-
aries was used. Notice that the region above the top
piston ring is resolved in this study; however, ring
motion and flow past the compression rings are not
included.
4 SCOPE AND OBJECTIVES
In the authors’ previous studies [6, 27, 28, 35] RCCI
combustion was explored through parametric stud-
ies at a fixed load. In this work, RCCI combustion is
investigated over a range of engine loads from 4.6
to 14.6 bar gross IMEP. First, the experimental
results are presented and emissions and
Table 4 Gasoline fuel properties
Distillation curve method ASTM D86
Initial boiling point 38.9 �CTemperature 10 per cent evaporated 69.4 �CTemperature 50 per cent evaporated 105.0 �CTemperature 90 per cent evaporated 160.6 �CFinal boiling point 215.6 �CLHV 43.2 MJ/kgMON 87.8RON 95.6(R + M)/2 91.6Ethanol 0%H/C ratio 1.88Density 756 kg/m3
Table 5 Diesel fuel properties
Viscosity (at 40 �C) 2.71 cStSurface tension (at 25 �C) 30.0 dyne/cmLHV 42.5 MJ/kgCetane number 46.1H/C ratio 1.74Density 856 kg/m3
Table 3 Common rail injector specifications
Number of holes 6Steady flow rate at 100 bar 33.3 cc/sHole diameter 250 mmIncluded spray angle 145�Injection pressure 400 to 800 bar
Fuel reactivity controlled compression ignition 213
Int. J. Engine Res. Vol. 12
performance are analysed. Next, operation at 9 bar
IMEP is selected for further analysis using engine
experiments and detailed CFD modelling. An exper-
imental and numerical comparison between RCCI
combustion and conventional diesel combustion
operating at very similar conditions is presented.
The effects of HT and the energy release character-
istics are isolated by making comparisons with adi-
abatic operation.
5 INJECTION STRATEGY
To control the overall fuel reactivity and therefore
combustion phasing, RCCI combustion uses in-
cylinder blending of two fuels with differing auto-
ignition characteristics. In this work, gasoline is
delivered using the port-fuel-injector of Table 2 and
diesel fuel is delivered using the common rail type
direct-injector of Table 3. In addition to controlling
the overall fuel-reactivity, in-cylinder fuel blending
allows the generation of fuel reactivity gradients
which result in control over the combustion
duration.
In previous work RCCI operation was demon-
strated at 6, 9, and 11 bar IMEP [27, 35] using an
injection and in-cylinder fuel blending strategy
developed with detailed CFD modelling [36]. The
injection strategy is highlighted in Fig. 4. A first
injection, shown in Fig. 4 as the squish conditioning
pulse, is delivered near 60� BTDC targeting the
squish region of the combustion chamber. The pur-
pose of this injection is to control the fuel reactivity
in the squish region ensuring complete combustion
of the premixed gasoline in the outer portion of the
combustion chamber. The second injection occurs
near 35� BTDC and targets the bowl region of the
combustion chamber. This injection event gener-
ates a relatively high reactivity region which acts as
an ignition source.
6 RESULTS AND DISCUSSION
6.1 Engine performance over a range of loads
In this section RCCI combustion is demonstrated
over a range of loads from 4.6 to 14.6 bar IMEP. The
results presented here are a combination of the
highest efficiency cases from a number of different
experiments; thus, the engine parameters and oper-
ating variables are not fixed over the load sweep.
Further note that to accommodate concurrent
research projects at the ERC, the 4.6 bar IMEP case
uses a slightly modified piston from that shown in
Table 1 with a compression ratio of 15.5:1. This
slight change in compression ratio is not expected
to significantly influence the results. Table 6 shows
the operating conditions over the range of loads
considered in this work. Notice that the per cent
gasoline was adjusted over the load sweep to main-
tain acceptable RI. In the present study, the gaso-
line percentage and EGR combinations were
selected based on chemical kinetics simulations
presented in the authors’ previous work, see
Kokjohn et al. [6]. In that work it was found that
combustion should be phased later in the cycle as
load is increased to control the RI (rate of pressure
Fig. 3 Computational grid with crevice volume. The grid consists of ~10 000 cells at BDC
214 S L Kokjohn, R M Hanson, D A Splitter, and R D Reitz
Int. J. Engine Res. Vol. 12

rise). However, it should be noted that the results
presented here have not been rigorously optimized
and it is expected that different combinations of
injection parameters, EGR levels, and gasoline per-
centages may yield similar results.
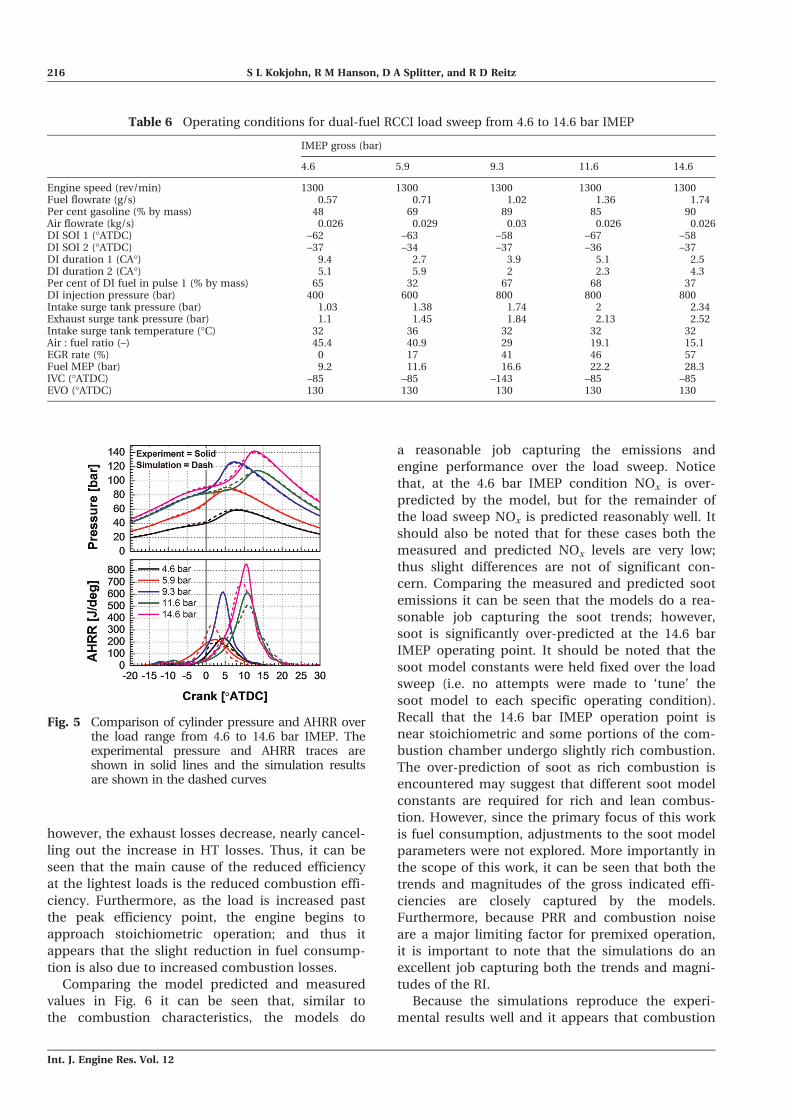
Figure 5 shows the measured and predicted cyl-
inder pressures and AHRR over the load sweep. It
can be seen that the simulations are able to accu-
rately capture the combustion characteristics over
the range of loads considered in this work. Figure 6
shows the measured and predicted emissions and
performance over the range of loads. In Fig. 6 NOx
and soot are shown on a gross indicated basis. The
gross indicated efficiency is defined as the (gross-
indicated-work)/(fuel energy). Because the engine
operates under boosted condition for all but the
lightest load, the PRR is not representative of knock
[11]; therefore, the RI correlation of Eng [37] is used
RI =1
2g
dP=dtð Þmax
� �
Pmax
ffiffiffiffiffiffiffiffiffiffiffiffiffiffiffiffigRTmax
p(1)
where g is the ratio of specific heats, (dP/dt)max is
the peak PRR, Pmax is the peak pressure, R is the
ideal gas constant, and Tmax is the peak tempera-
ture. In a similar engine, Dec and Yang [11] stated
that RIs below 5 MW/m2 resulted in acceptable
combustion noise and knock-free operation; thus,
in this work 5 MW/m2 is used as an upper limit for
acceptable combustion noise. Also shown in Fig. 6
are the US 2010 EPA HD on-highway truck limits
for NOx and soot emissions (i.e. 0.268 g/kW-h and
0.0134 g/kW-h for NOx and soot, respectively).
Notice that the measured NOx is near zero and
significantly below the 2010 EPA HD limits.
Furthermore, it can be seen that soot is extremely
low and below the 2010 EPA HD limits for all but
the 6 bar IMEP point, which is very near the limit. It
is possible that slight modifications to the operating
parameters could be explored that would result in
passing soot over the load sweep; however, since
fuel efficiency is the focus of this study, methods
for further soot reduction were not investigated.
Even with the current soot levels, it can be seen
that dual-fuel RCCI combustion is a promising
technique to meet the stringent emissions regula-
tions without the need for NOx after-treatment and
since soot is extremely low, if a DPF were required,
the time between regenerations could be signifi-
cantly extended compared to higher sooting
operation.
Of more interest for this study are the fuel effi-
ciencies and RIs. It can be seen that the gross indi-
cated efficiency is ~49 per cent at the low-load
condition, peaks at ~56 per cent at 9.3 bar IMEP,
and levels out near 52 per cent for the higher loads.
It should be noted that the most optimization has
been conducted at the 9.3 bar IMEP operating
point, which is likely the primary reason for the
peak in the fuel efficiency at this point. However, it
is still informative to investigate the fuel efficiency
trends over the load sweep. Figure 7 shows the
energy balances for each case. As previously stated,
the gross indicated efficiency is calculated as the
(gross work)/(fuel energy). The combustion losses
are calculated as
hcomb:loss
=_mcoLHVco + _mUHCLHVfuel
_mfuelLHVfuel(2)
where _mco and _mUHC are the measured exhaust
mass flowrates of CO and UHC, respectively, and_mfuel is the mass flowrate of the fuel. LHVCO and
LHVfuel are the LHVs of the CO and fuel, respec-
tively. Here it is assumed that the UHCs have the
same heating value as the fuel. The exhaust energy
is calculated from the measured exhaust tempera-
ture as
hexhaust =_mexh hexh Texhð Þ � hint Tintð Þ½ �
_mfuelLHVfuel(3)
where _mexh is the mass flowrate of the exhaust, hexh
and hint are the exhaust and intake enthalpies eval-
uated using the NASA database [38] assuming the
exhaust contains only O2, N2, CO2, H2O, CO, UHC,
and NO. Note that since all species except UHC
were measured on a dry basis; thus, the water con-
centration in the exhaust stream was obtained
using atom balancing. The heat loss contains the
contributions of losses to the coolant, oil, and ambi-
ent and was obtained using an energy balance with
the EGR loop located outside of the control volume;
thus, the exhaust energy contribution contains heat
rejected in the EGR heat exchanger.
Starting with the peak efficiency point (i.e. 9.3
bar IMEP), it can be seen that as the load is
decreased, the HT and combustion losses increase;
Fig. 4 Injection strategy used for split injection dual-fuel RCCI combustion
Fuel reactivity controlled compression ignition 215
Int. J. Engine Res. Vol. 12
however, the exhaust losses decrease, nearly cancel-
ling out the increase in HT losses. Thus, it can be
seen that the main cause of the reduced efficiency
at the lightest loads is the reduced combustion effi-
ciency. Furthermore, as the load is increased past
the peak efficiency point, the engine begins to
approach stoichiometric operation; and thus it
appears that the slight reduction in fuel consump-
tion is also due to increased combustion losses.
Comparing the model predicted and measured
values in Fig. 6 it can be seen that, similar to
the combustion characteristics, the models do
a reasonable job capturing the emissions and
engine performance over the load sweep. Notice
that, at the 4.6 bar IMEP condition NOx is over-
predicted by the model, but for the remainder of
the load sweep NOx is predicted reasonably well. It
should also be noted that for these cases both the
measured and predicted NOx levels are very low;
thus slight differences are not of significant con-
cern. Comparing the measured and predicted soot
emissions it can be seen that the models do a rea-
sonable job capturing the soot trends; however,
soot is significantly over-predicted at the 14.6 bar
IMEP operating point. It should be noted that the
soot model constants were held fixed over the load
sweep (i.e. no attempts were made to ‘tune’ the
soot model to each specific operating condition).
Recall that the 14.6 bar IMEP operation point is
near stoichiometric and some portions of the com-
bustion chamber undergo slightly rich combustion.
The over-prediction of soot as rich combustion is
encountered may suggest that different soot model
constants are required for rich and lean combus-
tion. However, since the primary focus of this work
is fuel consumption, adjustments to the soot model
parameters were not explored. More importantly in
the scope of this work, it can be seen that both the
trends and magnitudes of the gross indicated effi-
ciencies are closely captured by the models.
Furthermore, because PRR and combustion noise
are a major limiting factor for premixed operation,
it is important to note that the simulations do an
excellent job capturing both the trends and magni-
tudes of the RI.
Because the simulations reproduce the experi-
mental results well and it appears that combustion
Table 6 Operating conditions for dual-fuel RCCI load sweep from 4.6 to 14.6 bar IMEP
IMEP gross (bar)
4.6 5.9 9.3 11.6 14.6
Engine speed (rev/min) 1300 1300 1300 1300 1300Fuel flowrate (g/s) 0.57 0.71 1.02 1.36 1.74Per cent gasoline (% by mass) 48 69 89 85 90Air flowrate (kg/s) 0.026 0.029 0.03 0.026 0.026DI SOI 1 (�ATDC) –62 –63 –58 –67 –58DI SOI 2 (�ATDC) –37 –34 –37 –36 –37DI duration 1 (CA�) 9.4 2.7 3.9 5.1 2.5DI duration 2 (CA�) 5.1 5.9 2 2.3 4.3Per cent of DI fuel in pulse 1 (% by mass) 65 32 67 68 37DI injection pressure (bar) 400 600 800 800 800Intake surge tank pressure (bar) 1.03 1.38 1.74 2 2.34Exhaust surge tank pressure (bar) 1.1 1.45 1.84 2.13 2.52Intake surge tank temperature (�C) 32 36 32 32 32Air : fuel ratio (–) 45.4 40.9 29 19.1 15.1EGR rate (%) 0 17 41 46 57Fuel MEP (bar) 9.2 11.6 16.6 22.2 28.3IVC (�ATDC) –85 –85 –143 –85 –85EVO (�ATDC) 130 130 130 130 130
Fig. 5 Comparison of cylinder pressure and AHRR overthe load range from 4.6 to 14.6 bar IMEP. Theexperimental pressure and AHRR traces areshown in solid lines and the simulation resultsare shown in the dashed curves
216 S L Kokjohn, R M Hanson, D A Splitter, and R D Reitz
Int. J. Engine Res. Vol. 12

efficiency dominates the gross indicated efficiency
trend, the simulations are used to understand the
combustion efficiency trends observed in Fig. 7.
Figure 8 shows iso-volumes of UHC and CO for the
4.6, 9.3, and 14.6 bar IMEP cases at a CA of 40�ATDC. It can be seen that at the light-load condi-
tion UHC is found in both the centreline and crev-
ice regions. For this case CO is primarily found in
the centreline region. The centreline UHC and CO
is due to an overly lean region which does not
release enough energy to completely oxidize the CO
and UHC. Moving to the 9.3 bar IMEP case it can
be seen that UHC is only located in the crevice
region and CO is only located in the region near the
cylinder liner. The UHC in the crevice region is pri-
marily unreacted iso-octane (gasoline) resulting
from the premixed charge. The CO in the near liner
region is due to relatively low temperatures due to
HT from the gas to the cylinder liner. Additionally,
as the crevice region outgasses late in the cycle,
some UHC is converted to CO; however, tempera-
tures fall rapidly and the CO in this region is not
oxidized to CO2. Finally, moving to the 14.6 bar
IMEP case it can be seen that, similar to the 9.3 bar
IMEP case, UHC is found only in the crevice region.
However, in this case it can be seen that CO is pres-
ent both in the near-liner region and the centreline.
Similar to the 9.3 bar IMEP case, the CO near the
liner is likely due to a combination of crevice out-
gassing and HT from the fluid resulting in low reac-
tion rates. In this case, the centreline CO is not the
result of overly lean regions, but rather locally rich
regions created by the DI event. Recall that for this
case operation occurs only slightly lean of stoichio-
metric (equivalence ratio of ~0.97), thus due to the
DI event, some regions of the combustion chamber
undergo rich combustion and insufficient oxygen is
available to completely oxidize the CO.
Considering Fig. 8 the trend in combustion effi-
ciency and gross indicated efficiency is clear. At the
lightest loads operation borders on the lean limit
for the premixed gasoline and complete oxidation
of UHC and CO is difficult. At higher engine loads,
as stoichiometric operation is approached, the DI
event must be carefully controlled to avoid rich
regions and incomplete combustion due to insuffi-
cient oxygen. Note that it is likely that at the highest
engine loads the UHC and CO emissions could be
reduced by increasing the boost pressure to elimi-
nate the regions undergoing rich combustion.
However, this has not been explored at this time.
Finally, the peak in gross indicated efficiency and
combustion efficiency at 9.3 bar IMEP is the result
of operation avoiding both the lean and rich oxida-
tion limits.
6.2 Comparison of conventional diesel and RCCI
combustion
Previous studies [27] have suggested that dual-fuel
RCCI shows increased gross indicated efficiency
compared to conventional diesel operation through
reduced HT losses and improved combustion phas-
ing and duration. However, in the previous works
direct comparisons were not made between con-
ventional diesel and RCCI operation. In this section
Fig. 6 Emissions and performance of dual-fuel RCCIover a range of loads from 4.6 to 14.6 barIMEP. The solid horizontal lines show the US2010 EPA on-highway truck emissions limitsfor NOx and soot
Fig. 7 Flow of fuel energy over the load sweep
Fuel reactivity controlled compression ignition 217
Int. J. Engine Res. Vol. 12

direct comparisons are made between conventional
diesel operation and RCCI operation at the 9 bar
IMEP operating point. The conventional diesel case
was taken from the experiments of Tess and Reitz
[39] where conventional diesel operation was inves-
tigated at nearly identical conditions to those of the
9.3 bar IMEP case discussed in the previous section.
Table 7 shows the operating conditions for the two
cases. Note that the conventional diesel case was
part of a size-scaling study [39] which required
operation at a slightly lower speed than the RCCI
cases investigated in this work. However, since the
speeds differ by less than 100 rev/min it is thought
that this will not influence the findings of this
study.
The RCCI case is the 9.3 bar IMEP operating
point from Table 6 operating using 89 per cent pre-
mixed gasoline and a split DI of diesel fuel. The first
DI pulse occurs at –58� ATDC and the second pulse
occurs at –37� ATDC. In this case 67 per cent of the
direct-injected diesel fuel is delivered in the first DI
pulse and the injection pressure is 800 bar. The
RCCI case uses 41 per cent EGR providing an intake
oxygen concentration of 15.8 per cent by volume.
The conventional diesel case features a single DI
occurring at –10� ATDC with an injection pressure
of 755 bar. The conventional diesel case operates
without EGR and for both cases the intake pressure
is near 1.7 bar. Figure 9 shows a comparison of the
measured and predicted cylinder pressure and
AHRR for conventional and RCCI combustion. First
of all, it can be seen that the models used in this
study are capable of capturing the combustion
characteristics over a wide range of operating
conditions from the low-temperature combustion
dual-fuel RCCI mode to the high-temperature,
mixing-controlled conventional diesel mode. Table
8 shows the comparison of the measured and
predicted emissions and performance for these
cases. Note that the exhaust temperature was not
measured in the conventional diesel experiments of
Tess and Reitz [39]; thus, the HT cannot be evalu-
ated from the experimental results. However, given
difficulties associated with accurately measuring the
exhaust temperature (e.g. accounting for radiation
from the thermocouple to the exhaust surge tank
walls [40]) the model-predicted HT values likely
provide more insight into the combustion process.
For the model predictions, the HT considers only
the closed portion of the cycle (i.e. from IVC to
EVO). This is likely a reasonable approximation
since a majority of the HT occurs during the energy
release period near TDC. Since the simulations only
consider the closed portion of the cycle, the tem-
perature at EVO is not representative of the exhaust
temperature; therefore, the exhaust energy is solved
for using an energy balance. These approximations
should be considered when comparing the relative
quantities of HT and exhaust energy to other data;
however, in this section the comparisons of the
energy balances will rely completely on the model
predictions and are therefore deemed acceptable.
Compared to conventional diesel combustion,
RCCI demonstrates three orders of magnitude lower
NOx, a factor of six lower soot levels, and 16.4 per
cent higher gross indicated efficiency (i.e. the RCCI
case converts 7.9 per cent more of the fuel energy
to useful work). However, RCCI combustion shows
increased PRR, RI, and combustion losses (i.e.
increased UHC and CO). However, it can be seen
that the RI is well below the value of 5 MW/m2
Table 7 Operating conditions for the comparison
between conventional diesel and RCCI
combustion
RCCI Conventionaldiesel
IMEP gross (bar) 9.3 9.9Engine speed (rev/min) 1300 1208Fuel flowrate (g/s) 1.02 1.19Per cent gasoline (% by mass) 89 0Air flowrate (kg/s) 0.03 0.042DI SOI 1 (�ATDC) –58 –10DI SOI 2 (�ATDC) –37 NADI duration 1 (CA�) 3.9 22DI duration 2 (CA�) 1.95 NAPer cent of DI fuel in pulse 1 (% by mass) 67 1DI injection pressure (bar) 800 755Intake surge tank pressure (bar) 1.74 1.72Exhaust surge tank pressure (bar) 1.84 1.83Intake surge tank temperature (�C) 32 36Air : fuel ratio (–) 29 36EGR rate (%) 41 0Fuel MEP (bar) 16.6 20.5IVC (�ATDC) –143 –143EVO (�ATDC) 130 130
Fig. 8 Iso-volumes showing regions with mass frac-tions of UHC (top) and CO (bottom) greaterthan 4000 ppm
218 S L Kokjohn, R M Hanson, D A Splitter, and R D Reitz
Int. J. Engine Res. Vol. 12

suggested as an upper limit by Dec and Yang. [11].
Additionally, model results show that, at this condi-
tion, nearly all of the UHC emissions result from
the relatively large ring-pack crevice volume.
Although beyond the scope of this work, it may be
possible to reduce UHC and CO emissions through
improvements in the ring-pack design.
Similar to the previous section, the simulation
results are used to gain insight into the experimen-
tally observed improvements of RCCI compared to
conventional diesel operation. The improvements
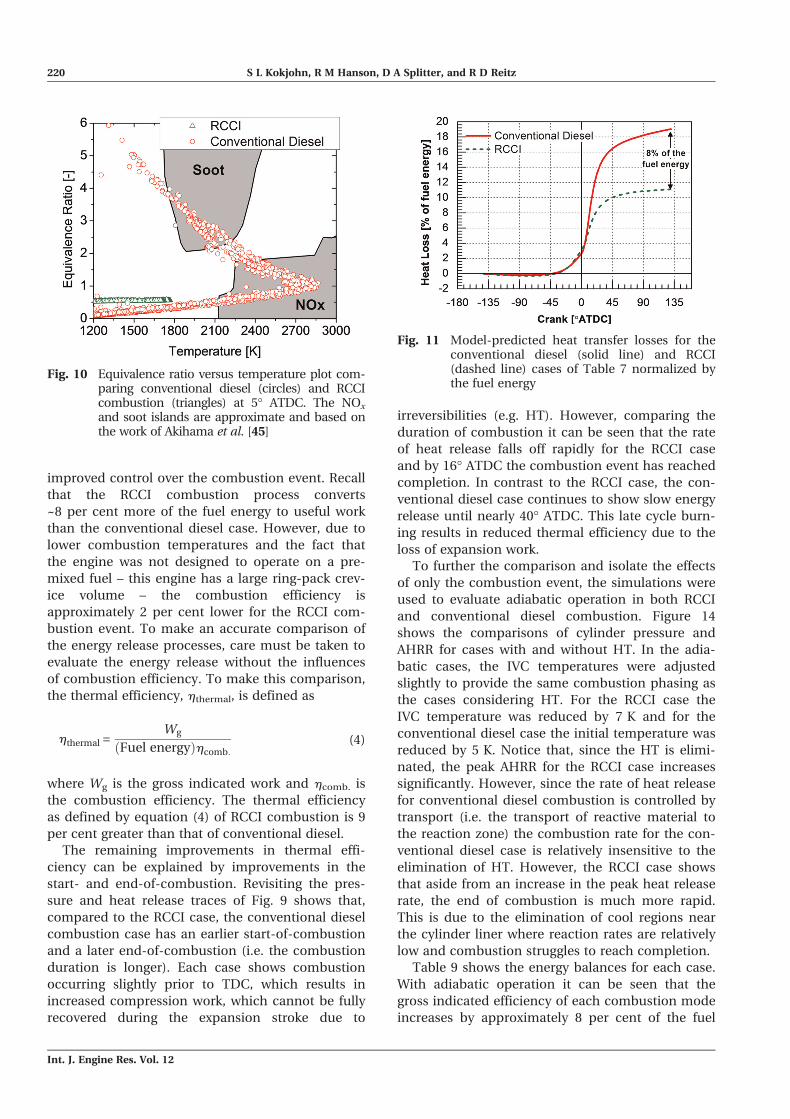
in NOx and soot are explained by plotting the simu-
lation results in temperature–equivalence ratio
space. Figure 10 shows the corresponding tempera-
ture and equivalence ratio for each computational
cell at 5� ATDC for the RCCI and conventional
diesel combustion cases. It can be seen that, as
expected, conventional diesel combustion has sig-
nificant locally rich regions as well as lean high-
temperature regions, which form soot and NOx,
respectively. The RCCI case shows that the peak
equivalence ratio is near 0.6 and due to the combi-
nation of relatively lean operation and reduced
intake oxygen concentration, the flame tempera-
tures remain below the NOx formation threshold.
To understand the improvement in gross indi-
cated efficiency, Fig. 11 shows the model-predicted
HT losses. It can be seen that the RCCI case has 43
per cent lower HT losses than the conventional
diesel case (i.e. 8.2 per cent less of the fuel energy is
lost to HT).
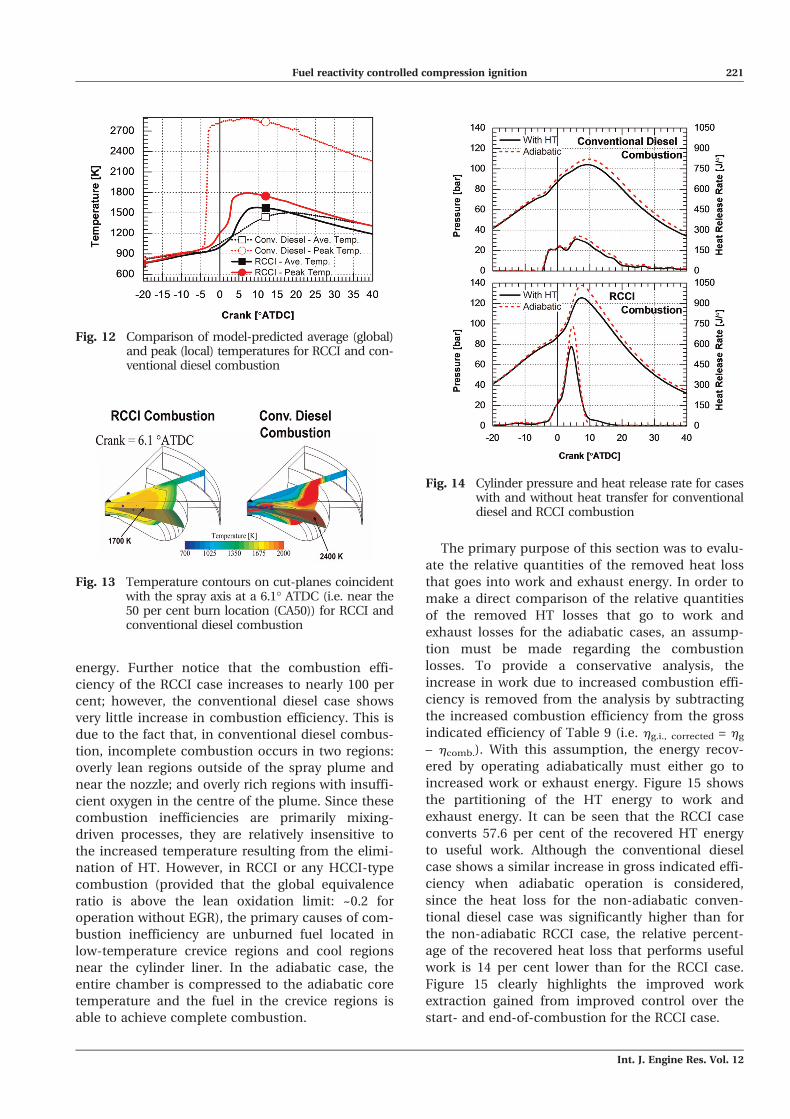
Figure 12 shows the model-predicted average
and peak temperatures for the RCCI and conven-
tional diesel combustion events. It can be seen that
the average temperatures are very similar; however,
the peak combustion temperature for the conven-
tional diesel case is near 2800 K; whereas the RCCI
case shows a peak temperature near 1700 K. It
should also be noted that the conventional diesel
case has slightly higher average temperatures due
to the slightly higher load operation as indicated in
Table 7. When the exhaust energies are compared,
it can be seen that the conventional diesel and
RCCI cases result in nearly identical energy levels
available to drive the turbocharger. Furthermore,
Fig. 13 shows contours of the temperature predicted
by the CFD modelling. It can be seen that not only
does conventional diesel combustion have regions
of the combustion chamber at significantly higher
temperatures than the RCCI case, but these regions
tend to be located on or near the piston bowl due
to the penetration of the fuel jet. These high-
temperature regions result in significantly increased
piston bowl HT and reduced thermal efficiency.
While a majority of the improvements of the
gross indicated efficiency can be attributed to
reductions in HT losses, the remaining improve-
ment in gross indicated efficiency is due to
Fig. 9 Measured and predicted cylinder pressure andAHRRs apparent heat release rates for conven-tional diesel and RCCI combustion at 9 barIMEP
Table 8 Emissions and performance of RCCI and conventional diesel combustion
RCCI Conventional diesel
Experiment Simulation Experiment Simulation
ISNOx (g/kW-h) 0.011 0.006 10 9.2ISsoot (g/kW-h) 0.012 0.019 0.076 0.133RI (MW/m2) 3.3 3.8 0.9 1Maximum PRR (bar/deg) 9.7 10.3 4.9 5.2Gross indicated efficiency (%) 56.1 54.3 48.2 47.6Combustion losses (%) 2.0 1.3 0.1 0.3HT (%) 11.4 10.9 NA 19.1Exhaust energy (%) 30.5 33.4 NA 33.0
Fuel reactivity controlled compression ignition 219
Int. J. Engine Res. Vol. 12
improved control over the combustion event. Recall
that the RCCI combustion process converts
~8 per cent more of the fuel energy to useful work
than the conventional diesel case. However, due to
lower combustion temperatures and the fact that
the engine was not designed to operate on a pre-
mixed fuel – this engine has a large ring-pack crev-
ice volume – the combustion efficiency is
approximately 2 per cent lower for the RCCI com-
bustion event. To make an accurate comparison of
the energy release processes, care must be taken to
evaluate the energy release without the influences
of combustion efficiency. To make this comparison,
the thermal efficiency, hthermal, is defined as
hthermal =Wg
Fuel energyð Þhcomb:(4)
where Wg is the gross indicated work and hcomb. is
the combustion efficiency. The thermal efficiency
as defined by equation (4) of RCCI combustion is 9
per cent greater than that of conventional diesel.
The remaining improvements in thermal effi-
ciency can be explained by improvements in the
start- and end-of-combustion. Revisiting the pres-
sure and heat release traces of Fig. 9 shows that,
compared to the RCCI case, the conventional diesel
combustion case has an earlier start-of-combustion
and a later end-of-combustion (i.e. the combustion
duration is longer). Each case shows combustion
occurring slightly prior to TDC, which results in
increased compression work, which cannot be fully
recovered during the expansion stroke due to
irreversibilities (e.g. HT). However, comparing the
duration of combustion it can be seen that the rate
of heat release falls off rapidly for the RCCI case
and by 16� ATDC the combustion event has reached
completion. In contrast to the RCCI case, the con-
ventional diesel case continues to show slow energy
release until nearly 40� ATDC. This late cycle burn-
ing results in reduced thermal efficiency due to the
loss of expansion work.
To further the comparison and isolate the effects
of only the combustion event, the simulations were
used to evaluate adiabatic operation in both RCCI
and conventional diesel combustion. Figure 14
shows the comparisons of cylinder pressure and
AHRR for cases with and without HT. In the adia-
batic cases, the IVC temperatures were adjusted
slightly to provide the same combustion phasing as
the cases considering HT. For the RCCI case the
IVC temperature was reduced by 7 K and for the
conventional diesel case the initial temperature was
reduced by 5 K. Notice that, since the HT is elimi-
nated, the peak AHRR for the RCCI case increases
significantly. However, since the rate of heat release
for conventional diesel combustion is controlled by
transport (i.e. the transport of reactive material to
the reaction zone) the combustion rate for the con-
ventional diesel case is relatively insensitive to the
elimination of HT. However, the RCCI case shows
that aside from an increase in the peak heat release
rate, the end of combustion is much more rapid.
This is due to the elimination of cool regions near
the cylinder liner where reaction rates are relatively
low and combustion struggles to reach completion.
Table 9 shows the energy balances for each case.
With adiabatic operation it can be seen that the
gross indicated efficiency of each combustion mode
increases by approximately 8 per cent of the fuel
Fig. 10 Equivalence ratio versus temperature plot com-paring conventional diesel (circles) and RCCIcombustion (triangles) at 5� ATDC. The NOx
and soot islands are approximate and based onthe work of Akihama et al. [45]
Fig. 11 Model-predicted heat transfer losses for theconventional diesel (solid line) and RCCI(dashed line) cases of Table 7 normalized bythe fuel energy
220 S L Kokjohn, R M Hanson, D A Splitter, and R D Reitz
Int. J. Engine Res. Vol. 12
energy. Further notice that the combustion effi-
ciency of the RCCI case increases to nearly 100 per
cent; however, the conventional diesel case shows
very little increase in combustion efficiency. This is
due to the fact that, in conventional diesel combus-
tion, incomplete combustion occurs in two regions:
overly lean regions outside of the spray plume and
near the nozzle; and overly rich regions with insuffi-
cient oxygen in the centre of the plume. Since these
combustion inefficiencies are primarily mixing-
driven processes, they are relatively insensitive to
the increased temperature resulting from the elimi-
nation of HT. However, in RCCI or any HCCI-type
combustion (provided that the global equivalence
ratio is above the lean oxidation limit: ~0.2 for
operation without EGR), the primary causes of com-
bustion inefficiency are unburned fuel located in
low-temperature crevice regions and cool regions
near the cylinder liner. In the adiabatic case, the
entire chamber is compressed to the adiabatic core
temperature and the fuel in the crevice regions is
able to achieve complete combustion.
The primary purpose of this section was to evalu-
ate the relative quantities of the removed heat loss
that goes into work and exhaust energy. In order to
make a direct comparison of the relative quantities
of the removed HT losses that go to work and
exhaust losses for the adiabatic cases, an assump-
tion must be made regarding the combustion
losses. To provide a conservative analysis, the
increase in work due to increased combustion effi-
ciency is removed from the analysis by subtracting
the increased combustion efficiency from the gross
indicated efficiency of Table 9 (i.e. hg.i., corrected = hg
– hcomb.). With this assumption, the energy recov-
ered by operating adiabatically must either go to
increased work or exhaust energy. Figure 15 shows
the partitioning of the HT energy to work and
exhaust energy. It can be seen that the RCCI case
converts 57.6 per cent of the recovered HT energy
to useful work. Although the conventional diesel
case shows a similar increase in gross indicated effi-
ciency when adiabatic operation is considered,
since the heat loss for the non-adiabatic conven-
tional diesel case was significantly higher than for
the non-adiabatic RCCI case, the relative percent-
age of the recovered heat loss that performs useful
work is 14 per cent lower than for the RCCI case.
Figure 15 clearly highlights the improved work
extraction gained from improved control over the
start- and end-of-combustion for the RCCI case.
Fig. 14 Cylinder pressure and heat release rate for caseswith and without heat transfer for conventionaldiesel and RCCI combustion
Fig. 12 Comparison of model-predicted average (global)and peak (local) temperatures for RCCI and con-ventional diesel combustion
Fig. 13 Temperature contours on cut-planes coincidentwith the spray axis at a 6.1� ATDC (i.e. near the50 per cent burn location (CA50)) for RCCI andconventional diesel combustion
Fuel reactivity controlled compression ignition 221
Int. J. Engine Res. Vol. 12

Finally, to ensure the comparison of RCCI com-
bustion and conventional diesel combustion was
not biased due to differences in initial conditions,
CFD modelling was used to compare RCCI combus-
tion and conventional diesel combustion at the
same operating conditions. The operating condi-
tions for the modelling study are provided in Table
10. For the high-EGR diesel combustion case the
injection timing was varied to achieve the same
combustion phasing (CA50) as the RCCI case.
Notice that the fuelling was held constant, thus the
reduced efficiency of the high-EGR diesel case
results in a lower IMEP. Table 11 shows the com-
parison of the computed emissions and perfor-
mance. As expected, the reduced oxygen
concentration of the high-EGR diesel combustion
case results in significantly lower NOx emissions
than the zero EGR conventional diesel case pre-
sented in the previous section (i.e. the results of
Table 8). However, it can also be seen that the RCCI
combustion case shows two orders of magnitude
lower NOx emissions than high-EGR diesel combus-
tion case. Recall that the high-EGR diesel and RCCI
cases have identical initial conditions; thus for
a given equivalence ratio the global adiabatic flame
temperatures would be identical. However, since
the RCCI injection strategy allows sufficient time
for mixing prior to reaction, the peak local equiva-
lence ratio during the combustion process is only
0.6. The lean operation results in a peak tempera-
ture near 1700 K (see Fig. 10). Conversely, the
high-EGR diesel case features a mixing-controlled
combustion process where reactions occur in
a near-stoichiometric band on the outer edge of the
spray plume. Because combustion occurs in a
stoichiometric region the peak temperature of the
high-EGR diesel case is over 2500 K. From this com-
parison, it can be seen that the NOx reduction is
due to the elimination of high temperature, near-
stoichiometric regions. Of course it would be possi-
ble to reduce the flame temperatures of the
high-EGR diesel case to 1700 K by further reducing
the inlet oxygen concentration (i.e. increasing the
EGR rate). Since it is expected that combustion
would occur in a stoichiometric region for this case,
the required level of EGR can be computed using
Fig. 15 Partitioning of the recovered heat transfer from adiabatic operation energy to work andexhaust energy
Table 9 Energy balance for RCCI and conventional diesel combustion with and without heat transfer
RCCI (simulation) Conventional diesel (simulation)
With HT Adiabatic With HT Adiabatic
Gross indicated efficiency (%) 54.3 61.9 47.6 56.0Combustion losses (%) 1.3 0.0 0.3 0.3HT (%) 10.9 0.0 19.1 0.0Exhaust energy (%) 33.4 38.1 33.0 43.7
222 S L Kokjohn, R M Hanson, D A Splitter, and R D Reitz
Int. J. Engine Res. Vol. 12

homogenous reactor simulations. Assuming con-
stant pressure combustion it is found that the inlet
oxygen concentration must be reduced to 8.5 per
cent by volume to achieve a stoichiometric flame
temperature of 1700 K. To realize this reduction in
inlet oxygen concentration at the present operating
condition, the EGR must be increased to approxi-
mately 70 per cent.
In addition to a significant NOx reduction, the
RCCI case shows ten times lower soot emissions.
Finally, comparing the energy balances of Table 11,
it can be seen that the RCCI combustion case
results in an improvement in gross indicated effi-
ciency of 11.5 per cent (i.e. the RCCI combustion
case converts 5.6 per cent more of the fuel energy
into useful work). Similar to the comparisons with
conventional (zero EGR) diesel combustion, it
appears that the improvement in gross indicated
efficiency is primarily due to reduced HT losses.
7 CONCLUSIONS
This work further demonstrates the feasibility of
a dual fuel RCCI concept that uses two fuels with
different reactivities [41]. The present study used
PFI of commercially available gasoline and DI of
commercially available diesel fuel. The RCCI con-
cept has been shown to provide improved control
over the combustion process and to allow high-
efficiency and low emissions operation over a wide
range of speeds and loads. In the present work
RCCI is demonstrated in a HD diesel engine
operating at 1300 rev/min with loads from 4.6 to
14.6 bar IMEP. Additional experimental results are
available in the literature [5, 6, 27, 28, 42, 43] over
wider operating ranges and with different fuels.
The present study demonstrates that RCCI is
a promising strategy to meet current and future
emissions regulations without relying on NOx and
soot after-treatment. Aside from the ability to meet
NOx and soot emissions in-cylinder, RCCI is shown
to provide high efficiency over a wide range of
engine loads, with a peak gross indicated efficiency
of 56 per cent at the 9.3 bar IMEP operating point.
To help understand the origins of the improved
performance, engine experiments were used to
compare RCCI and conventional diesel combustion.
Compared to conventional diesel combustion with-
out EGR it was found that RCCI results in a NOx
reduction of nearly three orders of magnitude, six
times lower soot, and 16.4 per cent higher gross
indicated efficiency. In addition to the experimental
engine comparisons, CFD modelling was used to
compare RCCI and high-EGR diesel combustion. It
was found that at identical operating conditions
(e.g. equal inlet oxygen concentrations) NOx was
reduced by two orders of magnitude, soot was
reduced by a factor of ten, and gross indicated effi-
ciency was improved by 11.5 per cent.
The CFD modelling indicates that the observed
NOx and soot reductions are due to the avoidance
of high equivalence ratio and high temperature
regions in the combustion chamber. Two factors
were found to explain the improved thermal effi-
ciency. First, RCCI combustion avoids high-
temperature regions that are located near the
piston bowl surface that are observed in the con-
ventional diesel combustion case; thus, HT losses
are reduced by nearly a factor of two. Second, RCCI
combustion shows improved control over the start-
and end-of-combustion. This improved combustion
control allows the combustion timing and duration
to be optimized for minimum compression work
and maximum expansion work (i.e. maximum
Table 10 Operating conditions for the comparison
between high-EGR diesel and RCCI
combustion
RCCI High-EGRdiesel
IMEP gross (bar) 9.3 8Engine speed (rev/min) 1300 1300Fuel flowrate (g/s) 1.02 1.02Per cent gasoline (% by mass) 89 0Air flowrate (kg/s) 0.03 0,03DI SOI 1 (�ATDC) –58 –14DI SOI 2 (�ATDC) –37 NADI duration 1 (CA�) 3.9 21DI duration 2 (CA�) 1.95 NAPer cent of DI fuel in pulse 1 (% by mass) 67 100DI injection pressure (bar) 800 800Intake surge tank pressure (bar) 1.74 1.74Exhaust surge tank pressure (bar) 1.84 1.84Intake surge tank temperature (�C) 32 32Air : fuel ratio (–) 29 29EGR rate (%) 41 41Fuel MEP (bar) 16.6 16.6IVC (�ATDC) –143 –14.3EVO (�ATDC) 130 130
Table 11 Emissions and performance of RCCI and
high-EGR diesel combustion
RCCI High-EGR diesel
ISnox (g/kW-h) 0.006 0.81ISsoot (g/kW-h) 0.019 0.23RI (MW/m2) 3.8 1.4Max PRR (bar/deg) 10.3 6.1Gross indicated efficiency (%) 54.3 48.7Combustion losses (%) 1.3 0.7HT (%) 10.9 16.1Exhaust energy (%) 33.4 34.5
Fuel reactivity controlled compression ignition 223
Int. J. Engine Res. Vol. 12
indicated efficiency). The improved control over the
start- and end-of-combustion was highlighted by
exploring adiabatic operation with the CFD model-
ling. It was found that when HT is removed the
RCCI combustion process converts 14 per cent
more of the recovered HT energy into useful work
than conventional diesel operation.
ACKNOWLEDGEMENTS
This work was supported by the Engine Research Center’sDiesel Engine Research Consortium, and by DOE grantDE-EE0000202 and the DOE Sandia Laboratories.
� Authors 2011
REFERENCES
1 Kim, J., Park, S. W., and Reitz, R. D.Improvements in the performance and pollutantemissions for stoichiometric diesel combustionengines using a two-spray-angle nozzle. J.Automob. Engng, 2010, 224(8), 1113–1122.
2 Theis, J. R., Ura, J. A., Li, J. J., Surnilla, G. G.,Roth, J. M., and Goralski Jr, C. T. NOx releasecharacteristics of lean NOx traps during richpurges. SAE paper 2003-01-1159, 2003.
3 Turns, S. R. An introduction to combustion: con-cepts and applications, second edition, 1999 (WCB/McGraw-Hill, Boston, Massachusetts).
4 Manente, V., Tunestal, P., and Johansson, B.Partially premixed combustion at high load usinggasoline and ethanol, a comparison with diesel.SAE paper 2009-01-0944, 2009.
5 Splitter, D. A., Hanson, R. M., Kokjohn, S. L., andReitz, R. D. Improving engine performance byoptimizing fuel reactivity with a dual fuel PCCIstrategy. Conference on Thermo and FluidDynamic Processes in Diesel Engines, Valencia,Spain, 14–17 September 2010.
6 Kokjohn, S. L., Splitter, D. A., Hanson, R. M., andReitz, R. D. Experiments and modeling of dual fuelHCCI and PCCI combustion using in-cylinder fuelblending. SAE Int. J. Engines, 2010, 2(2), 24–39.
7 Manente, V., Johansson, B., Tunestal, P., andCannella, W. Effects of ethanol and different typeof gasoline fuels on partially premixed combustionfrom low to high load. SAE paper 2010-01-0871,2010.
8 Hasegawa, R. and Yanagihara, H. HCCI combustionin DI diesel engine. SAE paper 2003-01-0745, 2003.
9 Hardy, W. L. and Reitz, R. D. A study of the effectsof high EGR, high equivalence ratio, and mixingtime on emissions levels in a heavy-duty dieselengine for PCCI combustion. SAE paper 2006-01-0026, 2006.
10 Opat, R., Ra, Y., Gonzalez, M. A., Krieger, R.,Reitz, R. D., Foster, D. E., Siewert, R., andDurrett, R. Investigation of mixing and tempera-ture effects on HC/CO emissions for highly dilute
low temperature combustion in a light duty dieselengine. SAE paper 2007-01-0193, 2007.
11 Dec, J. E. and Yang, Y. Boosted HCCI for highpower without engine knock and with ultra-lowNOx emissions using conventional gasoline. SAEInt. J. Engines, 2010, 3(1), 750–767.
12 Manente, V., Johansson, B., Tunestal, P., andCannella, W. Influence of inlet pressure, EGR,combustion phasing, speed and pilot ratio on highload gasoline partially premixed combustion. SAEpaper 2010-01-1471, 2010.
13 Kalghatgi, G. T. Auto-ignition quality of practicalfuels and implications for fuel requirements offuture SI and HCCI engines. SAE paper 2005-01-0239, 2005.
14 Kalghatgi, G., Risberg, P., and Angstrom, H.Advantages of fuels with high resistance to auto-ignition in late-injection, low-temperature, com-pression ignition combustion. SAE Trans., 2006,115(4), 623–634.
15 Kalghatgi, G. T., Risberg, P., and Angstrom, H.Partially pre-mixed auto-ignition of gasoline toattain low smoke and low NOx at high load ina compression ignition engine and comparisonwith a diesel fuel. SAE paper 2007-01-0006, 2007.
16 Liu, H., Yao, M., Zhang, B., and Zheng, Z. Effects ofinlet pressure and octane numbers on combustionand emissions of a homogeneous charge compres-sion ignition (HCCI) engine. Energy and Fuels, 2008,22(4), 2207–2215.
17 Christensen, M., Hultqvist, A., and Johansson, B.Demonstrating the multi-fuel capability of a homo-geneous charge compression ignition engine withvariable compression ratio. SAE paper 1999-01-3679, 1999.
18 Bessonette, P. W., Schleyer, C. H., Duffy, K. P.,Hardy, W. L., and Liechty, M. P. Effects of fuelproperty changes on heavy-duty HCCI combus-tion. SAE paper 2007-01-0191, 2007.
19 Inagaki, K., Fuyuto, T., Nishikawa, K.,Nakakita, K., and Sakata, I. Dual-fuel PCI com-bustion controlled by in-cylinder stratification ofignitability. SAE paper 2006-01-0028, 2006.
20 Ra, Y. and Reitz, R. D. A reduced chemical kineticmodel for IC engine combustion simulations withprimary reference fuels. Combust. Flame, 2008,155(4), 713–738.
21 Amsden, A. A. KIVA-3V, Release 2, improvementsto KIVA-3V, LA-UR-99-915, Los Alamos NationalLaboratory, 1999.
22 Beale, J. C. and Reitz, R. D. Modeling spray atom-ization with the Kelvin–Helmholtz/Rayleigh–Taylorhybrid model. Atomiz. Sprays, 1999, 9(6), 623–650.
23 Abani, N., Munnannur, A., and Reitz, R. D.Reduction of numerical parameter dependenciesin diesel spray models. Trans. ASME, J. Engng GasTurbines Power, 2008, 130(3) 1–9.
24 Abani, N., Kokjohn, S. L., Park, S. W., Bergin, M.,Munnannur, A., Ning, W., Sun, Y., and Reitz, R.D. An improved spray model for reducing numeri-cal parameters dependencies in diesel engine CFDsimulations. SAE paper 2008-01-0970, 2008.
224 S L Kokjohn, R M Hanson, D A Splitter, and R D Reitz
Int. J. Engine Res. Vol. 12
25 Kong, S.-C., Sun, Y., and Reitz, R. D. Modelingdiesel spray flame lift-off, sooting tendency andNOx emissions using detailed chemistry witha phenomenological soot model. Trans. ASME, J.Engng Gas Turbines Power, 2007, 129, 245–251.
26 Ra, Y. and Reitz, R. D. The application of a multi-component droplet vaporization model to gasolinedirect injection engines. Int. J. Engine Res., 2003,4(3), 193–218.
27 Hanson, R. M., Kokjohn, S. L., Splitter, D. A.,and Reitz, R. D. An experimental investigation offuel reactivity controlled PCCI combustion ina heavy-duty engine. SAE paper 2010-01-0864,2010.
28 Splitter, D. A., Hanson, R. M., Kokjohn, S. L.,Rein, K., Sanders, S., and Reitz, R. D. An opticalinvestigation of ignition processes in fuel reactivitycontrolled PCCI combustion. SAE paper 2010-01-0345, 2010.
29 Shuai, S., Abani, N., Park, S. W., Yoshikawa, T.,and Reitz, R. D. Simulating low temperature dieselcombustion with improved spray models. Int. J.Therm. Sci., 2009, 48(9), 1786–1799.
30 Hiroyasu, H. and Kadota, T. Models for combus-tion and formation of nitric oxide and soot in DIdiesel engines. SAE paper 760129, 1976.
31 Sun, Y. Diesel combustion optimization and emis-sions reduction using adaptive injection strategies(AIS) with improved numerical models. PhDThesis, Department of Mechanical Engineering,University of Wisconsin-Madison, 2007.
32 Munnannur, A. Droplet collision modeling inmulti-dimensional engine spray computations. PhDThesis, Department of Mechanical Engineering,University of Wisconsin-Madison, 2007.
33 O’Rourke, P. J. and Amsden, A. A. A spray/wallinteraction submodel for the KIVA-3 wall filmmodel. SAE paper 2000-01-0271, 2000.
34 O’Rourke, P. J. and Amsden, A. A. A particlenumerical model for wall dynamics in port-injected engines. SAE paper 961961, 1996.
35 Kokjohn, S. L. and Reitz, R. D. Investigation of theroles of flame propagation, turbulent mixing, andvolumetric heat release in conventional and lowtemperature diesel combustion. Trans. ASME, J.Engng Gas Turbines Power, (accepted).
36 Kokjohn, S. L. and Reitz, R. D. A modeling studyof charge preparation in an HCCI engine usinga variable pressure pulse (VPP) injection systemand optimized PRF Blends. The 11th InternationalConference on Liquid Atomization and SpraySystems, Vail, Colorado, 30 July 2009.
37 Eng, J. Characterization of pressure waves in HCCIcombustion. SAE paper 2002-01-2859, 2002.
38 McBride, B. and Gordon, S. Computer programfor calculation of complex chemical equilibriumcompositions, rocket performance, incident andreflected shocks, and Chapman–Jouguet detona-tions, NASA report SP-273, National Air and SpaceAdministration, 1971.
39 Tess, M. and Reitz, R. D. Diesel engine combus-tion size scaling at medium load without EGR. SAEpaper 11PFL-1022, 2011.
40 Ferguson, C. R. and Kirkpatrick, A. T. Internalcombustion engines, second edition, 2001 (JohnWiley & Sons, New York, New York).
41 Reitz, R. D., Hanson, R. M., Splitter, D. A., andKokjohn, S. L. Engine combustion control via fuelreactivity stratification. University of WisconsinWARF Patent Application P100054US.
42 Hanson, R. M., Kokjohn, S. L., Splitter, D. A., andReitz, R. D. Low load investigation of reactivitycontrolled compression ignition (RCCI) combus-tion in a heavy-duty engine. SAE paper 2011-01-0361.
43 Splitter, D. A., Hanson, R. M., Kokjohn, S. L., andReitz, R. D. Reactivity controlled compressionignition (RCCI) engine operation at mid and highloads with conventional and alternative fuels. SAEpaper 2011-01-0363.
44 Lutz, A. E., Kee, R. J., and Miller, J. A. SENKIN: AFORTRAN program for predicting homogeneousgas phase chemical kinetics with sensitivity analy-sis, SAND 89-8009, 1988.
45 Akihama, K., Takatori, Y., Inagaki, K., Sasaki, S.,and Dean, A. M. Mechanism of the smokeless richdiesel combustion by reducing temperature. SAEpaper 2001-, 2001. paper number
APPENDIX
Definition of acronyms
ATDC after top dead centre
AHRR apparent heat release rate
BDC bottom dead centre
BTDC before top dead centre
BMEP brake mean effective pressure
CI compression ignition
CFD computational fluid dynamics
CA crank angle
DPF diesel particulate filter
DI direct injection
ERC engine research center
EPA Environmental Protection Agency
EGR exhaust gas recirculation
EVC exhaust valve closing
EVO exhaust valve opening
FSN filter smoke number
HT heat transfer
HD heavy duty
HCCI homogeneous charge compres-
sion ignition
IMEP indicated mean effective pressure
IS indicated specific
IVC intake valve closure
Fuel reactivity controlled compression ignition 225
Int. J. Engine Res. Vol. 12

IVO intake valve opening
KH Kelvin–Helmholtz
LDEF Lagrangian-drop and Eulerian
fluid
LNT lean NOx trap
LTC low temperature combustion
LHV lower heating value
MEP mean effective pressure
PFI port fuel-injection
PCCI premixed charge compression
ignition
PCI premixed compression ignition
PM particulate matter
PRR pressure rise rate
PRF primary reference fuel
PID proportional integral derivative
RT Rayleigh–Taylor
RCCI reactivity controlled compression
ignition
RI ringing intensity
SCR selective catalytic reduction
SCOTE single cylinder oil test engine
SI spark ignited
SOI start of injection
TWC three-way catalyst
TDC top dead centre
UHC unburned hydrocarbon
US United States
226 S L Kokjohn, R M Hanson, D A Splitter, and R D Reitz
Int. J. Engine Res. Vol. 12


