1
Back analysis of a landslide in a residual soil slope in Rio de Janeiro, Brazil
D. M. S. GERSCOVICH
Civil Engineering Department, State University of Rio de Janeiro, Brazil
T. M. P. DE CAMPOS AND E. A. VARGAS JR
Civil Engineering Department Pontifical Catholic University of Rio de Janeiro, Brazil
ABSTRACT
After a short period of relatively intense rainfall, a deep-seated landslide occurred in a slope in
Rio de Janeiro. The mass movement buried cars, and caused structural damages to an adjacent
building. The exposed failure surface was completely saturated, regardless of the inexistence of
groundwater within the slope. At this site, a comprehensive laboratory and field investigation was
undertaken to determine the hydro-geotechnical parameters of the residual soil profile. Numerical
modeling of infiltration processes revealed that the rainfall amount was insufficient to reproduce the
saturation condition of the failure surface. On the other hand, this critical condition could be rapidly
achieved if the numerical analysis incorporated the changes of slope geometry, due to the
displacement of the soil mass above the failure surface, or the development of a preferential
infiltration path through the fractured soil-rock layer transition.
This paper evaluates the influence of the different scenarios that were conceived for the
simulations of the infiltration processes in the stability of the slop. The geotechnical parameters
used in the stability analyses were defined according to laboratory shear test carried out on samples
extracted from the slide surface and from an undisturbed location of the slope. Pore pressure
distributions at the central section of the landslide were obtained from previous results of flow
simulations.
Factors of safety were computed for the actual failure surface and for the one with the minimum
factor of safety. Regardless of the geometry of the failure mass, the stability analyses indicated the
landslide could not be triggered solely by rain infiltration. Amongst various alternatives, the

2
existence of a preferential flow through a fractured layer of the bedrock revealed to be the only
feasible scenario that could reproduce not only the saturated condition, but also a factor of safety
close to 1.
Deep-seated landslides of unsaturated residual slopes are relatively common in tropical countries.
Despite the usual approach of identifying the landslide as a rainstorm-induced mechanism, it
appears to be more complex and other infiltration sources may play an essential role.
Keywords: unsaturated soil, stability analysis, transient flow, residual soil
1. Introduction
Rio de Janeiro city is located in the southeastern region of Brazil. Its mountainous relief
associated to a tropical humid climate results in slopes of unsaturated residual soil with thickness
that may vary from few centimeters to dozen of meters. Rain-induced soil and/or rock mass
movements are quite frequent, during or immediately after periods of intense rainfall.
Despite of the considerable progress in the understanding of the behavior of unsaturated soils, it
is actually very difficult to predict when or where a landslide may happen. Nevertheless, it is
recognized that rainfall-induced landslides are caused by changes in pore water pressures.
Many authors have attempted to address the likely causes of landslides (e.g. Kim et al., 2004;
Capra et al, 2003; Gasmo et al, 2000; Au, 1998; Costa Nunes et al, 1989; Wolle and Hachich, 1989;
Vargas et al, 1986). Shallow failures may be attributed to the deepening of a wetting front into the
slope, which results in a decrease of matric suction or to the development of the weathering process
of steep slopes. Large landslides and debris flows usually result from the development of positive
pore pressures that comes along with fully saturation of the soil mass. This scenario may be
achieved when infiltrating water encounters a low permeability soil layer and a transient perched
water table occurs (Capra et al, 2003) or when water infiltrates through fractured layers of the
bedrock (Dietrich et al, 1986; Wilson, 1988; Vargas Jr. et al, 1990). Further studies have also
3
illustrated that positive pore pressure generation along the failure surface may be produced by the
crushing of soil grains resulting in a liquefied soil condition (Wang and Sassa, 2003) or as a
consequence of soil contraction that originates at the sliding surface and spreads to the unsaturated
soil mass (Capra et al, 2003).
In February 1988, a considerable number of soil/rock slides occurred in various slopes in Rio de
Janeiro city. Most of them were shallow and quite long in extension (100-150m) and were classified
as being amongst the largest that have occurred in the city. The pluviometric data corresponding to
21 days indicated an accumulated amount of 515.6mm, with a rain peak of 85.4mm in a single day.
Nine months later, in November, a deep-seated slide occurred in a re-vegetated slope (Figure 1)
after a period of a medium intensity rainfall. After 21 days, the accumulated rainfall amount was
246.3mm, with a maximum rain peak of 57.5mm. The failure caused structural and material
damages to an adjacent building, with the shearing of one pillar and complete destruction of one
apartment. Several cars in external and internal building parking areas were also damaged.
Fortunately, nobody was injured. Despite no evidence of groundwater within the slope, on the
following day and continuously for the following week after the slide, there were clear indications
of full saturation of the failure surface, with groundwater springs at its upper region.

4
(a) day after photo
0 10 20 30 40 50 60 70 80 90 Rain amount (mm)
17 19 21 23 25 27 29 31 2 4 6 8 10 12 14
Days (October/November)
October November
Day of landslide
(b) daily rain amount
Figure 1. Slope view and pluviometric data.
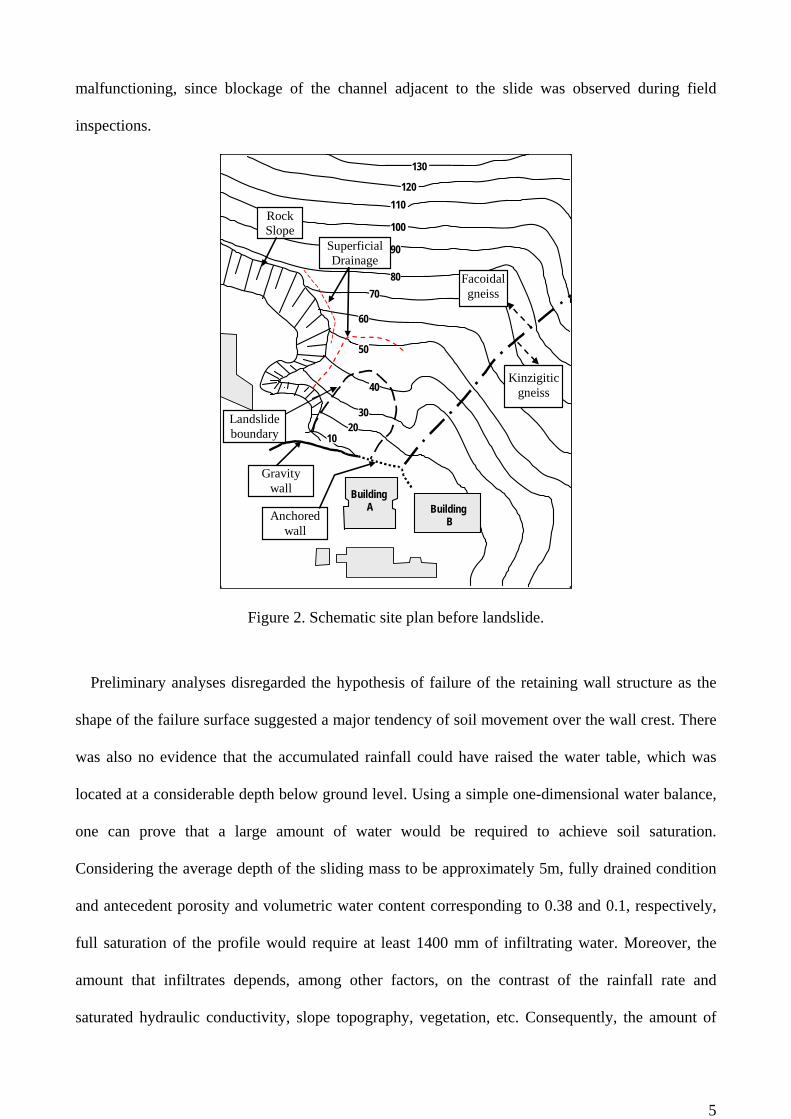
Figure 2 shows a schematic topographic plan of the site before the landslide. The slope crest
shows a maximum elevation of 384m and surface inclinations ranging from 30o to 55. At the toe of
the slope there was a gravity wall aligned with an anchored wall, located at the rear of the Building
A. The superficial drainage system, located at the upper region of the slope, was presumably
5
malfunctioning, since blockage of the channel adjacent to the slide was observed during field
inspections.
10
2030
40
50
60
70
80
90
100
110
120
130
Building BAnchored
wall
Rock Slope
Facoidal gneiss
Kinzigitic gneiss
Gravity wall
Landslide boundary
Building A
Superficial Drainage
Figure 2. Schematic site plan before landslide.
Preliminary analyses disregarded the hypothesis of failure of the retaining wall structure as the
shape of the failure surface suggested a major tendency of soil movement over the wall crest. There
was also no evidence that the accumulated rainfall could have raised the water table, which was
located at a considerable depth below ground level. Using a simple one-dimensional water balance,
one can prove that a large amount of water would be required to achieve soil saturation.
Considering the average depth of the sliding mass to be approximately 5m, fully drained condition
and antecedent porosity and volumetric water content corresponding to 0.38 and 0.1, respectively,
full saturation of the profile would require at least 1400 mm of infiltrating water. Moreover, the
amount that infiltrates depends, among other factors, on the contrast of the rainfall rate and
saturated hydraulic conductivity, slope topography, vegetation, etc. Consequently, the amount of
6
infiltration would be less than the values predicted by the pluviometers data. Nevertheless, the
triggering mechanism was undoubtedly associated to changes in the pore water pressure and it was
likely that complex changes of the slope hydrogeology might have occurred.
Numerical 3D-FEM transient flow analyses were carried out to identify the infiltration process
that could explain field evidence of complete saturation of the failure surface. Different boundary
conditions were conceived and the results revealed that only major changes of the slope
hydrogeology could justify the deep-seated slope failure (Gerscovich et al, 2006).
This paper describes the experimental programme, presents field and laboratory results regarding
geotechnical parameters of the residual soil and the uses the slope stability approach to verify the
validity of the previously obtained results of flow simulations.
2. Geotechnical Investigation
A comprehensive series of field and laboratory tests was carried out to determine soil profile and
geotechnical and hydrological parameters.
Field investigation comprised seismic refraction surveys, percussion and rotary drillings. They
indicated a varying thickness profile of unsaturated residual soil, originated from a gneissic
metamorphic rock that outcropped at the upper and left sides of the landslide boundary.
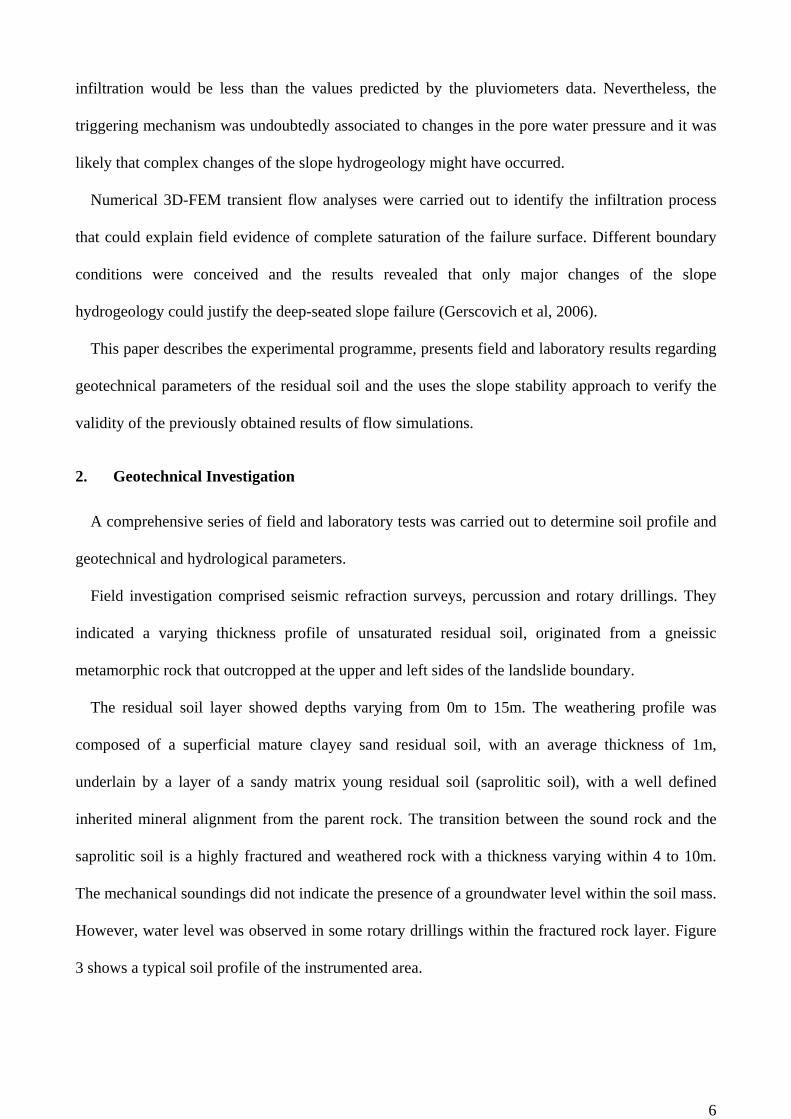
The residual soil layer showed depths varying from 0m to 15m. The weathering profile was
composed of a superficial mature clayey sand residual soil, with an average thickness of 1m,
underlain by a layer of a sandy matrix young residual soil (saprolitic soil), with a well defined
inherited mineral alignment from the parent rock. The transition between the sound rock and the
saprolitic soil is a highly fractured and weathered rock with a thickness varying within 4 to 10m.
The mechanical soundings did not indicate the presence of a groundwater level within the soil mass.
However, water level was observed in some rotary drillings within the fractured rock layer. Figure
3 shows a typical soil profile of the instrumented area.

7
Figure 3. Soil profile at the instrumented area.
Field instrumentation was installed outside the slide area and consisted of piezometers,
inclinometer tubes and a pluviometric station. Maxima piezometers (Brand, 1985) were also
installed at the soil-rock interface to record maximum transient water pressure levels. More details
regarding field instrumentation refer to Gerscovich et al (2006).
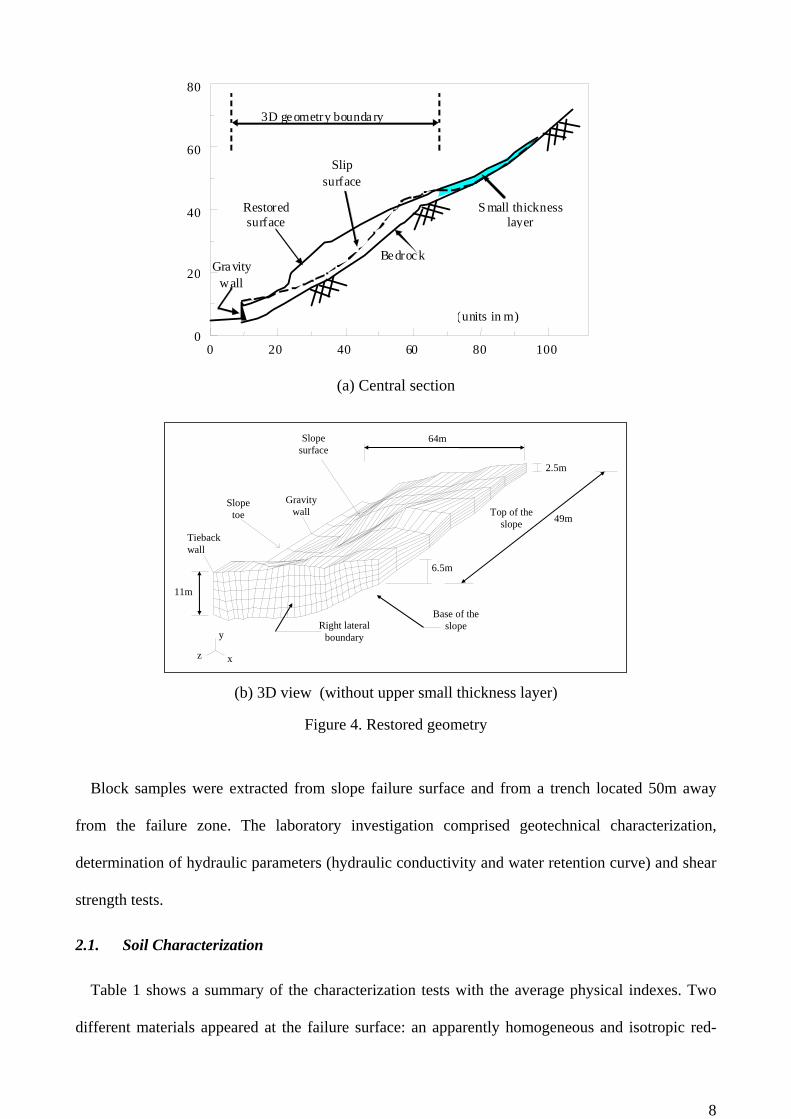
Topographic plants that were generated before and after the slide, aerophotos taken between 1966
and 1975, and logging profiles were used to restore the original geometry of the whole area and to
define the landslide surface, as well. The failure surface presented an ellipse shape with the
relationship width (perpendicular to the movement) and length (in the direction of the movement)
of approximately 0.6. Figure 4 displays the reconstructed 3D geometry of the hillside and a view of
the 2D central section of the slope.
8
0 20 40 60 80 100 0
20
40
60
80
Slipsurface
Restored surface
Bedrock Gravity
wall
(units in m)
3D geometry boundary
S mall thickness layer
(a) Central section
x
y
z
Gravity wall
Tieback wall
2.5m
6.5m
49m
64m
11m
Slope toe
Right lateral boundary
Slope surface
Top of the slope
Base of the slope
(b) 3D view (without upper small thickness layer)
Figure 4. Restored geometry
Block samples were extracted from slope failure surface and from a trench located 50m away
from the failure zone. The laboratory investigation comprised geotechnical characterization,
determination of hydraulic parameters (hydraulic conductivity and water retention curve) and shear
strength tests.
2.1. Soil Characterization
Table 1 shows a summary of the characterization tests with the average physical indexes. Two
different materials appeared at the failure surface: an apparently homogeneous and isotropic red-

9
colored mature residual soil, and a grey saprolitic soil, with a well-defined mineral alignment. At
the trench, only the saprolitic soil was extracted and it was coarser and denser than the one from the
slip surface.
Table 1. Soil characterization
Location Slip surface Trench
Soil type Saprolitic soil Mature soil Saprolitic soil
Sand (%) 63.0 56.0 82.0
Silt (%) 27.5 34.0 9.8
Clay (%) 9.5 10.0 8.2
L (%) 38.2 39.5 -
P (%) NP 24.7 -
(%) 19.0 21.2 6.4
(%) 22.4 25.5 10.3
Gs 2.64 2.63 2.66
e 1.19 1.14 0.62
n 0.54 0.53 0.38
t (kN/m3) 14.0 14.6 17.1
Notes: L= liquid limit; L = plasticity limit; = water content; = volumetric water content; Gs = specific gravity of grains; e= voids ratio, n = porosity, t = in situ density
The volumetric soil moisture profile of the saprolitic soil extracted from the trench, located
behind Building B, is shown in Figure 5. The results indicated volumetric water content around
25% on the surface and a gradual reduction with depth. Below 2m depth, this value is
approximately constant and equal to 9%.

10
Figure 5. Volumetric water content profiles of the saprolitic soil from the trench.
2.2. Shear Strength Parameters
Isotropically consolidated drained triaxial tests (CID) were performed on saturated 100mm-
diameter undisturbed samples of the saprolitic soil extracted from the trench. The specimens were
molded with the xistosity plane inclined around 30o with the horizontal plane. The consolidation
stress levels ranged from 25 to 200kPa and the shearing velocity was 0.0122mm/min. The triaxial
chamber allowed the use of internal devices for automatic measurement of axial and radial strains
and volume changes (water and total volume). The variations of air volume were mechanically
monitored by a bubble trap device (Aguilar, 1990).
Conventional direct shear tests were carried out on soil samples extracted from the slip surface.
The saprolitic soil specimens were molded with the shearing plane parallel and perpendicular to the
plane of xistosity. In spite of the apparent isotropic condition, the mature soil samples were also
prepared according two perpendicular angles. The samples were initially saturated, prior to the
consolidation stage, under normal stresses ranging from 22 to 135kPa. The shearing velocity was
0.0036mm/min and the shear box was prepared with an opening of 0.5mm.
0
1
2
3
4
0 1 2 3
Dep
th
June/9
Sept./93
Volumetric water content (%)

11
Figure 6 shows the shear strength test results of the saprolitic soil and Table 2 summarizes the
mean values of strength parameters, since no influence of the shear plane angle with respect to the
xistosity orientation has been observed. The results revealed a reasonable agreement between the
direct shear and the triaxial tests of the saprolitic soil, despite the differences on soil
characterization.
The Mohr-Coulomb strength envelope of the saprolitic soil could be fitted by a straight line with
effective cohesion and friction angle equal to 13kPa and 33o. However, due to the relatively high
percentage of sand, it would be expected a null cohesion within the range of low confining stresses.
For that reason, the Mohr-Coulomb strength envelope would better defined by a bi-linear curve that
is also plotted in Figure 6.
Table 2. Saturated Strength Parameters
Test Conventional Direct Shear test Triaxial test
Soil Saprolitic soil Mature soil Saprolitic soil
c’(kPa) 14.6 4.8 9.6
’(o) 31.8 27.5 34.0
Direct shear tests
Triaxial CID
0 50 100 150 200 0
50
100
150
200
Normal stress (kPa)
Sh
ear
stre
ss (
kPa)
Nonlinear envelope
Figure 6. Shear strength of saprolitic soil – saturated condition
The small thickness mature residual soil provided lower values of strength parameters as a result
of a more intense weathering process.
12
The shear strength response of the residual soil under unsaturated condition was determined by
direct shear tests with suction control. The tests were carried out on samples extracted from the slip
surface, according to a multi stage technique (Ho and Fredlund, 1982), following the wetting path
(Fonseca, 1991; Carrillo et al 1994). Similarly to the saturated tests, specimens were molded with
shearing plane parallel and perpendicular to the plane of xistosity. The samples were initially
consolidated to a vertical stress of 50kPa, and then submitted to decreasing suctions from 200 to
15kPa (de Campos et al, 1994). The shearing velocity was 0.0366mm/min.
The shear strength of unsaturated soils is based on the Mohr-Coulomb criterion and, according to
Fredlund et al (1978), can be expressed by:
tgutguuc ab
wa (1)
where, ua and uw are the pore air and pore water pressure, respectively, is the total normal stress;
c’ and ´ are effective strength parameters and b is the angle indicating the rate of increase in shear
strength relative to the matric suction. b is equal to ´ at low matric suction, and decreases to a
lower value at high matric suctions (Teknsoy et al, 2004).
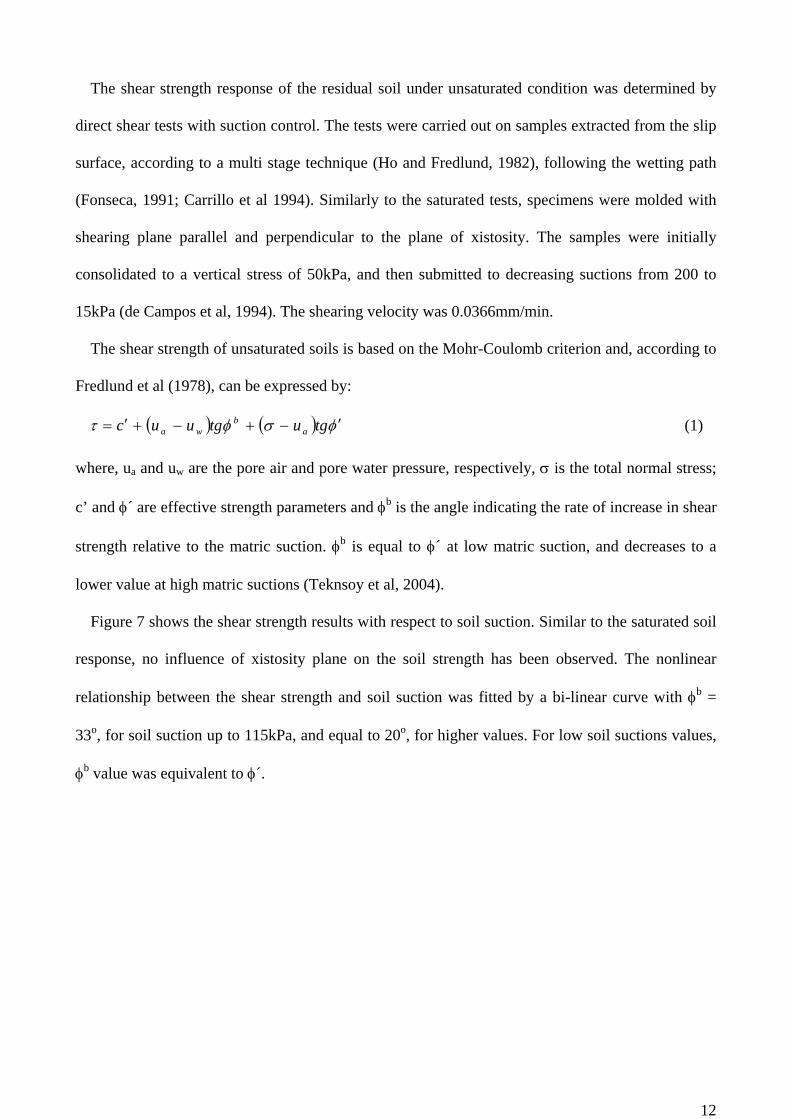
Figure 7 shows the shear strength results with respect to soil suction. Similar to the saturated soil
response, no influence of xistosity plane on the soil strength has been observed. The nonlinear
relationship between the shear strength and soil suction was fitted by a bi-linear curve with b =
33o, for soil suction up to 115kPa, and equal to 20o, for higher values. For low soil suctions values,
b value was equivalent to ´.
13
0 50 100 150 200 250 0
50
100
150
200
250
Matric suction (kPa)
She
ar s
tres
s (k
Pa)
b = 33o
b= 20
o
Perpendicular to xistos ity
Paralell to xistosity
Figure 7. Unsaturated strength envelope
The similarity between b and ´, for low values of matric suction, was also observed by
Rahardjo et al (1995) in triaxial tests on residual soils of Singapore. Following a drying path, the
authors obtained b equal to 26o, for matric suctions up to 400kPa, which was equal to the effective
friction angle ´.
It is worth to note that the relatively high b values revealed the strong influence of the matric
suction on the shear strength; any infiltration process promotes a substantial reduction of the shear
strength.
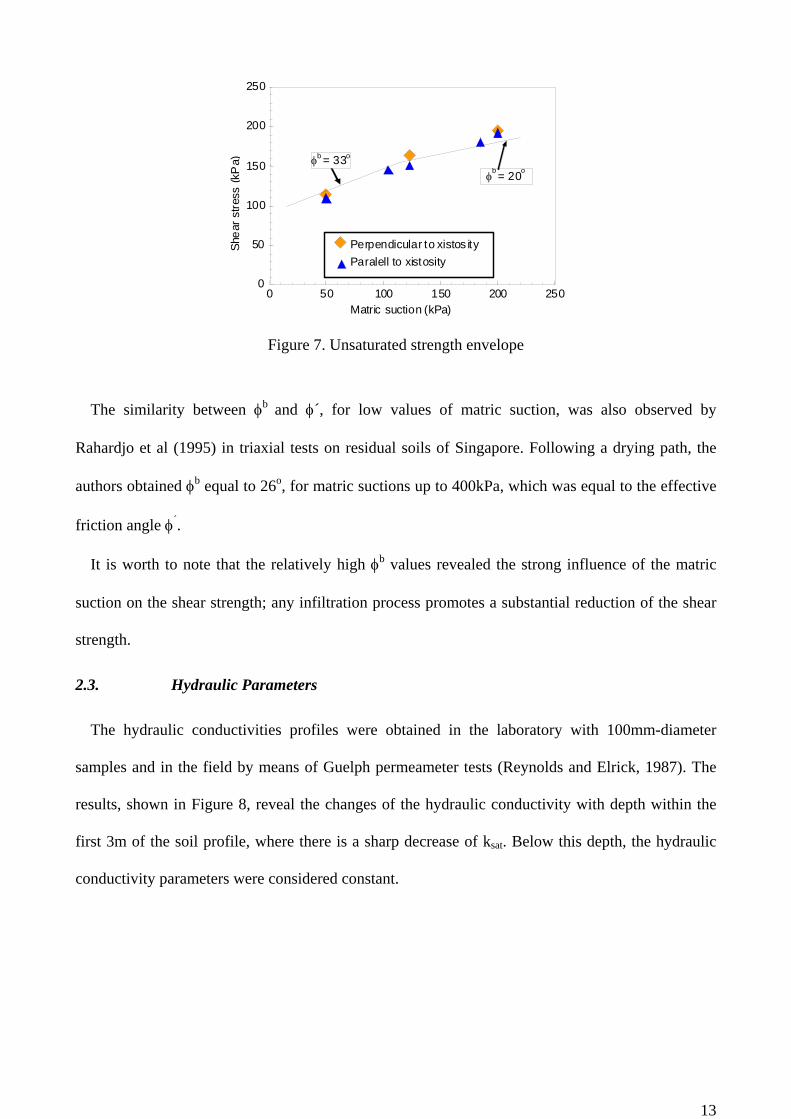
2.3. Hydraulic Parameters
The hydraulic conductivities profiles were obtained in the laboratory with 100mm-diameter
samples and in the field by means of Guelph permeameter tests (Reynolds and Elrick, 1987). The
results, shown in Figure 8, reveal the changes of the hydraulic conductivity with depth within the
first 3m of the soil profile, where there is a sharp decrease of ksat. Below this depth, the hydraulic
conductivity parameters were considered constant.
14
Figure 8.Prescribed relative hydraulic conductivity curves.
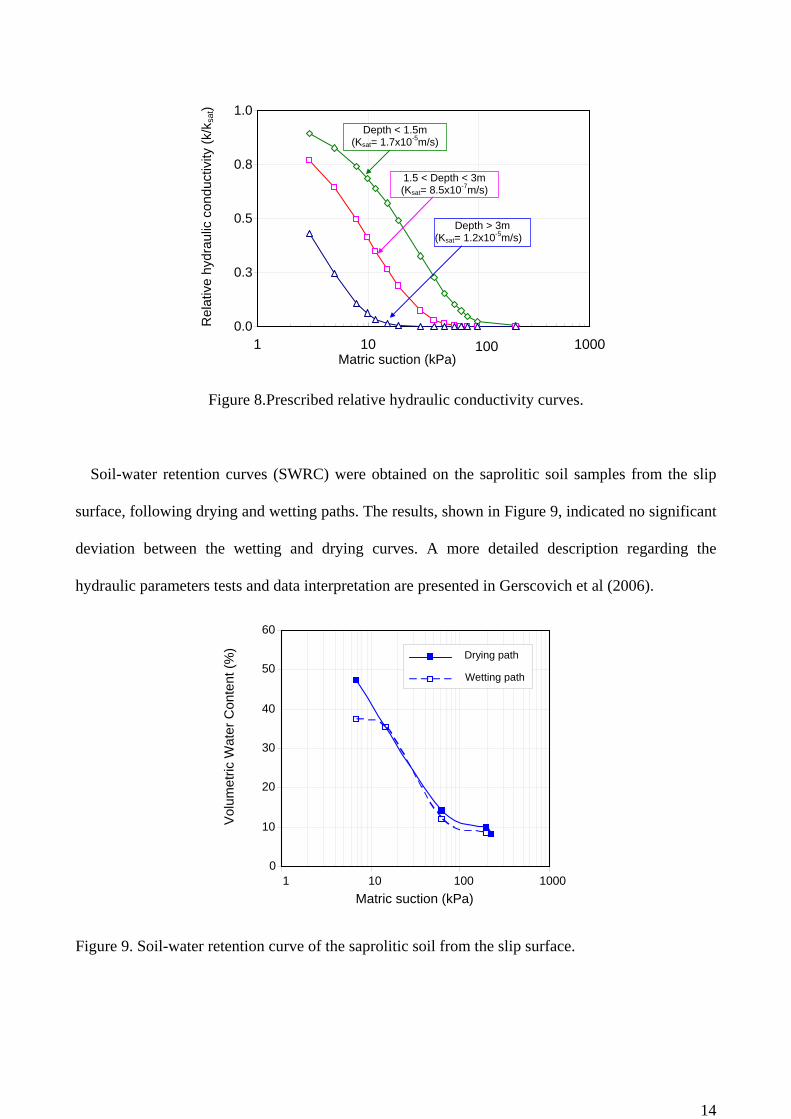
Soil-water retention curves (SWRC) were obtained on the saprolitic soil samples from the slip
surface, following drying and wetting paths. The results, shown in Figure 9, indicated no significant
deviation between the wetting and drying curves. A more detailed description regarding the
hydraulic parameters tests and data interpretation are presented in Gerscovich et al (2006).
Figure 9. Soil-water retention curve of the saprolitic soil from the slip surface.
0
10
20
30
40
50
60
1 10 100 1000
Matric suction (kPa)
Drying path
Wetting path
Vol
umet
ric W
ater
Con
tent
(%
)
0.0
0.3
0.5
0.8
1.0
1 10 100 1000 Matric suction (kPa)
Rel
ativ
e hy
drau
lic c
ondu
ctiv
ity (
k/k s
at)
1.5 < Depth < 3m (Ksat= 8.5x10⁻⁷m/s)
Depth > 3m (Ksat= 1.2x10⁻⁵m/s)
Depth < 1.5m (Ksat= 1.7x10⁻⁵m/s)
15
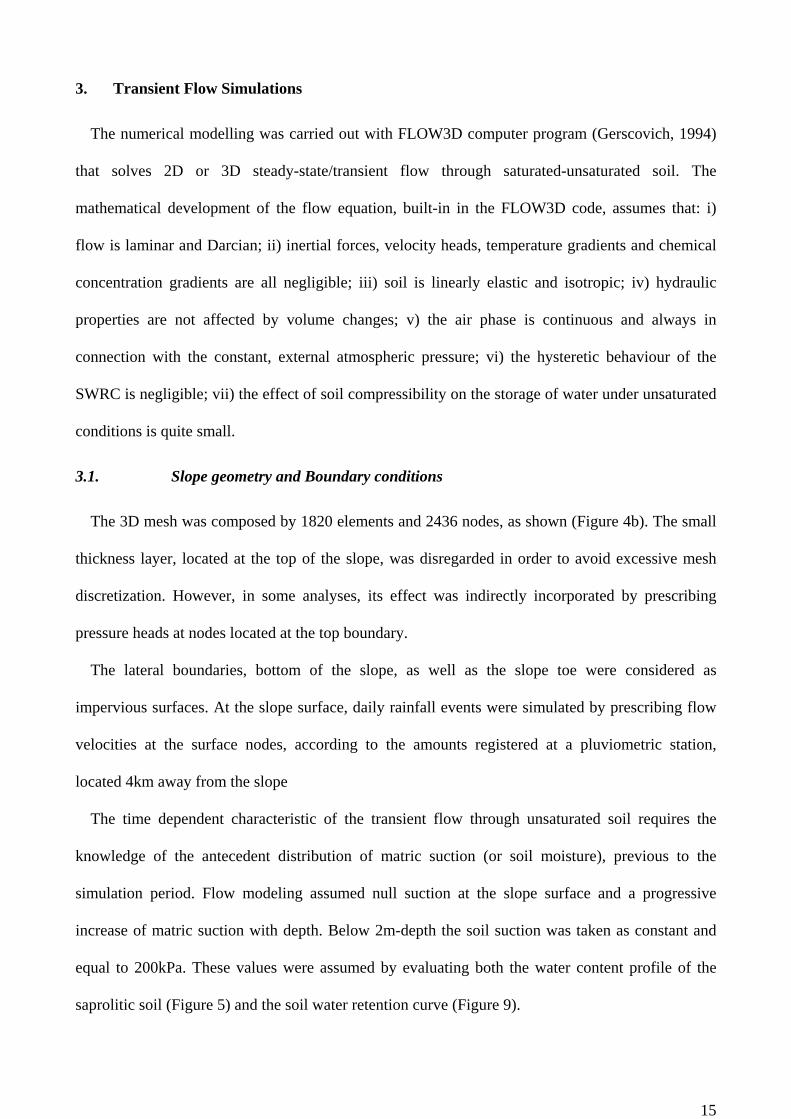
3. Transient Flow Simulations
The numerical modelling was carried out with FLOW3D computer program (Gerscovich, 1994)
that solves 2D or 3D steady-state/transient flow through saturated-unsaturated soil. The
mathematical development of the flow equation, built-in in the FLOW3D code, assumes that: i)
flow is laminar and Darcian; ii) inertial forces, velocity heads, temperature gradients and chemical
concentration gradients are all negligible; iii) soil is linearly elastic and isotropic; iv) hydraulic
properties are not affected by volume changes; v) the air phase is continuous and always in
connection with the constant, external atmospheric pressure; vi) the hysteretic behaviour of the
SWRC is negligible; vii) the effect of soil compressibility on the storage of water under unsaturated
conditions is quite small.
3.1. Slope geometry and Boundary conditions
The 3D mesh was composed by 1820 elements and 2436 nodes, as shown (Figure 4b). The small
thickness layer, located at the top of the slope, was disregarded in order to avoid excessive mesh
discretization. However, in some analyses, its effect was indirectly incorporated by prescribing
pressure heads at nodes located at the top boundary.
The lateral boundaries, bottom of the slope, as well as the slope toe were considered as
impervious surfaces. At the slope surface, daily rainfall events were simulated by prescribing flow
velocities at the surface nodes, according to the amounts registered at a pluviometric station,
located 4km away from the slope
The time dependent characteristic of the transient flow through unsaturated soil requires the
knowledge of the antecedent distribution of matric suction (or soil moisture), previous to the
simulation period. Flow modeling assumed null suction at the slope surface and a progressive
increase of matric suction with depth. Below 2m-depth the soil suction was taken as constant and
equal to 200kPa. These values were assumed by evaluating both the water content profile of the
saprolitic soil (Figure 5) and the soil water retention curve (Figure 9).

16
3.2. Flow simulation results
Different scenarios of flow infiltration have been analyzed in an attempt to reproduce the full
saturation of the slope that was observed the day after the landslide, despite the inexistence of
groundwater within the soil mass (Gerscovich et al, 2006).
3.2.1 Case 1: Flow pattern predicted after 21 days of rainfall recorded in February, 1988.
The influence of rainfall intensity was initially evaluated by analysing flow patterns considering a
more intense rainfall that occurred few months before the landslide. In this period, the accumulated
rainfall was approximately 2 times greater than the registered in November, 1988, prior to the
landslide. The results, shown in Figure 10, indicated slight changes in pressure head distributions,
but no development of positive pore pressures within the soil slope. This pore-water pressure
distribution is in disagreement to field observation after the landslide and suggests that rain
infiltration solely would not be sufficient to produce significant pore-water changes.
-20.0
-17.5
-15.0
-12.5
-10.0
-2.0
+0.0
Rainfall Period Feb.02nd – Feb. 22nd
x
y
Legend:Pressure Head
(mH20)
Figure 10. Pressure head distribution at central section - Case 1
17
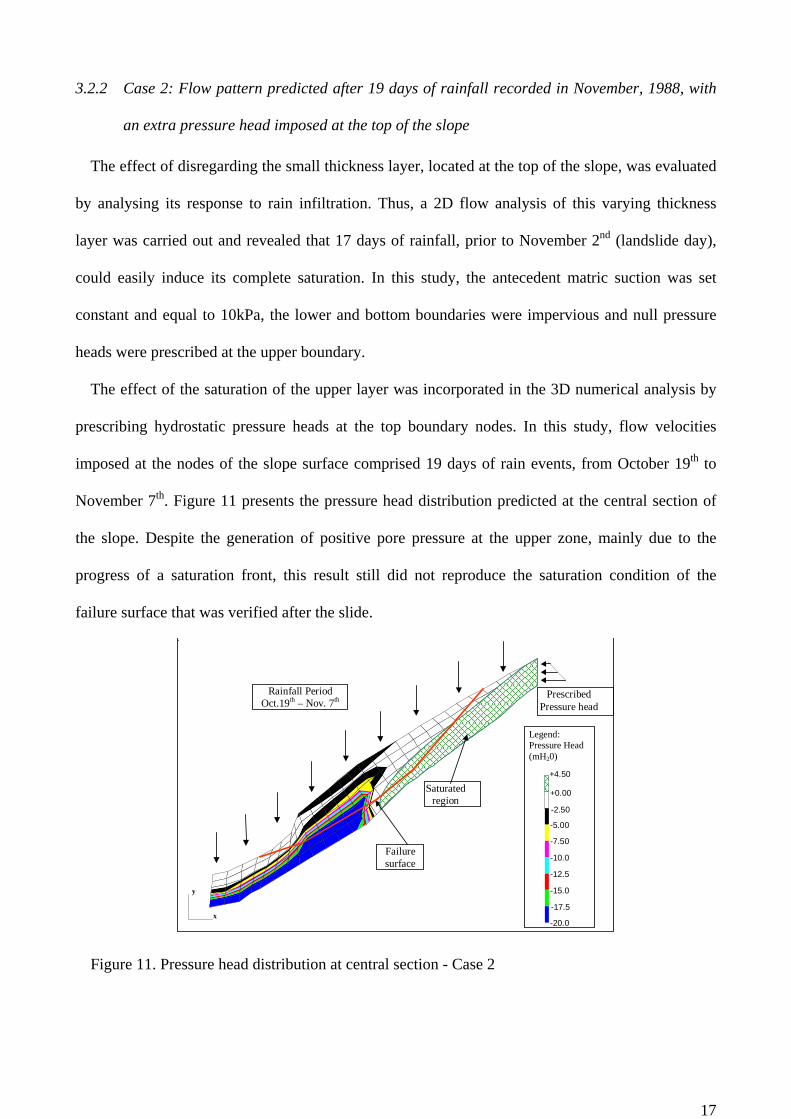
3.2.2 Case 2: Flow pattern predicted after 19 days of rainfall recorded in November, 1988, with
an extra pressure head imposed at the top of the slope
The effect of disregarding the small thickness layer, located at the top of the slope, was evaluated
by analysing its response to rain infiltration. Thus, a 2D flow analysis of this varying thickness
layer was carried out and revealed that 17 days of rainfall, prior to November 2nd (landslide day),
could easily induce its complete saturation. In this study, the antecedent matric suction was set
constant and equal to 10kPa, the lower and bottom boundaries were impervious and null pressure
heads were prescribed at the upper boundary.
The effect of the saturation of the upper layer was incorporated in the 3D numerical analysis by
prescribing hydrostatic pressure heads at the top boundary nodes. In this study, flow velocities
imposed at the nodes of the slope surface comprised 19 days of rain events, from October 19th to
November 7th. Figure 11 presents the pressure head distribution predicted at the central section of
the slope. Despite the generation of positive pore pressure at the upper zone, mainly due to the
progress of a saturation front, this result still did not reproduce the saturation condition of the
failure surface that was verified after the slide.
-20.0
-17.5
-15.0
-12.5
-10.0
-7.50
-5.00
-2.50
+0.00
+4.50
x
y
Rainfall PeriodOct.19th – Nov. 7th
Failure surface
Saturated region
Legend: Pressure Head (mH20)
Prescribed Pressure head
Figure 11. Pressure head distribution at central section - Case 2

18
An additional numerical analysis was carried out in an attempt to evaluate if geometry changes of
the slope, produced by the displacement of the soil mass after the landslide, could accelerate the
progression of the saturation front. This hypothesis was tested by performing a 2D numerical
simulation of the central section of the slope, including the small thickness layer, located at the top
of the slope. In this analysis, a high value of saturated hydraulic conductivity (ksat = 1) was used for
the soil above the failure surface and null pressure heads were prescribed at the nodes at failure
surface. The antecedent moisture conditions where equivalent to the ones predicted after 19 days of
rain simulation (Figure 11) and the remaining boundary conditions were unchanged. The results
confirmed that few hours were sufficient to nearly cause a saturation of the whole soil mass and
could be a feasible explanation for the saturation condition of the failure surface. However, it could
not explain the landslide, since it was likely that large positive pore-water pressures would be
required to reduce shear strength and cause the soil mass to fail.
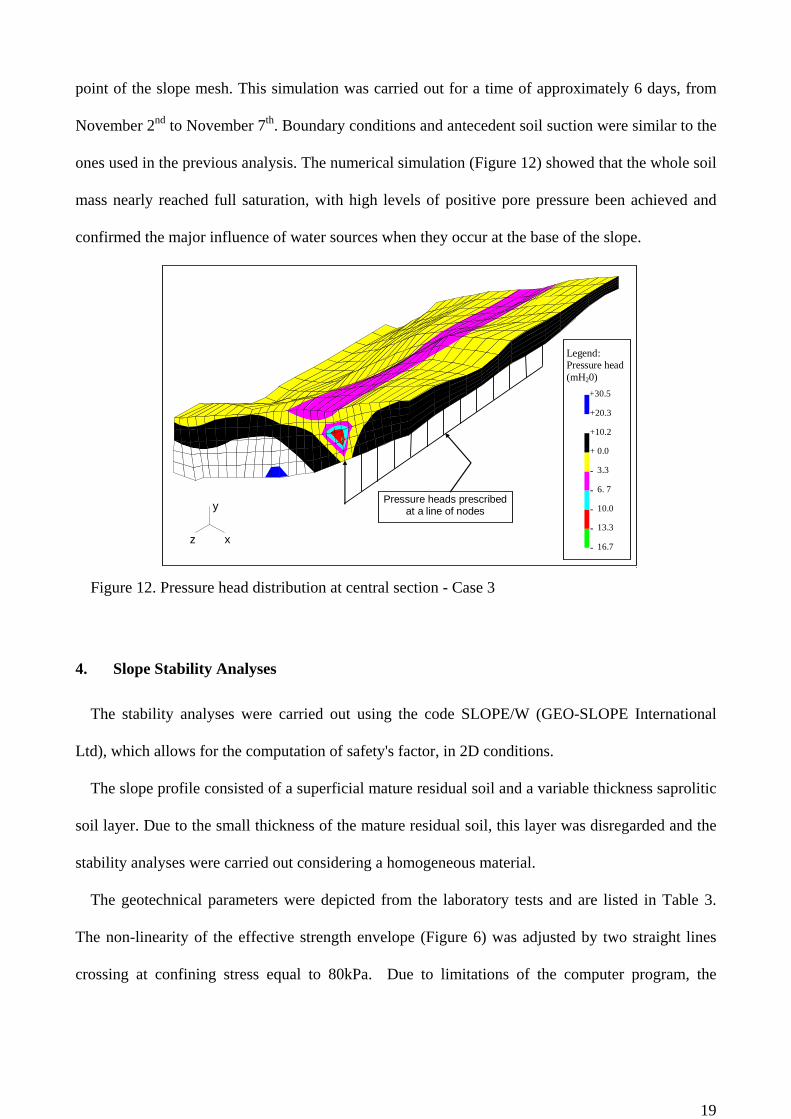
3.2.3 Case 3: Flow pattern generated by a rainfall period of 5 days prior to the landslide and
pressure heads prescribed at the top and at the base of the slope
Field investigations indicated the existence of a 4 to 10m thickness highly fractured rock layer at
the transition of the sound rock and saprolitic soil. Maxima piezometers measured water levels
restricted to this transition layer and confined to a small area.
The major role of the bedrock in generating high pore-water pressures have already been pointed
out by other researchers (Dietrich et al, 1986; Wilson, 1988; Vargas Jr. et al, 1990).On the other
hand, in the current engineering practice, it is very difficult not only to identify the existence of
layers with high transmissivities but also to conceive an adequate mathematical model.
Nevertheless, the influence of an eventual preferential flow through the fracture systems was
roughly evaluated by prescribing positive pressure heads at 13 nodes, located along a transversal
line of nodes at the base of the 3D mesh, as shown in Figure 12. At each node, the magnitude of
pressure head was equivalent to the vertical distance between the node coordinate and the highest
19
point of the slope mesh. This simulation was carried out for a time of approximately 6 days, from
November 2nd to November 7th. Boundary conditions and antecedent soil suction were similar to the
ones used in the previous analysis. The numerical simulation (Figure 12) showed that the whole soil
mass nearly reached full saturation, with high levels of positive pore pressure been achieved and
confirmed the major influence of water sources when they occur at the base of the slope.
- 16.7
- 13.3
- 10.0
- 6. 7
- 3.3
+ 0.0
+10.2
+20.3
+30.5
x
y
z
Pressure heads prescribed at a line of nodes
Legend: Pressure head (mH20)
Figure 12. Pressure head distribution at central section - Case 3
4. Slope Stability Analyses
The stability analyses were carried out using the code SLOPE/W (GEO-SLOPE International
Ltd), which allows for the computation of safety's factor, in 2D conditions.
The slope profile consisted of a superficial mature residual soil and a variable thickness saprolitic
soil layer. Due to the small thickness of the mature residual soil, this layer was disregarded and the
stability analyses were carried out considering a homogeneous material.
The geotechnical parameters were depicted from the laboratory tests and are listed in Table 3.
The non-linearity of the effective strength envelope (Figure 6) was adjusted by two straight lines
crossing at confining stress equal to 80kPa. Due to limitations of the computer program, the

20
unsaturated strength parameter (b) was assumed constant and equal to the average value of the
experimental results.
Table 3. Soil Parameters
Soil Parameter Stress Level (kPa) 80.0 >80.0
t (kN/m3) 17,5 17,5 c´ (kPa) 0 44,2 ' () 43,7 22 b () 25 25
It is worthwhile to mention that the strength parameters correspond to peak values, as the stress-
strain curves did not show any loss of strength for high strain levels.
The stability analyses were undertaken for the different scenarios of flow infiltration previously
described. The pore-water pressure distributions at the central section of the slope were
incorporated in the SLOPE/W program through a mesh of 46 nodes, as the program presents a
limitation of the maximum number of nodes (50 nodes). The effect of pore air pressure was
disregarded.
4.1. Case 1: Flow pattern predicted after 21 days of rainfall recorded in February, 1988.
Figure 13 displays the set of results of Morgenstern & Price method for a slip surface similar to
the one observed in situ (FS=4.1) and for a potential failure surface derived from a grid of rotation
centers (FS=3.5). The free search gave a lower factor of safety and the failure region was displaced
upward. Nevertheless, both analyses provided high factors of safety.

21
(a) Observed failure surface
Factor of Safety: 3.5Total Volume: 228.04
Distance (m)
0 10 20 30 40 50 60 700
10
20
30
40
50
600 10 20 30 40 50 60 70
Elevation (m
)
0
10
20
30
40
50
60
10
40
50
Ele
vatio
n (
m)
10 20 30 40 50 60 Distance (m)
0 0
30
Factor of Safety: 3.5
20
60
70
(b) Circular failure surface
Figure 13. Failure surfaces and Factors of Safety -Case 1
00
10
20
30
40
60
Factor of Safety: 4.05
50
Ele
vatio
n (
m)
10 20 30 40 50 60 70
Distance (m)
22
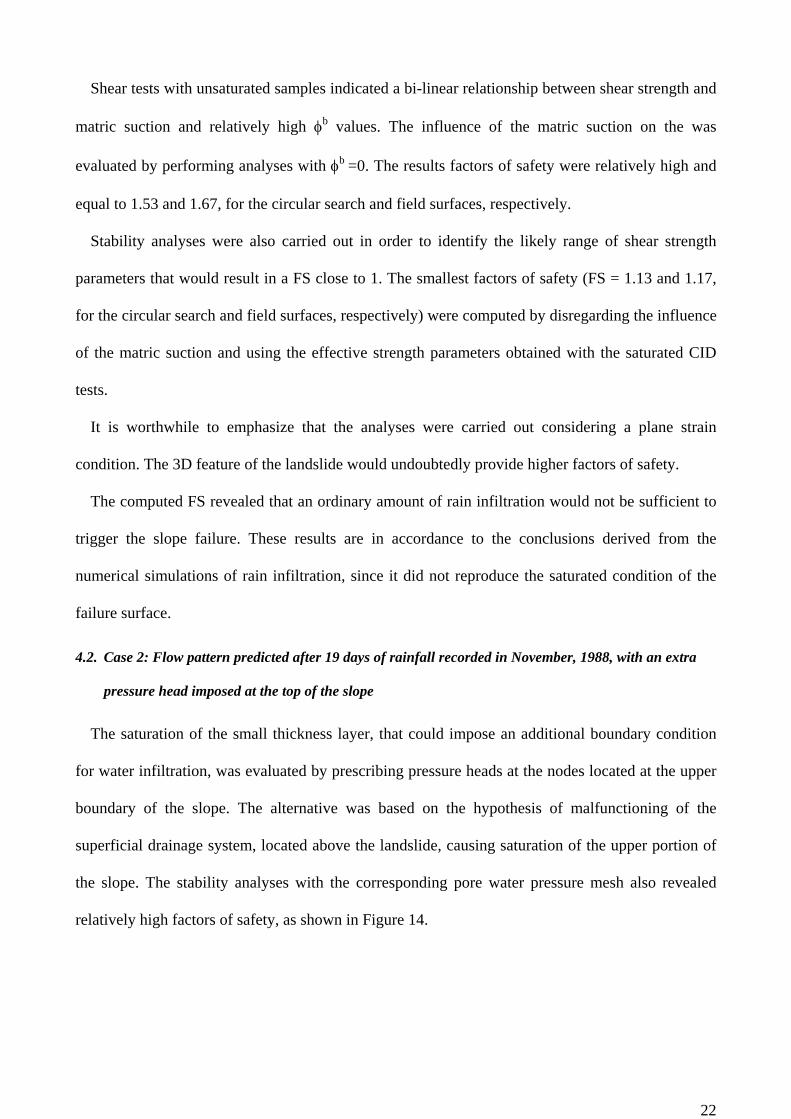
Shear tests with unsaturated samples indicated a bi-linear relationship between shear strength and
matric suction and relatively high b values. The influence of the matric suction on the was
evaluated by performing analyses with b =0. The results factors of safety were relatively high and
equal to 1.53 and 1.67, for the circular search and field surfaces, respectively.
Stability analyses were also carried out in order to identify the likely range of shear strength
parameters that would result in a FS close to 1. The smallest factors of safety (FS = 1.13 and 1.17,
for the circular search and field surfaces, respectively) were computed by disregarding the influence
of the matric suction and using the effective strength parameters obtained with the saturated CID
tests.
It is worthwhile to emphasize that the analyses were carried out considering a plane strain
condition. The 3D feature of the landslide would undoubtedly provide higher factors of safety.
The computed FS revealed that an ordinary amount of rain infiltration would not be sufficient to
trigger the slope failure. These results are in accordance to the conclusions derived from the
numerical simulations of rain infiltration, since it did not reproduce the saturated condition of the
failure surface.
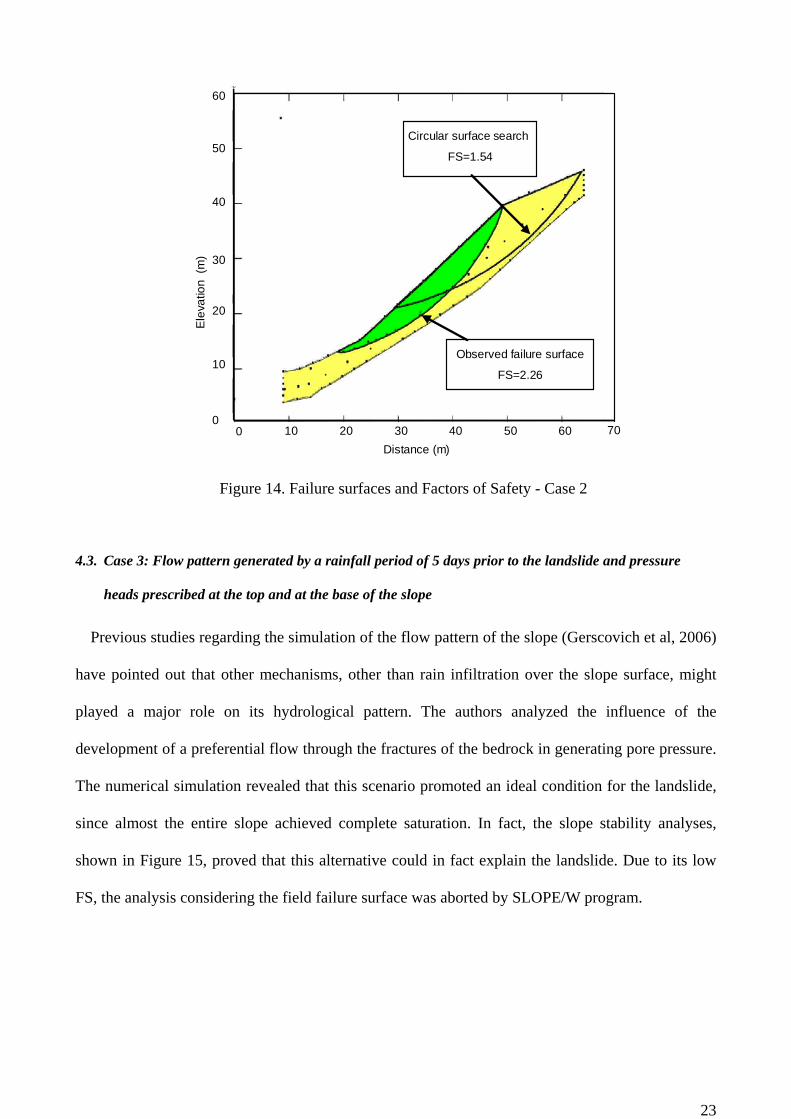
4.2. Case 2: Flow pattern predicted after 19 days of rainfall recorded in November, 1988, with an extra
pressure head imposed at the top of the slope
The saturation of the small thickness layer, that could impose an additional boundary condition
for water infiltration, was evaluated by prescribing pressure heads at the nodes located at the upper
boundary of the slope. The alternative was based on the hypothesis of malfunctioning of the
superficial drainage system, located above the landslide, causing saturation of the upper portion of
the slope. The stability analyses with the corresponding pore water pressure mesh also revealed
relatively high factors of safety, as shown in Figure 14.
23
Distance (m)
10 20 30 40 50 60
Circular surface search
FS=1.54
Observed failure surface
FS=2.26
0 0
10
20
30
40
60
Ele
vatio
n (
m)
50
70
Figure 14. Failure surfaces and Factors of Safety - Case 2
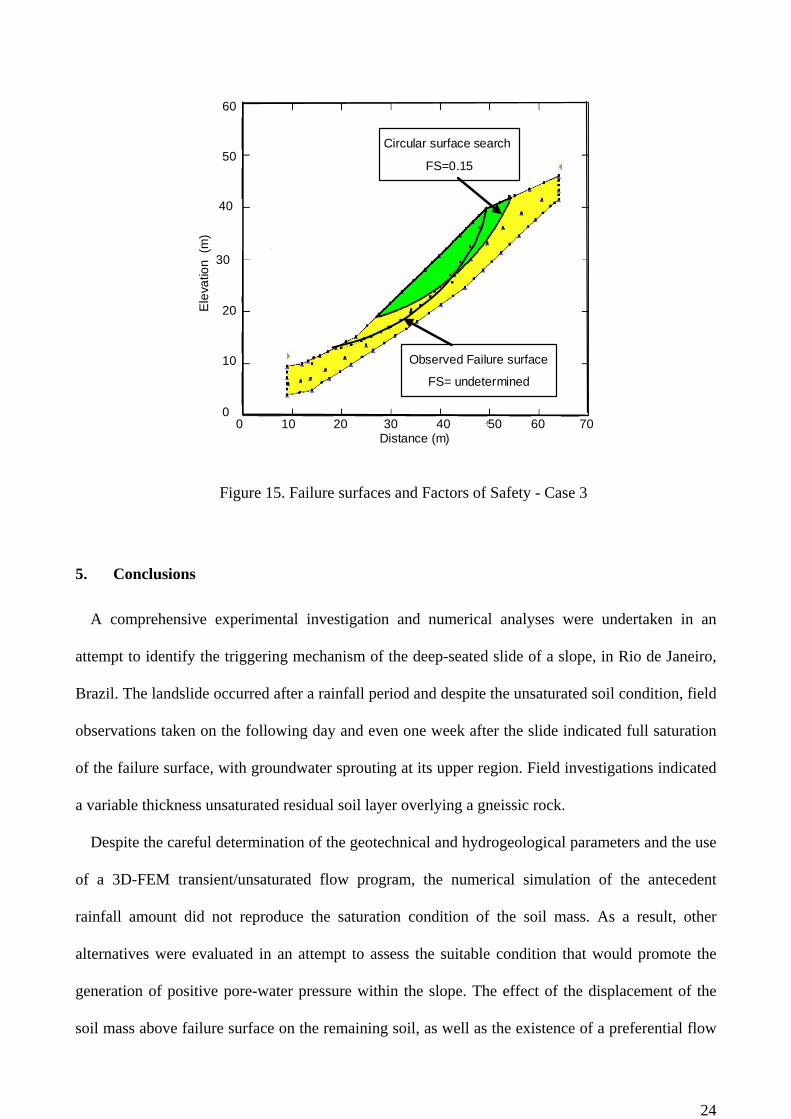
4.3. Case 3: Flow pattern generated by a rainfall period of 5 days prior to the landslide and pressure
heads prescribed at the top and at the base of the slope
Previous studies regarding the simulation of the flow pattern of the slope (Gerscovich et al, 2006)
have pointed out that other mechanisms, other than rain infiltration over the slope surface, might
played a major role on its hydrological pattern. The authors analyzed the influence of the
development of a preferential flow through the fractures of the bedrock in generating pore pressure.
The numerical simulation revealed that this scenario promoted an ideal condition for the landslide,
since almost the entire slope achieved complete saturation. In fact, the slope stability analyses,
shown in Figure 15, proved that this alternative could in fact explain the landslide. Due to its low
FS, the analysis considering the field failure surface was aborted by SLOPE/W program.
24
Circular surface search
FS=0.15
Observed Failure surface
FS= undetermined
10 20 30 40 50 60 0
10
20
30
40
60
Ele
vatio
n (
m)
50
Distance (m) 0 70
Figure 15. Failure surfaces and Factors of Safety - Case 3
5. Conclusions
A comprehensive experimental investigation and numerical analyses were undertaken in an
attempt to identify the triggering mechanism of the deep-seated slide of a slope, in Rio de Janeiro,
Brazil. The landslide occurred after a rainfall period and despite the unsaturated soil condition, field
observations taken on the following day and even one week after the slide indicated full saturation
of the failure surface, with groundwater sprouting at its upper region. Field investigations indicated
a variable thickness unsaturated residual soil layer overlying a gneissic rock.
Despite the careful determination of the geotechnical and hydrogeological parameters and the use
of a 3D-FEM transient/unsaturated flow program, the numerical simulation of the antecedent
rainfall amount did not reproduce the saturation condition of the soil mass. As a result, other
alternatives were evaluated in an attempt to assess the suitable condition that would promote the
generation of positive pore-water pressure within the slope. The effect of the displacement of the
soil mass above failure surface on the remaining soil, as well as the existence of a preferential flow

25
path though the fractured layer transition between the residual soil and the intact rock, revealed to
be feasible scenarios that could explain the hydrological condition after the landslide.
This paper presented the back-analysis of the landslide focusing stability approach, which is
much simpler than 3D saturated/unsaturated flow modeling and subjected to fewer uncertainties.
Triaxial and direct shear tests results, carried out on saturated samples extracted from the slip
surface and next to the landslide, revealed a minor influence of grain alignment and that the shear
strength parameters showed a reasonable agreement, despite the differences on the grain size
distribution. The strength envelope was reasonably fitted by a bi-linear curve.
Controlled suction direct shear tests, on samples from the slip surface, were carried out following
a wetting path. The soil the strength anisotropy could be disregarded, in agreement to the shear tests
on saturated samples. The results suggested a bi-linear relationship between the unsaturated
strength parameter (b) and matric suction; b was equal to 33o, for low suction values (up to
115kPa), and reduced to 20o, for higher values. This range is relatively high if compared to other
residual soils and, therefore, implies in a significant shear strength reduction due to an infiltration
process.
The stability analyses were carried out at the central section of the landslide, and FS were
computed for the actual failure surface geometry and for the potential surface, computed after a free
circular search. The numerical simulations of the different hydrological conditions were used to
build the pore water pressure meshes.
The back-analysis of the landslide revealed a FS higher than 3.5, independent of the stability
method and potential failure surface. This result implies that the rainfall amount that reached slope
surface was insufficient to trigger slope failure and is also in agreement to flow simulations, since
the predicted changes on matric suction were insufficient to produce a full saturation of the soil
mass. As a result, stronger changes on the pore-water pressure would be required to achieve FS
close to 1. The hypothesis of saturation of the failure surface due to the displacement of soil mass
above failure surface became unlikely, as well.
26
The simulation of a preferential flow through the fractured region between the residual soil and
the bedrock, in addition to the rainfall, resulted on a favorable condition to achieve the hydrological
pattern observed on the site. In fact, the stability analyses proved that this alternative could be used
to identify the main triggering mechanisms of the landslide
The results herein presented emphasize that, despite the development of experimental and
numerical techniques to address the behavior of unsaturated soils, the understanding of the complex
phenomenon of rainstorm-induced landslides is still a challenge among the geotechnical engineers.
Besides, except for extreme and unpredictable rainfall amounts, landslides are triggered by a
combination of mechanisms. Geotechnical engineers must call attention to the complexity of
landslides in unsaturated residual soils, and always try to answer a simple question that many times
arises: why the landslide did not occurred during a more intense event or why it did not occurred
few meters away?
6. Acknowledgements
The authors acknowledge International Development Center (IDRC), Canada, and National
Council for Research (CNPq) and FAPERJ, Brazil, for their financial support. The authors are also
grateful to all graduate students that participated in this research project.
7. References
Au, S.W.C. 1998. Rain-induced slope instability in Hong Kong. Engineering Geology, 51(1), 1-36.
Brand, E.W. 1985. Geotechnical engineering in tropical residual soils. Proceedings of the 1st
International Conference on Geomechanics in Tropical Lateritic and Saprolitic Soils, Brasília,
Brazil, vol. 3, pp. 23-100.
Capra, L., Lugo-Hubp, J. and Borselli, L. 2003. Mass movements in tropical volcanic terrains: the
case of Teziulán (Mexico) – Engineering Geology, 69 pp.359-379.
27
Carrillo, C.W.; Fonseca, E.C. & de Campos, T.M.P. 1994. Suction controlled direct shear device,
2nd Symposium on Unsaturated Soils, Recife, Brazil, pp 67-78 (in Portuguese).
Costa Nunes, A.J.; Couto Fonseca, A.M.M.C; Couto Fonseca, de M.; Fernandes, C.E. a& Craizer,
W. 1989. Intense rainstorm and ground slides. Proceedings of the 12th Int. Conf. Soil Mech. and
Foundation Engineering, vol.3, pp.1627-1630.
de Campos, T.M., Andrade, M.H.N, Gerscovich, D.M.S. & Vargas JR., E.A. 1994. Analysis of the
Failure of an Unsaturated Gneissic Residual Soil Slope in Rio de Janeiro, Brazil - 1st. Pan
American Symposium of Landslides - Guayaquil, Ecuador, vol.I, pp.201-213.
Dietrich, W.E.; Wilson, C.J. & Reneau, S L. 1986. Hollows, colluvium, and landslides in soil
mantled landscapes. Hillslope Processes, edited by A.D. Abrahams, Allen & Unwin Ltd, pp.361-
368.
Fonseca, E.C. 1991. Direct shear tests with suction control. MSc Thesis. Catholic University of Rio
de Janeiro (in Portuguese).
Fredlund, D.G.; Morgenstern, N.R. e Widger, R.A. 1978. The Shear Strength of Unsaturated Soils -
Canadian Geotechnical Jr., vol.15, pp 228-232.
Gasmo, J. M., Rahardjo, H. and Leong, E. C. 2000. Infiltration effect son stability of a residual soil
slope – Computers and Geotechnics, 26, pp.145-165.
GEO-SLOPE International Ltd. SLOPE/W for slope stability analysis, version 5.0
Gerscovich D.M.S.; Campos T.P.P.; Vargas Jr E.A. 2006. On the evaluation of unsaturated flow in
a residual soil slope in Rio de Janeiro Brazil. Engineering Geology. ISSN /0013-7952, v.88,
p.23 - 40, 2006.
Ho, D.Y.F e Fredlund, D.G. 1982. The Increase in Shear Strength due to Soil Suction for two Hong
Kong Soils - ASCE Geotechnical Conference on Engineering Construction in Tropical and
Residual Soils, Honolulu, Hawaii, Janeiro, pp.263-295.
Kim, J. Jeong, S. Park, S. and Sharma, J. 2004. Influence of Rainfall-induced wetting on the

28
stability off slopes in weathered soils – Engineering Geology, 75, pp.251-262.
Rahardjo, H. ; Lim, T.T.; Chang, M.f. and Fredlund, D.G. 1995. Shear strength characteristics of a
residual soil – Canadian Geotechnical Journal, 32, pp 60-77.
Reynolds, W.D. & Elrick, D.E. 1987. A laboratory and numerical assessment of the Guelph
permeameter method. Soil Science144 (4), 282-292.
Tekinsoy, M. A.; Kayadelen, C.; Keskin, M.S.; Soylemez M. 2004. An equation for predicting
shear strength envelope with respect to matric suction - Computers and Geotechnics, 31, pp 589-
593
Vargas Jr., E. A.; Velloso, R.C., de Campos, T.M.P. & Costa Filho, L.M. 1990. Saturated-
unsaturated analysis of water flow in slopes of Rio de Janeiro, Brazil. Computers and
Geotechnics, 10 (3), 247-261.
Vargas Jr., E. A.; Costa Filho, L. M. & Prado Campos, L. E. 1986. A study of the relationship
between stability of the slopes in residual soils and rain intensity. International Symposium on
Environmental Geotechnology, ed. Fang. Envo, pp491-500.
Wang, G. and Sassa, K. 2003. Pore-pressure generation and movement of rainfall-induced
landslides: effects of grain size and fine-particle content - Engineering Geology, 69, pp 109-
125.
Wilson, C.J. 1988. Runoff and pore pressures in hollows. PhD Thesis, California University,
Berkeley.
Wolle, C.M. & Hachich, W. 1989. Rain-induced landslides in south-eastern Brazil. Proceedings of
the 12th Int. Conf. Soil Mech. and Foundation Engineering, vol.3, pp.1639-1644.


