ISSN: 2455-2631 © May 2016 IJSDR | Volume 1, Issue 5
IJSDR1605055 International Journal of Scientific Development and Research (IJSDR) www.ijsdr.org 284
Functional and Structural Evaluation of Urban Road
Sections in Rajkot City 1Mr. Jay J. Parekh,
2Dr. Yogesh U. Shah
1PG Transportation Engineering Student,
2Associate Professor
Civil Engineering Department,
Marwadi Education Foundation’s Faculty, Rajkot, India
ABSTRACT - Urban pavement sections are generally
prioritized without taking pavement maintenance as a
priority which leads to ineffectiveness in the cost of
maintenance works. To achieve best results for the
maintenance work parameters like Pavement
Serviceability Rating (PSR), Road Class, Road Quality,
Traffic Volume & Structural Adequacy are considered.
Total five arterial sections for the 6 km length of stretch
in both ways were considered. Parameters were
functionally and structurally evaluated. The
questionnaire has been prepared for the pairwise
comparison of identified parameters and the weightage
will be calculated using Expert Choice using AHP
technique. A final priority index will be calculated and
all sections will be ranked based on this index for
maintenance prioritization.
INTRODUCTION
Road Maintenance is one of the important components of
the entire road system. The maintenance operations involve
the assessment of road condition, diagnosis of the problem
and adopting the most appropriate maintenance steps. Even
if the highways are well designed and constructed, they may
require maintenance; the extent which will depend on
several factors including the pavement type. Various types
of failures in pavements ranging from minor and localized
failure to major and general failures do take place.
Pavement Maintenance is the preservation, repair and
restoration of both the paved surface and the base of
foundation. Roadway surfaces should be true to type, cross-
section, alignment and grade, as originally constructed or
subsequently reconstructed, or resurfaced in order to
provide the highway user with a safe, convenient and
smooth riding surfaces at all times.
LITERATURE REVIEW
1. Priority analysis is a multi-criteria process that
determines the best ranking list of candidate sections for
maintenance based on several factors. In this paper, two
methods for priority ranking of road maintenance, viz. (a)
ranking based on subjective rating and (b) ranking based on
economic indicator are evaluated. The subjective ranking
was done using maintenance priority index which is a
function of road condition index, traffic volume factor,
special factor and drainage factor. The second ranking
method was based on economic indicator in which
NPV/Cost ratio was calculated for each pavement section
using the HDM-4 software.
The prioritization methods can be further divided as ranking
methods, optimization methods, Artificial Intelligence
Technique and Analytical Hierarchy Process method. In this
paper first the study area was identified, then various field
surveys were carried out in which inventory data, crust data
and cost data are collected. After that traffic volume count,
structural analysis by Benkelman beam deflection method
and functional evaluation by fifth wheel bump integrator are
carried out. From the evaluation, priority ranking by MPI
method was done. Urgency Index (UI) was carried out by
multiplying degree and extent. Weights were then analyzed
to the assigned distresses. From the above analysis, Road
Condition Index (RCI), Traffic Volume Factor (TVF),
Special Factor (SF), Drainage Factor (DF) were carried out.
From the determination of MPI values, prioritization
ranking using the HDM-4 software was done. HDM-4
application modules were prepared from which input
parameters were collected and the HDM-4 model was
adopted to the Indian conditions. After that further analysis
and comparison of HDM-4 and MPI ranking method were
done. From the above analysis it was concluded the
complexity is added to the calculations in complex network
optimization models as a prioritization methods. Ranking
based methods requires less data than other methods. The
main aim of this paper was to build knowledge about
pavement maintenance prioritization methods.
2. The analytic hierarchy process (AHP) is a structured
technique for dealing with complex decisions that was
developed by Thomas L. Saaty in the 1980 year. It provides
a comprehensive and rational framework for structuring a
decision problem, for representing and quantifying its
elements, for relating those elements to overall goals, and
for evaluating alternative solutions. The base of this model
is comparing variables by pair wise by Matrix relationship.
In this way, pair wise of the effective variables on the
concrete Pavement were considered and based on relative
weights the output was extent. In the present research,
combination of Indexing system Method with Analytical
Hierarchy Process has been applied to assess the prioritize
of concrete Pavement. By this process, classification and
qualification of the numerous types of concrete Pavement
would be accessible The findings of the research show that
the Continuous Reinforced Concrete Pavement (CRCP)
with (0/051) point promotes in first rank among 4 studied
Pavements and thus it is the most appropriate Pavement, in

ISSN: 2455-2631 © May 2016 IJSDR | Volume 1, Issue 5
IJSDR1605055 International Journal of Scientific Development and Research (IJSDR) www.ijsdr.org 285
contrast Jointed Plain Concrete Pavement (JPCP) with
(0/15) point goes down to the last rank. Prestressed
Concrete Pavement (PCP) and Jointed Reinforced Concrete
Pavement (JRCP) with (0/015,0/017) points are located in
next ranks.
3. For road pavement maintenance and repairs prioritization,
a multiattribute approach that compares fuzzy Analytical
Hierarchy Process (AHP) and fuzzy Technique for Order
Preference by Ideal Situation (TOPSIS) is evaluated. The
pavement distress data was collected through empirical
condition surveys and rating by pavement experts. In
comparison to the crisp AHP, the fuzzy AHP and fuzzy
TOPSIS pair wise comparison techniques are considered to
be more suitable for the subjective analysis of the pavement
conditions for automated maintenance prioritization. From
the case study results, four pavement maintenance
objectives were determined as road safety, pavement surface
preservation, road operational status and standards and road
aesthetics, with corresponding depreciating significance
weights of [W = 0.37, 0.31, 0.22, 0.10]T. The top three
maintenance functions were identified as Thin Hot Mix
Asphalt (HMA) overlays, resurfacing and slurry seals,
which were as a result of pavement cracking, potholes,
raveling and patching, while the bottom three cape seal,
micro surfacing and fog seal. The two methods gave nearly
the same prioritization ranking. In general, the fuzzy AHP
approach tended to overestimate the maintenance
prioritization ranking as compared to the fuzzy TOPSIS.
From this paper it was concluded that Fog seal, Micro
surfacing, Slurry seal, Cape seal, Chip seal, Thin HMA
overlay and resurfacing. Fuzzy TOPSIS perform slightly
better than fuzzy AHP. Also fuzzy AHP tend to
overestimate prioritization ranking process.
4. One of the innovative approach for maintaining and
rehabilitating the highways is to develop and implement
simple pavement maintenance management system
(PMMS). A simple priority ranking module that provides a
systematic procedure to prioritize road pavement sections
for improvement and selection of suitable maintenance
strategies depending upon the budget is developed. The
priority ranking methodology is based on priority index
concept, which makes use of overall distress index model
and traffic adjustment factors. It involves a process of
acquisition of expert opinion through a series of
questionnaires and the derivation of weighted average
condition measures. Important aspects of the methodology
are discussed and the index calculation technique is
demonstrated. In the priority ranking module, pavements in
a given jurisdiction are prioritized based on an overall
pavement performance index derived from a combination of
pavement surface distresses, traffic information and expert
opinion. The proposed approach has demonstrated its
reliability and ease of use in the example application.
5. Pavement deterioration is a complex process. It involves
not only structural fatigue but also many functional
distresses of pavement. It results from the interaction
between traffic, climate, material and time. Deterioration is
the term used to represent the change in pavement
performance overtime. The ability of the road to satisfy the
demands of traffic and environment over its design life is
referred to as performance. Due to the great complexity of
the road deterioration process, performance models are the
best approximate predictors of expected conditions. In this
study main distresses were identified from the selected road
stretches. Regression models are then developed using SPSS
(Statistical packages for social sciences) package. T test is
used to check the reliability of the model.
The study involves Data collection, structural and functional
evaluation, condition and roughness surveys, Analysis like
modified structural number evaluation, Riding Comfort
Index evaluation, Regression models, deflection, Pothole
progression, roughness progression and validation of these
models. Also it was concluded that SPSS values were nearer
to observed values.
6. Prioritizing competing transport infrastructure investment
schemes is an essential pre-requisite at all levels of transport
decision making. All countries face the basic economic
problem of allocating scarce resources among competing
uses in a way that maximizes the social welfare. Therefore it
is very essential to prioritise the projects to ensure that
resources are focused appropriately. This paper introduce a
Multi Criteria prioritization model based on novel set of
factors like Growth Centers, Road Utilization, Connectivity,
Accessibility, Backwardness and the amount of Commercial
Vehicles using the road, to identify the roads to be improved
which will result in socio-economic growth of the entire
region. The weight of each factors in Composite Index
calculation have been formulated using Analytical
Hierarchy Process (AHP). Further this prioritization model
has been used for prioritizing 20 Major District Roads
(MDRs) in the state of Kerala, India. In this paper
composite index were found out.
7. A primary purpose of a pavement management system
(PMS) is to provide information so that roadway
improvements can be priority ranked. Ideally, prioritization
is a consistent and justifiable process. It should involve
minimizing life cycle costs subject to minimum levels of
serviceability and budget constraints. Prioritization is a
complicated process that requires sound engineering
judgment and a good understanding of local conditions.
Current fiscal crises and rising roadway improvement costs
have made prioritization decisions more important than
ever. Priority analysis is a systematic process that
determines the best ranking list of candidate sections for
maintenance based on specific criteria such as pavement
condition, traffic level, pavement functions, etc. Various
methods are used for priority analysis ranging from simple
listing based on engineering judgment to true optimization
based on mathematical formulations. This paper examines
theoretical and pragmatic problems surrounding the
prioritization process. This study report a detailed review of
various prioritization techniques and models developed for
flexible pavements at global level. This will help in
evaluating the usefulness of the various models in some
particular condition having the similar prioritization
parameters. A discussion on the limitations of the different
models is also given in this study.
ISSN: 2455-2631 © May 2016 IJSDR | Volume 1, Issue 5
IJSDR1605055 International Journal of Scientific Development and Research (IJSDR) www.ijsdr.org 286
AHP is the best method from the above discussions to
prioritize the pavement maintenance. Priority index for the
parameters is essential for the assessment of the distresses
and conditions of the sections undertaken. Also functional
and structural condition surveys are necessary and for the
assessment of the reliability of surveys, expert choice
software for AHP is necessary.
STUDY AREA
THE INVENTORY DETAILS OF SELECTED STUDY AREA
Sr.
No.
Name of
Section
Starting Point Ending Point Length Carriageway
Width
Median
Width
Shoulder
Width
Footpath
Width
1 Nana Mava
Main Road
Nana Mava
Circle
Laxminagar
Underpass
1 Km 7 0.7 2 2
2 Nana Mava
Main Road
Laxminagar
Underpass
Nana Mava
Circle
1 Km 7 0.7 2.8 2
3 Raiya Road Raiya Circle Kishanpara
Circle
1 Km 10.7 0.9 N/a 1.3
4 Raiya Road Kishanpara
Circle
Raiya Circle 1 Km 11 0.9 N/a 3.3
5 Dr. Yagnik
Road
Jilla Panchayat
Circle
Ramakrishna
Ashram
1 Km 6.2 0.4 N/a 1.3
6 Dr. Yagnik
Road
Jilla Panchayat
Circle
Ramakrishna
Ashram
1 Km 6.2 0.4 N/a 1.3
N/a – Not Applicable
All roads are arterial with flexible road surface and paved shoulder each carrying 4-lanes and pedestrian footpaths. There is no
availability of side drains.
The details of study area includes the name of the section, starting and ending points of selected stretch, number of lanes,
distance, road category, width of carriageway of road and median, surface of road, availability of shoulder and their types,
shoulder width, footpath width if footpaths are available and other cross section details.
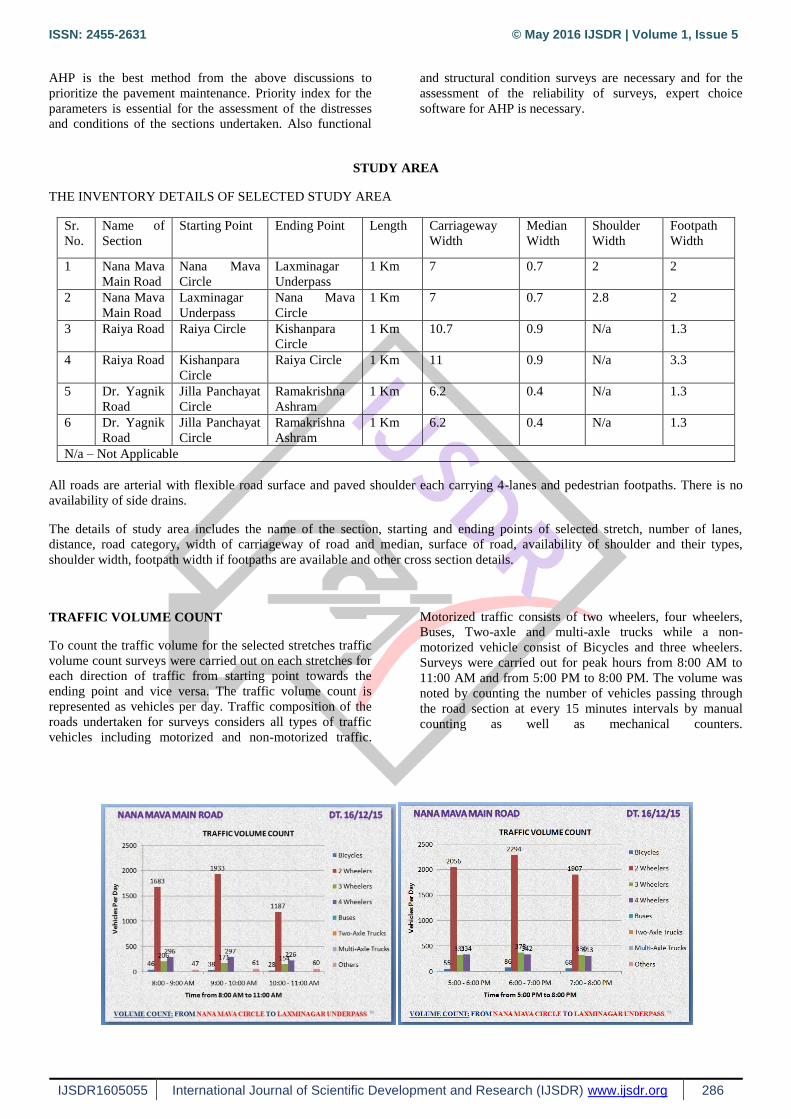
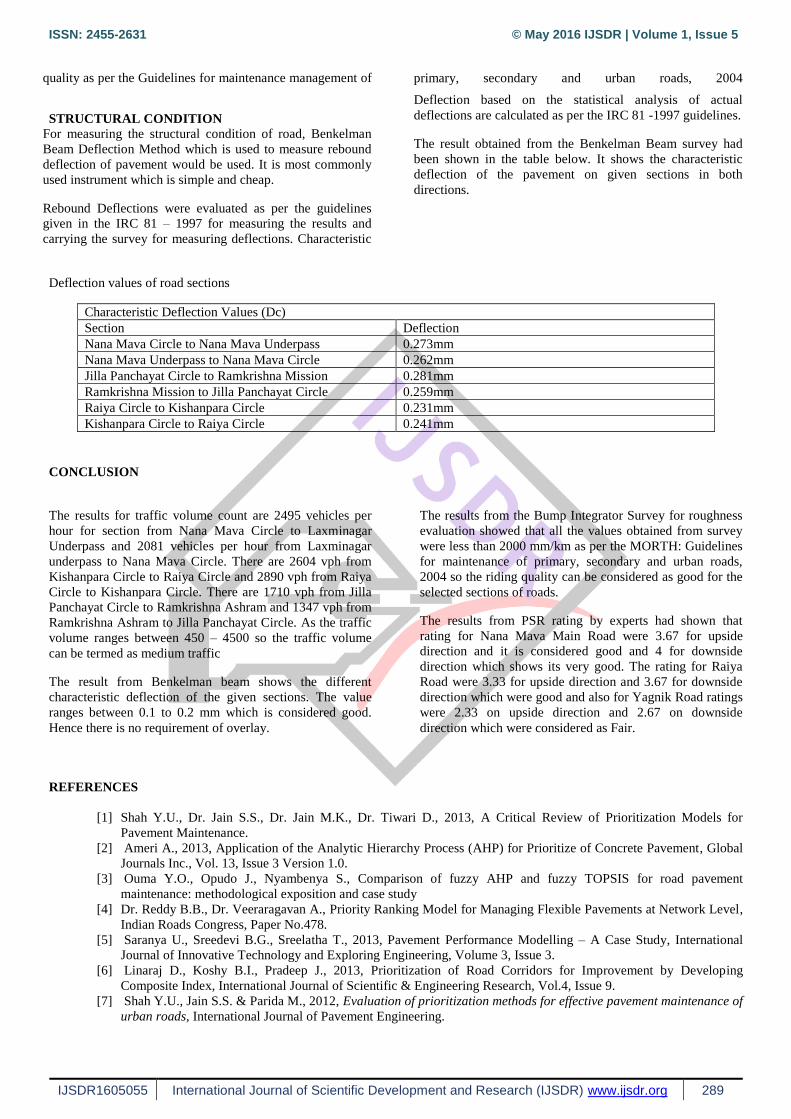
TRAFFIC VOLUME COUNT
To count the traffic volume for the selected stretches traffic
volume count surveys were carried out on each stretches for
each direction of traffic from starting point towards the
ending point and vice versa. The traffic volume count is
represented as vehicles per day. Traffic composition of the
roads undertaken for surveys considers all types of traffic
vehicles including motorized and non-motorized traffic.
Motorized traffic consists of two wheelers, four wheelers,
Buses, Two-axle and multi-axle trucks while a non-
motorized vehicle consist of Bicycles and three wheelers.
Surveys were carried out for peak hours from 8:00 AM to
11:00 AM and from 5:00 PM to 8:00 PM. The volume was
noted by counting the number of vehicles passing through
the road section at every 15 minutes intervals by manual
counting as well as mechanical counters.

ISSN: 2455-2631 © May 2016 IJSDR | Volume 1, Issue 5
IJSDR1605055 International Journal of Scientific Development and Research (IJSDR) www.ijsdr.org 287
Fig. 4.2.1 Nana Mava Main Road traffic volume
Fig. 4.2.2 Raiya Road traffic volume

ISSN: 2455-2631 © May 2016 IJSDR | Volume 1, Issue 5
IJSDR1605055 International Journal of Scientific Development and Research (IJSDR) www.ijsdr.org 288
Fig. 4.2.3 Yagnik Road traffic volume
CONDITION SURVEY
Functional Condition Data would be collected by walk
survey associated with actual measurements. The length and
width of each section of roads are measured with tape. Also
Pavement Serviceability Rating was considered in which
experts associated for survey were selected. Three experts
gave the ratings for the section based on the visual
inspection of the road sections considering the distress
conditions. The rating was done on scale of 0-5, 0 indicating
very poor and 5 indicating very good condition of pavement
section as below:
Sections Direction Rater 1 Rater 2 Rater 3 Avg.
Rating
Road Condition
Nana Mava Main Road Upside 4 3 4 3.67 Good
Downside 4 4 4 4.00 Very Good
Raiya Road Upside 3 4 3 3.33 Good
Downside 4 4 3 3.67 Good
Yagnik Road Upside 2 2 3 2.33 Fair
Downside 3 2 3 2.67 Fair
ROUGHNESS SURVEY
For the riding quality of pavement,
roughness or unevenness is considered and it is measured by
bump integrator which is most commonly used road
roughness measurement device. The readings by bump
integrator shown at Nana Mava Main Road were 760mm/km
at up side and 970mm/km at down side. The readings at
Raiya Road were 840mm/km at upside and 1180mm/km at
downside. And the readings at Yagnik Road were
630mm/km at upside and 650mm/km at downside. The
above readings taken on urban roads have shown that all the
roads are below 2000mm/km so they have good riding
ISSN: 2455-2631 © May 2016 IJSDR | Volume 1, Issue 5
IJSDR1605055 International Journal of Scientific Development and Research (IJSDR) www.ijsdr.org 289
quality as per the Guidelines for maintenance management of primary, secondary and urban roads, 2004
STRUCTURAL CONDITION
For measuring the structural condition of road, Benkelman
Beam Deflection Method which is used to measure rebound
deflection of pavement would be used. It is most commonly
used instrument which is simple and cheap.
Rebound Deflections were evaluated as per the guidelines
given in the IRC 81 – 1997 for measuring the results and
carrying the survey for measuring deflections. Characteristic
Deflection based on the statistical analysis of actual
deflections are calculated as per the IRC 81 -1997 guidelines.
The result obtained from the Benkelman Beam survey had
been shown in the table below. It shows the characteristic
deflection of the pavement on given sections in both
directions.
Deflection values of road sections
Characteristic Deflection Values (Dc)
Section Deflection
Nana Mava Circle to Nana Mava Underpass 0.273mm
Nana Mava Underpass to Nana Mava Circle 0.262mm
Jilla Panchayat Circle to Ramkrishna Mission 0.281mm
Ramkrishna Mission to Jilla Panchayat Circle 0.259mm
Raiya Circle to Kishanpara Circle 0.231mm
Kishanpara Circle to Raiya Circle 0.241mm
CONCLUSION
The results for traffic volume count are 2495 vehicles per
hour for section from Nana Mava Circle to Laxminagar
Underpass and 2081 vehicles per hour from Laxminagar
underpass to Nana Mava Circle. There are 2604 vph from
Kishanpara Circle to Raiya Circle and 2890 vph from Raiya
Circle to Kishanpara Circle. There are 1710 vph from Jilla
Panchayat Circle to Ramkrishna Ashram and 1347 vph from
Ramkrishna Ashram to Jilla Panchayat Circle. As the traffic
volume ranges between 450 – 4500 so the traffic volume
can be termed as medium traffic
The result from Benkelman beam shows the different
characteristic deflection of the given sections. The value
ranges between 0.1 to 0.2 mm which is considered good.
Hence there is no requirement of overlay.
The results from the Bump Integrator Survey for roughness
evaluation showed that all the values obtained from survey
were less than 2000 mm/km as per the MORTH: Guidelines
for maintenance of primary, secondary and urban roads,
2004 so the riding quality can be considered as good for the
selected sections of roads.
The results from PSR rating by experts had shown that
rating for Nana Mava Main Road were 3.67 for upside
direction and it is considered good and 4 for downside
direction which shows its very good. The rating for Raiya
Road were 3.33 for upside direction and 3.67 for downside
direction which were good and also for Yagnik Road ratings
were 2.33 on upside direction and 2.67 on downside
direction which were considered as Fair.
REFERENCES
[1] Shah Y.U., Dr. Jain S.S., Dr. Jain M.K., Dr. Tiwari D., 2013, A Critical Review of Prioritization Models for
Pavement Maintenance.
[2] Ameri A., 2013, Application of the Analytic Hierarchy Process (AHP) for Prioritize of Concrete Pavement, Global
Journals Inc., Vol. 13, Issue 3 Version 1.0.
[3] Ouma Y.O., Opudo J., Nyambenya S., Comparison of fuzzy AHP and fuzzy TOPSIS for road pavement
maintenance: methodological exposition and case study
[4] Dr. Reddy B.B., Dr. Veeraragavan A., Priority Ranking Model for Managing Flexible Pavements at Network Level,
Indian Roads Congress, Paper No.478.
[5] Saranya U., Sreedevi B.G., Sreelatha T., 2013, Pavement Performance Modelling – A Case Study, International
Journal of Innovative Technology and Exploring Engineering, Volume 3, Issue 3.
[6] Linaraj D., Koshy B.I., Pradeep J., 2013, Prioritization of Road Corridors for Improvement by Developing
Composite Index, International Journal of Scientific & Engineering Research, Vol.4, Issue 9.
[7] Shah Y.U., Jain S.S. & Parida M., 2012, Evaluation of prioritization methods for effective pavement maintenance of
urban roads, International Journal of Pavement Engineering.


