
Future HIV Financing Direction:Reality Check
Brian Rettmann, PEPFAR Country Coordinator

Modeled Impact of New Infections: the Global AIDS Response
Scaling up VMMC, Treatment, PMTCT, and Condoms Programs has Drastically Reduced New HIV Infections
Source: Stover modeling for the Office of the U.S. Global AIDS Coordinator, 2014

National Epidemiological Context
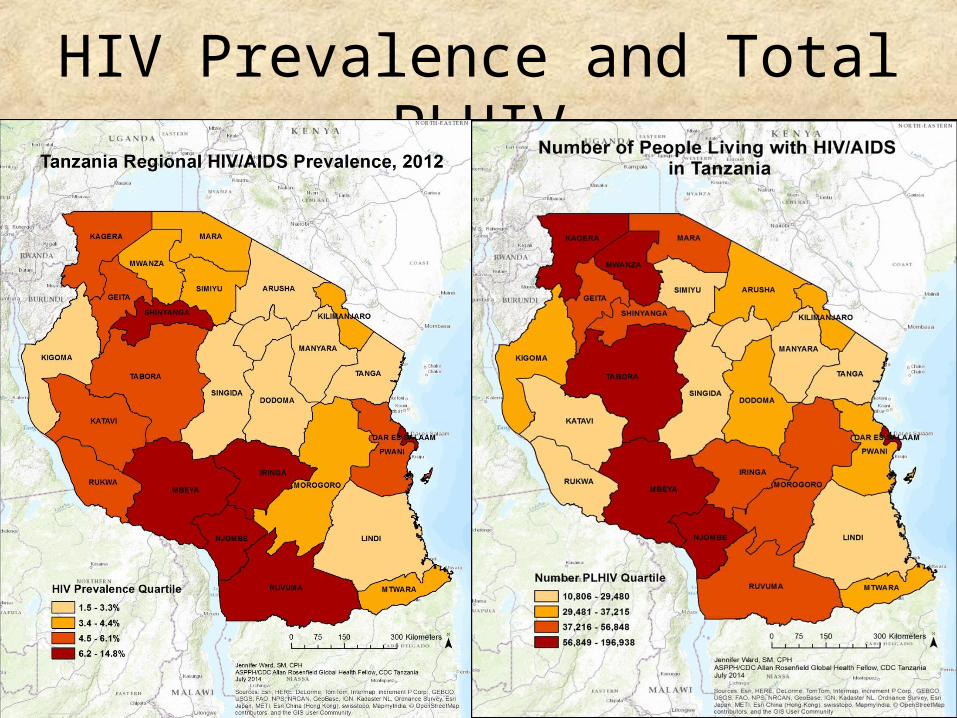
HIV Prevalence and Total PLHIV
4

Treatment Coverage/Gaps (PEPFAR data only)
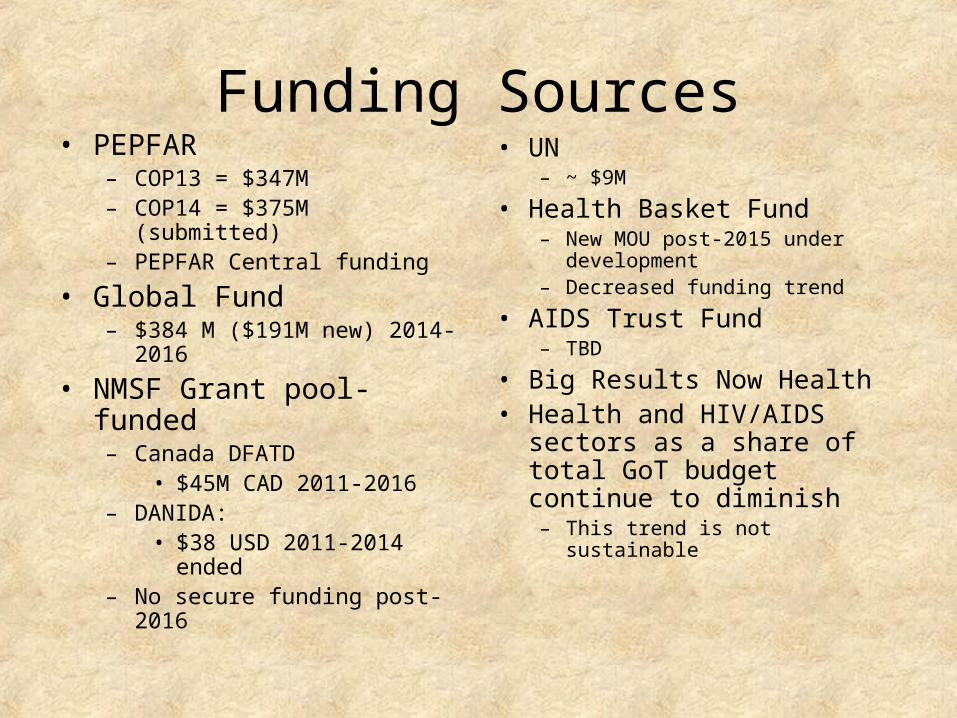
Funding Sources• PEPFAR
– COP13 = $347M– COP14 = $375M (submitted)– PEPFAR Central funding
• Global Fund– $384 M ($191M new) 2014-2016
• NMSF Grant pool-funded– Canada DFATD
• $45M CAD 2011-2016 – DANIDA:
• $38 USD 2011-2014 ended – No secure funding post-2016
• UN – ~ $9M
• Health Basket Fund– New MOU post-2015 under
development– Decreased funding trend
• AIDS Trust Fund– TBD
• Big Results Now Health• Health and HIV/AIDS sectors as
a share of total GoT budget continue to diminish – This trend is not sustainable


Focusing on Right Things: Core Activities to Maximize Epidemic Impact
• Combination Prevention (PMTCT, ART, Condoms, VMMC)
• Effective/targeted other prevention interventions• Holistic services for families including OVCs• Strengthening Health Systems as specifically required
to support the core activities – Human resources for health, financing, procurement & supply chain, lab, and
strategic information
• Appropriate resources for disproportionately effected, neglected & hard to reach populations – Young women and children– Key populations: MSM, FSW, PWID

Focusing on Right Places
• Symmetric geographic alignment of program investment and epidemiology
• Saturation in the highest burden areas (regions, districts, hotspots) based on:– prevalence and number of PLHIV – greatest unmet need for services
o Among general population/specific neglected populations
• Withdrawal from zero and very low volume facilities – Discontinue (HTC) or maintain (treatment and PMTCT) in
order to prioritize support to higher volume facilities and communities with greatest need

Measuring Program Efficiency: HTCPreliminary Analysis Undergoing Review and Revisions
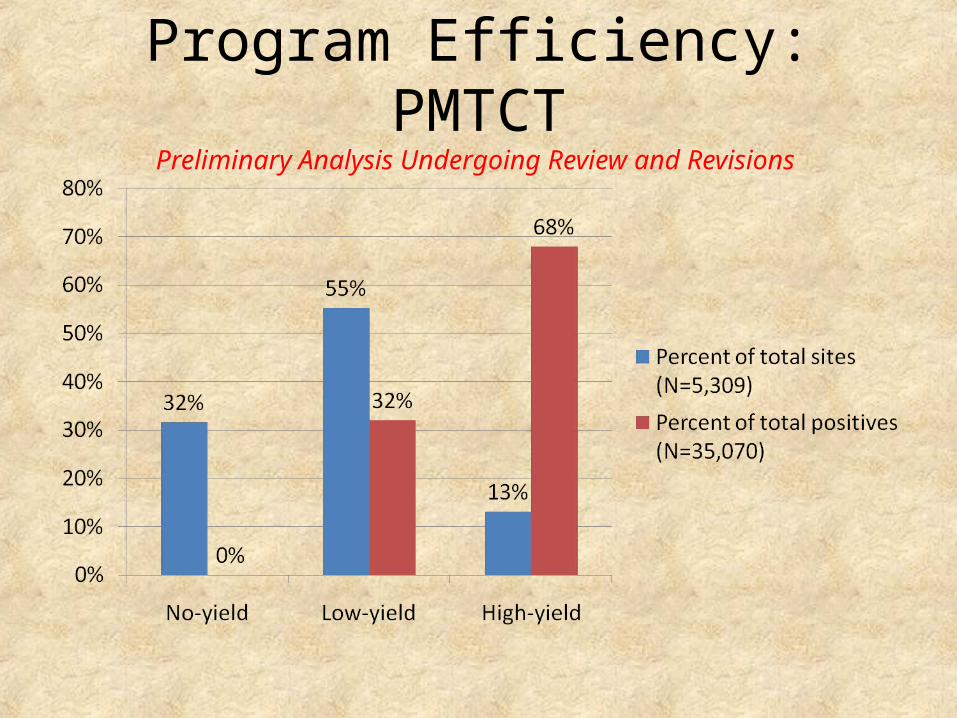
Program Efficiency: PMTCTPreliminary Analysis Undergoing Review and Revisions


Total GF Allocation2014-2016 (3 years)
Disease Existing Funding
Additional Funding
Total Allocation
HIV $193,133,430 $191,306,621 $384,440,050TB $13,068,691 $13,369,851 $26,438,541Malaria $182,422,697 $2,913,151 $185,335,848HSS $36,333,124 $0 $36,333,124Total $424,957,942 $207,589,623 $632,547,563
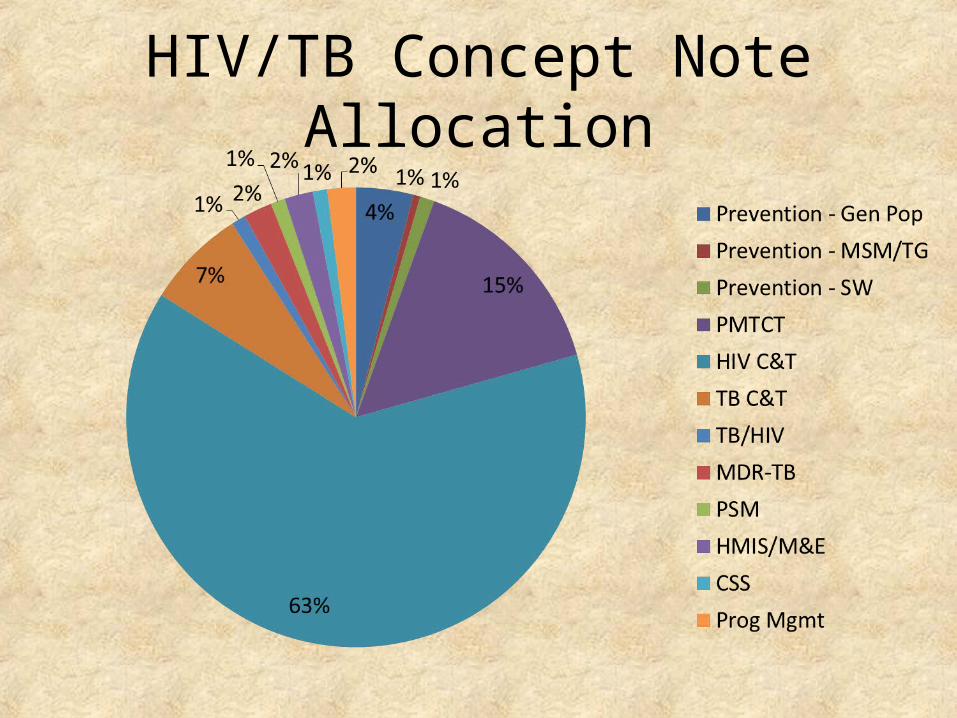
HIV/TB Concept Note Allocation
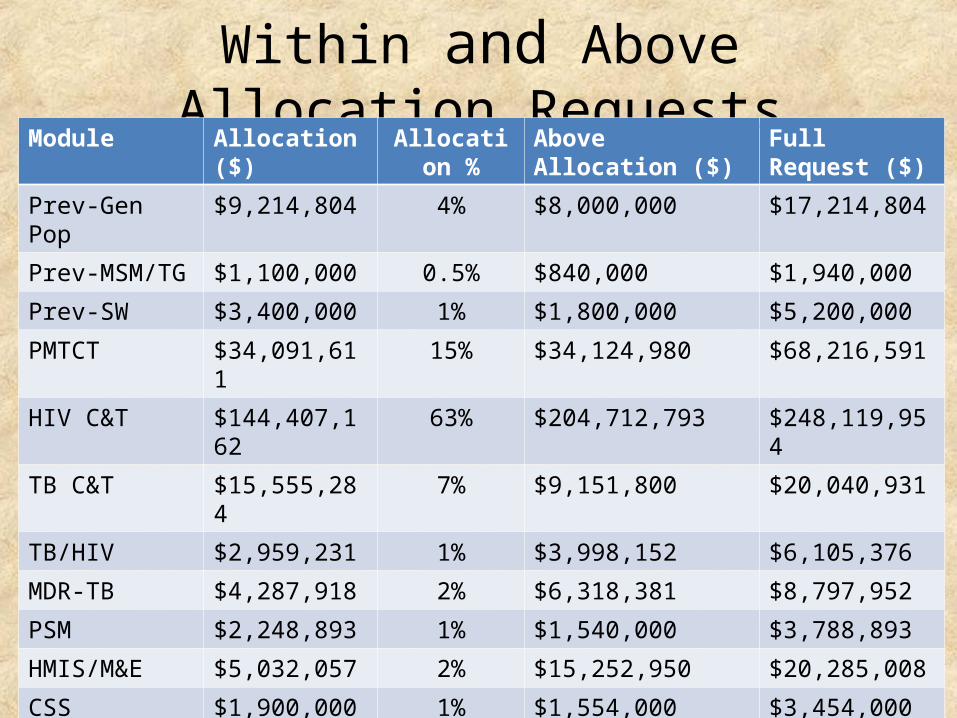
Within and Above Allocation RequestsModule Allocation ($) Allocation % Above Allocation ($) Full Request ($)
Prev-Gen Pop $9,214,804 4% $8,000,000 $17,214,804
Prev-MSM/TG $1,100,000 0.5% $840,000 $1,940,000
Prev-SW $3,400,000 1% $1,800,000 $5,200,000
PMTCT $34,091,611 15% $34,124,980 $68,216,591
HIV C&T $144,407,162 63% $204,712,793 $248,119,954
TB C&T $15,555,284 7% $9,151,800 $20,040,931
TB/HIV $2,959,231 1% $3,998,152 $6,105,376
MDR-TB $4,287,918 2% $6,318,381 $8,797,952
PSM $2,248,893 1% $1,540,000 $3,788,893
HMIS/M&E $5,032,057 2% $15,252,950 $20,285,008
CSS $1,900,000 1% $1,554,000 $3,454,000
Program Mgmt $5,351,553 2% $0 $5,351,553
Total $229,548,513 $287,293,056 (> 50%) $516,841,568

Commodity Funding Gap
Above Allocation request for key commodities: $193,117,348

Modeling Analysis of Investment Options for HIV Program in Tanzania
Draft, October 1, 2014Futures Institute, Johns Hopkins School of Public Health, UNAIDS,
TACAIDS

Scenarios• Base: Coverage of all interventions constant at 2013 levels• NMSF: Targets of National Multi-Sectoral Strategic Framework (NMSF)
2013/14-2017/18). Assumes WHO 2013 treatment guidelines adopted in 2014 and all HIV+ children <15 become eligible for treatment in 2015
• PMTCT: Only PMTCT is scaled up. Coverage is constant for all other interventions
• ART: Only ART is scaled up. Coverage is constant for all other interventions• Strategic: Full scale up of most cost-effective interventions: ART, PMTCT, female
sex worker empowerment, VMMC, condom promotion. Coverage is constant for all other interventions.
• FSW moderate: FSW empowerment program scaled up to 35% by 2019 and 55% by 2024.
• FSW optimistic: FSW empowerment program scaled up to 50% by 2019 and 80% by 2024
• Optimal: Resources available capped at $600 million by 2017. Most cost effective interventions are scaled up (ART, PMTCT, FSW, VMMC, condoms) others have reduced coverage to constrain costs increases (mass media, community mobilization, workplace)
Optimal Scenario
The Optimal scenario is designed to maximize impact within a resource constraint of < $600 million per year by 2017. – It fully scales up the most cost-effective interventions: ART,
PMTCT, FSW, condoms, VMMC.– It reduces coverage by ½ to ¾ for the least cost-effective
interventions: mass media, workplace, community mobilization.

Scenario Infections Averted(2014-2030)Co
NMSF 1.2 M
PMTCT 0.2 M
ART 0.7 M
Strategic 0.9M
FSW mod 0.1 M
FSW opt 0.2 M
Optimal 0.9M

Scenario Resources Needed (Billions of US$)(2014-2030)
Base $11.4
NMSF $18.7
PMTCT $11.7
ART $13.9
Strategic $14.5
FSW mod
$11.6
FSW opt $11.7
Optimal $12.4

Ending AIDS Scenario: New HIV Infections
Total number of people living with HIV/AIDS (PLWHA)
35M PLWHA
52M PLWHA
44M PLWHA
79M PLWHA
48M PLWHA
$8B in additional Treatment cost/year
$31B in additional
Treatment cost/year
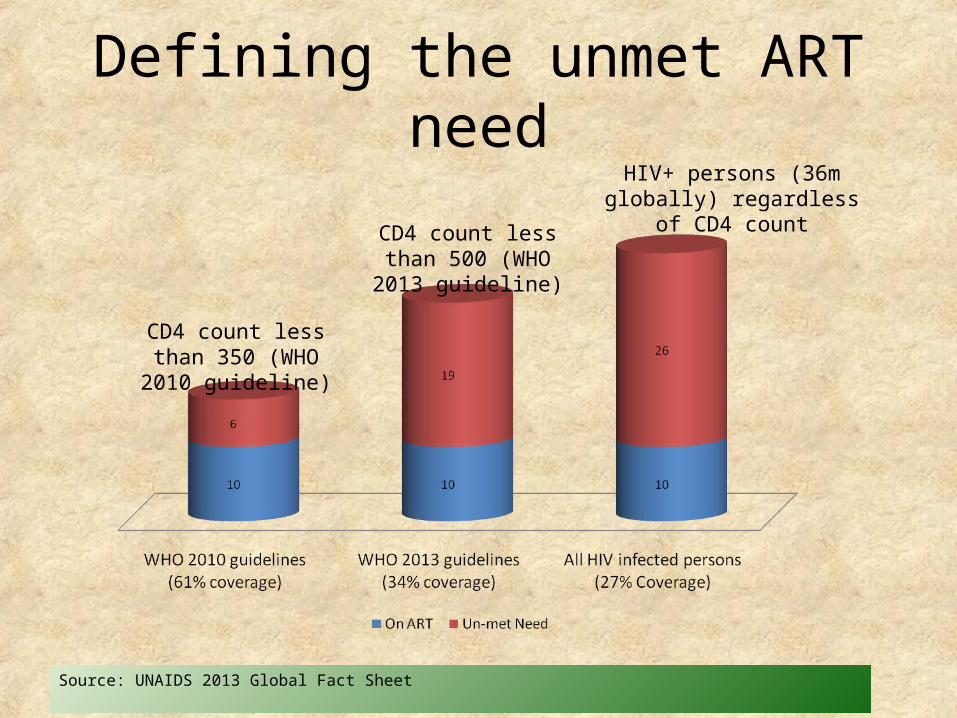
Defining the unmet ART need
CD4 count less than 350 (WHO 2010 guideline)
CD4 count less than 500 (WHO 2013 guideline)
HIV+ persons (36m globally) regardless of CD4 count
Source: UNAIDS 2013 Global Fact Sheet
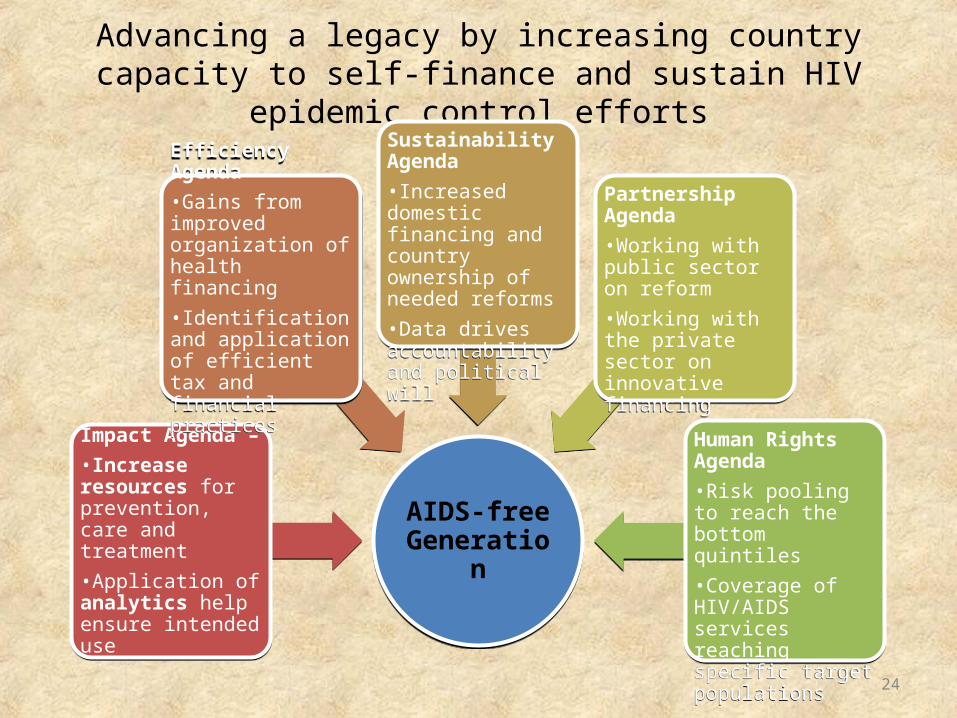
Advancing a legacy by increasing country capacity to self-finance and sustain HIV epidemic control efforts
24
AIDS-free GenerationAIDS-free
Generation
Impact Agenda – •Increase resources for prevention, care and treatment•Application of analytics help ensure intended use
Impact Agenda – •Increase resources for prevention, care and treatment•Application of analytics help ensure intended use
Efficiency Agenda•Gains from improved organization of health financing•Identification and application of efficient tax and financial practices
Efficiency Agenda•Gains from improved organization of health financing•Identification and application of efficient tax and financial practices
Sustainability Agenda•Increased domestic financing and country ownership of needed reforms•Data drives accountability and political will
Sustainability Agenda•Increased domestic financing and country ownership of needed reforms•Data drives accountability and political will
Partnership Agenda•Working with public sector on reform•Working with the private sector on innovative financing
Partnership Agenda•Working with public sector on reform•Working with the private sector on innovative financing
Human Rights Agenda•Risk pooling to reach the bottom quintiles•Coverage of HIV/AIDS services reaching specific target populations
Human Rights Agenda•Risk pooling to reach the bottom quintiles•Coverage of HIV/AIDS services reaching specific target populations

Low income countries (n=7)
Low/middle income countries (n=6)
As economies grow, the local share of HIV funding also grows
Source: FY2014 COP

NHA Report 2014
• Total Health Spending: 71,428 Tsh (~45 USD) per capita, 2011-2012
• Main sources of health sector financing: – Donors: 48% of total health
expenditure (up from 40%, 2010 NHA report)
– Households (largely out of pocket): 27%
– Government: 21%
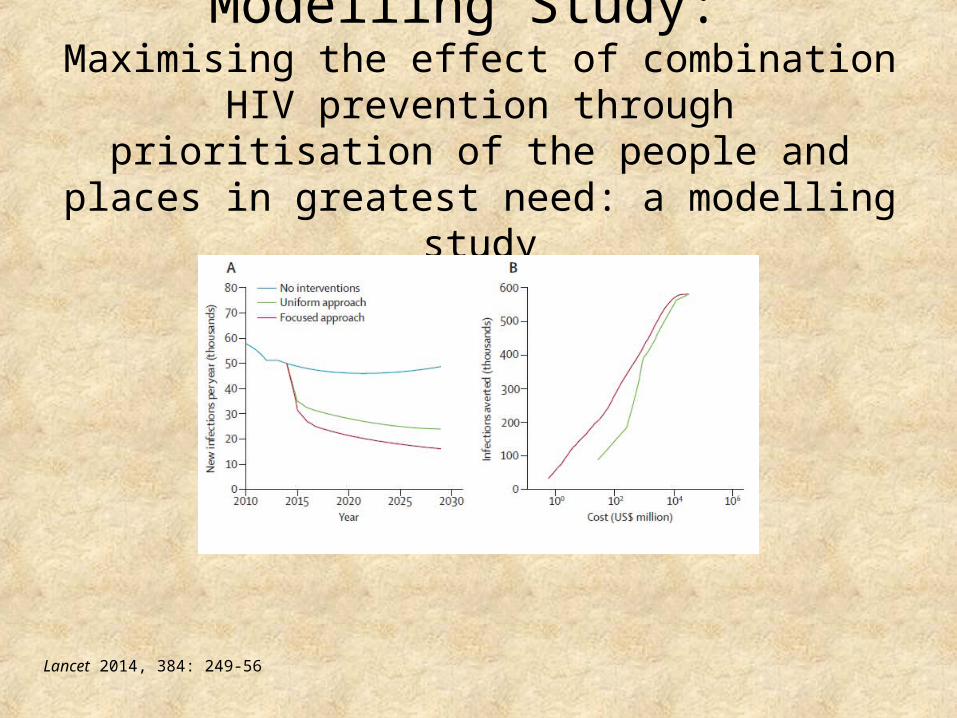
Modelling Study: Maximising the effect of combination HIV prevention
through prioritisation of the people and places in greatest need: a modelling study
Lancet 2014, 384: 249-56

Findings
Uniformly distributed combination of HIV prevention interventions:
• Could reduce the total number of new HIV infections by 40% during a 15-year period.
With focused approach:
• This effect could be increased by 14% (almost 100,000 extra infections) and result in 33% fewer new HIV infections occurring every year by the end of the 15-year period
Lancet 2014, 384: 249-56
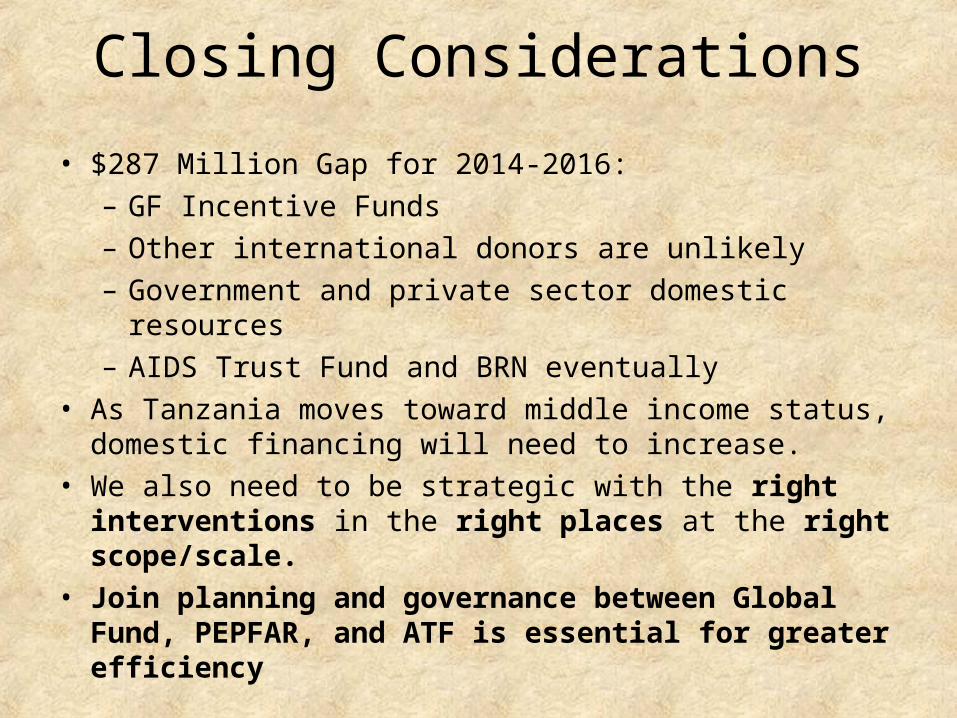
Closing Considerations• $287 Million Gap for 2014-2016:– GF Incentive Funds– Other international donors are unlikely– Government and private sector domestic resources– AIDS Trust Fund and BRN eventually
• As Tanzania moves toward middle income status, domestic financing will need to increase.
• We also need to be strategic with the right interventions in the right places at the right scope/scale.
• Join planning and governance between Global Fund, PEPFAR, and ATF is essential for greater efficiency
ASANTENI SANA!Thank you!


