1
FY 2003 Performance ReviewAnalysts Briefing
24 February 2004

2
AgendaAgenda
• Performance Highlights • Financial Review• Segmental Review• Proposed Dividends• Activities• Branding• Looking Back• Going forward• Q & A
3
Performance Highlights
4
Performance HighlightsPerformance Highlights
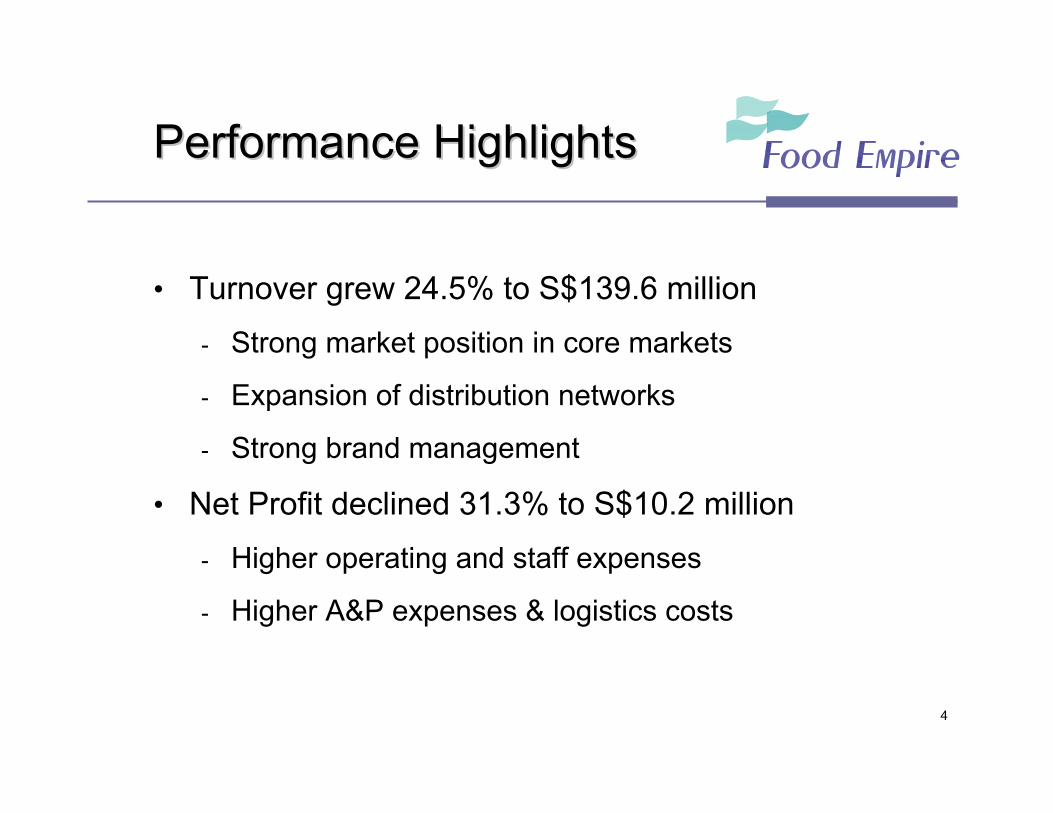
• Turnover grew 24.5% to S$139.6 million- Strong market position in core markets
- Expansion of distribution networks
- Strong brand management
• Net Profit declined 31.3% to S$10.2 million - Higher operating and staff expenses
- Higher A&P expenses & logistics costs
5
Financial Review
6
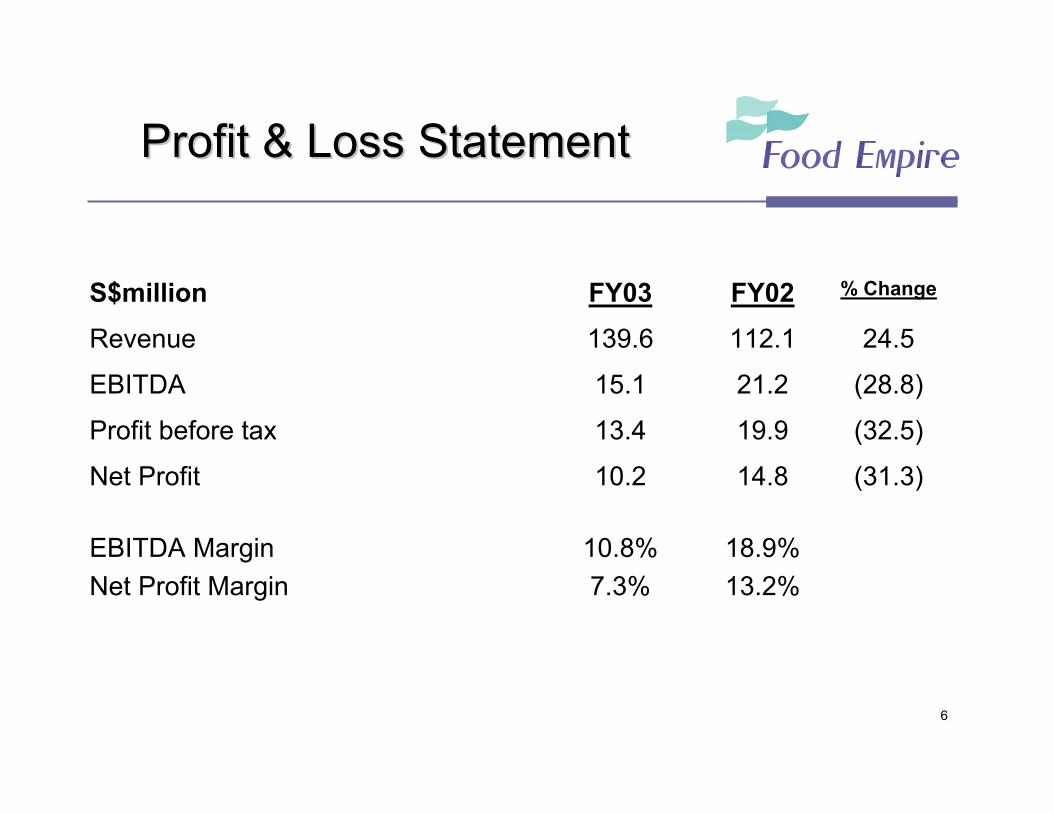
Profit & Loss StatementProfit & Loss Statement
(31.3)14.810.2Net Profit
18.9%13.2%
10.8%7.3%
EBITDA MarginNet Profit Margin
13.4
15.1
139.6
FY03
(32.5)19.9Profit before tax
(28.8)21.2EBITDA
24.5112.1Revenue
% ChangeFY02S$million

7
Review of PerformanceReview of Performance
Revenue grew 24.5% to S$139.6 million
• Achieved 3-yr CAGR of 33%
• Double digit sales improvement in core markets
• Expanded distribution networks
• Effective A&P activities
Group Revenue
FY00 FY01 FY02 FY03
59.284.2
112.1
139.6
0.0
30.0
60.0
90.0
120.0
150.0
S$m
CAGR of 33%
8
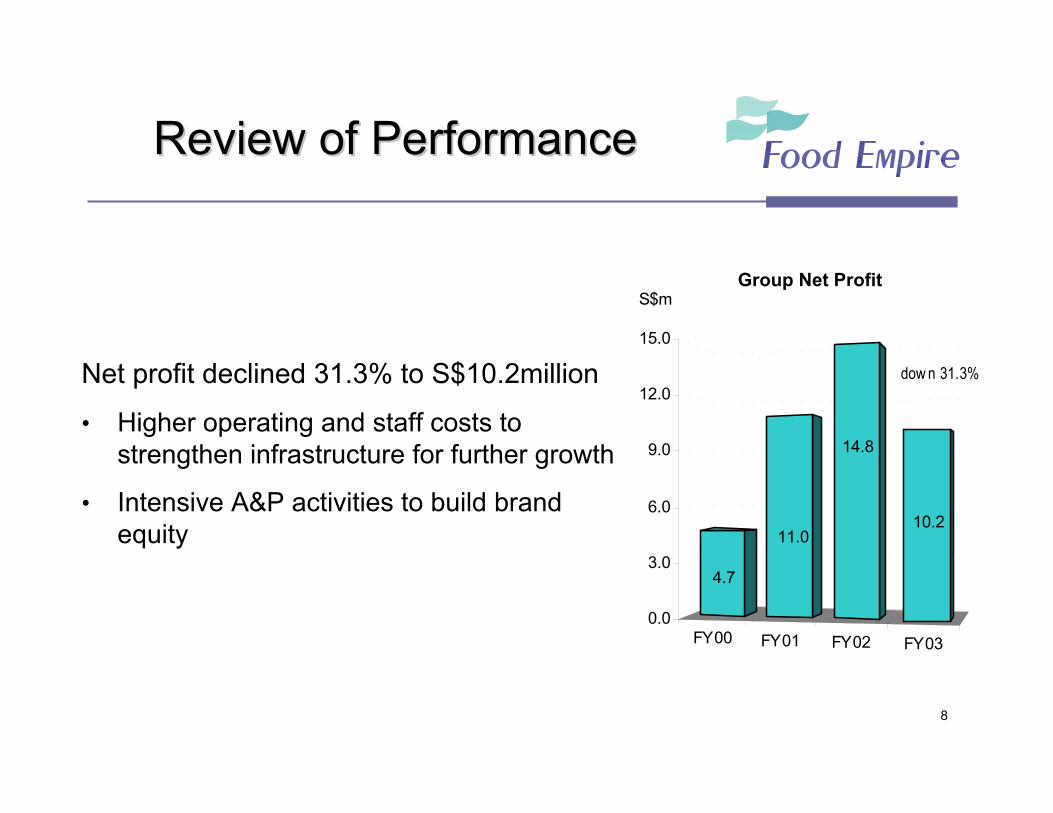
Review of PerformanceReview of Performance
Net profit declined 31.3% to S$10.2million
• Higher operating and staff costs to strengthen infrastructure for further growth
• Intensive A&P activities to build brand equity
Group Net Profit
FY00 FY01 FY02 FY03
4.7
11.0
14.8
10.2
0.0
3.0
6.0
9.0
12.0
15.0
S$m
dow n 31.3%
9
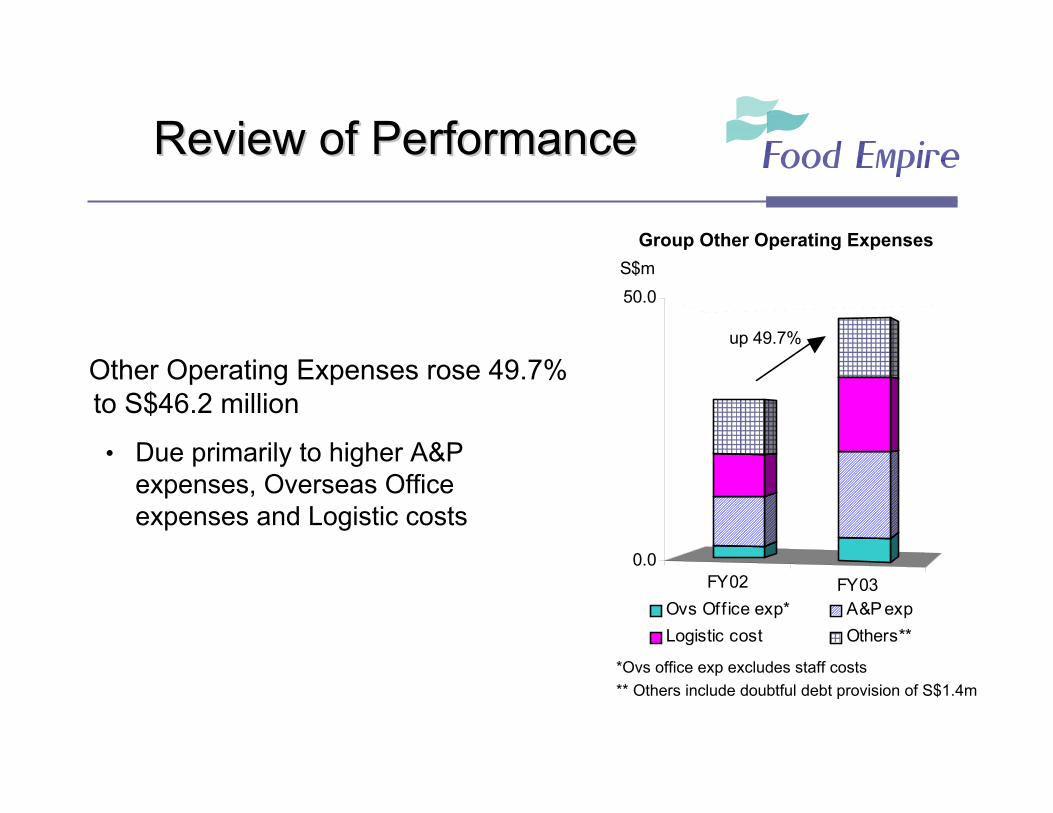
Review of PerformanceReview of Performance
Other Operating Expenses rose 49.7% to S$46.2 million
• Due primarily to higher A&P expenses, Overseas Office expenses and Logistic costs
*Ovs office exp excludes staff costs** Others include doubtful debt provision of S$1.4m
Group Other Operating Expenses
FY02 FY03
������������
������������
���������������������
���������������������
���������������������
���������������������
��������������������������������
������������
������
���������������������
���������������������
���������������������
��������������������� ��������
��������
��������
����
���������������������
���������������������
���������������������
���������������������
���������������������
���������������������
���������������������
����������������������������
��������
��������
���������������������
���������������������
���������������������
���������������������
���������������������
0.0
50.0
Ovs Office exp*
�������� A&P exp
Logistic cost
����
Others**
S$m
up 49.7%
10
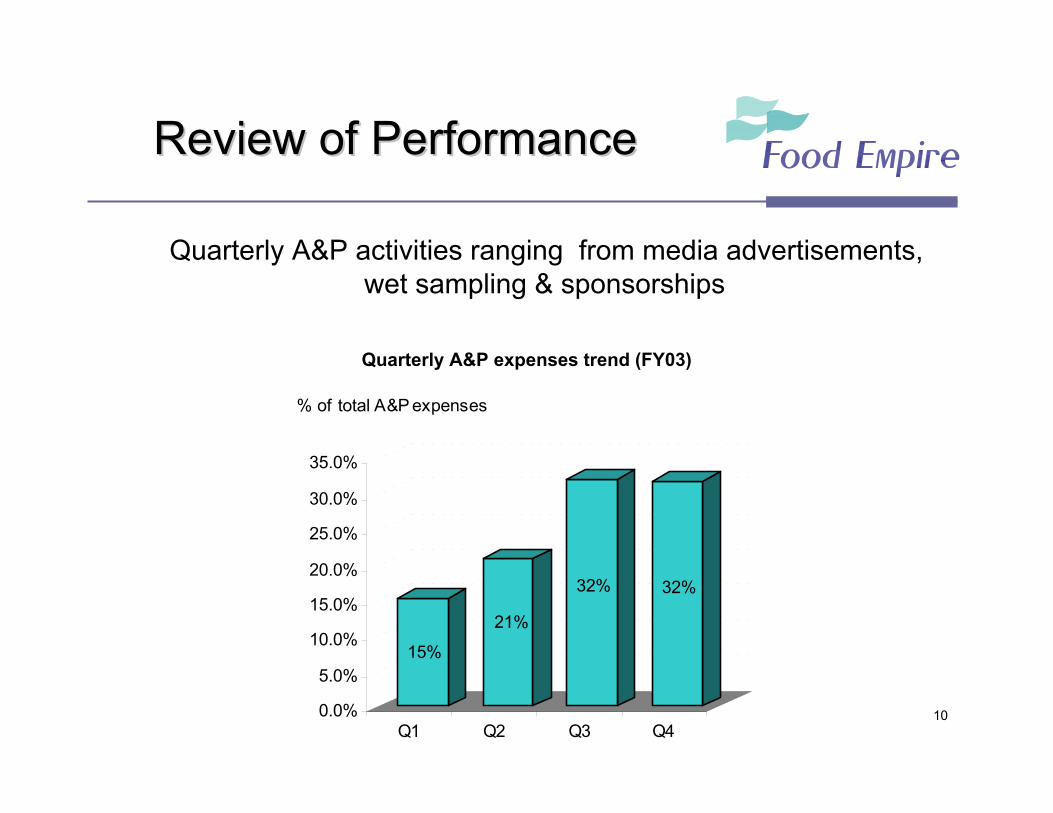
Review of PerformanceReview of Performance
Quarterly A&P activities ranging from media advertisements, wet sampling & sponsorships
Quarterly A&P expenses trend (FY03)
15%
21%
32% 32%
0.0%
5.0%
10.0%
15.0%
20.0%
25.0%
30.0%
35.0%
Q1 Q2 Q3 Q4
% of total A&P expenses
11
Review of PerformanceReview of Performance
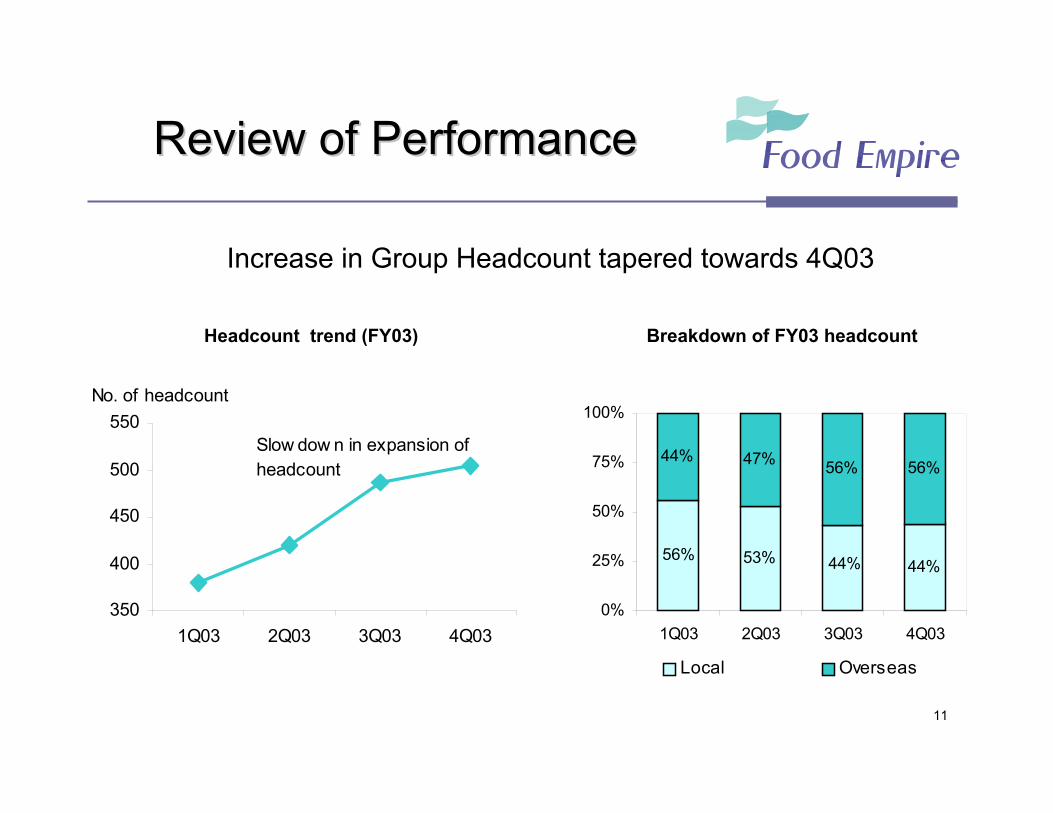
Increase in Group Headcount tapered towards 4Q03
Breakdown of FY03 headcountHeadcount trend (FY03)
44%44%56% 53%
56%56%47%44%
0%
25%
50%
75%
100%
1Q03 2Q03 3Q03 4Q03
Local Overseas
350
400
450
500
550
1Q03 2Q03 3Q03 4Q03
No. of headcount
Slow dow n in expansion of headcount
12
Review of PerformanceReview of Performance
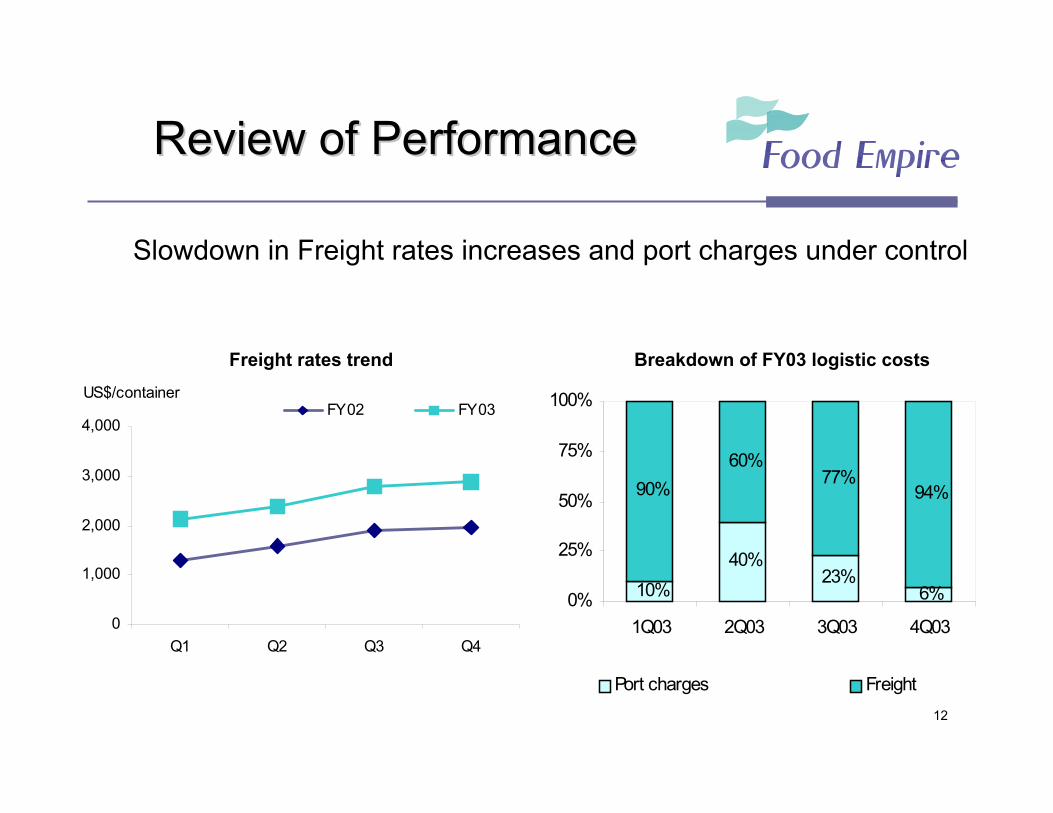
Slowdown in Freight rates increases and port charges under control
Breakdown of FY03 logistic costsFreight rates trend
6% 23%
40% 10%
94% 77%
60% 90%
0%
25%
50%
75%
100%
1Q03 2Q03 3Q03 4Q03
Port charges Freight
0
1,000
2,000
3,000
4,000
Q1 Q2 Q3 Q4
FY02 FY03US$/container
13
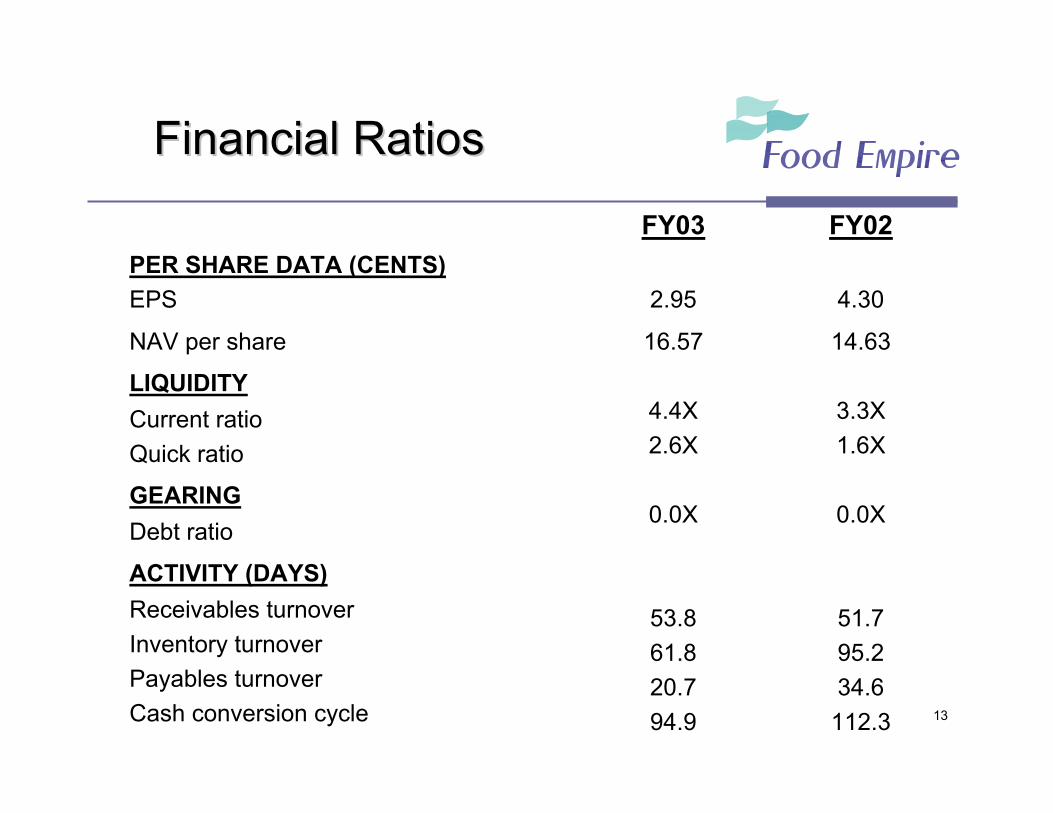
Financial Ratios Financial Ratios
14.63
3.3X1.6X
0.0X
51.795.234.6112.3
4.30
FY02
16.57
4.4X2.6X
0.0X
53.861.820.794.9
2.95
FY03
NAV per share
LIQUIDITYCurrent ratioQuick ratio
GEARINGDebt ratio
ACTIVITY (DAYS)Receivables turnoverInventory turnoverPayables turnoverCash conversion cycle
PER SHARE DATA (CENTS)EPS
14
Segmental Review
15
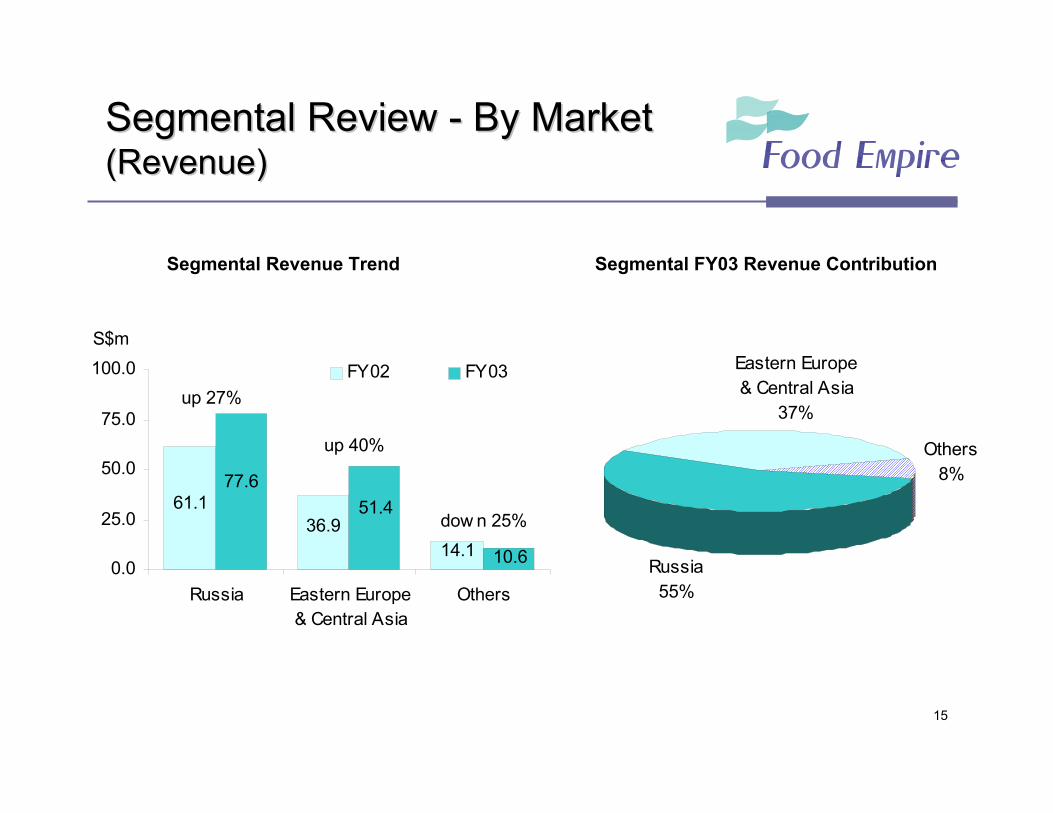
Segmental Revenue Trend Segmental FY03 Revenue Contribution
Segmental Review Segmental Review -- By MarketBy Market(Revenue)(Revenue)
����
����
��
��������������������������������������������������������������
��������������������������������������������������������������
��������������������������������������������������������������
Russia55%
Eastern Europe & Central Asia
37%
Others8%
61.136.9
14.1
77.651.4
10.60.0
25.0
50.0
75.0
100.0
Russia Eastern Europe& Central Asia
Others
FY02 FY03
S$m
up 27%
up 40%
dow n 25%
16
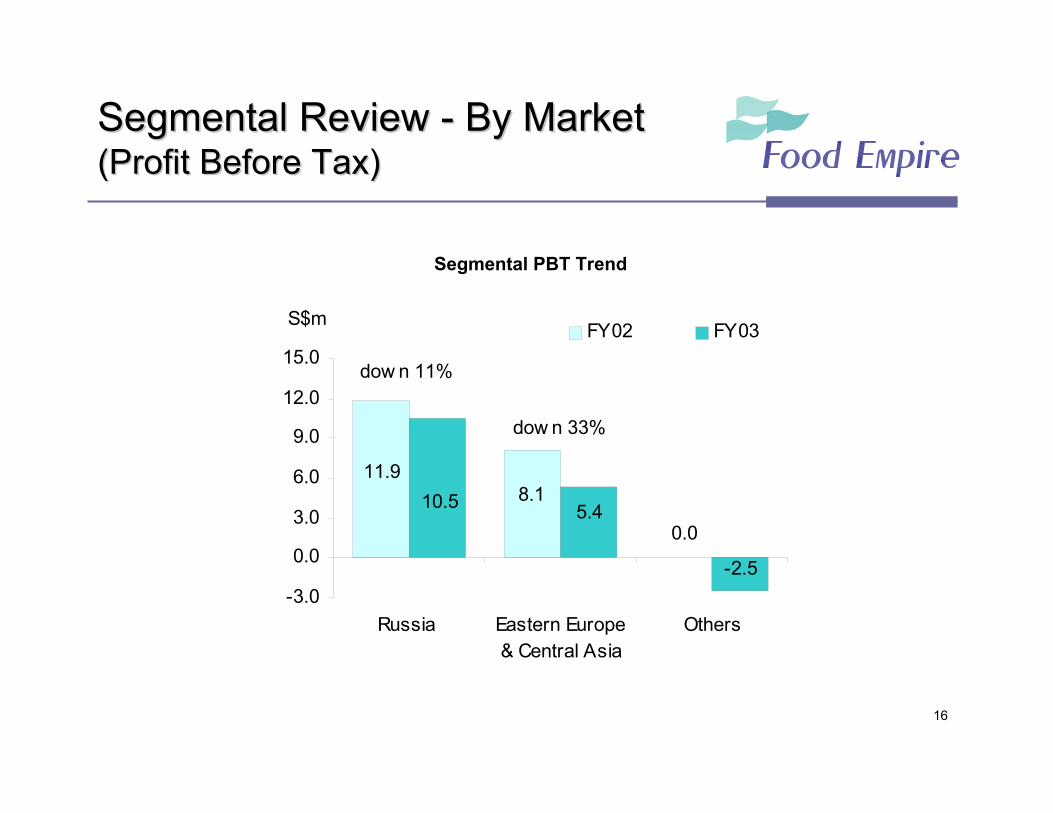
Segmental Review Segmental Review -- By MarketBy Market(Profit Before Tax)(Profit Before Tax)
Segmental PBT Trend
0.0
11.98.110.5 5.4
-2.5-3.0
0.0
3.0
6.0
9.0
12.0
15.0
Russia Eastern Europe& Central Asia
Others
FY02 FY03S$m
dow n 11%
dow n 33%
17
Segmental Review Segmental Review -- By MarketBy Market
RUSSIA and EASTERN EUROPE & CENTRAL ASIA• Russia sales grew by 27% while Eastern Europe & Central
Asia grew by 40%• Aggressive A&P activities to boost sales of core and new
products• Expansion of distribution networks• Extension of product portfolio
OTHERS• Revenue declined due to cessation of frozen seafood trading

18
Segmental Revenue Trend Segmental FY03 Revenue Contribution
Segmental Review Segmental Review -- By ProductBy Product(Revenue)(Revenue)
Beverages92%
Others8%
11.8
100.3
11.9
127.7
0.0
20.0
40.0
60.080.0
100.0
120.0
140.0
Beverages Others
FY02 FY03
S$m up 27%
up 1%

19
Segmental PBT Trend
Segmental Review Segmental Review -- By ProductBy Product(Profit before Tax)(Profit before Tax)
19.6
0.3
14.8
-1.3-5.0
0.0
5.0
10.0
15.0
20.0
25.0
Beverages Others
FY02 FY03
S$m
dow n 25%
20
Segmental Review Segmental Review –– By ProductBy Product
Beverage• Stronger demand for 3in1 instant coffee and coffee in tins• Top 3 best selling instant coffee – MacCoffee, FesAroma and Express• Core brand MacCoffee ranked as one of the leading instant coffee brands in Russia, Ukraine & Kazakhstan
Others• Snack food and Frozen Convenience food posted higher sales• Frozen seafood sales declined
21
Proposed Dividends
22
Proposed DividendsProposed Dividends
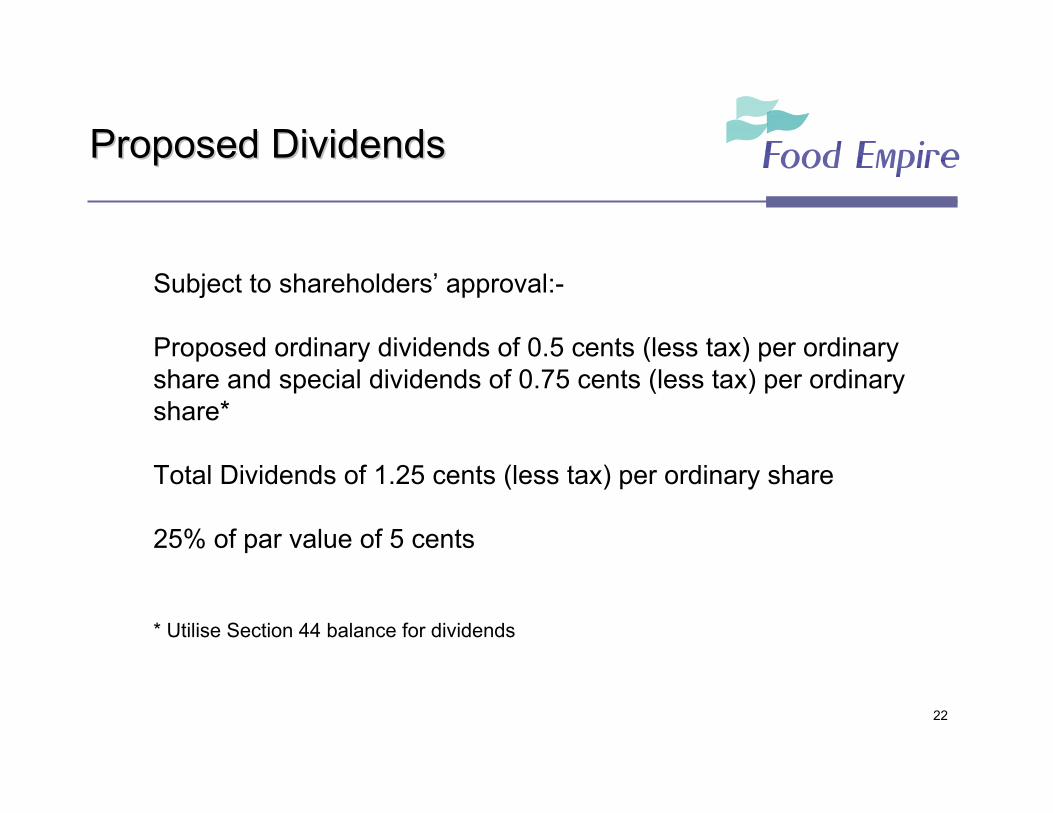
Subject to shareholders’ approval:-
Proposed ordinary dividends of 0.5 cents (less tax) per ordinaryshare and special dividends of 0.75 cents (less tax) per ordinary share*
Total Dividends of 1.25 cents (less tax) per ordinary share
25% of par value of 5 cents
* Utilise Section 44 balance for dividends

23
Activities
24
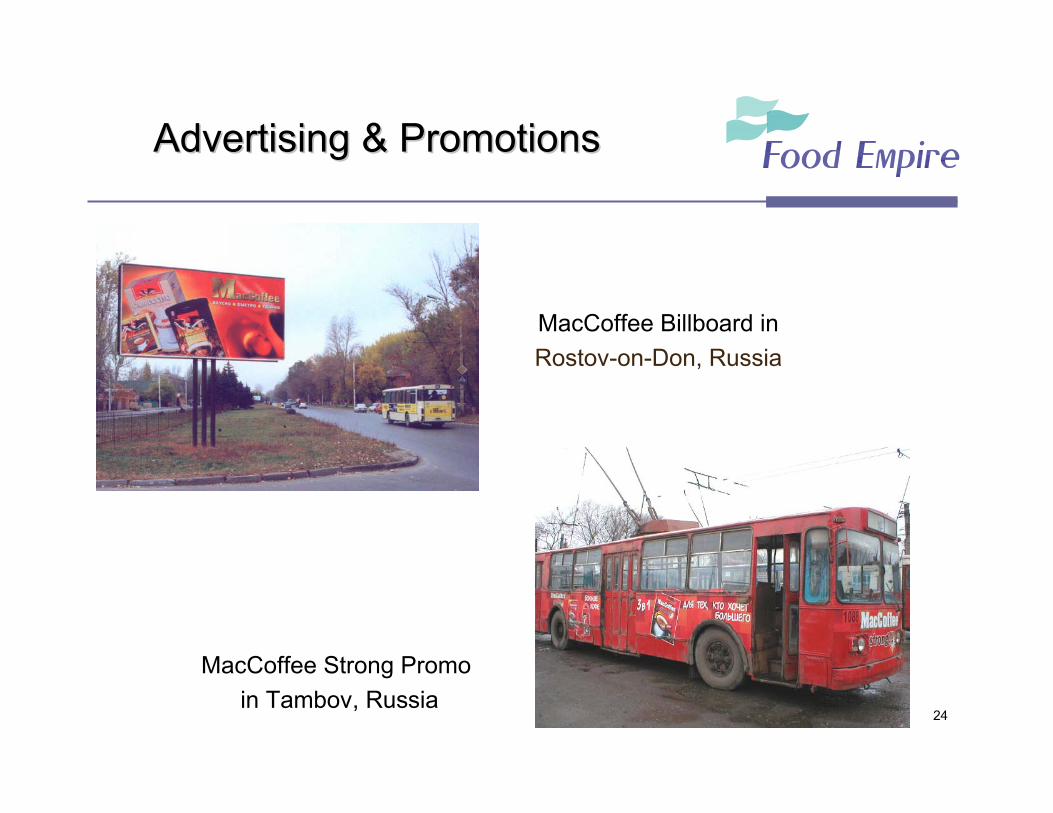
Advertising & PromotionsAdvertising & Promotions
MacCoffee Strong Promo in Tambov, Russia
MacCoffee Billboard in Rostov-on-Don, Russia
25
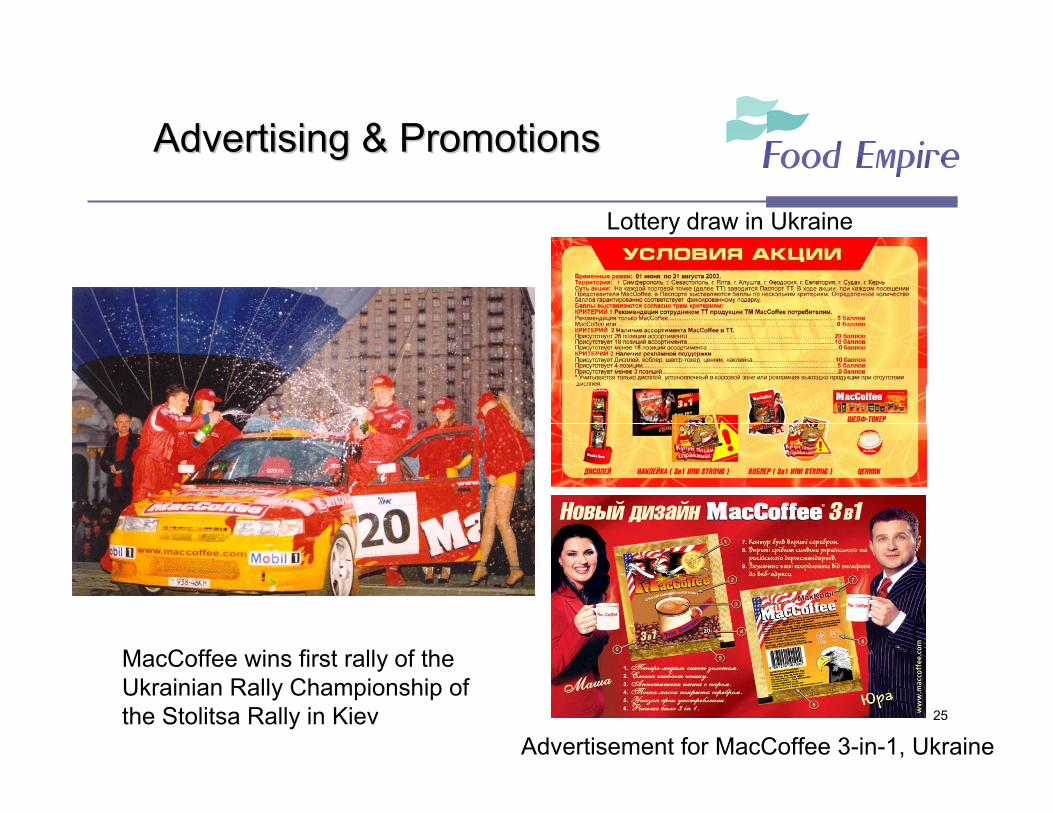
Advertising & PromotionsAdvertising & Promotions
MacCoffee wins first rally of the Ukrainian Rally Championship of the Stolitsa Rally in Kiev
Lottery draw in Ukraine
Advertisement for MacCoffee 3-in-1, Ukraine
26
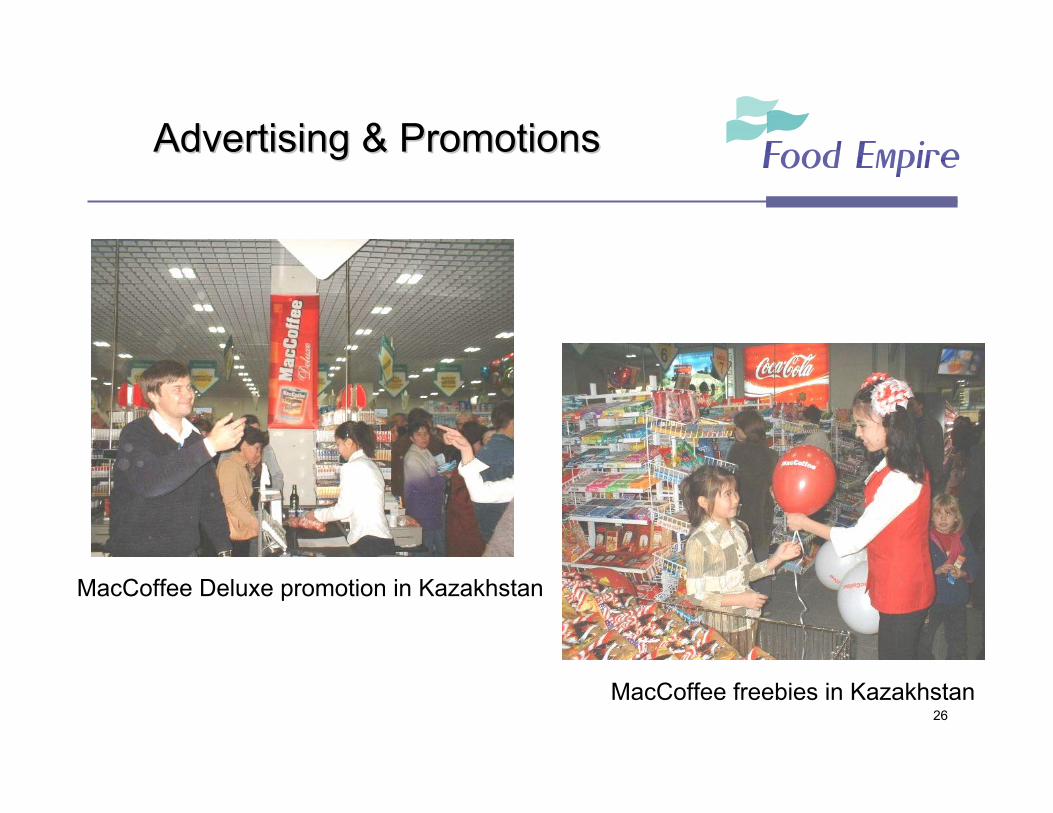
Advertising & PromotionsAdvertising & Promotions
MacCoffee Deluxe promotion in Kazakhstan
MacCoffee freebies in Kazakhstan
27
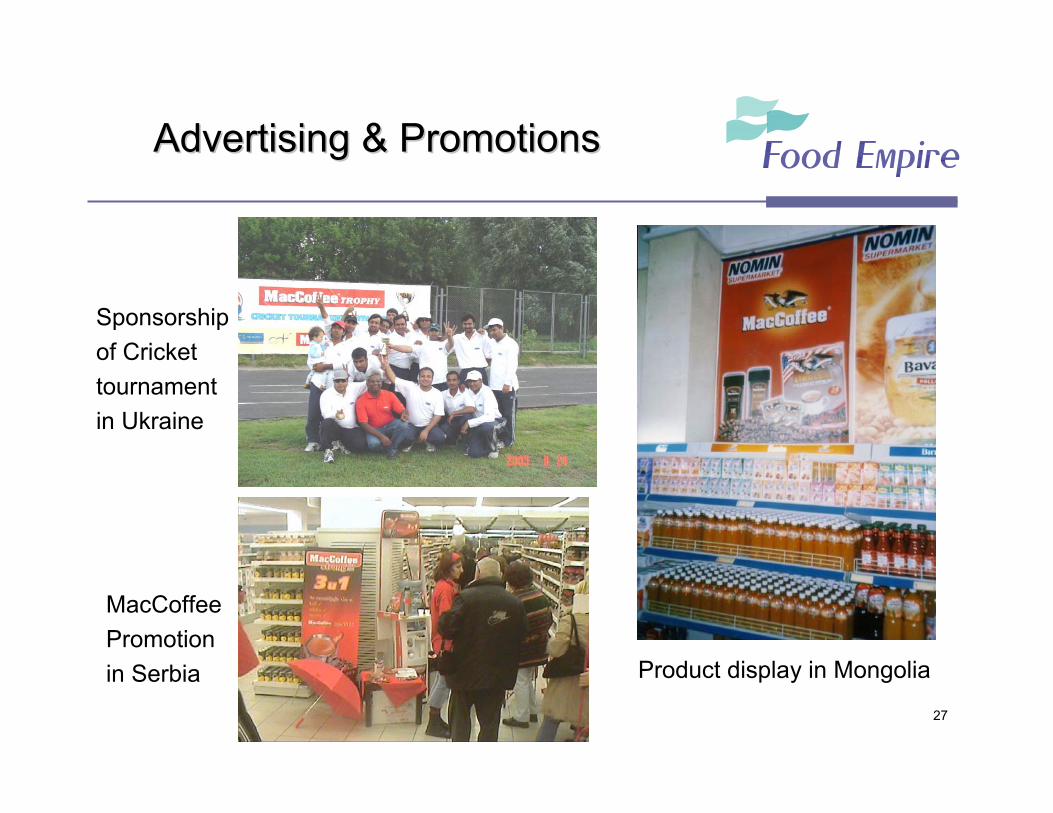
Advertising & PromotionsAdvertising & Promotions
Sponsorship of Cricket tournament in Ukraine
Product display in Mongolia
MacCoffee Promotion in Serbia

28
Trade ShowsTrade Shows
8th International Exhibition For Food, Beverage & Consumer goods,
in Egypt
World Food ’03 in Russia

29
Trade ShowsTrade Shows
Anuga 2003, Germany
30
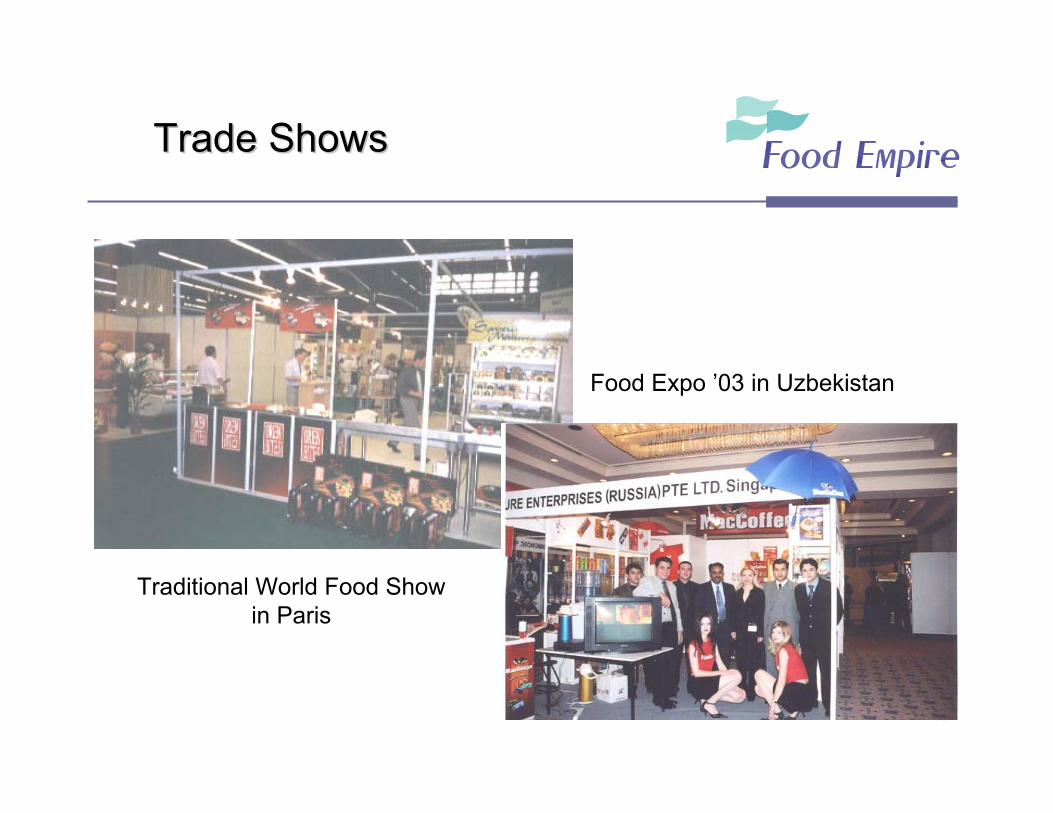
Trade ShowsTrade Shows
World Food Show in Paris
Food Expo ’03 in Uzbekistan
Traditional World Food Show in Paris
31
Branding
32
AwardsAwards
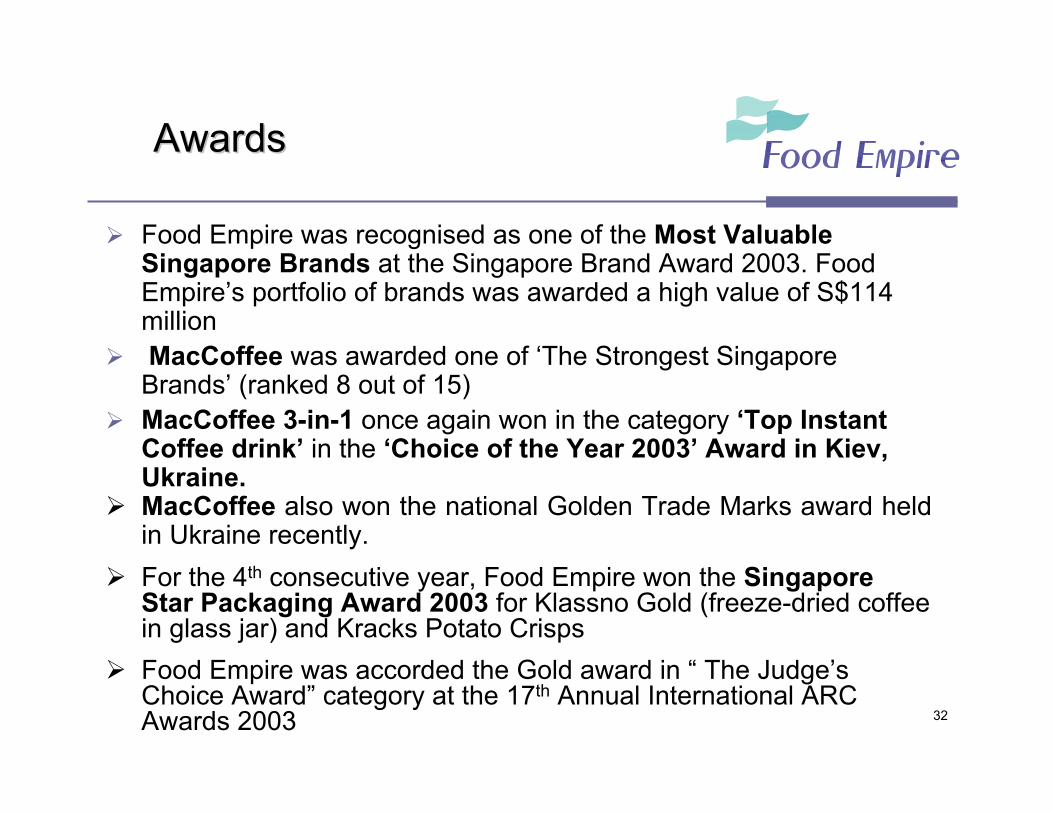
Food Empire was recognised as one of the Most Valuable Singapore Brands at the Singapore Brand Award 2003. Food Empire’s portfolio of brands was awarded a high value of S$114 millionMacCoffee was awarded one of ‘The Strongest Singapore
Brands’ (ranked 8 out of 15)MacCoffee 3-in-1 once again won in the category ‘Top Instant Coffee drink’ in the ‘Choice of the Year 2003’ Award in Kiev, Ukraine.MacCoffee also won the national Golden Trade Marks award held in Ukraine recently.For the 4th consecutive year, Food Empire won the Singapore Star Packaging Award 2003 for Klassno Gold (freeze-dried coffee in glass jar) and Kracks Potato CrispsFood Empire was accorded the Gold award in “ The Judge’s Choice Award” category at the 17th Annual International ARC Awards 2003
33
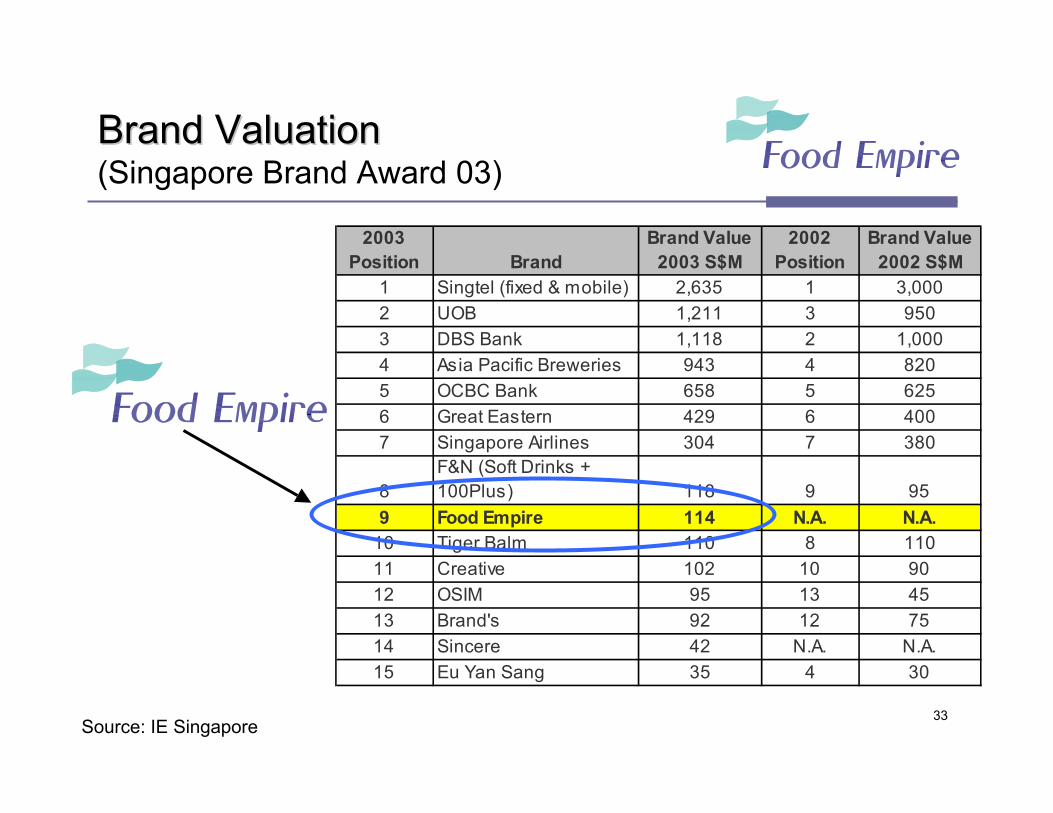
Brand ValuationBrand Valuation(Singapore Brand Award 03)
Source: IE Singapore
2003 Position Brand
Brand Value 2003 S$M
2002 Position
Brand Value 2002 S$M
1 Singtel (fixed & mobile) 2,635 1 3,0002 UOB 1,211 3 9503 DBS Bank 1,118 2 1,0004 Asia Pacific Breweries 943 4 8205 OCBC Bank 658 5 6256 Great Eastern 429 6 4007 Singapore Airlines 304 7 380
8F&N (Soft Drinks + 100Plus) 118 9 95
9 Food Empire 114 N.A. N.A.10 Tiger Balm 110 8 11011 Creative 102 10 9012 OSIM 95 13 4513 Brand's 92 12 7514 Sincere 42 N.A. N.A.15 Eu Yan Sang 35 4 30
34
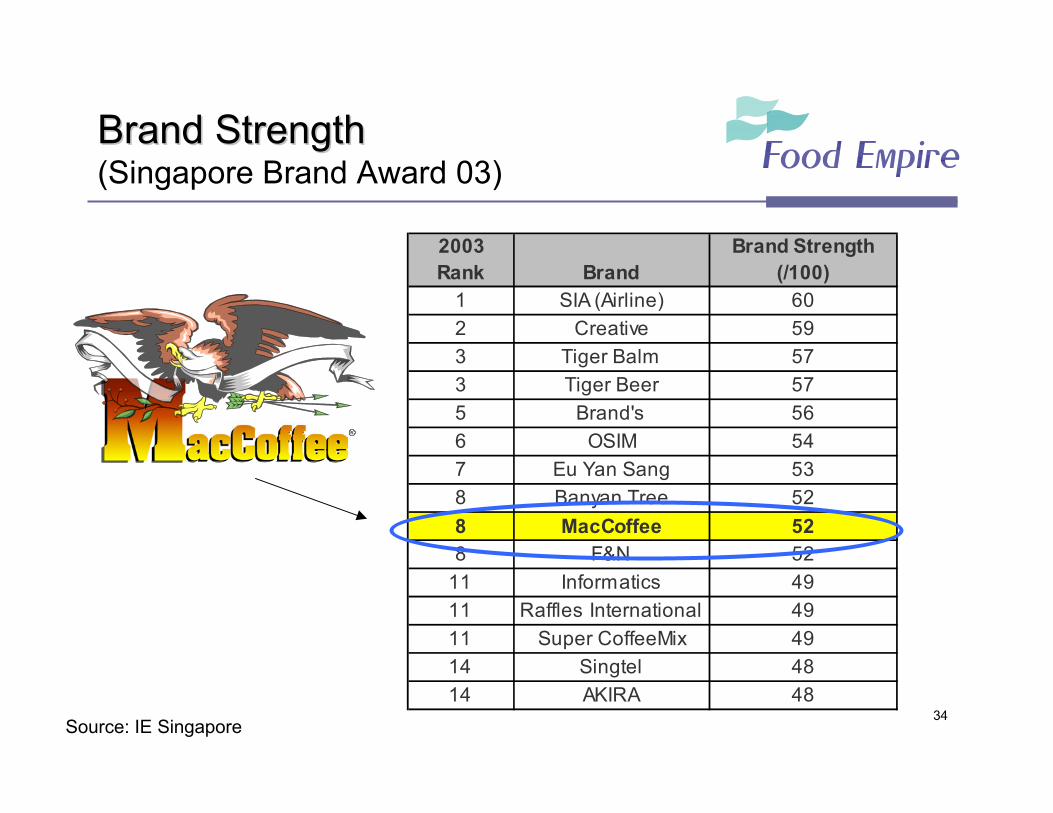
Brand StrengthBrand Strength(Singapore Brand Award 03)
Source: IE Singapore
2003 Rank Brand
Brand Strength (/100)
1 SIA (Airline) 602 Creative 593 Tiger Balm 573 Tiger Beer 575 Brand's 566 OSIM 547 Eu Yan Sang 538 Banyan Tree 528 MacCoffee 528 F&N 52
11 Informatics 4911 Raffles International 4911 Super CoffeeMix 4914 Singtel 4814 AKIRA 48

35
Looking Back
36
2003 Review2003 Review
“2003 is a year of brand building and expansion
We continued our efforts to build up our overseas operations and to invest brand equity
Revenue continued to grow but profitability was impacted as a result of the strategic actions taken to gear up for increasing our market reach “

37
Going Forward
38
2004 Outlook2004 Outlook
“Market environment in our core markets is expected to remain competitive and challenging.
Foreign currency fluctuations will continue to be an important consideration and raw material costs are expected to rise in 2004 “
We will continue to step up efforts to strengthen our operations and distribution networks, reinforce our marketing and branding. More importantly improve market reach and bottomline.“
39
Q & AQ & A


