
Department of Economics and Finance
Working Paper No. 12-05
http://www.brunel.ac.uk/economics
Eco
nom
ics
and F
inance
Work
ing P
aper
Series
Ray Barrell, Philip Davis, Iana Liadze, and Dilruba Karim
Off-Balance Sheet Exposures and Banking Crises in OECD Countries
February 2012

OFF-BALANCE SHEET EXPOSURES AND BANKING CRISES IN OECD COUNTRIES
Ray Barrell*, Philip Davis*†, Iana Liadze†, Dilruba Karim*
Abstract: Against the background of the acknowledged importance of off-balance-sheet exposures in the sub prime crisis, we seek to investigate whether this was a
new phenomenon or common to earlier crises. Using a logit approach to predicting banking crises in 14 OECD countries we find a significant impact of a proxy for the ratio of banks‟ off-balance-sheet activity to total (off and on balance sheet) activity, as
well as capital and liquidity ratios, the current account balance and GDP growth. These results are robust to the exclusion of the most crisis prone countries in our model. For
early warning purposes we show that real house price growth is a good proxy for off balance sheet activity prior to the sub-prime episode. Variables capturing off-balance
sheet activity have been neglected in most early warning models to date. We consider it essential that regulators take into account the results for crisis prediction in regulating banks and their off-balance sheet exposures, and thus controlling their
contribution to systemic risk.
Keywords: Banking crises, logit, off-balance sheet activity
JEL Classification: G21, G28
* Brunel University; † National Institute of Economic and Social Research
1 Introduction
Public commentary on the sub-prime crisis has highlighted the role of banks‟ off-balance sheet (henceforth OBS) activities (Barrell and Davis, 2008). Figures stressing
the exposure of banks to OBS risks have been widely cited1. Structured investment vehicles (SIVs) and conduits, for example, were often lightly regulated with little
capital cover, and the authorities were in some cases surprised by the volume of such activity that came to light in the crisis (Davis, 2009).
Academic commentators have started to focus on the design and appropriate regulation of banks‟ OBS vehicles, but to our knowledge there are no formal
systematic cross-country empirical investigations of the contribution of OBS activities to financial crises, despite the extensive literature on early warning models for banking crisis prediction (Davis and Karim, 2008). The lack of empirical work seems largely due
to paucity of data and not from a lack of underlying justification. Indeed, both banking theory, suggesting that moral hazard arises from less regulated activities, and the
sizeable impact OBS activities have had empirically on banks‟ profits, argue for a major effort to be made with research.
In this paper we investigate the effect of off-balance sheet activity on the vulnerability of the banking sectors in 14 OECD countries to crises in combination with key
regulatory, financial and macroeconomic variables. We are interested to see whether OBS activity was a crisis determinant across our entire sample (1980 – 2008), in which
case transactions traditionally regarded as risk-reducing were systemically problematic, or whether OBS activity only started to raise crisis probabilities when it
moved into risky securitisation associated with regulatory arbitrage in recent years. If the latter is true, OBS risks will be found to be a feature of the most recent crises only and hence will not add value to an early warning system based on our sample2.
There are important policy implications of an analysis of OBS and crises: periods of
structural change, when OBS income becomes associated with risky securitisation, may pose particular risks to financial stability. This paper demonstrates clearly that
this was the case, showing for the first time that OBS activity contributed significantly to crisis probabilities after 2003. Expanding on our earlier work (Barrell, Davis, Karim and Liadze, 2010), we test this proposition on the banking sectors of Belgium,
Canada, Denmark, Finland, France, Germany, Italy, Japan, Netherlands, Norway, Spain, Sweden, the UK and the US3.
The paper is structured as follows. Section 2 provides background on the importance of OBS activity in the recent crisis and introduces measures of off-balance sheet
exposures for OECD country banking sectors. Section 3 introduces the literature on banking crisis prediction and considers additional variables employed to predict crises.
Section 4 covers the estimation and analyses the results of a logit model of the determinants of banking crisis probabilities that includes OBS. Section 5 discusses
forecasting crises with logit models and Section 6 concludes.
1 See for example, Blundell-Wignall et. al. (2008).
2 Our OBS measure will still serve as another example of crisis risk arising from financial innovation which is a
feature of many historic banking crises (Davis, 1995). 3 Our choice of countries and of the time period we cover is constrained by the availability of data on capital ratios
as well as on off balance sheet income.

2 The relevance and measurement of OBS
Traditionally, OBS activity was seen as a risk reducing tool whereby parent companies could venture into new business lines without exposing their shareholders to the
concurrent risks; parents could hold minority interests in a legally separated entity which bore the risks instead. However the explosion of OTC derivatives trading by banks allowed them to generate increasing levels of non-interest income whilst
securitisation allowed them to earn additional fee based income whilst placing the assets off the balance sheet. This raised profitability further by avoiding the need to
hold costly regulatory capital against these assets. Acharya and Richardson (2009) note that the move towards securitization-generated
income became a feature of market-based banking systems of several OECD economies. This was particularly pronounced in the period after 2003 in the US when
asset backed security (ABS) issuance exploded, driven by banks‟ desire to avoid holding costly capital against their assets. Altunbas et. al. (2009) note similar
strategies were adopted in Europe and date the acceleration of securitisation in European banks around the same time (post-2004).
One way banks engaged in regulatory arbitrage was by removing assets off the balance sheet by holding asset-backed securities in SIVs and conduits, for which
banks then sought asset-backed commercial paper financing. The other was holding other banks‟ AAA ABS tranches on-balance sheet, which required a low capital
weighting. Acharya and Richardson (2009) suggest this regulatory arbitrage was the main cause of the sub-prime episode. Only the on-balance sheet form of regulatory arbitrage will be captured by conventional measures of capital-assets ratios, and even
there, an unadjusted measure of bank leverage (as employed by Barrell, Davis, Karim and Liadze, 2010) rather than a risk-based capital adequacy measure would have
captured risks better.
The recent increase in OBS activity may also have been due to banks‟ desire to mimic the business strategies of their peers. Farhi and Tirole (2009) suggest the maturity mismatch within SIVs and conduits (between long-term mortgage-backed assets and
the short term commercial paper used to finance them) was a structural feature of the business models of most banks which displayed strategic complementarities with their
peers. When authorities bail out failing banks, society incurs a fixed cost which is only justified if sufficient banks need bailing out. Therefore, each individual bank correlates its risk exposure with other banks, such that OBS risks can become systemically high.
As the recent crisis has shown (Barrell and Davis, 2008), capital adequacy and liquidity
ratios that did not take into account the riskiness of OBS activities proved to be misleading. Whereas banks may have appeared healthy and compliant with regulatory
rules, they were in fact weak due to the undercapitalization of OBS activity. The question arises whether this was a unique feature of the recent crisis or whether there are historical precedents.
Accordingly, our aim in this paper is to take into account the degree of overall OBS
activity by banks and its impact on systemic risk by introducing it in early warning

models for banking crises along with other key macroprudential indicators. The first step is to estimate the amount of OBS activity of the banking system of each sample
country. The literature on estimating OBS at a macro level is limited. One exception is Boyd and Gertler (1994) who questioned whether US banks‟ share of intermediation
had been maintained by a shift to OBS activity.4 They used the rate of return for on-balance sheet assets to derive a measure of OBS assets according to the scale of non-
interest income. It was assumed that non-interest income5 was generated by implicit off-balance sheet assets with the same risk and return characteristics as on-balance sheet activity as indicated by net interest income. The exception was fee-based off-
balance sheet activities (trust-type activities and service charges on deposits) which the authors classed as “non-risky” forms of income. The authors note that a similar
form of capitalization of certain OBS activities that entailed risk exposure was required under Basel 1 for capital adequacy purposes (where this was to provide credit equivalents).
Feldman and Lueck (2007) replicated the Boyd-Gertler calculations for US data up to
2006. They found that capitalizing non-interest income gave a roughly constant share of banks in total intermediation despite a decline in the share of on balance sheet
assets, illustrating the growing importance of OBS activity. They noted limitations to the Boyd-Gertler approach, notably the assumption that banks generate equal profitability from on and off-balance sheet assets, but nonetheless found it plausible.
Clearly, if banks are more competitive in traditional lending than in non-interest generation,6 the latter could include a wider margin and hence OBS assets could be
overestimated by this method, and hence its use as a way of calculating the share of intermediation undertaken by banks may be questioned. However, income from off-
balance sheet activities may contain information about the risk banks face, even if it is not a good measure of their assets. We focus on relative income shares below.
Further relevant contributions are from Stiroh (2004; 2006) who examined the effects of the ratio of non-interest income to total income on measures of bank risk and
return in the US. The author found that at the aggregate level, declining volatility of total income occurred over 1984-2001 despite rising volatility of non-interest income.
Lower total income volatility reflects instead lower volatility of interest income. At a bank level, rising shares of non-interest income were associated with unchanged returns but higher risk. This work provides an a priori justification for expecting OBS
activity, linked in the works cited above to non-interest income, to be associated with banking crisis risk at the macro level.
4 The pattern of growing non-interest income and its implications for intermediation were also noted by
Rogers (1998), who pointed out that from the late 1960s onwards, US banks had reduced their reliance on interest income from traditional activities. Instead, they placed increasing importance on the fee-
based incomes they generated from securitization. 5 Non interest income comprises revenue from banks’ securitizations and other off-balance sheet and non-interest
activities (which also include loan sales, backup lines of credit, and risk sharing through derivatives) as well as
profits on proprietary trading, fees and service charges on deposits, securities underwriting fees and commissions
on brokered securities transactions for third parties. However the non-interest income figures reported by the
OECD do not decompose the revenues generated by these different activities. 6 De Bandt and Davis (2000) in a study of the competitiveness of banking systems found that the competitive
position for interest-generating and non-interest generating activities varied between countries. In the US the non-
interest income market was found to be a more competitive than that for interest income, while in France the
opposite was true. In Germany and Italy positions were comparable.

Our methodology for deriving an OBS proxy using OECD banking sector data is detailed in Appendix 1. Unlike Boyd and Gertler (1994), we do not consider pure fee
income as non-risky since often the demand for the related services is highly volatile, and the bank faces reputation risk across its whole range of activities if it runs such
business lines badly. We can derive a ratio of OBS income to total income and thus find a proxy for OBS activity7 solely using information from banking sectors‟ income
statements which consists of non interest income and net interest income. Using our proxy, we find different patterns of OBS activity across countries as well as
over time. The majority of countries exhibit higher ratios of off to total balance sheet activities over the second half of 1980-2007 as compared to the first half, although
some show much stronger rises in OBS exposures than others. The lowest average ratios over the sample period are observable for Germany, Italy, Japan, Norway and Spain, while Denmark, France, Finland, Sweden and the UK have the highest average
ratios. Denmark had historically high levels of mortgage securitisation, which explains its relatively high ratio. UK OBS activity grew strongly in the period up to 2006, as did
that in the US. The ratio for Netherlands and the US is around the average for the countries in the sample.
For countries having the highest ratios of OBS exposures, we observe non-interest income growing faster than net interest income, specifically over 2001-2007. For
example, in the UK over 2002-2007, non-interest income grew by 14.7% per annum compared with 10% in 1996-2001, while net interest income growth fell from 9% per
annum in 1996-2001 to 6.2% in 2002-2007. The hypothesis then is that a high or rising level of such OBS activity gives rise to heightened risk of banking crises, as in
the subprime episode. 3 OBS and crisis prediction
The literature has developed a number of distinctive multivariate Early Warning
Systems (EWS) for banking crises, including logit (Demirguc Kunt and Detragiache, 1998; 2005) and the binary recursive tree (Duttagupta and Cashin, 2008). The signal
extraction approach (Kaminsky and Reinhart, 1999) differs by being univariate. Davis and Karim (2008) show logit to be the best of the three estimators whilst Hardy and Pasarbasioglu (1999) and Beck et. Al. (2006) also demonstrate the merits of logit
models. Accordingly we will adopt the logit approach to assess the impact of OBS activity and will use a binary banking crisis variable (1 for crisis, zero otherwise) based
on the dating of Caprio et. al. (2003) and Laeven and Valencia (2010). In order to avoid omitted variables bias, it is essential to estimate the effect of OBS
activity on banking crisis probabilities alongside a set of crisis determinants traditionally deemed important in the literature. This literature comprises two strands:
the first class of logit crisis models estimated by Demirguc-Kunt and Detragiache (1998; 2005) and the second class of logit models by Barrell, Davis, Karim and Liadze
(2010). The latter append new variables to the Demirguc-Kunt and Detragiache set of determinants for the OECD (1980 – 2006) and show that these “new” variables supersede the “traditional” determinants as OECD crisis predictors. We discuss the
“new” variables first and then the “traditional” determinants.
7 We use the term “activity” rather than “assets” to illustrate that we are not seeking to derive the volume of
implicit off balance sheet assets.
The significant variables in Barrell, Davis, Karim and Liadze (2010) were unweighted
bank capital adequacy8 (bank capital/total bank assets), bank liquidity ratios (liquidity as a proportion of total bank assets) and real house price growth. The reasons for this
result are twofold – originally, crisis models tended to exclude the new variables due to lack of data for global samples, and secondly, crisis determinants have been shown
to differ across country groups (e.g. between Asia and Latin America, see Davis, Karim and Liadze, (2011)).
Capital adequacy and liquidity can be regarded as defences against crises, while historically low levels are commonly considered to be precursors to crises
(Brunnermeier et. al., 2009). Capital is a buffer that protects banks against the variability of losses on non-performing loans which are a function of macro risks (e.g. interest rates and creditworthiness related to business cycle effects) and market risks
(asset price depreciations and funding). Equally, liquidity ratios show the degree to which banks are robust to sudden demands for withdrawal by depositors or the lack of
wholesale funds9.
Crises are often the result of poor quality lending, especially in real estate markets, as is discussed in Reinhart and Rogoff (2008) but residential property prices are again only available consistently for OECD countries10. Where available11, property price data
can enhance crisis forecasting ability; Barrell, Davis, Karim and Liadze (2010) showed that real house price growth is a better crisis predictor than domestic real credit
growth.
Although current account data is widely available, it is not commonly employed in the empirical literature12. However, recent work by Jorda, Schularick and Taylor (2011) suggests national crises tend to be driven by current account imbalances and that for
the post-Bretton Woods era, crisis related recessions are more strongly associated with current account problems than normal recessions. Deficits may be accompanied
by monetary inflows enabling banks to expand credit excessively and they also may accompany an overheating economy. This may both generate and reflect a high
demand for credit, as well as boosting asset prices in an unsustainable manner. These trends may be exacerbated by lower real interest rates than would otherwise be the case. Current account deficits may also indicate a shortfall of national saving relative
to investment and hence a need for the banking sector to access the potentially volatile international wholesale market. Consequently, we also add the current account
balance to our set of “new” crisis predictors.
8 Often called “leverage”. Aggregate data were obtained from the OECD Banking Income Statement and Balance
Sheet data. 9 In this paper, we use a narrow liquidity measure defined as a sum of banks‟ claims on general
government and the central bank, while total assets comprise foreign assets, claims on general government, central bank and private sector. This measure is more legitimate (in terms of crisis
prediction) than broad liquidity since the latter includes corporate securities which may actually become illiquid during a financial downturn, as in the subprime episode. 10
We note that house prices are correlated with prices of commercial property, which has also been a source of
major bank losses during financial crises, see Davis and Zhu (2009). 11
Our source for this variable is the National Institute of Economic and Social Research NIGEM database. 12
Hardy and Pasarbasioglu (1999) estimated logit models of crises for both advanced and developing countries
and found that the current account was not significant. Using a probit approach, Eichengreen and Rose (1998)
again found the current account insignificant as a predictor of banking crises in developing countries.

To select our set of “traditional” determinants, we followed Demirguc-Kunt and Detragiache, (2005) who estimated over 1980-2002 for 94 countries with 77 crisis
episodes13. Their potential predictors included real GDP growth, the rate of growth of real domestic credit, the real short term interest rate, and inflation. We also utilise
these general indicators of economic activity. To accommodate the financial sector they included the fiscal balance, the ratio of money to foreign exchange reserves, the
change in the credit to GDP ratio, the dollar exchange rate and changes in the terms of trade. Again, we utilise these variables, except for the latter three as they are more directly relevant to emerging markets than OECD economies. For similar reasons, we
also excluded Demirguc-Kunt and Detragiache‟s measures of institutional quality: real GDP per capita, law enforcement and deposit insurance14.
4 Estimation and results
As noted, we use the logit model for predicting crises (Demirguc Kunt and Detragiache (2005), Davis and Karim (2008)). The logit estimates the probability that a banking
crisis will occur in a given country with a vector of explanatory variables X it. The banking crisis dependent variable Yit is a zero-one dummy which is one at the onset of
a banking crisis, and zero elsewhere. Then we have the equation:
it
it
X'
X'
itite1
eXF1YobPr
(1)
where β is the vector of unknown coefficients and F(β X it) is the cumulative logistic
distribution. The log likelihood function is:
n
i
T
t
iteititeite XFYXFYLLog1 1
'1log1'log (2)
Coefficients show the direction of the effect on the probability of a crisis, although the
magnitude of the (marginal) effect is conditional on values of other explanatory variables at time t.
By definition, early warning systems rely on lagged explanatory variables so as to predict ahead and provide policymakers with opportunities for preventative action. To
determine the best lag structure we applied either 1, 2 or 3 lags to all explanatory variables, and undertook the three logit regressions and ranked them on the basis of
the models‟ AIC criteria. The 1-lag model performed the best, followed by the 2-lag model. However, a 1-lag model could not be used as an early warning system since our OBS variable, a balance sheet item, would only be reported after the end of the
accounting year and hence would not be available for forecasting purposes. Consequently we used the 2-lag model as the estimation start point.
The literature suggests our main focus of this paper, the OBS effect, may have
changed during the course of our sample period (1980 – 2008). As banks became preoccupied with securitisation and the benefits of regulatory arbitrage, the risk-return trade-off on OBS activity may have altered. We cannot compute these changes
directly due to the lack of reported detail on banks‟ portfolio holdings of OBS assets, but the literature does identify the turning point between traditional risk-reducing OBS
activity and risky securitisation. Acharya and Richardson (2009) date this switch to 2003, around the same period (2004) that Altunbas et. al. (2009) cite for European
13
Beck et. Al. (2006) with a similar set of independent variables covered 1980-97, 69 countries and 47 episodes. 14
Deposit insurance exists in all our OECD countries and thus the dummy would show no variation.

banks. To test the hypothesis that risky securitisation generated systemic risk, as opposed to traditional OBS activity (which was viewed as risk reducing), we use two
OBS variables in our initial model: a general level of OBS activity (defined as the ratio of off-balance sheet income/ total income) and this same level interacted with a post-
2003 dummy. If the latter is significant at the cost of the former we can attribute a particular risky effect to securitisation without having to know the relative risk-return
trade-offs between normal OBS transactions and risky securitisation. Turning to our dependent variable, our dataset includes 23 crises in OECD countries.
Over half the crises are from the World Bank Crisis Database covering 1974-2002, (Caprio et al 2003) as used in Barrell, Davis, Karim and Liadze (2010). That paper has
crises in Canada in 1983, Denmark in 1987, the US in 1988, Italy and Norway in 1990, Finland, Sweden and Japan in 1991, France in 1994, whilst in the UK there are crises in 1984, 1991 and 1995. For the crises episodes in 2007 and 2008 we have used the
crises dates from Laeven and Valencia (2010), who classified Belgium, Denmark, France, Germany, the Netherlands, Spain and Sweden in crisis by 2008 and the US
and UK in 2007. The authors treat the 2008 crisis in the US and the UK as a continuation of 2007 crisis, while we treat 2007 and 2008 as individual crises since
2008 was induced by the collapse of Lehman Brothers. A priori, we made no assumptions regarding the relative importance of our crisis
predictors, even though Barrell, Davis, Karim and Liadze (2010) showed the “new” determinants to be superior to the “traditional” ones. We therefore adopt a general to
specific approach whereby a starting regression accommodating our full set of determinants (lagged 2) is used to iteratively delete the most insignificant variable
during each subsequent round of regressions. Table 1: General to Specific Estimation, 1980 – 2008.

1 2 3 4 5 6 7 8
0.234
(0.176)
0.25
(0.131)
0.229
(0.117)
0.234
(0.115)
0.234
(0.113)
0.273*
(0.063)
0.256*
(0.08)
0.28**
(0.05)
0.039**
(0.02)
0.04**
(0.017)
-0.33***
(0.00)
-0.516***
(0.001)
-0.316***
(0.00)
0.041***
(0.00)
0.039***
(0.00)
0.038***
(0.00)
-0.111**
(0.013)
-0.112**
(0.012)
-0.112**
(0.012)
-0.115***
(0.009)
-0.123***
(0.003)
-0.114***
(0.004)
-0.115***
(0.004)
-0.14***
(0.00)
-0.329***
(0.00)
-0.334***
(0.00)
0.039**
(0.016)
0.034***
(0.006)
0.036***
(0.003)
-0.302***
(0.00)
-0.315***
(0.00)
-0.293***
(0.00)
-0.526***
(0.001)
-0.525***
(0.001)
-0.524***
(0.001)
-0.329***
(0.00)
-0.514***
(0.001)
-0.438***
(0.00)
-0.471***
(0.00)
-0.457***
(0.00)
0.101
(0.223)
0.104
(0.202)
0.098
(0.211)
0.087
(0.244)
0.084
(0.256)
0.083
(0.262)
0.091
(0.212)
0.00
(0.273)
0.00
(0.279)
0.00
(0.291)
0.00
(0.296)
0.00
(0.295)
0.00
(0.297)
0.0154
(0.505)
0.015
(0.518)
0.015
(0.525)
0.02
(0.323)
0.017
(0.383)
-0.102
(0.496)
-0.102
(0.49)
-0.102
(0.49)
-0.042
(0.581)
0.048
(0.698)
0.056
(0.642)
0.058
(0.63)
-0.016
(0.729)
-0.011
(0.796)
0.018
(0.762)
Current Balance (% GDP) (-2)
Leverage(-2)
Regression Number
GDP growth(-2)
2003 Dummy*OBS Income/Total
Income(-2)
Narrow Liquidity(-2)
Budget Balance(-2)
M2/Rreserves(-2)
Real Credit Growth(-2)
OBS Income/Total Income(-2)
Inflation(-2)
Real Interest Rate(-2)
Real House Price Growth (-2)
Note: *,**,*** indicate significance on 90%,95%,99% levels correspondingly
P-values in parentheses, (-2) indicates a variable is lagged by 2 years.
The results of this sequential elimination process are reported in Table 1. It can be
seen that throughout all stages of the elimination process, the first five variables in the table (namely leverage and liquidity ratios, real GDP growth, the current account
balance/GDP ratio and post-2003 OBS activity) are generally significant with slight variation in their parameters. The opposite is true for all the remaining variables, all of
which were highly insignificant. In particular we find that the full sample off balance sheet ratio is eliminated in the process, suggesting that over most of the period it did not raise risks, but rather reallocated them properly.
These results show that in OECD countries, growth in real output and lower defenses
from less stringent bank regulation, along with current account imbalances and recent OBS activity were the most important factors driving the probability of a banking crisis
occurring between 1980 and 2008. Although lax monetary policy and credit booms may at times contribute to banking crises, they are not the most powerful discriminators between times of crisis onset and other periods in OECD countries. The
pertinent result is the significance of post-2003 OBS activity as opposed to the general level of OBS activity for the whole sample period. This clearly accords with the findings
of Acharya and Richardson (2009), Altubas et. al. (2009) and other commentators

who became concerned with the particular systemic risks associated with securitization prior to the sub-prime episode. As a result, the coefficient on recent OBS activity is
positive and ceteris paribus, such activities raised the crisis probability in OECD banking systems.
We check the in-sample performance of the final model using the sample average
crisis rate as a cut off. As shown in Table 2, the false call rate when there is no crisis (known as the Type II error), is 29.0% and the false call rate when there is a crisis (known as the Type I error) is 30.4%. The overall successful call rate (both crisis and
no crisis called correctly) is 71%, with 16 out of the 23 crisis episodes captured correctly at a cut-off point of 0.060815. These results stand up well against the wider
literature. For example, Demirgüc-Kunt and Detragiache (2005) had a type II error of 32% and a type I error of 39%, with an overall success rate of 69% at a threshold of 0.05 for their most preferred equation. During the subprime period there is only one
genuine false call in Canada, and a failure to call Germany, where the purchase of low quality US ABS to hold on balance sheet was the source of the losses that induced the
crisis. Crises are called in Belgium, Denmark, France, Italy, the Netherlands, Sweden, Spain, the UK and the US, suggesting that the explanation is sound.
Table 2. In sample performance of the model
Dep=0 Dep=1 Total
P(Dep=1)<=0.0608 252 7 259
P(Dep=1)>0.0608 103 16 119
Total 355 23 378
Correct 252 16 268
% Correct 70.99 69.57 70.9
% Incorrect 29.01 30.43 29.1 Using the in sample proportion of crisis years (0.0608) as a cut-off
Note Dep is the (binary) dependent variable
Looking in more detail at the in-sample performance of the model and specifically at false alarms (Type II errors), more than 30% of them occur in the three years prior to the onset of the crisis, indicating that our model, as well as identifying crises, is able
to differentiate well between periods of financial stability and instability. To calculate an “adjusted” number of false calls, we specify an alternative call horizon following the
early warning literature whereby only calls up to three years prior to the crisis are accepted16. This leaves us with 70 instead of 103 initial false calls. In the majority of
cases, adjustment for timing significantly reduces the false call rate; for half of the countries this drops by between 30 – 40%.
Table 3: Robustness Tests
15
Calculated as the sample mean for onset of crises i.e. 23/378. We could of course use some other cut off point
for the crisis call, and this should depend on the weightings in the loss function for a false call when there is no
crisis to the loss from failing to call an actual crisis. If we wished to set a cut off to call all crises then we would
have around 283 false calls when there is no crisis. 16
A similar forecasting horizon is used by Borio and Drehmann (2009) which underpins the latest capital
proposals by the Bank for International Settlements.

BaselineUS
Excluded
UK
Excluded
Japan,
Denmark &
Norway
Excluded
0.038***
(0.00)
0.038***
(0.00)
0.043***
(0.00)
0.039***
(0.00)
-0.14***
(0.00)
-0.139***
(0.00)
-0.15***
(0.00)
-0.165***
(0.00)
-0.293***
(0.00)
-0.255***
(0.002)
-0.303***
(0.001)
-0.245***
(0.005)
-0.457***
(0.00)
-0.491***
(0.00)
-0.491***
(0.00)
-0.446***
(0.00)
0.28**
(0.05)
0.315**
(0.044)
0.352**
(0.026)
0.312*
(0.073)GDP Growth (-2)
2003 Dummy*OBS Income/Total
Income(-2)
Narrow Liquidity(-2)
Current Balance (% GDP) (-2)
Leverage(-2)
Note: *,**,*** indicate significance on 90%,95%,99% levels correspondingly P values in parentheses, (-2) indicates a variable is lagged 2 years
To counteract the possibility that our results are driven by specific crisis prone
countries, we ran robustness tests by eliminating the two countries that have the most crises in our sample: the US and the UK (3 and 5 crises respectively). A separate robustness exercise was conducted by eliminating Japan, Denmark and Norway
simultaneously. These countries reported negative non-interest income at points during our estimation period which may have affected our constructed OBS variable
such that the significance of post-2003 OBS activity hinges on these countries‟ non-interest income series. The results of these tests are summarised (relative to our
baseline specification) in table 3 which shows our results to be robust to the exclusion of the US and UK and also for Japan, Denmark and Norway. In particular, the shift in OBS activity after 2003 towards risky securitisation was not unique to the US or UK
and as a result raised crisis probabilities in the OECD in general.
It could be argued that our post-2003 OBS result is contingent on a particular level of banking system development because securitisation is greater in market based systems as opposed to bank based systems. We subjected our results to another
robustness test by including a dummy to capture the level of banking system development in each cross-section. The dummy takes a value of 0 for market based
economies (Canada, Denmark, Sweden, UK and the US) as indicated by Caprio et. al. (2003) and 1 otherwise, and we include it both as an intercept shift and as a shift
factor for the OBS indicator. Table 4 shows the post-2003 OBS effect is independent of the level of banking system development and that it raised systemic risk in both bank and market based systems.
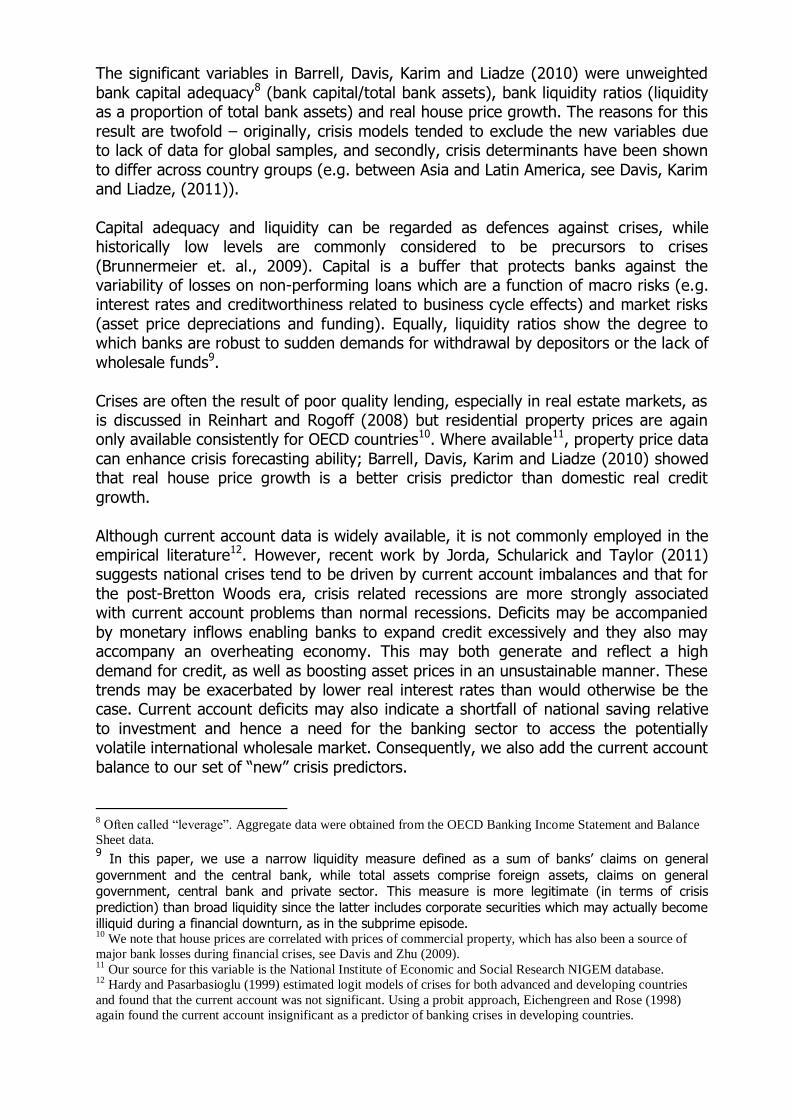
Table 4: Robustness to Bank-based vs market-based systems
0.297**
(0.043)
-0.114**
(0.013)
0.006
(0.727)
-0.296***
(0.001)
0.037***
(0.005)
-0.63
(0.308)
-0.471***
(0.00)
Bank Dummy
Leverage(-2)
Variable
GDP growth(-2)
Narrow Liquidity(-2)
Bank Dummy*(2003 Dummy*OBS Income/Total
Income(-2))
Current Balance (%GDP)(-2)
2003 Dummy*OBS Income/ Total Income (-2)
Note: *,**,*** indicate significance on 90%,95%,99% levels correspondingly P values in parentheses, (-2) indicates a variable is lagged 2 years
Bank dummy 0 in market based Canada, Denmark, Sweden, UK and US, one elsewhere
There are a number of ways to investigate the importance of a variable to a logit model, with looking at marginal effects being the most common. However, in this case it is more useful to look at the effects of the change in OBS after 2003 by setting its
parameter to zero in the estimated logit and projecting crisis probabilities over the period. In Belgium, Denmark, Italy, the Netherlands, Sweden, and the US, where we
called a crisis, we would not have expected one if there had been no change in off balance sheet activity after 2003, and there would only have been positive calls in Spain, the UK and France, where in the first two the current balance was poor given
bank capital that was available, or liquidity too low given other factors in the latter two. This would suggest that a regulatory response to financial innovations was
required, but that response would have had to rely on judgment not evidence, as we see below.
5 Forecasting Crises
By construction, our post-2003 OBS variable cannot be used for forecasting purposes. The lack of crisis observations between 2003 and 2006 makes it impossible to
estimate a truncated sample model (1980 – 2006) which could be used to assess out-of-sample ability via sub-prime crisis prediction. However there is a causal relationship
between property price growth and OBS activity which we can exploit to construct such an early warning system. IMF (2009) identifies the positive effect that rising house prices had on sub-prime lending and associated securitisation prior to the sub-
prime crisis. We test Granger causalities between house price growth and OBS activity over the whole sample and in the post 2003 period using two lags. The results,
summarised in Table 5, show unidirectional causality between house prices and OBS with the former appearing to drive OBS activity whereas the reverse causality does not
hold. In other words, house price dynamics lagged three years can be used to proxy OBS activity post 2003 in our model.

Table 5: Granger Causalities between Property Price Growth and OBS Activity
all countries excluding USA only
1.72 (0.18) 1.60 (0.20)
4.13** (0.02) 3.85** (0.02)
(1980 - 2008)
OFF BALANCE SHEET does not Granger cause
PROPERTY PRICES (2 lags)
F-stat (probability)
PROPERTY PRICES do not Granger cause OFF
BALANCE SHEET (2 lags)
F-stat (probability)
Note: *,**,*** indicate significance on 90%,95%,99% levels correspondingly
Table 6: General to Specific Estimation of Early Warning Model (1980 – 2006)
1 2 3 4 5 6 7 88
A (USA
excluded
)
-0.058
(0.242)
-0.061
(0.187)
-0.062
(0.183)
-0.064
(0.166)
-0.06
(0.181)
-0.064
(0.163)
-0.089
(0.163)
-0.082**
(0.02)
-0.091**
(0.016)
-0.555***
(0.004)
-0.555***
(0.005)
-0.559***
(0.004)
-0.568***
(0.003)
-0.532***
(0.003)
-0.555***
(0.002)
-0.482***
(0.002)
-0.454***
(0.002)
-0.431***
(0.004)
0.073
(0.124)
0.076*
(0.066)
0.075*
(0.066)
0.076*
(0.06)
0.083**
(0.028)
0.079**
(0.038)
0.076**
(0.038)
0.08**
(0.037)
0.08**
(0.044)
-0.804***
(0.004)
-0.803***
(0.004)
-0.795***
(0.004)
-0.792***
(0.004)
-0.726***
(0.003)
-0.751***
(0.002)
-0.685***
(0.002)
-0.544***
(0.00)
-0.521***
(0.000)
0.034
(0.278)
0.034
(0.269)
0.034
(0.257)
0.034
(0.259)
0.033
(0.25)
0.028
(0.333)
0.021
(0.333)
-0.115
(0.525)
-0.108
(0.537)
-0.088
(0.369)
-0.082
(0.384)
-0.081
(0.384)
-0.083
(0.385)
0.00
(0.392)
0.00
(0.369)
0.00
(0.365)
0.00
(0.378)
0.00
(0.393)
0.107
(0.575)
0.107
(0.573)
0.111
(0.555)
0.134
(0.42)
0.014
(0.824)
0.016
(0.802)
0.016
(0.799)
0.025
(0.852)
0.017
(0.89)
0.016
(0.875)
Real Credit Growth(-2)
Regression number
Real Interest Rate(-2)
Budget Balance(-2)
Narrow Liquidity(-2)
Current Balance (% GDP)(-2)
Real House Price Growth(-3)
Leverage(-3)
OBS Income/Total Income(-2)
Inflation(-2)
M2/Rreserves(-2)
GDP growth(-2)
Note: *,**,*** indicate significance on 90%,95%,99% levels correspondingly P-values in parentheses, (-2) means a variable is lagged 2 years
To construct our early warning system, we repeat the general to specific exercise for 1980 – 2006 by including the level of OBS activity at 2 lags as before, but this time
replacing the post-2003 OBS variable with house price growth at 3 lags, albeit over the whole period. Table 6 shows the deletion sequence of the variables, ending with
the final specification which includes liquidity, capital adequacy, current account balances and property price growth as crisis determinants. Essentially, property prices
capture the risky securitisation practices of banks prior to 2007 and the concurrent business cycle dynamics which made borrowing seem affordable and risky lending
seem justified. To ensure this relationship is robust we re-estimate the model in column 8 but exclude the US where house price falls played a major role in the
subprime crisis. These results, in column 8a, show that the link between property prices and securitisation was not driven solely by dynamics in the US, allowing us to
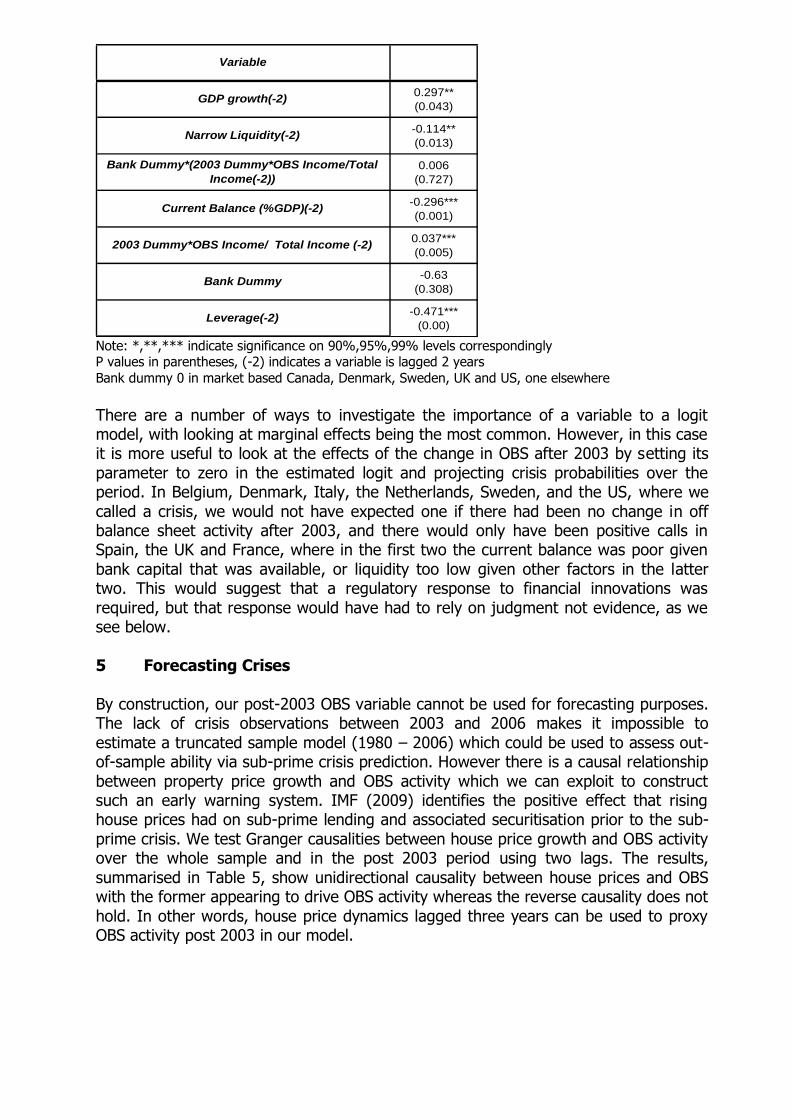
utilise the model in column 8 as our early warning system. The in-sample performance (see Table 7) of this specification is good: 75% of crises
during 1980 – 2006 are correctly identified with a cost of false calls in only 26% of non-crisis cases. The number of false calls in the three years in the run up to crises is
noticeable, and we calculate them in Table 8, and if we include these as „true‟ (but early) calls the overall false call rate falls to 23.5 per cent.
Table 7: In-Sample Accuracy of Early Warning Model (1980 – 2006)
Dep=0 Dep=1 Total
P(Dep=1)<=0.0357 240 3 243
P(Dep=1)>0.0357 84 9 93
Total 324 12 336
Correct 240 9 249
% Correct 74.07 75 74.11
% Incorrect 25.93 25 25.89 (Based on Column 8, Table 6.)
Using the in sample proportion of crisis years (0.0357) as a cut-off Note Dep is the (binary) dependent variable
The out of sample performance should be evaluated in terms of the ability of the full model to call the sub-prime crises that occurred after the 1980 – 2006 estimation
period. If this early warning model had been used for forecasting purposes in 2006, policy makers would have had at least a year to deal with the impending crises in the US, Belgium and France, as well as being in a position to recognise there might be
contagion for such a sustained set of problems in these countries. Indeed, as we can see from Table 8 this model was flagging up the possibility of a crisis in the UK as
early as 2004, and in Spain as early as 2005.
Table 9 summarises the out-of-sample accuracy of our early warning model, which is the main purpose of this part of the estimation exercise. The model is able to predict 7 out of the 11 crises that subsequently materialised. It misses the Netherlands, which
was a spillover through a jointly owned bank (Fortis) from Belgium, and it also misses Denmark and Sweden, which was a marginal call, as well as Germany. In the latter
case the implications of the purchase of US sourced ABS to hold on balance sheet were difficult to draw, but the systematic nature of warnings elsewhere should have
been leading regulators everywhere to take account of the risk they were facing. As the assets were US housing market related, and this variable was indicating problems in the US, it should have been read as doing so in Germany as well. This out-of-
sample accuracy rate is extremely good in comparison to other crisis models in the literature such as those underpinning the latest Basel III capital regulations (see Borio
and Drehmann, 2009).

Table 8: False Call Rates for In-Sample Prediction 1980-2006
Belgium 1 0 1 0 1
Canada 7 1 6 0 6
Denmark 0 0 0 0 0
Finland 5 1 4 0 4
3 prior 3 years (1994)
1 prior 1 years (2008)
Germany 0 0 0 0 0
Italy 2 0 2 0 2
Japan 3 0 3 0 3
Netherlands 2 0 2 0 2
Norway 3 1 2 2 0 prior 2 years (1990)
Sweden 2 0 2 0 2
Spain 3 1 2 2 0 prior 2 years (2008)
3 prior 3 years (1991)
2 prior 2 years (2007)
US 3 1 2 0 2
12 8France 13 1
Timing of false callsTotal callsCrisis
called
False calls
(as
produced
by model)
False calls
prior to
crisis
False calls
after
correction
for timing
10 5UK 13 3
(
Based on Column 8, Table 6)
Table 9: Out-of-Sample Prediction for 2007 and 2008 using the 1980 –
2006 Model
Belgium-08
Denmark-08
France-08
Germany-08
Netherlands-08
Spain-08
Sweden-08
UK-07
UK-08
USA-07
USA-08 P
P
P
P
P
OUT-OF-SAMPLE CRISES (2007, 2008)
(Country-year)
CORRECT IDENTIFICATIONS BY
MODEL
P
P
(Based on Column 8, Table 6, which proxies OBS with House Price Changes)

6 Conclusions
The change in the nature of off balance sheet activity after 2003 from risk diversification towards regulatory arbitrage driven securitisation is widely believed to
have left banks without sufficient capital to cover the risks they were facing. This paper demonstrates clearly that this was the case, showing for the first time that off balance sheet activity contributed significantly to crisis probabilities after 2003.
However, it is not clear that this variable could have been used in an early warning system to call the subprime crisis, but movements in house prices are found to
Granger cause our off balance sheet indicator and hence it is possible to substitute this into a warning system prior to 2006 . If we do so we show that it would have been relatively easy to call the subprime crisis in advance, and policy may have
reacted. Going forward it is clear that policy makers should keep a close eye on financial innovations that change the structure of bank portfolios. It appears to be the
case that before 2003 off balance sheet activity had no effect on increasing risk, and may have had a risk reducing effects, which were lost because of innovation and
inadequate regulatory attention. Regulation more generally needs to respond to the risks posed by OBS activities, with
controls needed at a macroprudential as well as a microprudential level. Reducing the scale and complexity of OBS activity may be essential, and there are several ways to
do this. Registers and clearing houses may make certain OBS activities more transparent and easier to provision against (IMF, 2009). Requiring mandatory holdings
or recourse on securitized assets may also be beneficial. Taxation or clearing houses to ensure registration of OTC derivatives might also be considered (see Barrell and Weale (2010), Singh (2010)). Of course other problems may emerge and financial
innovations may get round new regulations, as Goodhart (2008) discusses. Hence there is a need for continuous monitoring and adaptation of regulation of banks and
financial markets.
Overall, our findings can be considered as a step towards quantifying the effect OBS activity has on the probability of a crisis occurring, as well as in overall crisis prediction. Further investigation in this area can be conducted once more detailed
data are available, which will allow researchers to adjust banks liquidity and leverage ratios for the size of the OBS exposures directly and test for an impact on crisis
probabilities more precisely. Given how essential such calculations are, we would suggest direct regulatory action (to produce that data) would be wise.

References
Acharya, V. and Richardson, M. (2009), “Causes of the Financial Crisis”, Critical Review, Vol. 21, Issue 2 & 3, pages 195 – 210, June 2009.
Altunbas, Y., Gambacorta, L. and Marques-Ibanez, D. (2009), "Securitisation and the Bank Lending Channel", European Economic Review, Vol. 53, No.8, 996-1009.
Barrell, R. and Davis, E.P. (2008), “The Evolution of the Financial Crisis in 2008”, National Institute Economic Review, October 2008 no 206 pp 5 -14.
Barrell, R., Davis, E.P., Karim, D. and Liadze, I. (2010), “Bank Regulation, Property
Prices and Early Warning Systems for Banking Crises in OECD countries”, Journal of Banking and Finance, 34, 2255-2264.
Barrell, R., Holland, D. and Karim, D. (2010), “Tighter Financial Regulation and its Impact on Global Growth”, National Institute Economic Review, January 2010, no 213, pp 39-44.
Barrell, R. and Weale, M. (2010), “Financial Regulation and Commercial Protection”, National Institute Economic Review, January 2010, no 211, pp F4-11
Beck, T., Demirgüc-Kunt, A., and Levine, R., (2006), “Bank Concentration, Competition and Crises, first results”, Journal of Banking and Finance 30, 1581-1603.
Blundell-Wignall, A., Atkinson P., and Hoon Lee, S. (2008), “The Current Financial Crisis: Causes and Policy Issues”, OECD Financial Market Trends, 95 (2008/2), 1-21.
Borio, C. and Drehmann, M. (2009), “Assessing the Risk of Banking Crises - Revisited”, BIS Quarterly Review, March, pp 29-46.
Boyd, John H. and Gertler, Mark (1994), "Are Banks Dead? Or are the Reports Greatly Exaggerated?", Quarterly Review, Federal Reserve Bank of Minneapolis, Issue
Summer, pages 2-23.
Brunnermeier, M., Crockett, A., Goodhart, C., Hellwig, M., Persuad, A., Shin, H., (2009), “The fundamental principles of financial regulation”, Geneva Reports on the World Economy 11.
Caprio, G., Klingebiel, D., Laeven, L. and Noguera, G. (2003), “Banking Crisis
Database” in Honohan, P and Laevan, L (eds), “Systemic Financial Crises: Containment and Resolution”, The World Bank, 307-340.
Davis E P (1995), “Debt, Financial Fragility, and Systemic Risk”, Oxford University Press
Davis, E.P. (2009), "Financial Stability in the United Kingdom: Banking on Prudence", OECD Economics Department Working Paper, no. 717.
Davis, E.P., and Karim, D., (2008), “Comparing Early Warning Systems for Banking
Crises”, Journal of Financial Stability 4, 89 – 120.
Davis, E.P., Kari, D. and Liadze, I. (2011), “Banking Crisis in Asia and Latin America – A Single Pattern for Emerging Market Economies?”, Review of World Economics, Vol. 147, No. 4, 693-716.
Davis, E.P. and Zhu, H. (2009), “Commercial Property Prices and Bank Performance”,
Quarterly Review of Economics and Finance 49, 1341–1359.
De Bandt, O. and Davis, E.P. (2000), "Competition, Contestability and Market Structure in European Banking Sectors on the Eve of EMU", Journal of Banking and Finance, 24, 1045-1066.
Demirgüc-Kunt, A., and Detragiache, E., (1998), “The Determinants of Banking Crises
in Developed and Developing countries” IMF Staff Papers, 45, 81-109.
Demirgüç-Kunt, A., and Detragiache, E., (2005). "Cross-Country Empirical Studies of
Systemic Bank Distress: A Survey." IMF Working Papers 05/96, International Monetary Fund.
Duttagupta, R. and Cashin, P.A. (2008), “The Anatomy of Banking Crises”, IMF Working Paper, No. 08/93.
Eichengreen, B. and Rose, A. (1998), “Staying Afloat When the Wind Shifts: External
Factors and Emerging-Market Banking Crises,” NBER Working Paper, No. 6370 (January).
Farhi, E. and Tirole, J. (2009), “Collective Moral Hazard, Maturity Mismatch and
Systemic Bailouts”. NBER Working Paper, No. 15138. (July).
Feldman, R. and Lueck, M. (2007), “Are Banks Really Dying This Time?”, The Region, Federal Reserve Bank of Minneapolis, September 2007, 6-9, 42-51.
Goodhart, C.A.E. (2008), “The Boundary Problem in Financial Regulation”, National Institute Economic Review, no 206, October, pp. 48–55.
Hardy, D. C., Pazarbasioglu, C. (1999), “Leading Indicators of Banking Crises: Was Asia Different?”, IMF Staff Papers, 46, 247-258.
IMF (2009), “Navigating the Financial Challenges Ahead”, Global Financial Stability Report, Washington D.C., October.
Jorda, O., Schularick, M. and Taylor, A. (2011), "Financial Crises, Credit Booms, and External
Imbalances: 140 Years of Lessons", IMF Economic Review, Vol. 59, Issue 2, pp. 340-
378.
Kaminsky, G. and Reinhart, C. (1999), “The Twin Crises: The Causes of Banking and Balance-of-Payments Problems”, American Economic Review, Vol. 89, Issue 3,
pp. 473 – 500.Laeven, L. and Valencia, F. (2010),”Resolution of Banking Crises: The Good, the Bad, and the Ugly”, IMF Working Paper 10/146.
OECD (2004), “Bank Profitability, Methodological Country Notes”, Organisation for Economic Co-operation and Development, Paris.
Reinhart, C., Rogoff, K., (2008), “Is the 2007 US Sub-Prime Crisis so Different? An
International Historical Comparison”, American Economic Review Vol 98 Issue 2 Pages: 339-344
Rogers, K. (1998), “Nontraditional Activities and the Efficiency of US Commercial
Banks”, Journal of Banking and Finance, Vol. 22, Issue 4, pages 467-482.
Singh, M., (2010), “Collateral, Netting and Systemic Risk in the OTC Derivatives
Market”, IMF Working Paper 10/99 (Washington: International Monetary Fund).
Stiroh, K. J. (2004), “Diversification in Banking: is Noninterest Income the Answer?”,
Journal of Money, Credit and Banking, 36, 853-882.
Stiroh, K. J. (2006), “A Portfolio View of Banking with Interest and Noninterest Activities”, Journal of Money, Credit and Banking 38, 1351-1361.

APPENDIX 1: METHODOLOGY AND DATA ISSUES We use total non-interest income as the basis of our measure of OBS activity, and net interest income as a measure of on balance sheet activity, adjusting each for
provisions. Our approach is distinct from Boyd and Gertler (1994) in that we take the ratio of these two aggregates from the income statement as an indicator of off
balance sheet activity (adjusted for provisions) for 14 countries. In contrast, Boyd and Gertler use US data and adjust OBS activity down for fee-based off-balance sheet activities, estimate a figure for implicit OBS assets and compare it with figures for on
balance sheet assets. We consider that fee-based income is far from risk-free due to risk of volatile demand for such services as well as reputation risks that may arise
from it. Hence the inclusion of such activity in total OBS activity is in our view justified17.
Accordingly our measure is as follows:
OFF/(ON+OFF)=[Y*(1-P/(Y+(I-E))]/{[(I-E)*(1-P/(Y+(I-E)))]+[Y*(1-P/(Y+(I-E))]} (1)
Where OFF is the measure of off-balance sheet activity, ON is on balance sheet activity, Y is non interest income net of expenses, I is interest income, E is interest
expenses and P is provisions, which are allocated on and off balance sheet in proportion to net income.18
The variables used to construct the OBS estimate, net interest income, net non-
interest income and provisions are reported in aggregate form for each banking sector in the OECD Banking Income Statement and Balance Sheet online database for our sample period. Due to the aggregation of reported figures it is not possible to
decompose net non interest income into the proportion generated by traditional OBS activity and that which is generated by risky securitization.
There were a few missing observations in the data which were either filled in by using
data sources most comparable with the major data source or in a minority cases by applying average growth for 3 preceding years. There were cases when negative non interest income in Japan, Norway and Denmark lead to the negative sign on the
constructed OBS proxy variable. In our view, while Japanese, Norwegian and Danish banking systems may have faced some stresses around the time of the negative
observations, we still need to consider if these negative figures for estimated OBS are realistic. We decided that a more appropriate method was to assume that OBS activity on a gross basis can become zero but cannot be negative.
The resulting ratios for OBS activity are presented in the table A1. It can be seen that
the majority of countries exhibit higher ratios of off- to total balance sheet income over the second half of the 1980-2007 period as compared to the first half, although
some show much stronger rises in OBS exposures than others. We chart OBS activity
17
The heterogeneity of non-interest income means that it is more appropriate to use the term OBS activity rather
than OBS assets. 18
We acknowledge that provisions are mainly for on-balance sheet loans and for on and off balance sheet
securities so this adjustment may induce a slight downward bias to the measure of off-balance-sheet activity.

ratio for the US for the entire sample period for illustrative purposes and can clearly observe a considerable increase in OBS activity since 1995.
Table A1. Ratio of off balance sheet activity to total bank income Belgium Canada Denmark Finland France Germany Italy Japan Neths Norway Spain Sweden UK US
1980 0.13 0.23 0.40 0.40 0.17 0.23 0.37 0.26 0.31 0.21 0.17 0.35 0.29 0.27
1985 0.22 0.27 0.67 0.54 0.17 0.24 0.31 0.27 0.29 0.33 0.19 0.41 0.39 0.35
1990 0.21 0.33 0.21 0.50 0.26 0.32 0.26 0.34 0.31 0.38 0.21 0.29 0.48 0.38
1995 0.34 0.37 0.39 0.21 0.63 0.24 0.25 0.23 0.35 0.25 0.27 0.34 0.46 0.34
2000 0.52 0.57 0.49 0.40 0.66 0.43 0.40 0.08 0.49 0.28 0.40 0.54 0.46 0.43
2003 0.44 0.50 0.44 0.58 0.62 0.37 0.36 0.16 0.43 0.29 0.37 0.46 0.54 0.45
2004 0.36 0.50 0.48 0.40 0.65 0.26 0.35 0.07 0.43 0.28 0.36 0.45 0.61 0.43
2005 0.39 0.52 0.48 0.34 0.62 0.40 0.35 0.13 0.47 0.30 0.38 0.52 0.63 0.43
2006 0.58 0.55 0.55 0.38 0.77 0.38 0.43 0.09 0.52 0.29 0.44 0.69 0.65 0.44
2007 0.63 0.54 0.52 0.43 0.80 0.38 0.38 0.03 0.57 0.30 0.43 0.58 0.61 0.45 Chart A1. Ratio of off balance sheet activity to total income for the US
0.20
0.25
0.30
0.35
0.40
0.45
0.50
1980
1983
1986
1989
1992
1995
1998
2001
2004
2007
US
Table A.2: Data Sources
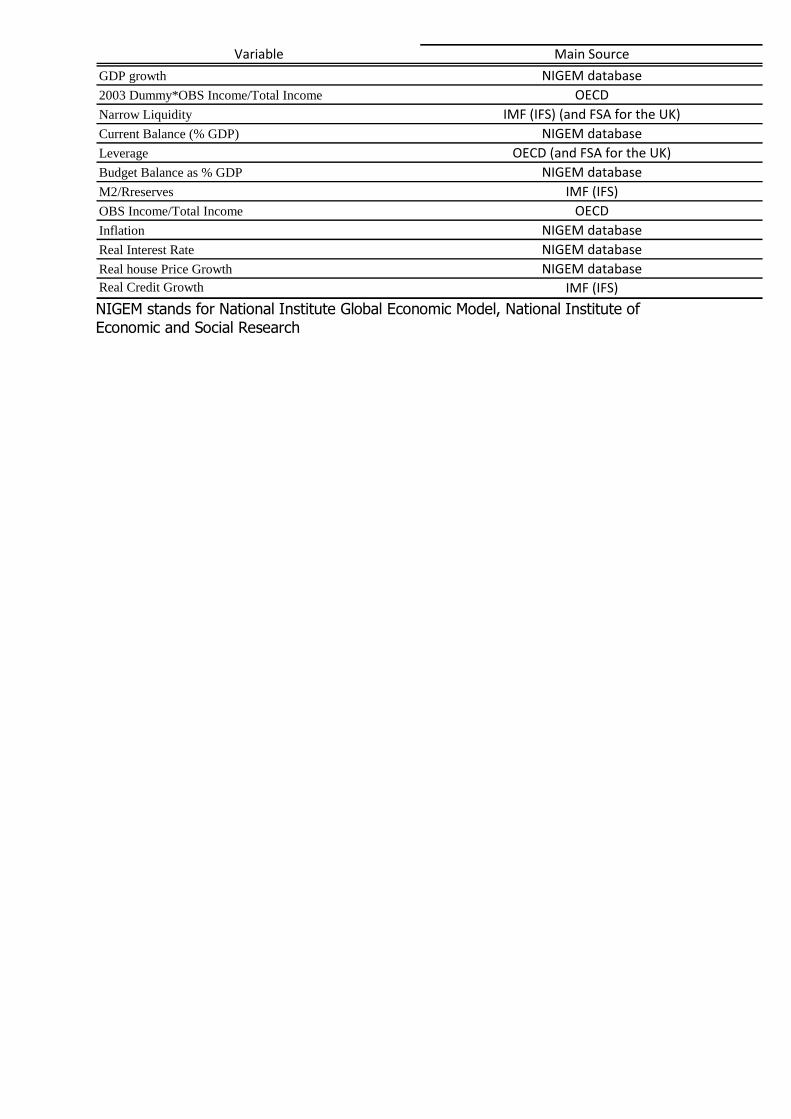
NIGEM database
IMF (IFS)
NIGEM database
Main Source
OECD
IMF (IFS) (and FSA for the UK)
NIGEM database
OECD (and FSA for the UK)
NIGEM database
IMF (IFS)
OECD
NIGEM database
NIGEM database
Variable
Inflation
Real Interest Rate
GDP growth
2003 Dummy*OBS Income/Total Income
Narrow Liquidity
Current Balance (% GDP)
Real house Price Growth
Real Credit Growth
Leverage
Budget Balance as % GDP
M2/Rreserves
OBS Income/Total Income
NIGEM stands for National Institute Global Economic Model, National Institute of Economic and Social Research


