General Electric
CAUTION CONCERNING FORWARD-LOOKING STATEMENTS:This document contains "forward-looking statements" – that is, statements related to future events that by their nature address matters that are, to different degrees, uncertain. For details on the uncertainties that may cause our actual future results to be materially different than those expressed in our forward-looking statements, see http://www.ge.com/investor-relations/disclaimer-caution-concerning-forward-looking-statements as well as our annual reports on Form 10-K and quarterly reports on Form 10-Q. We do not undertake to update our forward-looking statements. This document also includes certain forward-looking projected financial information that is based on current estimates and forecasts. Actual results could differ materially.
NON-GAAP FINANCIAL MEASURES:In this document, we sometimes use information derived from consolidated financial data but not presented in our financial statements prepared in accordance with U.S. generally accepted accounting principles (GAAP). Certain of these data are considered “non-GAAP financial measures” under the U.S. Securities and Exchange Commission rules. These non-GAAP financial measures supplement our GAAP disclosures and should not be considered an alternative to the GAAP measure. The non-GAAP financial measures we use in this document include Industrial net debt and the ratio of Industrial net debt to EBITDA. We cannot provide an equivalent GAAP guidance range for our Industrial net debt to EBITDA targets, which are calculated based on rating agency methodologies, without unreasonable effort. Industrial net debt reflects the total of gross debt, after-tax pension contributions, adjustments for operating lease obligations, and adjustments for 50% of preferred stock, less 75% of GE’s cash balance. There is significant uncertainty on the timing and amount of events that could give rise to items included in the determination of this metric, including the timing of pension funding, proceeds from dispositions, and the impact of interest rates on our pension assets and liabilities. EBITDA excludes Oil & Gas EBITDA, but it includes the BHGE dividend, and it also excludes other income, non-operating benefits costs, and adjustments for operating lease income or cost. There is significant uncertainty on the timing and amount of events that could give rise to items included in the determination of this metric, including the timing and magnitude of restructuring activities and the timing of dispositions.
General Electric Capital Corporation (GECC) was merged into GE in 2015 and our financial services business is now operated by GE Capital Global Holdings LLC (GECGH). In this document, we refer to GECC and GECGH as “GE Capital”. We refer to the industrial businesses of the Company including GE Capital on an equity basis as “GE”. “GE (ex-GE Capital)” and /or “Industrial” refer to GE excluding GE Capital.
GE’s Investor Relations website at www.ge.com/investor and our corporate blog at www.gereports.com, as well as GE’s Facebook page and Twitter accounts, contain a significant amount of information about GE, including financial and other information for investors. GE encourages investors to visit these websites from time to time, as information is updated and new information is posted.
TRANSACTION-RELATED INFORMATION:For important information about securities laws and forward looking statements involving the GE Transportation and Wabtec transaction, see https://www.ge.com/investor-relations/special-transaction-disclaimer-securities-laws-and-forward-looking-statements.
Company Update
June 26, 2018

2
GE’s path forward
• Focusing portfolio for growth & shareholder value creation– GE will be a premier high-tech industrial company … Aviation, Power & Renewable Energy – Creating a standalone GE Healthcare company over the next 12-18 months– Orderly separation of BHGE over the next 2-3 years– Separating Transportation in conjunction with previously announced Wabtec transaction
Making GE a simpler, stronger and more focused company
• Strengthening balance sheet a top priority … <2.5x Industrial net debt/EBITDA in 2020– ~$25B Industrial net debt reduction – Higher cash balances and less use of commercial paper– Materially shrinking GE Capital balance sheet
• Running the company with the businesses as the center of gravity – Corporate focused on strategy & execution, capital allocation, talent development & governance– $500MM+ in incremental Corporate cost out– Central services aligned to business units
• Larry Culp to succeed Jack Brennan as Lead Director

Focusing portfolio for growth & shareholder value creation
- GE will be a premier high-tech industrial company
- Creating a standalone GE Healthcare company
- Orderly separation of BHGE

4
Portfolio philosophy
Shift in culture and philosophyPosition businesses to reach full potential
• Position businesses for organic & inorganic growth … optimize performance for each of our businesses
• Management incentives aligned to performance
• Reduce complexity, increase speed, lower cost … simpler & more focused
• Centralized activities subject to “market test”
5
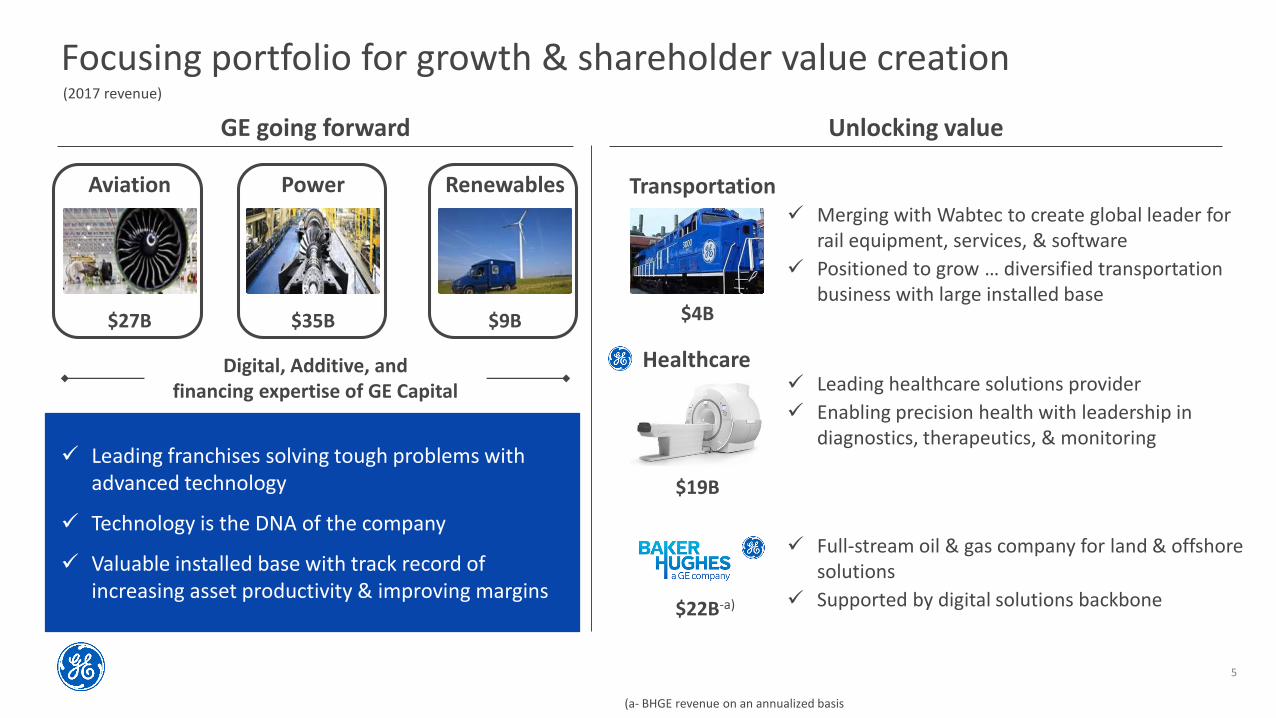
Focusing portfolio for growth & shareholder value creation
Unlocking valueGE going forward
✓ Leading franchises solving tough problems with advanced technology
✓ Technology is the DNA of the company
✓ Valuable installed base with track record of increasing asset productivity & improving margins
(2017 revenue)
Aviation
$27B
Power
$35B
Renewables
$9B
Digital, Additive, andfinancing expertise of GE Capital
✓ Full-stream oil & gas company for land & offshore solutions
✓ Supported by digital solutions backbone$22B-a)
✓ Merging with Wabtec to create global leader for rail equipment, services, & software
✓ Positioned to grow … diversified transportation business with large installed base
Transportation
$4B
✓ Leading healthcare solutions provider
✓ Enabling precision health with leadership in diagnostics, therapeutics, & monitoring
Healthcare
$19B
(a- BHGE revenue on an annualized basis

6
Strongest technology stack in our history … products, upgrades & adjacencies
Aviation
✓ Market tailwinds in commercial and military … ~6%+ RPK growth through 2020, departures & load factors
✓ Sustainable leadership in commercial engines with ~35K engine installed base; powering 2/3 aircraft departures
✓ Young, growing commercial fleet with 61% of fleet ≤1 shop visit; expect ~5% annual shop visit growth through 2020
✓ LEAP fastest growing narrowbody engine in history … maintaining margins through engine launch
✓ Robust military portfolio; lead in additive manufacturing; new advanced turboprop engine leveraging additive
Revenue: $27B Op profit: $5.4B Margins: 20% Backlog: $200B
Commercial Engines
Revenue: $7.1B
Commercial Services
Revenue: $12.6B
Military
Revenue: $4.0B
BGA & IS
Revenue: $1.3B
Avionics, Avio, Additive
Revenue: $2.0B
(2017)
7
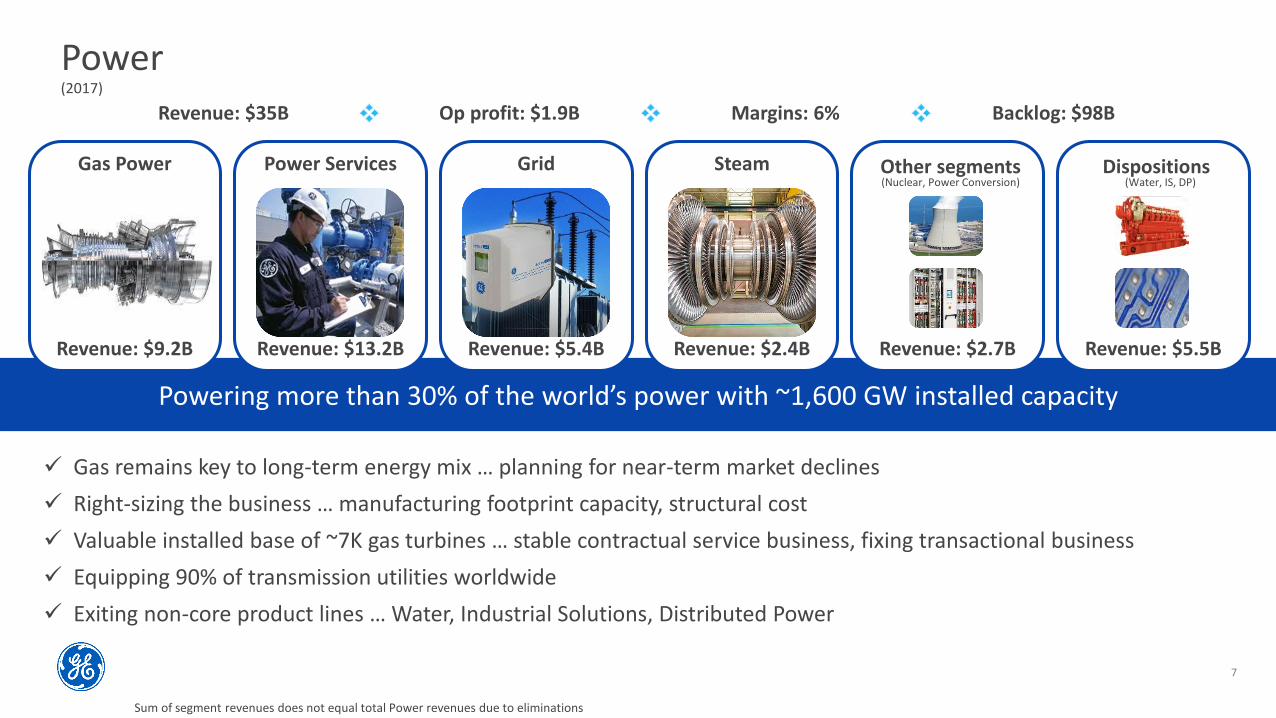
Powering more than 30% of the world’s power with ~1,600 GW installed capacity
Power
✓ Gas remains key to long-term energy mix … planning for near-term market declines
✓ Right-sizing the business … manufacturing footprint capacity, structural cost
✓ Valuable installed base of ~7K gas turbines … stable contractual service business, fixing transactional business
✓ Equipping 90% of transmission utilities worldwide
✓ Exiting non-core product lines … Water, Industrial Solutions, Distributed Power
Revenue: $35B Op profit: $1.9B Margins: 6% Backlog: $98B
Gas Power
Revenue: $9.2B
Steam
Revenue: $2.4B
Power Services
Revenue: $13.2B
Grid
Revenue: $5.4B
Other segments
Revenue: $2.7B
Dispositions
Revenue: $5.5B
(Nuclear, Power Conversion) (Water, IS, DP)
Sum of segment revenues does not equal total Power revenues due to eliminations
(2017)
8
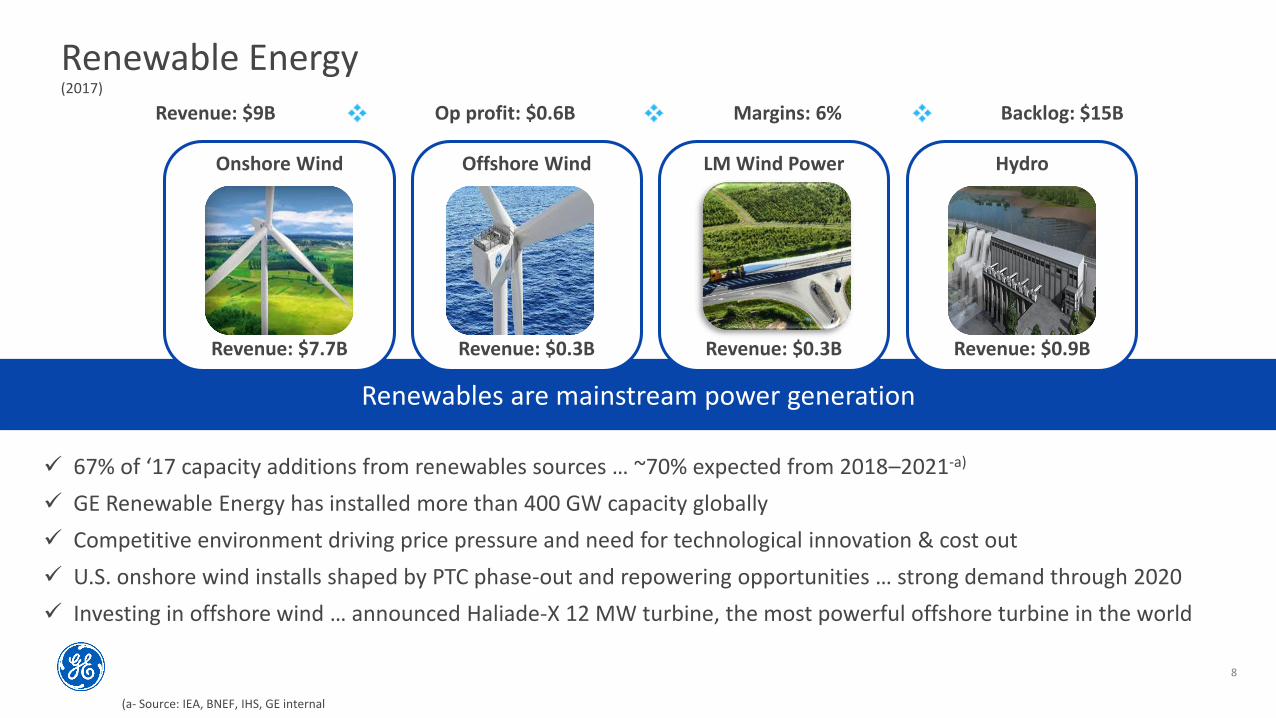
Renewables are mainstream power generation
Renewable Energy
✓ 67% of ‘17 capacity additions from renewables sources … ~70% expected from 2018–2021-a)
✓ GE Renewable Energy has installed more than 400 GW capacity globally
✓ Competitive environment driving price pressure and need for technological innovation & cost out
✓ U.S. onshore wind installs shaped by PTC phase-out and repowering opportunities … strong demand through 2020
✓ Investing in offshore wind … announced Haliade-X 12 MW turbine, the most powerful offshore turbine in the world
(2017)
(a- Source: IEA, BNEF, IHS, GE internal
Revenue: $9B Op profit: $0.6B Margins: 6% Backlog: $15B
Onshore Wind
Revenue: $7.7B
Offshore Wind
Revenue: $0.3B
LM Wind Power
Revenue: $0.3B
Hydro
Revenue: $0.9B
9
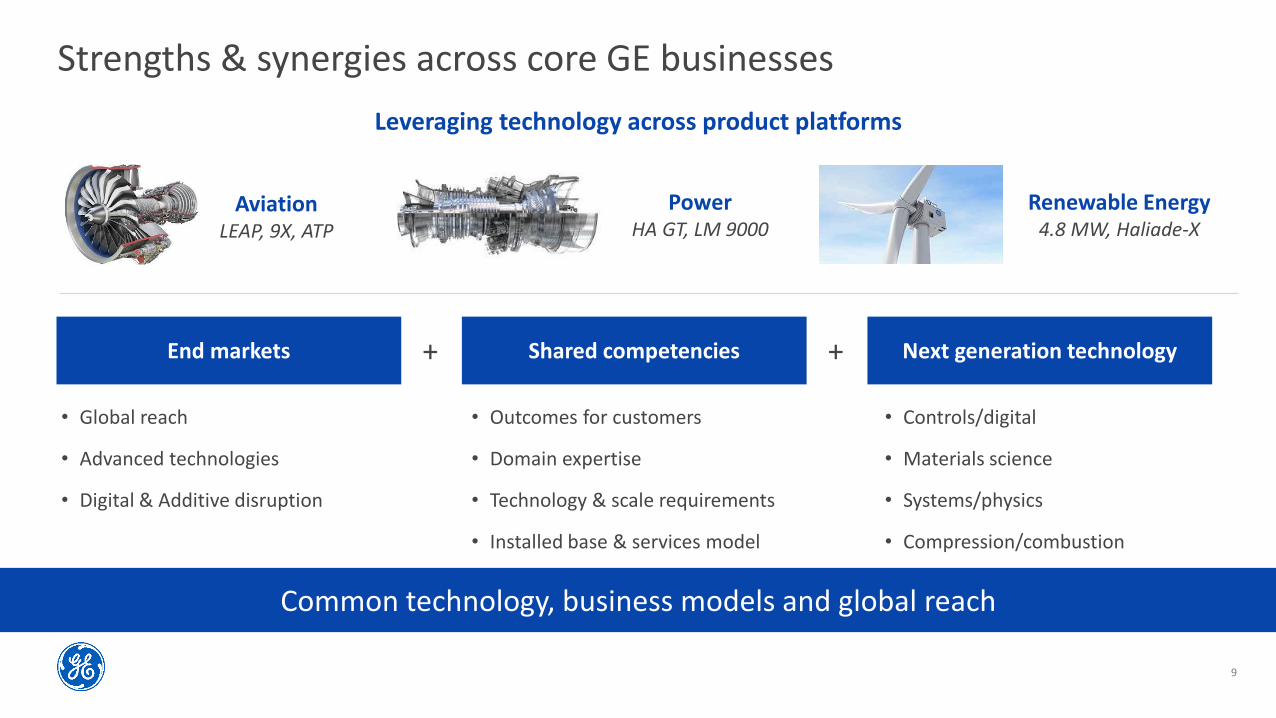
Strengths & synergies across core GE businesses
Common technology, business models and global reach
End markets
• Global reach
• Advanced technologies
• Digital & Additive disruption
Shared competencies
• Outcomes for customers
• Domain expertise
• Technology & scale requirements
• Installed base & services model
Next generation technology
• Controls/digital
• Materials science
• Systems/physics
• Compression/combustion
+ +
AviationLEAP, 9X, ATP
PowerHA GT, LM 9000
Renewable Energy4.8 MW, Haliade-X
Leveraging technology across product platforms
10
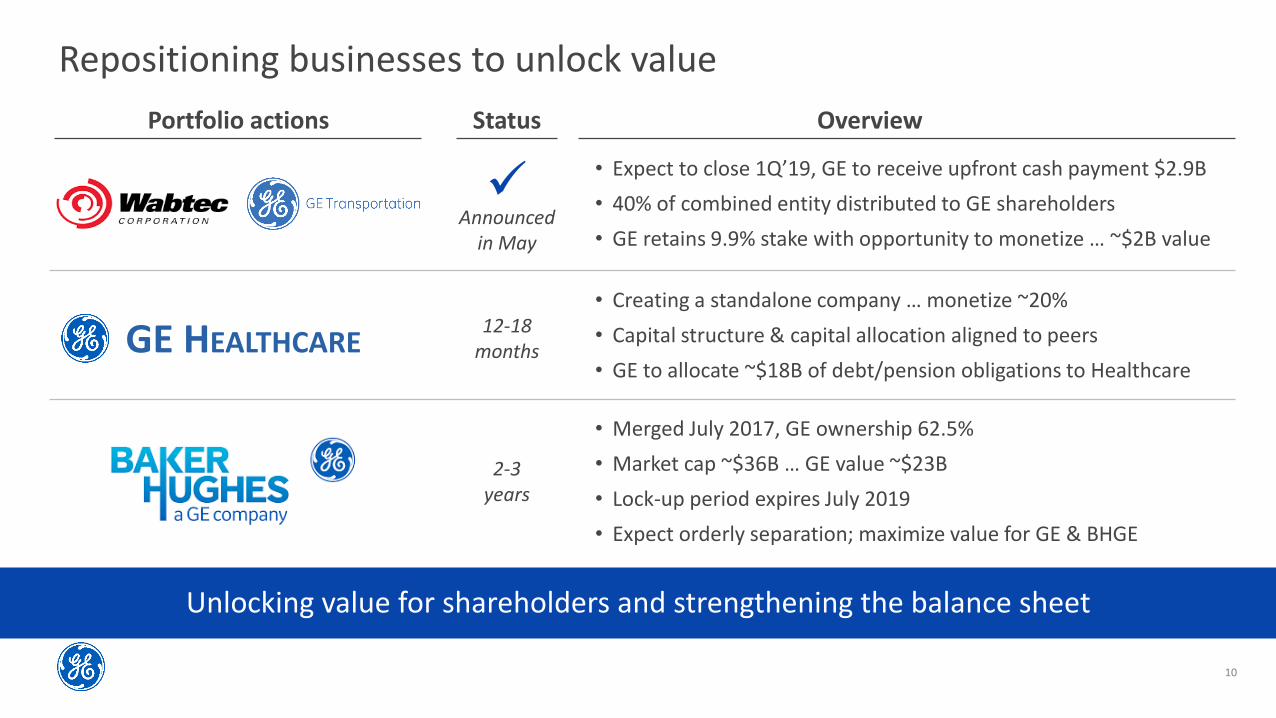
Repositioning businesses to unlock value
Overview
Unlocking value for shareholders and strengthening the balance sheet
Portfolio actions Status
• Expect to close 1Q’19, GE to receive upfront cash payment $2.9B
• 40% of combined entity distributed to GE shareholders
• GE retains 9.9% stake with opportunity to monetize … ~$2B value
✓Announced
in May
• Merged July 2017, GE ownership 62.5%
• Market cap ~$36B … GE value ~$23B
• Lock-up period expires July 2019
• Expect orderly separation; maximize value for GE & BHGE
2-3 years
• Creating a standalone company … monetize ~20%
• Capital structure & capital allocation aligned to peers
• GE to allocate ~$18B of debt/pension obligations to HealthcareGE HEALTHCARE
12-18 months

11
Businesses as the center of gravity
The “New” GE
Increase speed & lower cost … estimate $500MM+ cost savings from Corporate actions
Supported by a smaller Corporate
✓ Strategy
✓ Governance
✓ Talent management
✓ Capital allocation
Businesses are the center of gravity
Corporate actions
• Smaller HQ staff … increase speed at the businesses
• Focused on “managing by exception”
Reduce Corporate HQ1
• Business leaders will have full accountability & oversight over their operations
Outsource or transfer shared services back to our businesses
2
Digital focused on core industries & installed base4
Align critical capabilities to the businesses3
• Research, developing markets, Ventures
Strengthening balance sheet a top priority
- ~$25B Industrial net debt reduction
- Higher cash balance & less use of commercial paper
- Materially shrinking GE Capital balance sheet

13
Reducing GE Industrial leverage($ in billions)
Industrial leverage
(ex. BHGE)
Net debt-a)
~3.5x<2.5x
2018E 2020F
~$50 ~$25
(a- Net debt = Gross debt + after-tax pension deficit + adjustment for operating lease obligations + adjustment for 50% preferred stock - 75% of cash balance
Target net debt reduction: ~$25
• Debt/pension transfer to Healthcare
• “$20B+ dispositions” proceeds of ~$10B
• Monetization of ~20% of Healthcare
• Orderly separation of 62.5% BHGE shares & 9.9% Wabtec shares
• Industrial free cash flow less dividend
Potential sources:
$60+
Summary
• ~$25B net debt & pension reduction:
– Healthcare debt/pension transfer (~$18B gross)
– Debt/commercial paper paydown (~$9B gross)
Cash & liquidity
– >$15B cash on balance sheet by year end 2018
– ~$40B undrawn funding facilities
• Strengthening GE’s liquidity profile & reducing reliance on short-term markets
– Reduction in commercial paper (CP) funding
$16BAverage CP
$20BPeak CP
2017~$10B
~$13B
2H18E<$5B
~$5B
2020F
– Target net debt/EBITDA <2.5x in 2020
– Strong long-term rating & Tier 1 short-term rating
– Dividend payout in line with Industrial peers
• Financial policy:
• Assuming a ~$3B equity contribution to GE Capital in 2019

Healthcare

15
This is GE Healthcare
Impact
1MM+ Installed Base
16K+ Scans every minute
350MM+ exams
160K+ assets under management
Biologics and cell therapies
Contrast agents, nuclear tracers
At Scale Revenue Op Profit OP% FCF Conversion
Leader in Imaging & Mobile Diagnostics
Leader in China and Emerging Markets
Leader in Data and Analytics
Leader in Life Sciences
Portfolio breadth
Market solutions
~54K employees worldwide … with over $1.4B annual program investments
As reported, GE basis
2016
2017
$18.2B $3.2B 17.6%
$19.0B $3.5B 18.3%
> 100%
> 100%

16
In-Vivo + In-Vitro Decision Making Therapy Innovation Therapy Delivery Monitoring
Precision Diagnostics Precision TherapeuticsPrecision
Monitoring
From Protocol driven Too much data, in too many different places
Costly and risky R&D Complex and unguided Patients only monitored when sick
To Highly personalized Integrated, longitudinal,fueled by AI
Precisely targetedclinical trials
Complex processes simplified. Precision
interventions. Additive
Proactive approach to wellness beyond the
hospital
We are leading industry in journey to deliver on promise of Precision Health … better outcomes delivered more efficiently
Each patient ... digitally connected
Only GE Healthcare can do this … combining our expertise & leadership across Diagnostics, Monitoring and Digital to serve the needs of Providers, Pharma and Med-tech

17
Building the future of Precision Health($ in billions)
In pursuit of a bolder agenda …
• Attractive, highly-visible returns
• Accelerate investments in core franchises
• Cycle into higher growth adjacencies, leveraging core
• Enhanced clinical decision-making, synthetic bio, others
• Opportunity to build scale in precision health
• Focused on targets with strong synergies to core
Healthcare financials-a) Operating approach
• Relentless focus on customer experience … product quality & services
• Great products … market-backed technologies, R&D investment
• Unparalleled market access … strong direct & indirect channels, 140+ countries
• Strong supply chain & service capability … global sourcing & manufacturing
• Great operating rigor … product cost out, SG&A, & cash conversion
• Strong capital allocation … focused organic investment, disciplined, bolt-on acquisitions with prudent divestitures
(a- As reported, GE basis
2016
$18.2
2017
$19.0
2016
$3.2
2017
$3.5
FCF conv.
2018E
~3%
2018E
5%+
100%+ 100%+ 100%+
Revenue
Margins 17.6% 18.3% +
Op profit
Organic growth “Flow” inorganic growth Scale M&A

Summary

19
Summary
Positioned to deliver shareholder value
• Focusing portfolio for growth & shareholder value creation
• Strengthening balance sheet a top priority … <2.5x Industrial net debt/EBITDA in 2020
• Running the company with the businesses as the center of gravity